
Ensemble Averaging of Transfer Learning Models for Identification of Nutritional Deficiency in Rice Plant

 ,
, 
Abstract
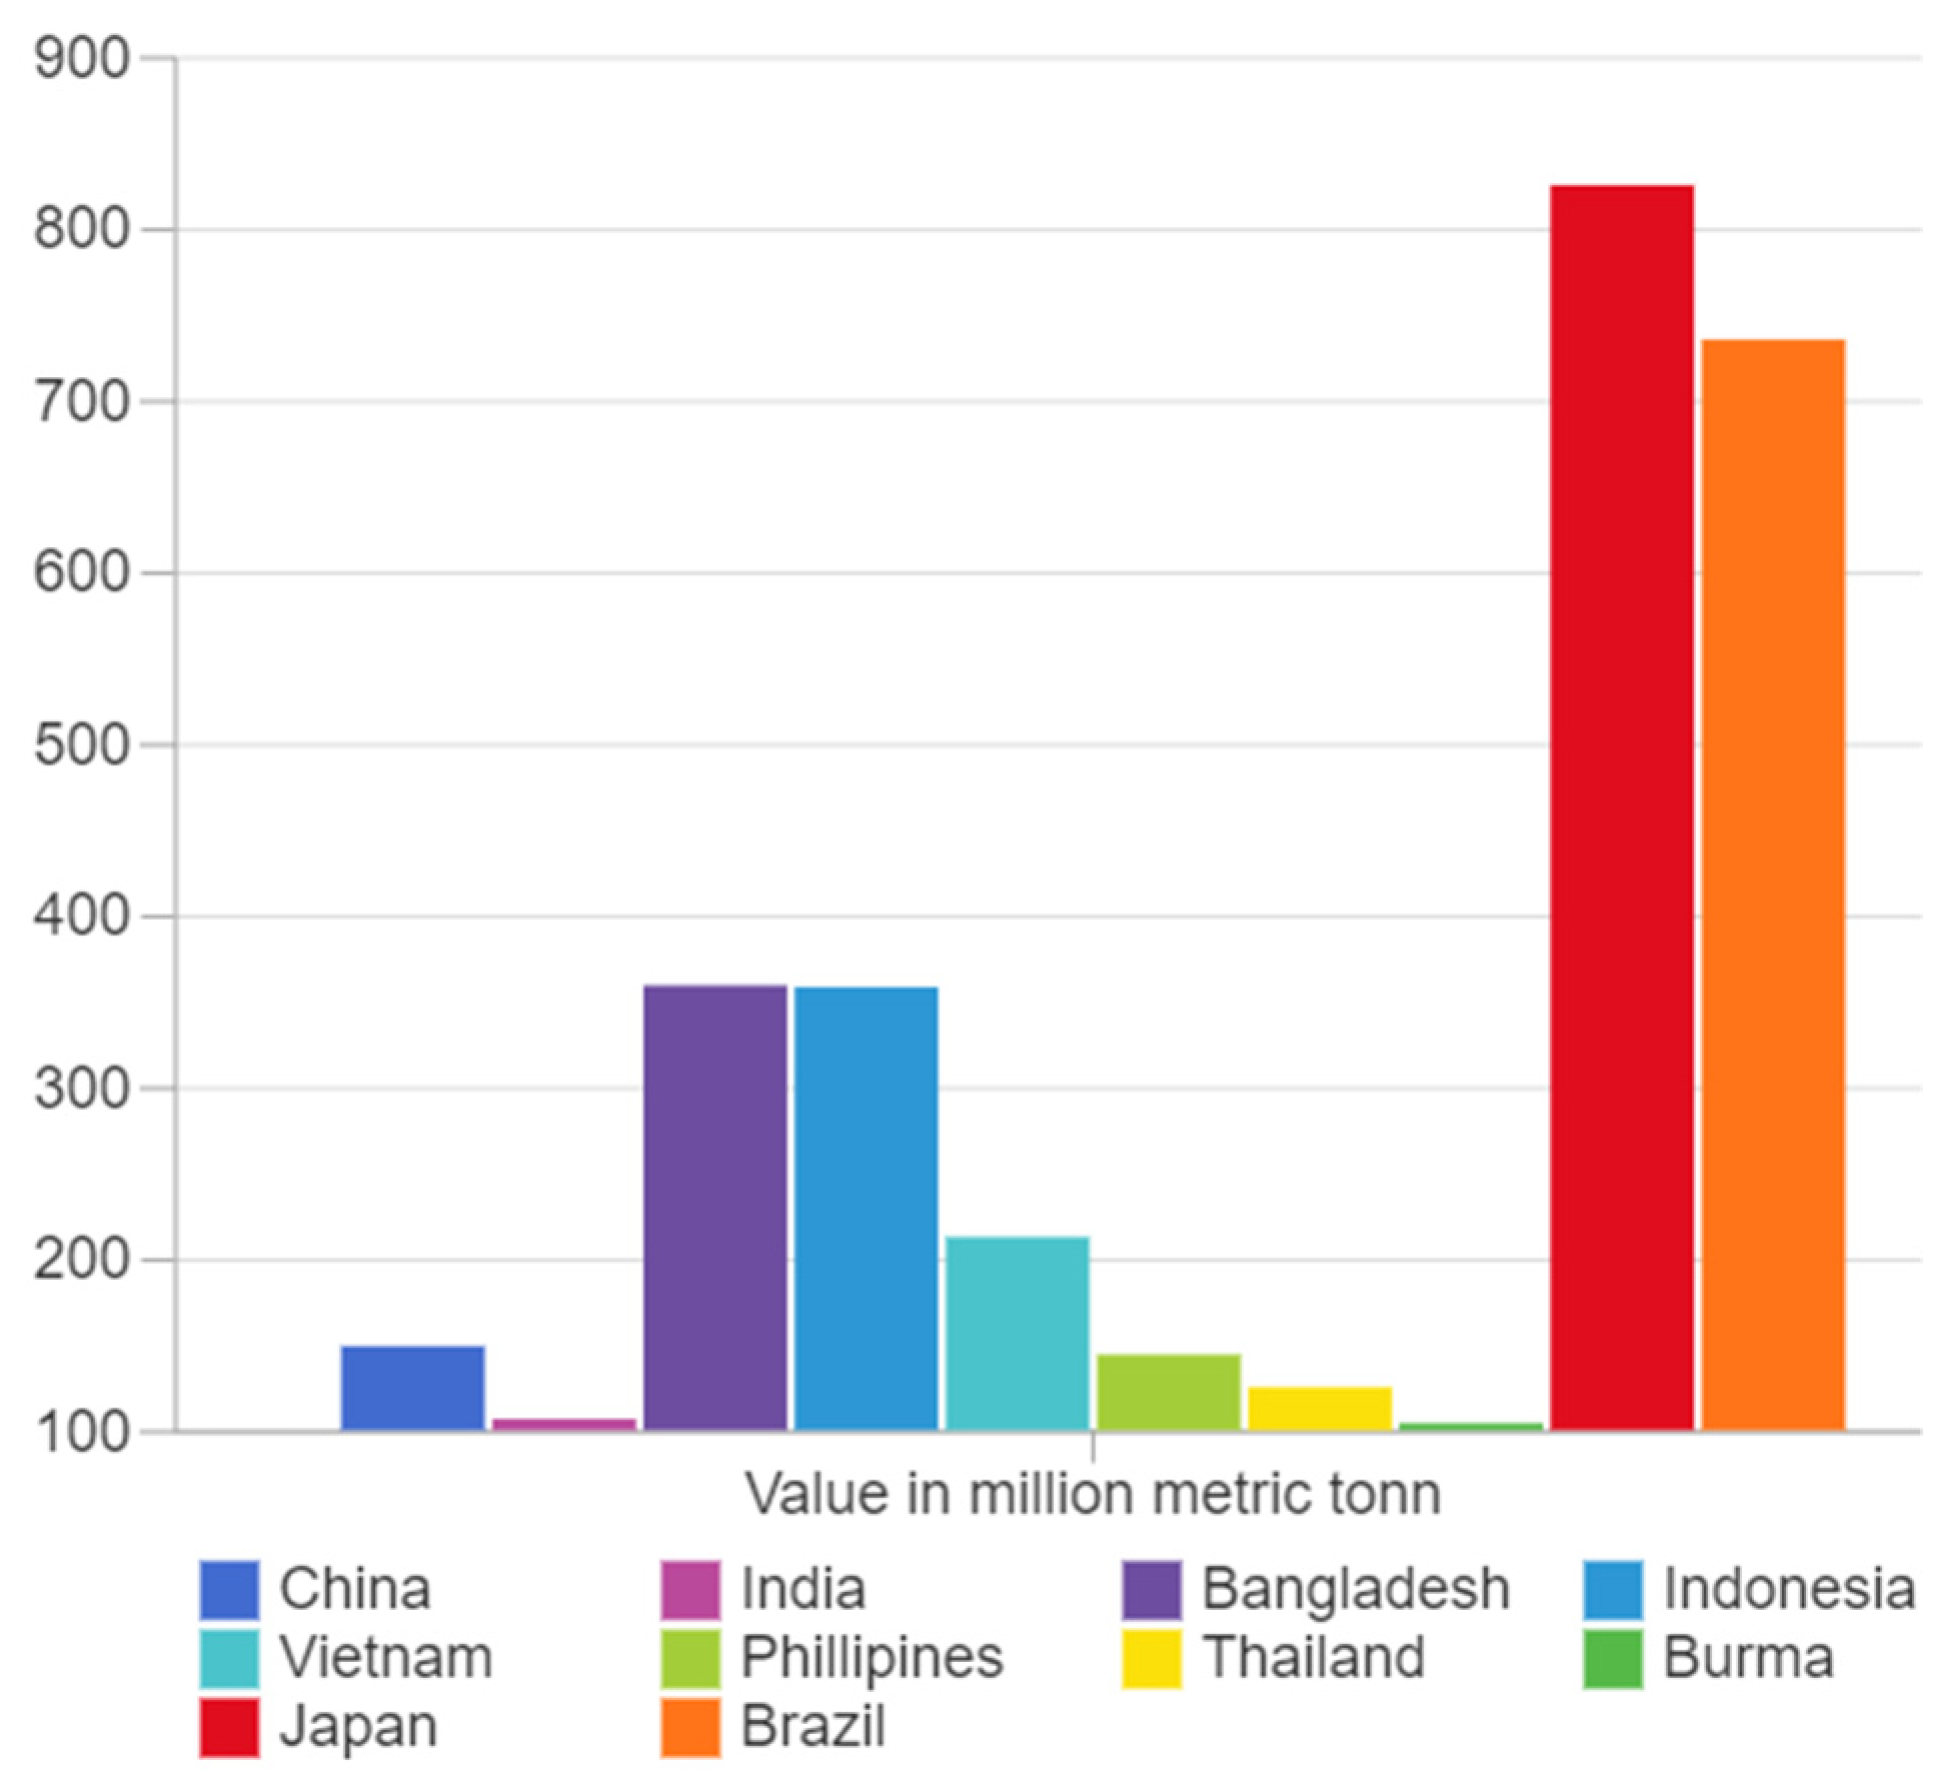
:1. Introduction
2. Related Work
3. Materials and Method
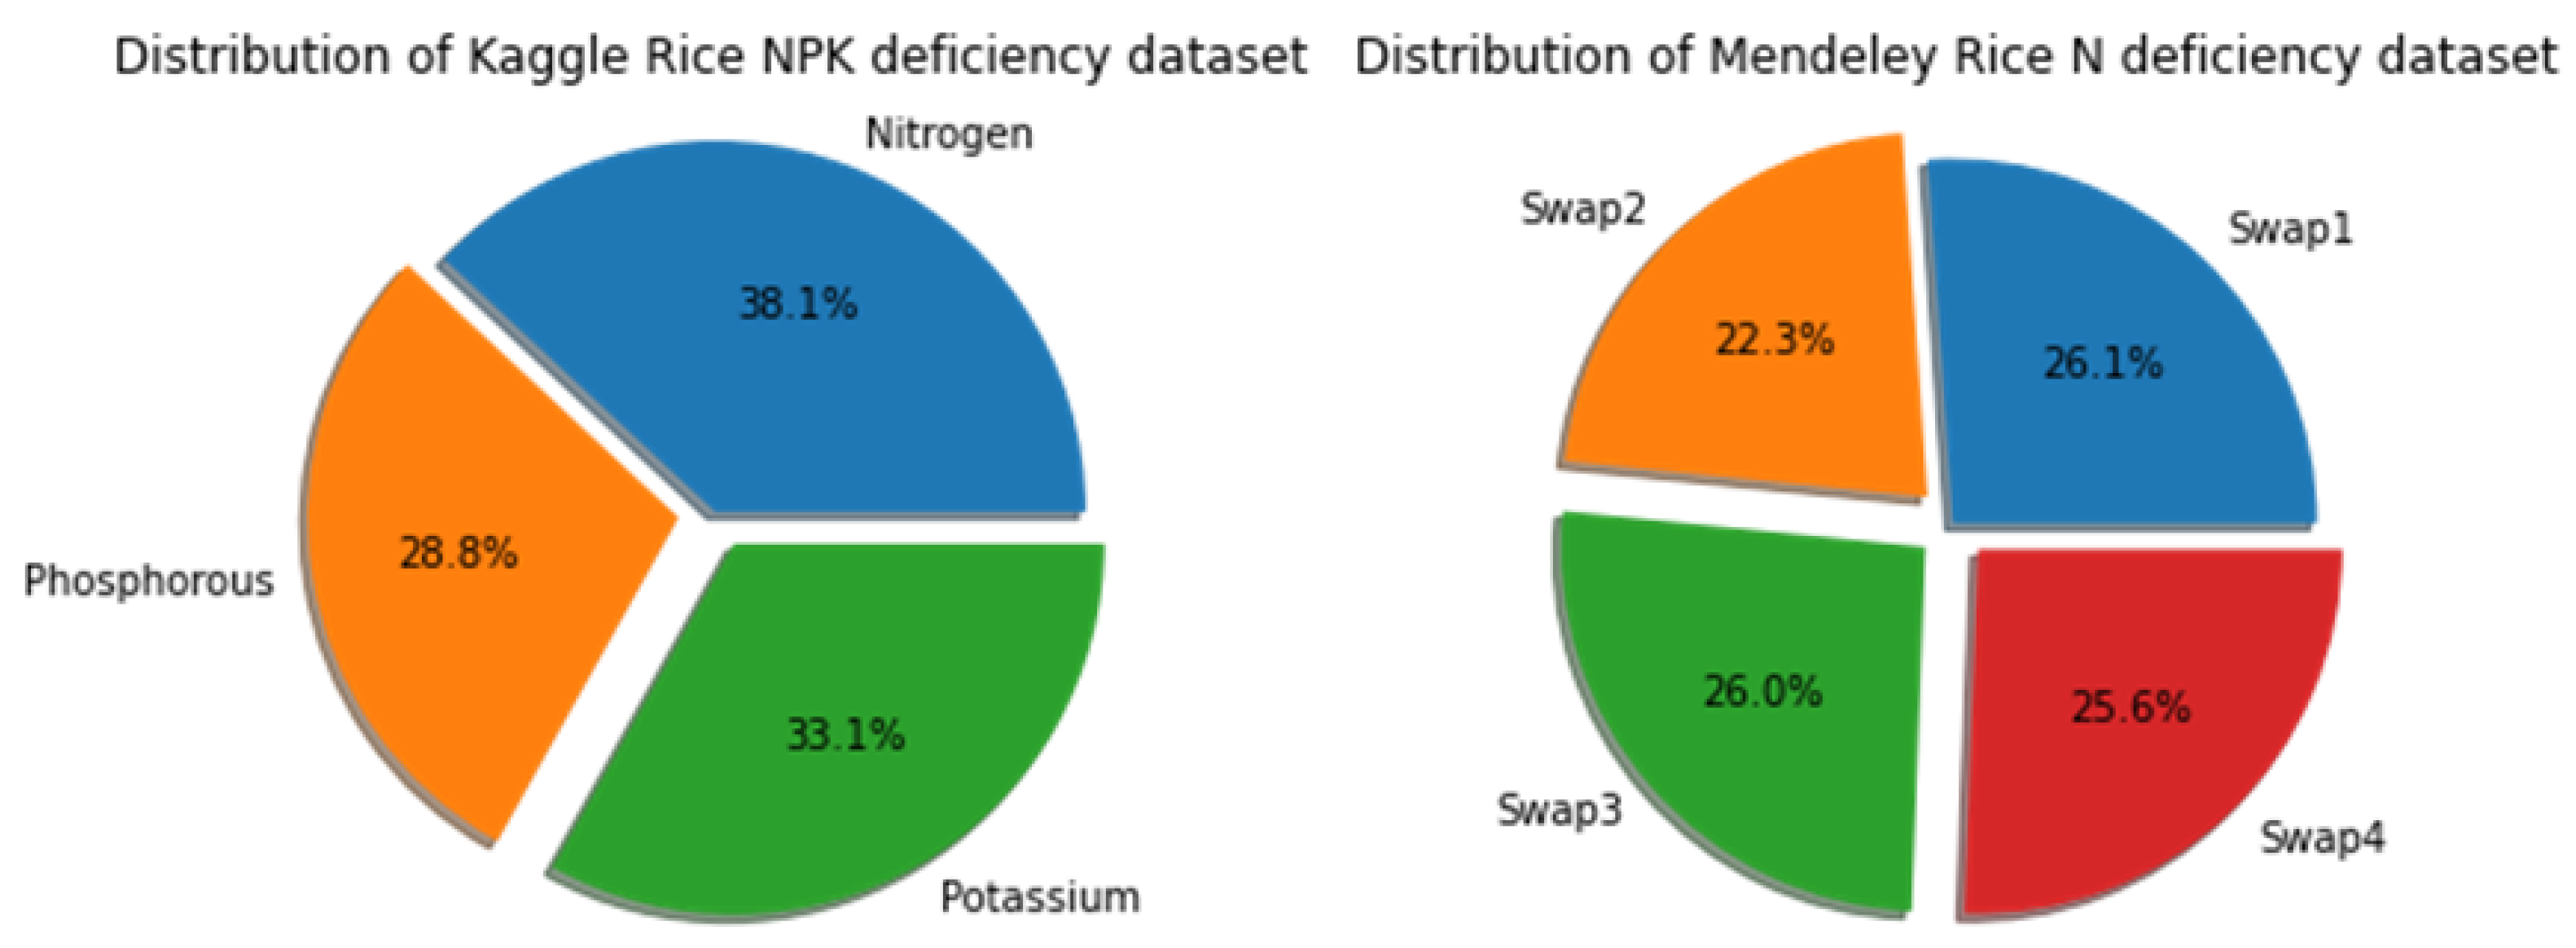
3.1. Dataset Details
3.2. Data Augmentation
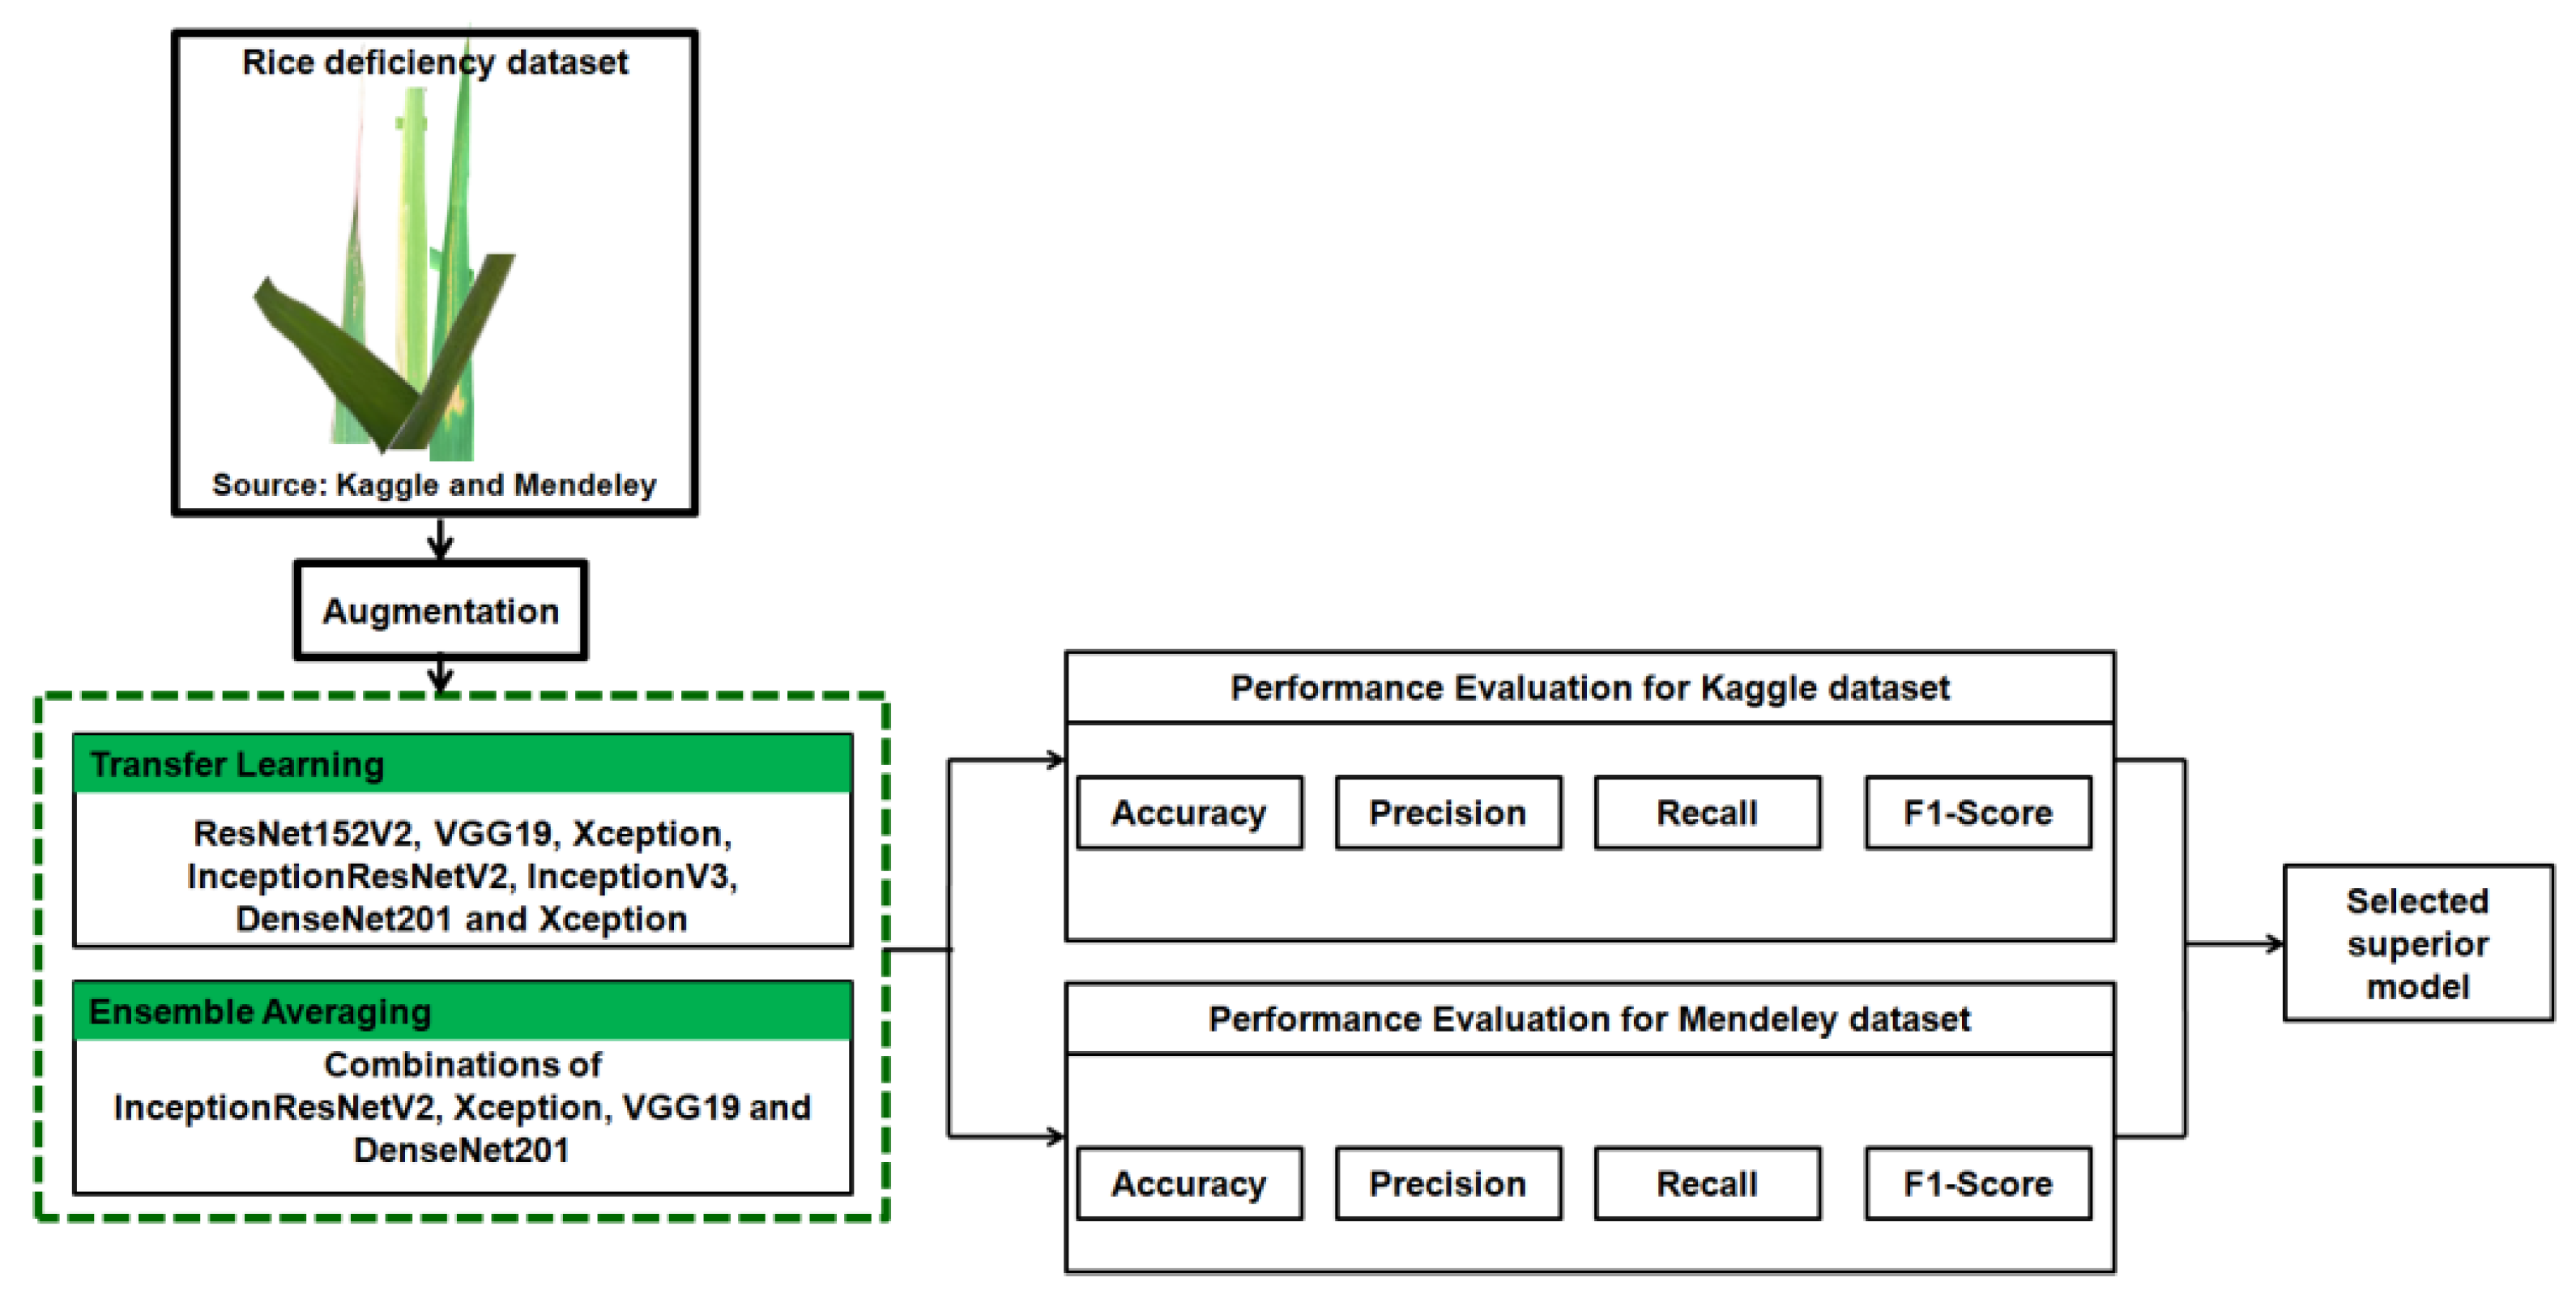
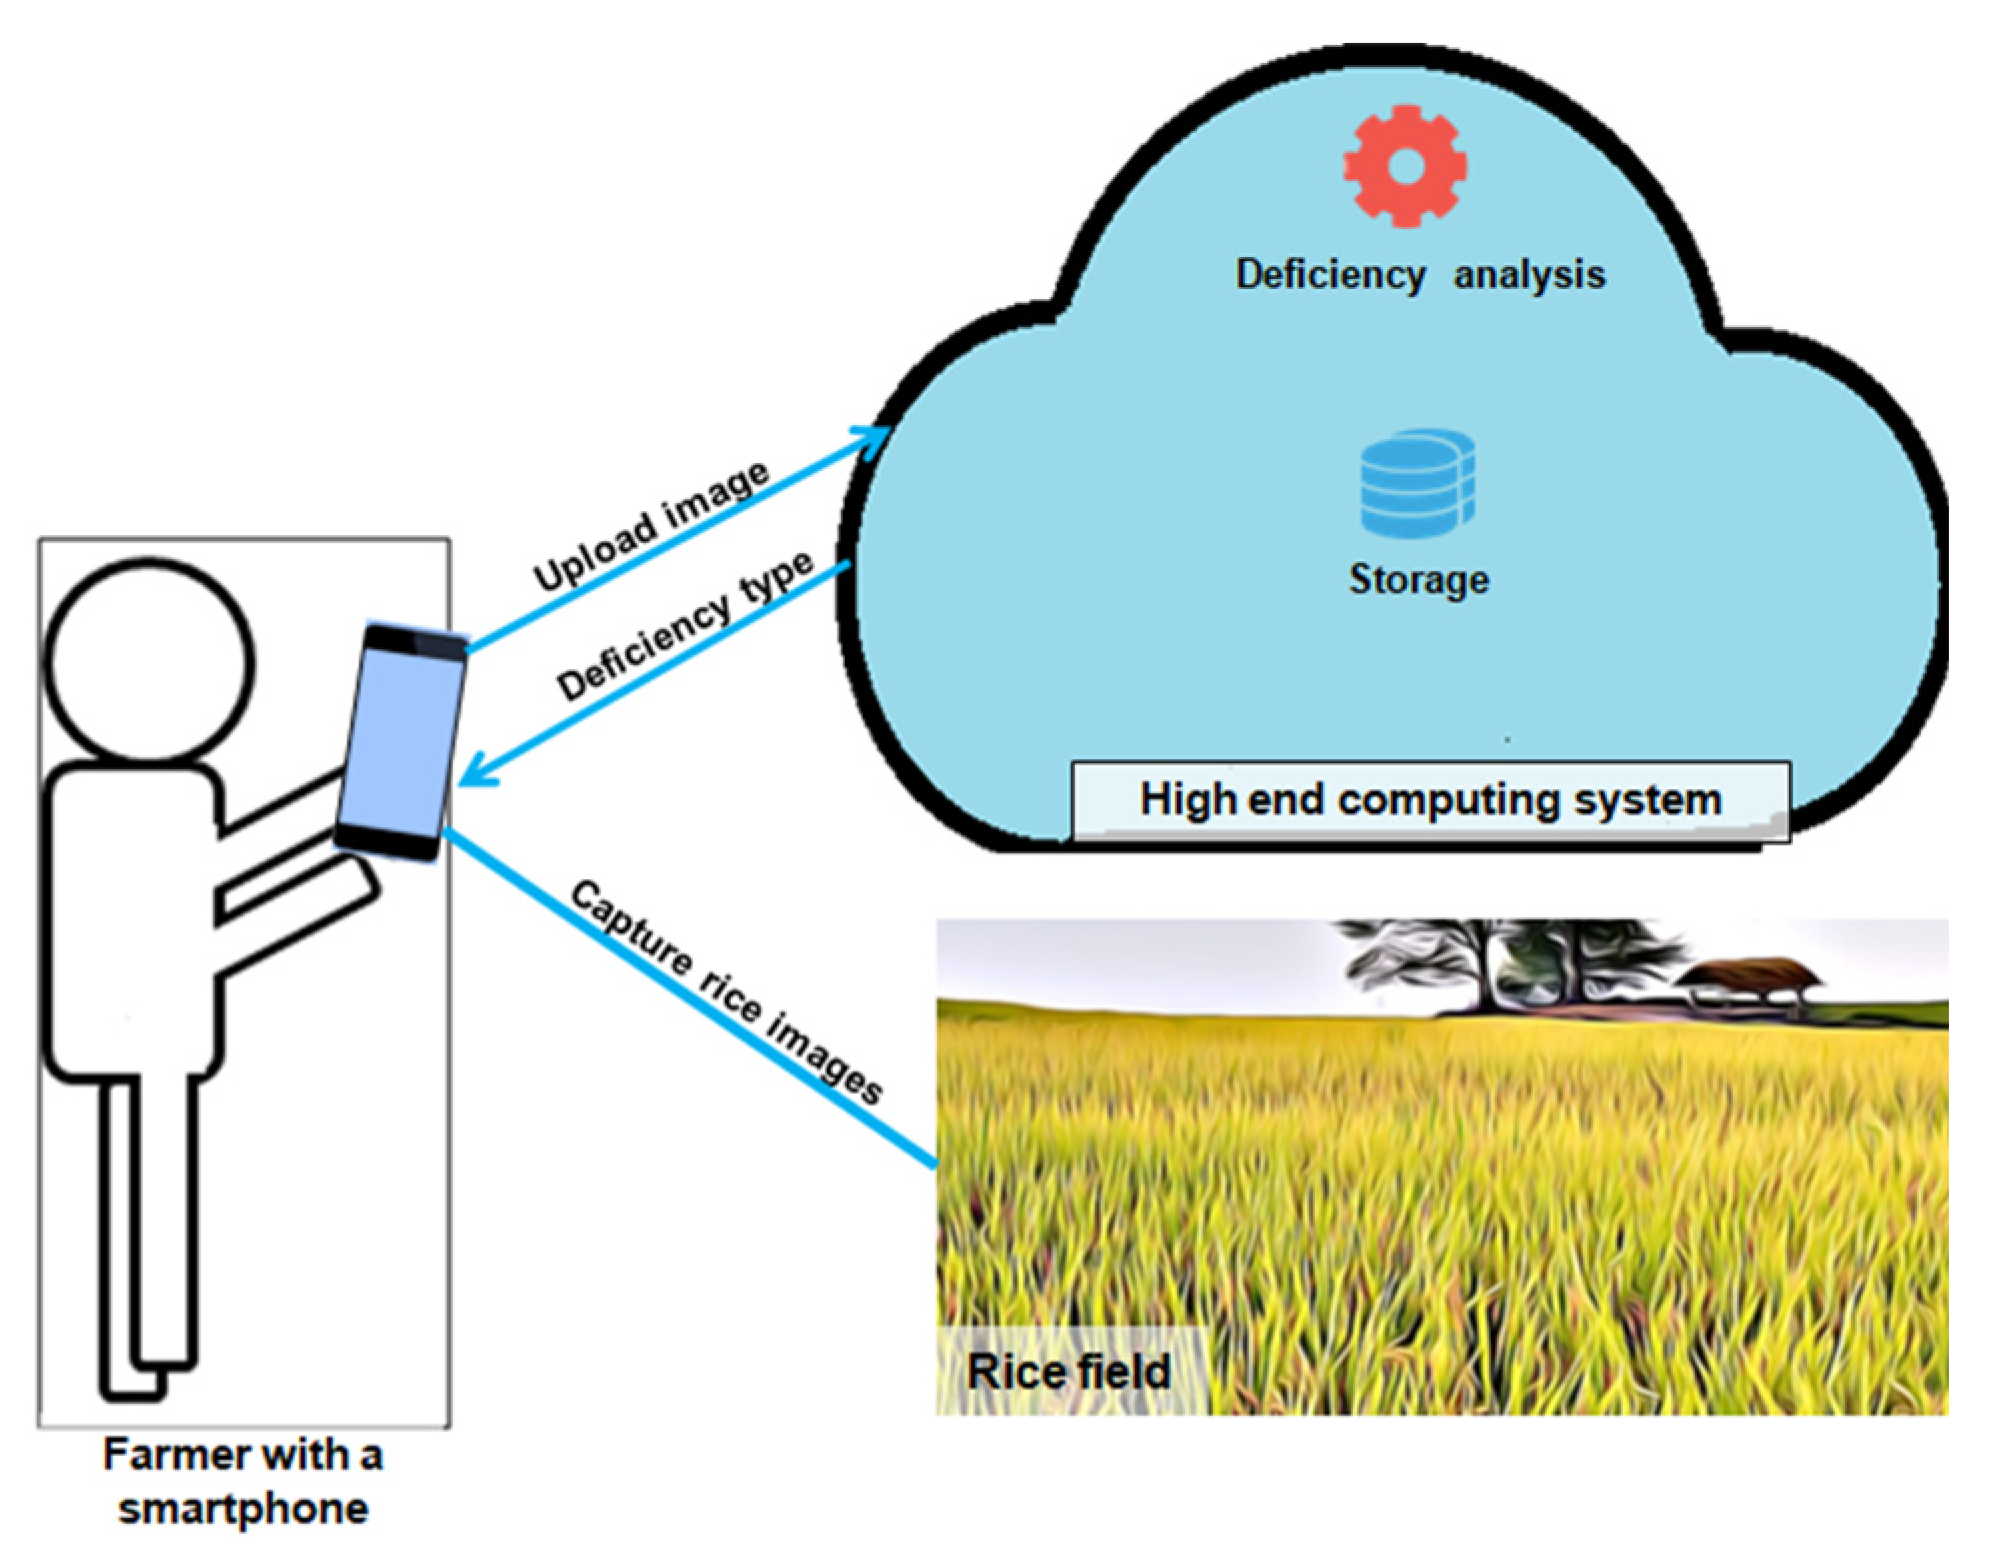
3.3. Proposed Rice Deficiency Identification System
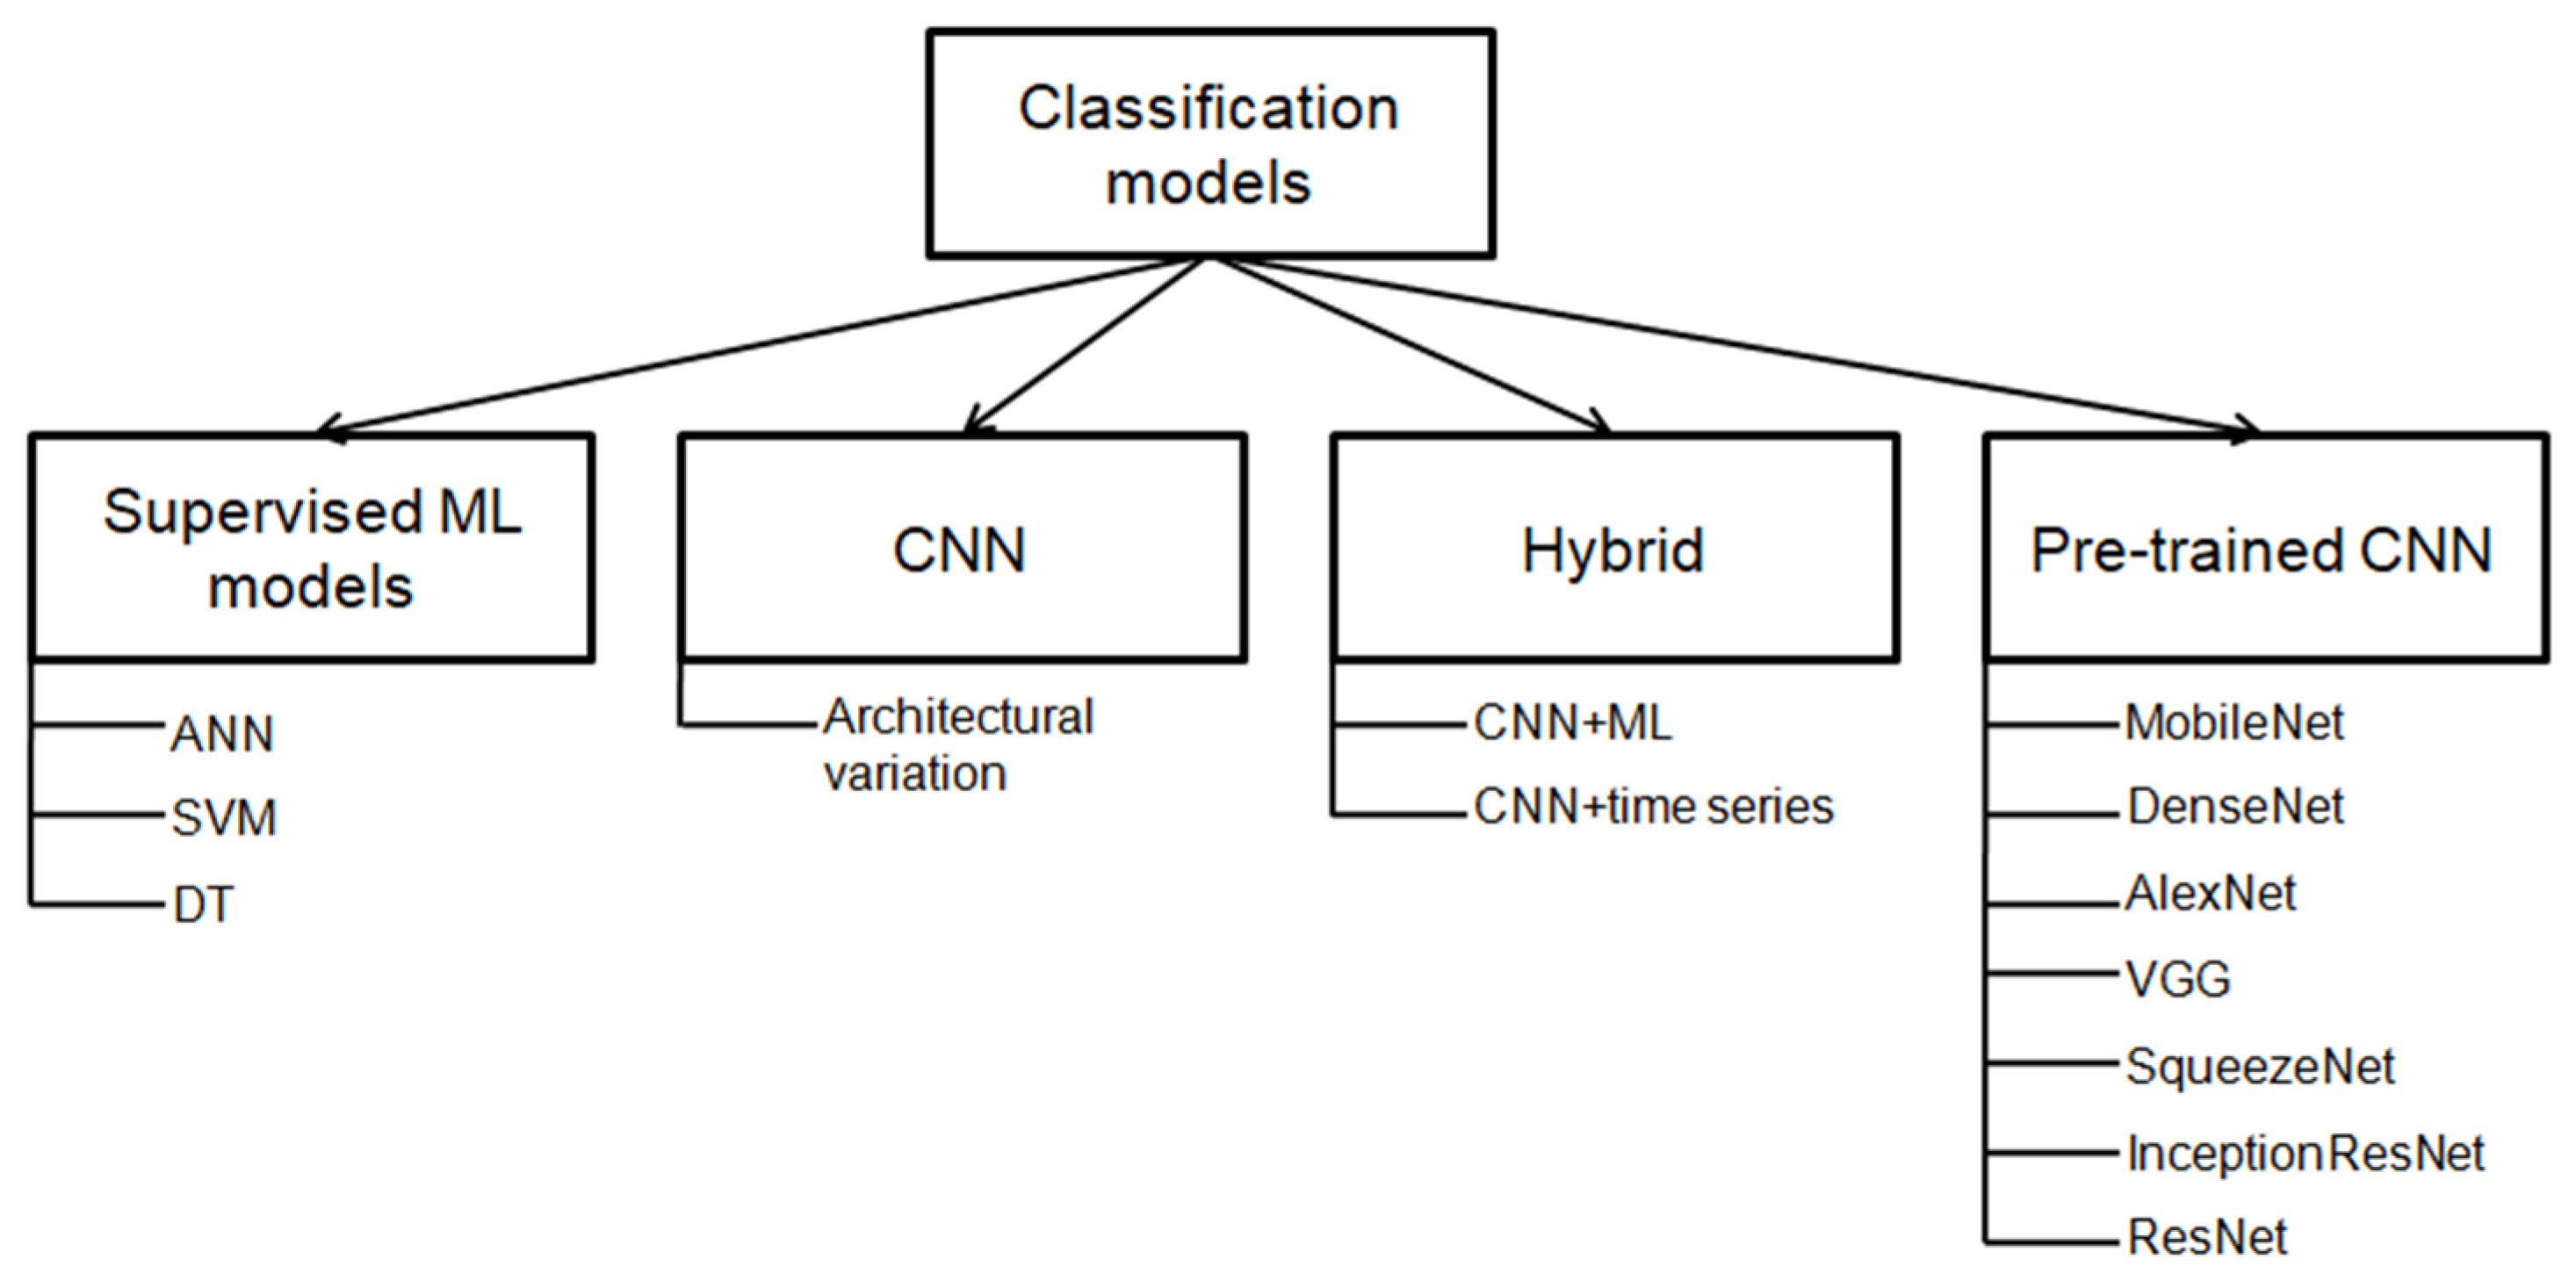
3.3.1. Transfer Learning Models
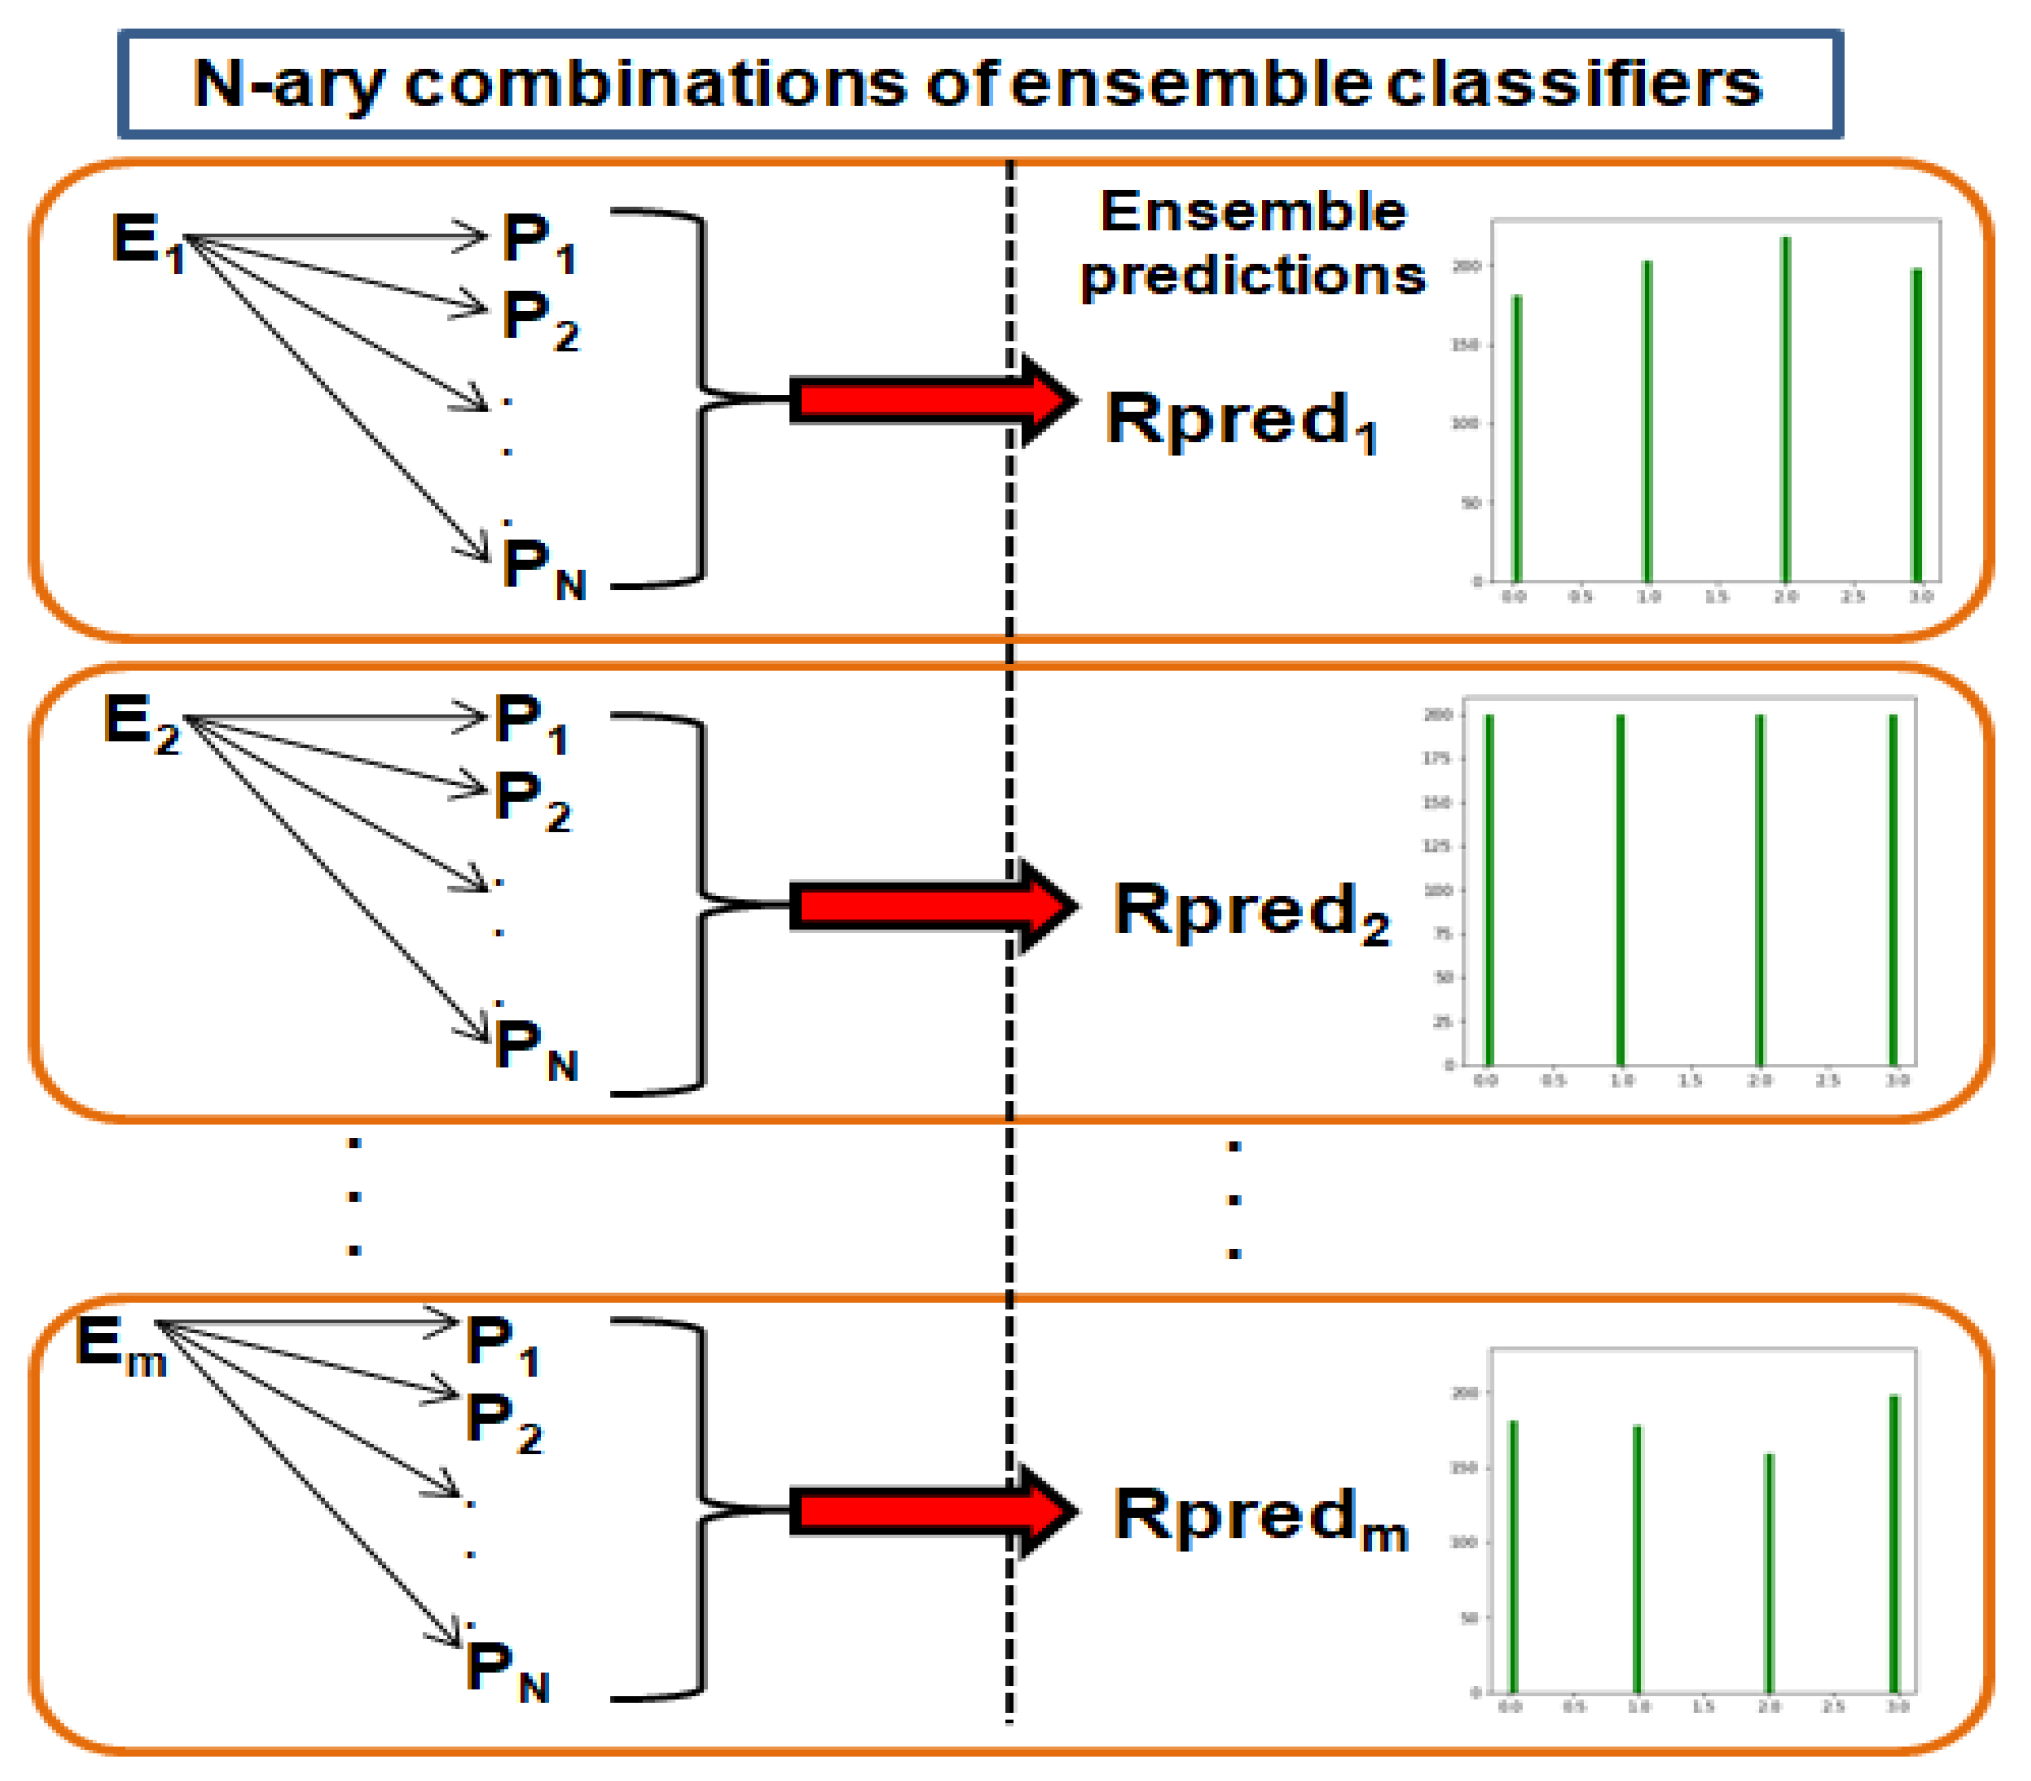
3.3.2. Ensemble TL Models
| Algorithm 1: Ensemble averaging | ||||||||
| Input:Test_set S: Models Mk (k = 1 to n) where k is the number of models | ||||||||
| Output: Ix Ensemble_model E = [M1,M2,…Mk] | ||||||||
| For i = 1 to k do | ||||||||
| Predict, P = generate(S) A = add (P, along y axis) Ix = index_max (A, along x axis) | ||||||||
| Confusion_matrix (Ix, S) Classification_matrices (Ix, S) | ||||||||
| End | ||||||||
4. Results
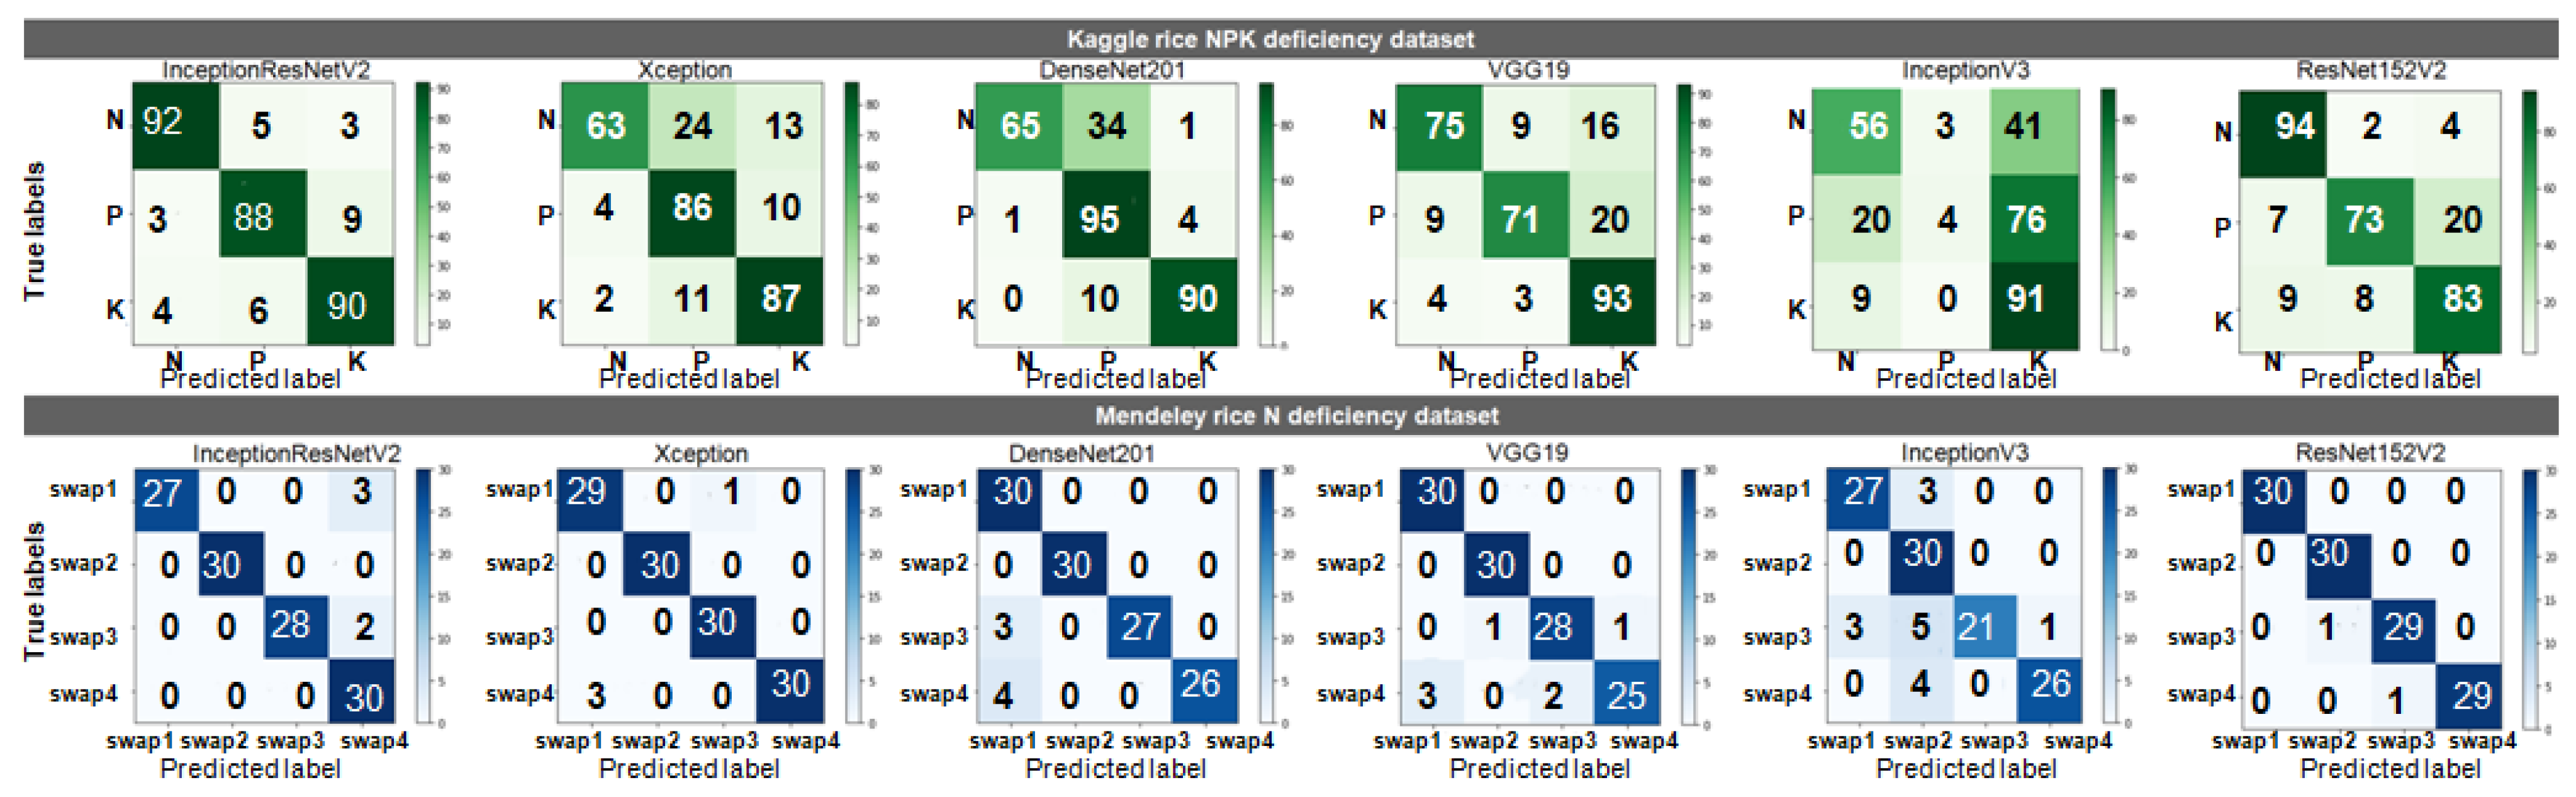
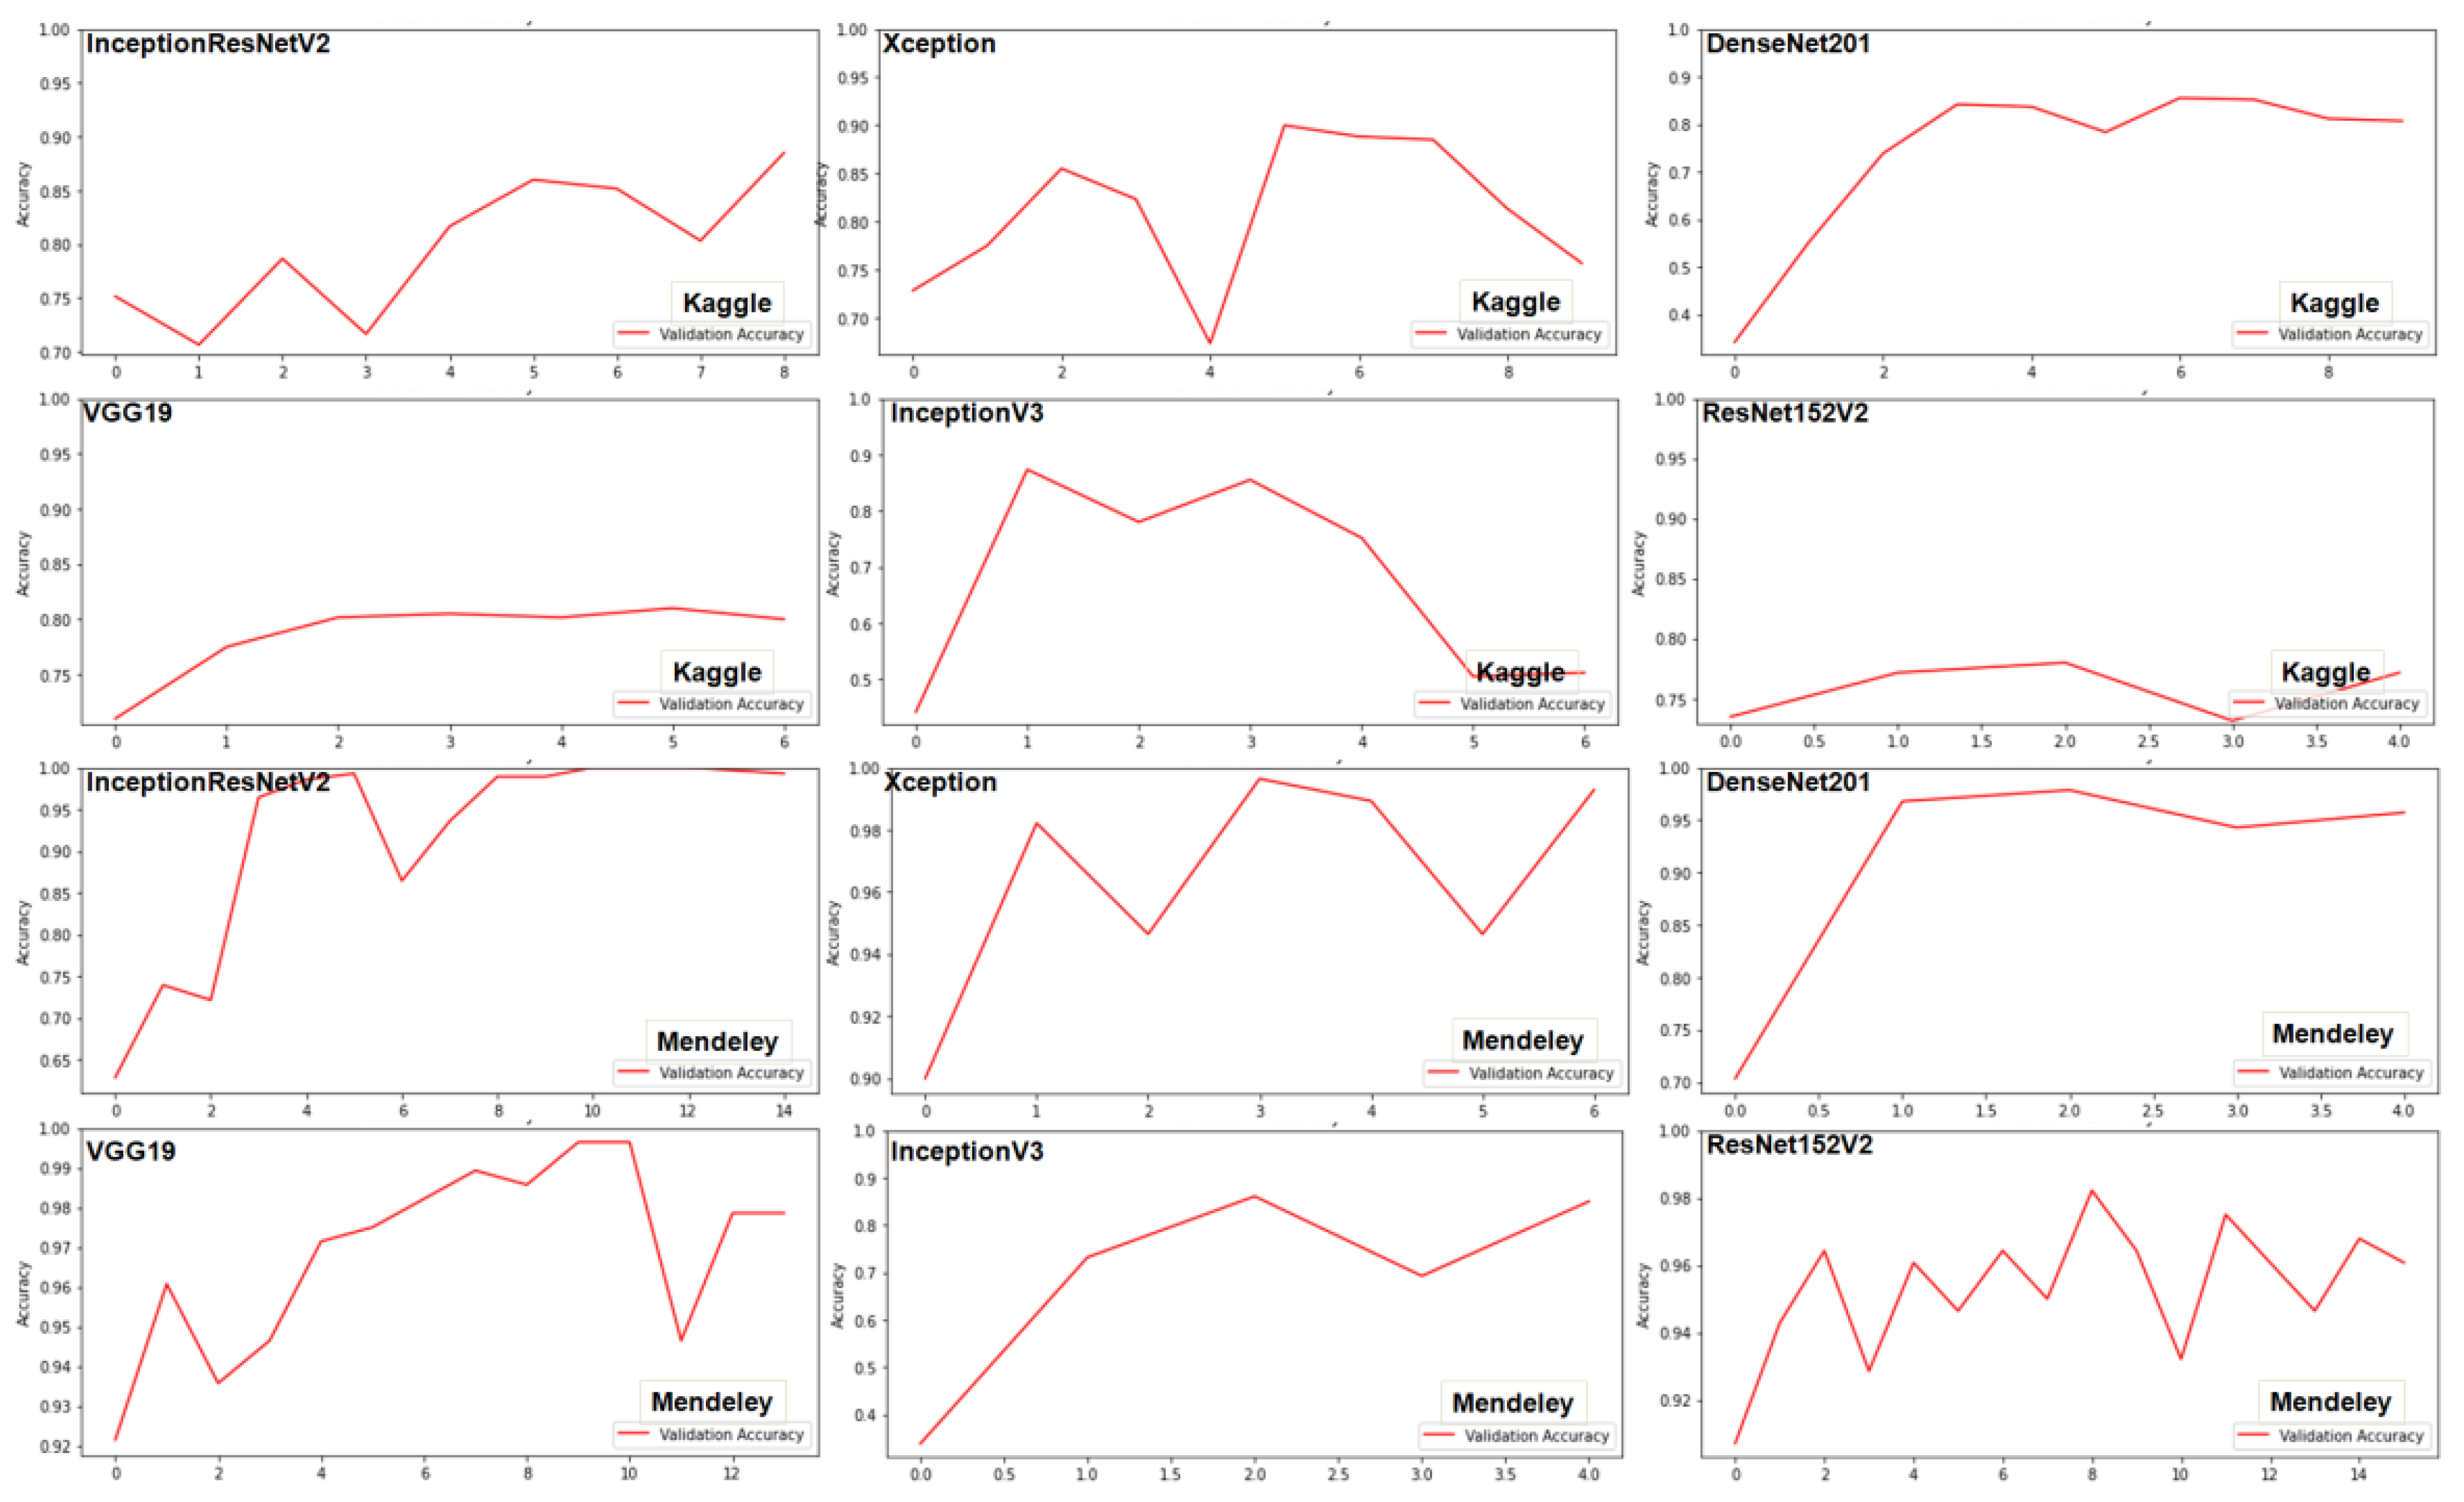
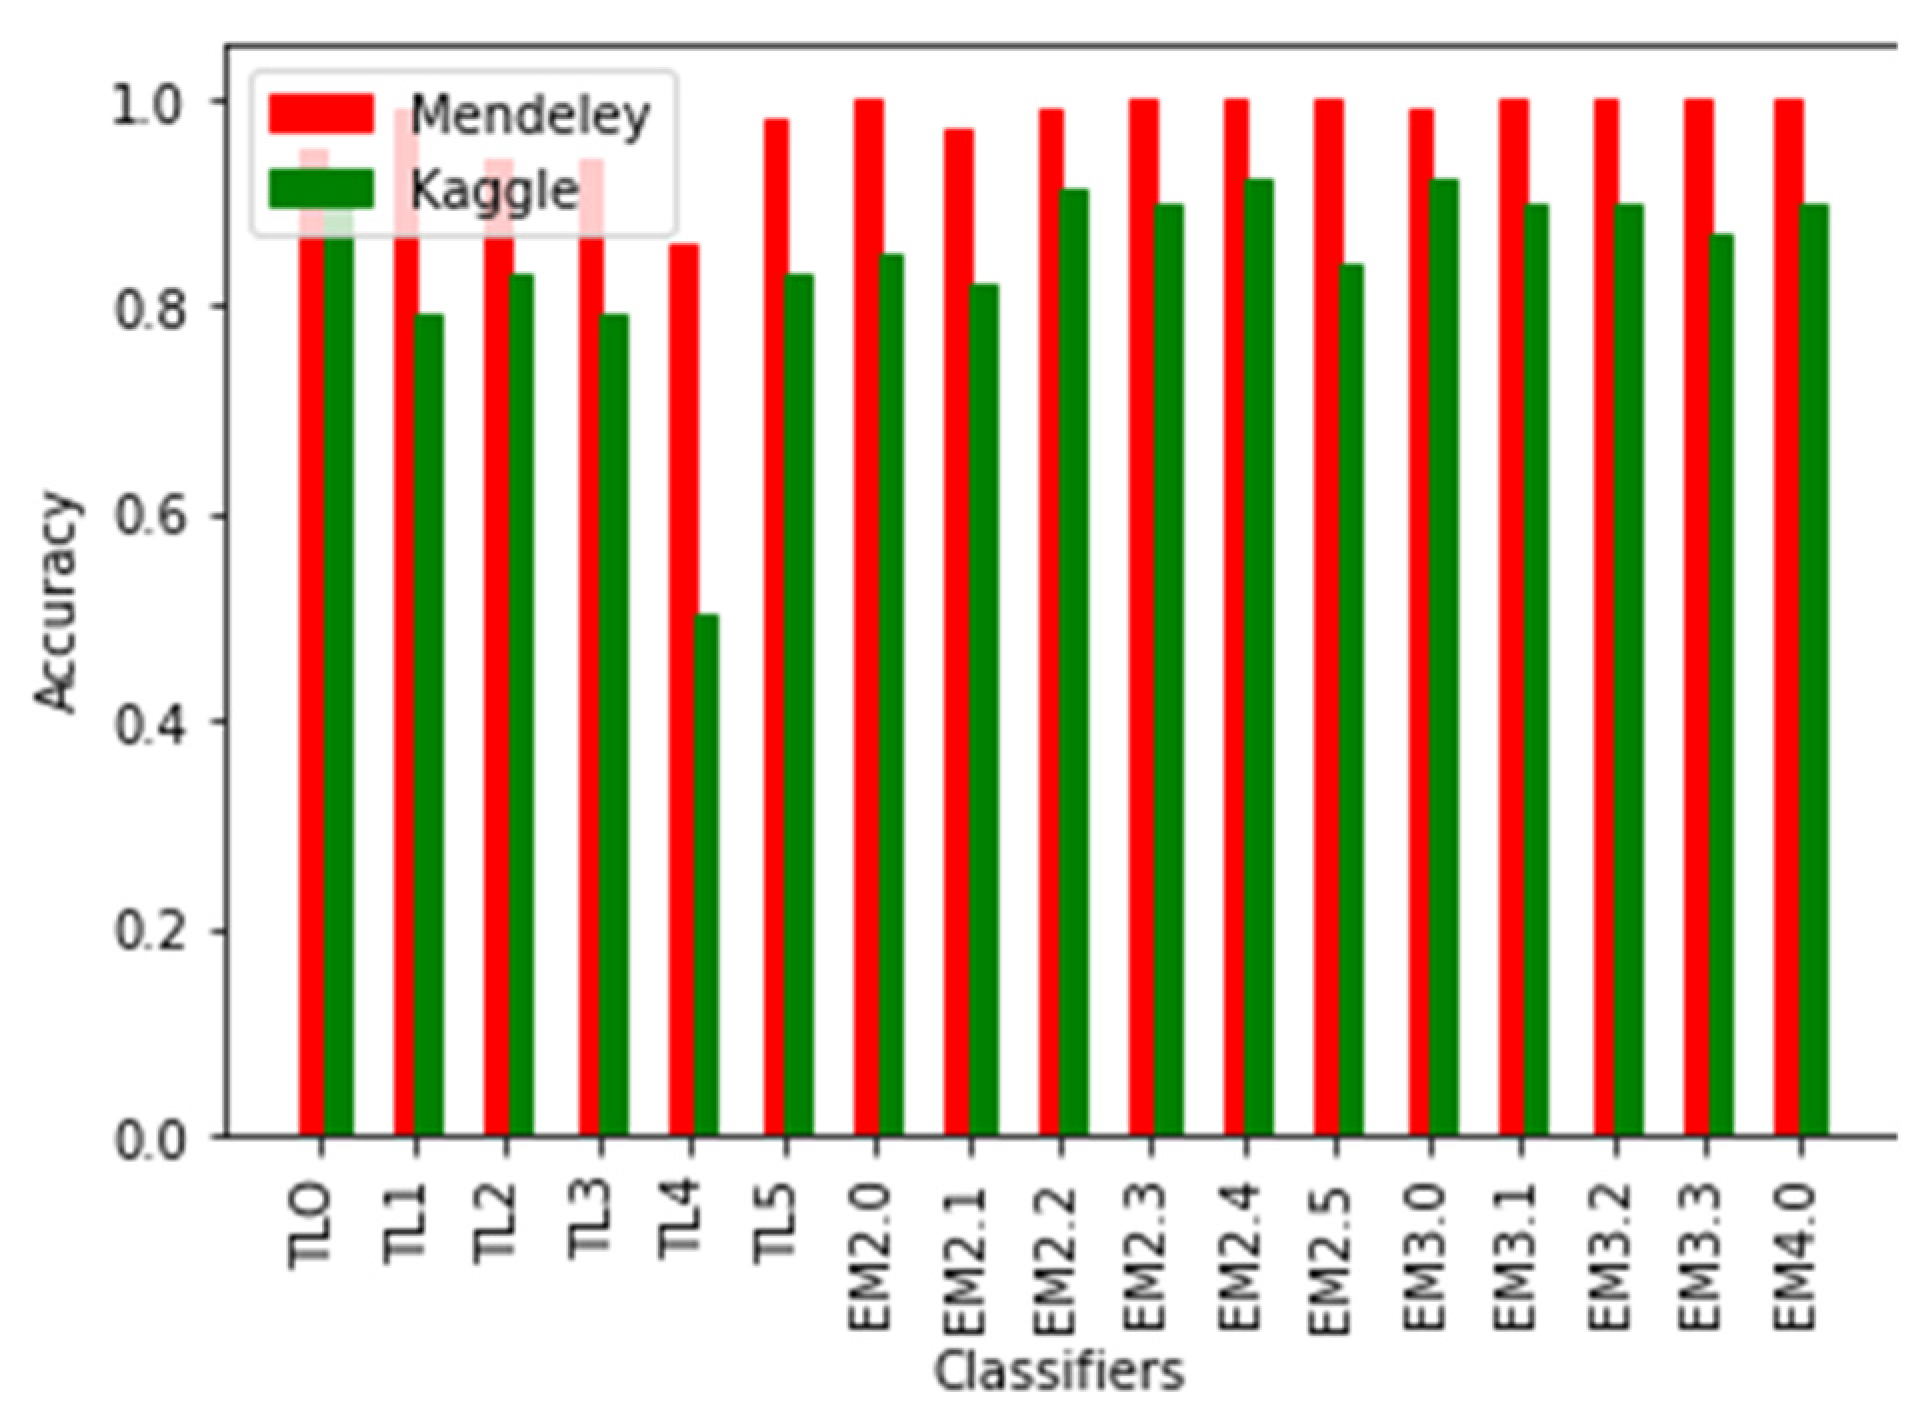
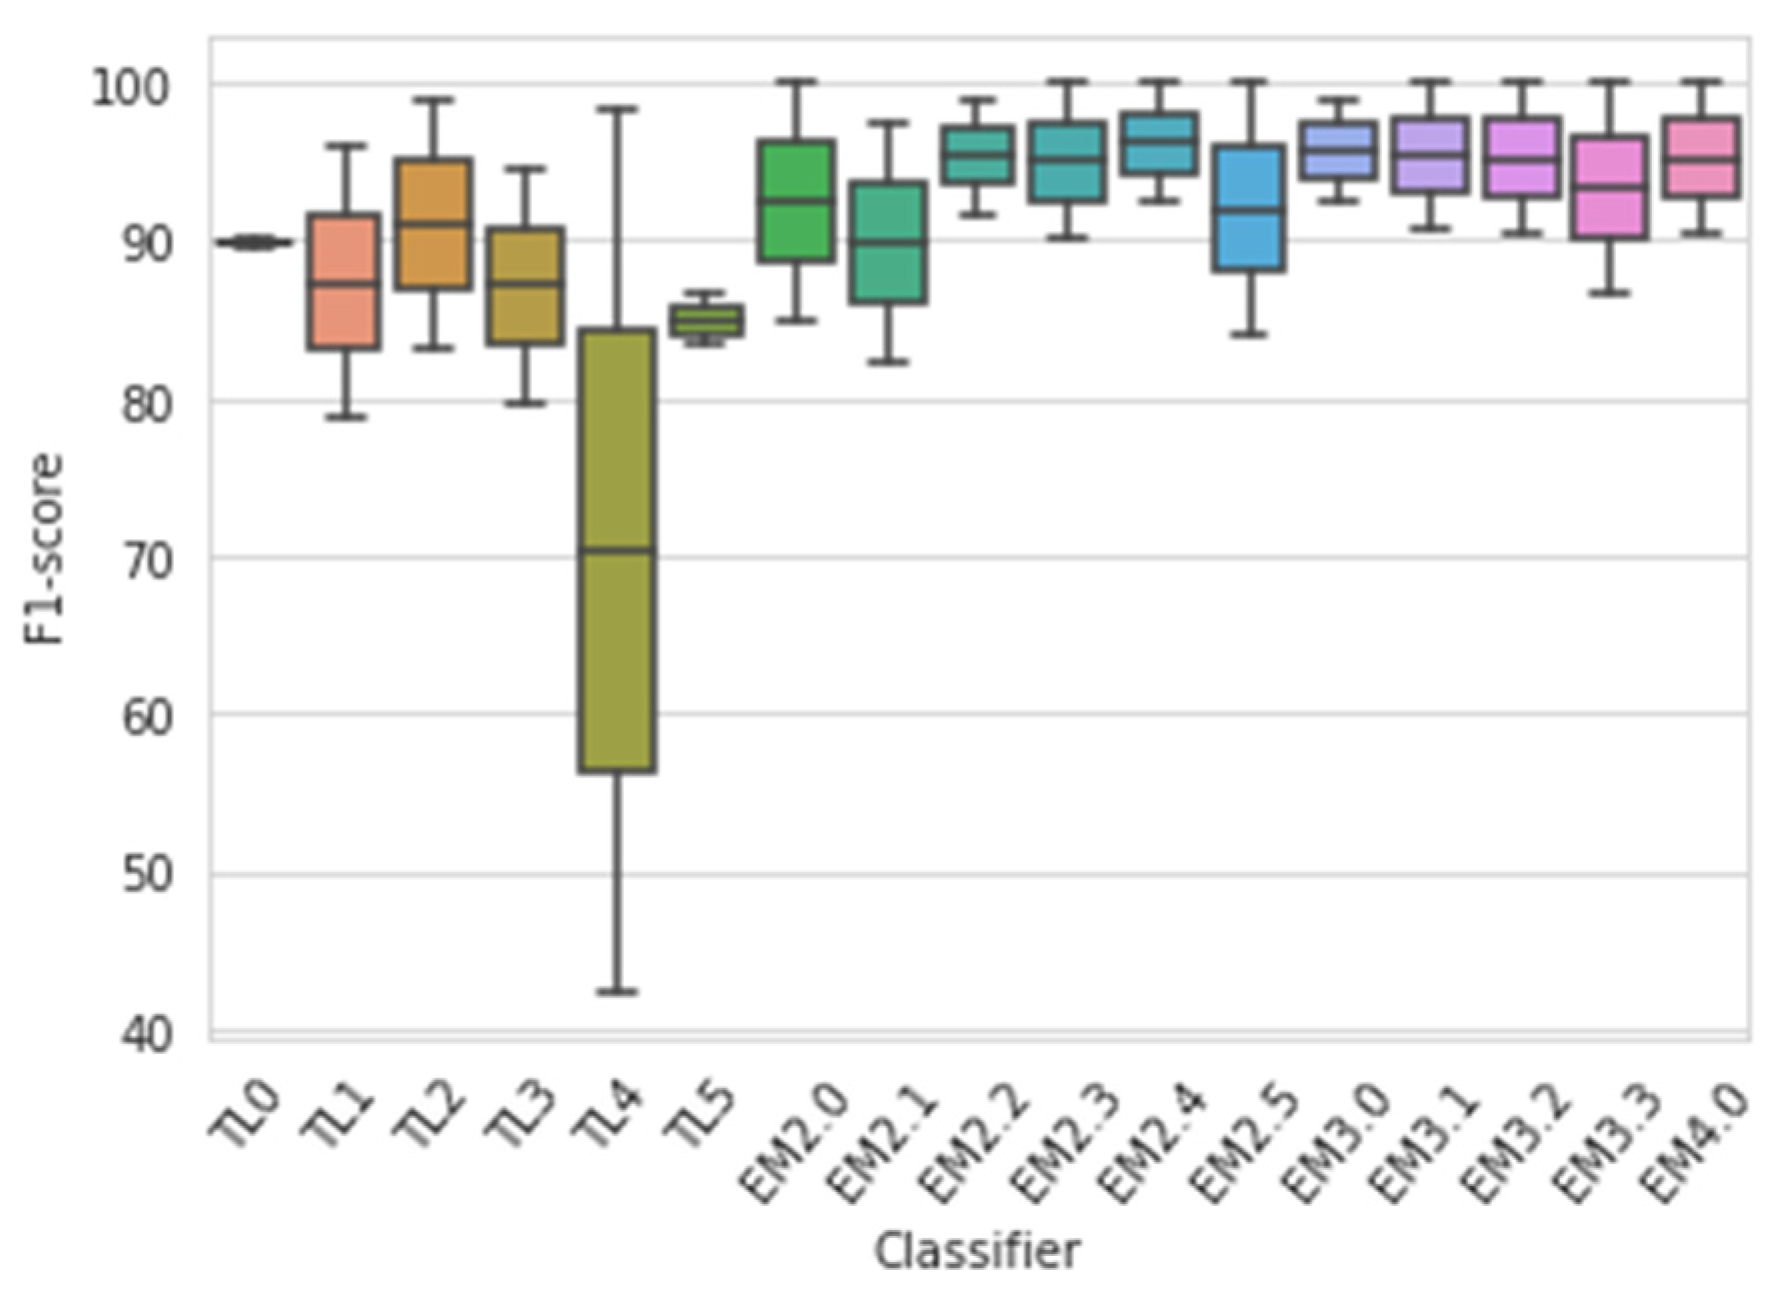
4.1. Results of Transfer Learning Models
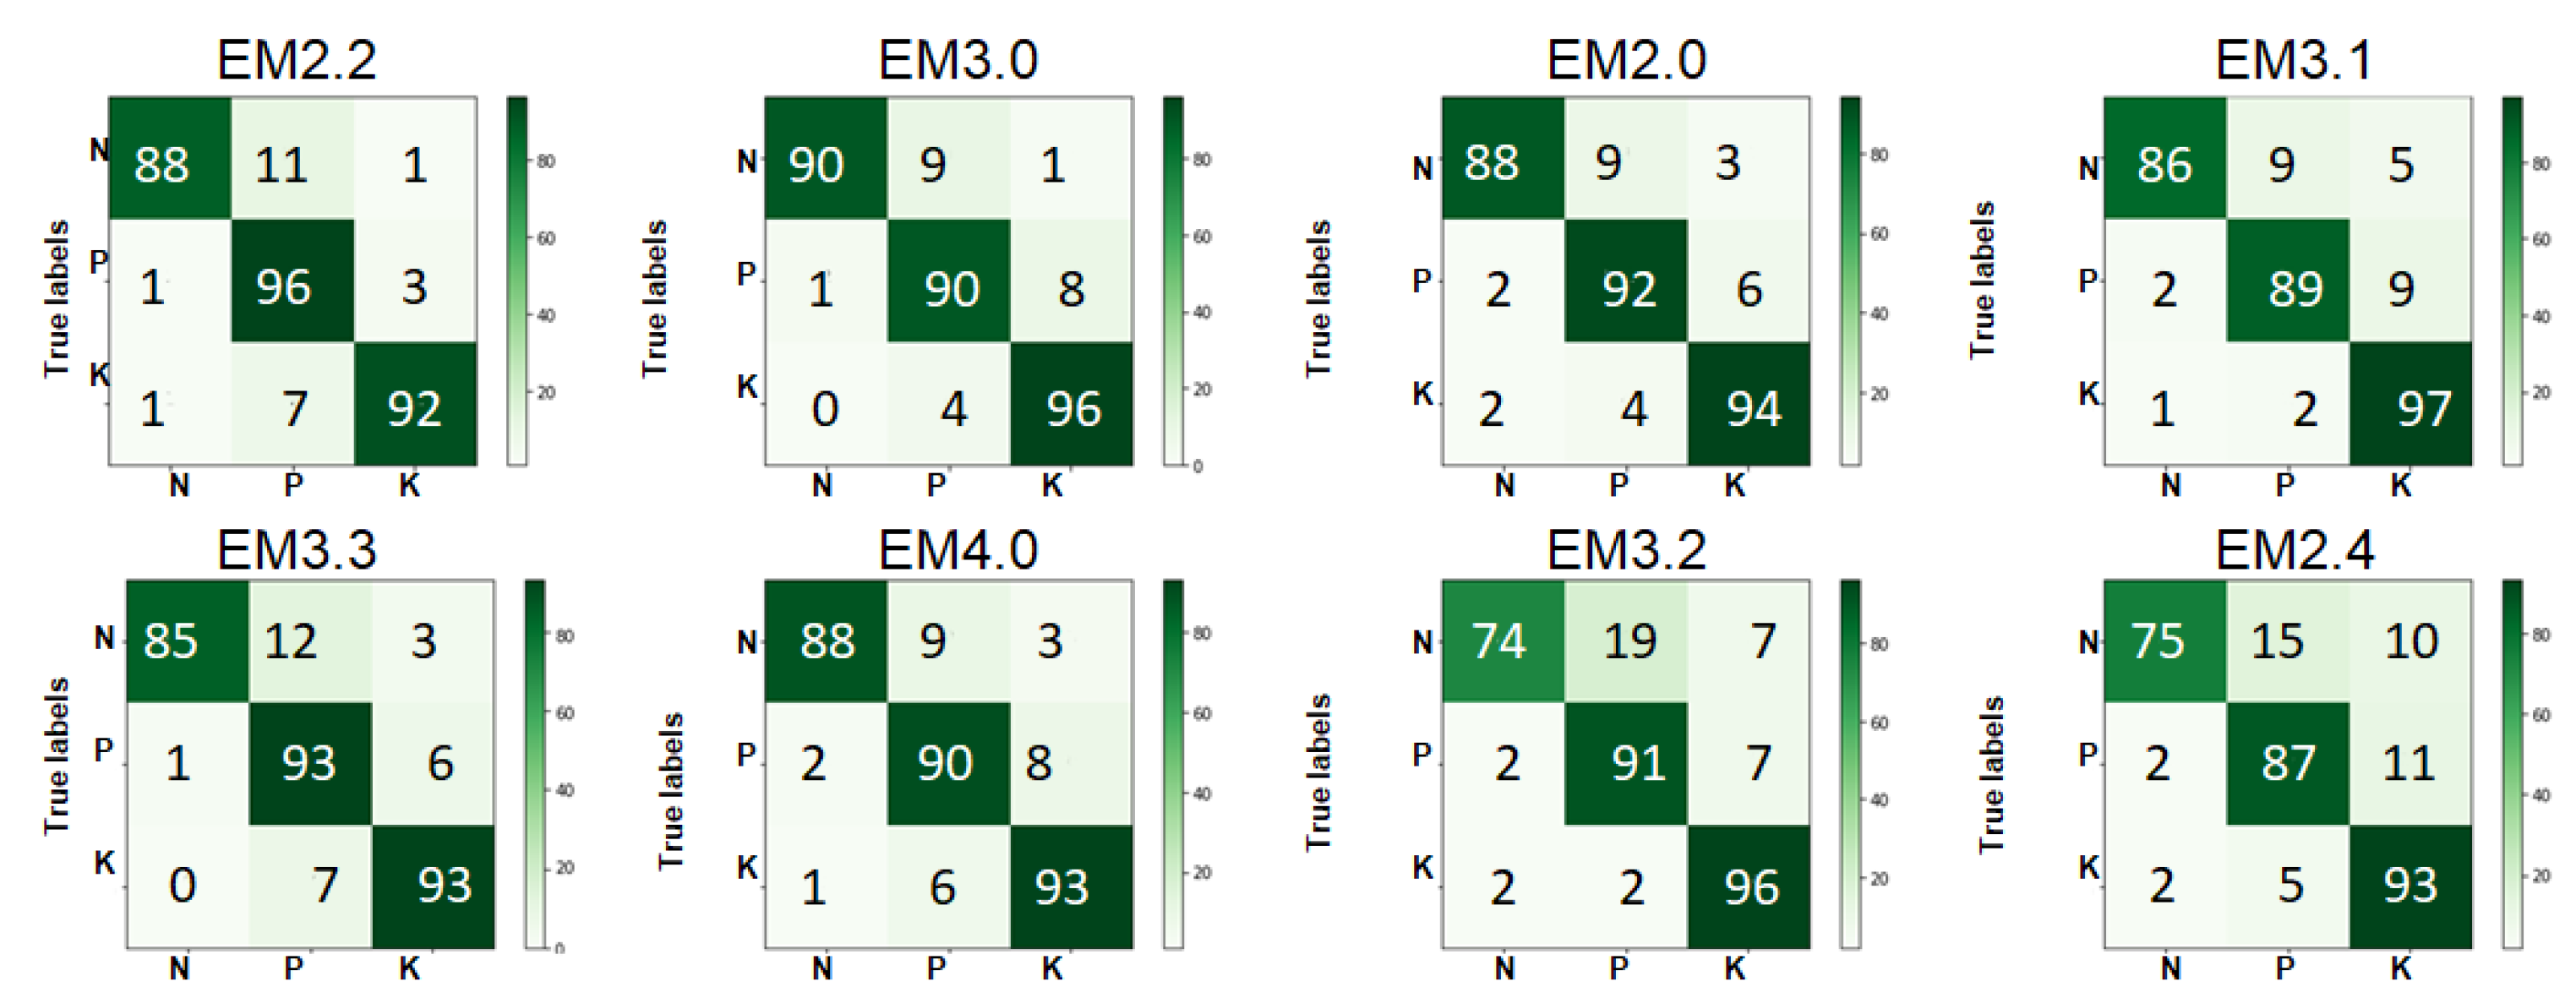
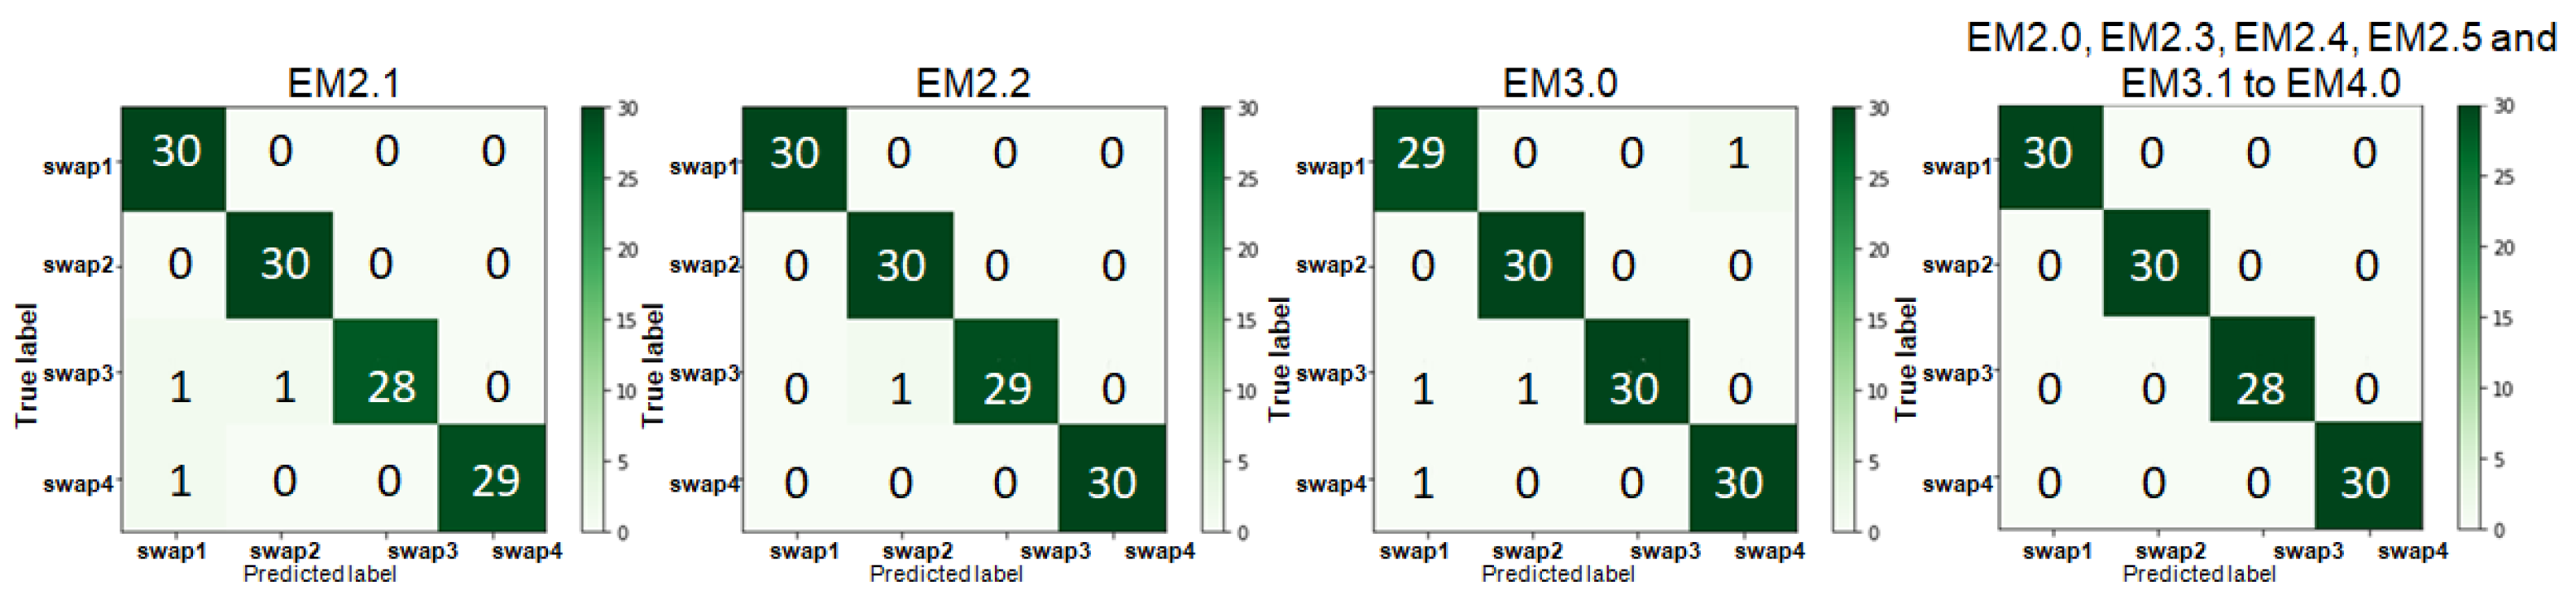
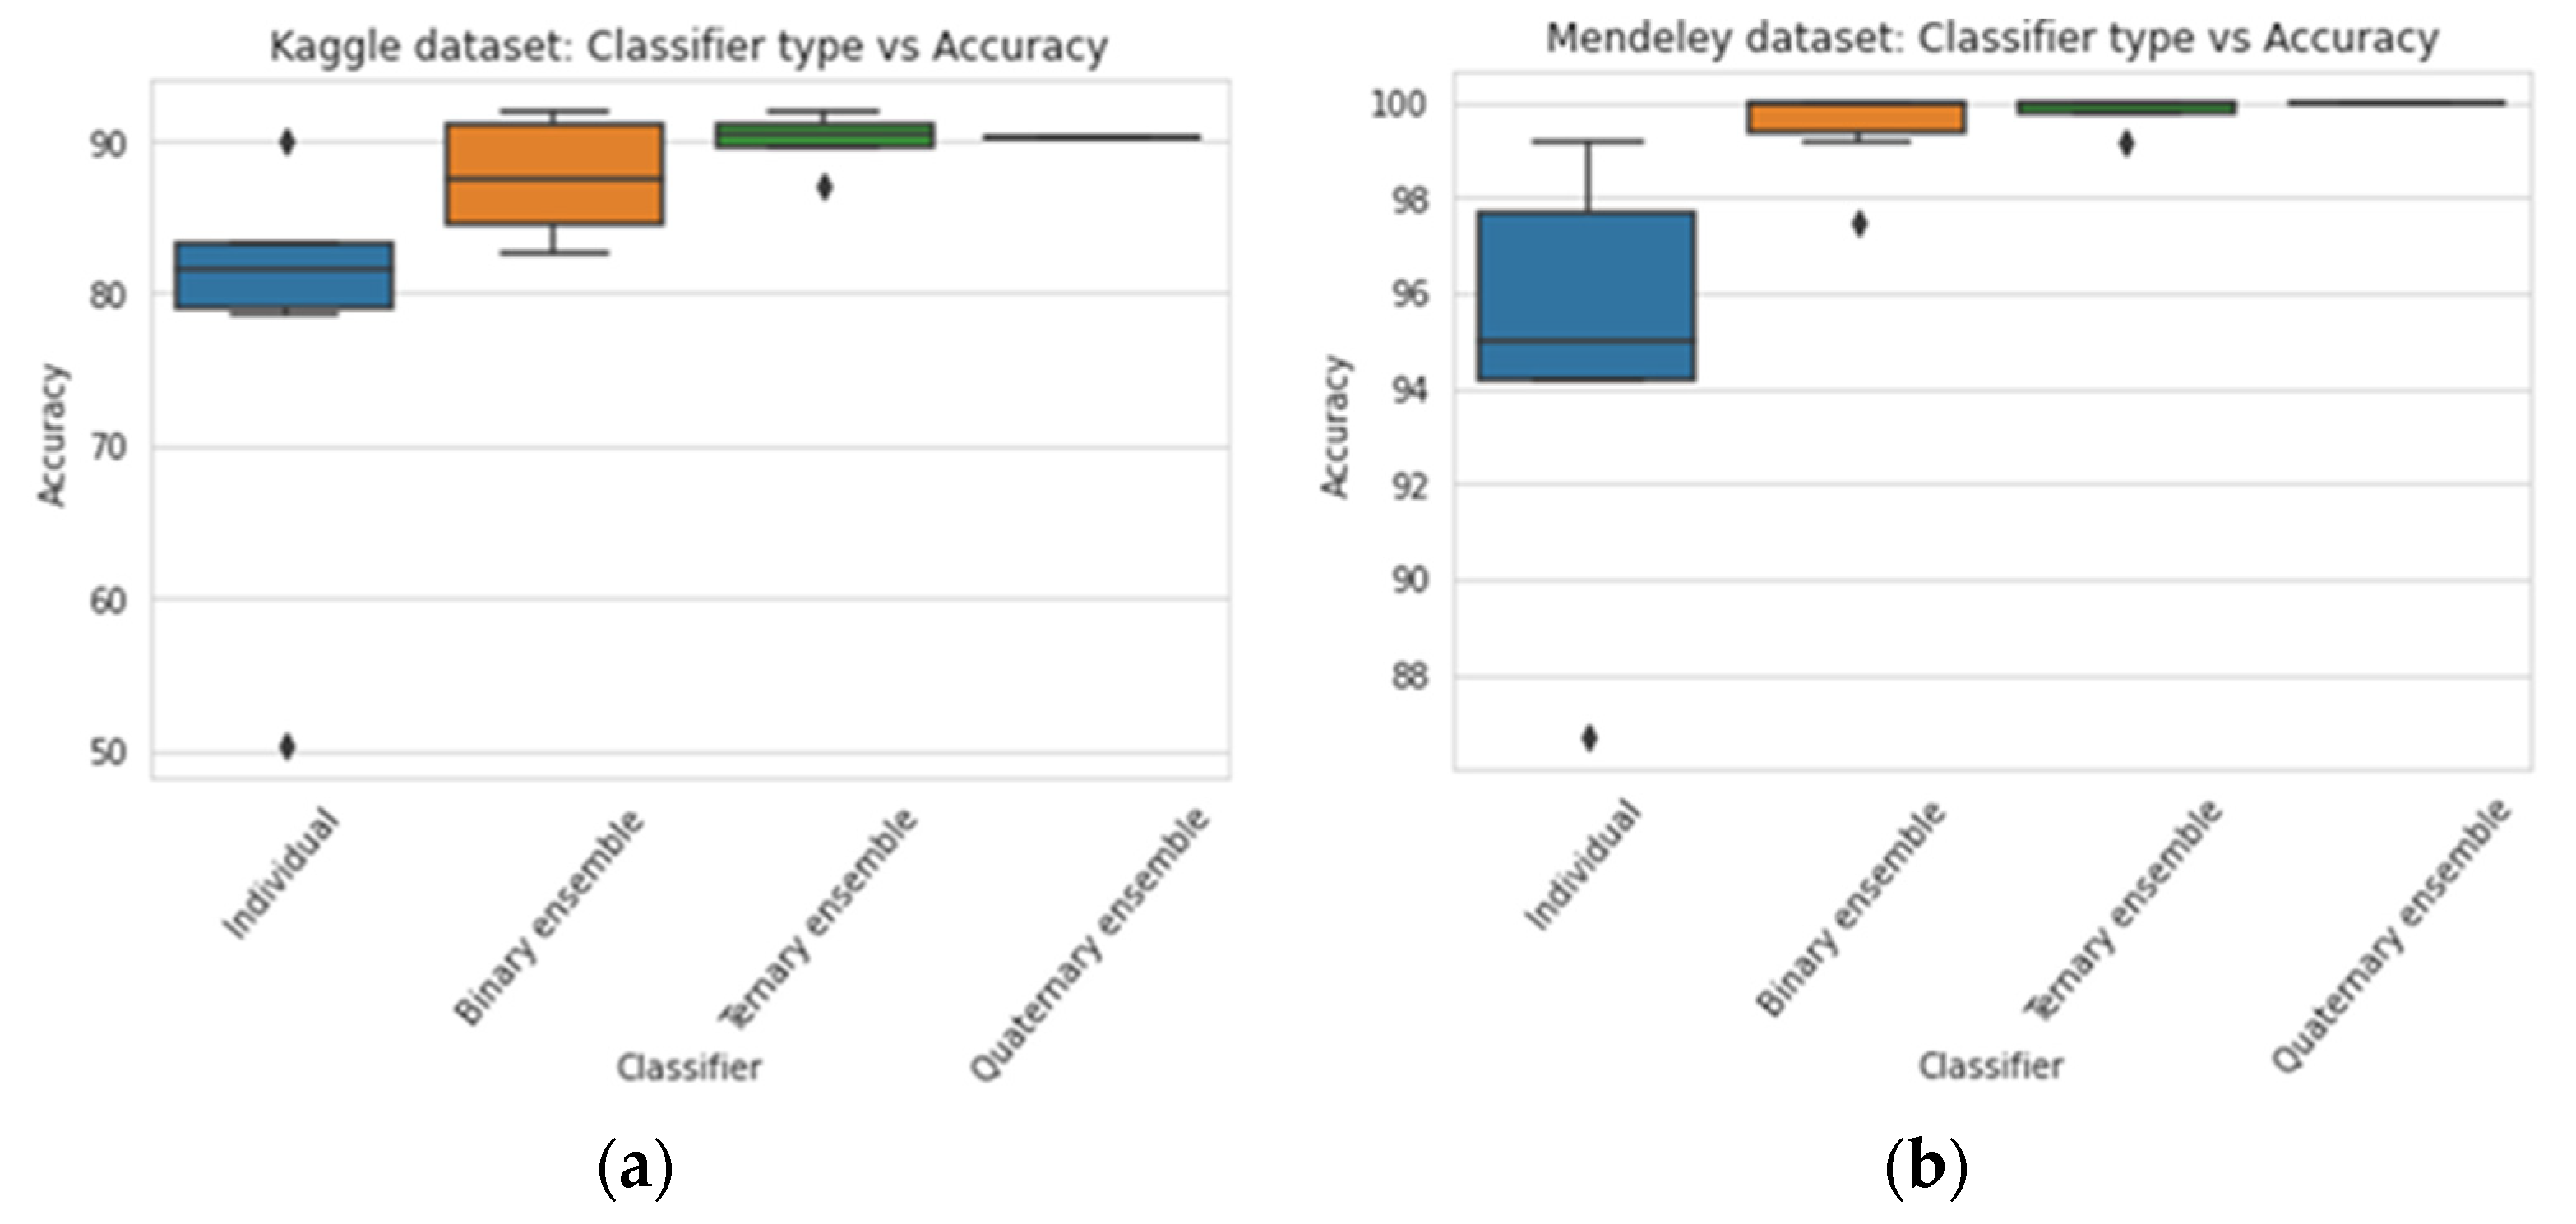
4.2. Results of Ensemble TL Models
5. Discussion
6. Conclusions
Author Contributions
Funding
Conflicts of Interest
Abbreviations
| DL | deep learning |
| CNN | convolutional neural network |
| TL | transfer learning |
| ML | machine learning |
| UAV | unmanned aerial vehicle |
| IoT | internet of things |
| ANN | artificial neural network |
| SVM | support vector machine |
| KNN | k-nearest neighbor |
| RAN | recurrent attention neural network |
| DRCNN | deep residual convolutional neural networks |
References
- Mohapatra, D.; Tripathy, J.; Patra, T.K. Rice disease detection and monitoring using CNN and naive Bayes classification. In Soft Computing Techniques and Applications; Borah, S., Pradhan, R., Dey, N., Gupta, P., Eds.; Springer: Singapore, 2021; Volume 1248. [Google Scholar]
- Mahender, A.; Swamy, B.P.M.; Anandan, A.; Ali, J. Tolerance of Iron-Deficient and -Toxic Soil Conditions in Rice. Plants 2019, 8, 31. [Google Scholar] [CrossRef] [PubMed] [Green Version]
- Rice Consumption by Country 2019 Statista. Available online: https://www.statista.com/statistics/255971/top-countries-based-on-rice-consumption-2012-2013/ (accessed on 19 December 2021).
- FAO. Rice Market Monitor (RMM); FAO: Roma, Italy, 2018; Volume XXI, pp. 1–38. [Google Scholar]
- Wang, Y.; Wu, W.H. Potassium transport and signaling in higher plants. Annu. Rev.Plant. Biol. 2013, 64, 451–476. [Google Scholar] [CrossRef] [PubMed] [Green Version]
- Nieves-Cordones, M.; Ródenas, R.; Lara, A.; Martínez, V.; Rubio, F. The combination of K+ deficiency with other environmental stresses: What is the outcome? Physiol. Plant. 2019, 165, 264–276. [Google Scholar] [CrossRef] [PubMed]
- Deficiencies and Toxicities-IRRI Rice Knowledge Bank. Available online: http://www.knowledgebank.irri.org/step-by-step-production/growth/soil-fertility/deficiencies-and-toxicities (accessed on 19 December 2021).
- Shrestha, J.; Manoj, K.; Subash, S.; Shah, K.K. Role of nutrients in rice (Oryza sativa L.): A review. Agrica 2020, 9, 53–62. [Google Scholar] [CrossRef]
- Cevallos, C.; Ponce, H.; Moya-Albor, E.; Brieva, J. Vision-Based Analysis on Leaves of Tomato Crops for Classifying Nutrient Deficiency using Convolutional Neural Networks. In Proceedings of the 2020 International Joint Conference on Neural Networks (IJCNN), Glasgow, UK, 19–24 July 2020. [Google Scholar]
- Patel, A.; Swaminarayan, P.; Patel, M. Identification of Nutrition’s Deficiency in Plant and Prediction of Nutrition Requirement Using Image Processing. In Proceedings of the Second International Conference on Information Management and Machine Intelligence, Jaipur, India, 24–25 July 2020; Springer: Singapore, 2020. [Google Scholar]
- Singh, A.; Budihal, S.V. Non-Invasive Techniques of Nutrient Detection in Plants. In Intelligent Computing and Applications. Advances in Intelligent Systems and Computing; Dash, S.S., Das, S., Panigrahi, B.K., Eds.; Springer: Singapore, 2019; p. 1172. [Google Scholar]
- Lu, T.; Han, B.; Chen, L.; Yu, F.; Xue, C. A generic intelligent tomato classification system for practical applications using DenseNet-201 with transfer learning. Sci. Rep. 2021, 11, 15824. [Google Scholar] [CrossRef]
- Barbedo, J.G.A. Detection of nutrition deficiencies in plants using proximal images and machine learning: A review. Comput. Electron. Agric. 2019, 162, 482–492. [Google Scholar] [CrossRef]
- Zha, H.; Miao, Y.; Wang, T.; Li, Y.; Zhang, J.; Sun, W.; Feng, Z.; Kusnierek, K. Improving Unmanned Aerial Vehicle Remote Sensing-Based Rice Nitrogen Nutrition Index Prediction with Machine Learning. Remote Sens. 2020, 12, 215. [Google Scholar] [CrossRef] [Green Version]
- Krishnamoorthy, N.; Prasad, L.V.N.; Kumar, C.S.P.; Subedi, B.; Abraha, H.B.; Sathiskumar, V.E. Rice leaf diseases prediction using deep neural networks with transfer learning. Environ. Res. 2021, 198, 111275. [Google Scholar]
- Abbaspour-Gilandeh, Y.; Molaee, A.; Sabzi, S.; Nabipur, N.; Shamshirband, S.; Mosavi, A. A Combined Method of Image Processing and Artificial Neural Network for the Identification of 13 Iranian Rice Cultivars. Agronomy 2020, 10, 117. [Google Scholar] [CrossRef] [Green Version]
- Mostafaeipour, A.; Fakhrzad, M.; Gharaat, S.; Jahangiri, M.; Dhanraj, J.; Band, S.; Issakhov, A.; Mosavi, A. Machine Learning for Prediction of Energy in Wheat Production. Agriculture 2020, 10, 517. [Google Scholar] [CrossRef]
- Sethy, P.K.; Kumari, C.; Barpanda, N.K.; Negi, B.; Behera, S.; Rath, A.K. Identification of Mineral Deficiency in Rice Crop based on SVM in Approach of K-Means & Fuzzy C-Means Clustering. Helix 2017, 7, 1970–1983. [Google Scholar]
- Dong, X.; Yu, Z.; Cao, W.; Shi, Y.; Ma, Q. A survey on ensemble learning. Front. Comput. Sci. 2020, 14, 241–258. [Google Scholar] [CrossRef]
- Li, J.; Oswald, C.; George, L.G.; Shi, Y. Improving model robustness for soybean iron deficiency chlorosis rating by unsupervised pre-training on unmanned aircraft system derived images. Comput. Electron. Agric. 2020, 175, 105557. [Google Scholar] [CrossRef]
- Han, K.A.M.; Watchareeruetai, U. Classification of Nutrient Deficiency in Black Gram Using Deep Convolutional Neural Networks. In Proceedings of the 2019 16th International Joint Conference on Computer Science and Software Engineering (JCSSE), Chonburi, Thailand, 10–12 July 2019; pp. 277–282. [Google Scholar]
- Tran, T.-T.; Choi, J.-W.; Le, T.-T.H.; Kim, J.-W. A Comparative Study of Deep CNN in Forecasting and Classifying the Macronutrient Deficiencies on Development of Tomato Plant. Appl. Sci. 2019, 9, 1601. [Google Scholar] [CrossRef] [Green Version]
- Wulandhari, L.A.; Gunawan, A.A.S.; Qurania, A.; Harsani, P.; Tarawan, T.F.; Hermawan, R.F. Plant nutrient deficiency detection using deep convolutional neural network. ICIC Express Lett. 2019, 13, 971–977. [Google Scholar]
- Xu, Z.; Guo, X.; Zhu, A.; He, X.; Zhao, X.; Han, Y.; Subedi, R. Using Deep Convolutional Neural Networks for Image-Based Diagnosis of Nutrient Deficiencies in Rice. Comput. Intell. Neurosci. 2020, 2020, 7307252. [Google Scholar] [CrossRef]
- Jahagirdar, P.; Budihal, S.V. Framework to Detect NPK Deficiency in Maize Plants Using CNNs. In Progress in Advanced Computing and Intelligent Engineering, Advances in Intelligent Systems and Computing; Panigrahi, C.R., Ed.; Springer: Singapore, 2021; p. 1199. [Google Scholar]
- Sethy, P.K.; Barpanda, N.K.; Rath, A.K.; Behera, S.K. Nitrogen Defciency Prediction of Rice Crop Based on Convolutional Neural Network. J. Ambient. Intell. Humaniz. Comput. 2020, 11, 5703–5711. [Google Scholar] [CrossRef]
- Abdalla, A.; Cen, H.; Wan, L.; Mehmood, K.; He, Y. Nutrient Status Diagnosis of Infield Oilseed Rape via Deep Learning-Enabled Dynamic Model. IEEE Trans. Ind. Inform. 2021, 17, 4379–4389. [Google Scholar] [CrossRef]
- Bahtiar, A.R.; Pranowo; Santoso, A.J.; Juhariah, J. Deep Learning Detected Nutrient Deficiency in Chili Plant, in 8th International conference on Information and Communication Technology. In Proceedings of the 2020 8th International Conference on Information and Communication Technology, Yogyakarta, Indonesia, 24–26 June 2020. [Google Scholar]
- Abayomi-Alli, O.; Damaševičius, R.; Misra, S.; Maskeliūnas, R. Cassava disease recognition from low-quality images using enhanced data augmentation model and deep learning. Expert Syst. 2021, 38, e12746. [Google Scholar] [CrossRef]
- Oyewola, D.O.; Dada, E.G.; Misra, S.; Damaševičius, R. Detecting cassava mosaic disease using a deep residual convolutional neural network with distinct block processing. PeerJ Comput. Sci. 2021, 7, e352. [Google Scholar] [CrossRef]
- Almadhor, A.; Rauf, H.; Lali, M.; Damaševičius, R.; Alouffi, B.; Alharbi, A. AI-Driven Framework for Recognition of Guava Plant Diseases through Machine Learning from DSLR Camera Sensor Based High Resolution Imagery. Sensors 2021, 21, 3830. [Google Scholar] [CrossRef] [PubMed]
- Kundu, N.; Rani, G.; Dhaka, V.S.; Gupta, K.; Nayak, S.C.; Verma, S.; Ijaz, M.F.; Woźniak, M. IoT and Interpretable Machine Learning Based Framework for Disease Prediction in Pearl Millet. Sensors 2021, 21, 5386. [Google Scholar] [CrossRef]
- Li, K.; Lin, J.; Liu, J.; Zhao, Y. Using Deep Learning for Image-Based Different Degrees of Ginkgo Leaf Disease Classification. Information 2020, 11, 95. [Google Scholar] [CrossRef] [Green Version]
- Yi, J.; Krusenbaum, L.; Unger, P.; Hüging, H.; Seidel, S.J.; Schaaf, G.; Gall, J. Deep Learning for Non-Invasive Diagnosis of Nutrient Deficiencies in Sugar Beet Using RGB Images. Sensors 2020, 20, 5893. [Google Scholar] [CrossRef] [PubMed]
- Hassan, S.; Maji, A.; Jasiński, M.; Leonowicz, Z.; Jasińska, E. Identification of Plant-Leaf Diseases Using CNN and Transfer-Learning Approach. Electronics 2020, 10, 1388. [Google Scholar] [CrossRef]
- Raksarikon, W. Nutrient Deficiency Symptom in Rice, Kaggle V1. 2020. Available online: https://www.kaggle.com/guy007/nutrientdeficiencysymptomsinrice/activity (accessed on 21 October 2021).
- Sethy, P.K. Nitrogen Deficiency of Rice Crop, Mendeley Data, V1. 2020. Available online: https://data.mendeley.com/datasets/gzm5pxntyv/1 (accessed on 21 October 2021).
- Bansal, P.; Kumar, R.; Kumar, S. Disease detection in Apple leaves using deep convolutional neural network. Agriculture 2021, 11, 617. [Google Scholar] [CrossRef]
- Simonyan, K.; Zisserman, A. Very deep convolutional networks for large-scale image recognition. In Proceedings of the International Conference on Learning Representations, San Diego, CA, USA, 7–9 May 2015. [Google Scholar]
- Chollet, F. Xception: Deep learning with depthwise separable convolutions. In Proceedings of the 2017 IEEE Conference on Computer Vision and Pattern Recognition (CVPR), Honolulu, HI, USA, 21–26 July 2017. [Google Scholar]
- Ramesh, S.; Vydeki, D. Recognition and classification of paddy leaf diseases using Optimized Deep Neural network with Jaya algorithm. Inf. Processing Agric. 2020, 7, 249–260. [Google Scholar] [CrossRef]
- Bari, S.; Islam, M.N.; Rashid, M.; Hasan, M.J.; Razman, M.A.M.; Musa, R.M.; Ab Nasir, A.F.; Abdul Majeed, A.P.P. A real-time approach of diagnosing rice leaf disease using deep learning-based faster R-CNN framework. PeerJ Comput. Sci. 2021, 7, e432. [Google Scholar] [CrossRef]
- Uğuz, S.; Uysal, N. Classification of olive leaf diseases using deep convolutional neural networks. Neural Comput. Appl. 2021, 33, 4133–4149. [Google Scholar] [CrossRef]
- Sharma, M.; Kumar, C.J.; Deka, A. Early diagnosis of rice plant disease using machine learning techniques. Arch. Phytopathol. Plant. Prot. 2021, 1–25. [Google Scholar] [CrossRef]
- Szegedy, C.; Vanhoucke, V.; Ioffe, S.; Shlens, J.; Wojna, Z. Rethinking the inception architecture for computer vision. In Proceedings of the IEEE Conference Computer Vision and Pattern Recognition, Las Vegas, NV, USA, 27–30 June 2016. [Google Scholar]
- Szegedy, C.; Liu, W.; Jia, Y.; Sermanet, P.; Reed, S.; Anguelov, D.; Erjam, D.; Vanhoucke, V.; Rabinovich, A. Going deeper with convolutions. In Proceedings of the IEEE Conference on Computer Vision and Pattern Recognition, Boston, MA, USA, 8–10 June 2015. [Google Scholar]
- Peng, J.; Kang, S.; Ning, Z.; Deng, H.; Shen, J.; Xu, Y.; Zhang, J.; Zhao, W.; Li, X.; Gong, W.; et al. Residual convolutional neural network for predicting response of transarterial chemoembolization in hepatocellular carcinoma from CT imaging. Eur Radiol. 2020, 30, 413–424. [Google Scholar] [CrossRef] [PubMed] [Green Version]
- Turkoglu, M.; Yanikoğlu, B.; Hanbay, D. PlantDiseaseNet: Convolutional neural network ensemble for plant disease and pest detection. In Signal Image Video Processing; Springer: London, UK, 2021; pp. 1–9. [Google Scholar]
- Vallabhajosyula, S.; Sistla, V.; Kolli, V.K.K. Transfer learning-based deep ensemble neural network for plant leaf disease detection. J. Plant. Dis. Prot. 2021, 1–14. [Google Scholar] [CrossRef]
- Feng, L.; Zhang, Z.; Ma, Y.; Du, Q.; Williams, P.; Drewry, J.; Luck, B. Alfalfa yield prediction using UAV-based hyperspectral imagery and ensemble learning. Remote Sens. 2020, 12, 2028. [Google Scholar] [CrossRef]


| References | Models Used | Deficiency Dataset | Transfer Learning | Type of Deficiency | Results |
|---|---|---|---|---|---|
| [9] | CNN | Tomato (field-work) | No | N,P,K | (80.45–86.59)% |
| [18] | (Kmeans,FCM based feature exraction) + SVM | Rice (IRRI, Philippines data base) | No | N,P,K,Zn,Mg | (85.06–93)% |
| [20] | RAN-CNN, convolutional autoencoder | Soybean (field-work) | No | Fe | convolutional autoencoder performed best |
| [21] | MobileNet/V2, AlexNet, VGG16, Xception, InceptionV3, ResNet50 | Black gram (field-work) | Yes | N,P,K,Ca,Fe,Mg | 65.44% |
| [22] | InceptionResNetV2, autoencoder and ensembling of these two. | Tomato (field-work) | Yes | Ca, N, P | (79.09–91)% |
| [23] | InceptionResNetV2 | Okra (field-work) | Yes | Not given | (59–86)% |
| [24] | InceptionV3, ResNet50, NasNet-large and DenseNet121 | Rice (field-work) | Yes | N,P,K,S,Ca,Mg,Fe,Mn,Zn,Si | (91.67–97.44)% |
| [25] | InceptionV3 | Maize (details not provided) | Yes | NPK | (40–80)% |
| [26] | (AlexNet + ResNet18/50 + GoogleNet + VGG16/19) + SVM | Rice (field-work) | Yes | N | (95.61–99.84)% |
| [27] | InceptionV3 + time series model | Oilseed rape (field-work) | No | N, P, K mainly | (92–95)% |
| [34] | AlexNet, VGG16, ResNet101, Densenet161, SqueezeNet | Sugar beet (field-work) | Yes | N,P,K,Ca | (62.4–98.4)% |
| Sl. No. | Augmentation Technique | Parameter with Value |
|---|---|---|
| 1 | Flip | Probability = 0.2 |
| 2 | Rotation without cropping | Probability = 0.2, Maximum left/right factor = 25 |
| 3 | Random skew | Probability = 0.4, Maximum skew = 0.5 |
| 4 | Zooming | Probability = 0.2, Minimum factor = 1.1, Maximum factor = 1.5 |
| Information | Kaggle Deficiency Rice Dataset | Mendeley N Deficiency Rice Dataset | |||||
|---|---|---|---|---|---|---|---|
| Deficiency class | N | P | K | Swap1 | Swap2 | Swap3 | Swap4 |
| Distribution of images | 440 | 333 | 383 | 1407 | 1203 | 1400 | 1380 |
| Number of training images | 2456 | 5390 | |||||
| Number of testing images | 300 | 120 | |||||
| Number of validation images | 600 | 280 | |||||
| Total number of images after augmentation | 3356 | 5790 | |||||
| Model | Total Parameters |
|---|---|
| InceptionResNetV2 | 55,913,699 |
| Xception | 22,962,731 |
| DenseNet201 | 20,815,427 |
| VGG19 | 20,552,771 |
| InceptionV3 | 23,116,067 |
| ResNet152V2 | 59,382,275 |
| Classifiers | Kaggle Dataset | Mendeley Dataset | ||||||
|---|---|---|---|---|---|---|---|---|
| Mean | Mean | |||||||
| Precision | Recall | F1-Score | Accuracy | Precision | Recall | F1-Score | Accuracy | |
| InceptionResNetV2 (TL0) | 90 | 90 | 89.67 | 90 | 96.5 | 95.75 | 96 | 95.83 |
| Xception (TL1) | 80.33 | 78.67 | 78.67 | 78.67 | 99.25 | 99.25 | 99 | 99.17 |
| DenseNet201 (TL2) | 87 | 76 | 83 | 83.33 | 95.25 | 94.25 | 94.5 | 94.17 |
| VGG19 (TL3) | 81 | 79.67 | 79.67 | 79.67 | 98.5 | 98.5 | 98.25 | 94.17 |
| InceptionV3 (TL4) | 55.67 | 50.33 | 42.33 | 50.33 | 89.25 | 86.75 | 86.5 | 86.67 |
| ResNet152V2 (TL5) | 83.67 | 83.33 | 83.33 | 83.33 | 94.25 | 94 | 93.75 | 98.33 |
| Xception + VGG19 (EM2.0) | 86 | 85 | 85 | 85 | 100 | 100 | 100 | 100 |
| Xception+ DenseNet201(EM2.1) | 86 | 82.67 | 82.33 | 82.67 | 97.75 | 97.5 | 97.5 | 97.5 |
| Xception +InceptionResNetV2 (EM2.2) | 91.67 | 91.33 | 91.67 | 91.33 | 99.25 | 99.25 | 99 | 99.17 |
| InceptionResNetV2 + VGG19 (EM2.3) | 90.33 | 90 | 90 | 90 | 100 | 100 | 100 | 100 |
| InceptionResNetV2 + DenseNet (EM2.4) | 92.67 | 92 | 92.33 | 92 | 100 | 100 | 100 | 100 |
| VGG19 + DenseNet201 (EM2.5) | 87.33 | 84.33 | 84 | 84.33 | 100 | 100 | 100 | 100 |
| InceptionResNetV2 + VGG19 + DenseNet201 (EM3.0) | 92 | 92 | 92.33 | 92 | 99.25 | 99.25 | 99 | 99.17 |
| InceptionResNetV2 + VGG19 + Xception (EM3.1) | 91 | 90.67 | 90.67 | 90.67 | 100 | 100 | 100 | 100 |
| InceptionResNetV2 + DenseNet201 + Xception (EM3.2) | 91 | 90.33 | 90.33 | 90.33 | 100 | 100 | 100 | 100 |
| VGG19 + Xception + DenseNet201 (EM3.3) | 87.67 | 87 | 86.67 | 87 | 100 | 100 | 100 | 100 |
| InceptionResNetV2 + VGG19 + DenseNet201 + Xception (EM4) | 90.67 | 90.33 | 90.33 | 90.33 | 100 | 100 | 100 | 100 |
Publisher’s Note: MDPI stays neutral with regard to jurisdictional claims in published maps and institutional affiliations. |
© 2022 by the authors. Licensee MDPI, Basel, Switzerland. This article is an open access article distributed under the terms and conditions of the Creative Commons Attribution (CC BY) license (https://creativecommons.org/licenses/by/4.0/).
Share and Cite
Sharma, M.; Nath, K.; Sharma, R.K.; Kumar, C.J.; Chaudhary, A. Ensemble Averaging of Transfer Learning Models for Identification of Nutritional Deficiency in Rice Plant. Electronics 2022, 11, 148. https://doi.org/10.3390/electronics11010148
Sharma M, Nath K, Sharma RK, Kumar CJ, Chaudhary A. Ensemble Averaging of Transfer Learning Models for Identification of Nutritional Deficiency in Rice Plant. Electronics. 2022; 11(1):148. https://doi.org/10.3390/electronics11010148
Chicago/Turabian StyleSharma, Mayuri, Keshab Nath, Rupam Kumar Sharma, Chandan Jyoti Kumar, and Ankit Chaudhary. 2022. "Ensemble Averaging of Transfer Learning Models for Identification of Nutritional Deficiency in Rice Plant" Electronics 11, no. 1: 148. https://doi.org/10.3390/electronics11010148
APA StyleSharma, M., Nath, K., Sharma, R. K., Kumar, C. J., & Chaudhary, A. (2022). Ensemble Averaging of Transfer Learning Models for Identification of Nutritional Deficiency in Rice Plant. Electronics, 11(1), 148. https://doi.org/10.3390/electronics11010148