Article

Low-Power GPS-Disciplined Oscillator Module for Distributed Wireless Sensor Nodes

by
Tyler J. Boehmer
1 and
Sven G. Bilén
2,3,*
1
Johns Hopkins University Applied Physics Laboratory, Laurel, MD 20723, USA
2
School of Engineering Design, Technology, and Professional Programs, The Pennsylvania State University, University Park, PA 16802, USA
3
School of Electrical Engineering and Computer Science, The Pennsylvania State University, University Park, PA 16802, USA
*
Author to whom correspondence should be addressed.
Electronics 2021, 10(6), 716; https://doi.org/10.3390/electronics10060716
Submission received: 31 January 2021 / Revised: 15 March 2021 / Accepted: 15 March 2021 / Published: 18 March 2021
(This article belongs to the Section Circuit and Signal Processing)

Abstract

:
Many sensor systems, such as distributed wireless sensor arrays, require high-accuracy timing while maintaining low power consumption. Although the capabilities of chip-scale atomic clocks have advanced significantly, their cost continues to be prohibitive for many applications. GPS signals are commonly used to discipline local oscillators in order to inherit the long-term stability of GPS timing; however, commercially available GPS-disciplined oscillators typically use temperature-controlled oscillators and take an extended period of time to reach their stated accuracy, resulting in a large power consumption, usually over a watt. This has subsequently limited their adoption in low-power applications. Modern temperature-compensated crystal oscillators now have stabilities that enable the possibility of duty cycling a GPS receiver and intermittently correcting the oscillator for drift. Based on this principle, a design for a GPS-disciplined oscillator is presented that achieves an accuracy of 5 μ s rms in its operational environment, while consuming only 45 mW of average power. The circuit is implemented in a system called geoPebble, which uses a large grid of wireless sensors to perform glacial reflectometry.

1. Introduction

Providing accurate timing for electronic sensors has been a necessary and difficult problem for a long time [1,2] and is particularly necessary for distributed wireless sensor applications, such as tracking items or targets of interest [3], network communication [4,5], or reflectometry. While many solutions exist [2,6,7,8,9], currently, most commercially available frequency sources exhibiting frequency accuracies better than 100 ppb require a power draw of at least 155 mW [10,11,12], with the exception of chip-scale atomic clocks. While significant progress on chip-scale atomic clocks has been made and 250-ppt accuracy has been demonstrated with less than 75-mW power draw [12], the cost of such devices is prohibitive for many applications. The excessive power consumption of typical high-accuracy frequency sources has limited their use in wireless sensor nodes due to the size of the required battery pack needed for long duration operations. Table 1 presents a qualitative look at various frequency sources and how the GSP-disciplined oscillator (GPSDO) described herein compares.
A system called geoPebble [13,14], which uses a large grid of wireless sensors to perform glacial reflectometry, has been developed at The Pennsylvania State University. The geoPebbles have been deployed in the Antarctic and elsewhere in order to create three-dimensional maps of ice sheets. High-accuracy timing is required for precise mapping, but the units must also be capable of running continuously for several days while still being small and easy to transport, which places restrictions on the power supply (additional details on the geoPebble system are provided in Appendix A). Since a typical high-accuracy frequency source would account for the largest average power consumption in the system, a method of frequency counting and GPS receiver duty cycling has been developed that allows for a timing accuracy of 5 μ s rms, while consuming less than 45 mW average power. This reduction in power usage significantly extends the operational time of the deployed geoPebbles from about one day to almost a week and reduces the logistical costs of constant retrieval and deployment of the units for recharging.
It should be noted that many distributed sensor (e.g., Internet of Things (IoT)) networks require low power usage and may accomplish this via wake-up receivers/oscillators (cf. [15,16]); however, such systems generally do not require that the distributed sensors remain in phase coherence. In cases where this is required—such as the geoPebble system—a GPSDO such as we developed is needed.

GPSDO Commercial Availability

Much work has been performed on GPSDOs, resulting in many commercially viable products. Unfortunately, these products focus on very high-accuracy applications for which the GPS will run continuously. While many specify hold-over accuracies for when GPS is not available, these models typically utilize ovenized oscillators that require a relatively large amount of power to run, i.e., the oscillator is held at a constant temperature above the ambient one—typically >50 °C—in an “oven” to ensure that temperature-drift effects are minimized, and the power draw required increases the larger the differential between ambient and oven temperature. The models that do use a temperature-compensated crystal oscillator (TCVCXO) instead of an ovenized oscillator do not have as high quality an oscillator as that used in this work or take too long to discipline the oscillator to within acceptable limits. Table 2 presents a list of GPSDOs that have been found to have some of the lowest power consumptions. Even the lowest power GPSDO requires five times the power allotted for the GPSDO in the geoPebble system. While never commercially developed, there exists a patent detailing the functionality of a low-powered GPSDO using a phase-locked loop [17], but this system takes just as long as other commercially available GPSDOs to reach its intended accuracy. The developed GPSDO, while not intended to be as accurate as the commercially available GPSDOs, is capable of disciplining within 36 s of a valid 1-pps signal (described below) appearing. This quick discipline action, combined with a GPS receiver that can lock onto a signal quickly (in less than one minute), is what allows the developed GPSDO to achieve such a low power consumption.
This paper presents an overview of the frequency source as developed, the driving requirements for the design, and the experimental verification of the system’s hardware and software.

2. GPSDO Overview

The GPSDO was designed in order to meet the timing requirements of the geoPebble system. The technique used for accurate timing requires the use of the one-second epoch derived from the GPS signal. The GPS receiver outputs this signal as a pulse, also known as a “one-pulse-per-second” (1-pps) signal. The 1-pps signal from the GPS receiver is used as an accurate timing source that is used to steer the local 20-MHz oscillator to a more accurate operating point. A temperature-compensated voltage-controlled crystal oscillator (TCVCXO) is used used as the frequency source due to its lower power requirements compared with other high-accuracy oscillators. Further power savings can be obtained by duty cycling the GPS receiver on and off, thus lowering the average power consumption of the GPSDO system. Such GPS receivers necessarily require fast acquisition, but their performance generally is not affected otherwise by on–off cycling.
Unlike conventional GPSDOs that use long time constants for integration (typically from hours to days) in order to inherit the GPS signal’s long-term accuracy, which is on the order of parts per trillion [6,9], the proposed GPSDO uses a much shorter time constant of 33 s in order to drive the oscillator into the necessary bounds. This short time constant allows frequency counting resolution of the local oscillator down to 0.03 Hz, allowing a margin of error for jitter on the 1-pps signal and the drift of the VCTCXO due to temperature fluctuations while the GPS receiver is off to conserve power.
Figure 1 presents the block diagram of the GPSDO developed. The GPSDO circuit was implemented on the main board of the geoPebble, as shown in Figure A3 of Appendix B. A frequency counter uses a gate trigger to start and stop the counting of the 20-MHz local oscillator signal. The counted value of this clock is read into a microcontroller acting as a digital controller that controls the output of a digital-to-analog converter (DAC). This DAC then feeds into the control pin of the TCVCXO. This closed-loop system will steer the oscillator to an accurate 20-MHz frequency, based on the accuracy of the gate trigger (i.e., the GPS-derived 1-pps signal).

2.1. GPSDO Requirements

The geoPebble system requires 1% timing accuracy, with respect to the data sampling rate, at all times while collecting data in order to accomplish its intended science (see Appendix A for additional details on the requirements for timing accuracy). The geoPebble’s two data collection modes are continuous mode and burst mode. Continuous mode entails collecting data for extended periods of time at a rate of 1 kHz, resulting in a timing accuracy requirement of 10 μ s with respect to some nominal time standard. The burst mode collects data for a shorter period of time, approximately three minutes, at a rate of 10 kHz, resulting in a timing accuracy requirement of 1 μ s with respect to some nominal time standard. Since the geoPebble is a battery-operated device, the most stringent requirement is power usage. The GPSDO is allocated a power budget of 100 mW. Since the GPS receiver requires more power than this, a stable oscillator is needed to keep track of time while the GPS receiver is off. The power requirement also immediately eliminates any GPSDOs that are commercially available as the lowest power options currently on the market are around 500 mW [18]. The unit must also operate nominally at temperatures as low as 20 °C, since the geoPebble must be capable of deployment during the Antarctic summer.
Based on what is currently commercially available, the best non-ovenized crystal oscillators typically have an absolute accuracy of 0.1 ppm when shipped from the manufacturer. These are temperature-compensated crystal oscillators (TCXO) and can typically maintain 0.1-ppm relative accuracy across a temperature range of 20 °C to + 70 °C for high-end devices. This results in 0.2-ppm absolute accuracy at any given operating temperature when shipped from the manufacturer. Using a 0.2-ppm offset from nominal frequency as the worst case, this means that after three minutes (the average operating mode period), the clock may have drifted:
t drift = δ × Δ T = 0.2 ppm × ( 3 × 60 ) = 36 μ s ,
where δ is the frequency offset of the oscillator, Δ T is the length of time the clock has run, and t drift is the clock’s time drift. Not only does this not meet the burst mode’s requirements, but it does not meet the requirements for continuous mode within three minutes. Coupling this with the fact that the oscillator will drift further from nominal due to aging and mechanical shock and vibration, using a non-ovenized crystal oscillator without external compensation is not feasible.

2.2. Hardware

In order to accomplish the necessary frequency counting with high enough accuracy, a direct frequency counter was implemented on a complex programmable logic device (CPLD), avoiding possible timing errors that a microcontroller could introduce. Measuring frequency directly by counting pulses is very simple and low cost, but it provides a fixed absolute resolution, meaning the precision depends on the frequency of the signal for a given measurement gate. The slower the signal is, the longer the measurement gate needs to be to achieve the same precision. For example, measuring for one second will allow one to see frequency differences no finer than 1 Hz, whereas measuring for 10 s allows one to see a frequency difference as fine as 0.1 Hz. This is because with a 0.1 Hz offset of a 1 Hz nominal signal, the system would only see an extra pulse every 10 s, and since this is a pulse counting system, the system needs at least a 10 s measurement in order to obtain such a fine resolution. Thus:
Δ f min = 1 T gate ,
where f min is the frequency resolution and T gate is the measurement gate. Therefore, if a one-second measurement gate were used to count a 1-MHz signal, a 1-ppm (seven-digit) precision would be obtained, whereas a one-second measurement gate of a 10-MHz signal would result in a 0.1-ppm (eight-digit) precision. As the frequency increases, so does the precision of the measurement. The same applies to the measurement gate, in that, as the measurement gate period is increased, so does the resolution of the measurement.
In order to accomplish direct frequency counting, two binary counters are used. One counter is used to count the 20-MHz oscillator signal, and the other is used as the gate trigger for the 1-pps signal. The first 1-pps pulse will start the 20-MHz counter. Each pulse thereafter will increment the 1-pps counter, and when it reaches a designated value, it stops the 20-MHz counter from incrementing so that the value can be read into a microcontroller. The counters are fully autonomous and always provide hardware-controlled start and stop triggers, thus avoiding any potential timing issues with a microcontroller.
While the size of the hardware was not of particular concern in our application, it should be noted that the board space required to implement the GPSDO is small (see Appendix B). However, we recognize that other potential applications may have size limitations. The four largest components are the oscillator, CPLD, microcontroller, and the DAC. While the CPLD and microcontroller are very small to begin with, they could potentially be combined into a single field-programmable gate array (FPGA). Furthermore, since the DAC does not need to change values quickly, it could be replaced with a heavily filtered pulse-width modulated (PWM) signal from the microcontroller (or possibly from an FPGA). If desired, the current design can be implemented on a two-layer board within one square inch (6.3 cm 2 ), with further size reductions realized by combining components (such as the microcontroller and CPLD combined into an FPGA) and more layers for the board.

2.3. Software

The software for the GPSDO’s microcontroller, an MSP430F2232, is relatively simple since all the counting happens in hardware, i.e., the CPLD. Because the hardware counting allows for a full second of dead time after a frequency has been counted, timing within the microcontroller is of little concern. The microcontroller performs the majority of its functions based on interrupts from the hardware, such as monitoring the 1-pps signal and waiting for a frequency count to finish.
The software operation of the GPSDO is broken up into three modes: sleeping, disciplining, and calibrating. Sleep mode simply disables the frequency counter, then puts the microcontroller in a low-power state. During normal operation, this mode is used between discipline cycles in order to conserve power. The GPSDO is in discipline mode when it is actively trying to count frequency and discipline the oscillator. If a 1-pps signal from the GPS receiver is not present, it will wait until the 1-pps signal is once again provided by the GPS receiver and then resynchronize the frequency counter. Finally, the calibration mode is used to calibrate the controller gain. This auto-calibration routine is run the first time the GPSDO is turned on and may be used at any time in the future. During normal operation, this mode will likely be run every time the geoPebble system is redeployed.

2.4. Oscillator Control

Because the 1-pps counter counts for a designated amount of time, one can calculate the expected number of 20-MHz counts, i.e.,
N expected = 2 16 mod ( T gate · f osc ) ,
where f osc is the frequency of the oscillator. Once the 20-MHz counter value is read in, it can be compared to the expected value, and an error count is created to adjust the DAC that controls the oscillator. This closed-loop negative feedback can be implemented very simply with a proportional controller (cf. [19]). Due to the extended period of time it takes to make a single frequency measurement, anywhere from a few seconds to several minutes depending on the required resolution, and because the duty cycle of the GPS power needs to be as low as possible, the proportional gain of the controller can be calibrated to accurately steer the oscillator to the desired frequency in a single adjustment. If only a single sample will be used for making the adjustment, no integrators or differentiators need be applied. The technique of using a single sample can be susceptible to harmonic oscillations; however, in this application, the oscillator will not have changed by any meaningful amount in the time it takes to perform several measurements. This is because the oscillator is not expected to experience any rapid temperature changes or mechanical shock or vibration (the primary causes of short-term oscillator drift) since the geoPebble will be sitting in the snow during operation. Because of this and the need to discipline as quickly as possible, no more than one measurement is necessary, provided that the controller’s proportional gain is accurate. For applications in which rapid temperature changes or mechanical shock or vibration are expected, a control algorithm employing integrators and/or differentiators (i.e., a full PID controller [19]) can be applied.
In order to ensure an accurate proportional gain for control, a calibration routine can be run that reads the frequency while the DAC is set to a low value and again while the DAC is set to a high value. This will provide a two-point linear trend, i.e., the line describing the DAC-value-to-frequency relationship (DAC–frequency transfer function), the slope of which is proportional to the gain of interest. This slope is related to the controller gain by the error-count-to-frequency relationship, which is controlled by the length of the measurement gate. For example, if the measurement gate is 10 s, one would expect 20 × 10 7 counts on a perfect 20-MHz oscillator. This means that, for every extra count, the oscillator is 0.1 Hz (the inverse of the measurement gate) faster than nominal. This provides an error–frequency transfer function. The transfer function needed for the controller’s proportional gain is the error–DAC function, which can be found by combining the two previous transfer functions. Since this calibration routine only requires two frequency measurements, it can be run every time the geoPebble is turned on to ensure the controller’s proportional gain is always extremely accurate even after aging or other effects on the oscillator evidence themselves.
The accuracy of the controller’s proportional gain is of critical importance. If the gain is too low, it will take several discipline cycles to reach the correct oscillator value. If the gain is too high, overshoot and ringing may occur in the control loop, and stability also becomes a concern. Although testing has confirmed it requires a high gain to become unstable, it is easy for the gain to be far enough off that it takes two or three discipline cycles to achieve the desired oscillator frequency.

3. GPSDO Validation

3.1. Control Linearity

The control-loop linearity was tested by collecting 256 evenly spaced data points. The DAC was set to one of these points, then the resulting frequency was measured using the on-board frequency counter. The data are shown in Figure 2, which examines the nonlinearities in the control loop. A linear fit (justified in the paragraph below) of the overall DAC–frequency relationship was taken using a least-squares method. The error was then plotted by taking the difference between the linear fit and the actual data.
The nonlinearities present in these data are predominantly a combination of the DAC nonlinearity and the TCVCXO’s voltage-control nonlinearity. Before examining the linear fit error any further, however, one must understand the expected range of operation of the DAC. The specific TCVCXO chosen, TCD3002-20.M manufactured by Pletronics, Inc., has a rated accuracy of ± 0.5 ppm from the factory and has a maximum of ±3.4 ppm after the first 15 years. Summing these together yields ± 3.9 ppm, which means a maximum possible deviation from 20 MHz of ±78 Hz for any given oscillator. The slope of the full-range linear fit of the device under test is 10.1513 mHz per DAC value. A ±78-Hz deviation equates to ±7684 DAC counts. The specifications of the oscillator are taken with the control voltage at 1.50 V, and since the DAC reference is 3.00 V, a DAC value of 32,768 is the center point. This means that the expected range of operation is between 25,084 and 40,452 DAC counts. Figure 2 shows the linear fit error for this limited range, for which the error falls within ±0.5 Hz, which meets our requirement. The full-range least-squares fit results in a gain of 2.9851, whereas the limited-range least-squares fit results in a gain of 2.9413.
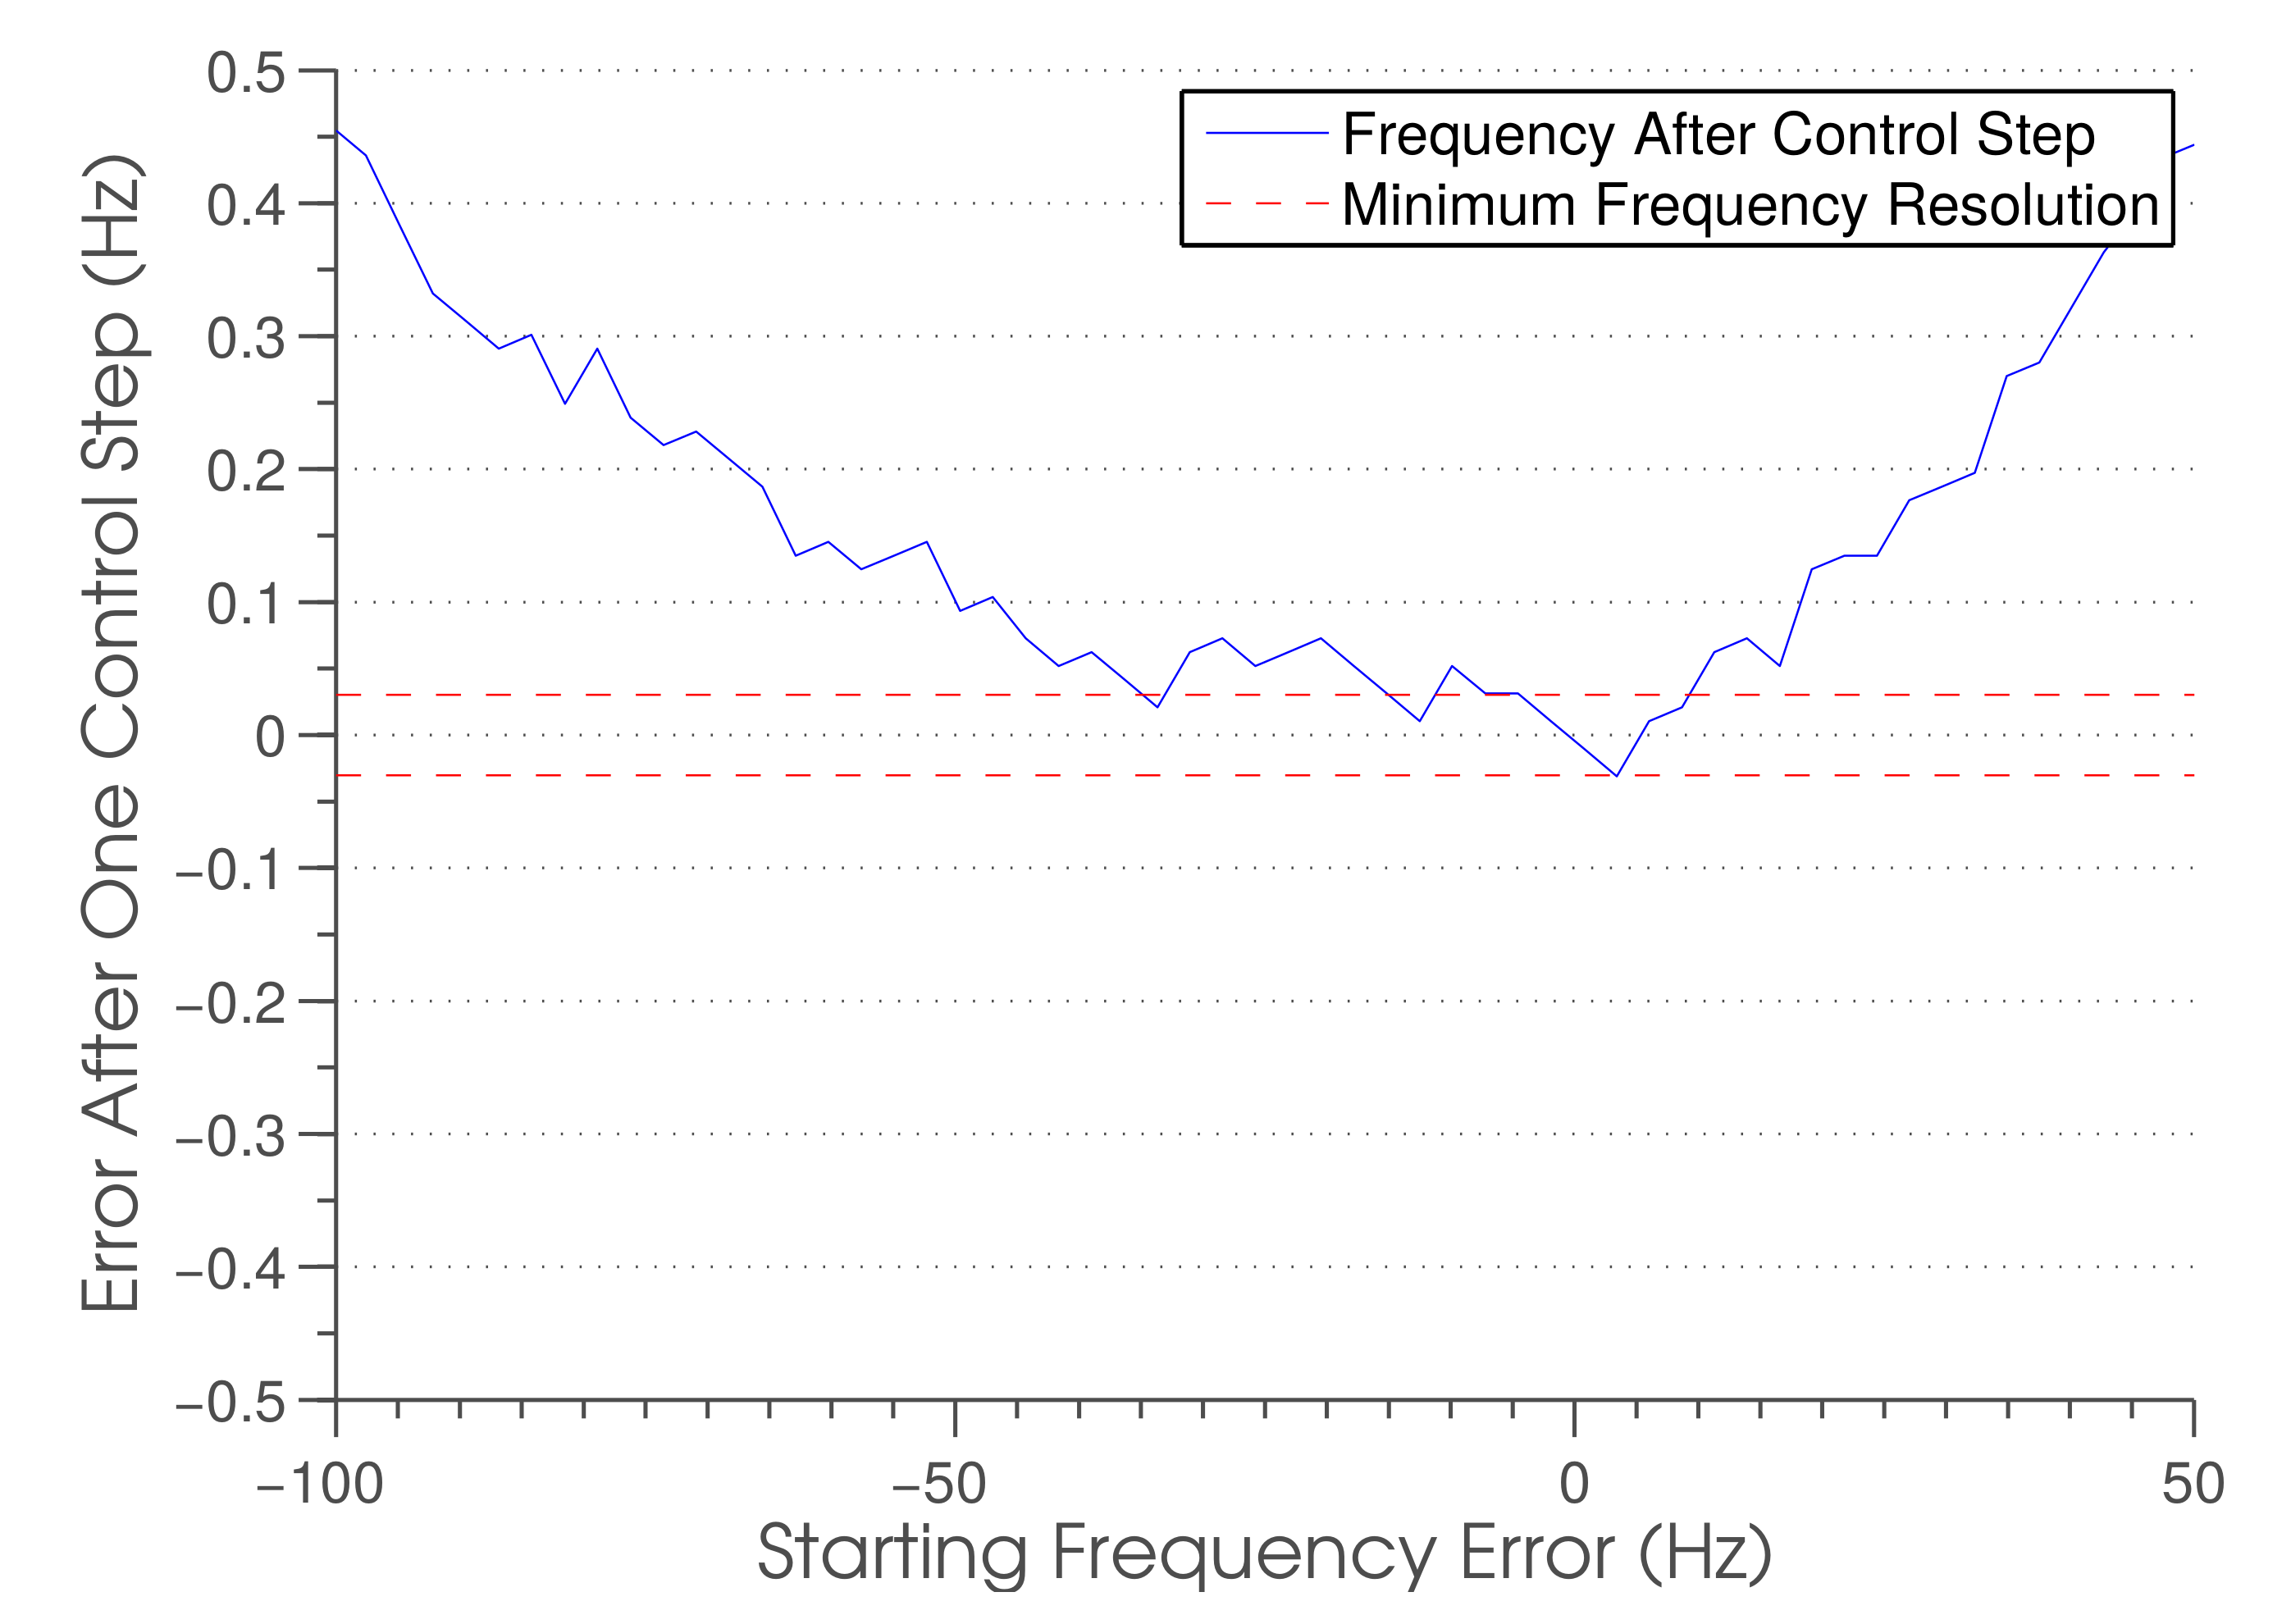
In order to characterize the control errors, the proportional controller with the gain as found above was applied to the test data. The tested DAC value and resulting frequency error were used to calculate a new DAC value using a two-point calibrated gain (2.9238, calibrated with DAC values of 32,639 ± 5140). The new DAC value was then converted to an estimated frequency error using the limited-range least-squares gain calculated earlier. Figure 3 displays the resulting frequency error based on an initial frequency error after a single control step. This calculation was performed within the expected range of oscillator frequency error. The highest calculated error is approximately 0.9 Hz after a single control step. From the graph, it is easy to see that a second control step will easily put the oscillator within one error-count resolution. Thus, the oscillator will reach the desired accuracy within only two control steps. The rated range across temperature of the oscillator is 0.28 ppm across the full temperature range, which equates to a maximum frequency deviation of 5.6 Hz. Since the temperature fluctuation in the geoPebble system from one discipline cycle to another is expected to be very small, the frequency deviation due to temperature is expected to be much smaller than 5.6 Hz. The controller can put the oscillator within the desired range with a starting frequency deviation of approximately ±5 Hz, so during normal operation, it is expected to always reach the desired frequency in a single control step.

3.2. Continuous Operation

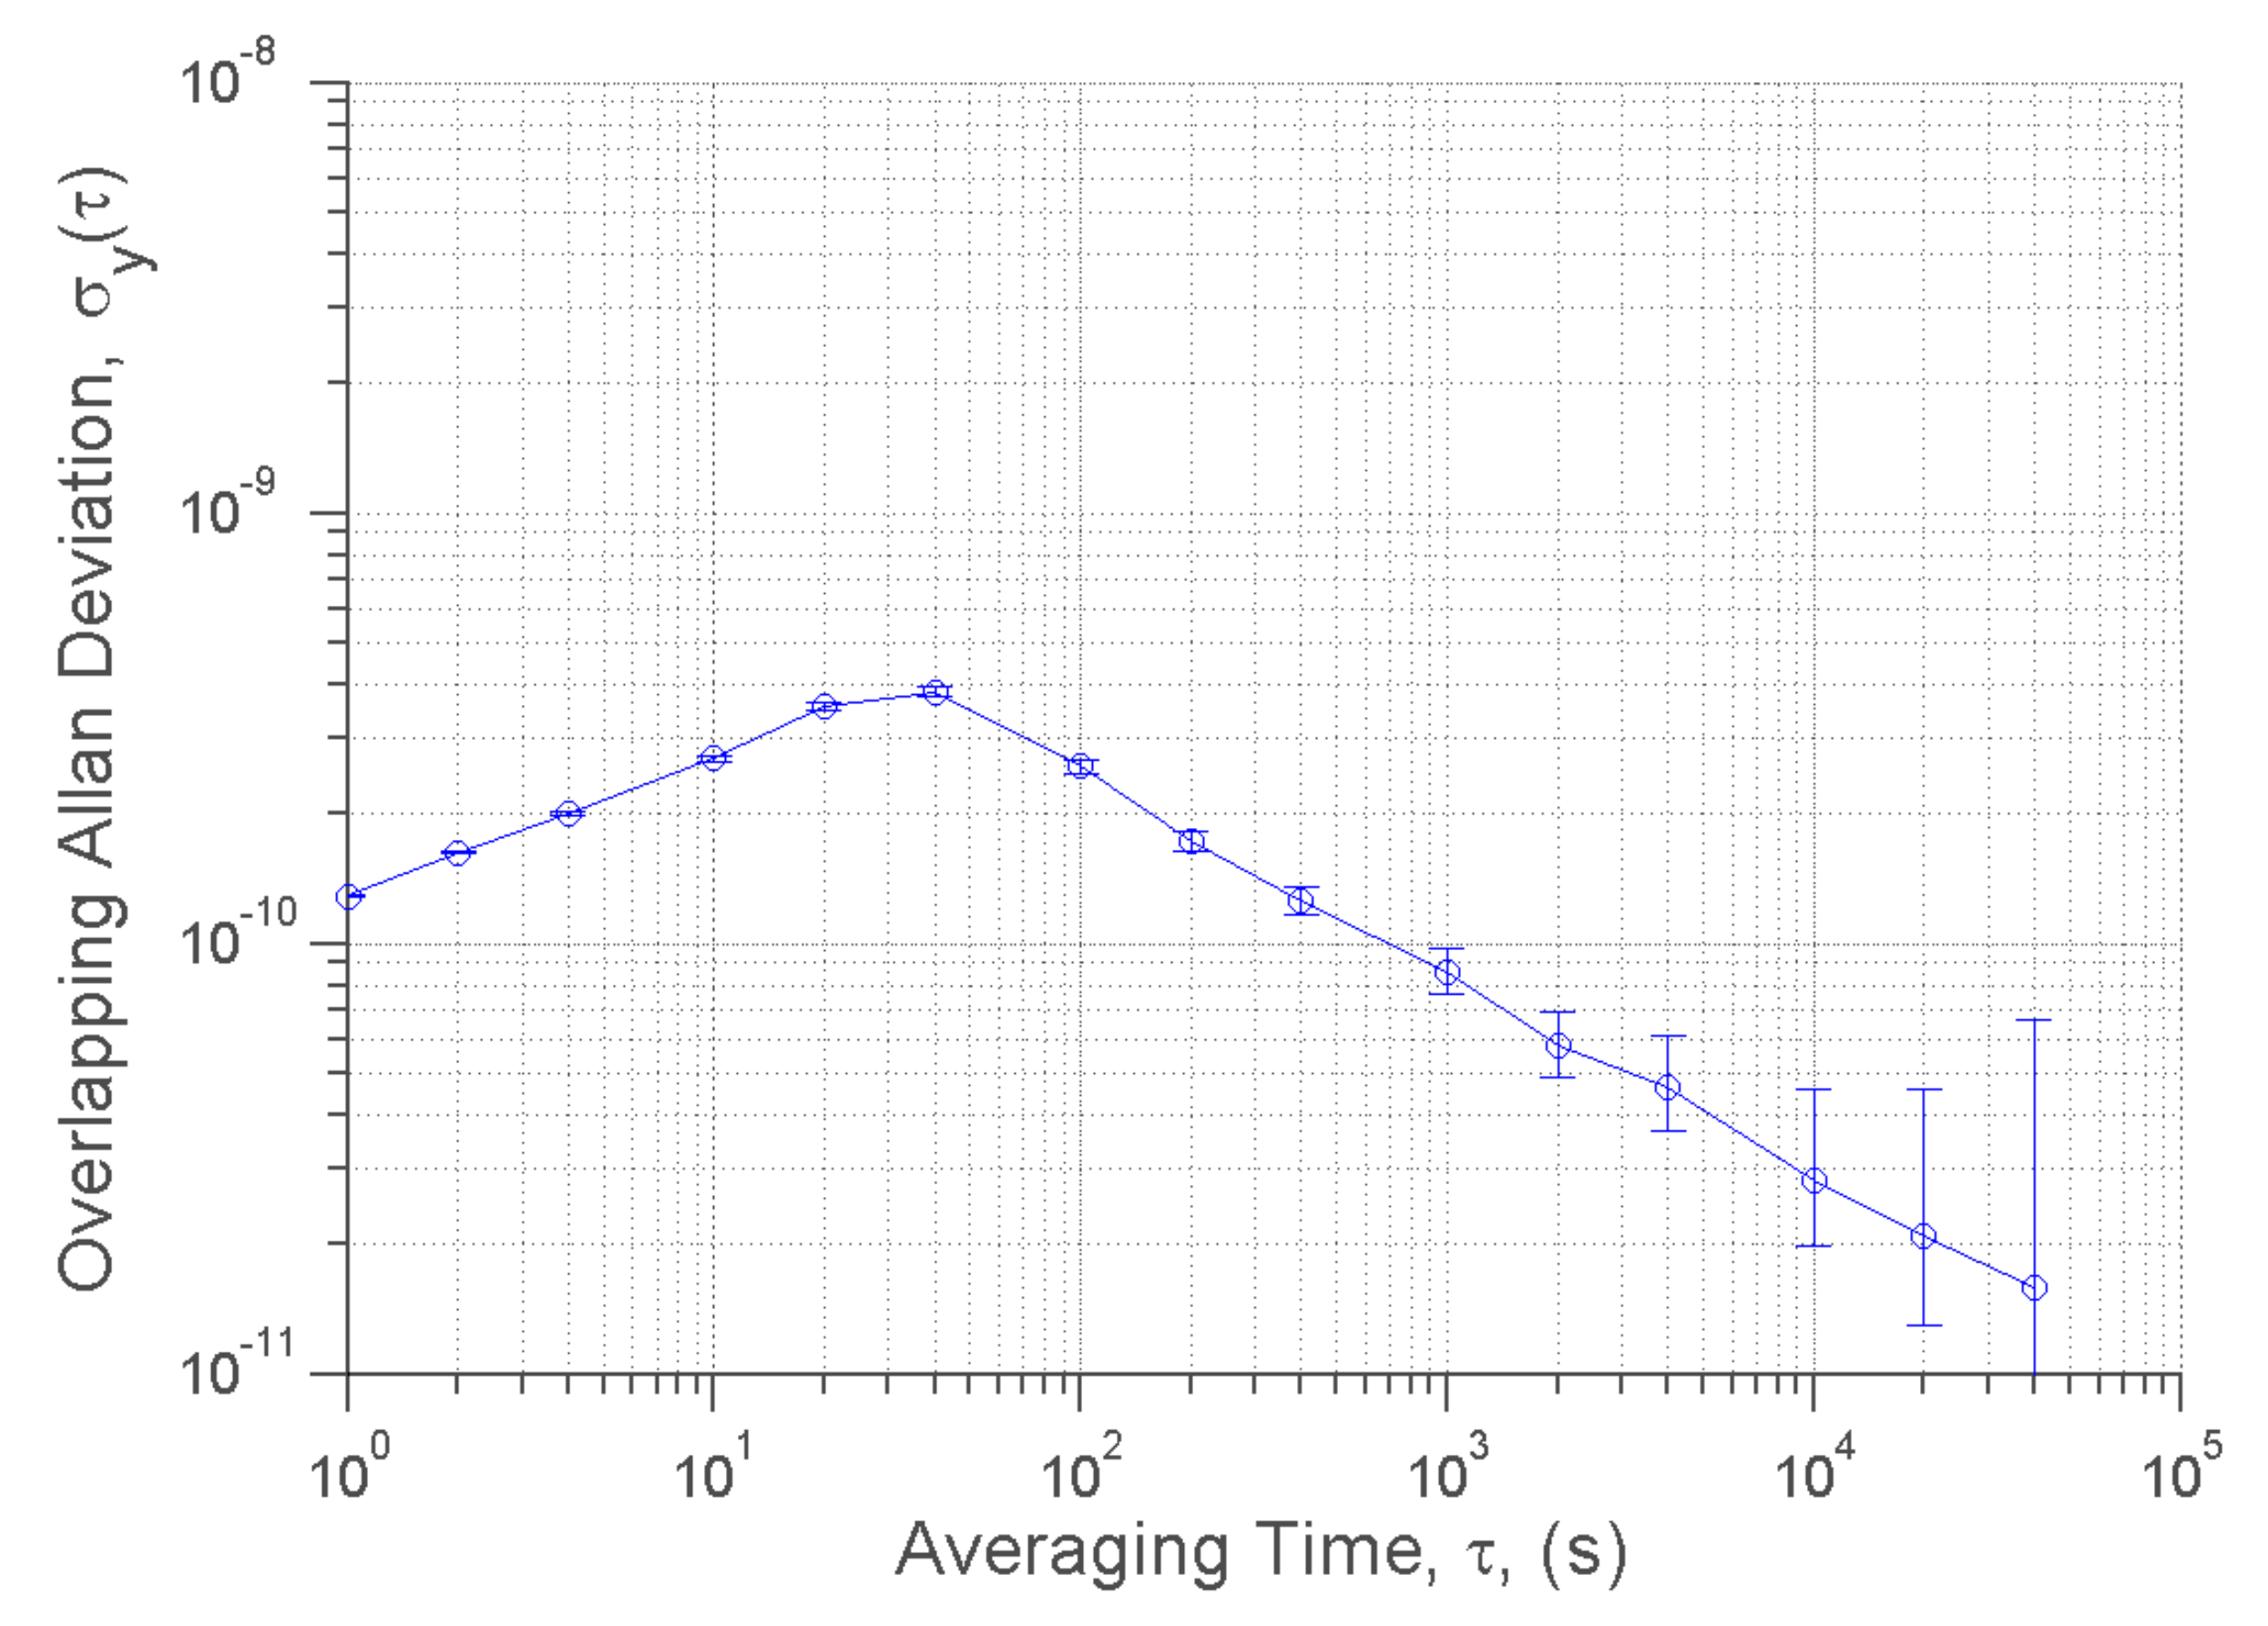
Figure 4 shows the overlapping Allan deviation of the 20-MHz GPSDO running closed-loop continuously for 54 h. (The term “overlapping” indicates that a moving sample is employed. Appendix C provides more background information on clock characterization used in determining the accuracy of the implemented GPSDO. See also [20] for a complete handbook on frequency stability analysis.) Random walk frequency modulation (RWFM) is seen up to the control period of 34 s. This type of noise is fully expected due to the nature of the control algorithm; every 34 s, the frequency changes rapidly to correct for any frequency drift. As a Fourier series would suggest [20], this sudden change creates a summation of higher order frequencies to create this shift, causing the RWFM to appear across the lower time averages. In the control period, flicker-noise frequency modulation (FFM) is seen, again as expected due to the frequency corrections. Beyond the control period, white-noise frequency modulation (WFM) is seen, indicating the increasing long-term accuracy of the GPSDO as it inherits the GPS’s accuracy. All of these properties are expected of the GPSDO and indicate proper operation. Since the overlapping Allan deviation represents a type of standard deviation, the three-sigma confidence (99.7%) of the frequency accuracy in the region of worst stability is 1.15 ppb. This result aligns fairly well with the measurement resolution of 1.52 ppb.
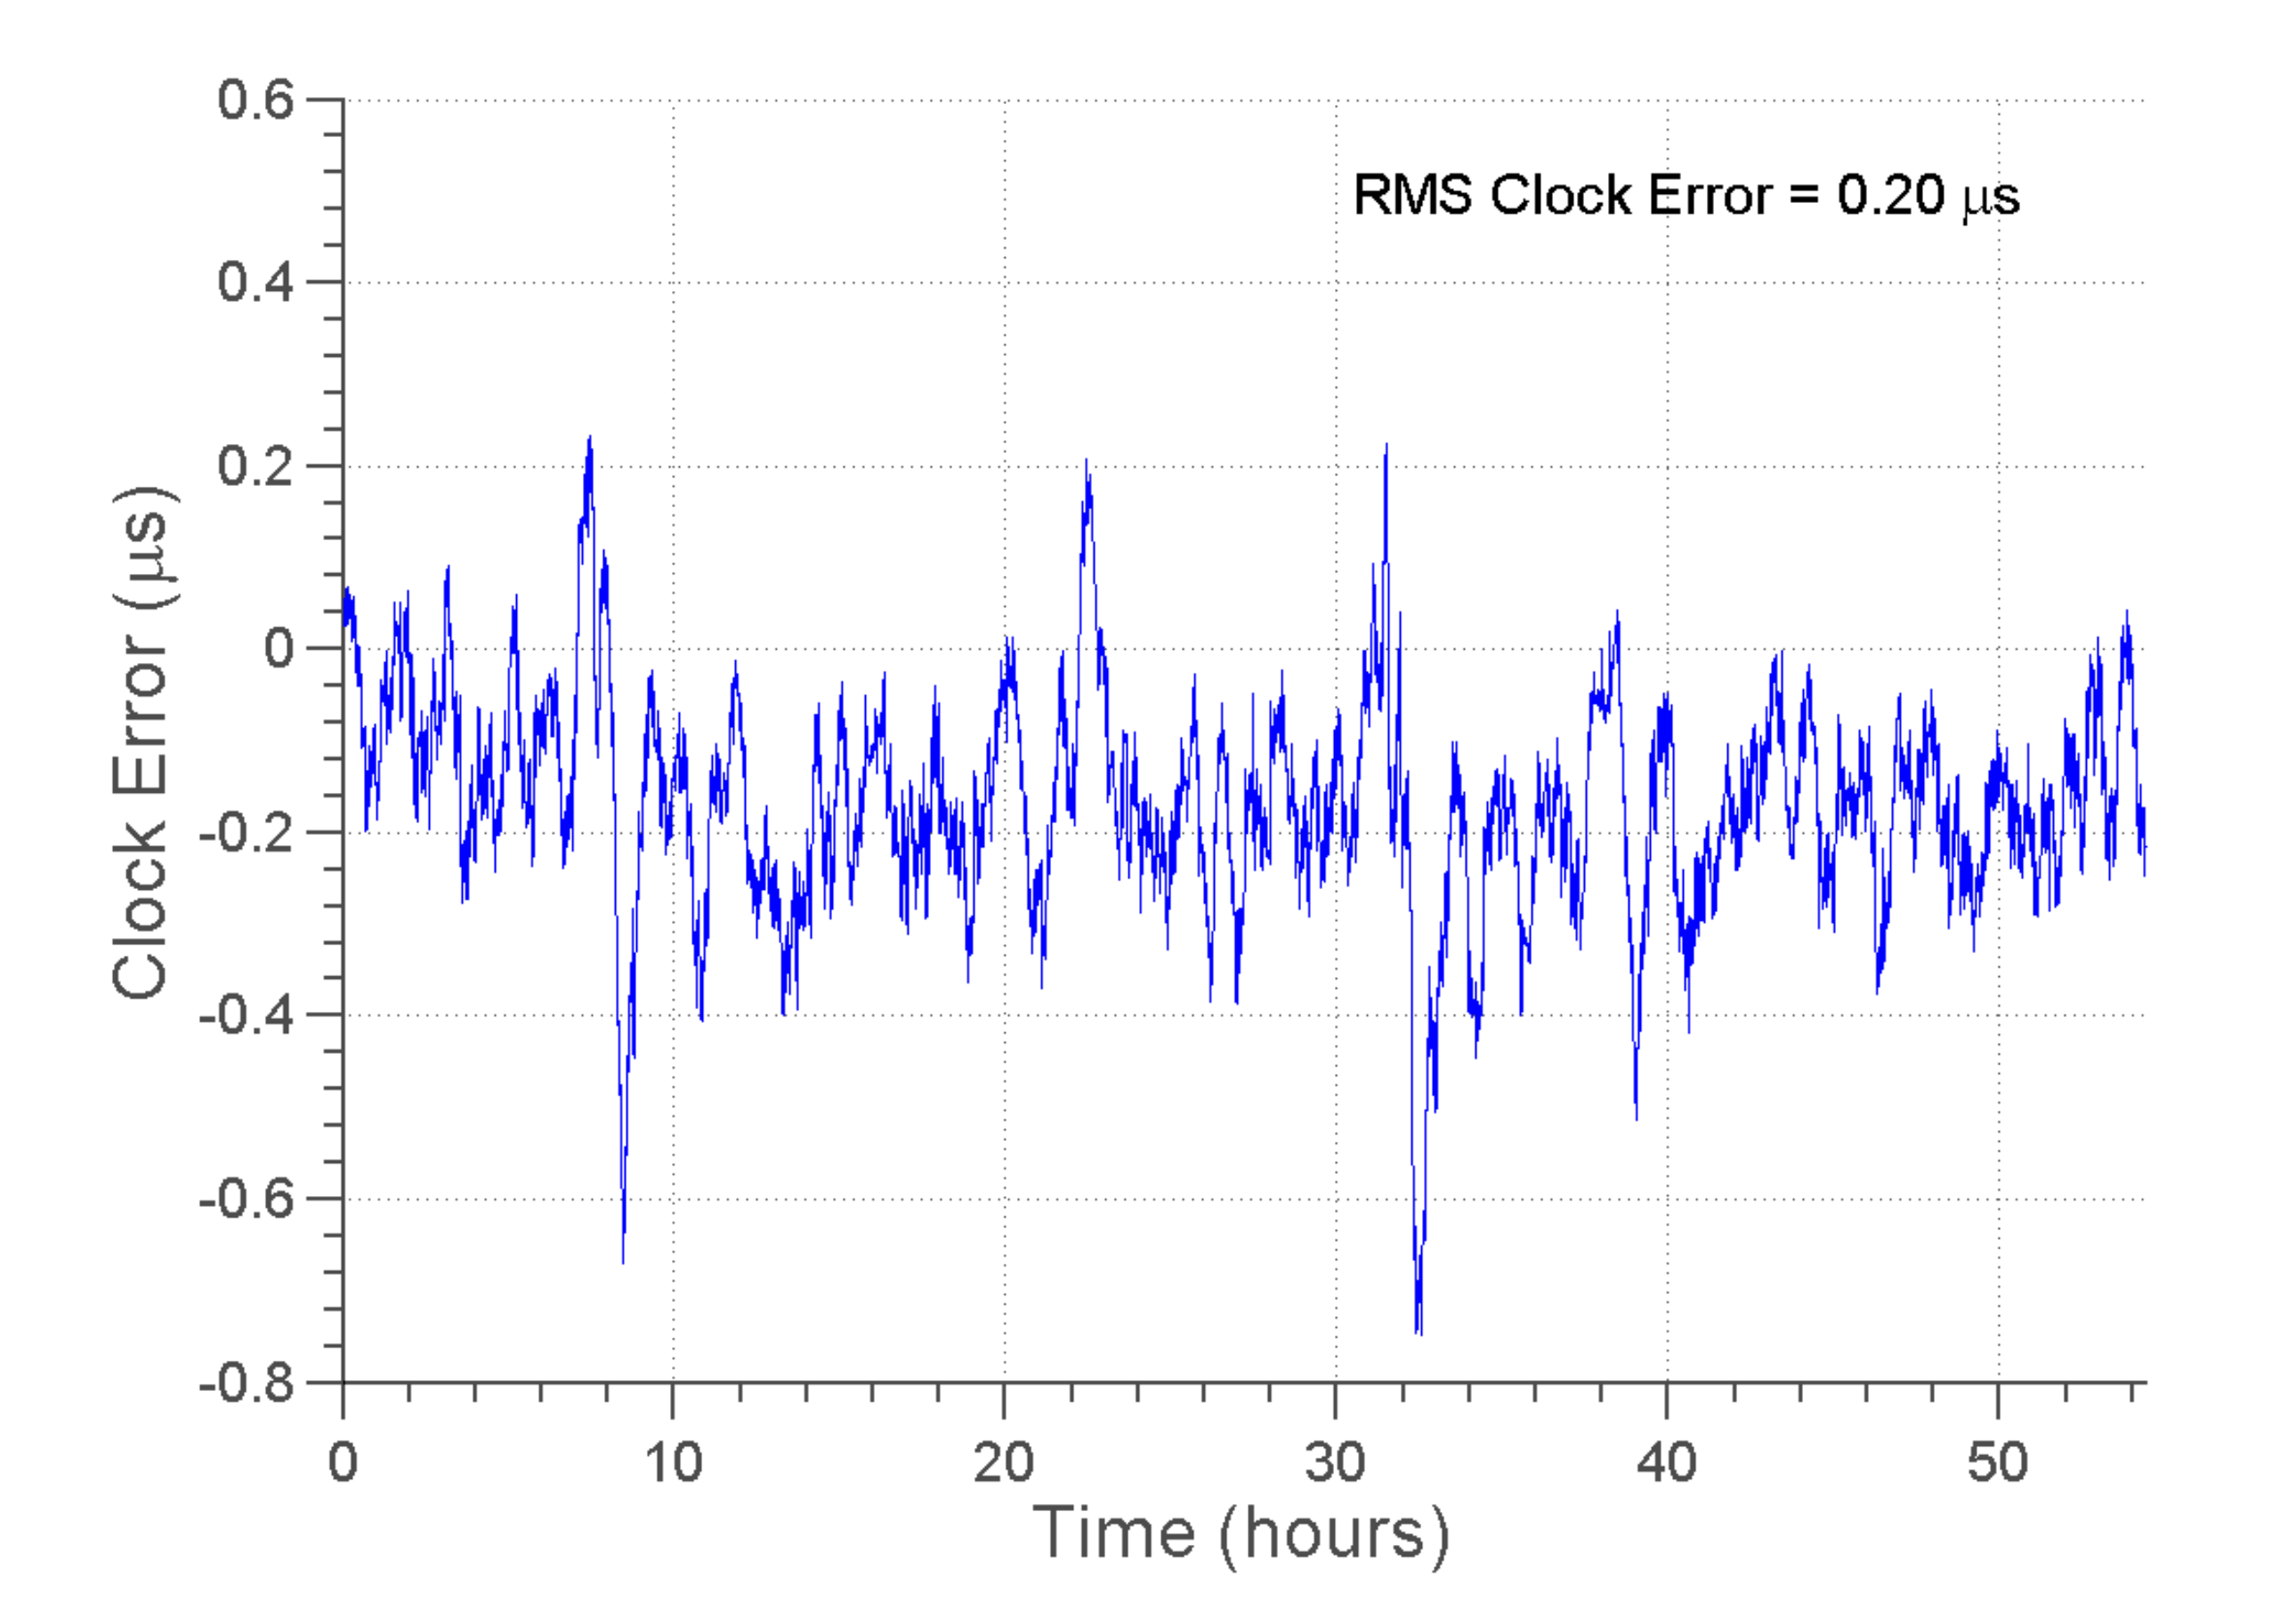
Using the same data, Figure 5 displays the time drift within an 1800-s window; that is to say, the error in the clock’s time from 1800 s prior to the current time. The rms time error is calculated to be 204 ns, whereas the specifications require the rms time error to remain within 1000 ns in this mode. This result exceeds the specification by nearly five fold.

3.3. Duty-Cycled Operation

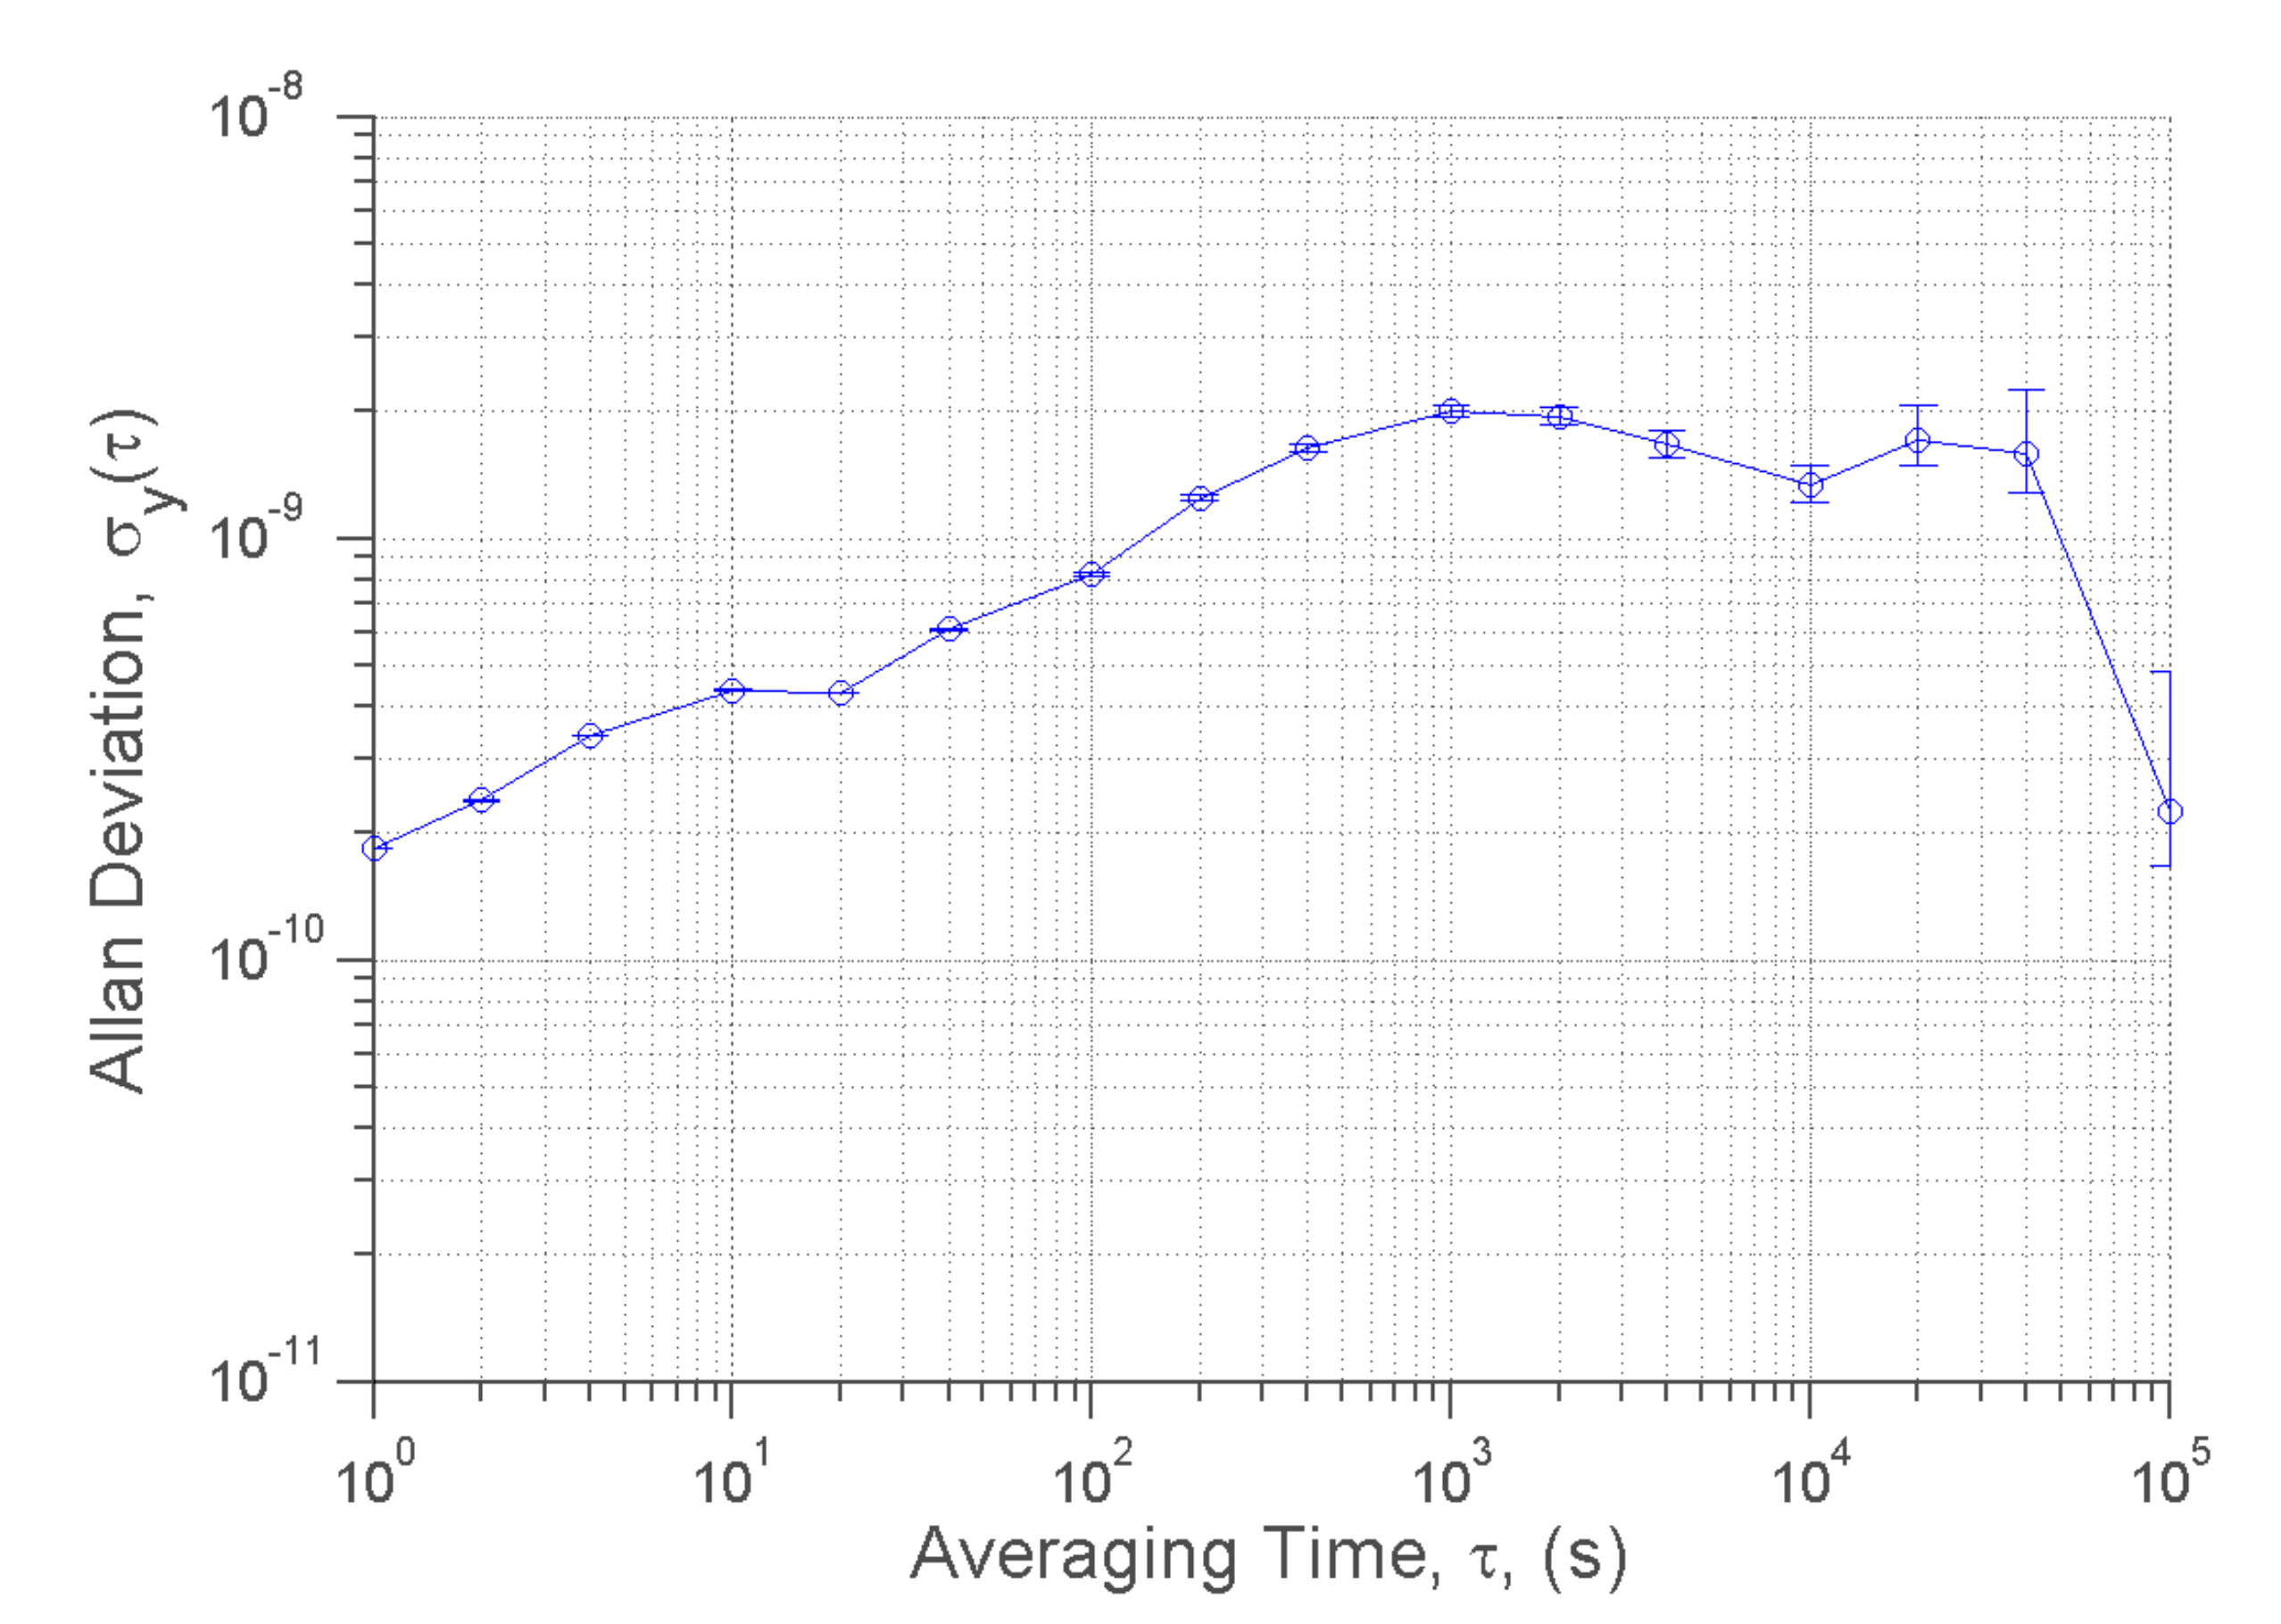
Figure 6 shows the overlapping Allan deviation of the 20-MHz GPSDO running for 45 h, disciplining once about every half hour. The analysis indicates RWFM up towards the discipline period of 1837 s, for the same reasons as before while disciplining continuously.
Following the RWFM noise, FFM is seen around the discipline-period time averages. This is expected due to the random noise and drift of the oscillator, which necessitates frequency corrections in both directions to keep the oscillator at its nominal frequency of 20 MHz. Beyond this, WFM is observed, followed by a shift towards RWFM again. Ideally, WFM would be expected beyond the discipline period, as seen in Figure 4. The increase in noise is most likely from two sources. The first is the error in the analysis due to the limited amount of time the data were collected. As higher averaging times approach the length of time the oscillator was measured, error increases significantly due to the limited number of data points available. The second source is likely environmental effects since the GPSDO is measured while sitting on a laboratory bench in ambient air. This results in semi-daily temperature swings due to the HVAC system of the laboratory, resulting in increased frequency drift during these temperature swings.
While the temperature effects of the laboratory were not expected to cause much fluctuation in the data, the results clearly demonstrate a properly functioning and accurate GPSDO. The three-sigma confidence of the frequency accuracy in the region of worst stability is 1.53 ppb, aligning very well with the measurement resolution of 1.52 ppb.
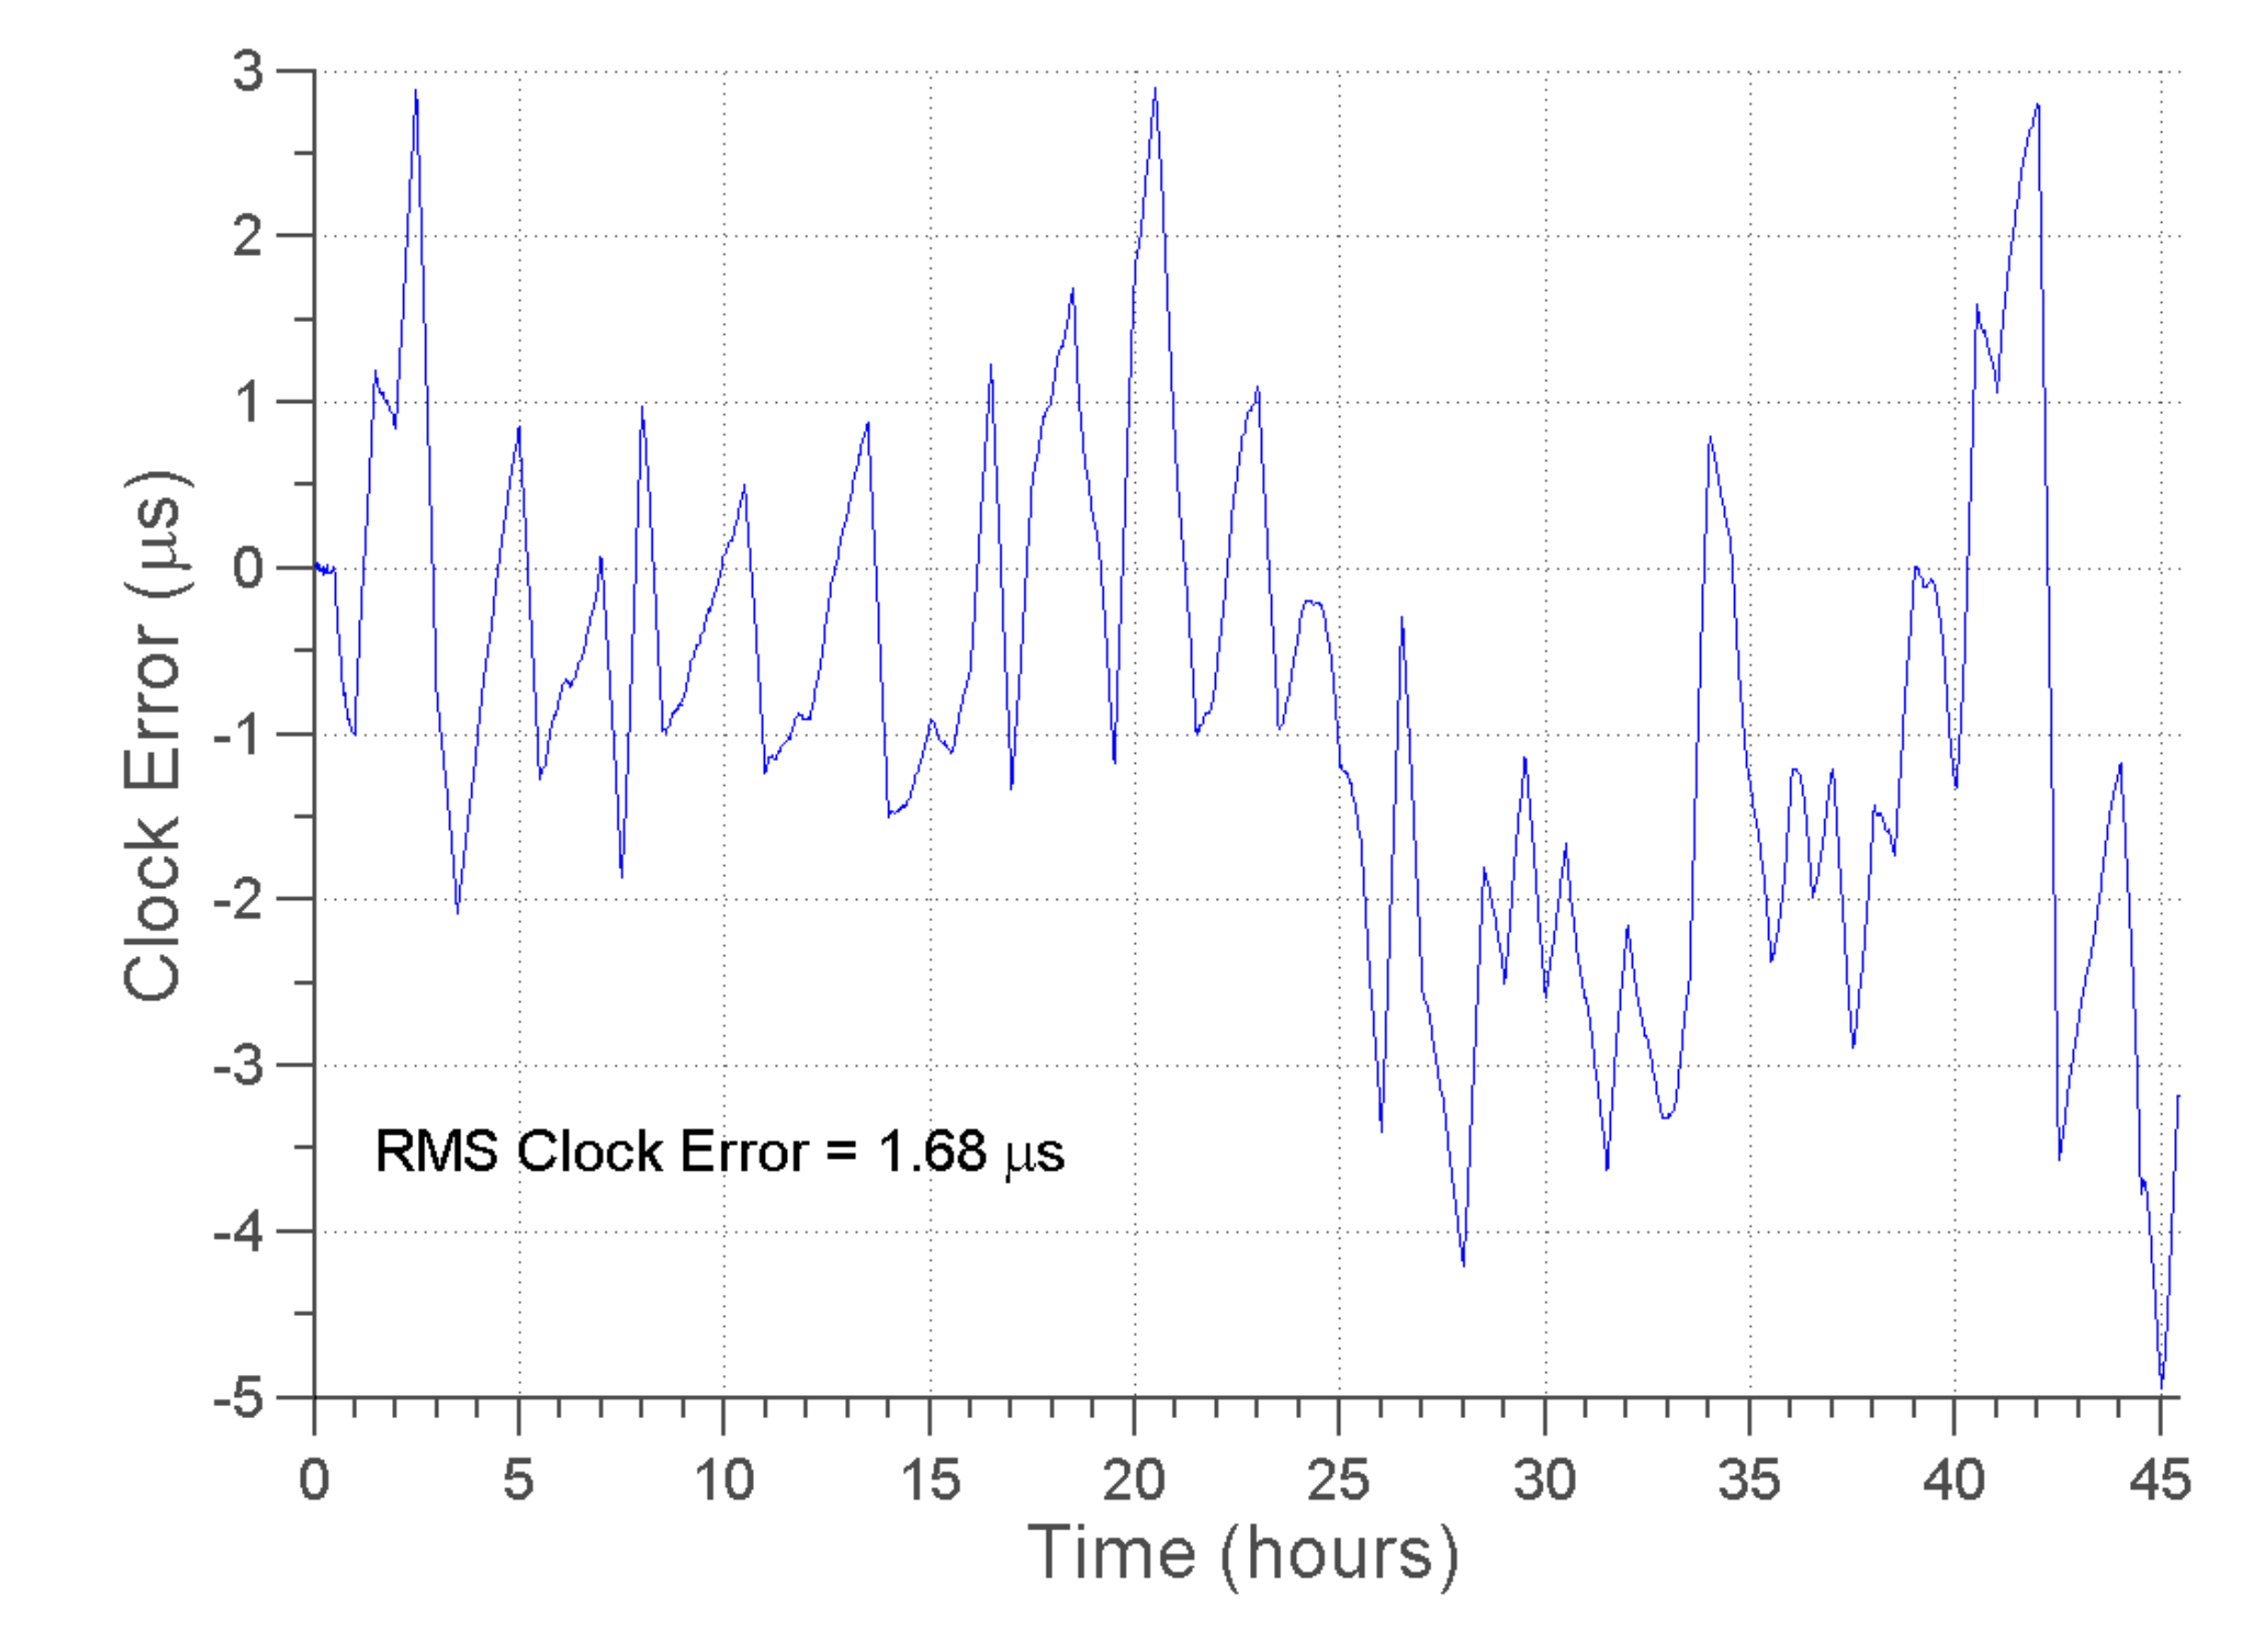
Using the same data, Figure 7 displays the time drift within an 1800-s window. The rms time error was calculated to be 1.68 μ s , whereas the specifications require that the rms time error of the GPSDO remains within 10 μ s in this mode of operation. Similar to before, this exceeded the specification by more than five fold, while keeping the absolute worst-case time error within the rms specification as well.

3.4. Oscillator Temperature Stability

A large consideration in the choice of oscillator for the GPSDO is its temperature characteristics. Since the geoPebble system will be deployed outdoors in the Antarctic summer, temperature swings from 20 °C to as high as + 10 °C are expected. The oscillator under test was initially calibrated to 20 MHz, then left running open-loop. While running open-loop, the oscillator was subjected to a temperature swing of about 40 to + 50 °C. Figure 8 displays the results of this temperature swing. The results show a rough linear trend of decreasing frequency as temperature increases, with the total frequency deviation being approximately 5 Hz. If only the expected range of 20 to + 10 °C is considered, the total frequency deviation is approximately 2.5 Hz.
In order to better understand the temperature effects, it is critical that a maximum expected temperature swing be defined. Surface temperature data from Antarctica indicate that the worst temperature deviation in a half-hour window is about ±1.4 °C, whereas the vast majority are within ±1.0 °C and a large majority within ±0.5 °C. A separate analysis also showed that the maximum temperature shift within one minute is less than 0.07 °C. Since this change in temperature is extremely small, the GPSDO operating in a continuously disciplining mode is not analyzed, as temperature is expected to have little to no effect.

Environmental Test

Ultimately, the GPSDO must operate in a very cold environment with fluctuating temperatures. The GPSDO was tested in a temperature-controlled chamber (TestEquity Model 1007C) programmed to mimic the actual surface temperatures in Antarctica. Figure 9 presents the Allan deviation of the 160 h of data taken from the GPSDO disciplining once every half-hour. The results are similar to those when the GPSDO was operating in the ambient lab environment (compare Figure 6); however, during this test, the stability degraded. The stability at low averaging times decreased by nearly three fold, most likely from small and rapid temperature fluctuations in the temperature chamber, but still remaining well within acceptable limits. RWFM noise dominated up to the duty-cycle period, just as before. Similar to before, the oscillator increased in stability after the duty-cycle period, then decreased in stability once more around 12-h time averages, before finally drastically increasing in stability at time averages over a day long. The similarity in noise profiles of these data leads to a strong confidence in the semi-daily temperature fluctuations resulting in decreased oscillator stability in the previous test.
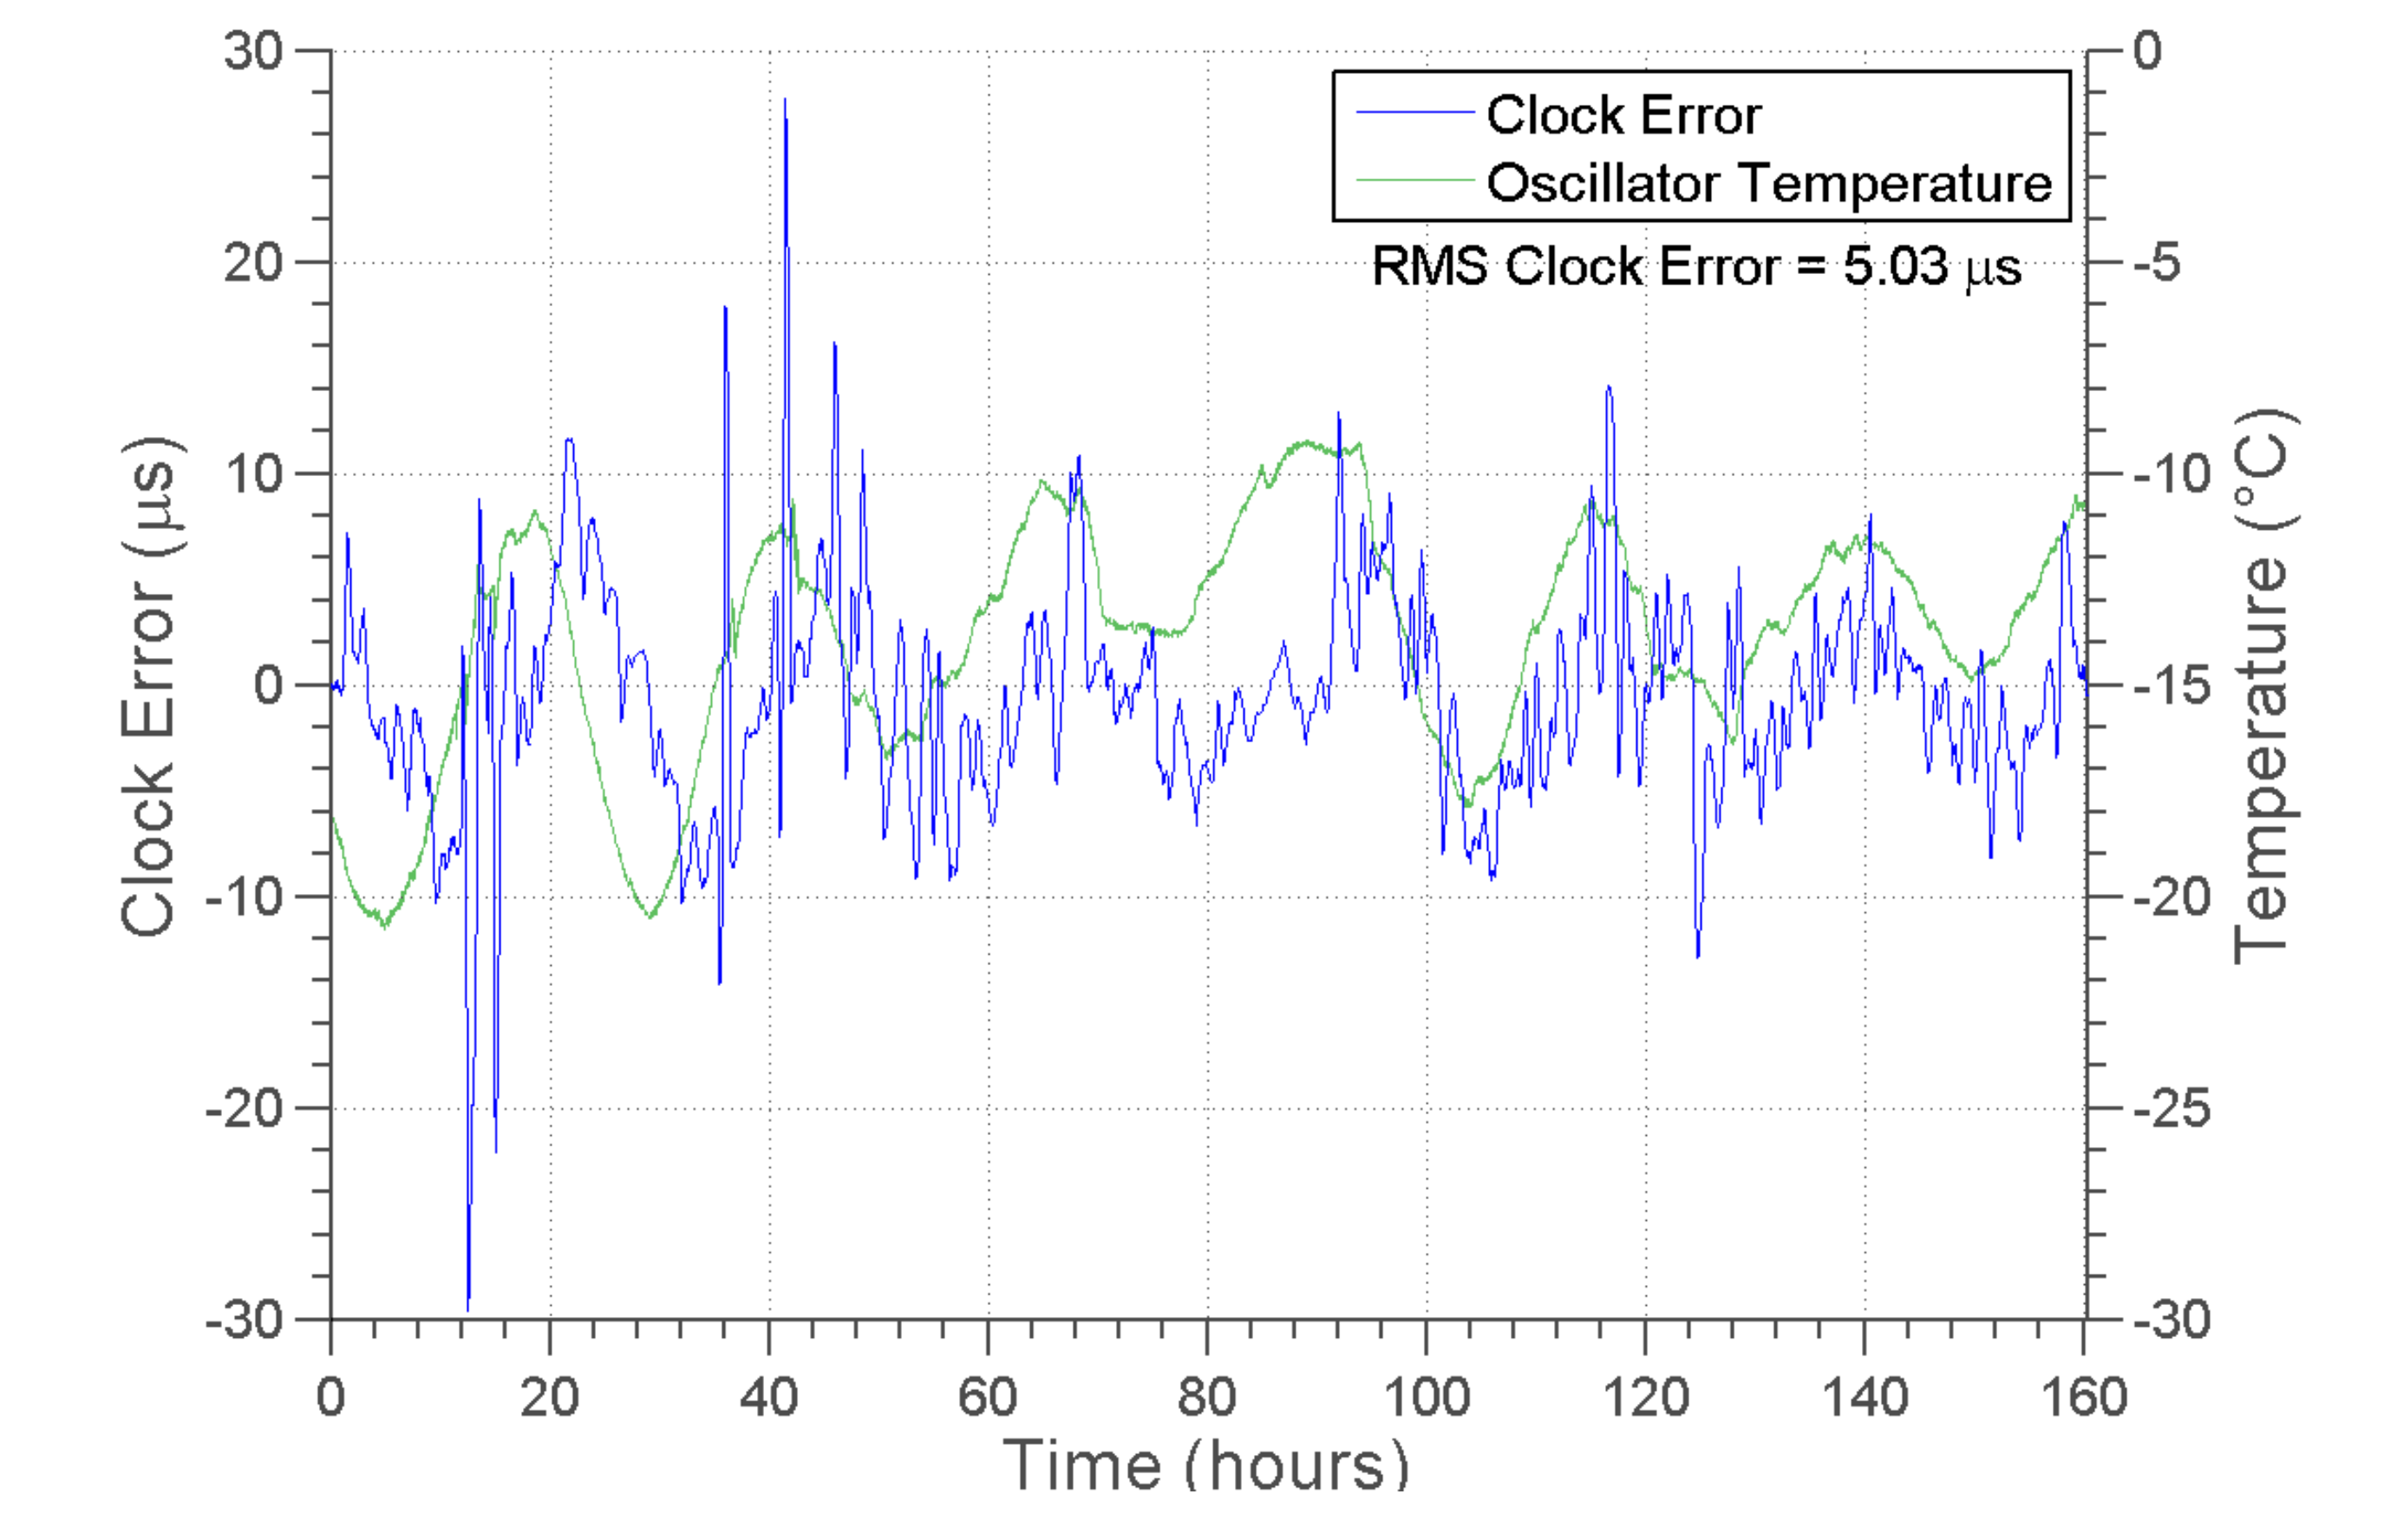
Overall, while the stability of the oscillator in the cold decreased, it still performed very well. In the worst-case stability region, the oscillator achieved an accuracy of 5.98 ppb with three-sigma confidence. Although this is nearly four times less accurate than the resolution of the frequency counter, it was expected due to the more-rapidly-fluctuating temperatures between discipline cycles.
Figure 10 presents the principal analysis of the data: the rms clock error. While in this test there were several instances where the clock error was larger than ±10 μ s , the rms time-error was calculated to be 5.03 μ s , a near two-fold increase in accuracy beyond the 10 μ s rms requirement. Furthermore, 95.8% of the data set falls within a ±10- μ s clock-error, demonstrating robust operation and consistently low error.

4. Conclusions

The GPSDO design presented herein meets the strict power and timing requirements for the geoPebble system. The GPDSO design could find use in other distributed networked sensor systems that are power constrained and/or require low cost implementations. Data were collected in order to verify the performance characteristics of the implemented circuit, and it has been demonstrated that the GPSDO exceeds the requirements. The power requirement dictated that the GPSDO shall draw no more than 100-mW average power, and the implemented design consumes less than 45-mW average power during normal operation. The timing requirements of a 1- μ s-rms time error during continuous operation and a 10- μ s-rms time error during duty-cycled operation were exceeded, with the implemented design achieving a 204-ns-rms time-error during continuous operation and a 5.03- μ s-rms time-error during duty-cycled operation.

Author Contributions

Conceptualization, T.J.B. and S.G.B.; firmware, T.J.B.; validation, T.J.B.; resources, S.G.B.; data curation, T.J.B.; writing—original draft preparation, T.J.B.; writing—review and editing, S.G.B.; visualization, T.J.B.; supervision, S.G.B.; project administration, S.G.B.; funding acquisition, S.G.B. All authors read and agreed to the published version of the manuscript.

Funding

This work was supported by the National Science Foundation (Grant Number ANT-1039982).

Data Availability Statement

The data presented in this study are available on request from the corresponding author.

Acknowledgments

The authors wish to thank the entire geoPebble team for their efforts to realize this system.

Conflicts of Interest

The authors declare no conflict of interest.

Abbreviations

The following abbreviations are used in this manuscript:
AVARAllan variance
CPLDcomplex programmable logic device
DACdigital-to-analog converter
FMfrequency modulation
FFMflicker-noise frequency modulation
FPGAfield-programmable gate array
GPSGlobal Positioning System
GSPDOGPS-disciplined oscillator
MAVARmodified Allan variance
PMphase modulation
ppbparts per billion
ppmparts per million
ppspulse per second
pptparts per trillion
PWMpulse-width modulated
RFWMrandom walk frequency modulation
rmsroot mean square
TCVCXOtemperature-compensated voltage-controlled crystal oscillator
TCXOtemperature-compensated crystal oscillator

Appendix A. geoPebble System

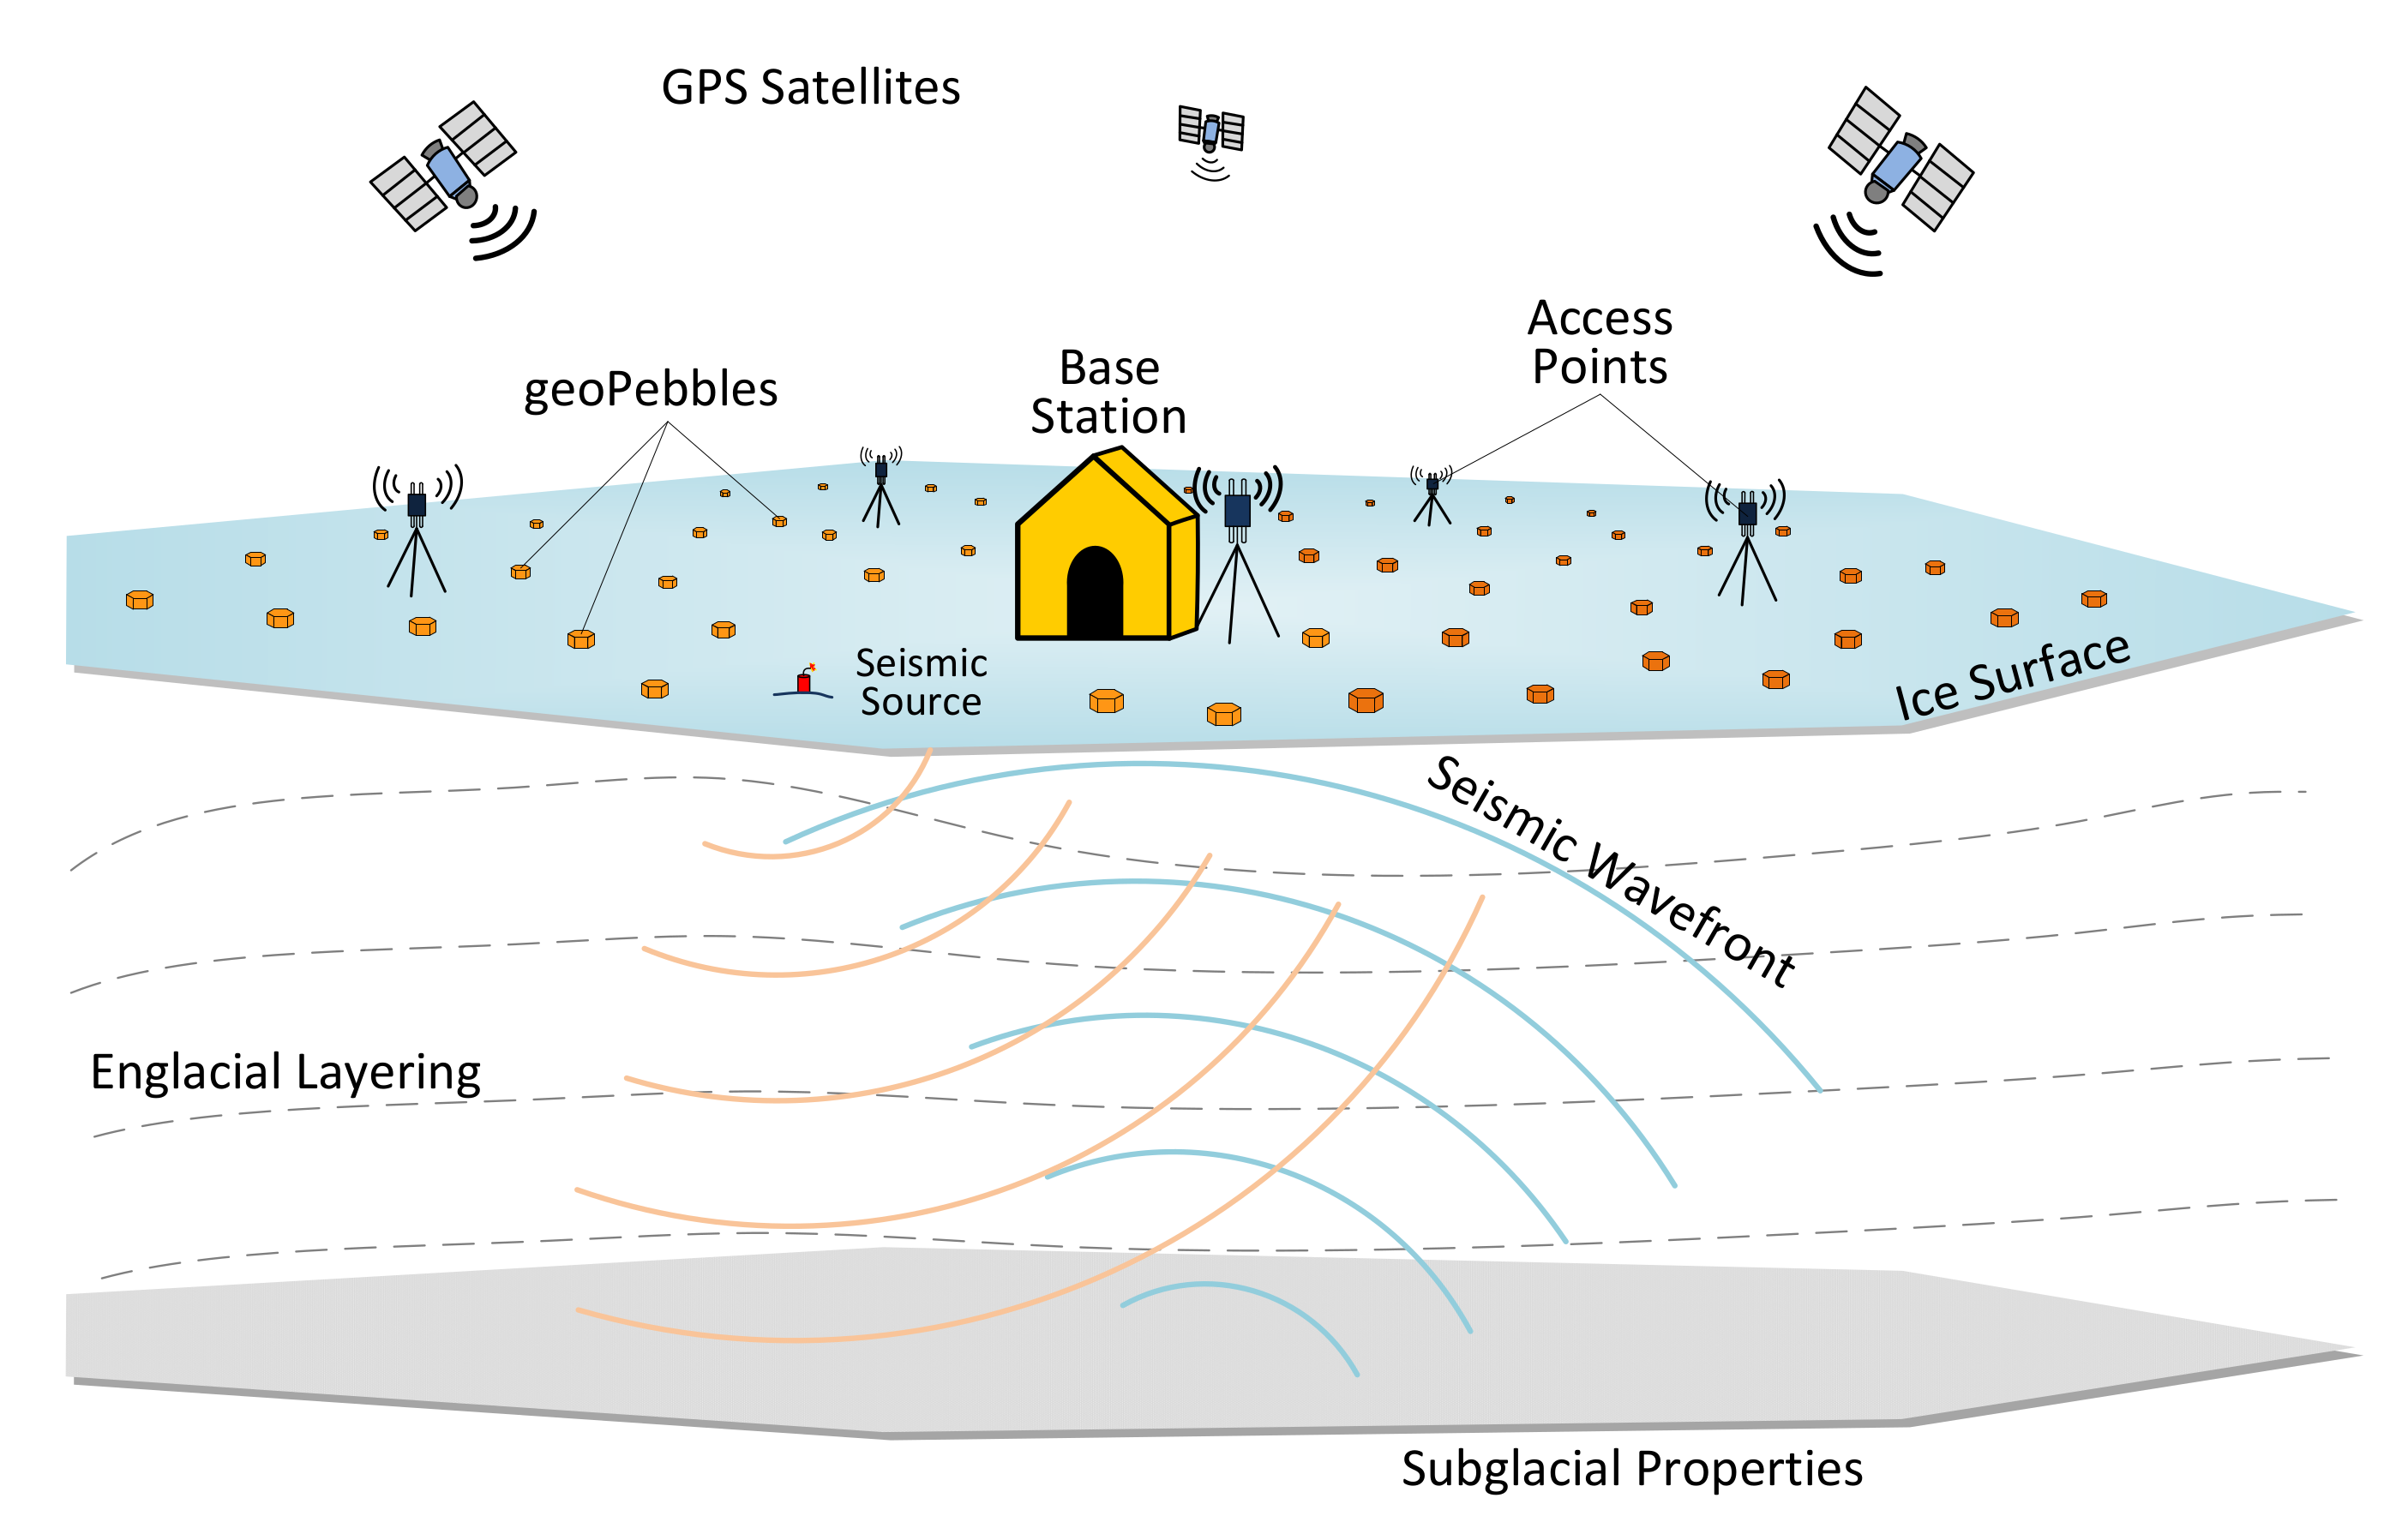
The goal of the geoPebble system is to enable wireless measurements of seismic reflectometry that can be used to determine ice sheet morphology. Figure A1 demonstrates how the geoPebble system is configured. The wireless sensor nodes are distributed in a large random array, relaying data wirelessly back to a base station. A small explosive is detonated to create a seismic source, which then travels through the ice sheet and bounces off the bedrock. The geoPebble nodes then measure the resulting reflected pressure wave, creating a three-dimensional mapping of the ice sheet. This allows for many important subglacial properties to be determined, which is highly useful in climate research.
Figure A1. A conceptual overview of how the geoPebble system functions.
Electronics 10 00716 g0a1

Appendix A.1. Requirement for Accurate Timing
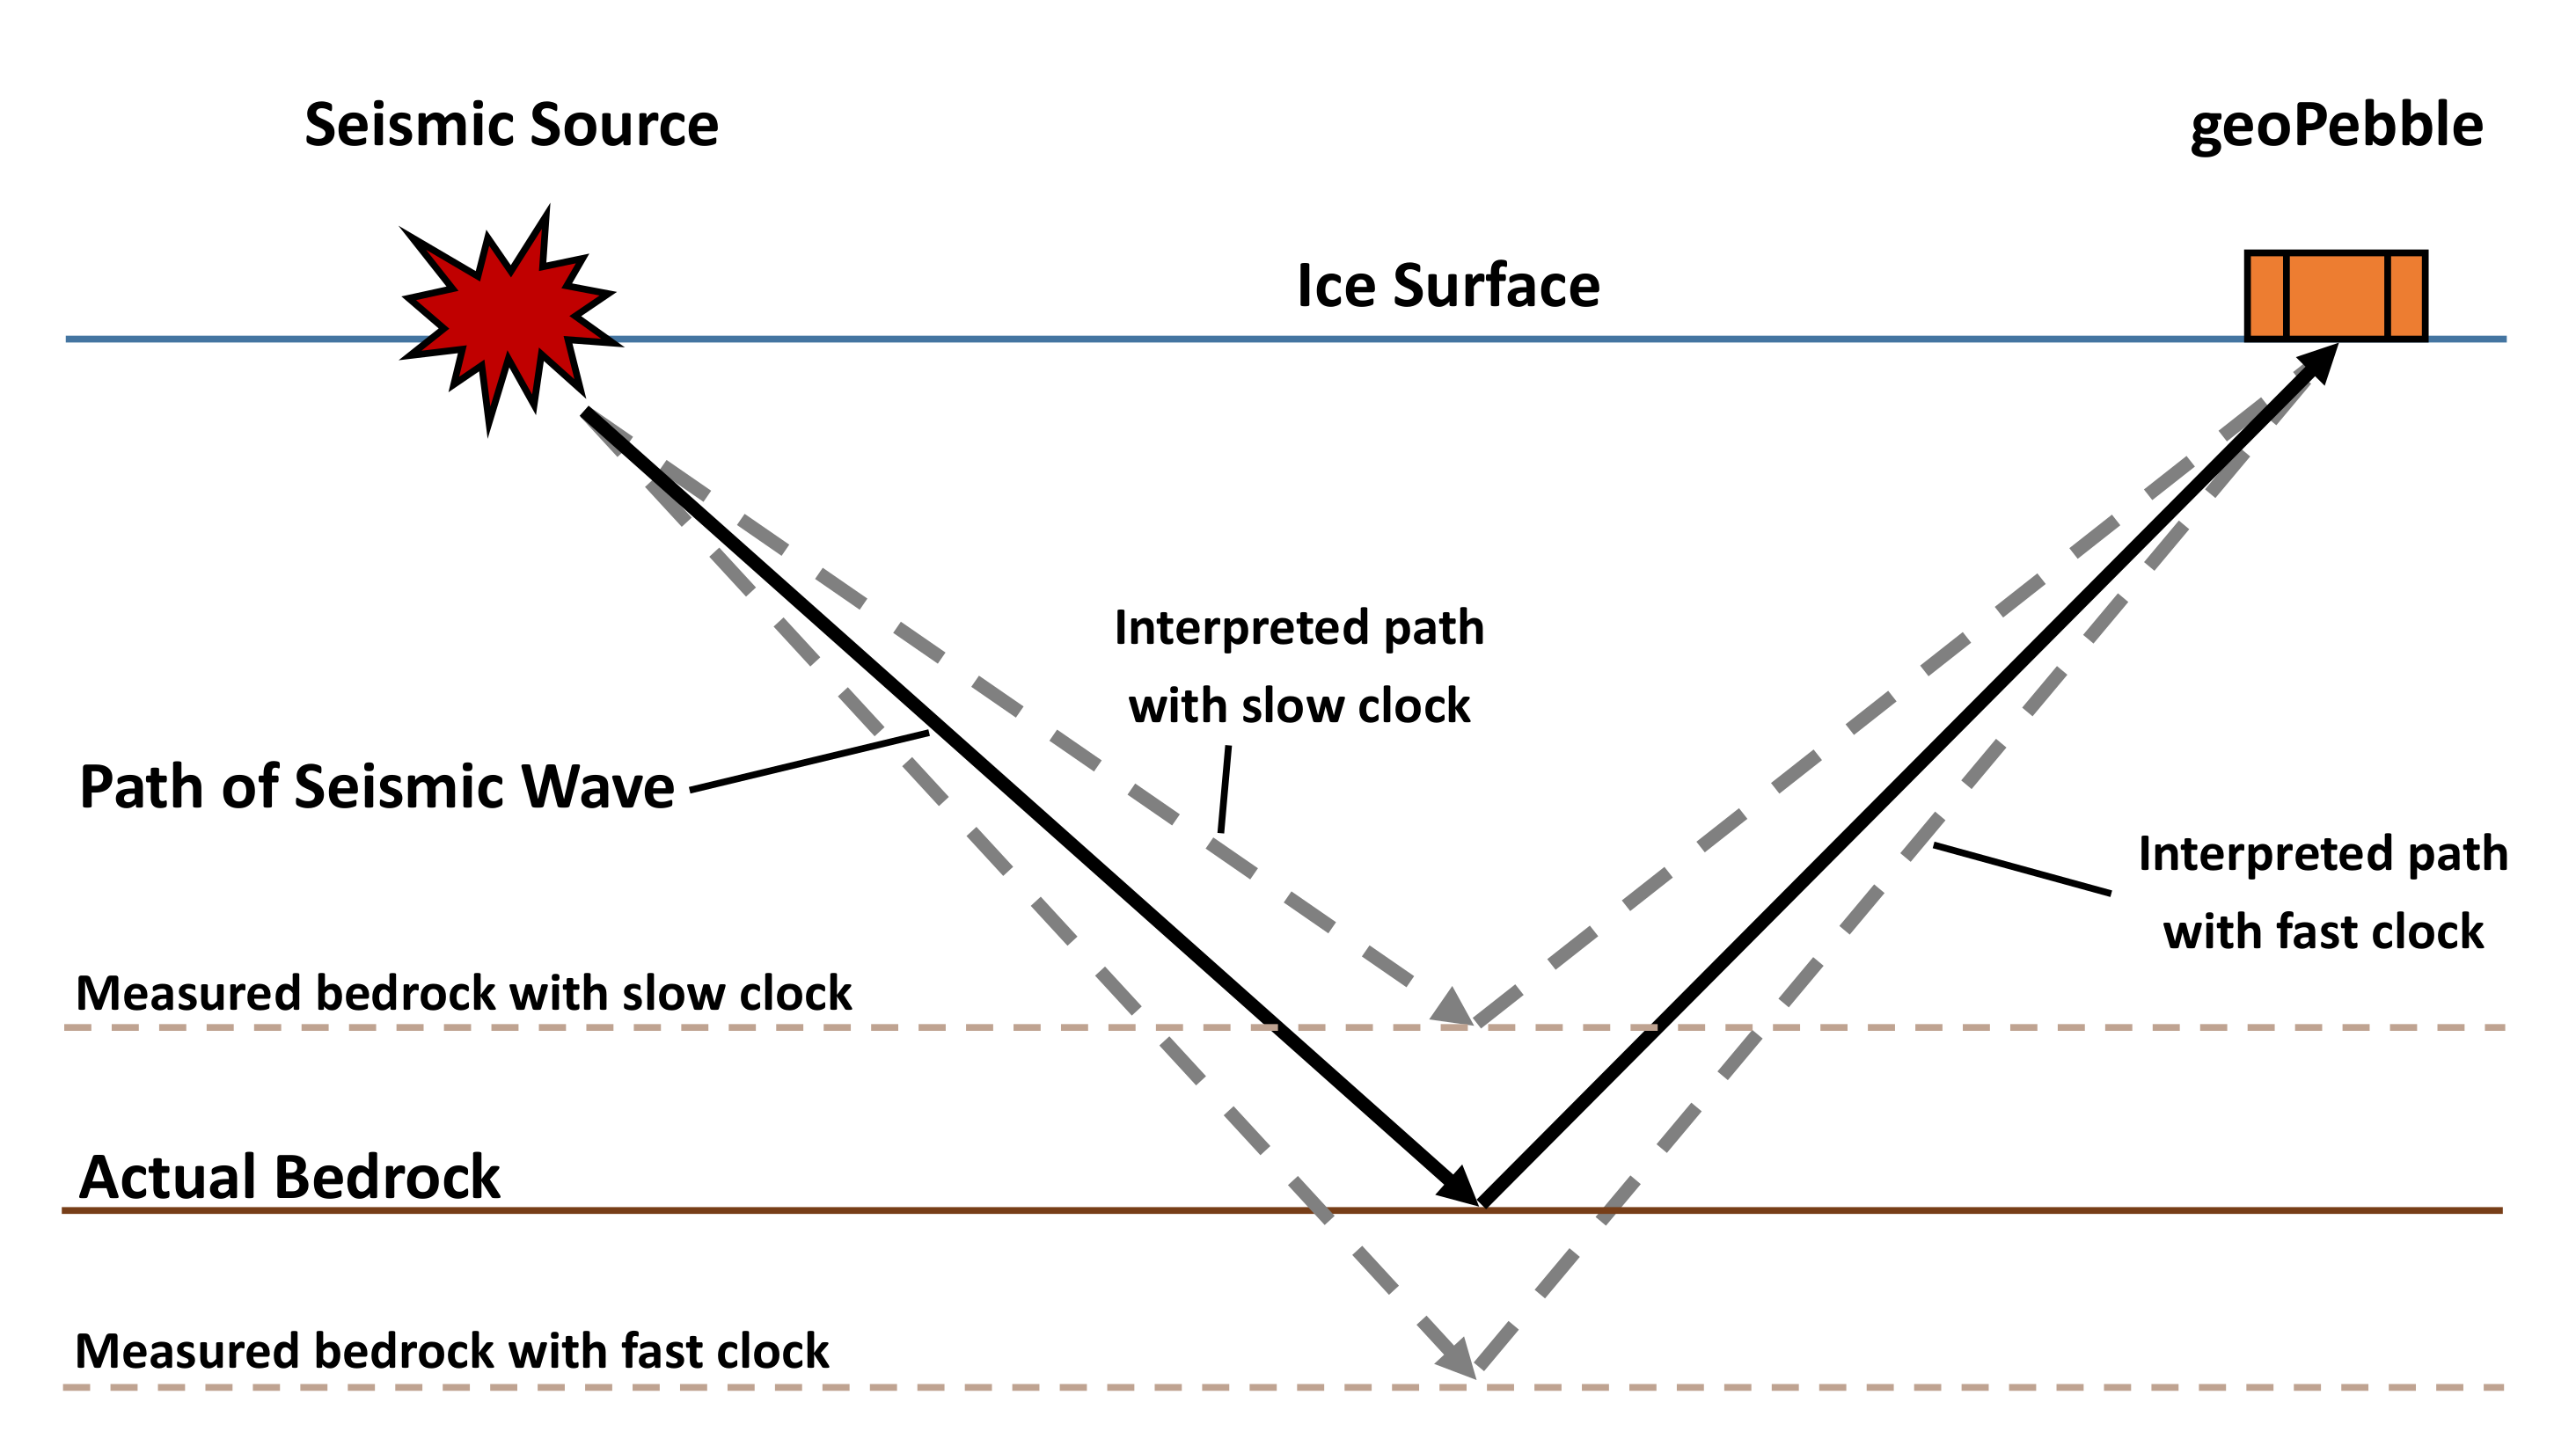
The data collected with the geoPebble nodes are highly time-dependent. Since seismic reflections are being measured, timing differences between geoPebbles will result in the pressure wave appearing to have hit one of the instruments sooner or later than another. This will result in distortion of the mapping and decrease the accuracy of the results. The geoPebble system aims to achieve high resolution features of the glacier morphology, so high accuracy timing is needed to create certainty in the results. An example can best illustrate this process, as seen in Figure A2.
Figure A2. A simplified diagram of mapping distortions due to timing errors.
Electronics 10 00716 g0a2
To simplify the problem, let us assume the speed of the seismic wave is 3 km·s 1 , the seismic source and geoPebble are separated by x pebble = 1 km, the bedrock is y bedrock = 0.5 km deep, and the bedrock and ice surface are perfectly flat and parallel. Since the seismic wave traveling to the geoPebble forms an isosceles triangle, the distance it needs to travel is:
d wave = 2 1 2 x pebble 2 + y bedrock 2 = 2 1 2 1.0 2 + 0 . 5 2 = 1.4142 km .
Since the wave is traveling at 3 km·s 1 , it will take the wave 471.41 ms to traverse through the ice. Now, let us suppose the timing of the geoPebble is 1 ms fast. The geoPebble now sees the wave taking 470.41 ms to traverse through the ice. This would suggest the wave traveled 1.4112 km. Working backwards to find the bedrock depth,
y bedrock = 1 2 d wave 2 1 2 x pebble 2 = 1 2 1.4112 2 1 2 1.0 2 = 497.8 m ,
resulting in 2.2 m of error in the bedrock depth measurement.
This simple example demonstrates the fundamental need for high timing accuracy, and it is also the basis for the geoPebble system’s timing accuracy requirement. The geoPebble system may be distributed such that an individual geoPebble may be as far as 1 km away from the seismic source. The average ice thickness of Antarctica is 2 km [21], and the fastest expected speed of the seismic wave through the ice is approximately 3.9 km·s 1 [22]. The geoPebble timing requirement is an accuracy of 1% rms of the sampling period between all units or 1 μ s rms in the case of the highest sampling rate of 10 kHz. The actual seismic path length is:
d wave = 2 1 2 1.0 2 + 2 . 0 2 = 4.123106 km .
At a speed of 3.9 km·s 1 , it takes the seismic wave approximately 1.057207 s to travel this distance. If the timing error is 1 μ s, the seismic wave travel path is interpreted as 4.123110 km. This results in a depth measurement of:
y bedrock = 1 2 4.123110 2 1 2 1.0 2 = 2.000002 km .
This determines that the error in the depth measurement due to timing errors is 2 mm. This ensures the timing is not a significant source of error for the sensitive measurements performed in the field.

Appendix B. GPSDO Implementation in the geoPebble System

The GPSDO circuit was implemented on the main board of the geoPebble, as shown in Figure A3. The circuitry that is part of the GPSDO is enclosed within the white lines. Of note are the components labeled X1101 (crystal), U1101 (temperature sensor), and U1102 (MSP430 microcontroller). The temperature sensor is bent onto the crystal and affixed with thermal epoxy. As a number of different GPS receivers can be used, this component is not included, although for our system, we used the ublox LEA-T6 [10]. It should be noted that the circuit was not optimized for board space as that was not required due to ample board space; however, a circuit optimized for board space could be shrunk by at least a factor of three. In such case, not including the GPS receiver, the total board space could be on the order of 1.5 cm 2 .
Figure A3. Implementation of the GPSDO circuit on the geoPebble main board. The overall main board is shown, with the location of the GPSDO circuit highlighted.
Electronics 10 00716 g0a3

Appendix C. Clock and Timing Fundamentals

Clock characterization is required in order to properly understand the accuracy of the implemented GPSDO. This is needed in order to precisely determine how accurate the oscillator is on some time scale (e.g., the time accuracy after 1 s of operation or the time accuracy after 1 h of operation). Basic standard deviations of the oscillator frequency are not applicable since the standard deviation does not converge for certain types of noise [23]. As the number of samples increases, the standard deviation will climb logarithmically. A modified variance (the square of standard deviation) known as the Allan variation corrects this issue and converges for all types of relevant noise [23,24], thus allowing one to accurately characterize a clock statistically.

Appendix C.1. Allan Variance Theory

Noise in a precision oscillator is typically characterized by a power law spectrum [24,25], i.e.,
S y ( f ) = h | f | α ,
where y is the normalized frequency deviation, f is the frequency, h is the amplitude of the specific noise process, and α is constant over some range of f. The normalized frequency deviation is defined as:
y ( t ) = v ( t ) v 0 v 0 ,
where v is the measured frequency output of the device under test (DUT), and v 0 is the frequency of a reference oscillator, which is nominally the same frequency as the DUT. The reference oscillator is assumed to be better than the DUT, such that it induces minimal error. Thus, Equation (A5) states that the noise in the normalized frequency deviation follows a power law.
The Allan variance is built on these frequency deviations, y ( t ) , and the fact that they follow a power law. The Allan variance analyzes the derivative of normalized frequency deviation. Further averaging is needed in order to analyze different time scales, e.g., the clock accuracy after 1 s, 10 s, 100 s, etc. The average value of y ( t ) over the interval t to t + τ is:
y ¯ ( t ) = 1 τ t t + τ y ( t ) d t .
To determine the Allan variance, a group of N measurements must be taken at a regular intervals, with period T, and must have no dead time between measurements (meaning one measurement starts immediately after the previous one with no delay). The Allan variance is then defined as [25]:
σ y 2 ( N , T , τ ) = 1 N 1 n = 1 N y ¯ ( t + n T ) 1 N k = 1 N y ¯ ( t + k T ) 2 .
It has been shown that:
E σ y 2 ( N , T , τ ) τ μ ,
where the function E σ y 2 ( N , T , τ ) denotes the expectation value. Furthermore, μ is related to α by the following [25]:
μ = 2 if α 1 , α 1 if 3 < α 1 , undefined otherwise .
These relationships provide deep insight into an oscillator’s performance. When the Allan variance is plotted on a log scale, the slope of the line, μ , indicates what type of noise process is dominant at a particular time scale, since μ is related α , and α describes the noise process. Table A1 lists the various noise processes that are considered.
Table A1. Noise processes as related to α .
α Noise Process
2White-Noise Phase Modulation
1Flicker-Noise Phase Modulation
0White-Noise Frequency Modulation (Random Walk Phase)
1 Flicker-Noise Frequency Modulation
2 Random Walk Frequency Modulation
The relationship between μ and α does bring up one issue, however. The Allan variance is not capable of distinguishing between white-noise phase modulation (PM) and flicker-noise PM since α = 1 and α = 2 both result in μ = 2 . A modified Allan variance was developed in order to remove this ambiguity at the cost of more computational time, which is not an issue with modern computers. The modified Allan variance uses the second difference in order to remove this ambiguity. In terms of phase, the modified Allan variance is defined as [24]:
Mod σ y 2 ( N , n , τ ) = 1 2 τ 2 n 2 ( N 3 n + 1 ) j = 1 N 3 n + 1 i = j n + j 1 ( x i + 2 n 2 x i + n + x i ) 2 ,
where τ = n τ 0 , τ 0 being the sampling period, n is the averaging factor, and the phase x is defined as:
x ( t ) = 0 t y ( t ) d t .
One drawback to the modified Allan variance is that it is more difficult to accurately analyze the results. Typically, the Allan variance is used for α < 1 , and the modified Allan variance is used to analyze α 1 (white PM and flicker PM). Figure A4 demonstrates the different α μ relationships between the Allan variance and the modified Allan variance. The modified Allan variance α μ relationship uses asymptotic values as n approaches infinity. For small n (e.g., n 8 ), α appears more negative and skews the results slightly.
Figure A4. The relationship between α and μ for the Allan variance (AVAR) and the modified Allan variance (MAVAR). The α μ relationship for MAVAR is n .
Electronics 10 00716 g0a4

Appendix C.2. Time Error Estimation Using the Allan Variance

Time error estimation of a dominant noise process is based on the modified Allan variance. Table A2 shows the results of a statistical analysis on the noise processes of interest [26]. When dealing with a single dominant noise process, the optimum prediction of the rms time error, χ ( τ p ) , is a simple calculation. For instance, the expected dominant noise process of the GPSDO is random walk frequency modulation (FM) ( α = 2 ). The optimum prediction for this noise process is then the prediction interval multiplied by the modified Allan deviation.
Table A2. Noise processes as related to α .
α Noise ProcessOptimum Prediction
χ ( τ p )  rms
Time Error:
Asymptotic Form
2White-Noise PM τ p · σ y ( τ p ) · 1 3 constant
1Flicker-Noise PM τ p · σ y ( τ p ) · ln τ p 2 ln τ 0 ln τ p
0White-Noise FM τ p · σ y ( τ p ) τ p 1 / 2
1 Flicker-Noise FM τ p · σ y ( τ p ) · 1 ln 2 τ p
2 Random Walk FM τ p · σ y ( τ p ) τ p 3 / 2

Appendix C.3. Using the Allan Variance
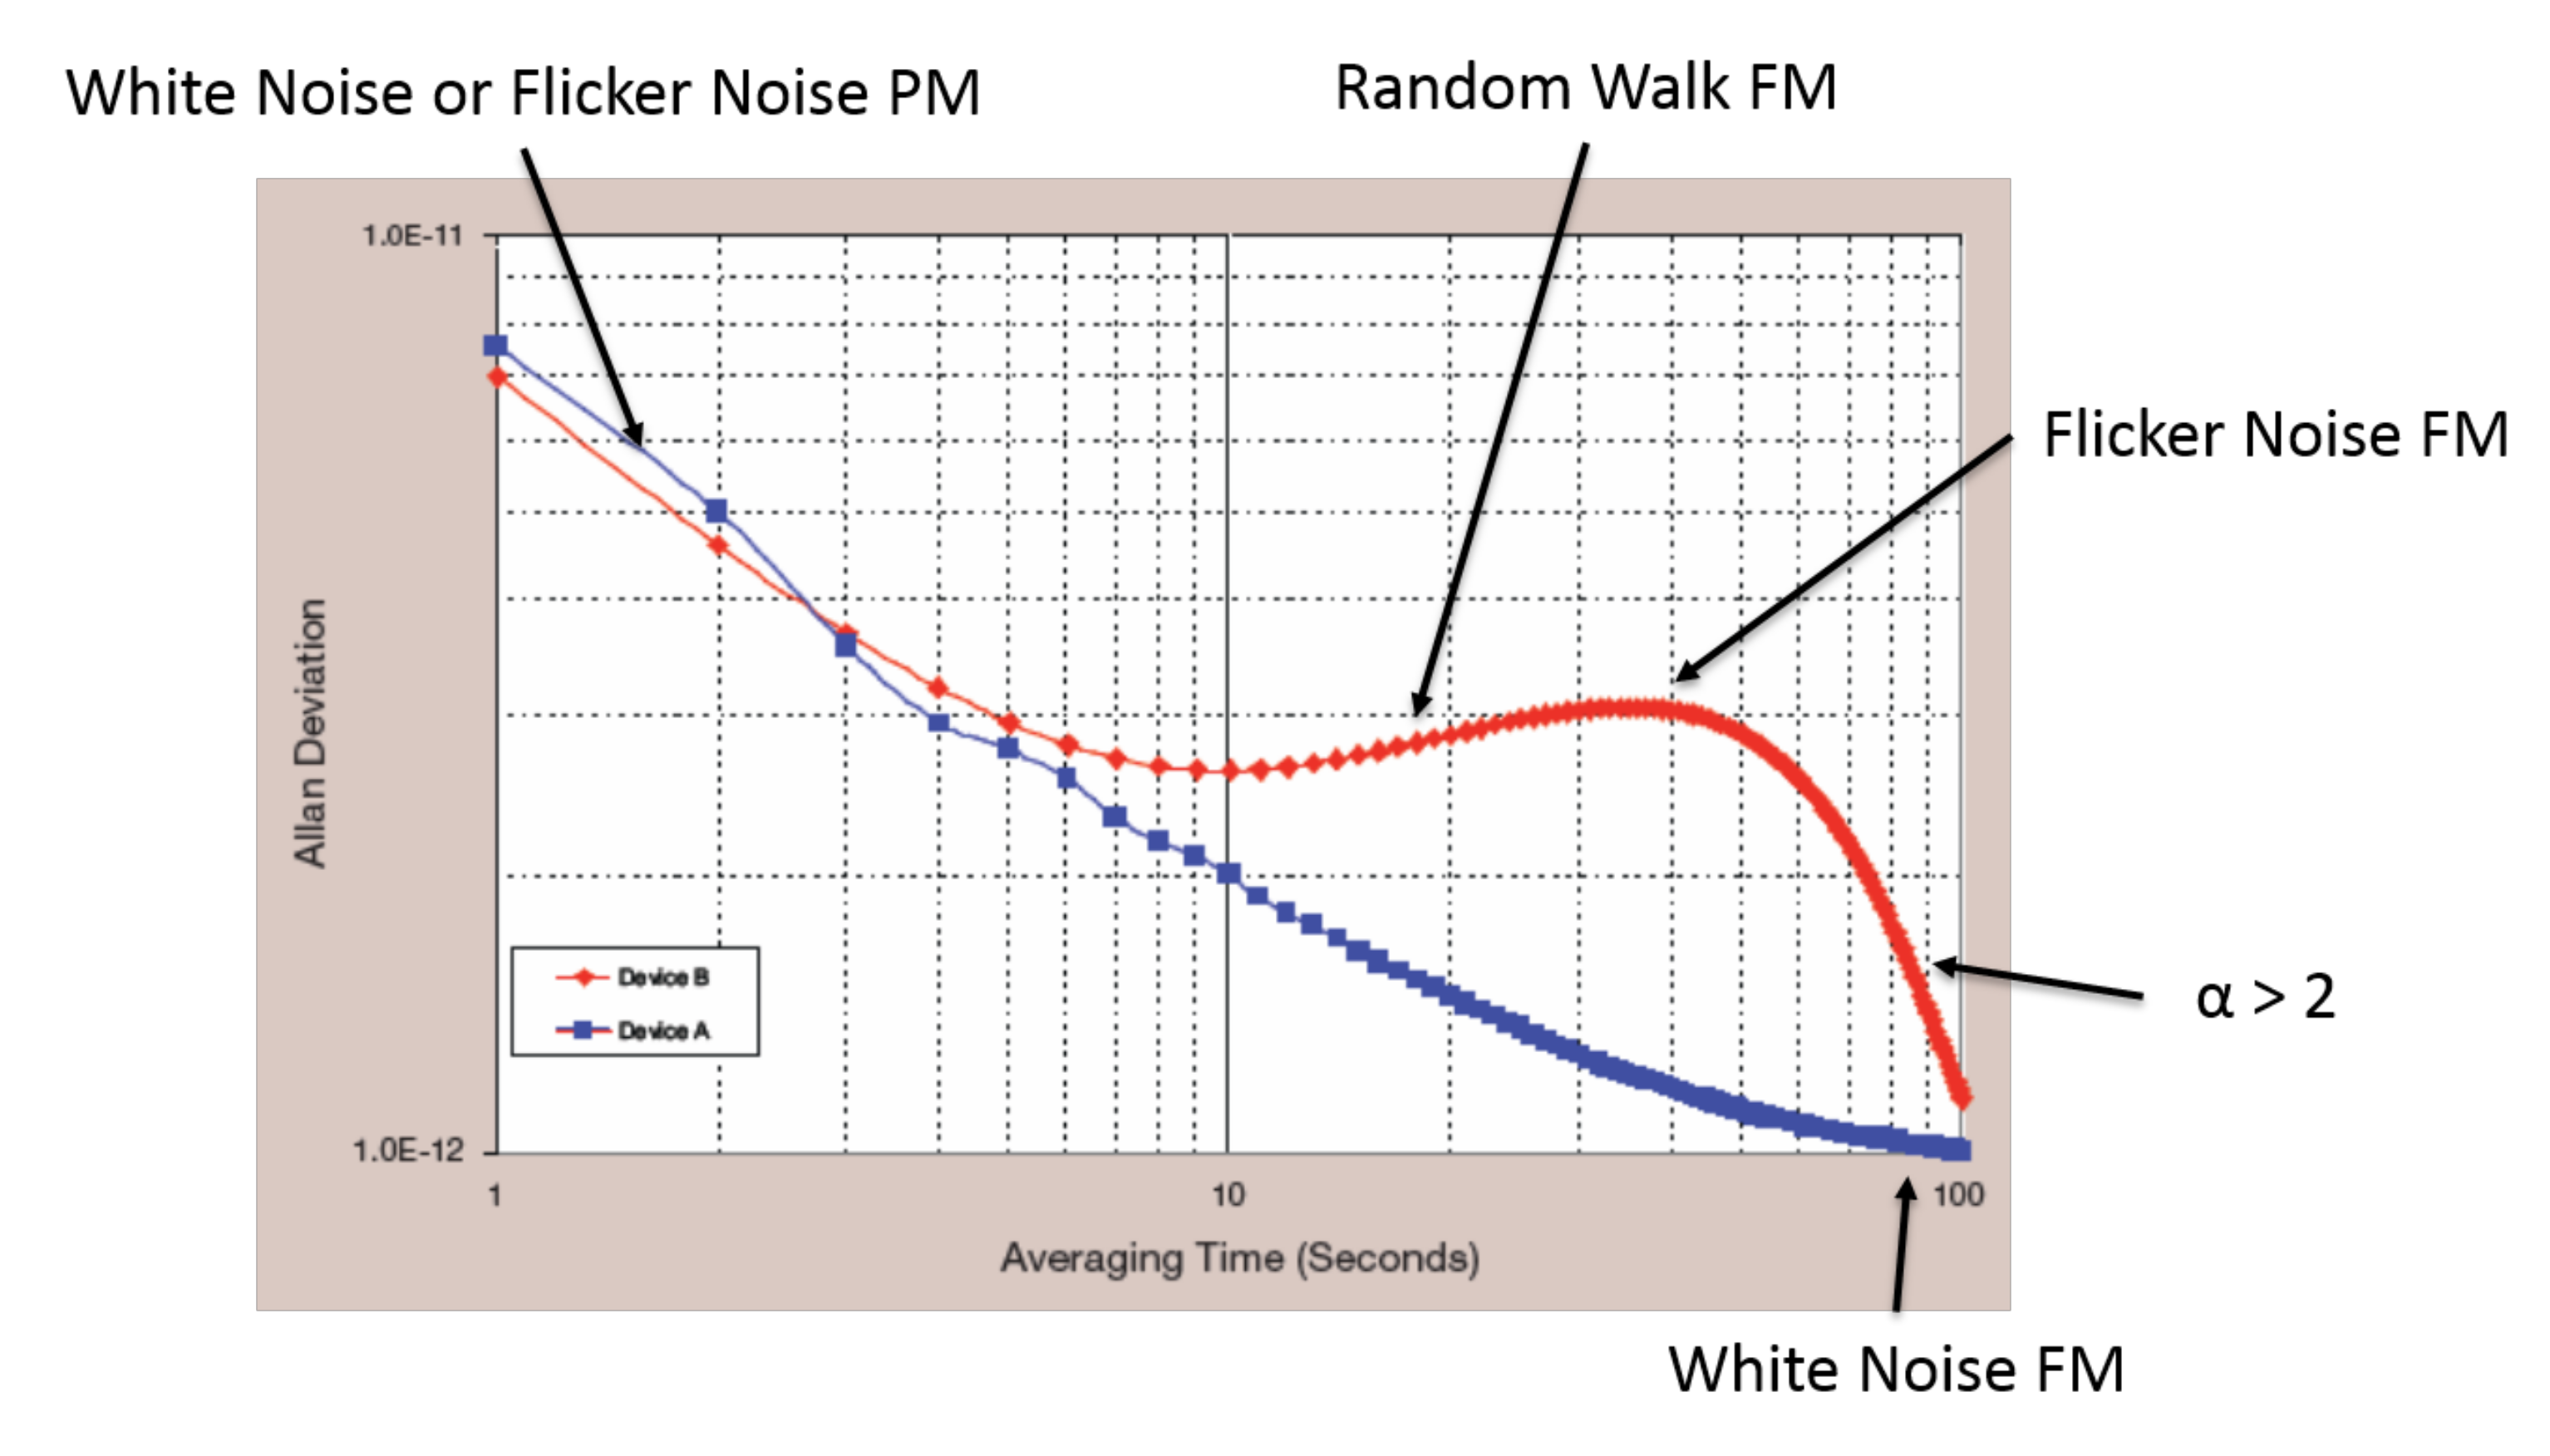
The primary use of the Allan variance in analyzing the designed GPSDO is to ensure that the GPSDO is behaving as expected and to determine how long the oscillator is capable of running open-loop without GPS disciplining. To verify the GPSDO is behaving as expected, one may look at the noise processes present, as described by the Allan deviation. Since a quartz oscillator is used, flicker FM noise is expected to dominate for low time averages; however, white-noise FM may also appear depending on the oscillator. The white-noise FM is common with crystal oscillators that are forced to a specific frequency [27]. Furthermore, since the oscillator will be adjusted for frequency errors periodically, frequency jumps are expected to occur. This will induce random walk FM up to the GPSDO disciplining period(s). Beyond the longest GPSDO disciplining period, white-noise FM is expected to dominate as the GPSDO inherits the long-term time accuracy of the GPS satellite.
Figure A5 displays a plot of the Allan deviation, or the square root of the Allan variance, of two GPSDO units. At low time averages, τ < 8 , the slope is approximately 1 . This implies that α 1 , meaning white- or flicker-noise PM is dominant. After an 8-s time averaging, the slope of the red line increases towards μ = 1 , or α = 2 , meaning random walk FM is dominant. The blue line, however, remains in its downward slope, eventually slightly increasing such that μ = 1 , or α = 0 , indicating white-noise FM. The red line continues its upward trend until around 30–40 s time averages, which presumably is (one of) its integration period(s), resulting in flicker-noise FM. The red line then takes a sharp downward turn, quickly inheriting the long-term accuracy of GPS and resulting in a noise process with α > 2 . These higher order noise processes are sometimes seen in GPSDOs depending on the control loop implemented.
Figure A5. The Allan deviation (square root of Allan variance) of two GPSDO units, from Lombardi 2008 [9].
Electronics 10 00716 g0a5

References

  1. Allan, D.; Weiss, M.; Peppler, T. In search of the best clock. In Proceedings of the Precision Electromagnetic Measurements (CPEM 88), Tsukuba, Japan, 7–10 June 1988; pp. 78–79. [Google Scholar] [CrossRef] [Green Version]
  2. Allan, D.; Weiss, M.; Peppler, T. In search of the best clock. IEEE Trans. Instrum. Meas. 1989, 38, 624–630. [Google Scholar] [CrossRef]
  3. Sichitiu, M.; Veerarittiphan, C. Simple, accurate time synchronization for wireless sensor networks. In Proceedings of the Wireless Communications and Networking (WCNC 2003), New Orleans, LA, USA, 16–20 March 2003; Volume 2, pp. 1266–1273. [Google Scholar] [CrossRef]
  4. Gezici, S.; Tian, Z.; Giannakis, G.; Kobayashi, H.; Molisch, A.; Poor, H.; Sahinoglu, Z. Localization via ultra-wideband radios: A look at positioning aspects for future sensor networks. Signal Process. Mag. 2005, 22, 70–84. [Google Scholar] [CrossRef]
  5. Sayed, A.; Tarighat, A.; Khajehnouri, N. Network-based wireless location: Challenges faced in developing techniques for accurate wireless location information. Signal Process. Mag. 2005, 22, 24–40. [Google Scholar] [CrossRef]
  6. Allan, D.W. An Ultra-Precise Time Synchronization System Designed by Computer Simulation; Technical Report; National Bureau of Standards: Gaithersburg, MD, USA, 1968.
  7. Allan, D.W.; Gray, J.E.; Machlan, H. The National Bureau of Standards atomic time scales: Generation, dissemination, stability, and accuracy. IEEE Trans. Instrum. Meas. 1972, 21, 388–391. [Google Scholar] [CrossRef] [Green Version]
  8. Allan, D.W.; Davis, D.D.; Weiss, M.; Clements, A.; Guinot, B.; Granveaud, M.; Dorenwendt, K.; Fischer, B.; Hetzel, P.; Aoki, S.; et al. Accuracy of international time and frequency comparisons via Global Positioning System satellites in common-view. IEEE Trans. Instrum. Meas. 1985, 34, 118–125. [Google Scholar] [CrossRef] [Green Version]
  9. Lombardi, M.A. The use of GPS disciplined oscillators as primary frequency standards for calibration and metrology laboratories. NCSLI Measure. 2008, 3, 56–65. [Google Scholar] [CrossRef]
  10. u blox. LEA-6T Module with Precision Timing. Available online: https://www.u-blox.com/en/product/neolea-6t (accessed on 17 March 2021).
  11. Microsemi. Chip Scale Atomic Clock (CSAC)—SA.45s. Available online: http://https://www.microsemi.com/product-directory/clocks-frequency-references/3824-chip-scale-atomic-clock-csac (accessed on 17 March 2021).
  12. Knappe, S.; Shah, V.; Schwindt, P.D.D.; Hollberg, L.; Kitching, J.; Liew, L.A.; Moreland, J. A microfabricated atomic clock. Appl. Phys. Lett. 2004, 85, 1460–1462. [Google Scholar] [CrossRef] [Green Version]
  13. Bilén, S.G.; Anandakrishnan, S.; Burkett, P.; Fleishman, A.; Urbina, J. Design and implementation of a wireless sensor network of GPS-enabled seismic sensors for the study of glaciers and ice sheets. In Proceedings of the 2012 AGU Fall Meeting, San Francisco, CA, USA, 3–7 December 2012. [Google Scholar]
  14. Anandakrishnan, S.; Urbina, J.; Bilén, S.G.; Fleishman, A.; Burkett, P. Penn State geoPebble system: Design, implementation, and initial results. In Proceedings of the 2014 AGU Fall Meeting, San Francisco, CA, USA, 15–19 December 2014. [Google Scholar]
  15. Lim, J.; Lee, K.; Cho, K. Ultra low power RC oscillator for system wake-up using highly precise auto-calibration technique. In Proceedings of the 2010 Proceedings of ESSCIRC, Sevilla, Spain, 13–17 September 2010; pp. 274–277. [Google Scholar] [CrossRef]
  16. Ali, I.; Asif, M.; Rehman, M.R.U.; Khan, D.; Yingge, H.; Kim, S.J.; Pu, Y.; Yoo, S.S.; Lee, K.Y. A highly reliable, 5.8 GHz DSRC wake-up receiver with an intelligent digital controller for an ETC system. Sensors 2020, 20, 4012. [Google Scholar] [CrossRef] [PubMed]
  17. Apparatus for Correcting the Timing Function in a Nodal Seismic Data Acquisition Unit. U.S. Patent US9465124B2, 11 October 2016.
  18. Jackson Labs Technologies, Inc. GPSOCXO. Available online: http://www.jacksonlabs.com/index.php/products/gps_ocxo (accessed on 17 March 2021).
  19. Tejado, I.; Vinagre, B.M.; Traver, J.E.; Prieto-Arranz, J.; Nuevo-Gallardo, C. Back to basics: Meaning of the parameters of fractional order PID controllers. Mathematics 2019, 7, 530. [Google Scholar] [CrossRef] [Green Version]
  20. William Riley, D.A.H. Handbook of Frequency Stability Analysis; National Institutes of Standards and Technology: Gaithersburg, MD, USA, 2008.
  21. Bramwell, M. Glaciers and Ice Caps; Franklin Watts: Hachette, UK, 1986. [Google Scholar]
  22. Vogt, C.; Laihem, K.; Wiebusch, C. Speed of sound in bubble-free ice. J. Acoust. Soc. Am. 2008, 124, 3613–3618. [Google Scholar] [CrossRef] [PubMed]
  23. Allan, D.W. Statistics of atomic frequency standards. Proc. IEEE 1966, 54, 221–230. [Google Scholar] [CrossRef] [Green Version]
  24. Allan, D.; Barnes, J. A Modified “Allan Variance” with increased oscillator characterization ability. In Proceedings of the Thirty Fifth Annual Frequency Control Symposium, Philadelphia, PA, USA, 27–29 May 1981; pp. 470–475. [Google Scholar] [CrossRef]
  25. Barnes, J. Tables of Bias Functions, B1 and B2, for Variances Based on Finite Samples of Processes with Power Law Spectral Densities; Technical Report; National Bureau of Standards: Gaithersburg, MD, USA, 1969.
  26. Allan, D.W. Time and frequency (time-domain) characterization, estimation, and prediction of precision clocks and oscillators. IEEE Trans. Ultrason. Ferroelectr. Freq. Control. 1987, 34, 647–654. [Google Scholar] [CrossRef] [PubMed]
  27. Howe, D.; Allan, D.; Barnes, J. Properties of signal sources and measurement methods. In Proceedings of the Thirty Fifth Annual Frequency Control Symposium, Philadelphia, PA, USA, 27–29 May 1981; pp. 669–716. [Google Scholar] [CrossRef]
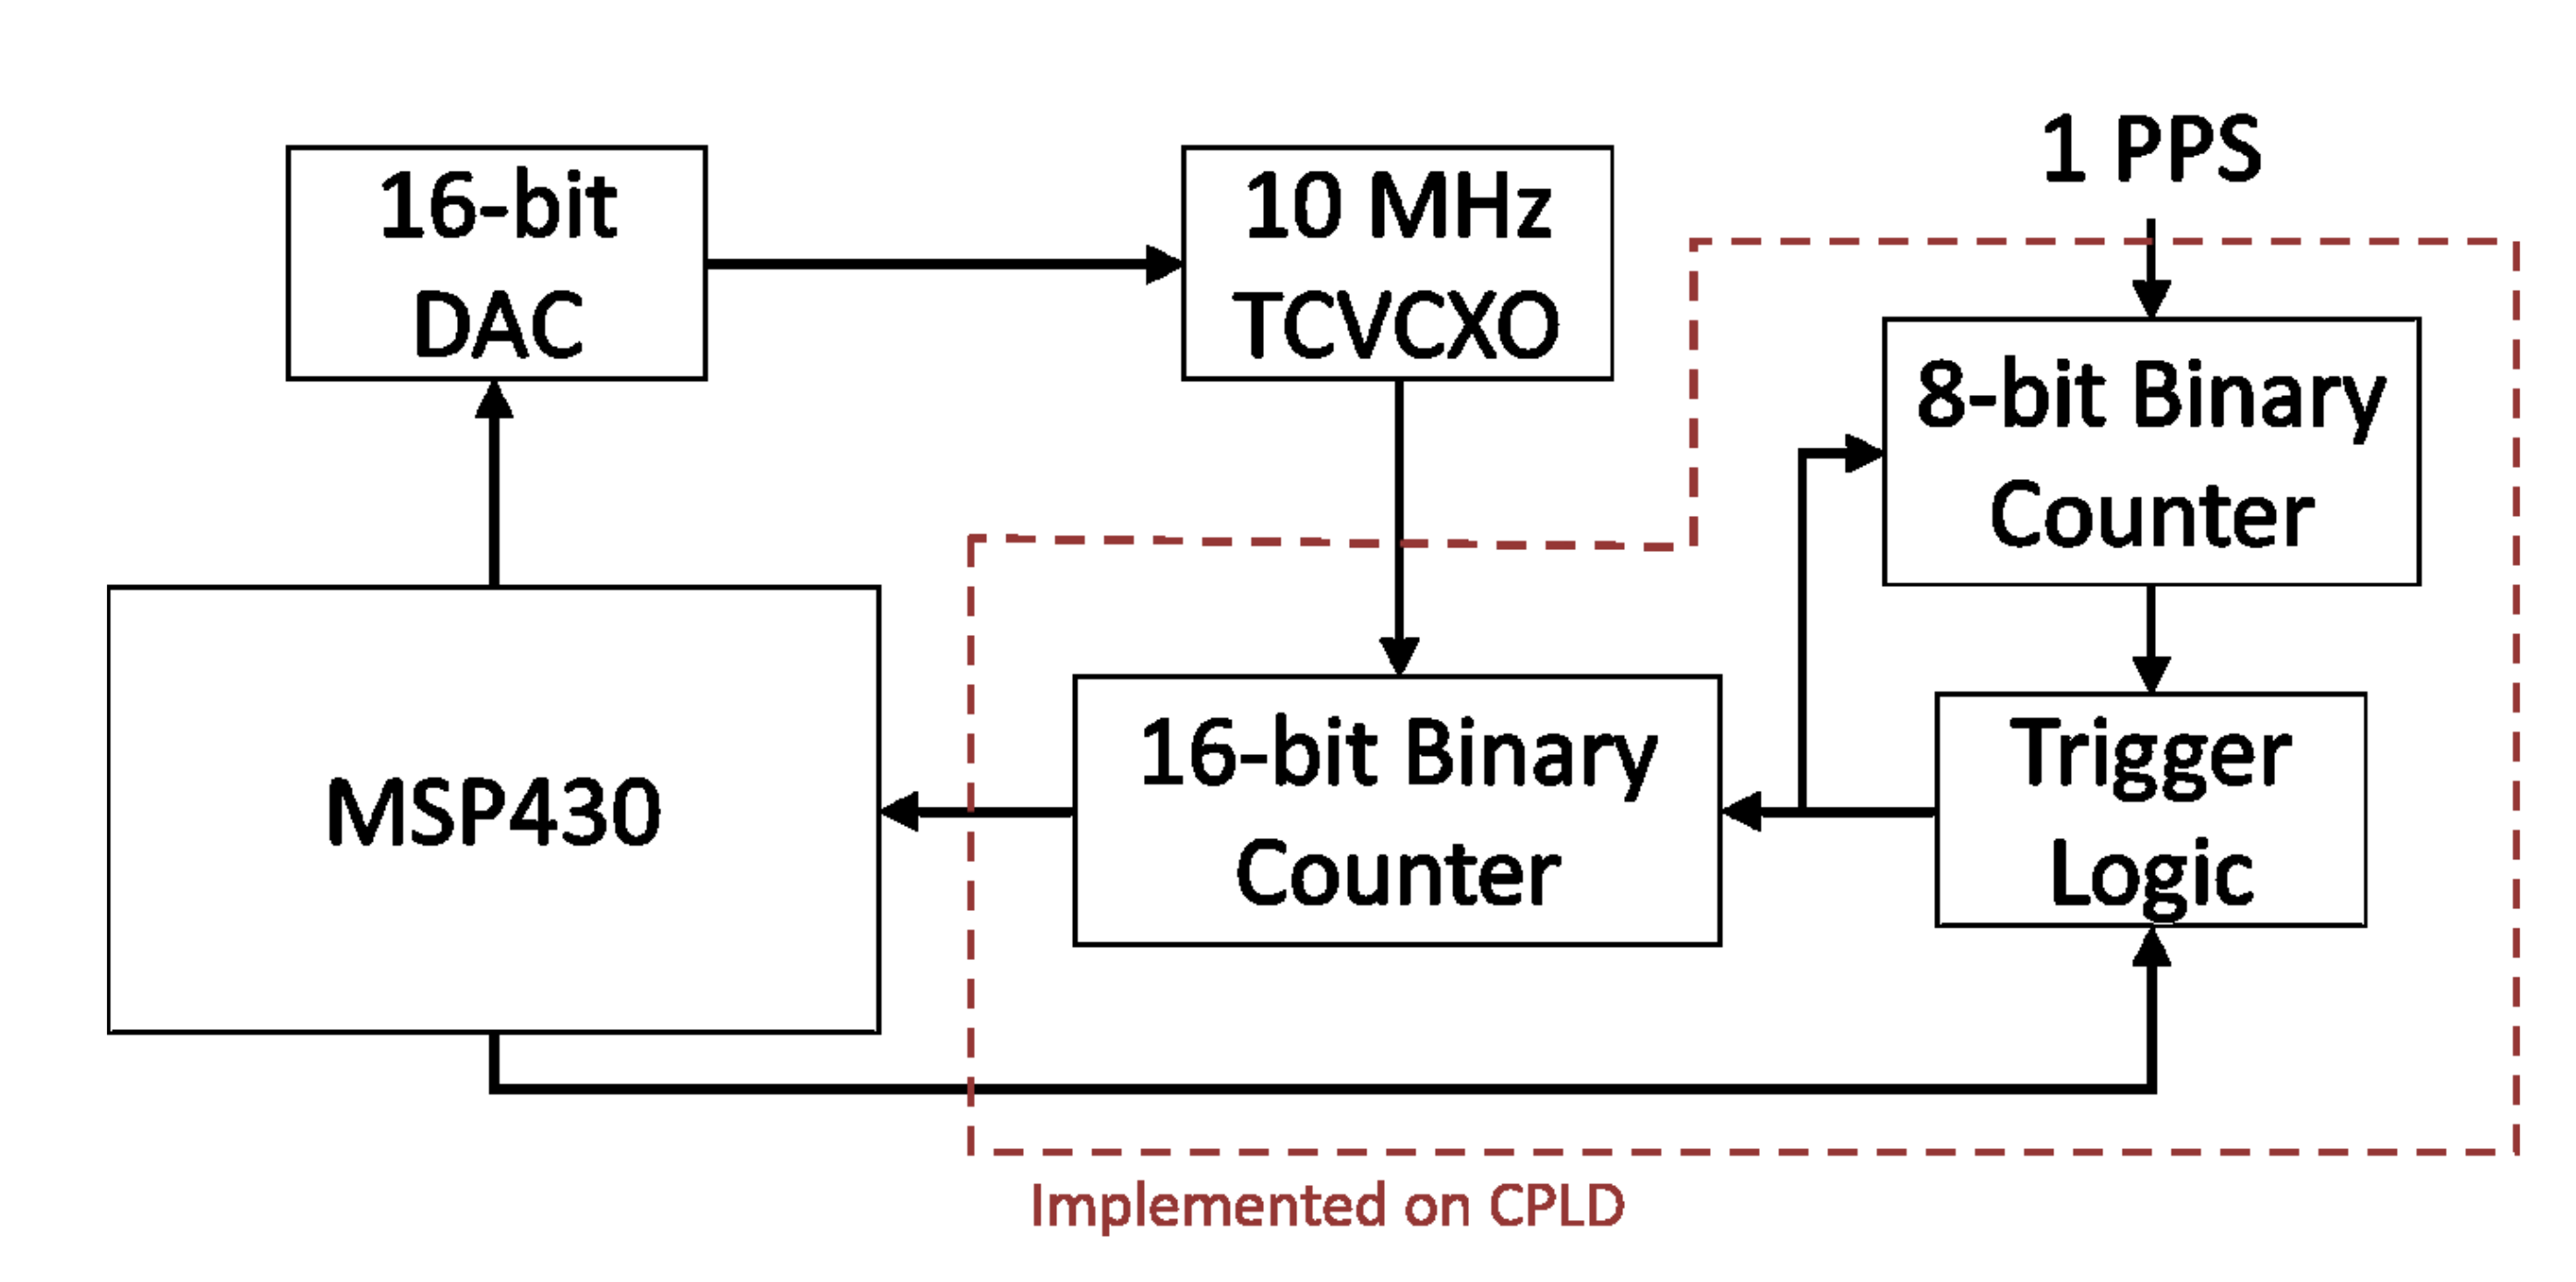
Figure 1. Block diagram of the GPS-disciplined oscillator (DAC: digital-to-analog converter, MSP430: microcontroller, TCVXCO: temperature-compensated voltage-controlled crystal oscillator, pps: pulse per second, CPLD: complex programmable logic device).
Electronics 10 00716 g001
Figure 2. The error between the least-squares estimate and the actual frequency ready by the on-board frequency counter for the 20 MHz oscillator.
Electronics 10 00716 g002
Figure 3. The estimated frequency error after a single control step.
Electronics 10 00716 g003
Figure 4. The overlapping Allan deviation of the 20-MHz oscillator running for 54 h while continuously disciplining every 34 s. Error bars are 1 σ confidence (68.3%).
Electronics 10 00716 g004
Figure 5. The clock time error of the 20-MHz GPSDO in an 1800-s window, with the GPSDO disciplining continuously every 34 s.
Electronics 10 00716 g005
Figure 6. The overlapping Allan deviation of the 20-MHz oscillator running for 45 h while disciplining once every 1837 s. Error bars are 1 σ confidence (68.3%).
Electronics 10 00716 g006
Figure 7. The clock time error of the 20-MHz GPSDO in an 1800-s window, with the GPSDO disciplining once every 1837s.
Electronics 10 00716 g007
Figure 8. The frequency deviation from 20 MHz of the oscillator when swept across a large temperature range.
Electronics 10 00716 g008
Figure 9. The Allan deviation of the 20-MHz oscillator running for 160 h while disciplining once every 1800 s. Error bars are 1 σ confidence (68.3%).
Electronics 10 00716 g009
Figure 10. The error between the least-squares estimate and the actual frequency ready by the on-board frequency counter for the 20-MHz oscillator.
Electronics 10 00716 g010
Table 1. A qualitative comparison of the properties of typical frequency sources.
Frequency SourceLong-Term
Accuracy (1000 s)
Power
Consumption
Cost
Quartz Crystal OscillatorLowLowLow
Ovenized OscillatorMediumMedium to HighMedium
RubidiumHighHighHigh
CesiumHighHighHigh
Chip-Scale Atomic Clock (CSAC)HighLowHigh
GPS-Disciplined Oscillator
(GPSDO)
HighMediumMedium
GPSDO in This PaperHighLowLow
Table 2. A comparison of several of the lowest power GPSDOs commercially available.
ManufacturerModelRated Power
Consumption
Rated Accuracy
From UTC
Jackson Labs TechnologiesGPSTCXO<0.5 W ± 75 ns
Jackson Labs TechnologiesGPSOCXO0.7 W ± 50 ns
Jackson Labs TechnologiesFireFly-1B GPSTCXO<0.75 W ± 75 ns
Symmetricom/MicrosemiGPS-1000<1.8 W ± 50 ns
Symmetricom/MicrosemiGPS-2700/2750<1.4 W ± 15 ns
Symmetricom/MicrosemiGPS-3300/3550<5.6 W ± 10 ns
Connor WinfieldFTS2500.66 W ± 40 ns
Connor WinfieldWi1250.6 W ± 25 ns
Publisher’s Note: MDPI stays neutral with regard to jurisdictional claims in published maps and institutional affiliations.