
IQ-Data-Based WiFi Signal Classification Algorithm Using the Choi-Williams and Margenau-Hill-Spectrogram Features: A Case in Human Activity Recognition


Abstract
:1. Introduction
1.1. Article Contribution
1.2. Symbols and Article Organization
2. Related Work
3. Methodology
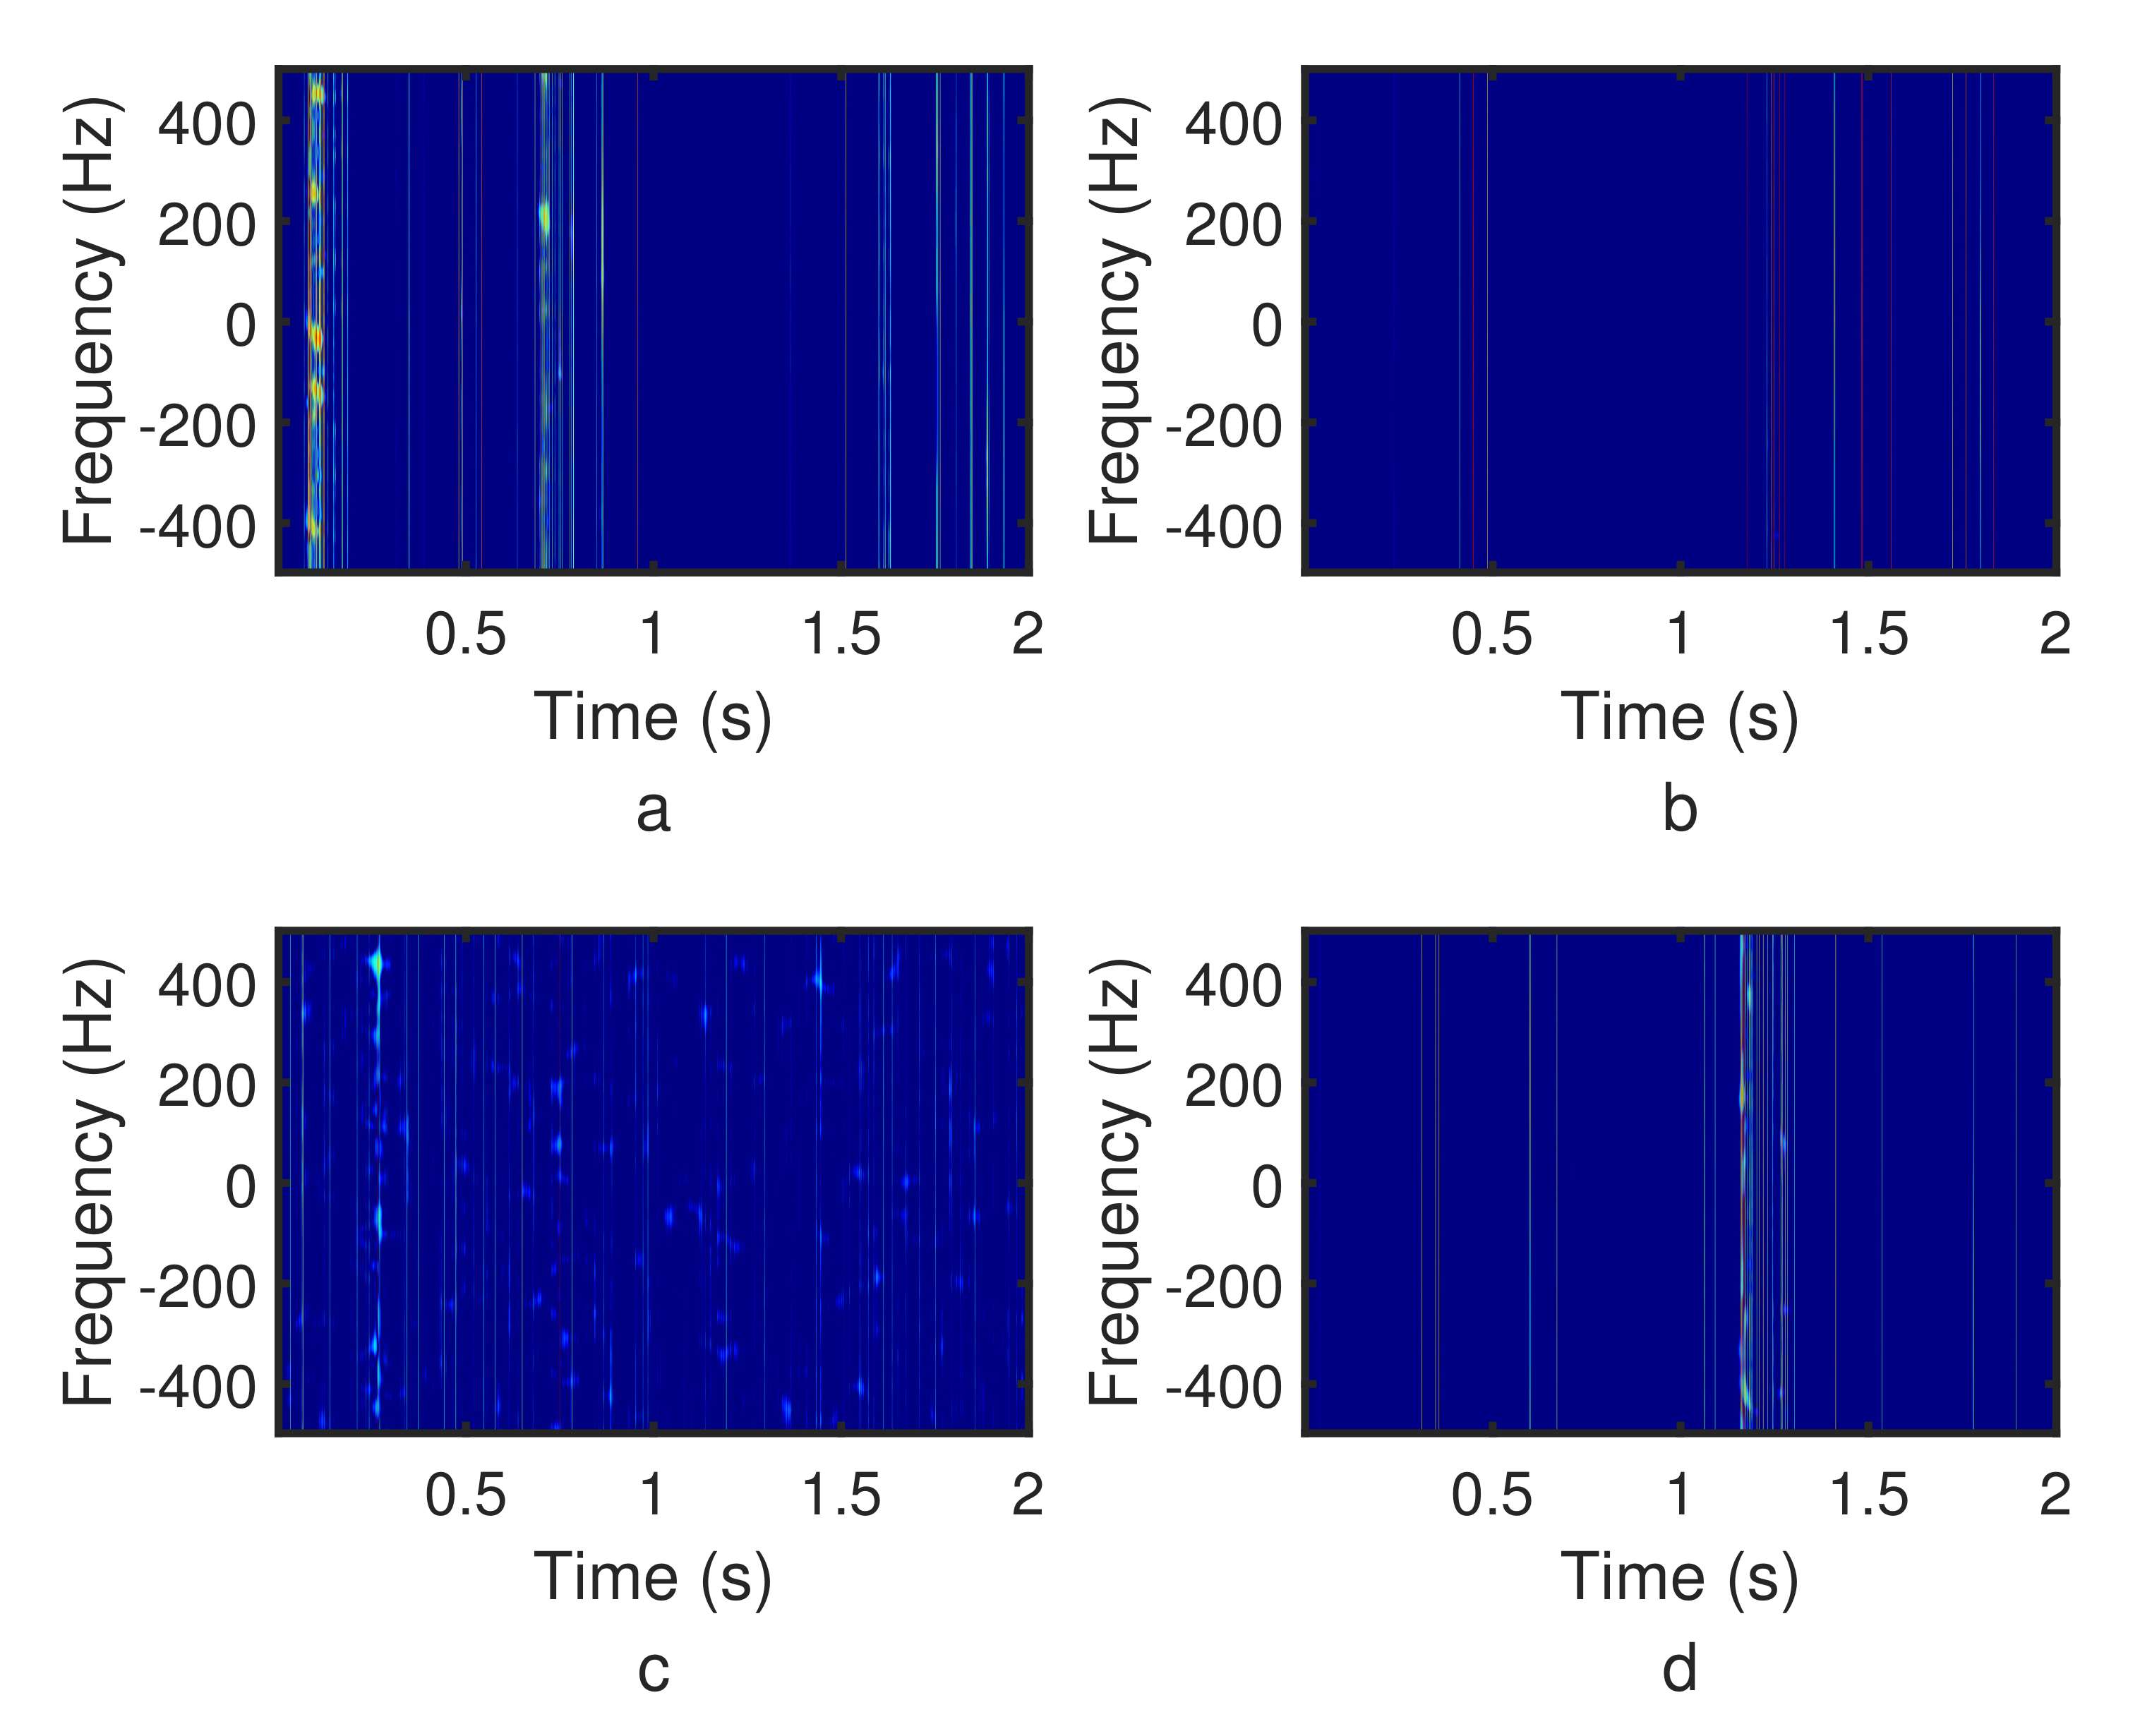
3.1. Time-Frequency Methods
- (1)
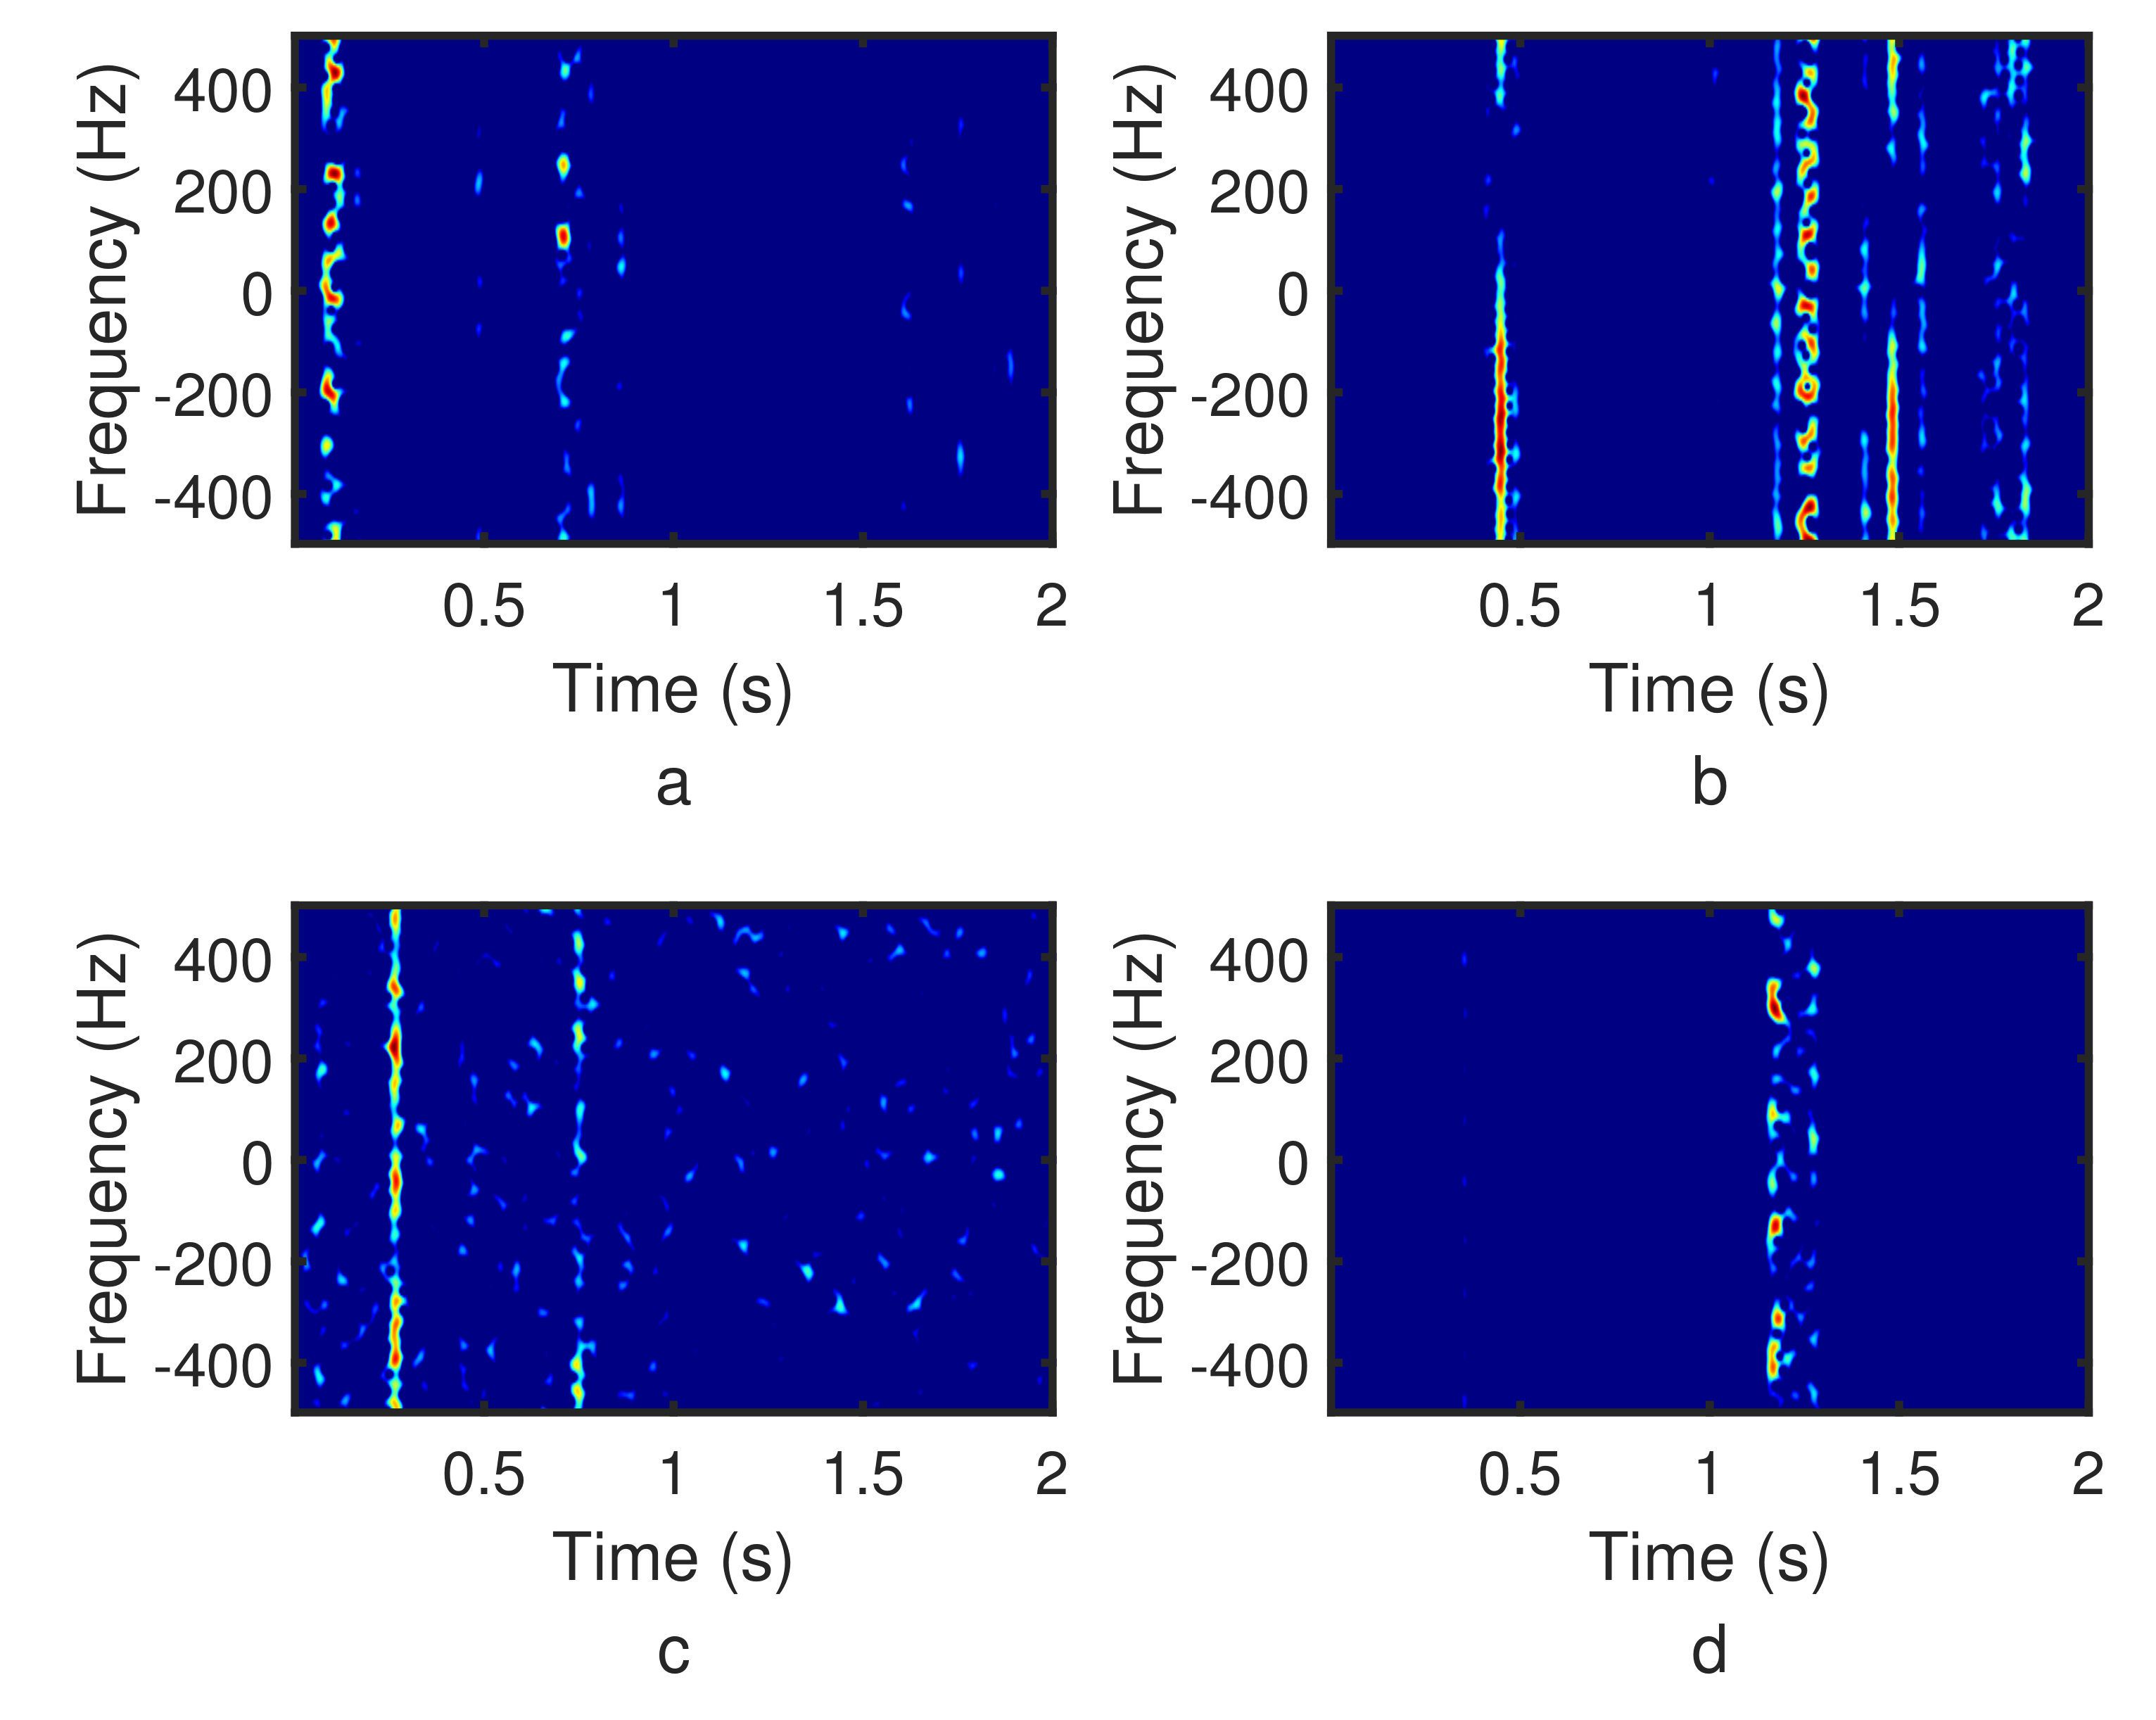
- The Choi-Williams distribution has the following expression:where denotes the input signal and and denote the vectors of the time instants and normalized frequencies, respectively. denotes the standard deviation, i.e., the square root of the variance.
- (2)
- The Margenau-Hill-Spectrogram distribution has the following expression:where denotes the short-time Fourier transform of with the analysis window .
3.2. Classification Features
3.3. Method Framework
4. Experimental Environment
5. Results and Discussion
6. Conclusions
Author Contributions
Funding
Conflicts of Interest
Abbreviations
| CSAIL | Computer Science and Artificial Intelligence Laboratory |
| CSI | Channel status information |
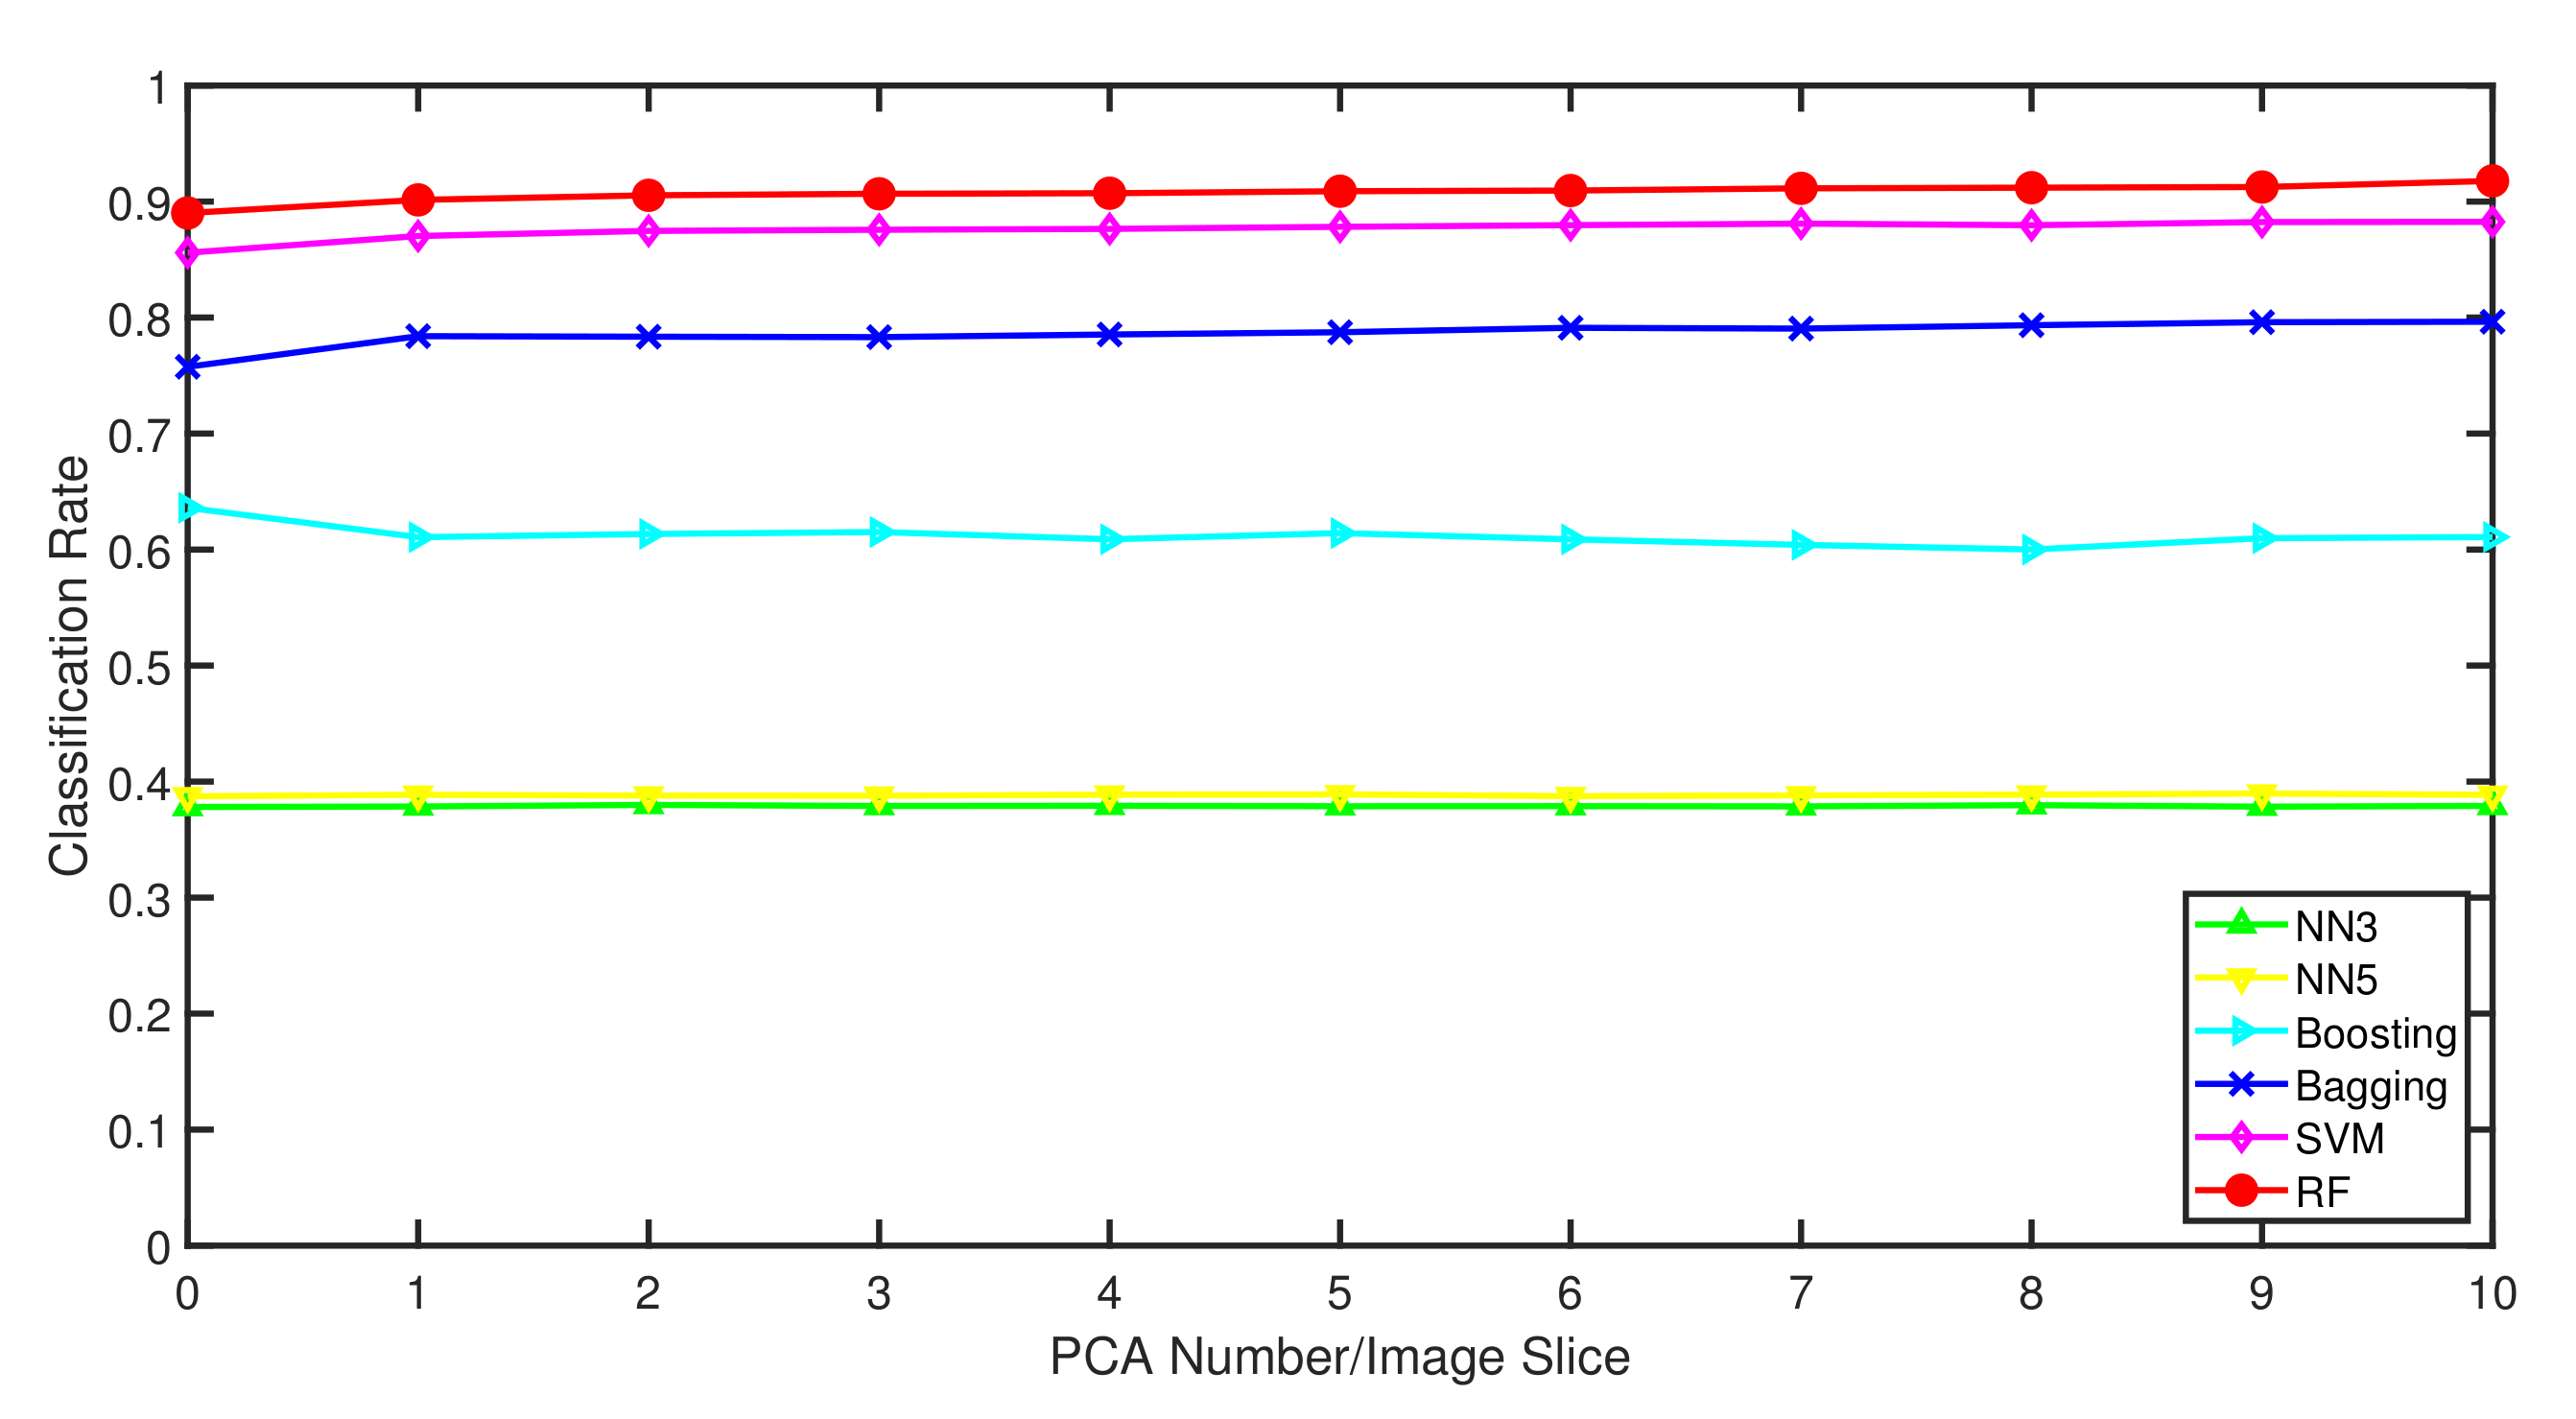
| PCA | Principal component analysis |
| RF | Random forest |
| SVM | Support vector machine |
References
- Narayana, R.M. Earthquake survivor detection using life signals from radar micro-doppler. In Proceedings of the 1st International Conference on Wireless Technologies for Humanitarian Relief, Kerala, India, 18–21 December 2011; pp. 259–264. [Google Scholar]
- Yang, Y.; Zhang, C.; Fathy, A.E. Development and implementation of ultra-wide band see-through-wall imaging system based on sampling oscilloscope. IEEE Antennas Wirel. Propag. Lett. 2008, 7, 465–468. [Google Scholar] [CrossRef]
- O’Hara, B.; Petrick, A. IEEE 802.11g Higher Data Rates in 2.4 GHz Frequency Band; Wiley-IEEE Standards Association: Hoboken, NJ, USA, 2005. [Google Scholar]
- Adib, F.; Katabi, D. See through walls with WiFi! ACM Sigcomm Comput. Commun. Rev. 2013, 43, 75–86. [Google Scholar] [CrossRef]
- Lu, Y.; Lv, S.; Wang, X.; Zhou, X. A survey on WiFi based human behavior analysis technology. Chin. J. Comput. 2019, 42, 3–23. [Google Scholar]
- Vishwakarma, S.; Ram, S.S. Detection of multiple movers based on single channel source separation of their micro-dopplers. IEEE Trans. Aerosp. Electron. Syst. 2017, 99, 159–169. [Google Scholar] [CrossRef]
- Zhou, Z.; Yang, Z.; Wu, C.; Shangguan, L.; Liu, Y. Towards omnidirectional passive human detection. In Proceedings of the 2013 Proceedings IEEE INFOCOM, Turin, Italy, 14–19 April 2013; pp. 3057–3065. [Google Scholar]
- Shi, F.; Chetty, K.; Julier, S. Passive activity classification using just WiFi probe response signals. In Proceedings of the IEEE Radar Conference (RadarConf), Boston, MA, USA, 22–26 April 2019. [Google Scholar]
- Choi, H.; Williams, W. Improved time–frequency representation of multicomponent signals using exponential kernels. IEEE Trans. Acoust. Speech Signal Process. 1989, 37, 862–871. [Google Scholar] [CrossRef]
- Hippenstiel, R.; Oliviera, P.D. Time-varying spectral estimation using the instantaneous power spectrum (IPS). IEEE Trans. Acoust. Speech Signal Process. 1990, 38, 1752–1759. [Google Scholar] [CrossRef]
- Adib, F.; Hsu, C.; Mao, H.; Katabi, D.; Durand, F. Capturing the human figure through a wall. ACM Trans. Graph. 2015, 34, 1–13. [Google Scholar] [CrossRef]
- Adib, F.; Kabelac, Z.; Katabi, D. Multi-person localization via RF body reflections. In Proceedings of the 12th USENIX Symposium on Networked Systems Design and Implementation (NSDI ’15), Oakland, CA, USA, 4–6 May 2015. [Google Scholar]
- Zeng, Y.; Pathak, P.H.; Mohapatra, P. Analyzing shopper’s behavior through WiFi signals. In Proceedings of the 2nd Workshop on Workshop on Physical Analytics, Florence, Italy, 22 May 2015. [Google Scholar]
- Zeng, Y.; Pathak, P.H.; Mohapatra, P. WiWho: WiFi-based person identification in smart spaces. In Proceedings of the ACM/IEEE International Conference on Information Processing in Sensor Networks, Vienna, Austria, 11–14 April 2016; pp. 1–12. [Google Scholar]
- Wang, W.; Liu, A.X.; Shahzad, M. Gait recognition using WiFi signals. In Proceedings of the ACM Ubiquitous Computing Conference, Heidelberg, Germany, 12–16 September 2016; pp. 363–373. [Google Scholar]
- Wang, W.; Liu, A.X.; Shahzad, M.; Ling, K.; Lu, S. Device-free human activity recognition using commercial WiFi devices. IEEE J. Sel. Areas Commun. 2017, 5, 1118–1131. [Google Scholar] [CrossRef]
- Khan, M.I.; Jan, M.A.; Muhammad, Y.; Do, D.T.; Rehman, A.U.; Mavromoustakis, C.X.; Pallis, E. Tracking vital signs of a patient using channel state information and machine learning for a smart healthcare system. In Neural Computing and Applications; Springer: Berlin/Heidelberg, Germany, 2021. [Google Scholar]
- Yuan, H.; Yang, X.; He, A.; Li, Z.; Tian, Z. Features extraction and analysis for device-free human activity recognition based on channel statement information in b5G wireless communications. EURASIP J. Wirel. Commun. Netw. 2020, 2020, 1–10. [Google Scholar] [CrossRef]
- Sharma, L.; Chao, C.; Wu, S.L.; Li, M.C. High accuracy WiFi-based human activity classification system with time–frequency diagram CNN method for different places. Sensors 2021, 21, 3797. [Google Scholar] [CrossRef] [PubMed]
- Akhtar, Z.U.A.; Wang, H. WiFi-based driver’s activity recognition using multi-layer classification. Neurocomputing 2020, 405, 12–25. [Google Scholar] [CrossRef]
- Chelli, A.; Muaaz, M.; Abdelgawwad, A.A.; Pätzold, M. Human activity recognition using Wi-Fi and machine learning. In Innovative and Intelligent Technology-Based Services for Smart Environments–Smart Sensing and Artificial Intelligence; CRC Press: Boca Raton, FL, USA, 2021; pp. 75–80. [Google Scholar]
- Muaaz, M.; Chelli, A.; Abdelgawwad, A.A.; Mallofré, A.C.; Pätzold, M. WiWeHAR: Multimodal human activity recognition using Wi-Fi and wearable sensing modalities. IEEE Access 2020, 8, 164453–164470. [Google Scholar] [CrossRef]
- Muaaz, M.; Chelli, A.; Gerdes, M.; Pätzold, M. Wi-Sense: A passive human activity recognition system using Wi-Fi and convolutional neural network and its integration in health information systems. In Annals of Telecommunications; Springer: Berlin/Heidelberg, Germany, 2021; pp. 1–13. [Google Scholar]
- Chetty, K.; Graeme, E.S.; Woodbridge, K. Through-the-wall sensing of personnel using passive bistatic WiFi radar at standoff distances. IEEE Trans. Geosci. Remote Sens. 2012, 50, 1218–1226. [Google Scholar] [CrossRef]
- Lin, Y. The Short-Time Fourier Transform based WiFi Human Activity Classifification Algorithm. In Proceedings of the International Conference on Computational Intelligence and Security(CIS), Chengdu, China, 19–22 November 2021. [Google Scholar]
- Tftb-Info. Available online: http://tftb.nongnu.org/ (accessed on 16 September 2021).
- Dobrini, D.; Gaparovi, M.; Medak, D. Sentinel-1 and 2 time-series for vegetation mapping using random forest classification: A case study of Northern Croatia. Remote Sens. 2021, 13, 2321. [Google Scholar] [CrossRef]
- Ghaffar, M.; Khan, U.S.; Iqbal, J.; Rashid, N.; Izhar, U. Improving classification performance of four class fnirs-bci using mel frequency cepstral coefficients. Infrared Phys. Technol. 2020, 112, 103589. [Google Scholar] [CrossRef]
- Asfour, M.; Menon, C.; Jiang, X. A machine learning processing pipeline for relikely hand gesture classification of FMG signals with stochastic variance. Sensors 2021, 21, 1504. [Google Scholar] [CrossRef] [PubMed]
- Lin, Y.; Kernec, J.L.; Yang, S.; Fioranelli, F.; Romain, O.; Zhao, Z. Human activity classification with radar: Optimization and noise robustness with iterative convolutional neural networks followed with random forests. IEEE Sens. J. 2018, 18, 9669–9681. [Google Scholar] [CrossRef] [Green Version]
- Permanasasi, Y.; Falah, A.N.; Marethi, I.; Ruchjana, B.N. PCA and projection pursuits on high dimensional data reduction. J. Phys. Conf. Ser. 2021, 1722, 012087. [Google Scholar] [CrossRef]
- Clarenz, U.; Rumpf, M.; Telea, A. Robust feature detection and local classification for surfaces based on moment analysis. IEEE Trans. Vis. Comput. Graph. 2004, 10, 516–524. [Google Scholar] [CrossRef] [Green Version]
- Qing, Y.; Liu, W. Hyperspectral image classification based on multi-scale residual network with attention mechanism. Remote Sens. 2021, 13, 335. [Google Scholar] [CrossRef]
- Gao, L.; Hong, D.; Yao, J.; Zhang, B.; Gamba, P.; Chanussot, J. Spectral superresolution of multispectral imagery with joint sparse and low-rank learning. IEEE Trans. Geosci. Remote Sens. 2020, 59, 2269–2280. [Google Scholar] [CrossRef]
- Bettini, C.; Civitarese, G.; Presotto, R. Personalized semi-supervised federated learning for human activity recognition. arXiv 2021, arXiv:2104.08094. [Google Scholar]
- Subasi, A.; Fllatah, A.; Alzobidi, K.; Brahimi, T.; Sarirete, A. Smartphone-based human activity recognition using bagging and boosting. Procedia Comput. Sci. 2019, 163, 54–61. [Google Scholar] [CrossRef]
- Tarafdara, P.; Bose, I. Recognition of human activities for wellness management using a smartphone and a smartwatch: A boosting approach. Decis. Support Syst. 2021, 140, 113426. [Google Scholar] [CrossRef]
- Gajowniczek, K.; Grzegorczyk, I.; Ząbkowski, T.; Bajaj, C. Weighted random forests to improve arrhythmia classification. Electronics 2020, 9, 99. [Google Scholar] [CrossRef] [Green Version]
- Mostafa, M.; Chamaani, S. Unobtrusive Human Activity Classification Based on Combined Time-Range and Time-Requency Domain Signatures Using Ultrawideband Radar. IET Signal Process. 2021, 15, 543–561. [Google Scholar] [CrossRef]
- Gonçalves, P.J.; Lourenço, B.; Santos, S.; Barlogis, R.; Misson, A. Computer vision intelligent approaches to extract human pose and its activity from image sequences. Electronics 2020, 9, 159. [Google Scholar] [CrossRef] [Green Version]


| Marching-in-Place | Rope Skipping | Arms Rotating | Idle | |
|---|---|---|---|---|
| Marching-in-place | 834 | 55 | 2 | 8 |
| Rope skipping | 93 | 738 | 58 | 11 |
| Arms rotating | 2 | 40 | 857 | 2 |
| Idle | 6 | 18 | 1 | 875 |
| Marching-in-Place | Rope Skipping | Arms Rotating | Idle | |
|---|---|---|---|---|
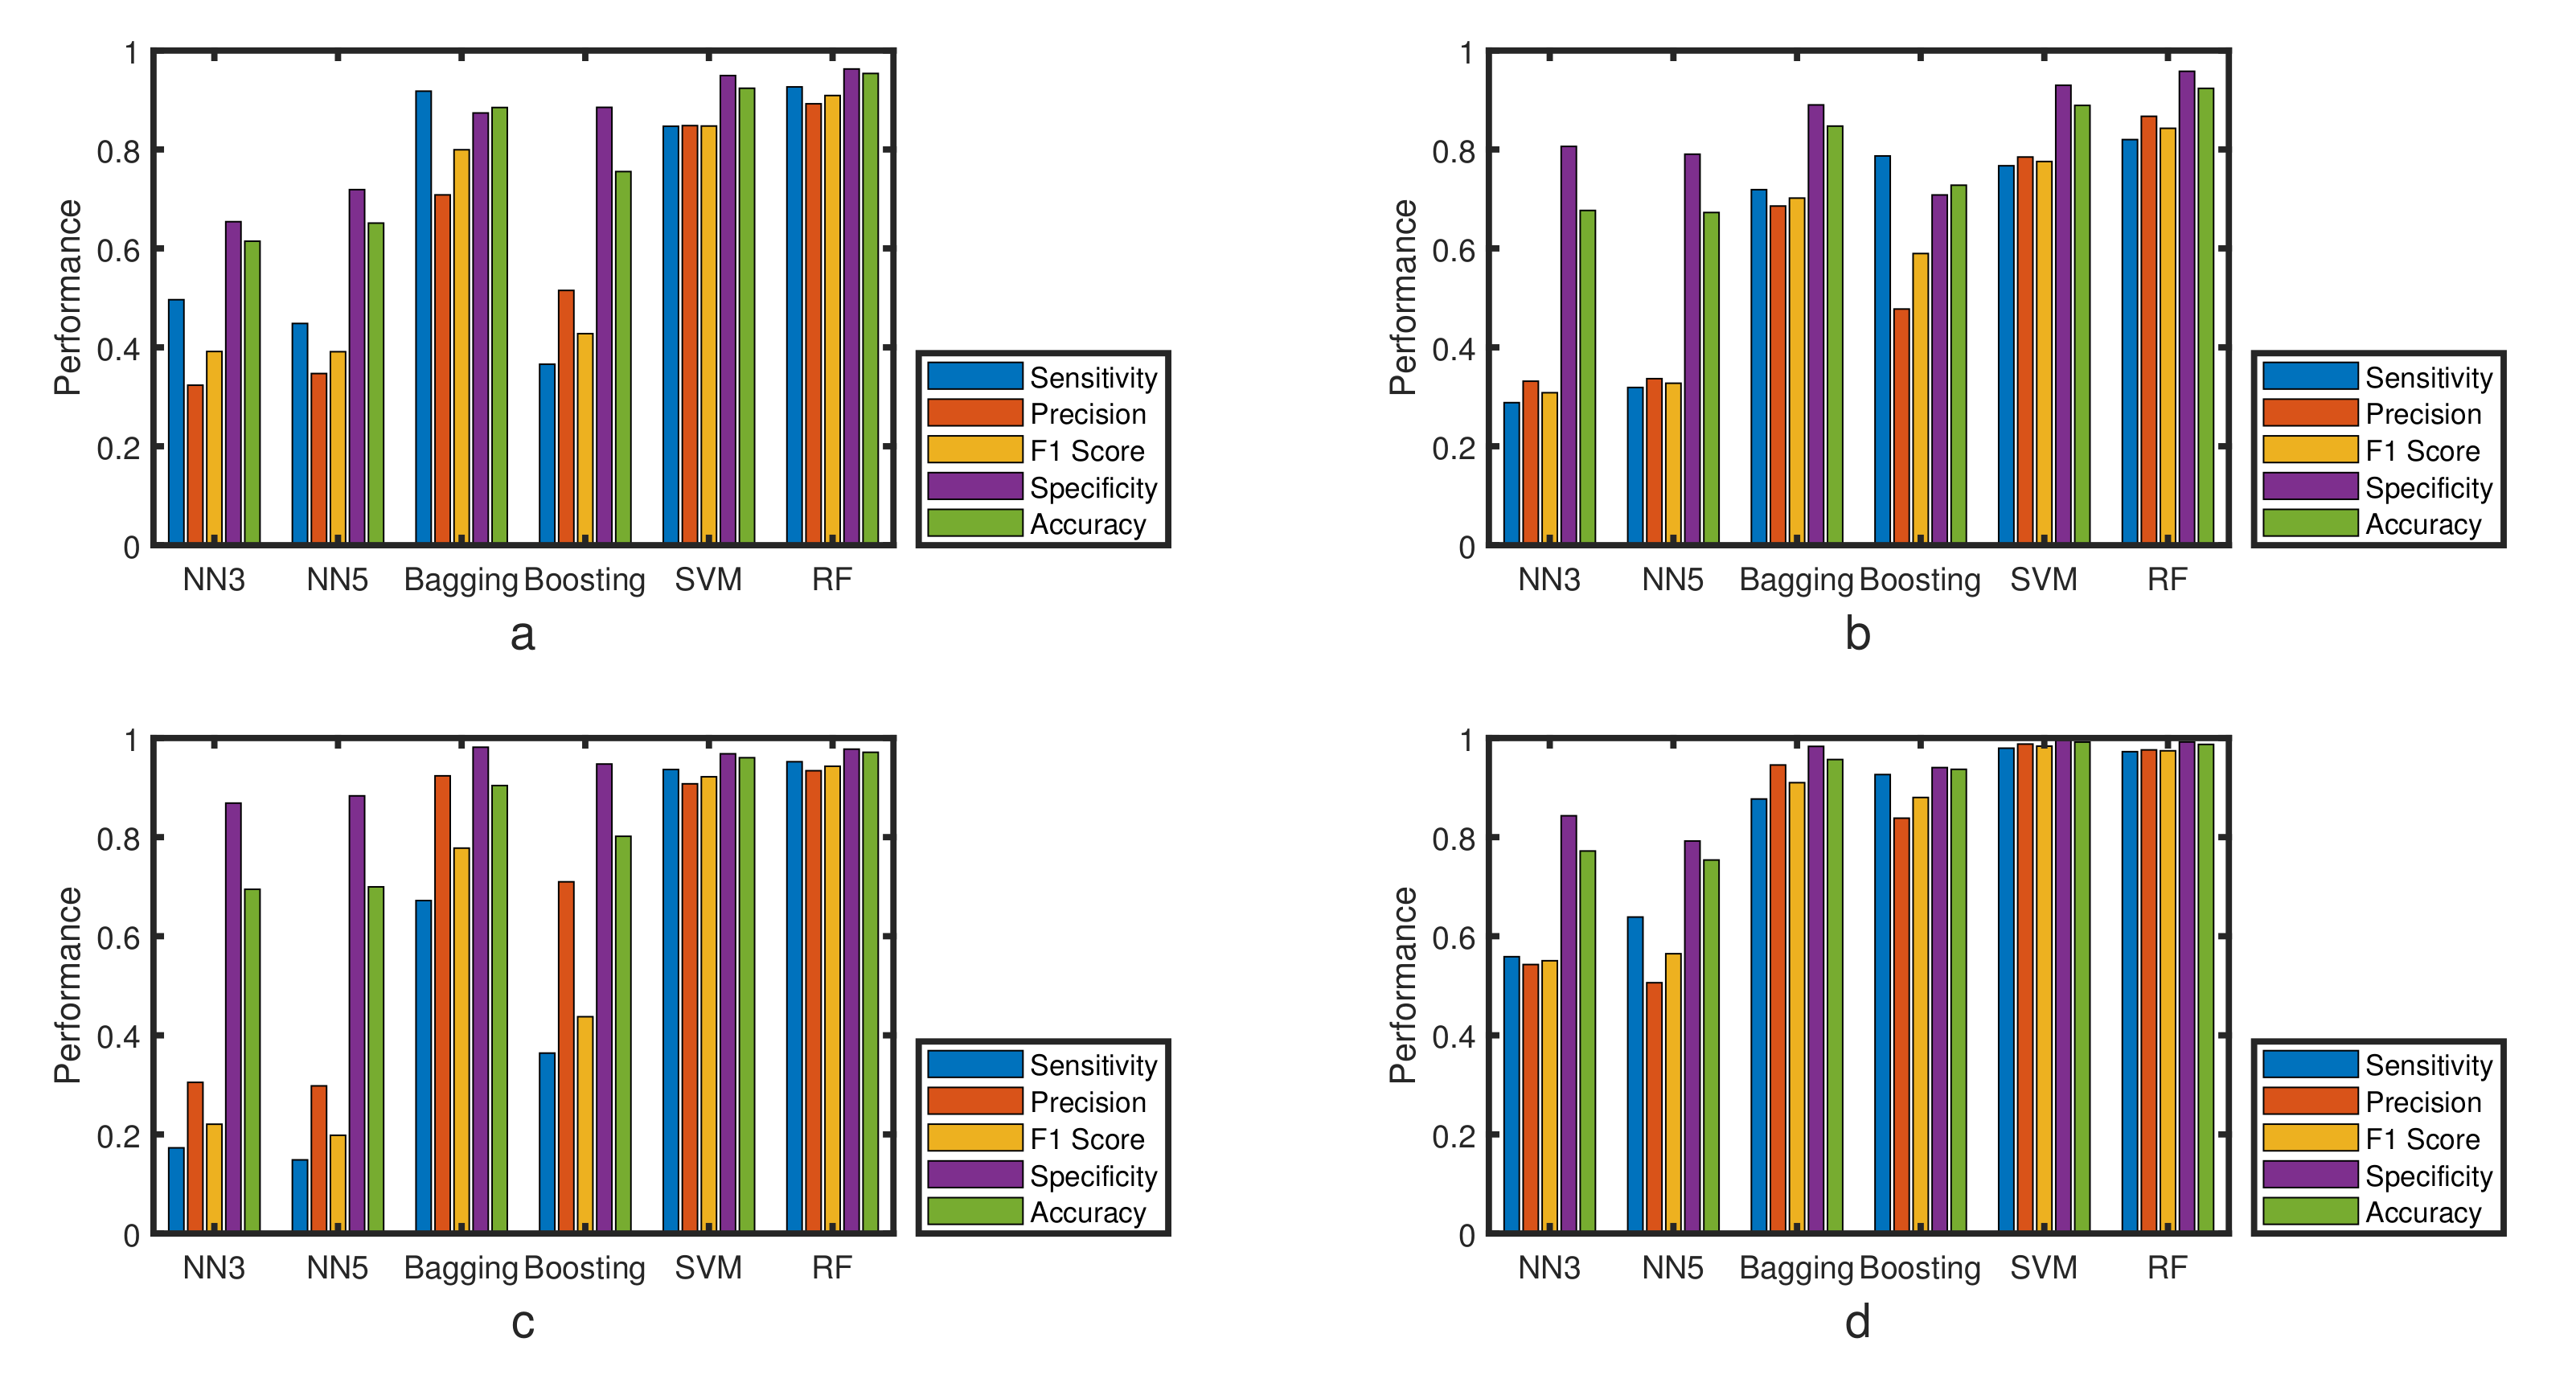
| Sensitivity | 92.65% | 82.00% | 95.22% | 97.25% |
| Precision | 89.24% | 86.71% | 93.40% | 97.61% |
| F1-Score | 90.91% | 84.28% | 94.30% | 97.42% |
| Specificity | 96.27% | 95.81% | 97.76% | 99.20% |
| Accuracy | 95.37% | 92.35% | 97.12% | 98.71% |
Publisher’s Note: MDPI stays neutral with regard to jurisdictional claims in published maps and institutional affiliations. |
© 2021 by the authors. Licensee MDPI, Basel, Switzerland. This article is an open access article distributed under the terms and conditions of the Creative Commons Attribution (CC BY) license (https://creativecommons.org/licenses/by/4.0/).
Share and Cite
Lin, Y.; Yang, F. IQ-Data-Based WiFi Signal Classification Algorithm Using the Choi-Williams and Margenau-Hill-Spectrogram Features: A Case in Human Activity Recognition. Electronics 2021, 10, 2368. https://doi.org/10.3390/electronics10192368
Lin Y, Yang F. IQ-Data-Based WiFi Signal Classification Algorithm Using the Choi-Williams and Margenau-Hill-Spectrogram Features: A Case in Human Activity Recognition. Electronics. 2021; 10(19):2368. https://doi.org/10.3390/electronics10192368
Chicago/Turabian StyleLin, Yier, and Fan Yang. 2021. "IQ-Data-Based WiFi Signal Classification Algorithm Using the Choi-Williams and Margenau-Hill-Spectrogram Features: A Case in Human Activity Recognition" Electronics 10, no. 19: 2368. https://doi.org/10.3390/electronics10192368
APA StyleLin, Y., & Yang, F. (2021). IQ-Data-Based WiFi Signal Classification Algorithm Using the Choi-Williams and Margenau-Hill-Spectrogram Features: A Case in Human Activity Recognition. Electronics, 10(19), 2368. https://doi.org/10.3390/electronics10192368