1. Introduction
Cosmetic preparations are products used to preserve and improve the state of health of the human skin by using specific formulations, consisting of a variety of chemical and organic compounds [
1,
2,
3,
4] Preparations are available in different physical forms: aqueous, dough, oily, alcoholic, creamy, gel, emulgel, and milky. Cosmetic mixtures contain not only the active substances, but also excipients such as pH correctors, preservatives, cosmetic dyes and natural pigments, stabilizers, and flavoring agents [
1,
2,
3,
5]
Quality Control (QC) tests should be performed by cosmetic manufacturers at every level of production, from the purchasing of raw materials to the packaged product. Integrated quality control during the manufacturing process guarantees quality at every step [
6,
7,
8]. QC includes environmental control, which is essential to maintain the compliance and value of the product and avoid potential contamination. Cosmetic producers are required to comply with the principles of Guidelines on Good Manufacturing Practices (GMP), reported in the International Organization for Standardization (ISO) standard DS/EN ISO 22716:2007, which comprises all aspects of production, control, storage, and shipment of cosmetics [
6,
7,
8,
9,
10]. The main goal of GMP is to define the criteria for cosmetic products, in order to ensure the safety and the protection of the consumer [
6,
7,
8,
11]. Other important indications are defined by guidelines and generic regulation of each country, such as the guidelines from the Food and Drug Administration (FDA) and the Personal Care Products Council (PCPC), respectively, for American and British countries, and EC regulations 1223/2009 and the previous 87/357/EEC directive for European countries [
4,
6,
7,
8].
According to GMP, cosmetic products are not necessarily sterile, but contain neither injurious nor pathogenic organisms. A low, but stable microbiological population may be present, but not interfering over the product’s lifetime [
3,
4,
6,
7,
8,
12].
To meet the required conditions, microbiological analyses of raw materials, bulk and finished products, packaging, personnel, equipment, and preparation and storage rooms are mandatory [
9,
13,
14,
15,
16,
17].
Moreover, producers must provide information supporting the microbiological stability of the products, which are essential to demonstrate the overall stability of the product within its lifetime [
18,
19,
20].
Raw materials can contribute significantly in the microbial contamination of the finished product, especially those of natural origin; therefore, analysis of microbiological compliance is essential: many components are complex mixtures of natural ingredients, chemical substances and oligomers, which are particularly vulnerable to bacterial degradation [
3,
13,
14,
21]. Particular attention is paid to water, the main raw material used in most cosmetics. It is necessary to consider its microbiological characteristics, in order to reduce the bacteriological load [
14,
22,
23,
24].
The ability of microorganisms to grow in cosmetics is common, especially in water-based products, which are commonly characterized by limited durability. To overcome such limitations, the use of preservatives in the formulations, such as salts (such as sodium chloride, sodium polyacrylate), alcohols and polyols (such as glycerol, ethoxydiglycerol, ethyl alcohol), isothiazolinone (such as chloromethylisothiazolinone), and acids (such as sorbic, benzoic, salicylic, citric) is a common expedient to reduce microbial growth and guarantee stability over time. To verify the effectiveness of preservatives in cosmetic products, the challenge test is usually performed during the manufacture; in this way, the correct amount and type of preservatives are included in the formulations. Preservatives need to be safe, compatible with all ingredients, soluble, and well-dispersed to optimize preservation. The goal is to use the lowest possible concentration to obtain ideal efficacy, avoiding any safety issues associated with a particular preservative.
Preservative resistance may be considered as the inactivation of the preservative agent, the reduction in preservative efficacy, or tolerance of microorganisms. To avoid this limitation, the development of new antimicrobials is crucial to fight resistance phenomena, and is becoming a new topic issue [
5,
9,
15,
22,
25,
26].
Beyond the contamination of raw materials, a multitude of manufacturer-dependent variables may affect the final product’s quality, such as preparation in unclean areas, insufficient hygiene during storage, and insufficient preservation. Therefore, overall cleanliness is essential [
2,
6,
7,
8,
22].
Microbiological risk analyses are comprehensive considerations about type of user, site of application, potential alteration of the cosmetic over time, as well as the pathogenicity of its potential present microorganisms [
6,
7,
8,
9,
10,
11]. Microbiological risk analysis is related to the presence of pathogens and opportunistic microorganisms such as
Staphylococcus aureus, Pseudomonas aeruginosa, Candida albicans, Klebsiella pneumoniae, and
Escherichia coli: since such bacteria are harmful, especially in cosmetic products intended for the eye area, their presence must be evaluated by the producer and fulfill regulations for the specific intended use. They must not be detectable in either 0.5 g or 0.5 mL of a Category 1 cosmetic (specifically intended for children under three years, eye area, and mucous membranes) or in 0.1 g or 0.1 mL if Category 2 cosmetic (other products) [
2,
19,
27,
28,
29,
30,
31,
32,
33].
According to EC 1223/2009 and trade associations such as the European Cosmetic Toiletry and Perfumery Association (COLIPRA) and FDA for cosmetic production, Microbiological Quality Management (MQM) is mandatory to produce safe products [
4,
6,
7,
10,
22].
The gold-standard in the assessment of both microbiological contaminants and quality control of preservation systems in cosmetics is the plate count method. Test samples are incubated on different media and at different conditions, according to specific ISO or harmonized Pharmacopoeia methods. The number of viable pathogens existent in the native suspension is determined by the count on agar plates, which gives the concentration in terms of CFU/g or /mL (colony forming units) as output [
1,
3,
4,
6,
7,
8].
The acceptance criteria for every product depends of the category of preparation, according to the harmonized Pharmacopoeia or international organization’s guidelines (such as FDA for American countries, CTPA for British countries, COLIPA for European countries, and Unione Nazionale Industrie di Profumeria (UNIPRO) and ISO 17516: Cosmetics—Microbiology—Microbiological limits for Italy) [
4,
6,
7,
8].
In the cosmetic field, the search for new biological molecules is a now hot topic. Many biocompounds are predominantly bacteria- and fungi-derived. Cosmetic formulations involving compounds derived from bacteria, fungi, and algae represent cheap, renewable, and novel sources compared to classical chemical substances.
In this case, the presence of microorganisms in the cosmetic’s formulation is essential; therefore, quality control evaluation will focus on other aspects; for example, characterization of their vitality.
The extensive range of probiotics or good bacteria in a live state or as ferments or lysates as ingredients in cosmetic products is a new trend in cosmetic production. Live bacteria are used as biotherapeutic biological drugs where the active ingredients are probiotics.
Some of the probiotic cosmetic products produced today contain Lactobacillus or Bacillus genus bacteria as an ingredient, which are part of the skin microbiome. For example, by decreasing the counts of
Propionibacterium acnes on the surface of the skin, probiotics target one factor contributing to acne formation. In vitro,
Streptococcus salivarius has been shown to prevent the growth of
Propionibacterium acnes and group A Streptococci. Similarly, strains of
Lactococcus spp. showed antimicrobial activity anti-
Staphylococcus epidermidis,
Staphylococcus aureus,
Streptococcus pyogenes, and
Propionibacterium acnes activity through the secretion of bacteriocins [
34,
35,
36,
37].
Some probiotic lysates, such as
Lactobacillus rhamnosus,
Lactobacillus reuteri, or
Bifidobacterium longum, can be used as a topical application to improve or restore the skin’s barrier function. Topical application of the bacterial lysate as part of a cosmetic composition is also employed in
Staphylococcus infections. In this case, the presence of bacteria in cosmetic productions increases and restores the barrier function of keratinocytes or other injuries [
38,
39,
40,
41].
Microorganisms are composed of fatty acids, enzymes, peptides, vitamins, lipopolysaccharides, and pigments with beneficial properties. Biomolecules, such as ceramides, mycosporine, carotenoids, omega−3, 6, and 9, have seen enormous application in the cosmetic industry. The major advantage of using microbial ingredients is their biocompatibility. Bacterial oligosaccharides, exopolysaccharides (EPS), biosurfactants, enzymes, peptides, and vitamins are the major molecules that are exploited. Other potential products are from fungi with a special application for skin care, antioxidants, and hair products. Fungi are rich in secondary metabolites known to have various advantageous properties.
Candida albicans,
Agaricus bisporus, and
Armillaria tabescens are usually employed in the production of glycosyl-ceramides, while other yeasts, such as
Saccharomyces cerevisiae, are optimal sources of ceramides [
42,
43,
44,
45,
46].
Molecular biology analyses now represent a frontier in microbiology [
47,
48,
49,
50]. Nucleic acid extraction followed by qPCR allows higher sensitivity, up to 0.01%, and a reduced workflow that yields an analytical result in about four hours from sampling, in opposition to the traditional plate count method that is labor intensive and requires days [
32,
51,
52,
53,
54,
55,
56,
57,
58]. The reduction in time and the increase in sensitivity allow serial microbiological testing over time and at all time-points during manufacturing, in opposition to the current actual gold standard that—due to its intrinsic limits—can be performed far less frequently and is not applicable to all phases of production.
DNA-based methods cannot unequivocally differentiate between living and dead cells. DNA from dead cells is indistinguishable from the DNA of living cells, but its identification is important in certain contexts, such as the quality control assessment proposed. Therefore, DNA-based approaches can overestimate the types and numbers of viable microorganisms. This is especially true for pathogen detection, cleanliness estimations, bioburden analysis, and antibiotic susceptibility testing. The genetic identification of an intact, functional cell membrane, the presence of cellular metabolism, or the possession of self-replicating DNA that can be transcribed into RNA, could overcome the limitation of traditional molecular tests and can be implemented in a qPCR workflow.
The proposed molecular-based workflow has seen limited use in common practice due to the complexity of cosmetic compositions and the few standardized DNA extraction protocols from cosmetics [
23,
30,
31,
49,
59]. Commercial kits are not suitable for complex matrices, and they have been rarely compared in a comprehensive manner. The prerequisite to successfully identify bacterial DNA by qPCR depends on the ability to obtain sufficient and high-quality material for the subsequent amplification and quantitation [
24,
29,
30,
32,
33,
60,
61,
62]. The design of new methods for microbiological Quality Control in cosmetic production requires testing and comparison of different extraction methods for any possible type of raw material and mixtures, in terms of yield, purity, and integrity of bacterial DNA.
The main objective of the present study is to provide preliminary evidence of the application of a molecular approach to extract and analyze DNA from cosmetics for microbiological quality control, thus bypassing the plate method. Plate count is operator-dependent and affected by the microorganisms’ status and the composition of the cosmetic sample and its preservatives; more importantly, it cannot lead to any timely corrective action with a secondary level exam [
5,
9,
22,
51,
52,
62].
In this study, we firstly optimized an efficient method for bacterial DNA extraction from cosmetic matrices using spiked samples. A subsequent real-time qPCR assay has been designed for the rapid detection and characterization of the extracted microbiological contaminants, both probiotics and pathogens.
2. Materials and Methods
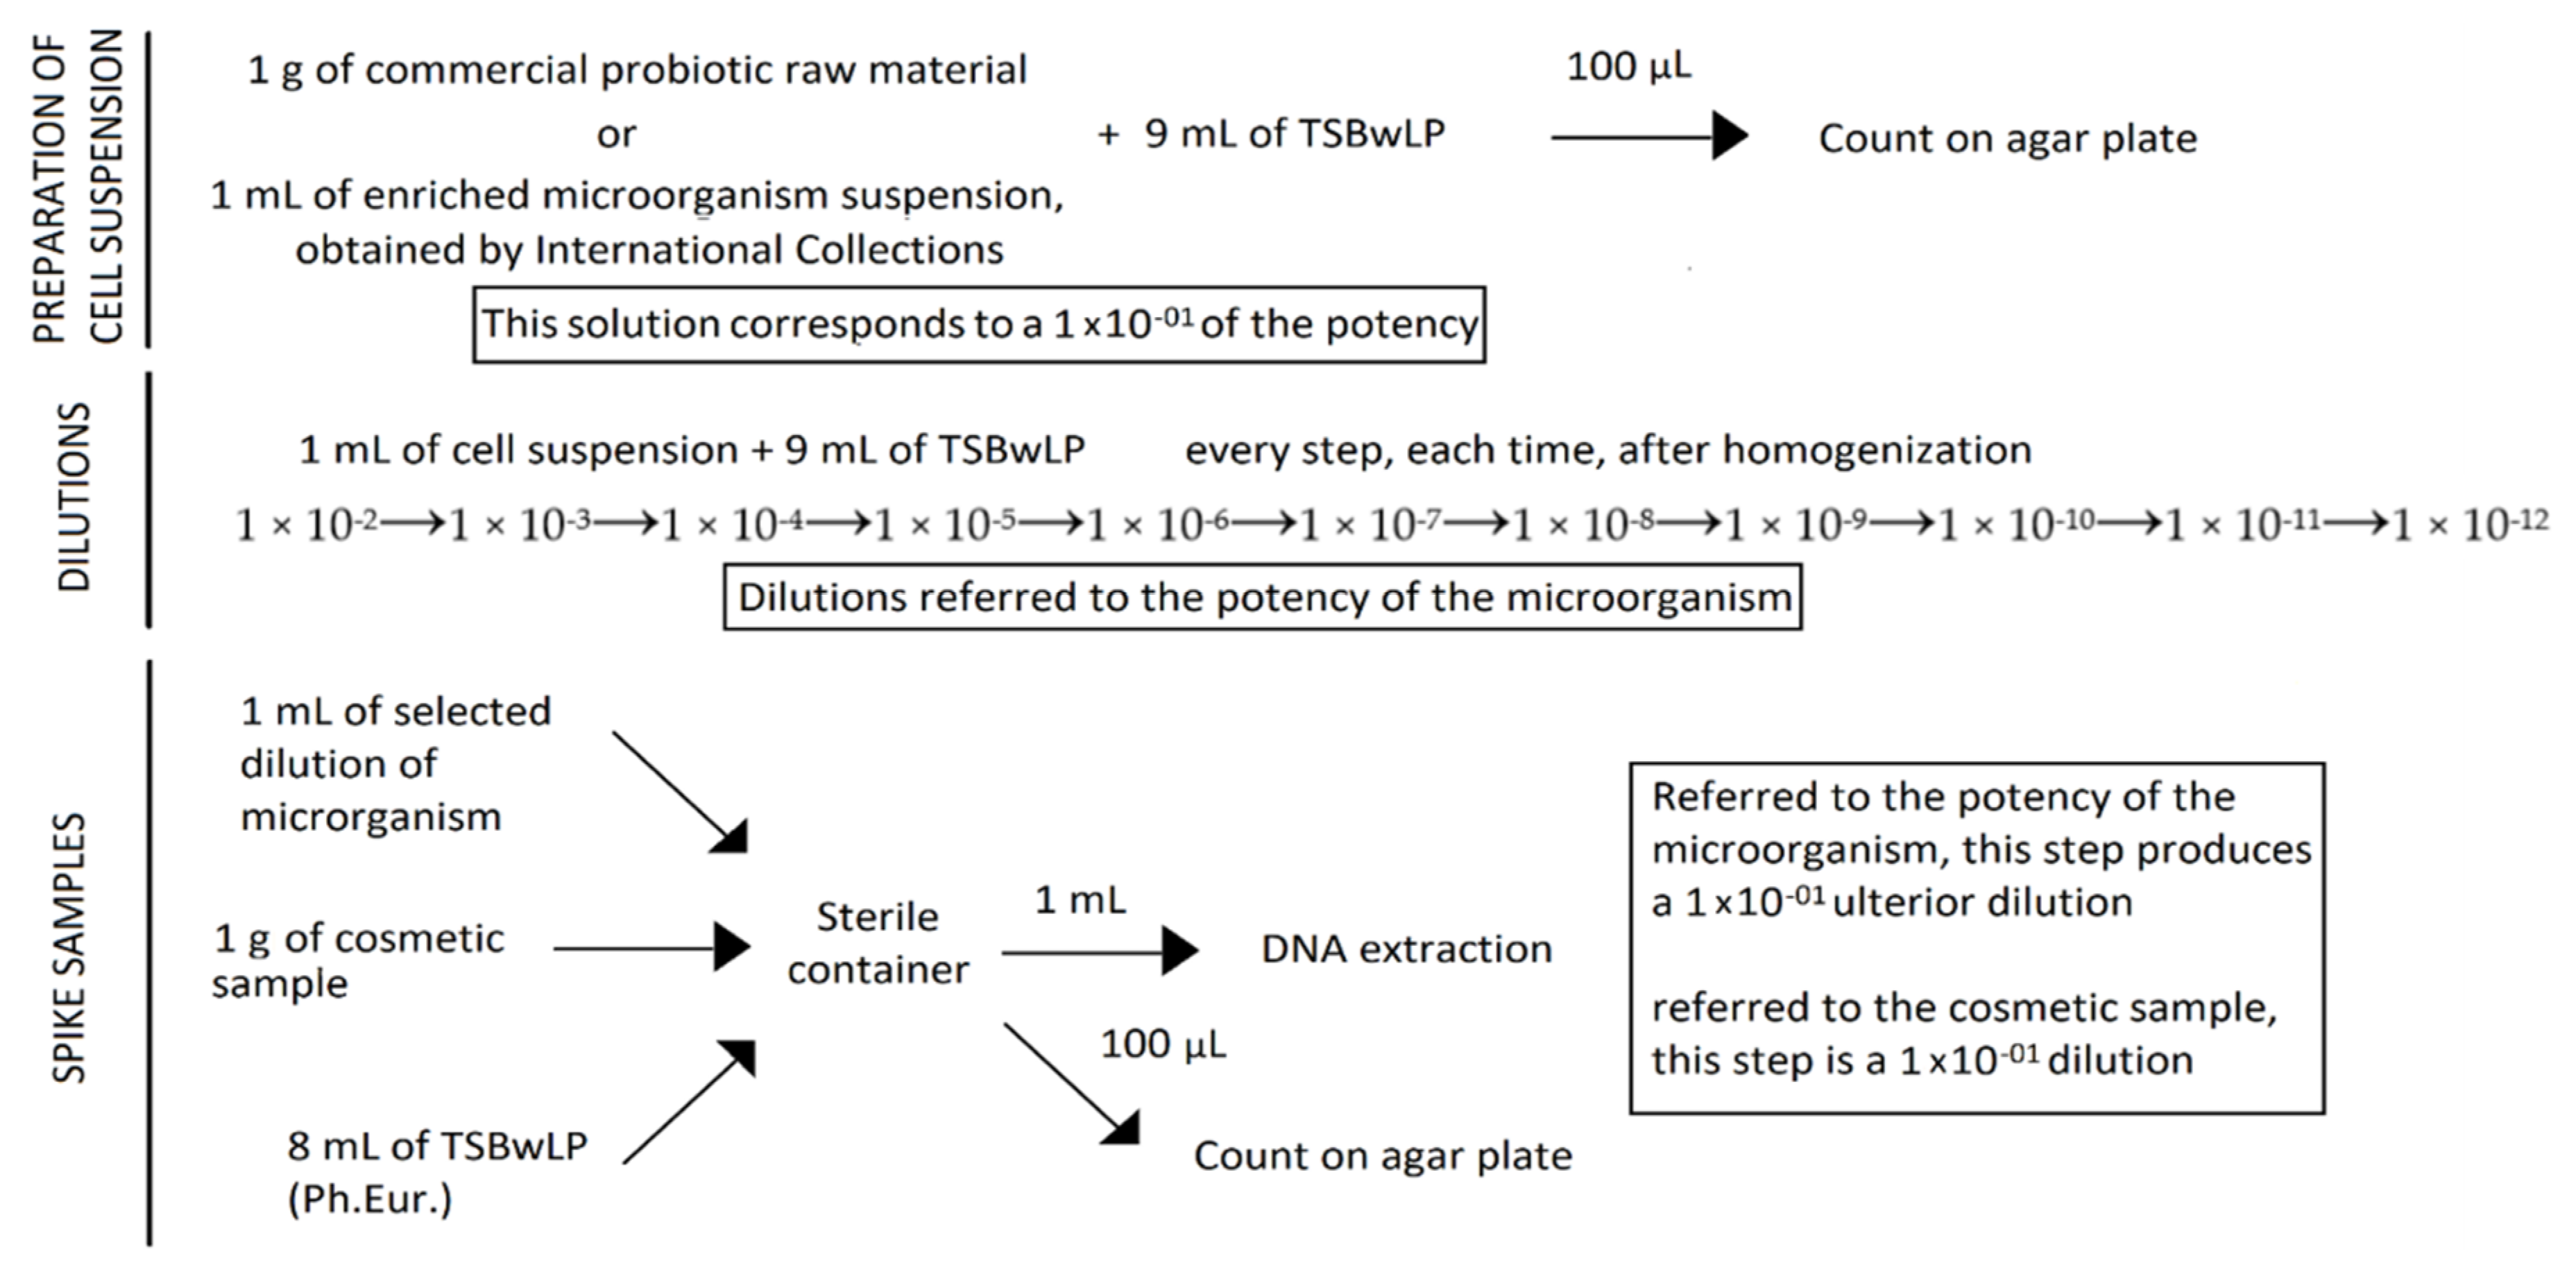
2.1. Mixture Components and Microorganisms Used in Spiked Samples Experiments
Cosmetics used in this study are anonymized commercial formulations of different brands and producers, with different compositions of natural ingredients (jojoba oil, avocado oil, sunflower oil, hyaluronic acid), glycerin, minerals (sodium chloride, malachite, bentonite), amino acids, preservatives and other excipients. The final formulations appeared in different physical forms, such as aqueous, paste, solid-state compact, oily, creamy, and milky. The physical parameters and the specifications of the cosmetics employed are reported in
Table 1.
Spiked samples experiments were conducted using three different cell types: the probiotic Gram positive bacteria Lactobacillus rhamnosus, an Escherichia coli commercial strain representative of a Gram negative pathogen, and Candida albicans yeast cells. Lactobacillus rhamnosus was selected due to its high resistance to cleaning procedures and its safety during experiment development. Considering the extensive range of probiotics employed as active ingredients in cosmetic products, we selected a representative one to conduct our preliminary experiments; then to go more in-depth into the method’s applications, using two commercial strains of pathogens important in quality control assessment. These two microorganisms were tested together to observe the performance of each kit in presence of different types of cells. The results of the plate count method were: Lactobacillus rhamnosus 7.82 × 10¹¹ CFU/g (declared 4.50 × 10¹¹ CFU/g), Candida albicans 5.00 × 10⁷ CFU/g, Escherichia coli 4.92 × 10⁷ CFU/g.
All information regarding the category and the number of spiked cells inserted in cosmetics are shown in
Table 2.
2.2. In Vitro Spike-in Samples Preparation
A total of six cosmetic samples were spiked-in with known numbers of Lactobacillus rhamnosus from consecutive dilutions, from 10−2 to 10−12. Escherichia coli and Candida albicans cells, considering their low growth on plates, were spiked-in to the cosmetic samples at the concentration of 10 × 104 cells for each strain.
The probiotic mixture, with a potency of 4.50 × 10¹¹ CFU/g, was prepared by mixing 1 g of probiotic raw material powder with 9 mL of dilution broth—Tryptic Soy Broth with Lecithine Polysorbate 80 (TSBwLP)—a media described by the European Pharmacopoeia, and homogenized. In a new container, 1 g of each cosmetic sample was diluted with 8 mL of TSBwLP and spiked-in with 1 mL of the previous probiotic solution, corresponding to a 1 × 10⁻¹ dilution. Serial consecutive dilutions, from 10−2 to 10−12 (compared to the potency of the probiotic raw material) were carried out in order to evaluate the Limit of Detection (LOD) of the method and sensitivity. Noncontaminated samples were prepared as a blank control to define specificity: 1 g of cosmetic sample was added to 9 mL of TSBwLP and homogenized. For each spiked sample, the six highest dilutions (from 10−7 to 10−12) were subjected to DNA extraction.
Regarding pathogen-spiked samples, 1 mL of enriched broth containing 10 × 10
4 Escherichia coli and 1 mL containing 10 × 10
4 Candida albicans cells, were loaded in 1 g of each cosmetic sample and diluted in 7 mL of TSBwLP, in order to create a contaminated mixed samples (
Figure 1).
For each spiked sample, one set of reconstituted samples with the same dilution was subjected to DNA extraction with all the kits tested for Lactobacillus rhamnosus, Escherichia coli, and Candida albicans. Moreover, the highest dilutions and the first dilution over the last dilution, referred to the potency of Lactobacillus rhamnosus, Escherichia coli, and Candida albicans, were subjected to DNA extraction with the kits from the first tests.
Noncontaminated samples composed of 1 g of cosmetic sample in 9 mL of TSBwLP were prepared in order to evaluated any possible interference derived from the matrix.
2.3. DNA Extraction and Purification Methods
Initially, DNA was extracted with seven commercial kits from 1 mL of spiked samples containing the theoretical amount of 10 × 109 cells in the case of Lactobacillus rhamnosus (dilution 10−2) and from 1 mL of mixed pathogen-spiked samples containing about 5 × 10³ Escherichia coli and 5 × 10³ Candida albicans cells, created as described in the previous paragraph (2.2). The seven methodologies selected had the advantage of different approaches for cell lysis. We tested one magnetic beadstrategy kit: Invitrogen MagMax Microbiome Ultra Nucleic Acid Isolation kit; four kits based on mechanic cell lysis: the Zymo Research Quick DNA Fungal Bacterial DNA kit, the Qiagen DNeasy Power Soil kit, the Zymo Research ZymoBiomics, and the Omega Biotek E.Z.N.A. Food kit; two commercial extraction kits based on an enzymatic membrane digestion: Invitrogen PureLink Genomic kit and Qiagen QIAmp mini DNA. The Omega Biotek E.Z.N.A. Food kit was not tested on mixed spiked samples.
The DNeasy Power Soil kit was also tested in automation, using the Qiacube Connect instrument (Qiagen), on pathogen-spiked samples.
All protocols were carried out using the manufacturers’ recommendations for soil, stool, and difficult samples. No guidelines for cosmetic applications were available.
The volume of extraction and the elution solution were chosen according to the producer’s instruction.
After extraction and purification, all DNA from the 10 × 109 Lactobacillus-spiked samples, and from the 10 × 104 Escherichia coli and Candida albicans mixed samples were quantified by spectrophotometer (Nanodrop ND−100 ThermoFisher) and profiled by real time qPCR using specific primers for each strain: Lactobacillus rhamnosus: FW−5′- CGGCTGGATCACCTCCTTT–3′, RV−5′–GCTTGAGGGTAATCCCCTCAA–3′; Escherichia coli: FW−5′-GCAGTCTTACTTCCATGATTTCTTTA−3′, RV−5′-ATGCGAGGTACGGTAGG−3′ and Candida albicans: FW−5′-TTTATCAACTTGTCACACCAGA−3′, RV−5′-GGTCAAAGTTTGAAGATATACGT−3′.
The three methods with the best recovery and purity were also tested on the other Lactobacillus rhamnosus spiked-in dilutions, from 10−7 to 10−12. Only samples 2, 3, and 5 were selected to define the limit of detection and the sensibility of our designed protocol. We decide to restrict our investigations to the most complex and hardest products to analyze. Sample 2 was selected for the high salt content and the low percentage of water; sample 3 represented a standard formulation for cosmetics where aqueous and fatty components are approximately 6–70%, and sample 5 showed strong oily and fat components with known problems for probiotic recovery.
2.4. Real-Time Quantitative PCR
A real time qPCR amplification was employed to detect the yield of the above-mentioned methods of extracting DNA. All the reagents required for quantitative PCR were combined in a master mix (Universal SYBR Green Master Mix; Roche, Basel, Switzerland), including specific primers for Lactobacillus rhamnosus, Escherichia coli, and Candida albicans. In total, 14 μL aliquots of this PCR mixture and 1 μL of extracted DNA were dispensed in a 96-well plate. The following amplification program was applied: one cycle of 3 min at 95 °C for denaturation, followed by 40 cycles (30 s at 95 °C for denaturation, 30 s at 60 °C for annealing, 30 s at 72 °C for extension), and a final 5 min extension at 72 °C. qPCR and analyses were performed employing the LightCycler 480 (Roche, Basel, Switzerland) instrument. For each amplification reaction, the melting temperature (Tm) and cycle threshold (Ct) values were computed. The cycle threshold is defined as the fractional cycle number in the log-linear region of PCR amplification in which the reaction reaches fixed amounts of amplicon DNA. For the absolute quantification of DNA copies, a standard curve composed of points representative of different concentrations was built. The detection limit of real-time qPCR was determined by the lowest concentration tested: 10−11, containing seven theoretical cell of Lactobacillus rhamnosus. The specificity and the threshold signal were defined using the 10−12 blank sample for Lactobacillus rhamnosus.
2.5. Standard Curve Creation
Linear regressions, specific for each strain tested, Lactobacillus rhamnosus, Escherichia coli, and Candida albicans, were built using first the LightCycler480 software and then validated with the R software package (R Core Team 2013). The standard curve was constructed derived from the cycle threshold values (Ct) of the serial dilutions of Lactobacillus rhamnosus (from 10 × 1011 to 10 cells), Escherichia coli (from 10 × 107 to 10 cells), and Candida albicans (from 10 × 107 to 10 cells).
Concentrations were expressed in arbitrary units (AI). Logarithms (base 10) of concentrations were plotted against crossing points. The optimal threshold was chosen automatically by the software. The script examined different threshold positions, calculating the coefficient of determination (R
2) for each resulting standard curve. The maximum coefficient of determination pointed to the optimal threshold (typically the maximum R
2 was larger than 99%). The optimal threshold was used in order to calculate Ct for unknown samples obtained by the extractions. Means were calculated for Cts in qPCR replicates. Values referring to 10 × 10
11 cells and 10 were excluded from the analysis, because out of the linearity range. The standard curve equations were:
2.6. Plate Count as Reference for Quantitation
From appropriate dilutions, 100 µL of Lactobacillus rhamnosus suspension was inoculated on petri plates containing de Man, Rogosa, Sharpe agar (MRS, Biolife), augmented with 0.05% L-cystein HCl (Sigma Aldrich), in duplicate. Plates were incubated at 37 ± 2 °C for 48–72 hours in anaerobiosis. For Escherichia coli, 100 µL was inoculated on petri plates containing Mac Conkey Agar (MCK, Biolife) in duplicate, and incubated at 35 °C ± 2 °C for 48–72 hours in aerobiosis. In the same way, 100 µL of Candida albicans cell suspension were inoculated on petri plates containing Sabouraud Dextrose Agar (SDA, Biolife), all in duplicate, and plates were incubated at 35 °C ± 2 °C for 48–72 hours in aerobiosis.
Grown colonies for each microorganism were counted for two consecutive dilutions, where the number was between 3 and 300, verifying proportionality with calculation of Kp (coverage factor for measurement uncertainty, as described by ISO 13005) and G2 (chi square test). The average number of colonies for each dilution considered was computed using the following equation:
(n = considered dilution; m = number of plates retained)
Plate counts were performed while ensuring proportionality between the different dilutions tested. In order to calculate the average numbers of colonies for n and n+1 dilutions, the following equation was applied:
(∑C = sum of the average numbers obtained from the count of the colonies on the plates in the two consecutive dilutions considered; V = volume (mL) of the inoculated amount in each plate; d = dilution factor corresponding to the first dilution considered).
Results were expressed as colony forming units per gram (CFU/g), in scientific notation, with one or two decimal places. In absence of bacterial growth, data was expressed as less than 1/dilution microorganism per g of product.
Where a colony count was not possible, the precise number of colonies, the result is expressed as “between dilution and dilution+1” CFU/g, where dilution is the last plate where growth is observable, and the next is where there is no growth observable.
2.7. Statistical Analyses
Data were described using mean ± standard deviation and tested for normal distribution using the Shapiro–Wilk test. The t-test or Wilcoxon–Mann–Whitney test, as appropriate, was used to compare continuous variables between groups of Ct values. The standard curve was built using the LightCycler 480 software. Statistics were performed by Prism (version 4.0c) and R software. A p-value less than 0.05 was considered significant. For the linear regression, the coefficient, the intercept, the slope, and R2 values were defined.
3. Results
3.1. Recovery and Integrity Evaluation of DNA Samples
All DNA extracted from the 10 × 10
9 L. Rhamnosus-spiked samples, using the seven different commercial kits, and the 10 × 10
4 pathogen-mixed spiked-in samples, extracted with the six commercial kits, were firstly evaluated using a spectrophotometer. DNA concentration and purity were estimated by absorbance at 260 nm (A260) and by A260/A280 and A260/A230 ratio, respectively (
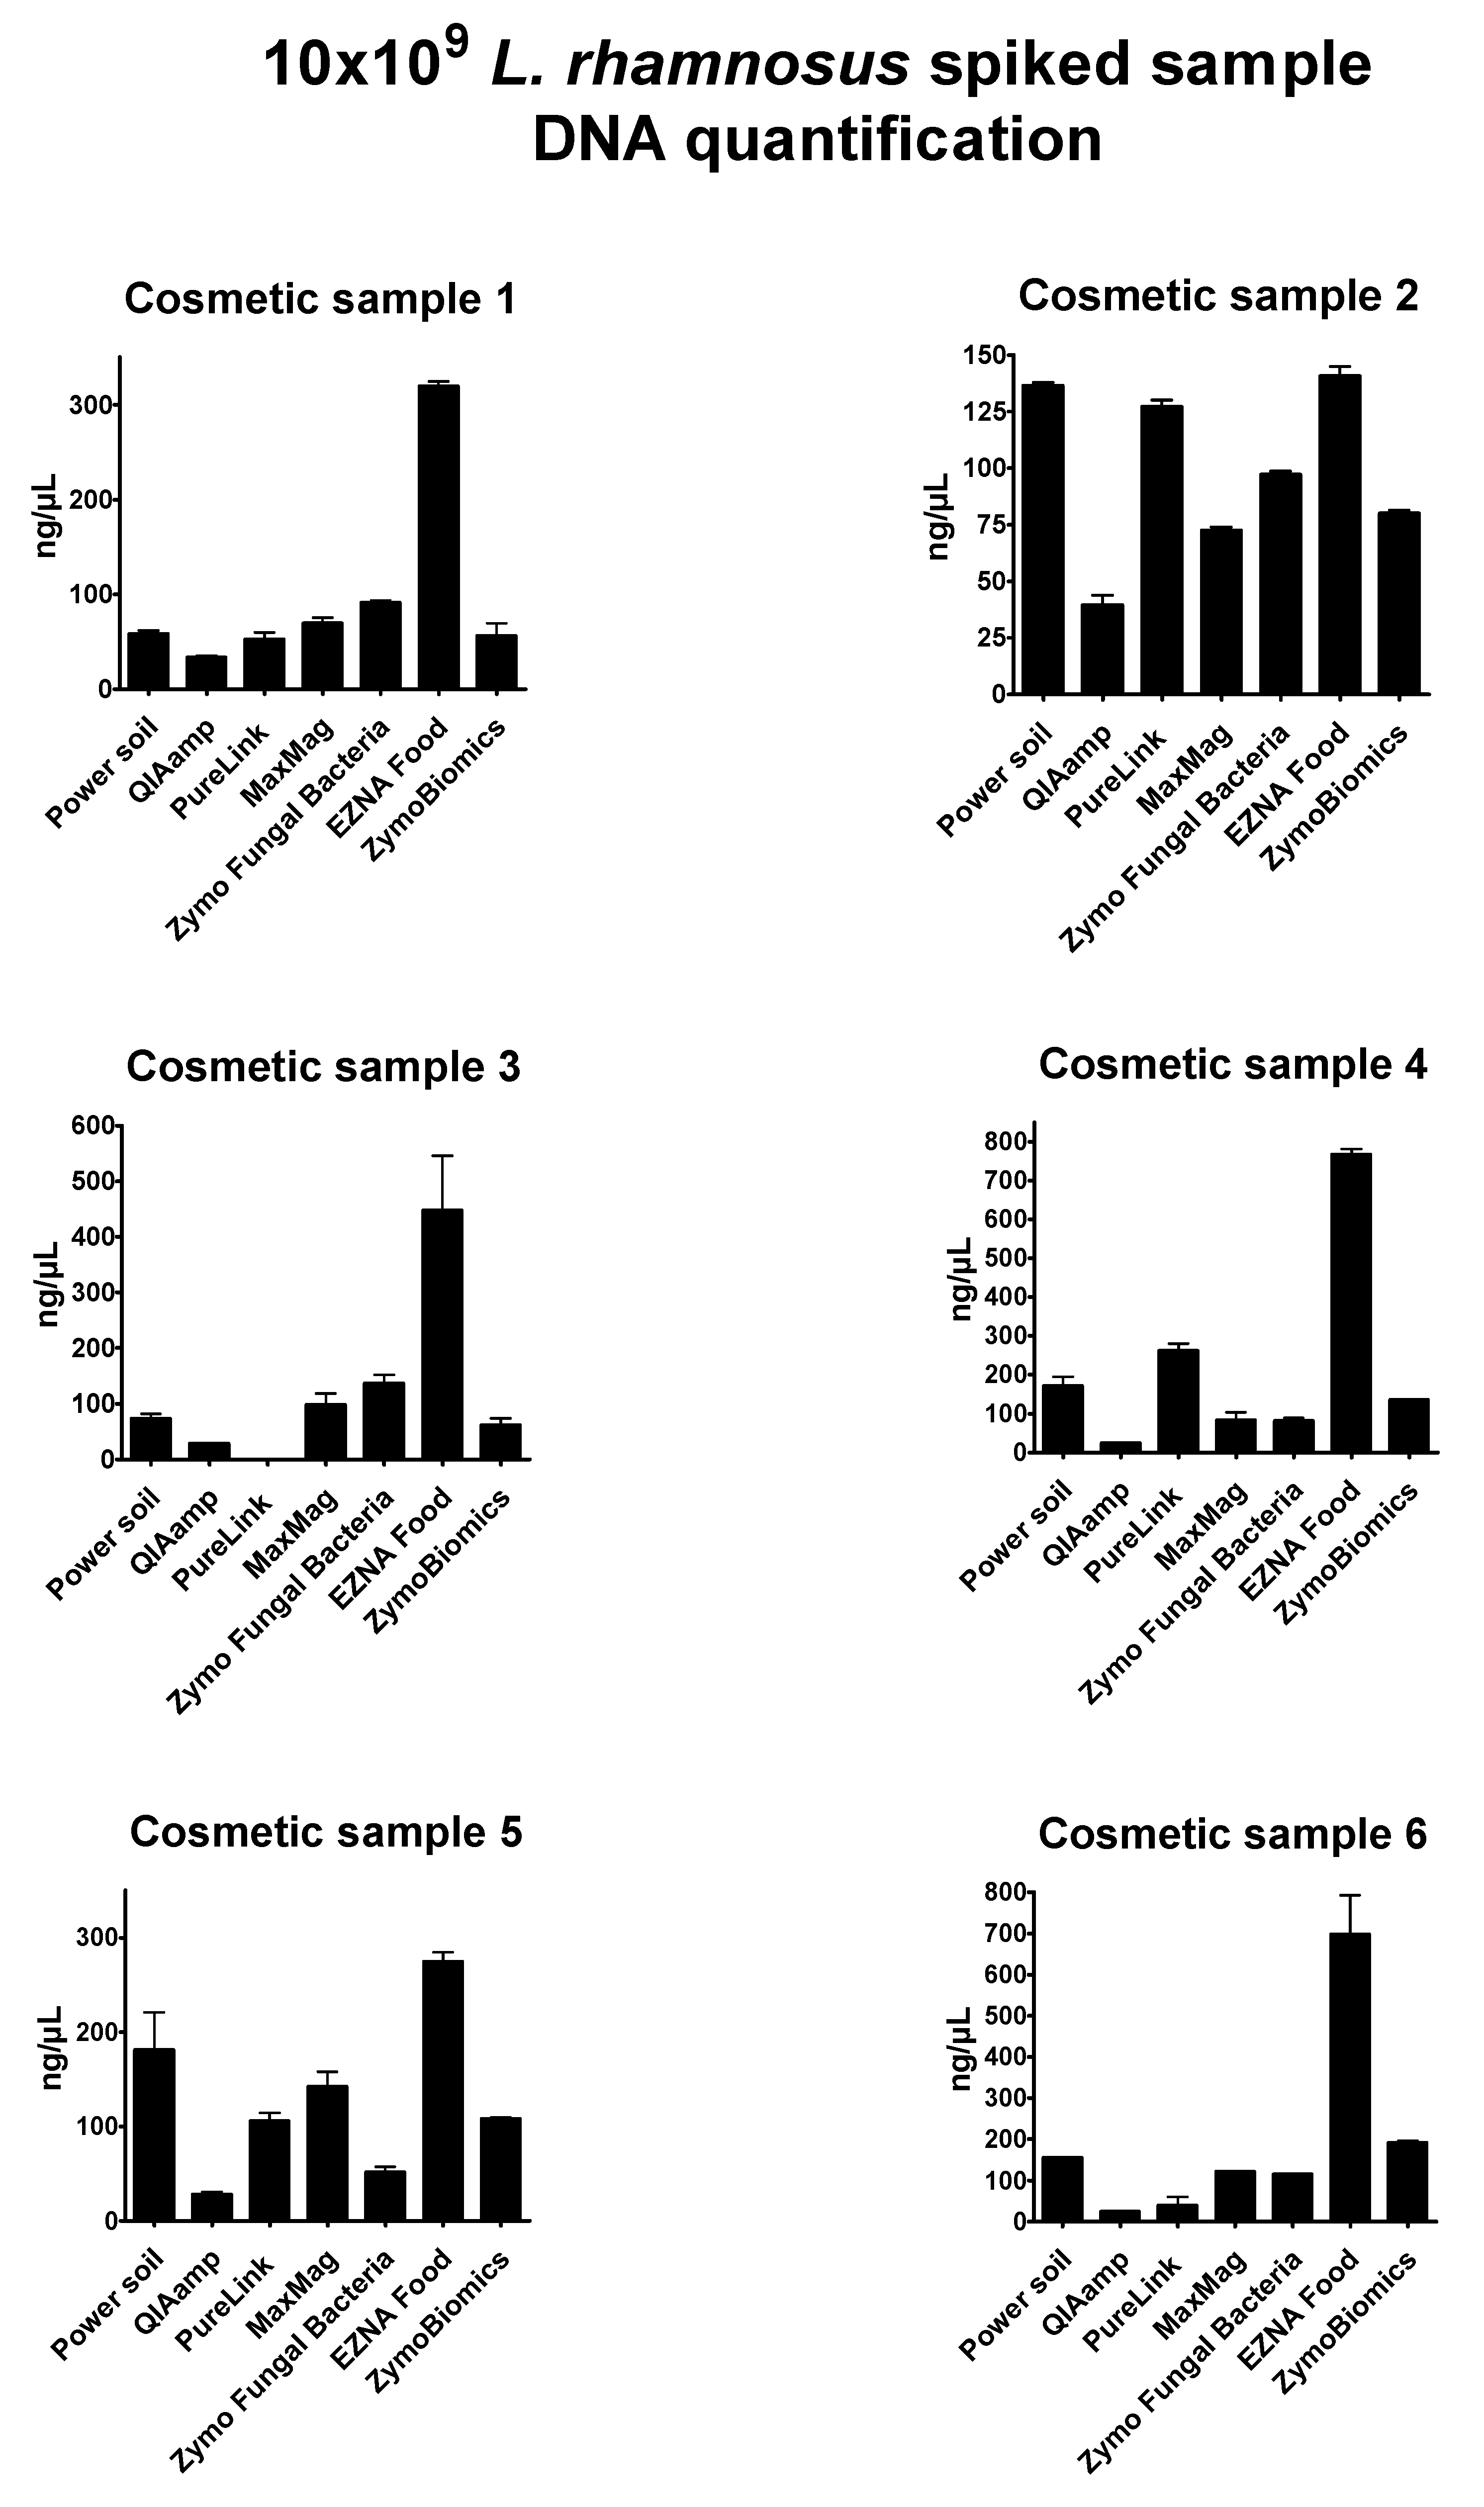
Supplementary Table S1). DNA concentration results of probiotic-spiked samples were expressed as ng/µL (
Figure 2). In some cases, the oily or creamy phase of the initial product was carried forward during the extraction and interfered with the absorbance read, providing no reliable results in terms of quantity and purity. DNA obtained from mixed spiked-in samples with
Escherichia coli and
Candida albicans gave inconsistent spectrophotometer quantification due to the low number of cells spiked in the cosmetics (5 × 10
3 for each strain). Inconsistent values were obtained by Nanodrop measurements, and differences between kit performances could not be determined. The same samples were analyzed by qPCR to evaluate the recovery rate using the strain-specific standard curve as reference.
Overall, the seven extraction methods showed significant differences in DNA yield and purity; the highest DNA concentrations resulted from the E.Z.N.A Food DNA kit (values ranging from 130.44 to 808.14 ng/µL), while the lowest resulted from the QIAmp DNA Mini kit (values ranging from 20.85 to 52.4 ng/µL). In general, the bead-beating methods DNeasy Power soil (Qiagen), the
Zymo Research Quick DNA Fungal Bacterial DNA kit, the
Zymo Research ZymoBiomics kit, and the
Omega Biotek E.Z.N.A kit reached satisfying results. The enzyme-based method of the
Qiagen QIAmp DNA mini kit did not provide expected results, probably due to interference of the cosmetics’ matrices with proteinase K activity [
63,
64,
65,
66]. The magnetic-based MagMax Microbiome Ultra Nucleic Acid Isolation kit and the
Invitrogen PureLink Genomic kit revealed intermediate yield values, but low quality of extracts, specifically with poor 260/280 ratios. Because of their composition, cosmetic samples 2 and 3 were considered the most complex products to process and analyze. The E.Z.N.A Food DNA kit showed optimal performance in these tricky conditions. Unfortunately, no further investigations could be performed with this method.
3.2. Derivation of Values from Crossing Points for qPCR Quantification of Spiked Samples
The DNA extracted from the 10 × 109 L. rhamnosus-spiked samples and from the mixed spiked samples with 10 × 104 Escherichia coli plus Candida albicans were profiled by real time qPCR using the specific primers for each species. To obtain absolute quantification of the extracts, cycle threshold (Ct) values, derived from the amplification, were interpolated with those of the standard curve. The Pearson correlation coefficient was in all cases −1.00; p-values e ≤ 0.0005 and the R2 values were: 0.9921, 0.982, and 0.986, respectively, for Lactobacillus rhamnosus, Escherichia coli, and Candida albicans.
Briefly, qPCR results confirmed that the best methods of extracting bacterial DNA from cosmetic products are based on the physical destruction of cell membranes, as previously observed with the spectrophotometer. In the majority of cases, the absolute quantification of DNA copies in L. rhamnosus-spiked samples was overestimated (10 × 1011 and 10 × 1010 cells instead of 10 × 109 cells; data not shown). This inaccurate count of DNA copies could be affected by the incorrect logarithmic phase definition, where homogenous efficiency is assumed. In fact, due to the high amount of DNA extracted, the amplification started at very low cycles values (Ct ~ 11), interpolating the standard curve in the upper limit. The amplification efficiency decreased when the amount of product exceeded a certain level, reaching the exponential PCR phase sooner, thus saturating the system. This approach was useful to verify the possibility of amplifying extracts by real time qPCR and to underline differences between the DNA enrichment methods. In this preliminary phase, absolute quantitation was not achieved. The signal to noise ratio, probably related to the cosmetic background, negatively affected the interpretation of the results. This could also be due to the inexact initial count of raw material obtained by the plate method.
In the proposed screening workflow for pathogen detection in cosmetic material, the identification of higher bacterial loads can be defined in second-level examinations.
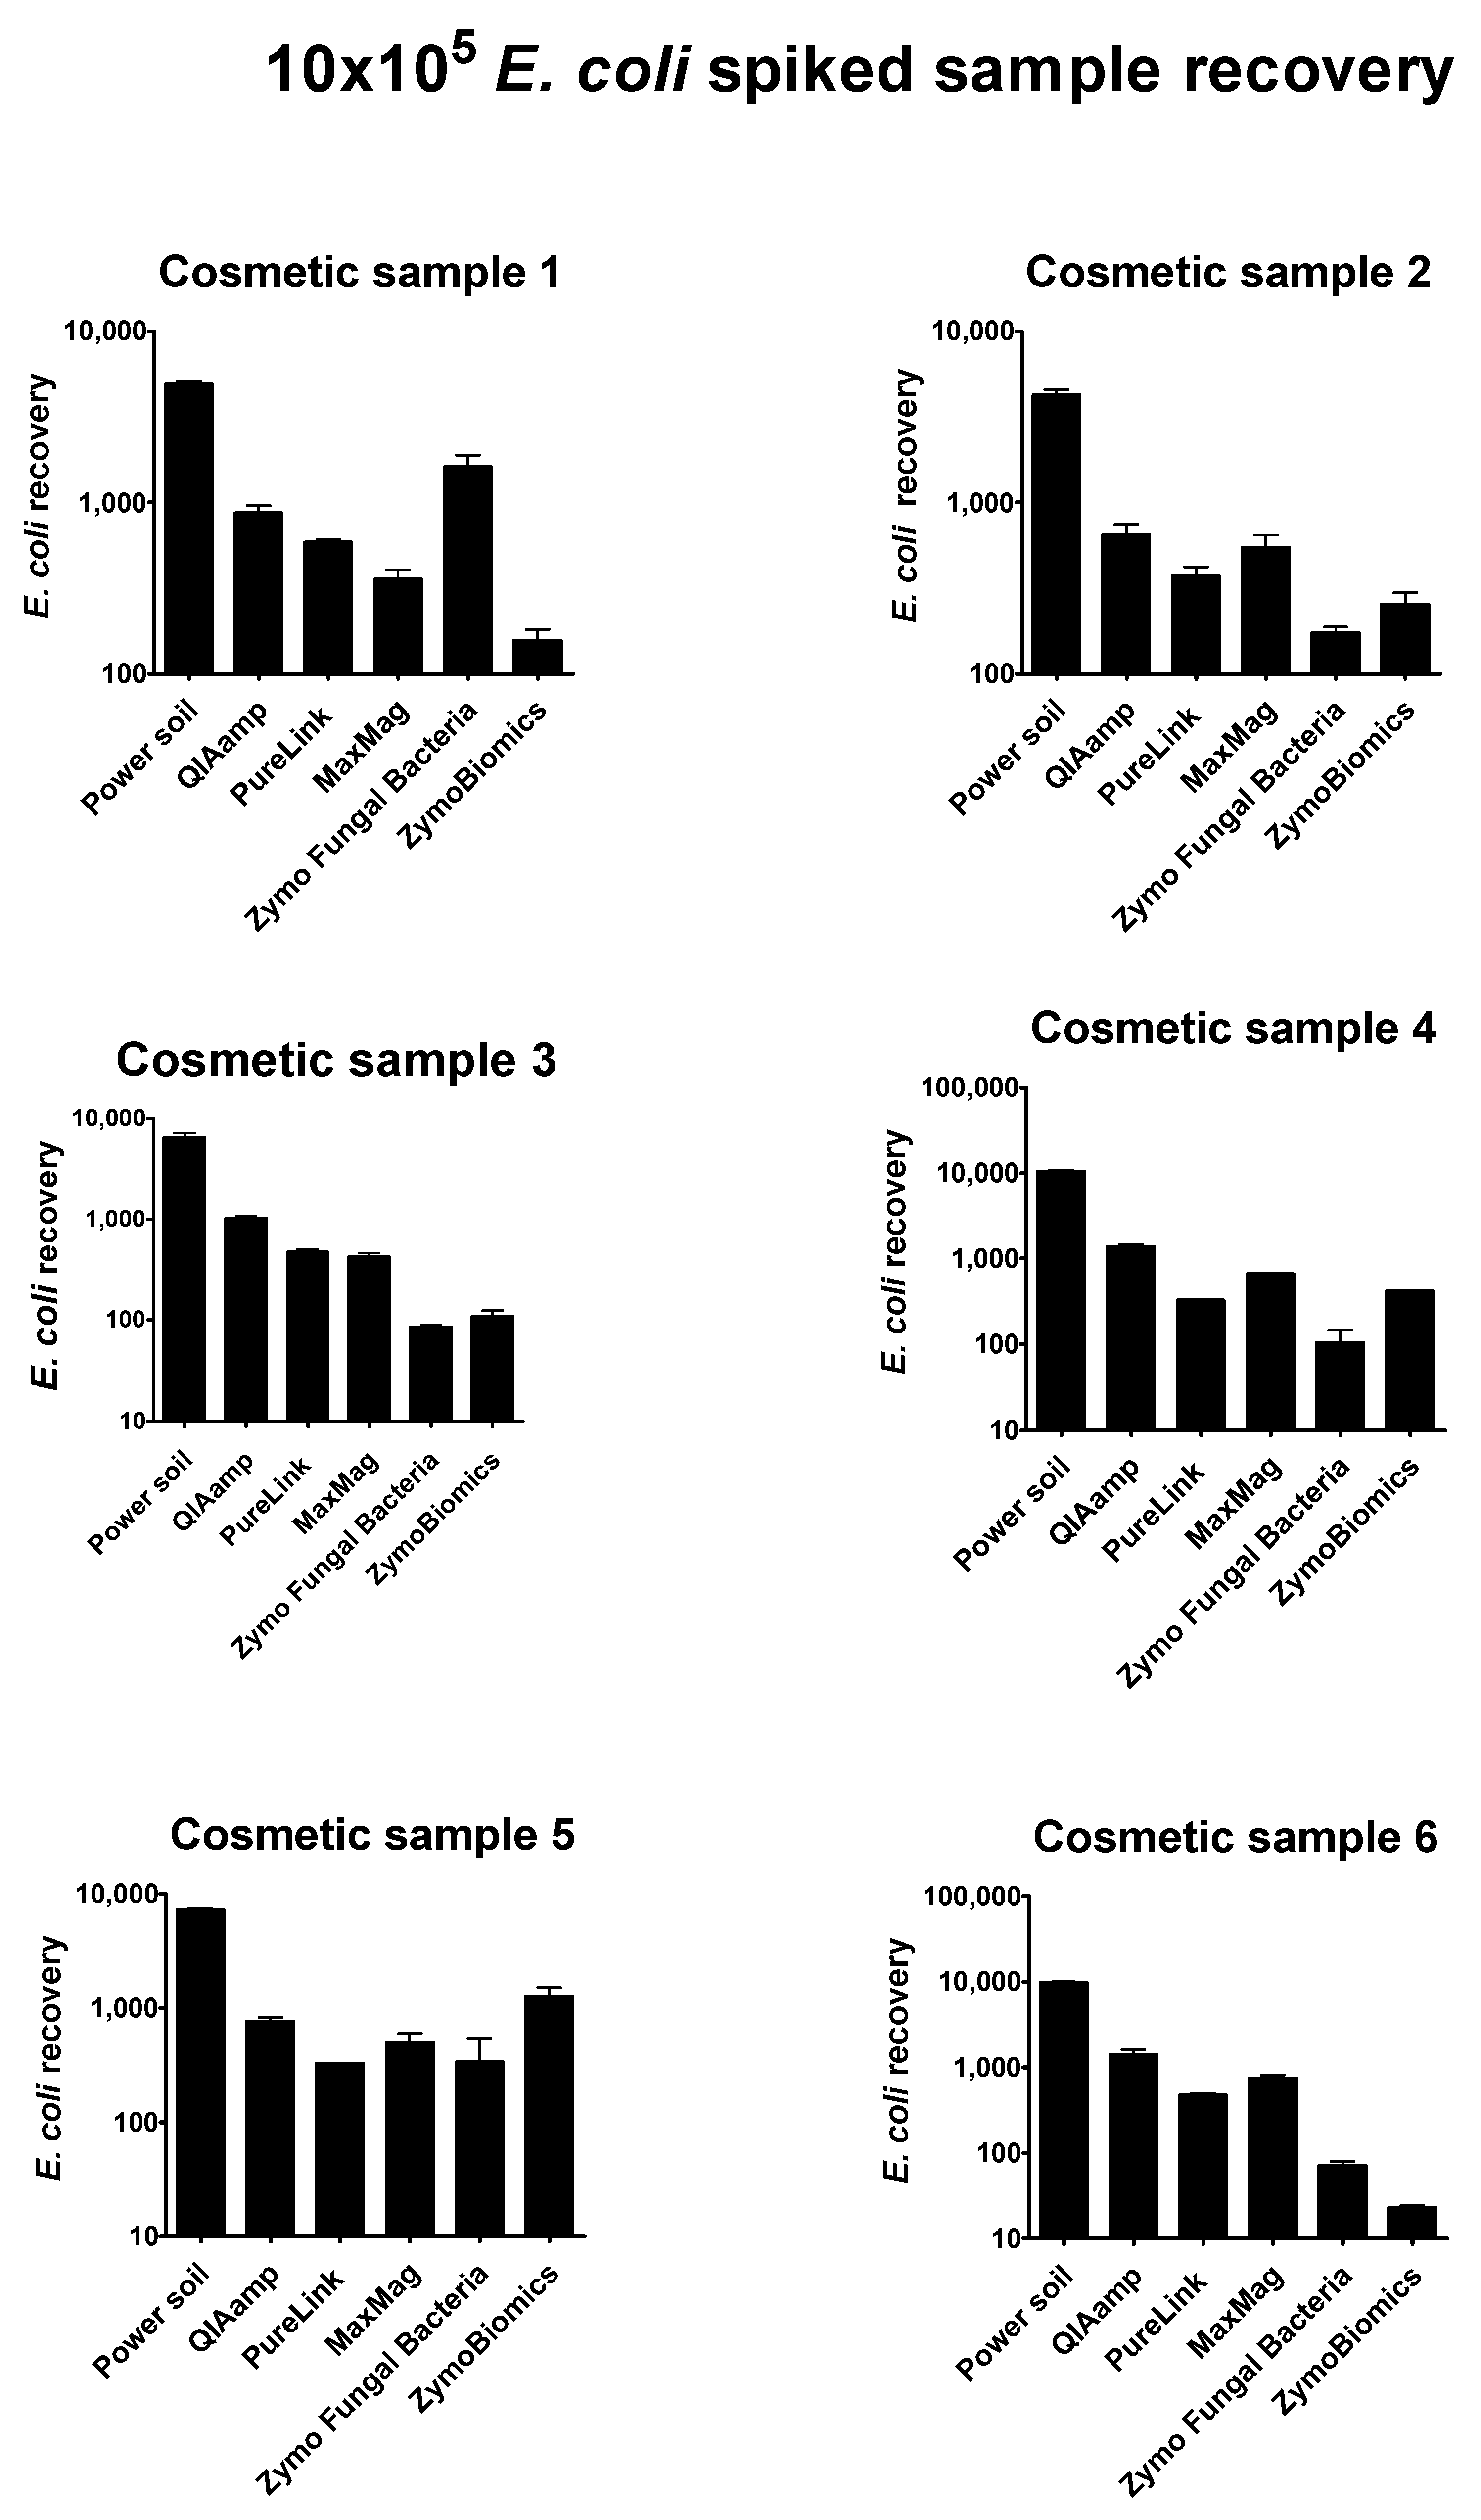
Regarding 10 × 10
4 pathogen-spiked samples, optimal recovery yield was reached only for the
Escherichia coli strain. All results are plotted in the histograms shown in
Figure 3. Briefly, the best method in Gram negative cell identification was the QiAamp Power Soil kit by
Qiagen, which was performed in automation. For all cosmetic samples analyzed, the numbers of recovered
E. coli cells were in line with our expectations. Simplifying the extraction process by eliminating operator-dependent activity assured consistency of the results, guaranteeing a more standardized workflow.
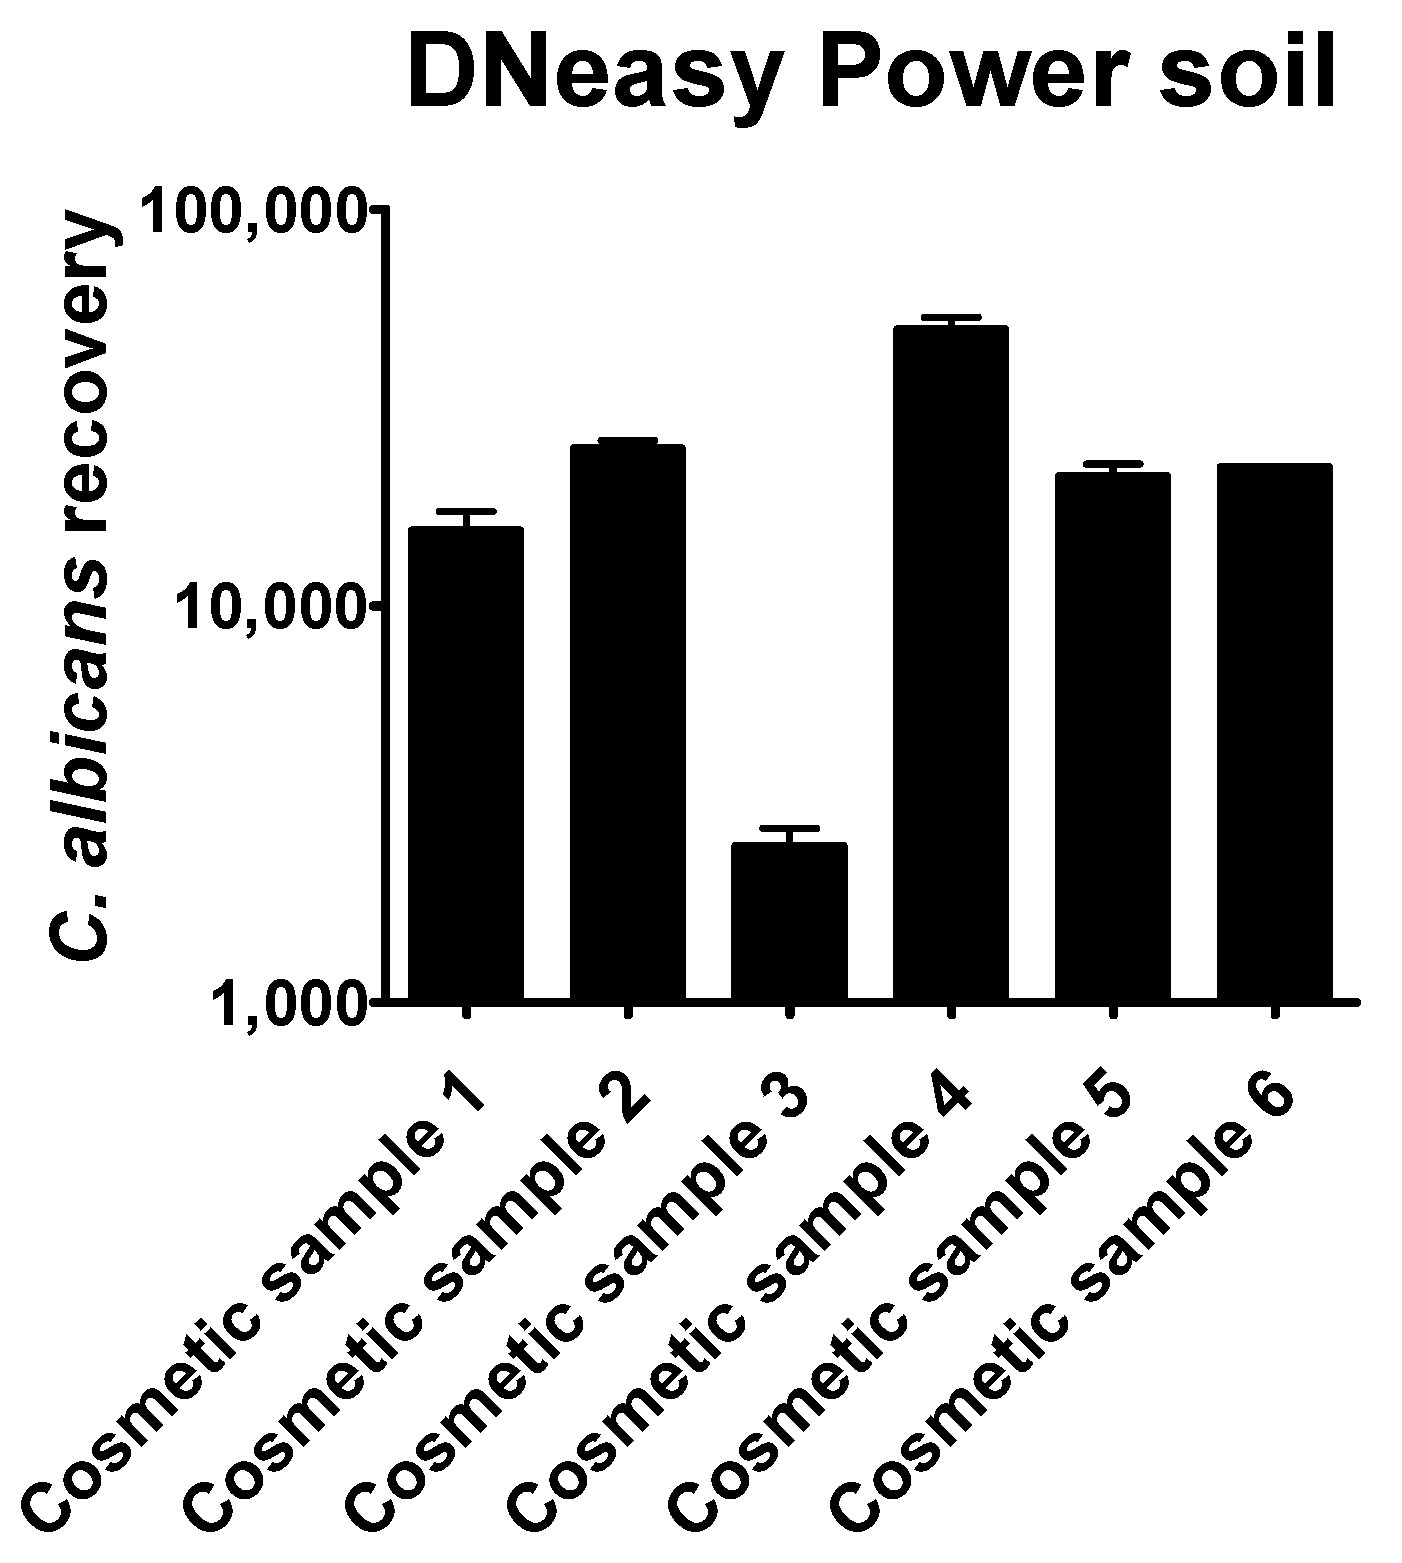
The quantitation results obtained by the six different commercial methods showed that their efficiency in recovering Candida albicans cells was generally very low. The methods examined showed considerable differences in the quantity of the recovered DNA
Only the automated DNeasy Power Soil method was able to provide enough DNA to be directly amplified by qPCR (
Figure 4). Except for cosmetic sample 3, the number of
Candida albicans cells was always overestimated, compared to the plate count.
For the other methods, intermediate steps are probably necessary to remove inhibitors and to increase DNA recovery. qPCR analysis evidenced that prokaryotic DNA was easier to extract and amplify than the eukaryotic DNA of yeast cells. Some methods were more suited to recovering either prokaryotic or eukaryotic DNA. Therefore, small protocol modifications may be necessary to extract DNA from different cell types.
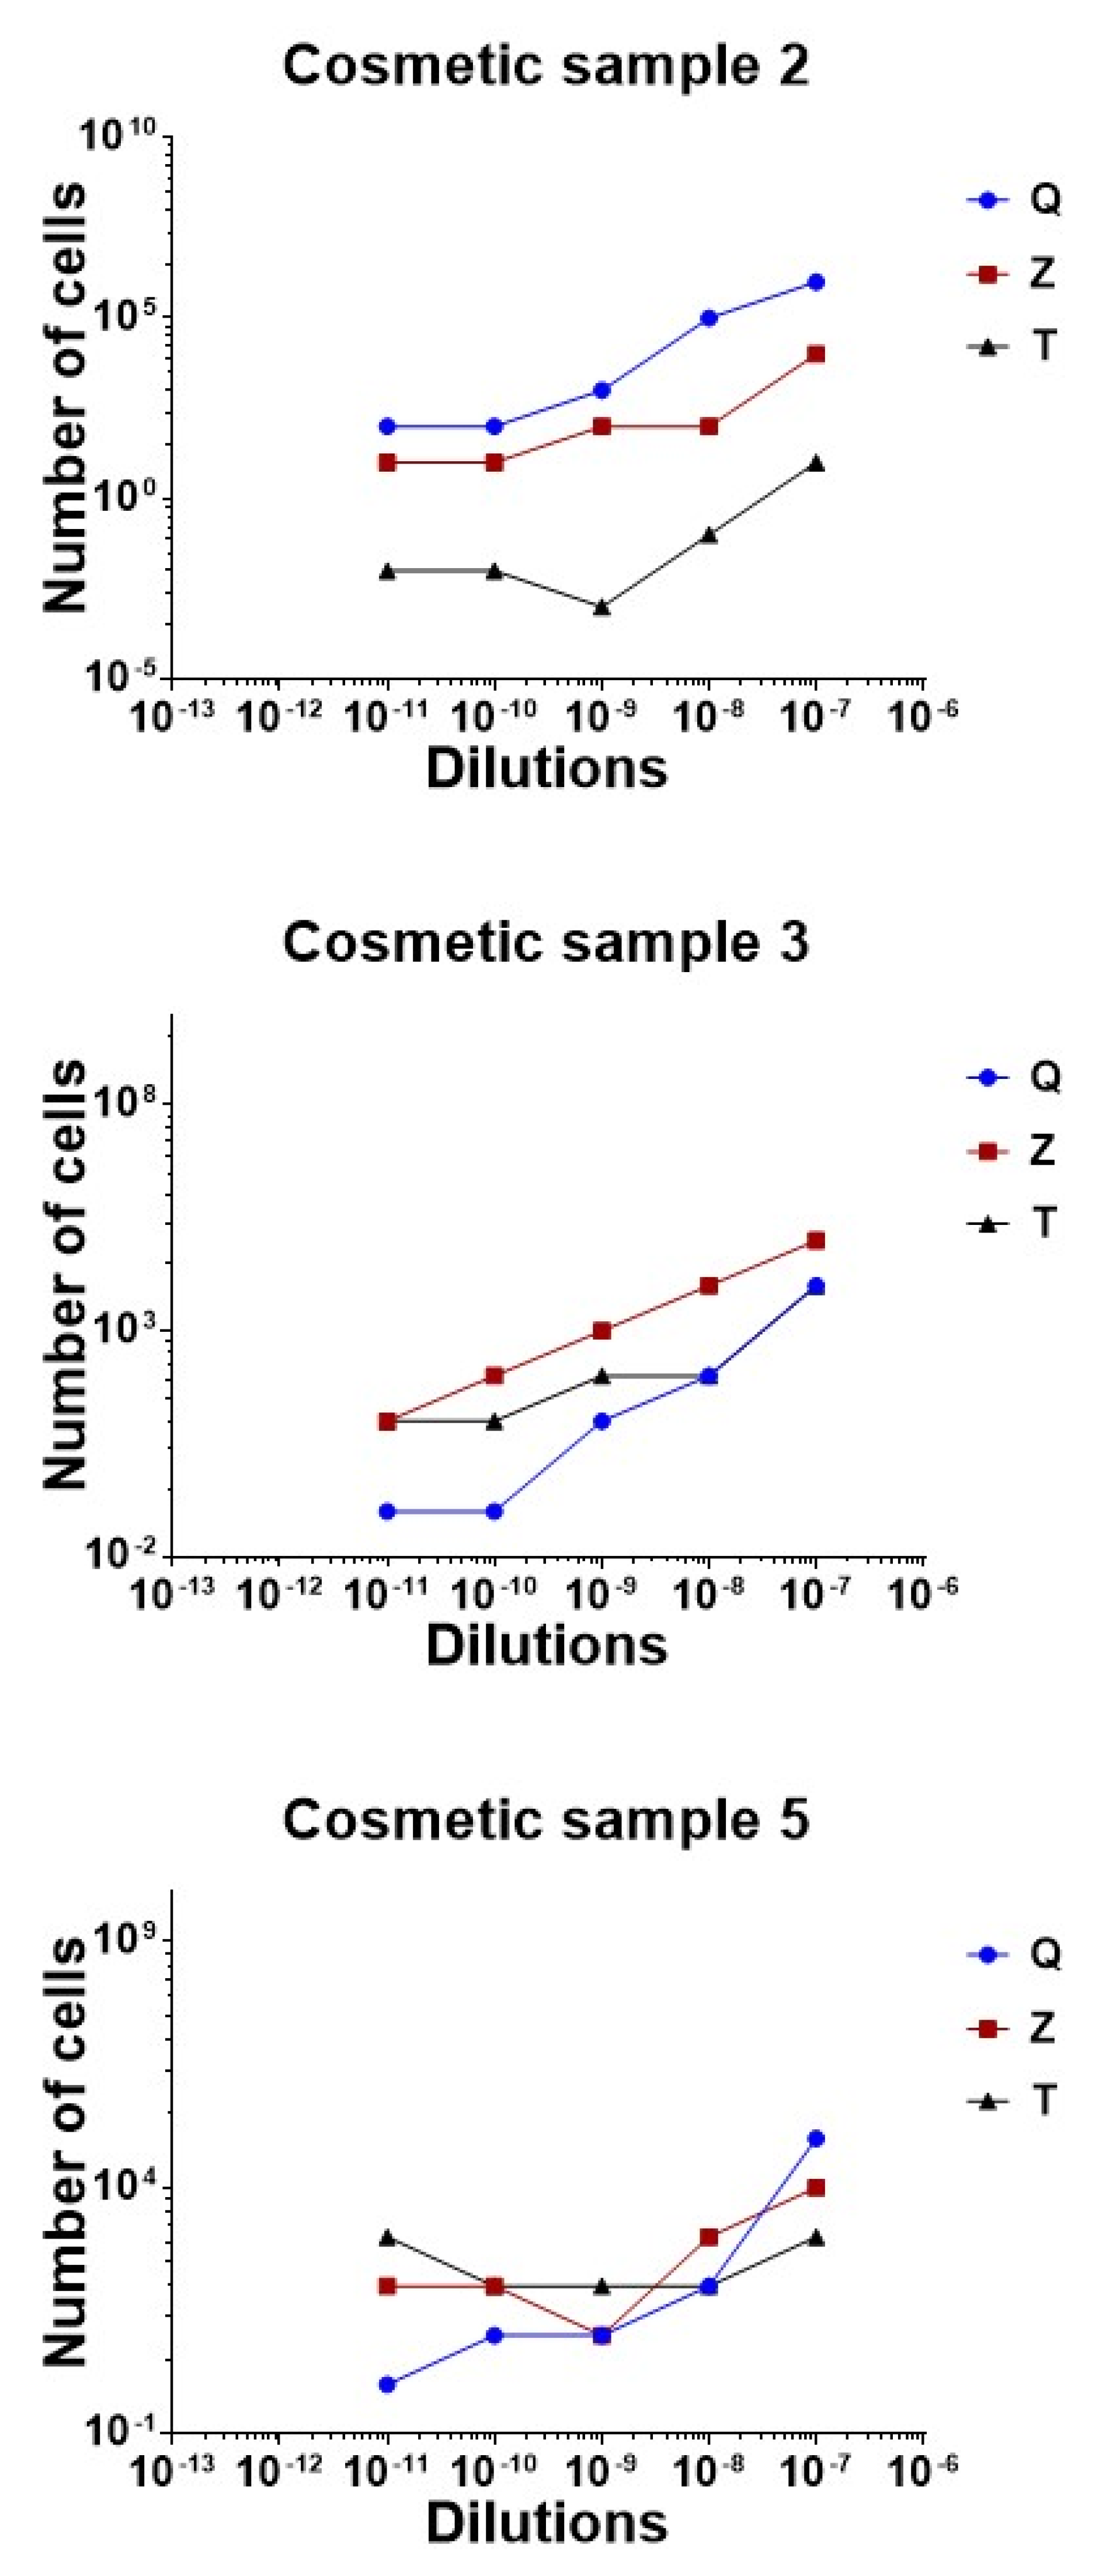
3.3. Limit of Detection (LOD) of Lactobacillus Rhamnosus Spiked Samples
To go deeper into study feasibility, we evaluated the ability of our protocol to identify low numbers of cells. Analysis were restricted to the three mechanical extraction methods, the DNeasy Power soil kit from Qiagen, the Zymo Research Quick DNA Fungal Bacterial DNA kit, and the MagMax Microbiome Ultra Nucleic Acid Isolation kit.
In these experiments, only three types of cosmetics spiked with
L. rhamnosus were employed. Samples 2, 3, and 5 were selected, as previously described in
Section 2.3, because of their high salt content and low percentage of water, their formulation, and their strong oil and fat composition.
DNA extracted from the serial dilutions between 10−7 and 10−12 were tested by real time qPCR and quantified.
In these cases, the non-normalized values were calculated from the mean Ct values by the standard curve equation followed by exponent (base 10).
The comparison of the three methods is graphically reported in
Figure 5.
Regarding sample 2, the best method for DNA extraction was achieved with the Zymo Research Quick DNA Fungal Bacterial DNA kit, proven by the successful rate of recovery of all the dilutions analyzed. A concordance of 100% between expected and observed results was reached for every sample quantified by real time qPCR, except for the highest dilution of 10−9, for which the results were slightly overestimated. The DNeasy Power soil kit overvalued results, probably due to the background noise generated during the amplification by the matrix carried over after the extraction. The rate of recovery obtained by the Thermo Fisher kit was low for sample 2 serial dilutions. In all cases, a DNA loss was observed compared to the estimated value.
Regarding sample 3, the best method for DNA extraction was the DNeasy Power soil kit, which maintained linearity between all the dilutions tested. In this cosmetic, the Zymo kit overquantified DNA copies, while the Thermo Fisher magnetic based-method worked well on the highest dilution, but showed limitations in the 100 to 10 range of cells.
Cosmetic 5 was correctly analyzed when processed with Zymo and Qiagen’s methods. In this case, the magnetic bead extraction did not reach the results expected.
No 10 × 1012 dilutions generated amplification products during the 40 cycles.
3.4. Plate Count Enumeration of Strains
Lactobacillus rhamnosus enumeration in cosmetics, resulting from the plating of the spiked samples, were expressed as CFU/g values and are given in
Table 3. Quantitation of
Lactobacillus rhamnosus potency was done for each cosmetic sample in order to study the possible effects of preservatives on probiotic viability.
Considering that probiotic dilutions from 10−2 to 10−7 were too great to be directly counted by the operator, only colonies grown from 10 × 108, 10 × 109, and 10 × 1010 were evaluated for each sample.
Raw material employed for spike-in experiments was also counted to verify the title expected. Probiotic enumeration was compliant with the batch specification defined by the supplier and corresponded to 7.82 × 10¹¹ CFU/g. Results for dilutions not useful to count are omitted.
Escherichia coli enumeration in cosmetics, resulting from the plating of the spiked samples prepared, were expressed as CFU/g values and are given in
Table 4. The determination of
Escherichia coli potency was done for each cosmetic sample, in order to evaluate the preservatives effects on bacterial viability.
Considering that dilutions from 10−1 to 10−4 were too great to be directly counted by the operator, only colonies grown from 10 × 105, 10 × 106, and 10 × 107 were evaluated for each sample.
The Gram negative bacteria employed for spike-in experiments were also counted to verify the number expected. Escherichia coli enumeration corresponded to 4.92 × 10⁷ CFU/g. Results of dilutions not useful to count were omitted.
Candida albicans enumeration in cosmetics resulting from the plating of the spiked samples is expressed as CFU/g values and is given in
Table 5. The determination of
Candida albicans potency was done for each cosmetic sample, in order to evaluate the preservatives’ effects on yeast viability.
Considering that dilutions from 10−1 to 10−4 were too great to be directly counted by the operator, only colonies grown from 10 × 105, 10 × 106 and 10 × 107 were evaluated for each sample.
The yeast employed for spike-in experiments was also counted to verify the number expected. Candida albicans enumeration corresponded to 5.00 × 10⁷ CFU/g. Results of dilutions not useful to count were omitted.
4. Discussion
Quality control evaluation of cosmetic formulations requires microbiological analysis of raw materials and finished products to monitor the safety of their manufacture [
3,
4,
6,
7,
8,
16,
17]. Cosmetics and beauty products are applied directly on human skin and other sensitive areas, and they must never cause an adverse reaction due to the presence of pathogenic organisms, even during prolonged exposure [
1,
6,
7,
8,
22]. Quality in the cosmetics industry is provided and controlled on the basis of several ISO (International Organization for Standardization) standards or stricter Pharmacopoeia methods.
The most important and popular is ISO 22716:2007 Guidelines on Good Manufacturing Practices (GMP).
An increasingly popular trend in the cosmetics industry is the use of live probiotics as biocompatible molecules to provide health benefits to the consumer. In skincare and cosmetics, probiotic products will calm inflammation, strengthen the skin’s natural barrier, and maintain a healthy bacterial balance. Despite the range of positive outcomes promised, the FDA does not currently regulate the use of probiotics in the cosmetic field [
7,
8,
16,
17].
The conventional microbiological methods for pathogen detection need pre-enrichment steps to allow the growth of any microorganisms present. Their enumeration, isolation, and biochemical identification require 4–5 days before validation of results [
4,
6,
7,
10,
22].
New molecular methods have been developed in order to examine products more deeply and sensitively than by culture testing [
47,
48,
49,
50]. These methodologies are straightforward and practical enough to use in a quality control laboratory [
32,
53,
54]. However, no PCR assays have been validated for the detection and identification of bacterial indicators for pathogen screening of nonsterile cosmetics.
Therefore, the present study was designed to investigate the potential of adding molecular protocols that are fast and sensitive for the quantification of bacteria in a given cosmetic product, both for pathogens and probiotics [
47,
48,
49,
50]. Sample preparation prior to contamination analysis is a critical step for the optimization of a molecular workflow. The extraction of microbial DNA was performed on six in vitro contaminated complex sample mixtures, containing natural ingredients, including glycerin, minerals, amino acids, preservatives, and other excipients. Spiked samples were created by adding known numbers of
Lactobacillus rhamnosus,
Escherichia coli, and
Candida albicans cells to the cosmetics, which were then subjected to DNA extraction using different commercial kits. The selection of
Lactobacillus rhamnosus ensured the adequacy of the experimental condition of operator and is representative of an ingredient that could act as a biological drug [
38,
39,
40]. Probiotics are largely employed in their live state, as ferments, or as lysates, in cosmetic products in order to inhibit
P. acnes, to improve or restore barrier function or to reduce skin Staphylococcus infections [
33,
34,
35,
36].
The products selected in the study are representative of the most common cosmetic productions, with specifically difficult formulations in the case of samples 2, 3, and 5. These mixtures are characterized by high salt content, low water percentage, and high oil and fat content. The goal of our work was to extract DNA from these complex materials in order to demonstrate the possibility to apply an easy and rapid molecular approach in quality control assessments. In the first phase, we tested the DNA recovery reached by the different kits on the 10 × 10
9 L. rhamnosus spike-in samples and on 10 × 10
4 pathogen mixed samples, composed of
E. coli and
C. albicans. For this preliminary test, we compared the spectrophotometer’s results in terms of concentration and purity, estimated by absorbance at 260 nm and by A260/A280 and A260/A230 ratios. The seven methods showed significant differences in DNA yield and purity. The highest DNA concentrations resulted from the bead-beating methods (E.Z.N.A Food DNA kit from OMEGA biotech, the DNeasy Power soil
Qiagen, the
Zymo Research Quick DNA Fungal Bacterial DNA, the
Zymo Research ZymoBiomics), while the lowest results were derived from the QIAmp DNA Mini kit, probably due to interference of the cosmetic matrices with proteinase K activity [
63,
64,
65]. The magnetic-based MagMax Microbiome Ultra Nucleic Acid Isolation kit and the
Invitrogen PureLink Genomic kit revealed intermediate yield values, but low quality of extracts, with particularly poor 260/280 ratios. This spectrophotometer comparison was not possible for mixed-spiked samples because the amount of DNA recovery was below the Nanodrop’s limit of sensitivity. The plate count method is generally affected by agar media, the state of bacterial cells, the presence of preservatives, and the optimization of growth conditions. Considering these aspects, the potency of the microorganisms’ raw material could be inaccurate [
51,
52].
After the creation of a standard curve specific for each strain and tested by qPCR, a quantification profile for the 10 × 109 probiotic-spiked samples and for the 10 × 104 pathogen mixed spiked samples were performed. Cycle threshold (Ct) values from the amplification were interpolated with those of each specific standard curve to obtain an absolute quantification of the extracts. Results confirmed that the best methods for bacterial DNA extraction from cosmetics are based on the physical destruction of cell membranes. The absolute quantification of DNA copies by qPCR was overestimated in the case of L. Rhamnosus, probably due to the high amount of input DNA and the cosmetic background. For E. coli, the best method was the automated Power soil kit. In fact, in an ideal standardized workflow, the automation will help in obtaining more successful and reproducible results. For the other methods, the difference in findings may be due to the relatively few cells included in the spiked samples.
Regarding Candida albicans, only automatic extraction gave DNA amplifiable by qPCR, probably because the detection of fungal pathogens by qPCR requires the use of extraction methods that efficiently lyse fungal cells and recover DNA suitable for amplification. The methods tested for bacteria did not efficiently work on yeast cells. Fungi have cell walls that impede cell lysis and the recovery of DNA using conventional extraction methods. The simple lysis procedures, or incubation with hot detergent and proteases, cannot produce high yields of DNA from many fungal species.
In the proposed QC screening workflow, the identification of a higher bacterial load could represent a suitable result, compared to positive samples missing (false negative results). After the optimization of the DNA enrichment conditions, a second investigation by qPCR was performed on 10−7 to 10−12 probiotic spiked-samples’ serial dilutions of cosmetics 2, 3, and 5. We restricted the analysis only to the three mechanical extraction methods: the DNeasy Power Soil from Qiagen, the Zymo Research Quick DNA Fungal Bacterial DNA and the MagMax Microbiome Ultra Nucleic Acid Isolation kit.
As done before, the non-normalized values were calculated from the mean Ct values by the standard curve equation. Different recovery rates were obtained from the different samples using the three commercial kits. The Qiagen method worked successfully in cosmetic 2 and 5, but overestimated bacterial numbers in sample 2, due to noise.
The
Zymo Research Quick DNA showed optimal performance in two out of the three samples, with some limits in very high dilutions (for example, the 10
−9 dilution of sample 2). In cosmetic 3, a higher amount of DNA was recognized. Eventually, the methodology by Thermo Fisher did not reach the results expected, concluding that the magnetic bead extraction was not ideal. The turn-around time to complete the analysis, including sample preparation and qPCR amplification of targets, was four hours, compared to the classical culture approach which requires three to five days. The use of real-time qPCR to detect and quantify microbial nucleic acids allowed us to identify the genotypic identity of cultures. Real-time qPCR has improved sensitivity, reproducibility, and reduced risk of carry-over contamination. Two advantages of qPCR, in comparison to the plate count method, are the possibility to analyze different ranges of cell number, bypassing the limitation of the count of typical colonies, and the possibility to perform higher numbers of tests per day (47,48,49,50). Molecular investigations are better standardized and more sensitive. The limitations of our test were related to high amounts of DNA, where the linearity of the reaction is lost, and on fungal DNA extraction, which required a dedicated protocol [
37,
38,
39].
DNA-based methods cannot unequivocally differentiate between living and dead cells. DNA from dead cells is indistinguishable from DNA from living cells, which may be important to consider in certain contexts. Live microorganisms have the potential to grow and adapt to a given environment. Without the selective identification of living microbes, DNA approaches overestimate the types and numbers of viable microorganisms. The genetic identification of an intact, functional cell membrane, the presence of cellular metabolism, or the possession of self-replicating DNA that can be transcribed into RNA, could overcome the limitations of traditional molecular tests [
47,
50,
51,
52].
A negative screening result reports the absence of a specific pathogen in a cosmetic sample, in compliance with microbiological limits. A positive screening result requires further investigation with different techniques.
In terms of quality and recovery of DNA extraction, the Qiagen Power Soil and Zymo research Quick DNA Fungal/Bacterial kits have proven themselves as the better kits among the seven tested for use in cosmetics.
The results of our molecular method provide preliminary evidence of effective cosmetic screening. Low amounts of cells (10–100 cells) could be identified, in compliance with regulatory limits of 100 CFU/g in cosmetics. These data showed that qPCR technology permitted a four-hour detection, allowing rapid evaluation of both raw materials sensitive to microbial contamination and probiotics employed as biological drugs. For Candida albicans, other intermediate steps will probably be necessary to increase DNA recovery or to remove inhibitors of qPCR. qPCR analysis evidenced that the prokaryotic DNA was easier to extract and amplify than the eukaryotic DNA of yeast cells. Therefore, some protocol modifications may be necessary to extract DNA from different cell types.
The large differences in the amounts of fungal DNA recovered with the different DNA extraction methods and detected by qPCR in this study highlight the importance of the extraction step, and this is what we would like to emphasize with our preliminary results.


