1. Introduction
Opto-thermal radiometry, or photothermal radiometry, is an infrared remote sensing technique that was originally developed back in the 1980s [
1,
2]. It has since been used for many applications. Long et al. used pulsed photothermal radiometry to study the depth profile of layered materials, including biological tissue [
3]. Jacques et al. used pulsed photothermal radiometry to study the heat deposition in human skin after a short laser pulse, and this was very useful for port-wine-stain lesions treatment [
4]. Guo et al. has studied noninvasive glucose detection in human skin using wavelength-modulated differential laser photothermal radiometry [
5]. Streza et al. used lock-in thermography and optical microscopy to study the adhesion between some dental fillings and the dental hard tissue [
6]. Almond et al. has published a book on photothermal science and techniques, which covers many industrial applications, such as non-destructive testing (NDT), characterizations of semiconductors, thermal property measurements, and gas measurements [
7]. Vavilov et al. summarized the basics of pulsed thermal nondestructive testing (TNDT), which included theoretical solutions, data processing algorithms, and practical implementation [
8]. Trefon-Radziejewska et al. used photothermal radiometry and scanning thermal microscopy methods to study the thermal properties of metal phthalocyanine layers [
9]. Pawlak et al. used modulated photothermal infrared radiometry to study the thermal diffusivity of moderate and heavily doped semiconductor samples [
10]. Kusiak et al. used pulsed and modulated photothermal radiometry to study the thermal conductivity of thin films [
11]. Imhof et al. has used photothermal radiometry to study skin hydration and skin pigments [
12,
13].
Opto-thermal radiometry uses a modulated (sinusoidal or pulsed) light source (i.e., laser, etc.) to heat up the sample surface, and uses a fast infrared detector (e.g., mercury cadmium telluride or MCT) to pick up the sample’s blackbody radiation due to the temperature increase. By analyzing the shape of the measured signal, we can get information on the sample’s optical properties, thermal properties, the thickness of the sample, and its layer structure. The pulsed laser version, OTTER (opto-thermal transient emission radiometry), originally developed by Imhof et al. [
2,
12,
13] and subsequently by Xiao et al. [
13,
14,
15,
16,
17,
18,
19,
20,
21,
22,
23,
24], has been intensively used for skin measurements. By using Nd:YAG Lasers (532 nm), skin melanin concentration (skin darkness) and skin hemoglobin concentration (i.e., blood distributions) can be measured [
15,
16,
17,
18], and by using Er:YAG Lasers (2.94 µm), skin hydration, skin hydration depth profiles, and skin topically applied substances can be measured [
19,
20,
21,
22,
23,
24].
However, the OTTER measurements have so far focused only on a single detection wavelength. In this paper, we will use multiple detection wavelengths. By plotting the OTTER results at different detection wavelengths, we can have an opto-thermal detection spectrum. By combining OTTER’s detection spectrum with OTTER’s depth profiling capability, we can get a unique depth-resolved opto-thermal detection spectrum. This will be a powerful tool that can be used for many skin studies.
2. Theoretical Background and Measurement Apparatus
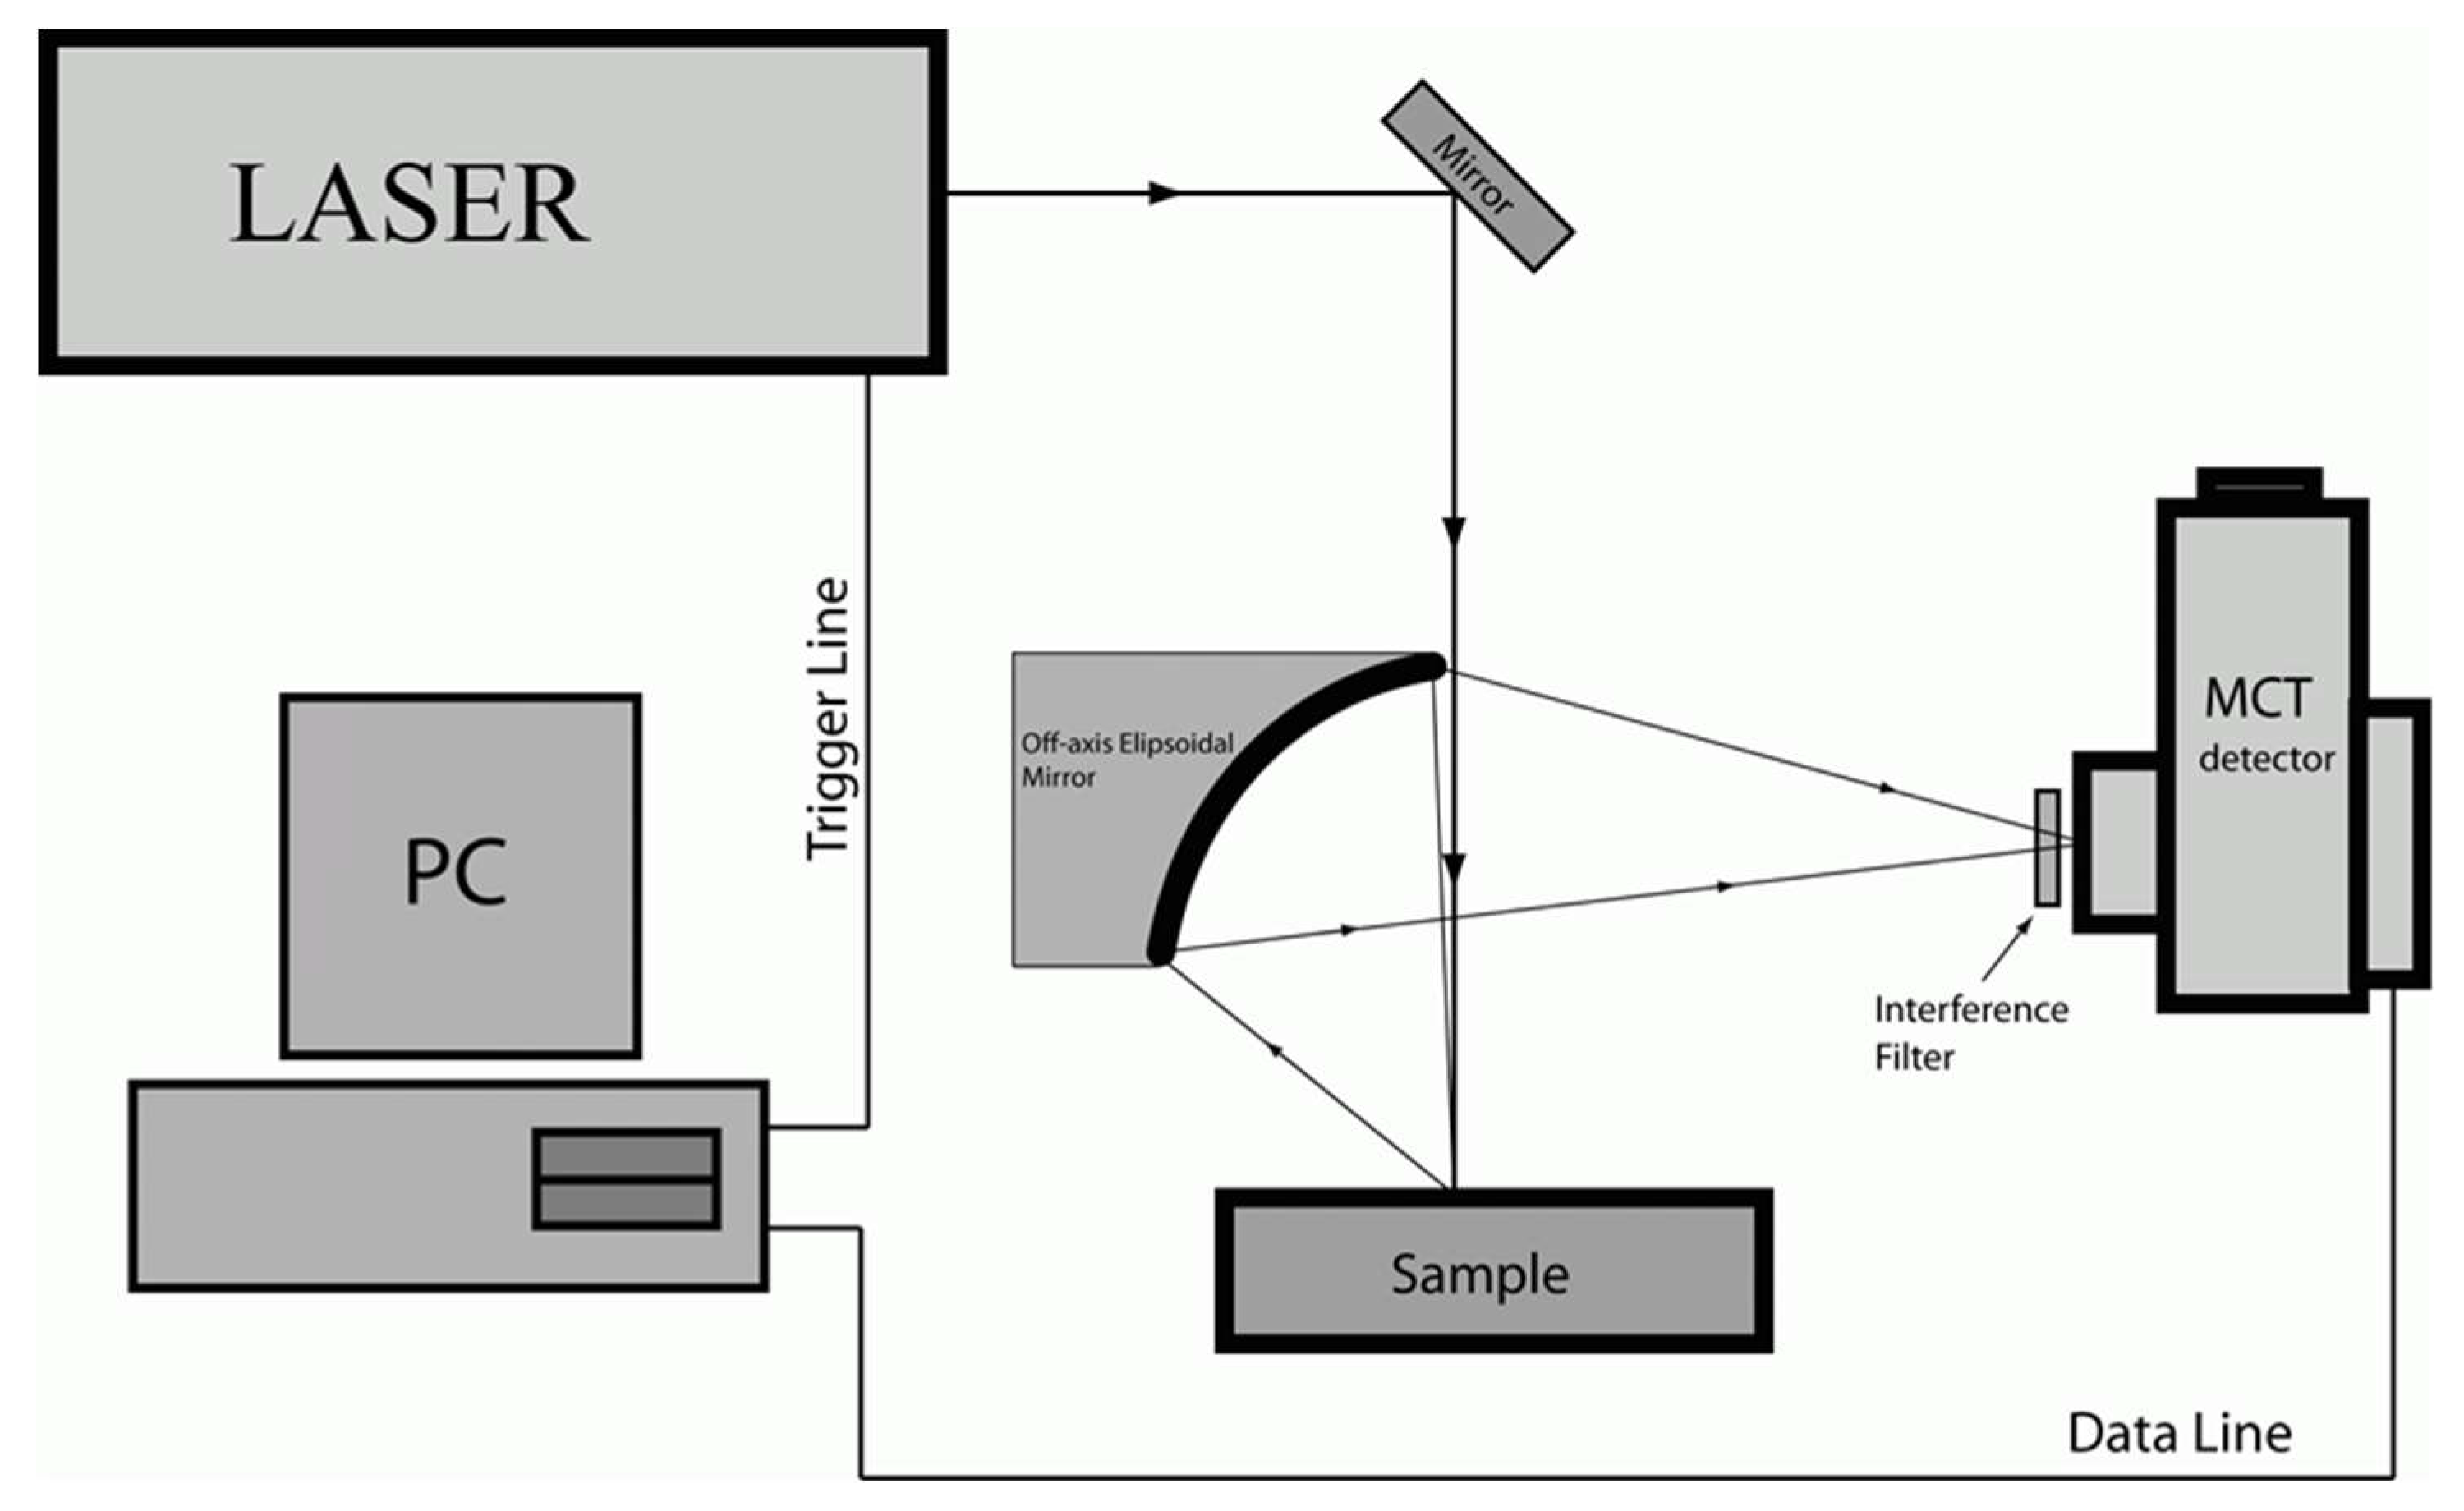
Figure 1 shows the schematic diagram of the OTTER apparatus. It uses a pulsed laser as heat source to heat up the sample surface, and a fast infrared MCT (mercury cadmium telluride, spectra responsive range 3–15 μm) detector, to pick up the sample’s blackbody radiation through an ellipsoidal mirror and interference filter. The signal from the MCT detector will be first pre-amplified, then sent to a PicoScope 4262 16-bit high resolution oscilloscope for digitization and finally to a computer for display, storage, and further analysis. A typical opto-thermal signal contains 4096 points, sampled at 1 MHz sampling frequency (∆t = 1 μs). The shape of the measured signal is dependent on the sample’s optical and thermal properties, the thickness of the sample, and its layer structure. Comparing with many other technologies, OTTER has the advantages of being non-contact, non-invasive, spectroscopic in nature, able to work on arbitrary surfaces, insensitive to color, and having small movements.
In this study, we used Er:YAG [
25], which has a few milli joules per pulse for energy, 100 ns for pulse width, 5 Hz for repetition rate, and ~1 mm diameter for laser spot size; the average laser radiation power was around 1 mW/mm
2.
The selection of detection wavelength was achieved by using narrow bandpass infrared interference filters (LaserComponents Ltd, UK), as shown in
Figure 1. These narrow bandpass filters have half-peak bandwidths less than 6% of the center of the wavelength value. In this work, we will use seven detection wavelengths, i.e., 13.1 μm, 11.5 μm, 9.5 μm, 8.5 μm, 7.79 μm, 6.48 μm, and 6.05 μm. By selecting the detection at a particular wavelength, it can illuminate the possible interferences of light at other wavelengths, such as the laser light and other infrared or near infrared light.
OTTER has a unique depth profiling capability. By using the segmented least squares (SLS) fitting algorithm, we got the water depth profiles or solvent depth profiles in the stratum corneum [
20]. According to the heat diffusion and blackbody radiation theory, the OTTER signal S(t) can be calculated as [
2,
12,
13]
where θ(z,t) is the skin’s transient temperature field due to laser excitation, t is the time, z is the depth in the skin, β is the skin’s absorption coefficient for the emitted thermal radiation, E
0 is the laser energy, C is the skin’s specific heat,
is the skin density, and the parameter ζ = ζ(λ_em) includes factors that depend on the black body emission curve, detector sensitivity, focusing, and alignment, but is independent of the properties of the sample.
For semi-infinite homogenous sample, from Equation (1), the OTTER signal can be expressed as [
2,
12,
13]
where A is the amplitude of the signal, τ = 1/(β
2 D) is the signal decay lifetime, and D is the skin’s thermal diffusivity. By fitting the entire OTTER signal, we can get an average τ and from which we can get any average β. From β we can get the water content in skin [
13,
18].
From Equation (1), we can see the OTTER signal comes from all depths of the sample and, therefore, we can get an estimated “mean detection depth”,
, at any given time t:
which can be simplified as
where
is the average of β at all depths.
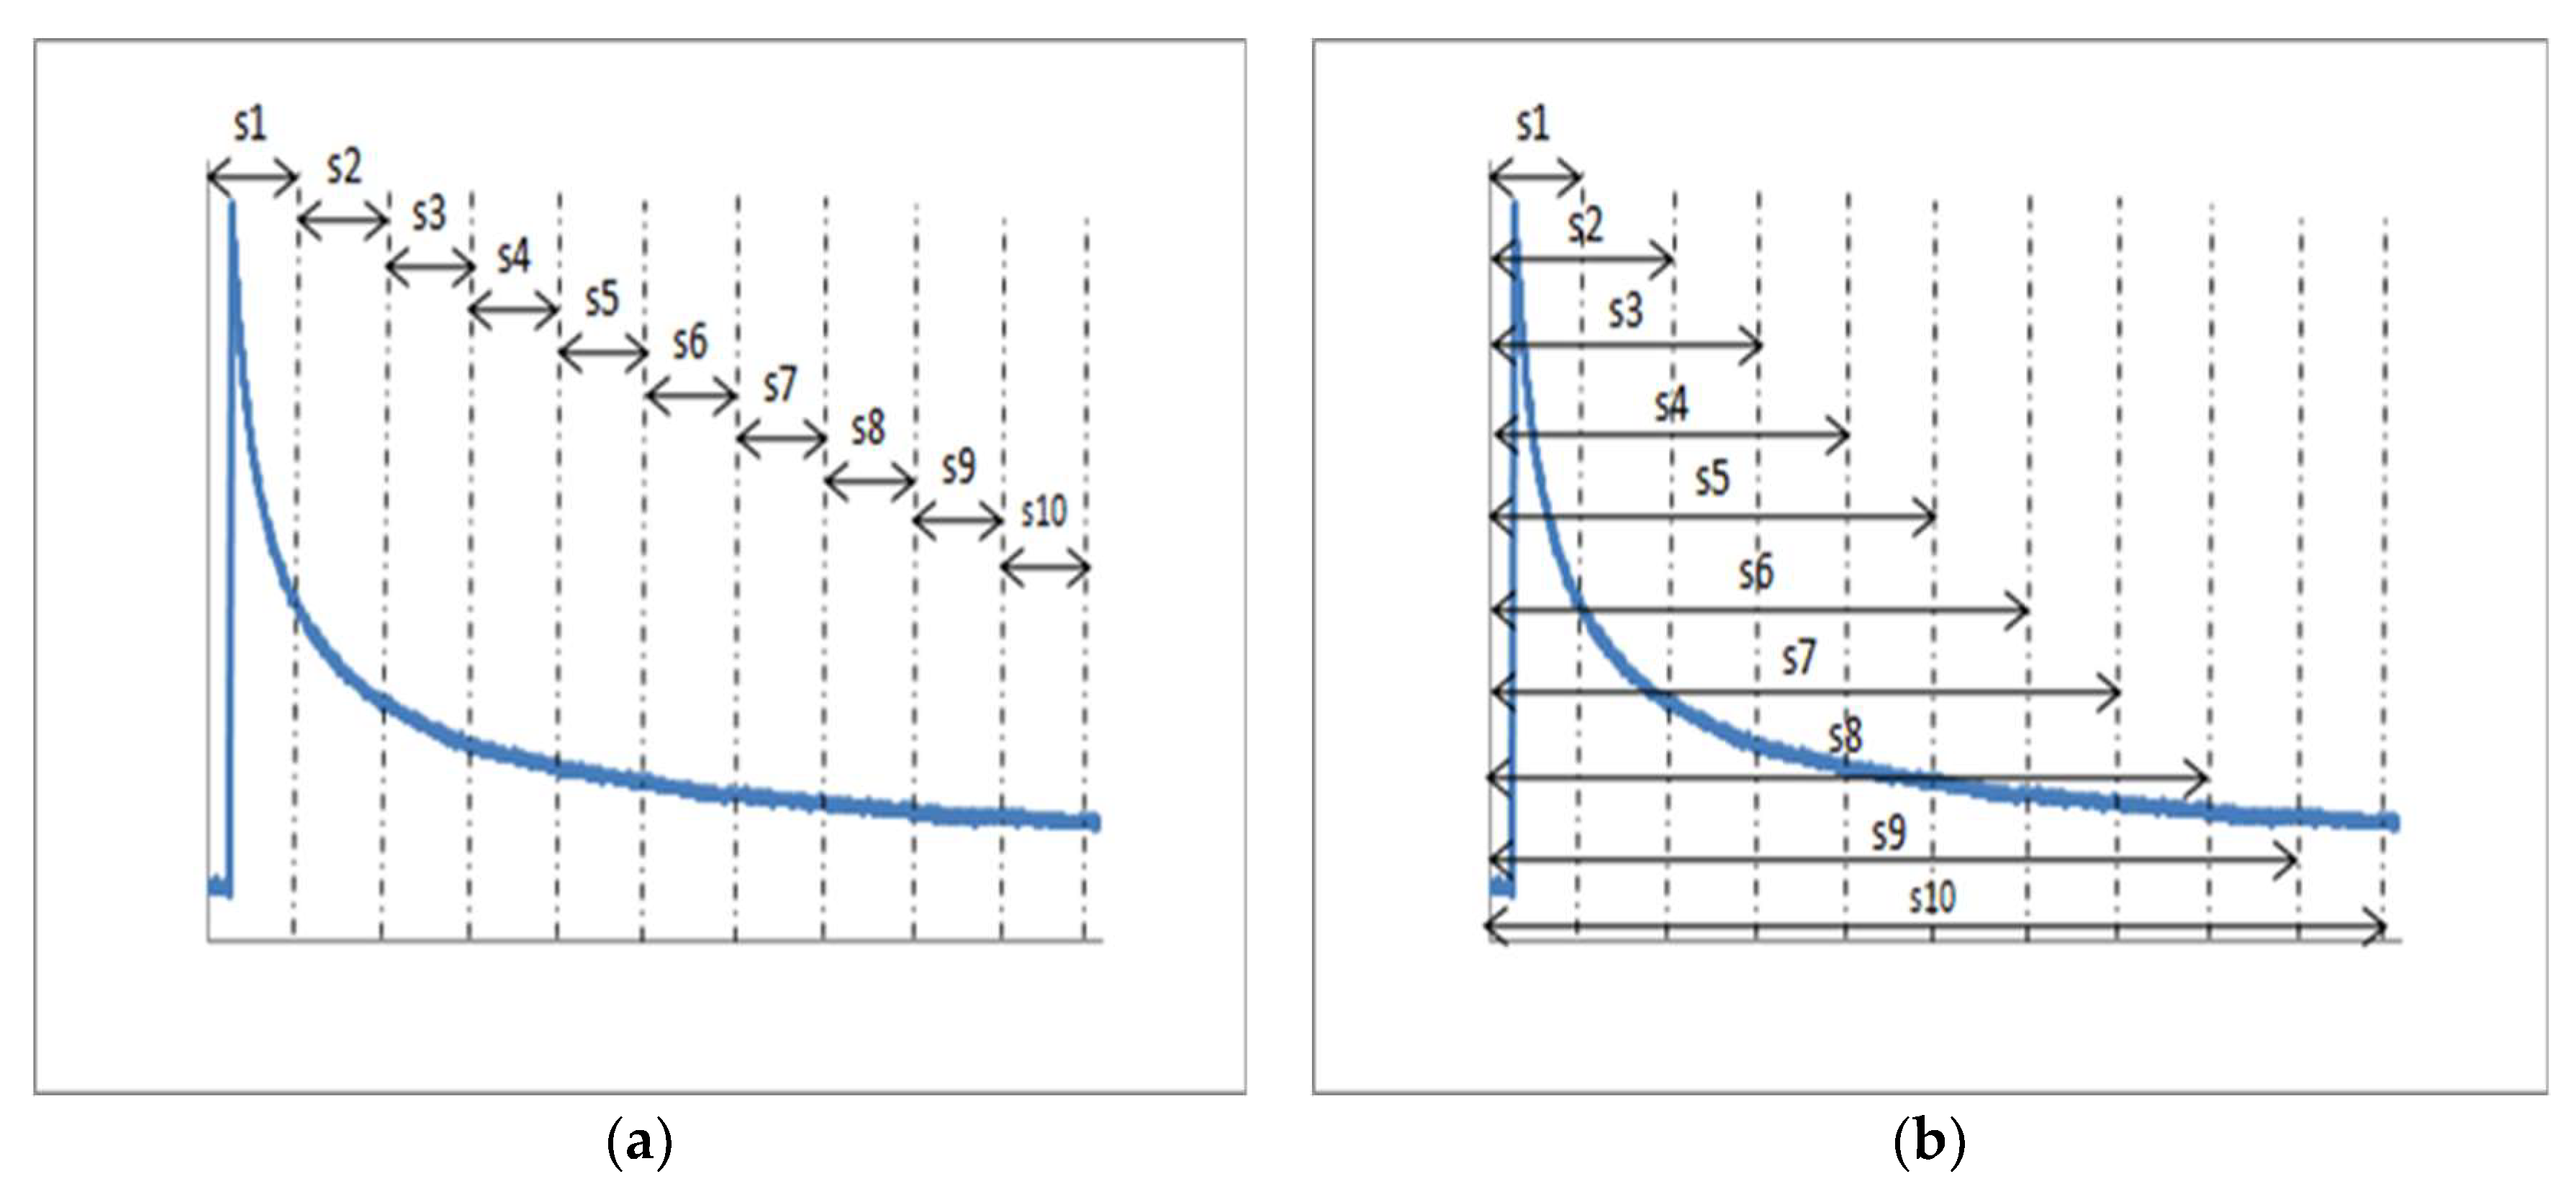
The Following are the key steps in the SLS fitting algorithm:
Fit the entire signal using Equation (2) to get an average .
Divide the OTTER signal into several separated pieces, see
Figure 2a.
Fit each piece of the signal using Equation (2) and get β for each piece.
Associate each piece to a certain skin depth using Equation (4).
Plot β against the mean detection depth to get the skin depth profile. By converting β to water content, we can also get the skin hydration depth profiles.
However, this approach presents several issues. First, it is physically inaccurate, as the OTTER signal comes from all skin depths, not just a certain depth. Second, the fitting can become unstable, especially for the pieces near the tail of the signal, such as S8, S9, and S10 in
Figure 2a.
To improve the fitting, an enhanced SLS fitting is proposed. In this case, the OTTER signal is divided into progressive pieces, e.g., every piece is starting from the same beginning, and progressively increased in length, see
Figure 2b. This approach is more physically sound and brings better stability of the fitting.
The advantages of the SLS fitting are it is simple and fast in performing the calculation, which is very important for real-life applications. It is also very effective, as our previous studies show that it can effectively differentiate homogenous samples from non-homogenous samples [
20]. The skin hydration depth profiles calculated by SLS fitting are generally in agreement with the literature values [
26,
27].
3. Results and Discussions
In this paper, all the experiments were performed on healthy volunteers (aged 20–35, male), under the standard laboratory conditions of 21 ± 1 °C in temperature, and 40% ± 5% relative humidity. All the volunteers were acclimatized for 15 min before the measurements.
3.1. OTTER Signals at Different Detection Wavelengths
Figure 3 shows typical OTTER signals of an in vivo skin site at the back of the left hand index finger (middle phalange), at seven detection wavelengths, i.e., 13.1 μm, 11.5 μm, 9.5 μm, 8.5 μm, 7.79 μm, 6.48 μm, and 6.05 μm. OTTER signals at different detection wavelengths have different amplitudes and decay shapes. The amplitude of the signal depends on the laser power, sample’s absorption coefficient for its infrared emission, and blackbody radiation power. The signals at 9.5 μm, 8.5 μm, and 7.79 μm, with the relatively high amplitudes, is largely due to the high blackbody radiation at this region. By normalizing the OTTER signal to its peak amplitude, we can eliminate the effects of laser power and blackbody radiation power, etc. The decay curve shape will be mainly dependent on the sample’s absorption coefficient for its infrared emission [
2,
13].
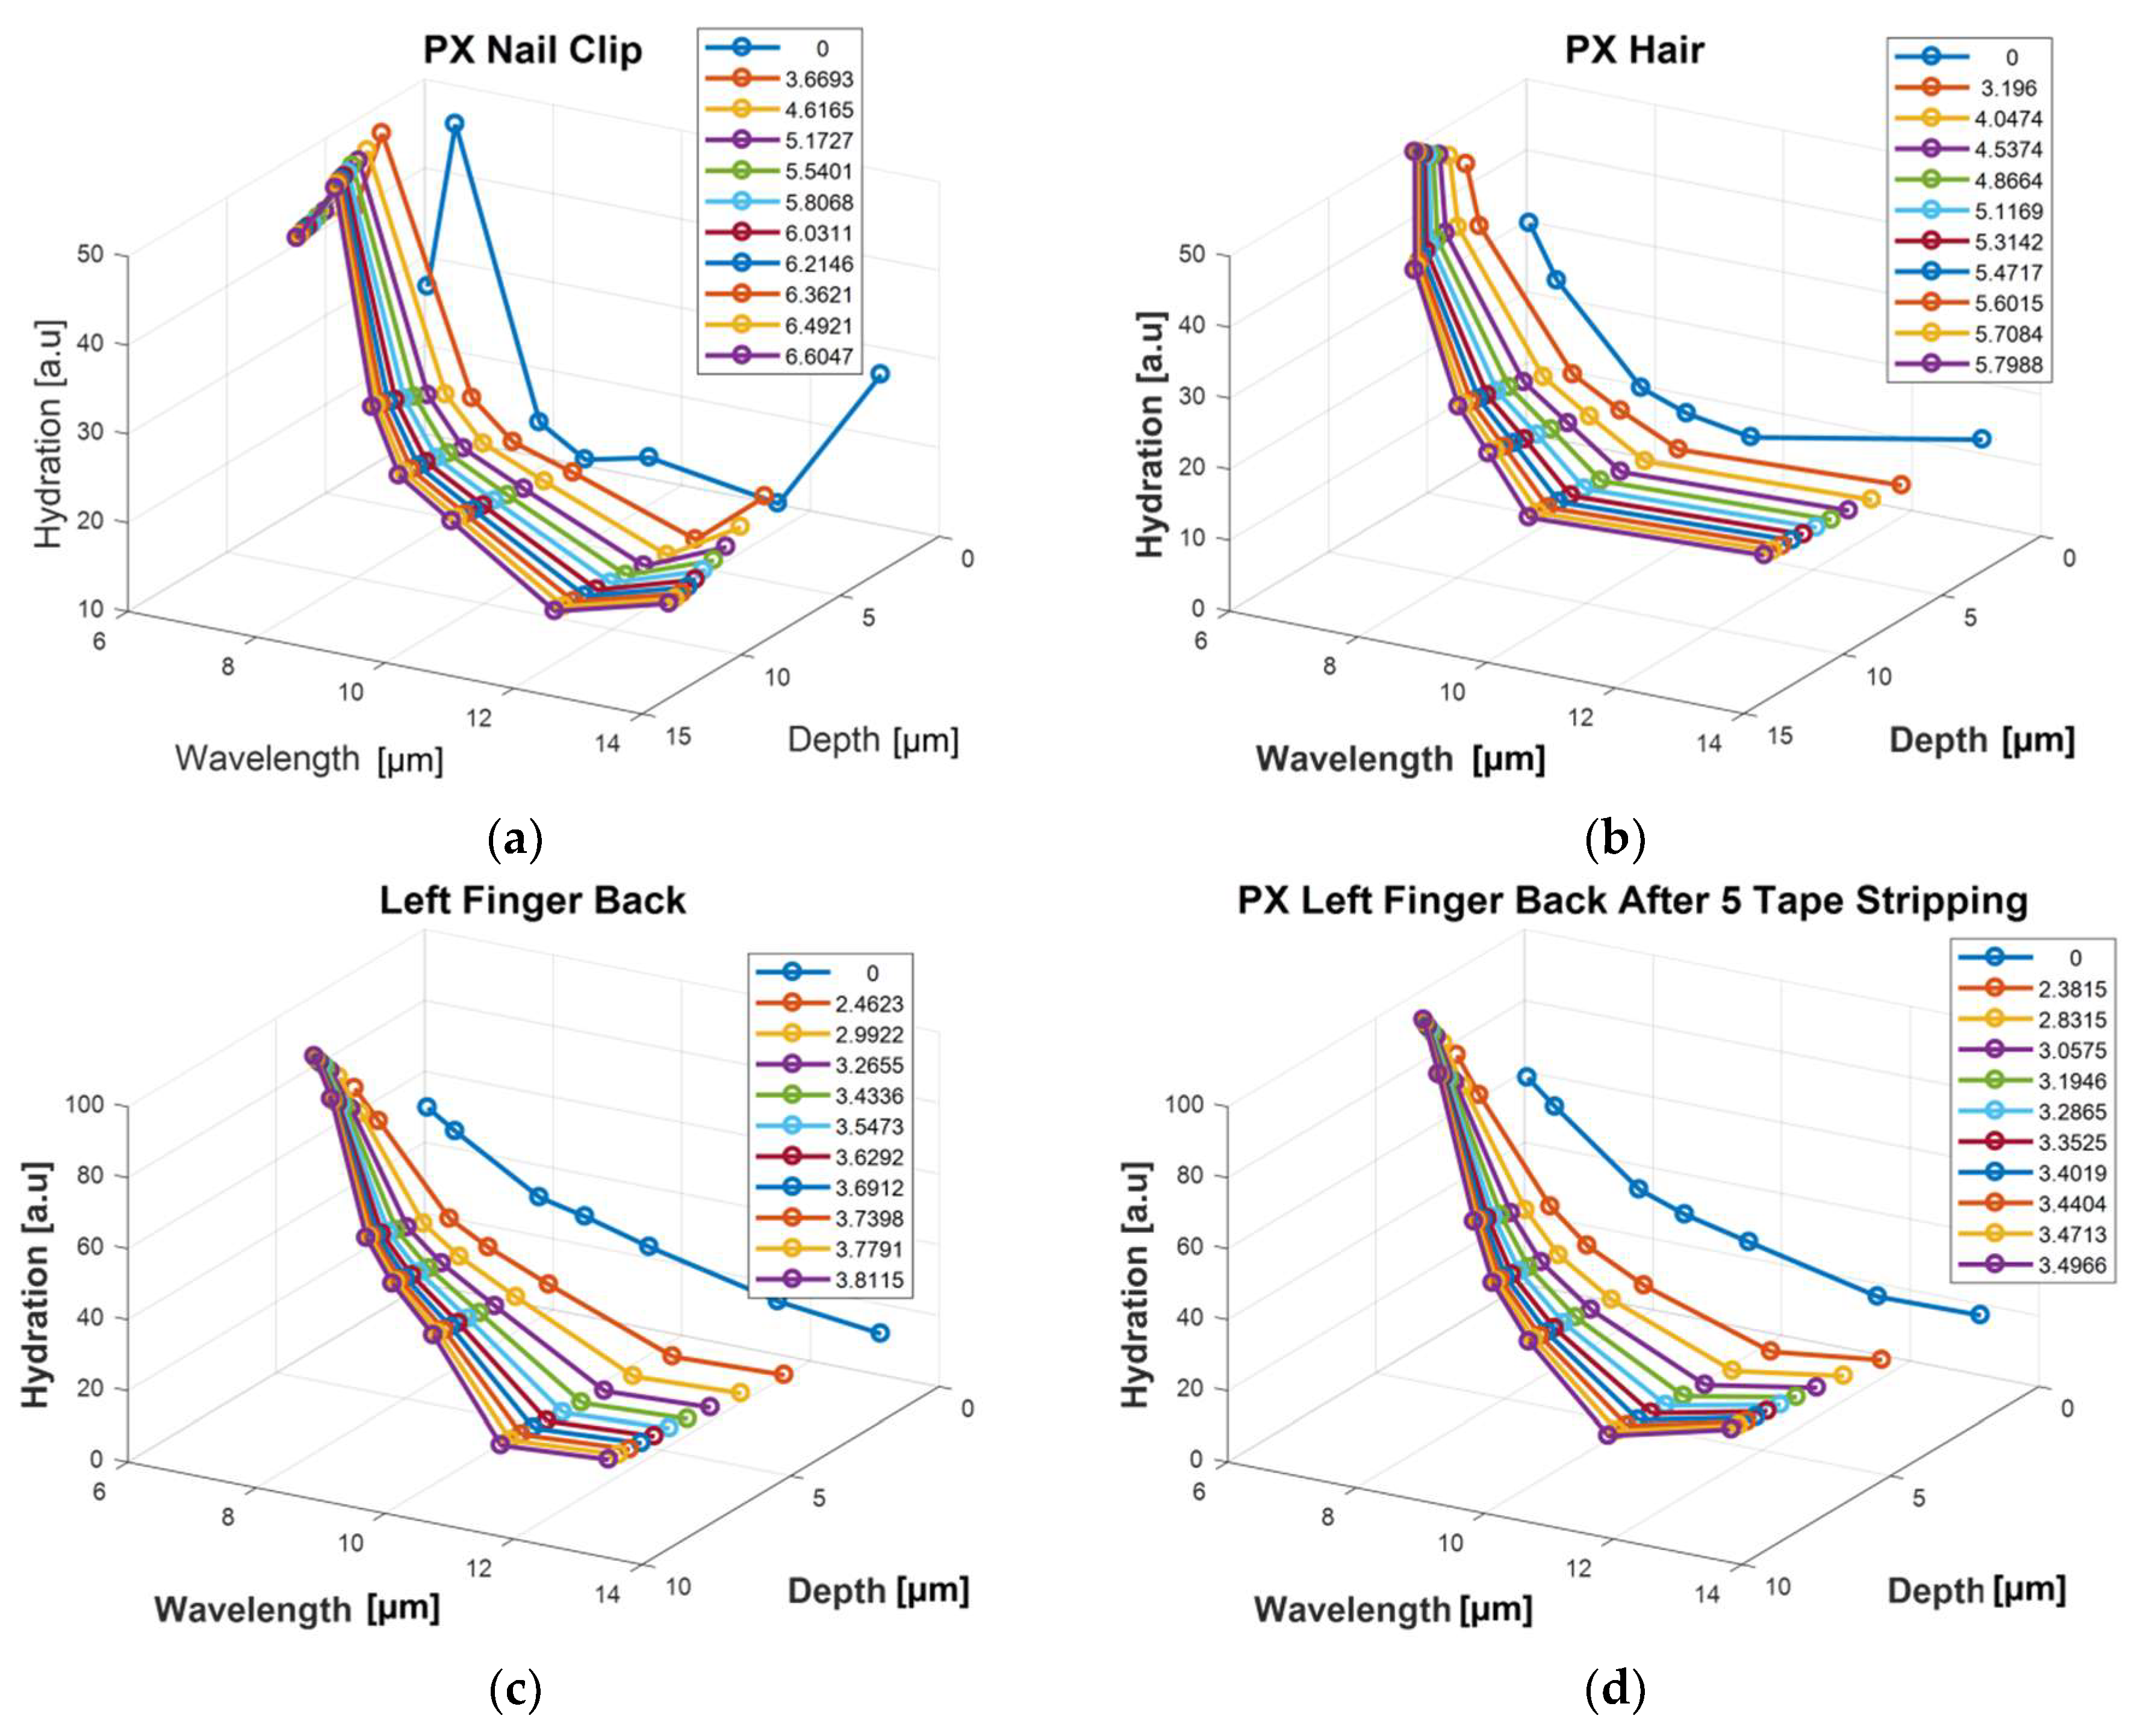
3.2. OTTER Spectra Results
By least squares fitting the OTTER signals at different wavelengths using Equation (1), we can get the OTTER spectra results.
Figure 4 shows the spectra results of human nail (index finger nail, left hand), hair, normal finger (back of left hand index finger, middle phalange), as well as finger (back of left hand index finger, middle phalange) after five times of tape stripping, compared with water spectra (not in real scale). From the spectra results we can clearly differentiate different samples and changes in samples. We can clearly see the differences between skin and hair/nail.
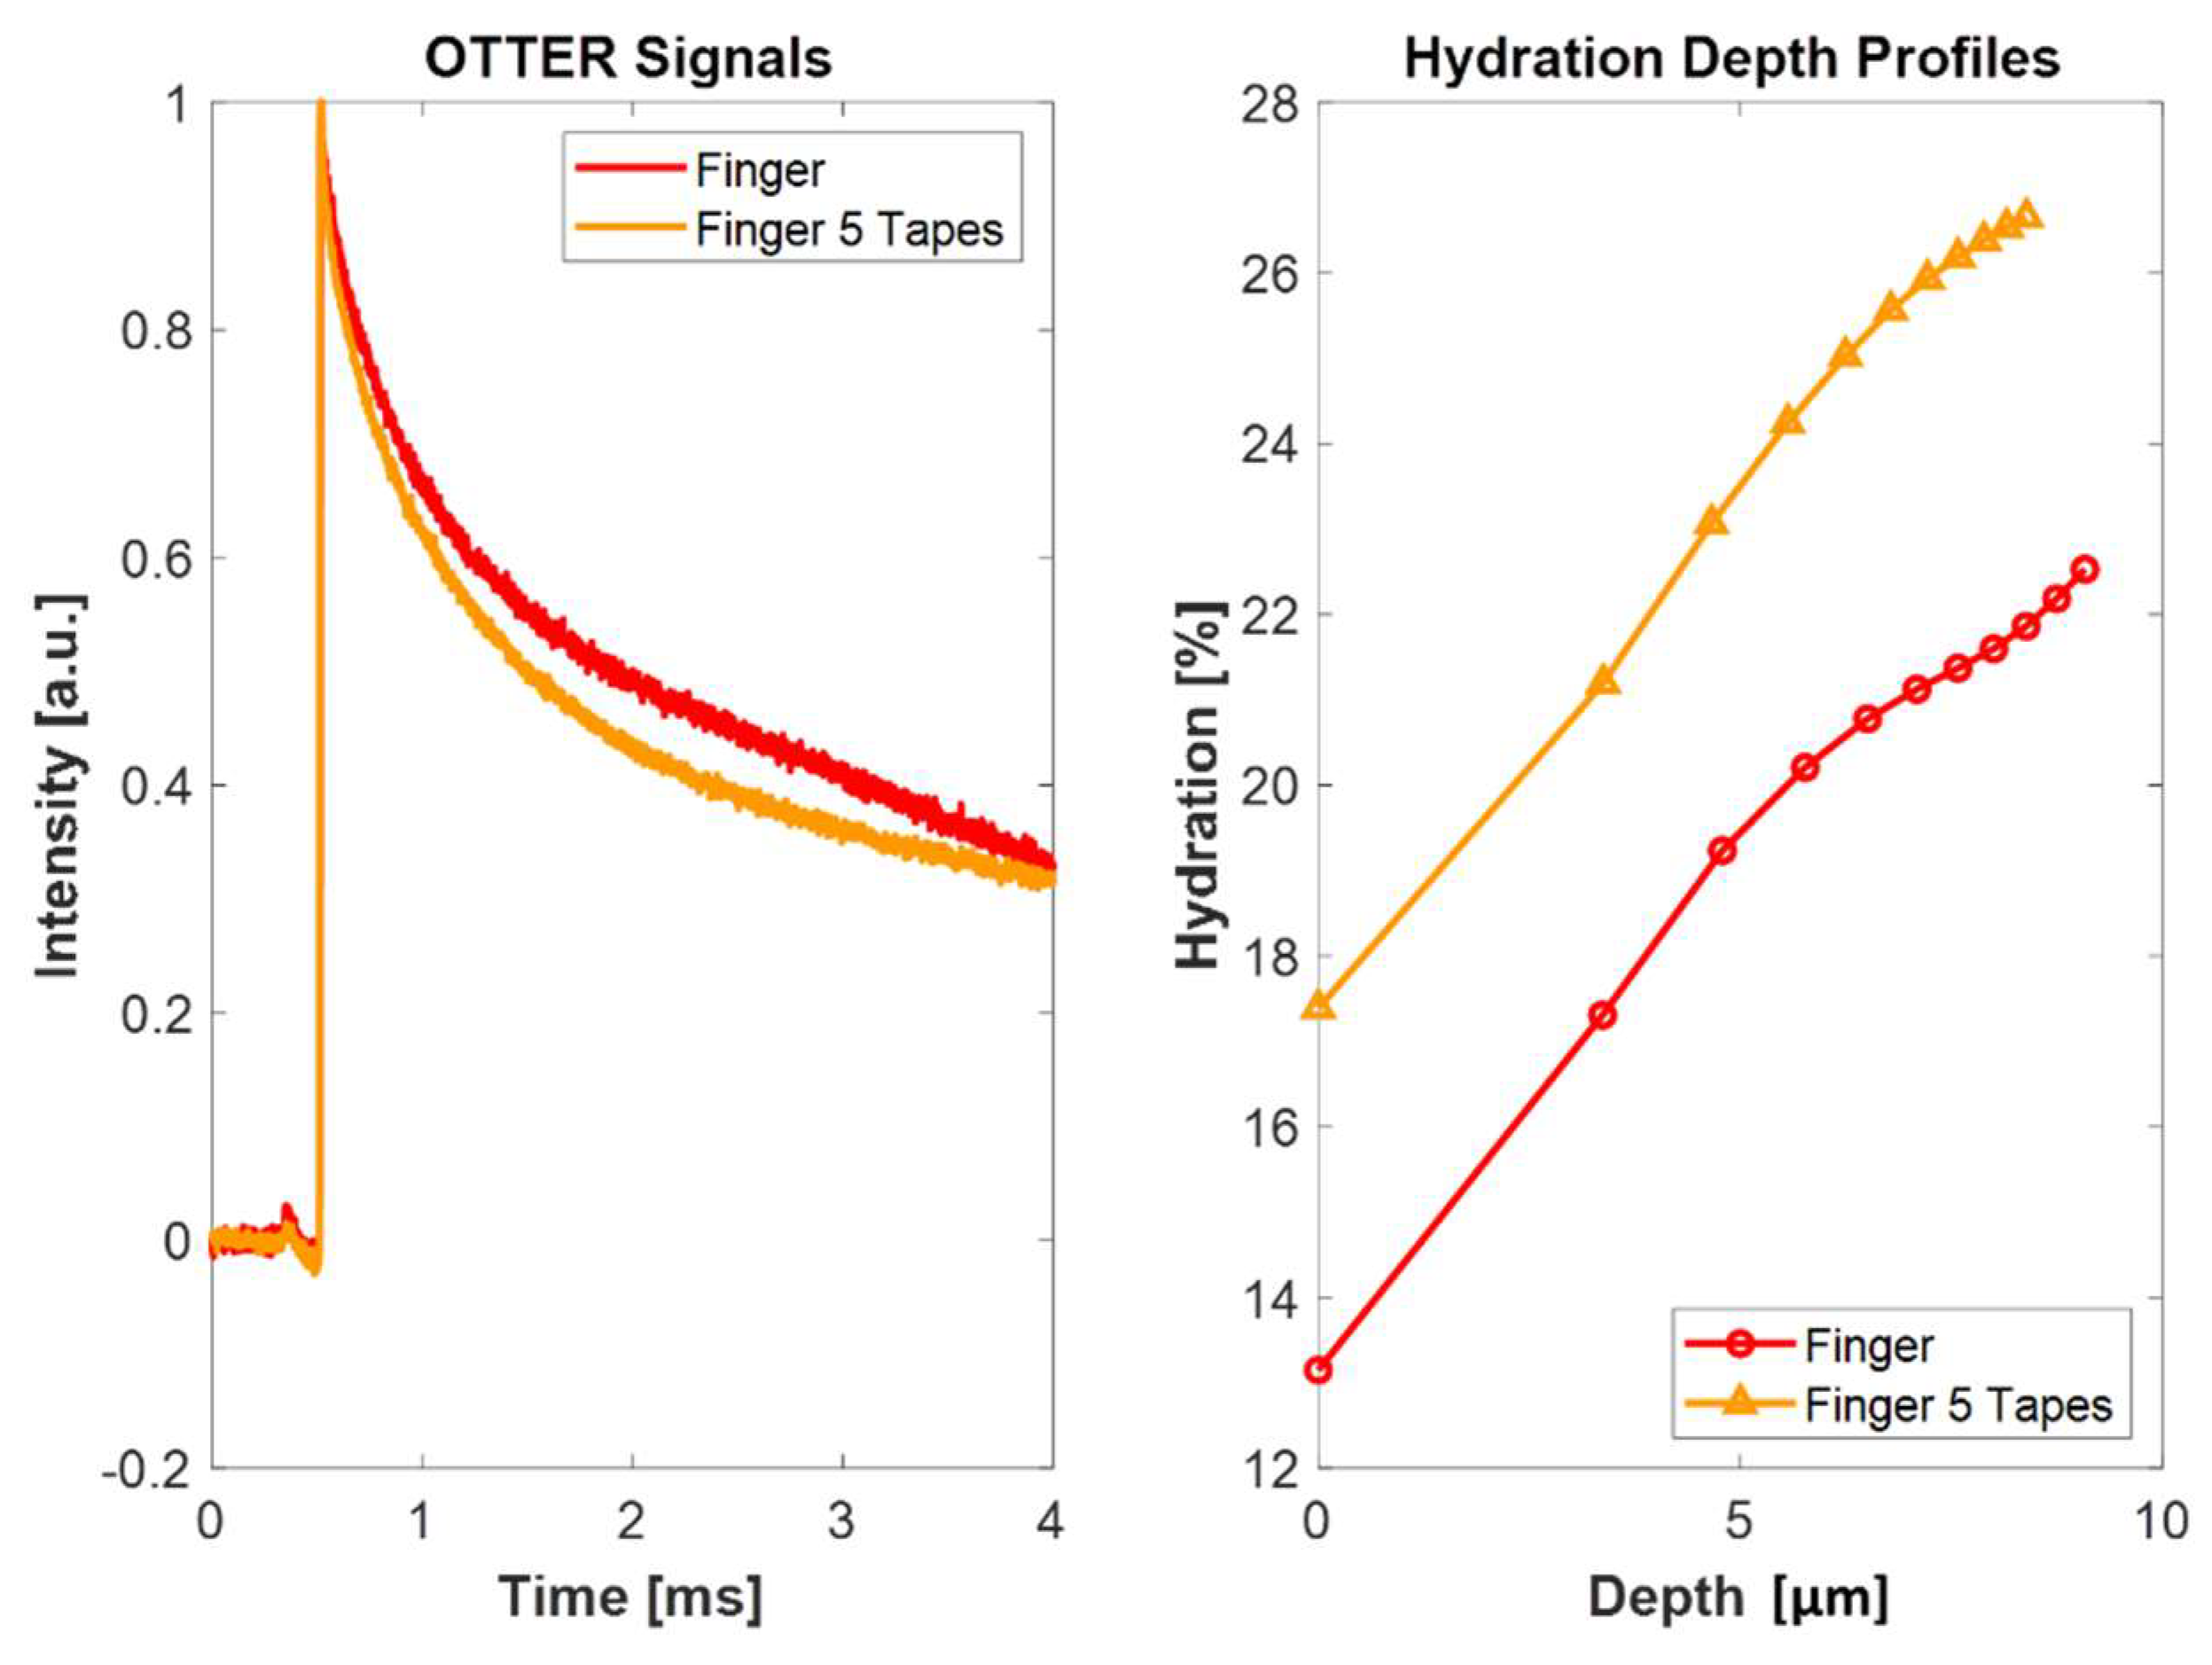
3.3. OTTER Signal Depth Profiling
Figure 5 shows OTTER signals at 13.1 μm detection wavelength of the skin sites for normal finger and after five times of tape stripping, as well as the corresponding skin hydration depth profiles calculated by using the enhanced SLS fitting algorithm. The skin site shows higher hydration levels after tape stripping.
By applying depth profiling to the OTTER data at all detection wavelengths, as shown in
Figure 3, we can get a depth-resolved spectrum, i.e., the spectra at different depths of the sample, see
Figure 6. The results show that the surface spectra are quite different from that inside the skin. This depth-resolved spectra will be very useful for skin studies, as there are not many techniques that can resolve the top 10 μm of the skin surface.
3.4. OTTER In Vivo Skin Characterization Measurements
In this experiment, four different test skin sites (A: upper volar arm, B: lower volar arm, C: back hand, and D: palm) were chosen on a health volunteer (male, aged 30), and again seven different detection wavelengths (13.1 μm, 11.5 μm, 9.5 μm, 8.5 μm, 7.79 μm, 6.48 μm, and 6.05 μm) were used.
Figure 7 shows the spectra data of the four skin sites, compared with a water spectrum.
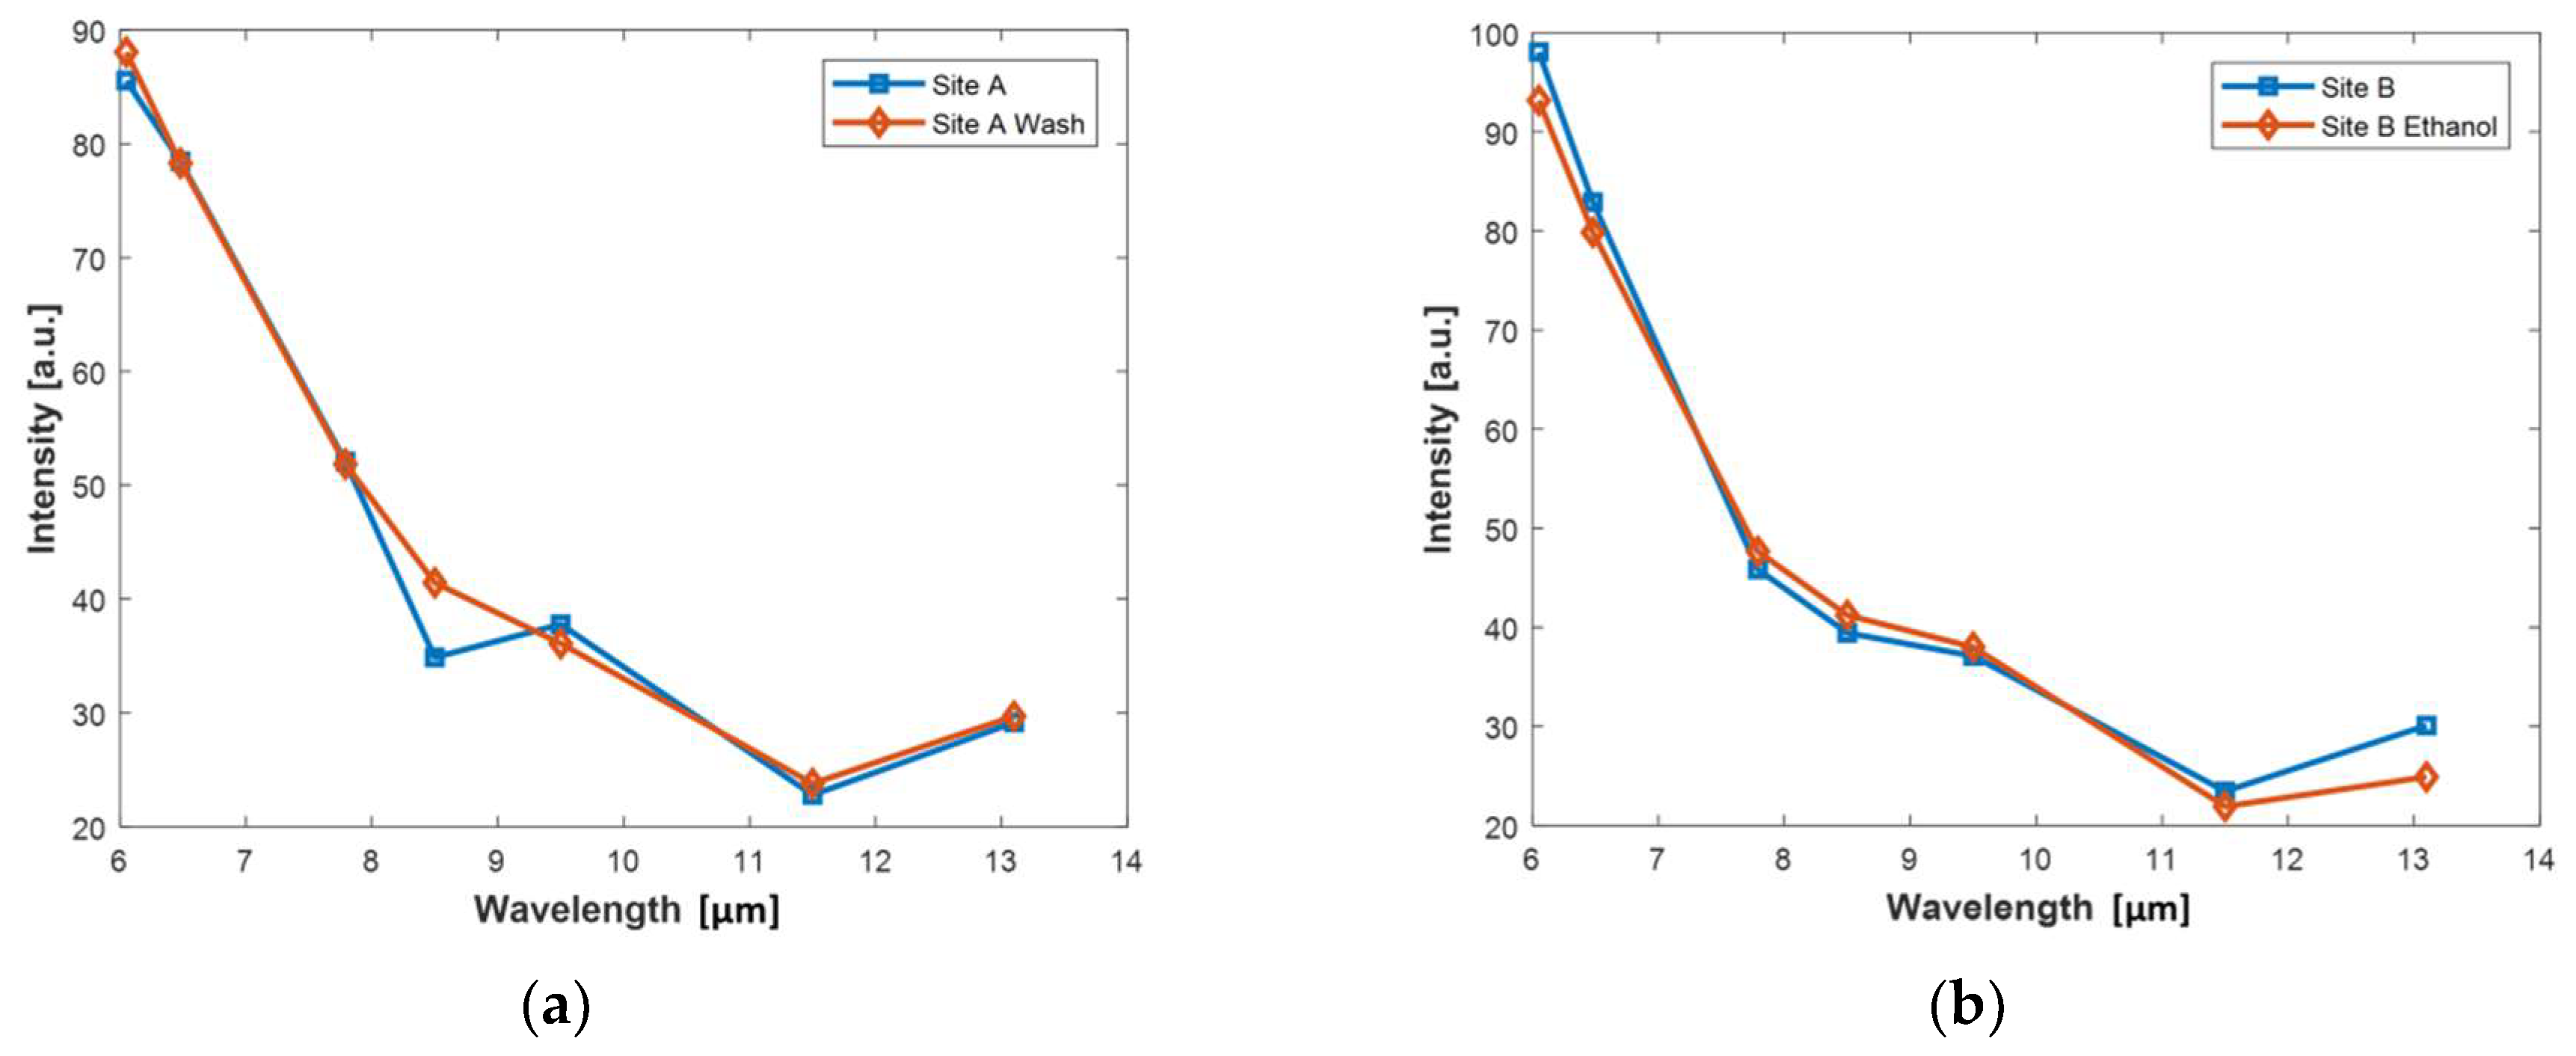
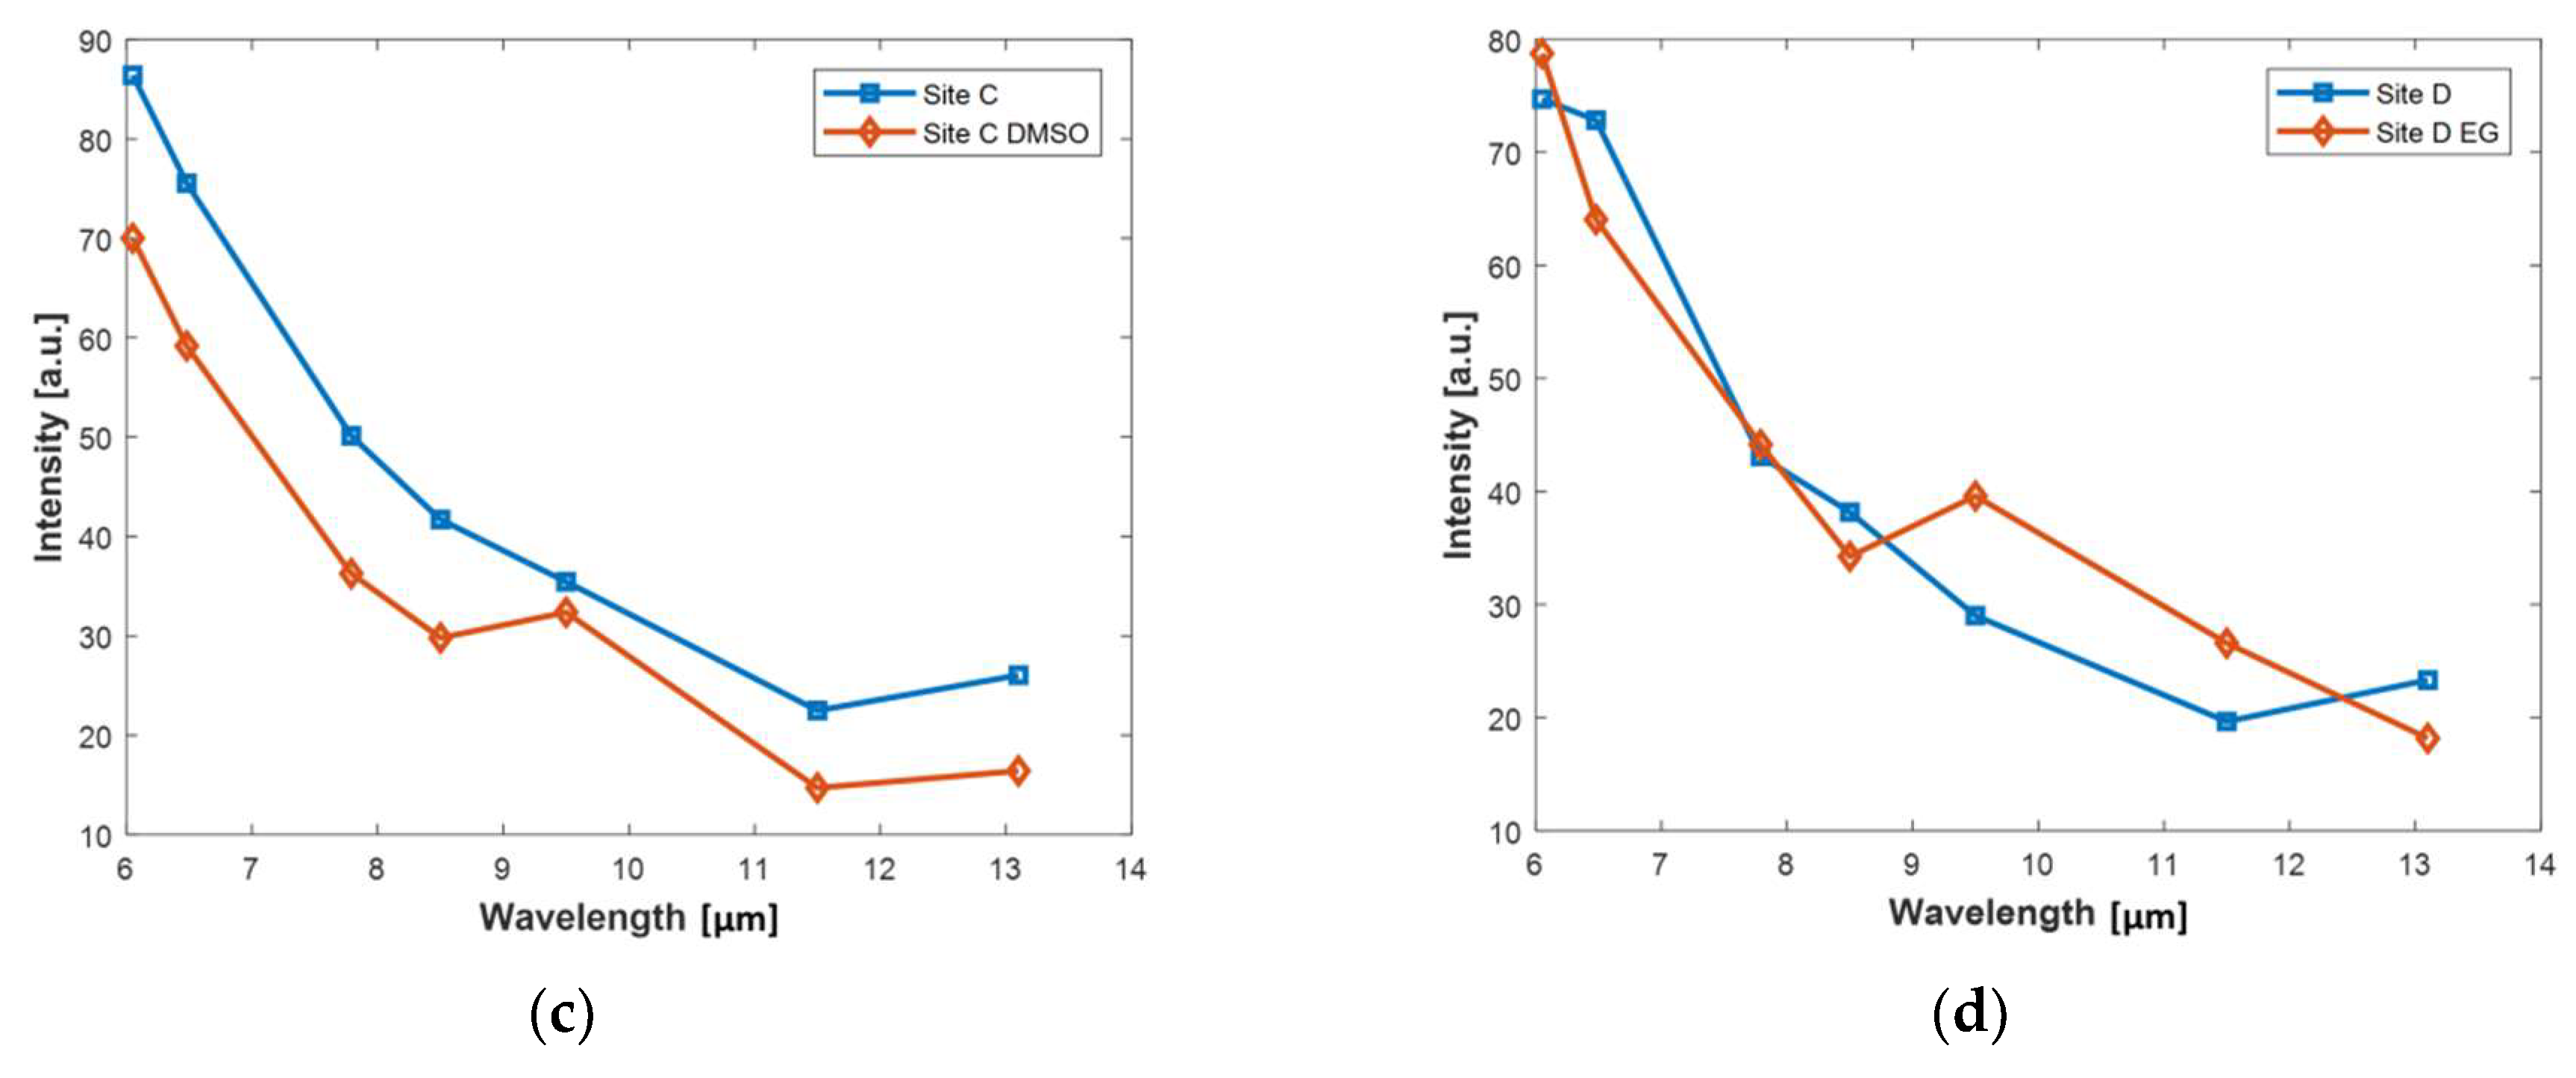
The four skin sites were then treated differently in order to observe the changes. Skin site A was washed by a soap twice, for 3 min each time. Skin site B was applied with pure ethanol for 5 min. Skin site C was applied with pure DMSO (dimethyl sulfoxide) solvent for 5 min. Skin site D was applied with ethylene glycol (EG) for 5 min.
Figure 8 shows the OTTER spectra changes for Site A, Site B, Site C, and Site D. Clearly, the different treatment caused different spectra changes for the different skin sites.
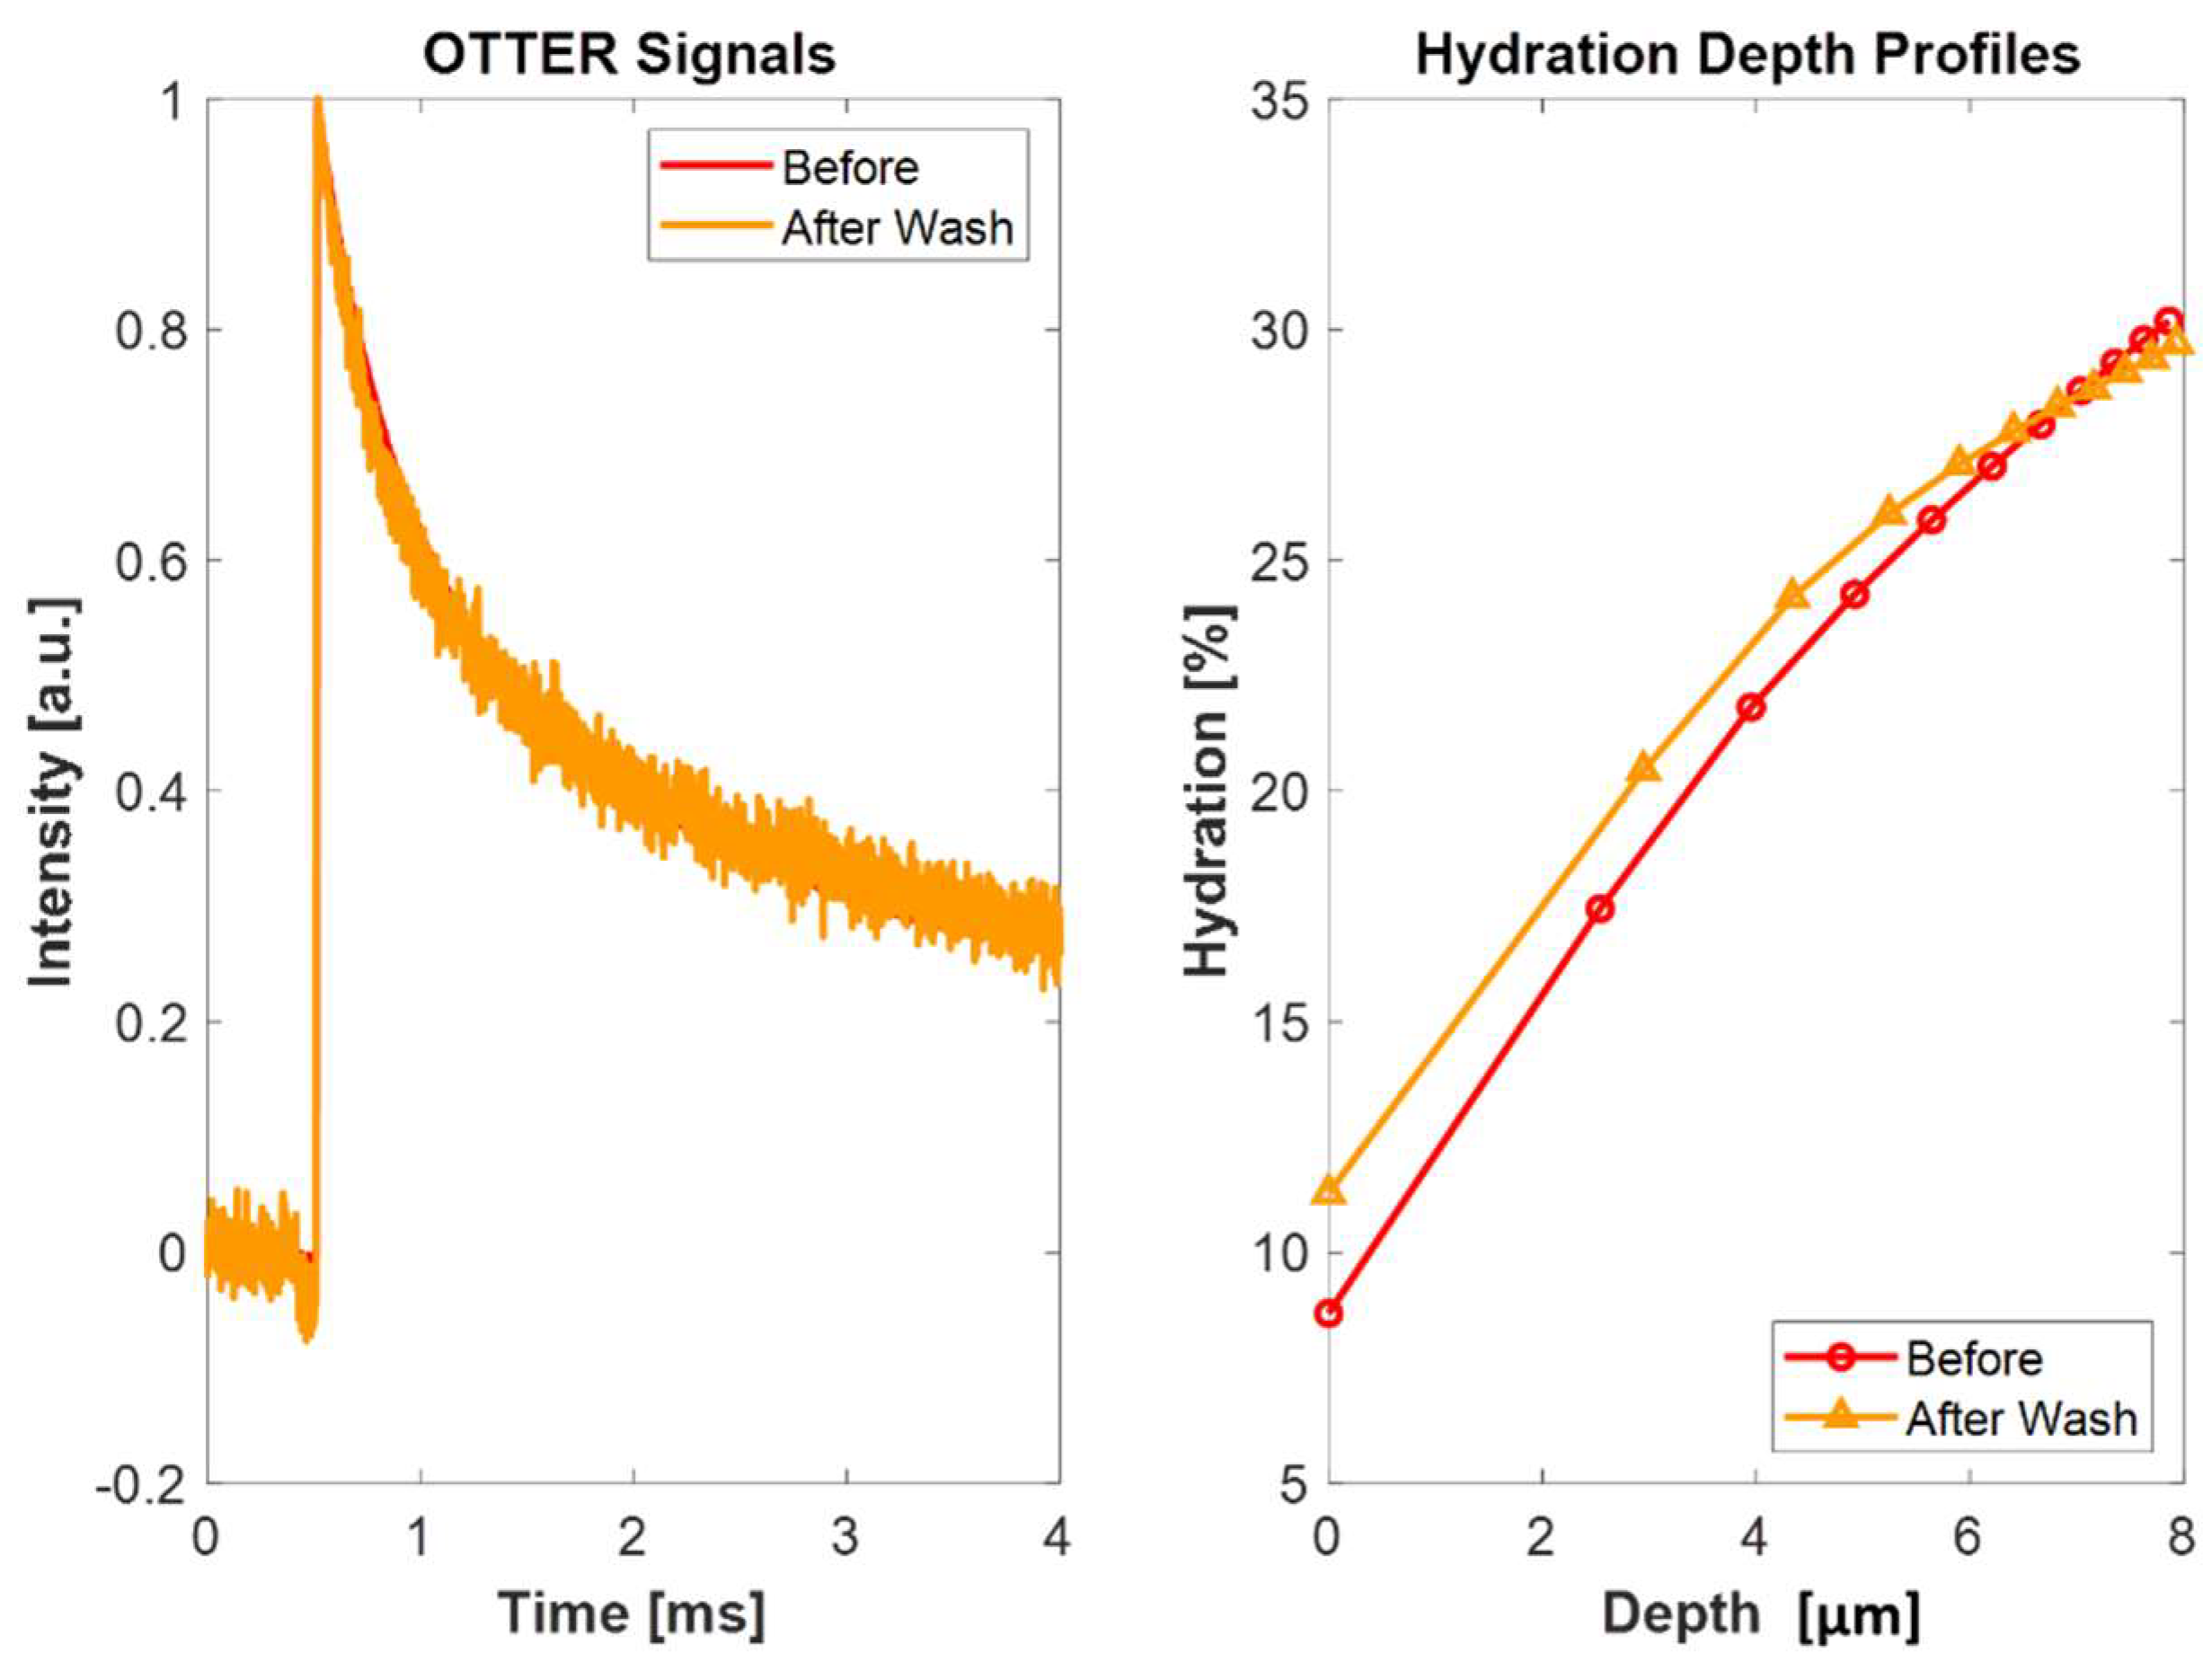
By looking at the OTTER signals and results at the 13.1 μm detection wavelength, we can understand how the skin hydration changes for these four different skin sites.
Figure 9 shows the OTTER signals at 13.1 μm and corresponding depth profiles of Site A, before and after washes. The results show that the washing causes an increase of skin hydration level, however, the washing affects skin surface more, and affects deeper skin less. This indicates washing only affect the skin surface layers.
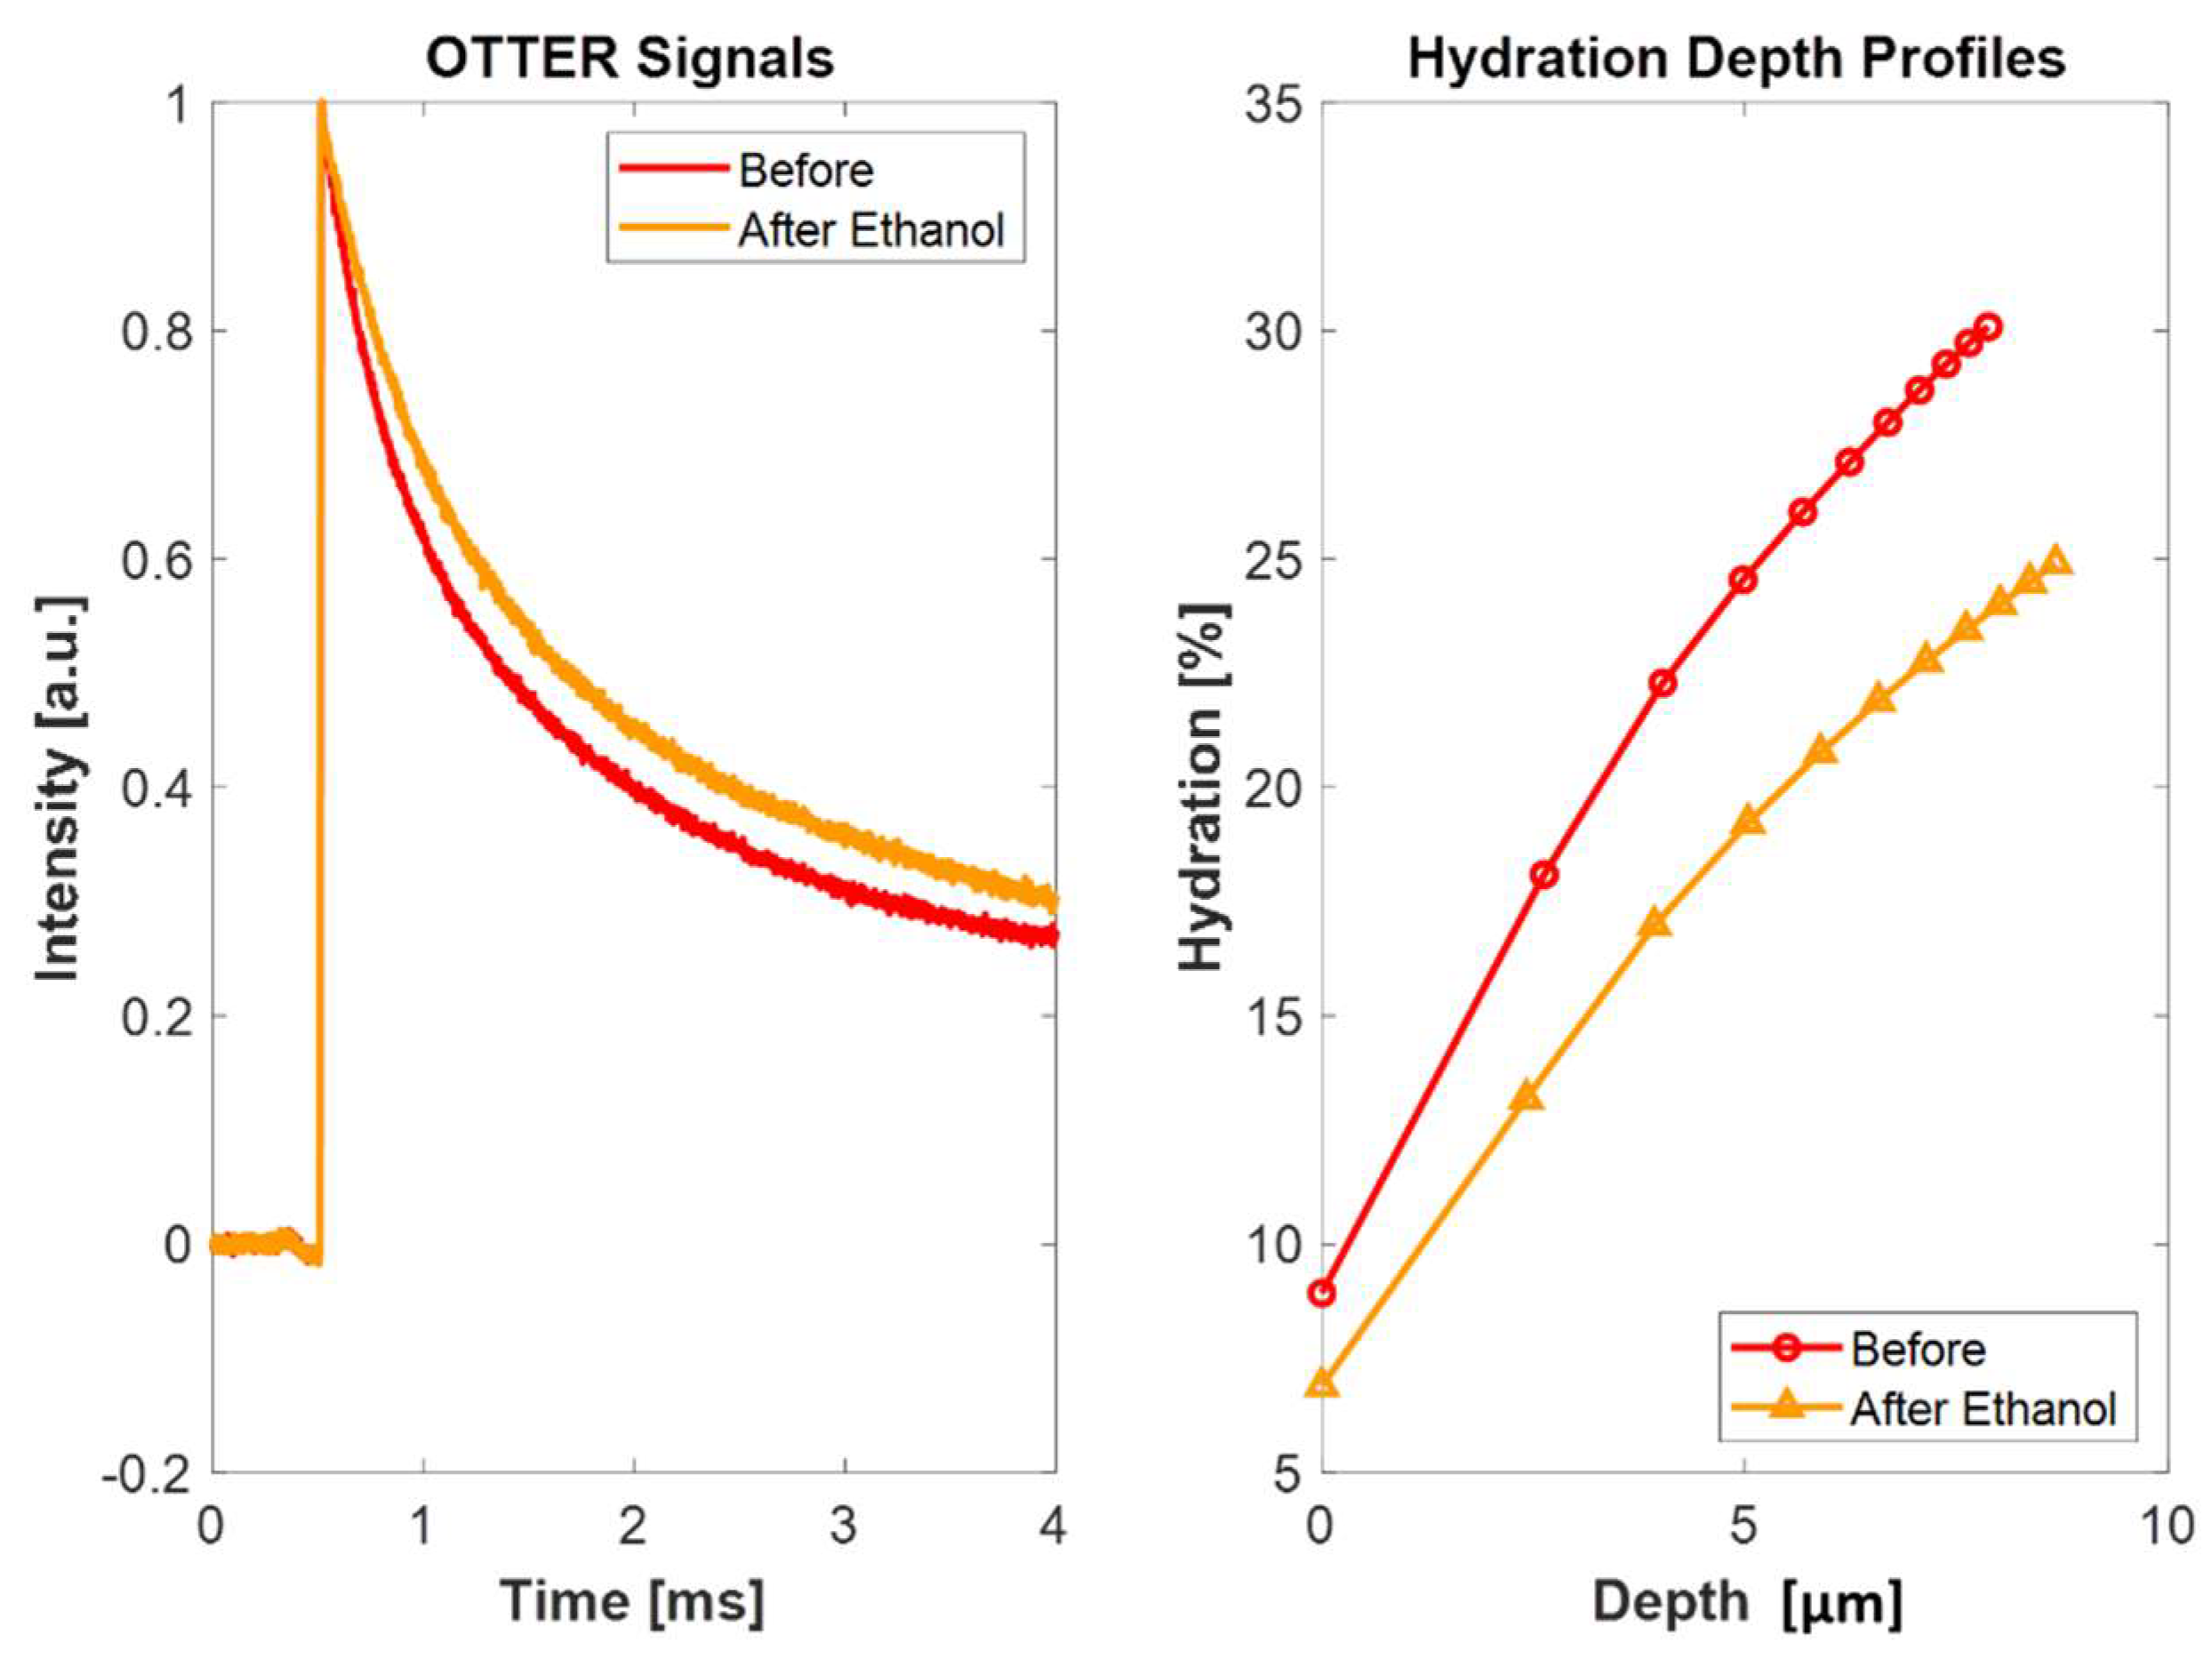
Figure 10 shows the OTTER signals at 13.1 μm and corresponding depth profiles of Site B before and after a 5 min ethanol application. The results show that ethanol causes skin hydration level to decrease, ethanol affects all depths within skin, but affects deeper skin more. This indicates that ethanol has penetrated into some skin layers and causes some drying effect in these skin layers.
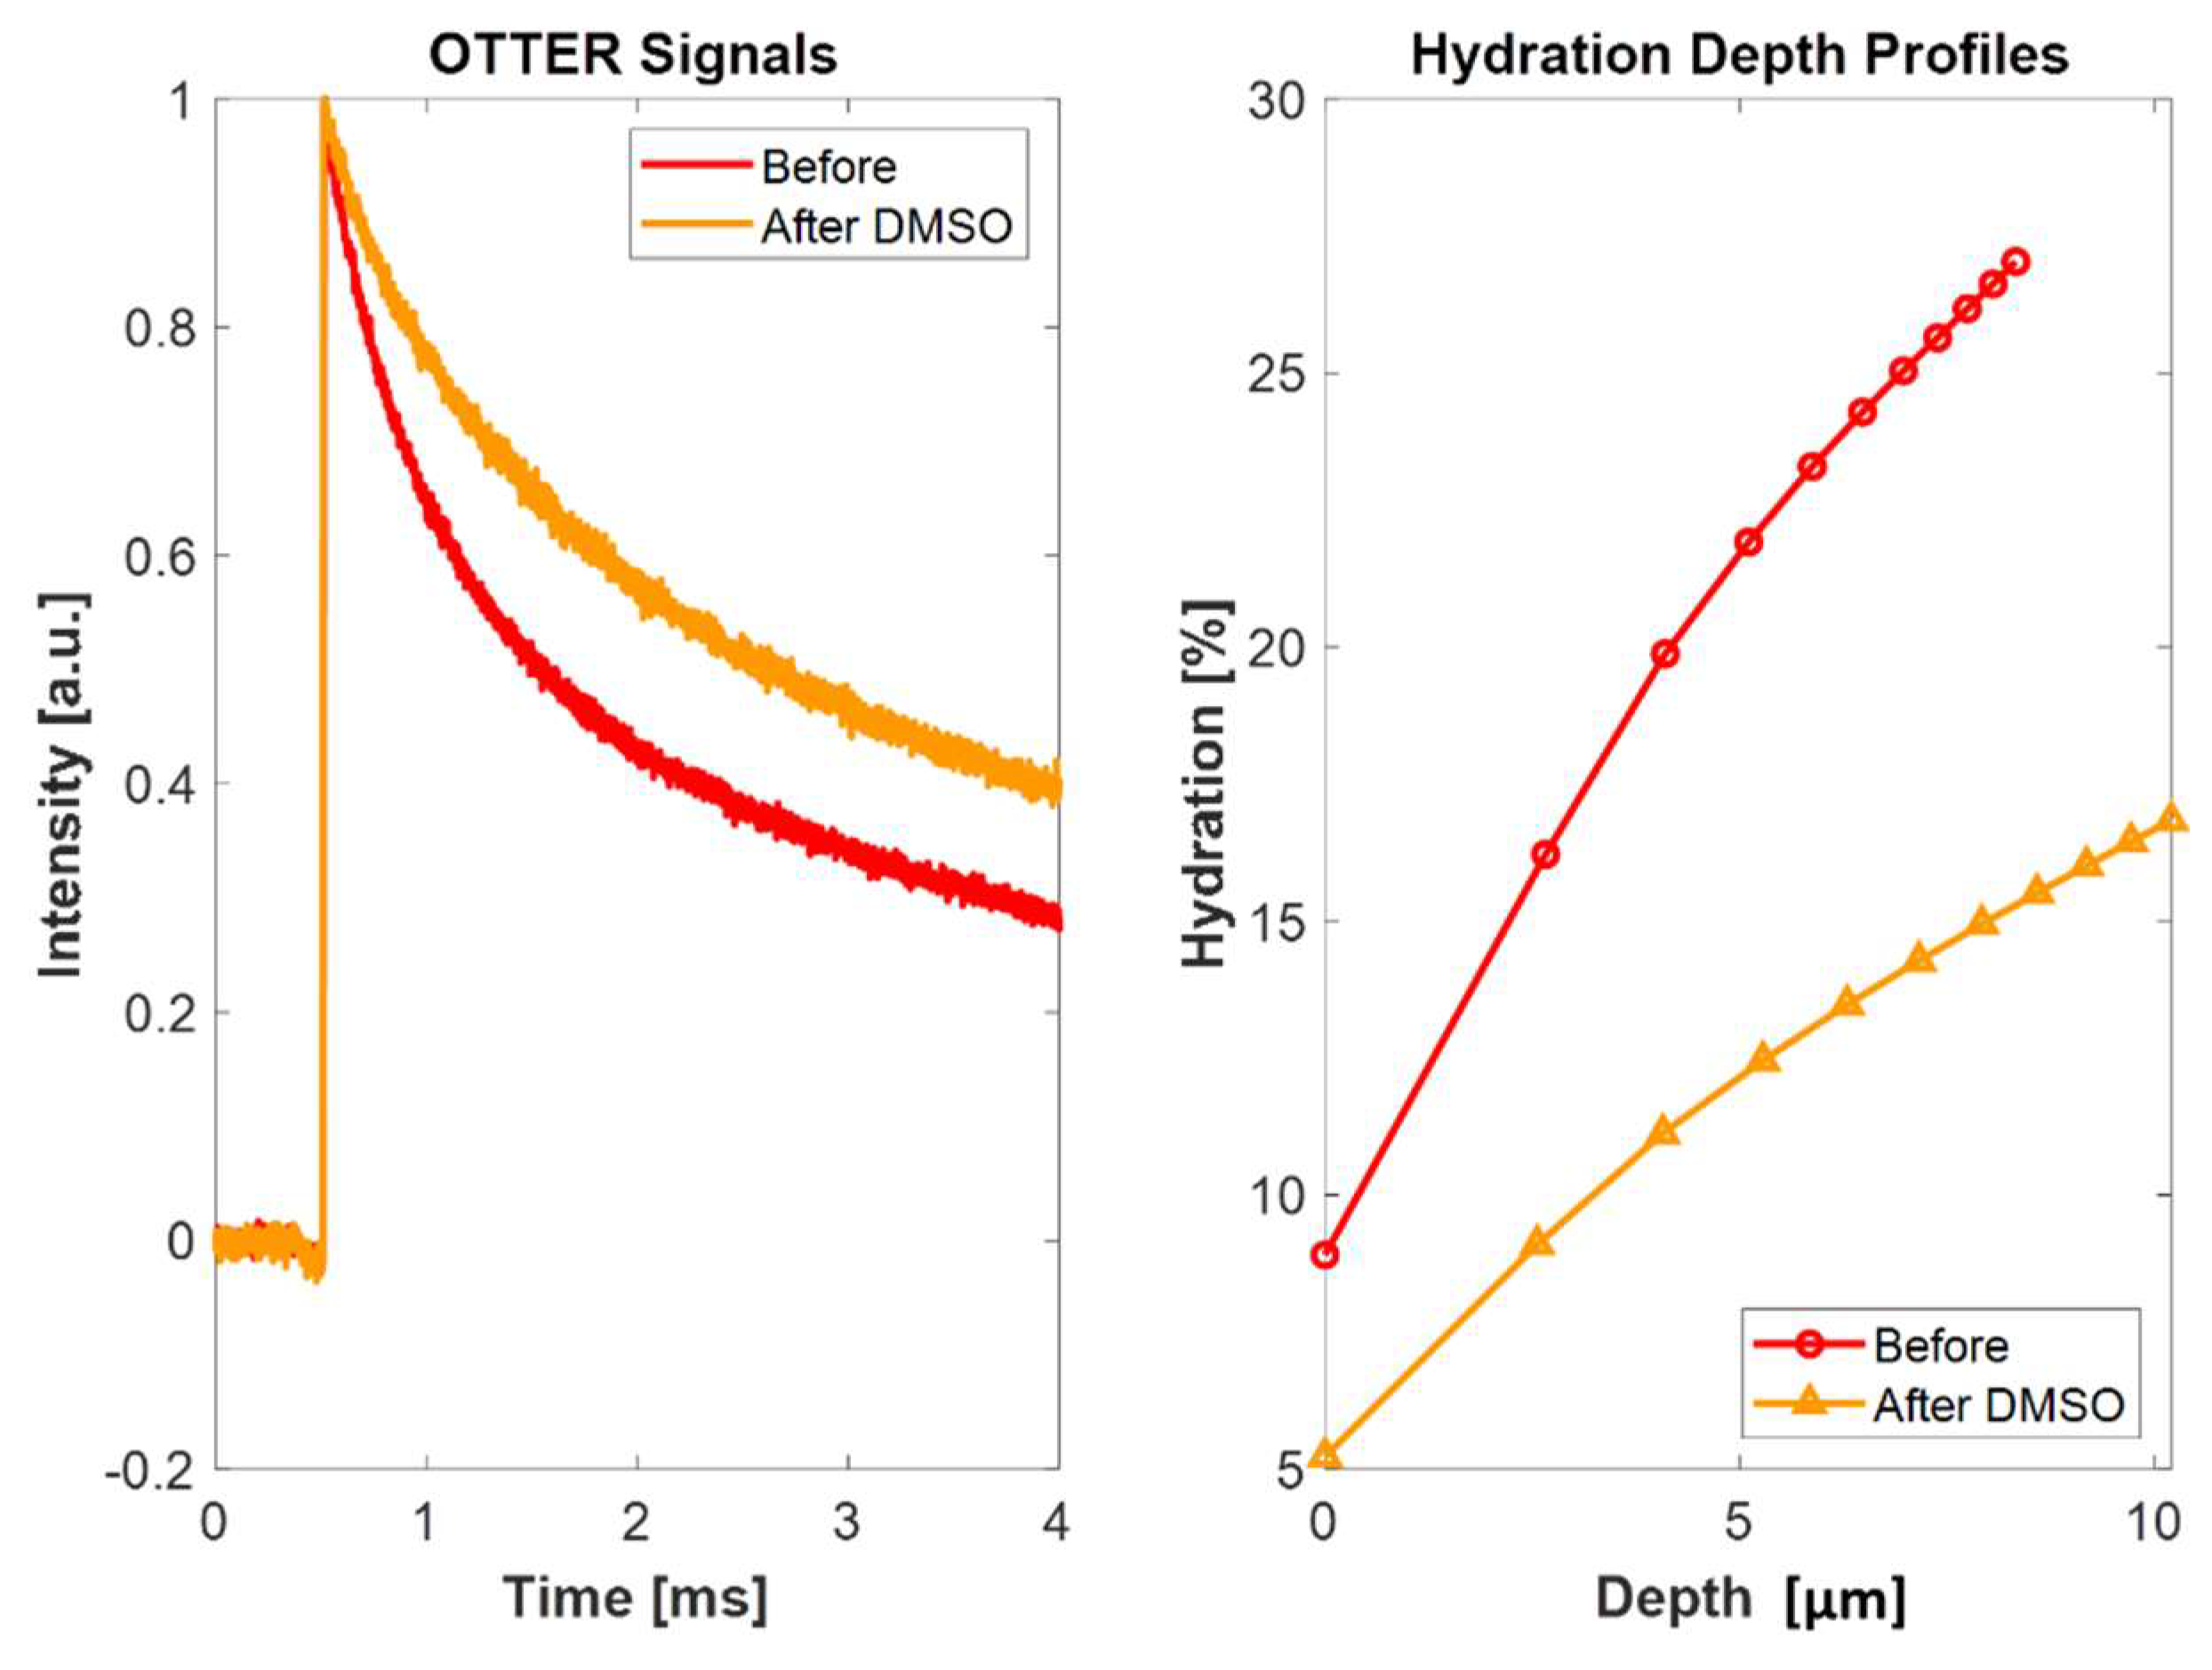
Figure 11 shows the OTTER signals at 13.1 μm and corresponding depth profiles of Site C before and after a 5 min DMSO application. The results show that DMSO also causes skin hydration level to decrease, even more than ethanol, DMSO also affects all depths within skin, and the biggest change happens at deeper skin. This indicates the DMSO has penetrated deep into skin, and cause skin hydration level to change. DMSO is a penetration enhancer that is used in many cosmetic and pharmaceutical products. DMSO can penetrate skin fast and easily. This is because DMSO can catalyze a conformational change, which creates holes in the keratin matrix that allows DMSO and molecules dissolved in DMSO to penetrate the skin easily.
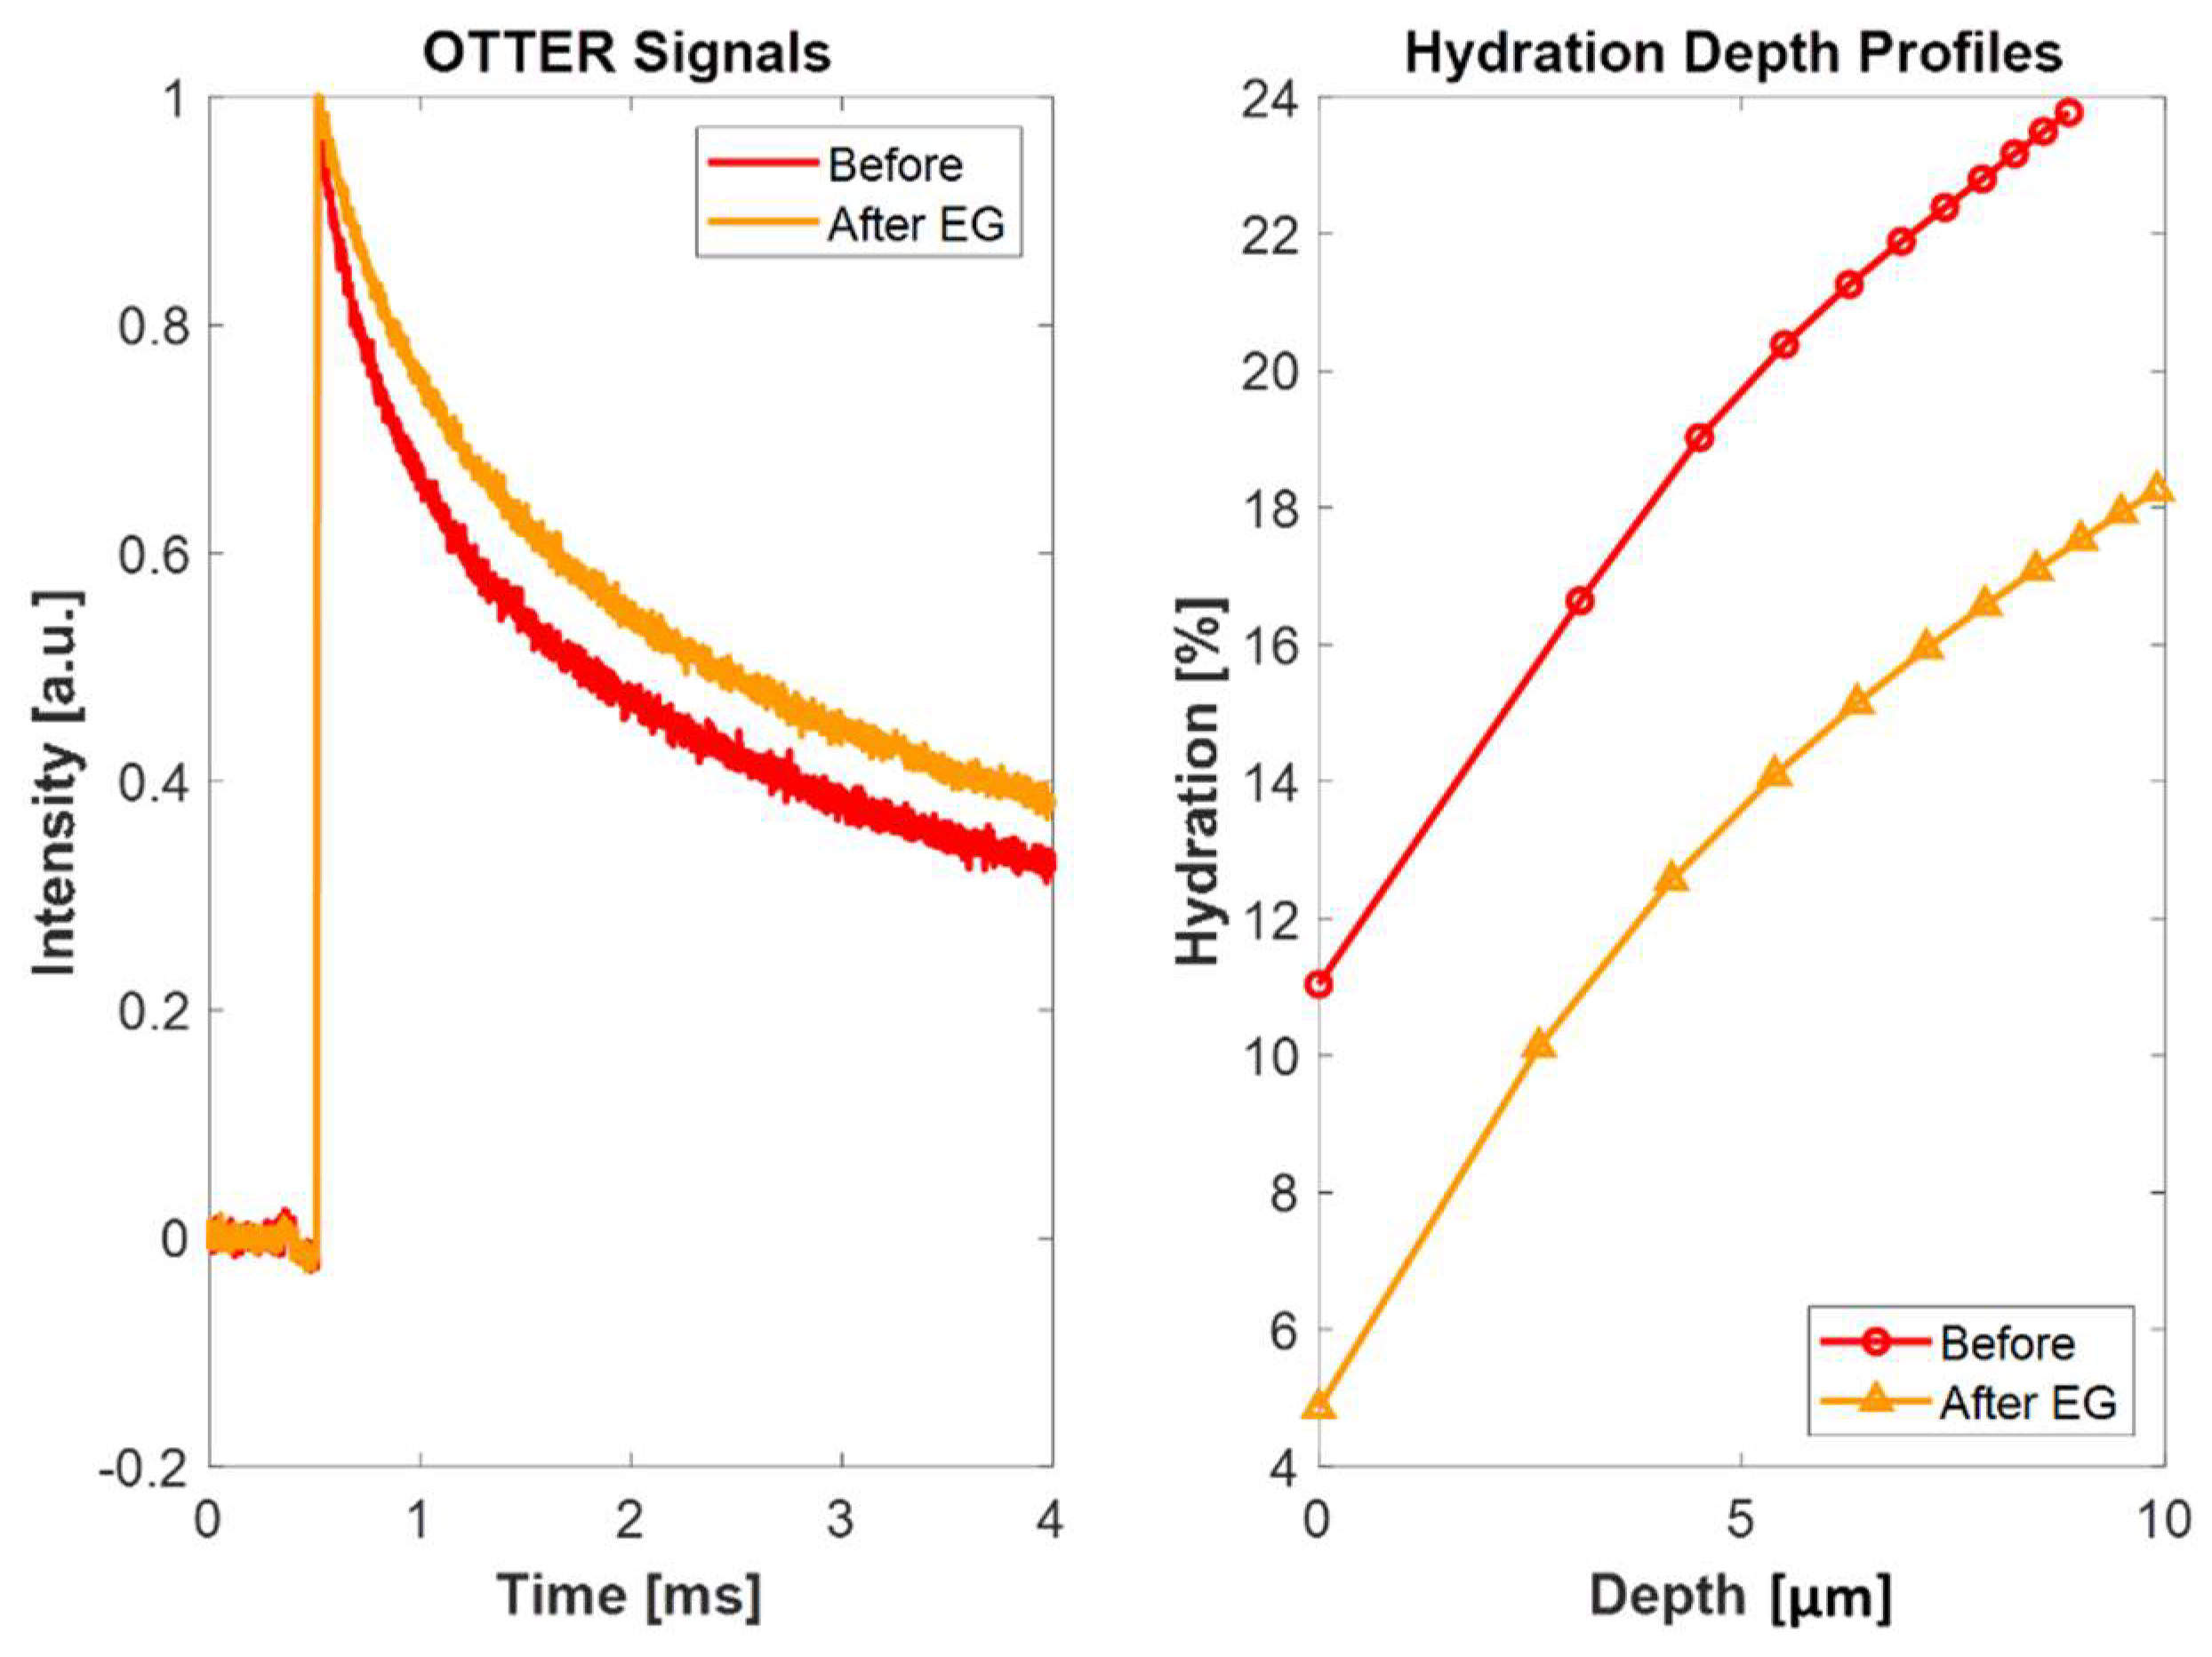
Figure 12 shows the OTTER signals at 13.1 μm and corresponding depth profiles of Site D before and after a 5 min ethylene glycol (EG) application. The results show that EG also affects all depths within skin, but that it is slightly more at deeper skin than at the surface. These results show that DMSO has the most significant impact on skin, followed by EG, and ethanol has the smallest impact on skin.
In summary, the overall results show that OTTER multiple detection wavelength signals can effectively differentiate the different samples, as well as different types of skin changes, and therefore could potentially be very useful for skin characterizations. It can also potentially identify different types of solvents applied on skin, even with mixed solvents.
The depth-resolved hydration profiles shows very interesting results. It can not only show the differences of the different skin sites, but also show the different types of skin changes. The depth hydration profiles show that washing only affect the skin surface layers, whilst the solvents, e.g., ethanol, DMSO, and EG, can penetrate deep into skin, and affect skin at all depths. This makes OTTER a great tool to study skin damage assessments and skin solvent penetrations.
4. Conclusions
OTTER multiple wavelength detection shows very interesting results. In the past, with single wavelength detection, when a signal changes, we do not know what causes the change. With multiple wavelength detection, it is possible identify what causes the changes. It can clearly differentiate different types of skin damages and different types of solvents applied.
Depth-resolved hydration profiling using enhanced SLS fitting also shows very interesting results. It shows that washing only affects the skin surface layers, whilst the solvents, e.g., ethanol, DMSO, and EG, can penetrate deep into skin, affecting skin at deeper depths.
The combination of multiple wavelength detection and depth profiling makes OTTER a potential great tool to study skin damages and skin solvent penetration. OTTER can measure not only the scale of the damages, but also the types of damages; it can differentiate between different types of solvents on skin, and is able to detect multiple substances on the skin surface.


