Article

Skin Improvement Effects of Gardeniae fructus Extract in HaCaT Keratinocytes, B16F10 Melanocytes, and CCD-986sk Fibroblast Cells

1
Department of Preventive Medicine, College of Korean Medicine, Kyung Hee University, Kyungheedae-ro 26, Dongdaemun-gu, Seoul 02447, Korea
2
Department of Korean Medicine, Graduate School, Kyung Hee University, Kyungheedae-ro 26, Dongdaemun-gu, Seoul 02447, Korea
3
Department of Science in Korean Medicine, Graduate School, Kyung Hee University, Kyungheedae-ro 26, Dongdaemun-gu, Seoul 02447, Korea
*
Author to whom correspondence should be addressed.
Cosmetics 2019, 6(3), 48; https://doi.org/10.3390/cosmetics6030048
Submission received: 1 July 2019 / Revised: 25 July 2019 / Accepted: 30 July 2019 / Published: 8 August 2019
(This article belongs to the Special Issue Anti-aging Properties of Natural Compounds)

Abstract

:
The development of functional cosmetics with skin improvement effects from natural sources is necessary. In this study, the antioxidant, antiwrinkling, moisturizing, and whitening effects of Gardeniae fructus extract (GF) were investigated in keratinocytes, melanocytes, and fibroblast cells. Antioxidant activity was determined by a DPPH free radical scavenging assay. MMP-1, MMP-9, HAS1, and filaggrin mRNA levels were measured by RT-PCR in keratinocytes and fibroblast cells. MITF and tyrosinase protein levels were evaluated by blotting analysis in melanocytes. DPPH free radical activity was investigated to determine whether GF showed dose-dependent inhibitory activity. GF induced the upregulation of HAS1 and filaggrin mRNA expression in keratinocytes and fibroblast cells. GF led to the downregulation of MMP mRNA levels in keratinocytes and fibroblast cells. Western blotting was performed to confirm the whitening-related protein (MITF and tyrosinase) levels induced by GF in melanocytes, and the inhibitory activity was superior to that of the α-MSH used for the comparison test. GF showed marked antioxidant, antiwrinkling, skin moisturizing, and whitening activity in keratinocytes, melanocytes, and fibroblast cells. Through the results of these experiments, the applicability of GF as a natural and functional cosmetic material was verified.

1. Introduction

Oxidative stress is produced by reactive oxygen species (ROS) [1]. ROS and free radicals are significant components of skin aging. Aging can be divided into two types: internal and external (induced by ultraviolet (UV) irradiation) [2,3]. Aging is a result of multiple interactions between the epidermis, dermis, and subcutaneous fat and wrinkle formation caused by oxidative stress. The substances generated during this process cause increased melanin production and wrinkles.
Melanin is synthesized by oxidation via tyrosinase activity. Melanocytes play an essential role in defending the skin against UV light and free radicals [4,5]. In addition, microphthalmia-associated transcription factor (MITF) is a main factor controlling the transcription of enzymes such as tyrosinase [6]. Tyrosinase is transcriptionally regulated by MITF, which plays an essential role in melanin synthesis signaling [7,8]. Additionally, ROS induce the expression of matrix metalloproteinases (MMPs). MMPs collapse the structure of collagen and elastin, inducing wrinkles [9]. Wrinkle production is mediated by MMP enzymes, and the mechanisms regulating these various elements have been discovered in antiwrinkle studies [10]. ROS reduce the production of collagen, elastin, and hyaluronan (HA), reducing skin elasticity.
Keratinocytes play a main role in the pathogenesis of skin inflammation, such as atopic dermatitis (AD) [11]. In addition, fibroblasts can play a key role in the dermis to produce collagen and elastin, which are essential to skin [12]. In addition, skin barrier conditions and skin moisturization are also important elements because they are related to aging [13].
Gardeniae fructus extract (GF) is a traditional herb known to have anti-inflammatory, anti-neurotoxicity, and antioxidant activity and many other effects [14,15,16,17,18,19]. However, studies of the whitening, antiwrinkling, and skin moisturizing effects of GF have not been performed. Therefore, this study aimed to investigate the antioxidant, antiwrinkling, moisturizing, and whitening effects of GF on keratinocytes, melanocytes, and fibroblast cells.

2. Materials and Methods

2.1. Gardeniae Fructus Extract (GF) Preparation

GF was generated by Han-poong Pharm and Foods Company (Jeon-ju, Korea) following good manufacturing practices (GMPs) procedures. GF, as a water-extracted brown powder, was dissolved in water (DW) for the in vitro experiments. Further information on the GF production process can be requested from the company (http://hpeng.hanpoong.co.kr/).

2.2. Cell Culture and UV-B Irradiation

HaCaT human keratinocyte and B16F10 mouse melanocyte cell lines were purchased from the Korea Cell Line Bank (KCLB, Seoul, Korea). Each cell line was grown in Dulbecco’s Modified Eagle’s Medium (DMEM, Welgene, Daegu, Korea) or in Iscove’s Modified Dulbecco’s Medium (IMDM, Welgene) supplemented with heat-inactivated 10% fetal bovine serum (FBS, Welgene) and 1% antibiotics (Ab, Welgene) in a 5% CO2 incubator at 37 °C. The CCD-986sk human fibroblast cell line was exposed to UV-B light (312 nm) once at a dose of 30 mJ/cm2 and cultured as described for the B16F10 mouse melanocyte cell line. UV-B irradiation was performed as previously described, with some modifications [10].

2.3. WST-1 Assay

Cell viability was determined using a WST-1 assay (Dogen, Seoul, Korea). HaCaT cells, B16F10 cells, and CCD-986sk cells (1 × 10⁴ cells/well) were plated in 96-well plate culture plates and incubated for 24 h. The cells were then treated with different concentrations of CE and incubated for another 24 h. HaCaT cells were treated with 1 μg/ml LPS, and B16F10 cells were treated with 100 ηM α-melanocyte stimulating hormone (α-MSH) in the presence or absence of various concentrations of GF. Ten microliters of WST-1 solution was added to 100 μl of cell culture medium, and the plates were incubated for 2 h. The optical density (OD) was measured at 450 nm using an enzyme-linked immunosorbent assay (ELISA) plate reader (Versa Max; Molecular Devices LLC, Sunnyvale, CA, USA).

2.4. Cell Migration

The HaCaT human keratinocytes were incubated at 3 × 10⁵ cells/mL for 24 h in a CO2 incubator. Briefly, the cell monolayers were scratched with a 200 μl yellow tip and washed twice with phosphate-buffered saline (PBS). Next, monolayers were treated with different doses of GF and cultured in the incubator for 24 h. Cell motility was evaluated 24 h later using a microscope, and the scratched area was measured. Measurements were taken to determine the distance traveled in the 24-h period by measuring the scratched area with light microscopy (Olympus, Tokyo, Japan).

2.5. DPPH Free Radical Scavenging Activity Assay

The 2,2-diphenyl-1-picrylhydrazyl (DPPH) free radical scavenging activity was measured using a previously described method [20]. Next, 100 μl of DPPH solution (0.2 mM DPPH in 95% ethanol) was added to 100 μl of GF. After shaking, the mixture was incubated for 45 min in the dark. The absorbance was then determined at 520 nm using an ELISA plate reader.

2.6. Melanin Content Assay

Melanin content was measured as previously described with some modifications [21]. B16F10 mouse melanocytes were treated with α-MSH (100 ηM) for 24 h and further treated with different concentrations of GF for another 24 h. After the treatments, the cells were detached by incubation in trypsin and subsequently centrifuged at 5000 g for 5 min, and the cell pellets were then solubilized in 1 N NaOH at 60 °C for 60 min. The melanin content was assayed on the basis of the absorbance at 420 nm by an ELISA plate reader.

2.7. Reverse Transcription-Polymerase Chain Reaction

The cells were harvested by centrifugation, and the pellet was washed with ice cold PBS. RNA was isolated from the pellet using an easy blue RNA extraction kit (iNtRON Biotech, Sungnam, Korea) according to the manufacturer’s instructions. The quantity of the isolated RNA was measured using a NanoDrop ND-1000 spectrophotometer (NanoDrop Technologies Inc., Wilmington, DE, USA), and cDNA was synthesized from 2 μg of total RNA using a cDNA synthesis kit (TaKaRa, Otsu, Shinga, Japan). RT-PCR was performed in a 15-μL reaction mixture consisting of DNA template, a 10-pM concentration of each gene-specific primer, 10x Taq buffer, 2.5 mM dNTP mixture, and 1 unit of Taq DNA polymerase (Takara). RT-PCR was performed using a RT-PCR PreMix kit (iNtRON Biotech) with appropriate sense and antisense primers for the GAPDH gene (GAPDH: sense primer, 5′-CGT CTT CAC CAC CAT GGA GA-3′; antisense primer, 5′-CGG CCA TCA CGC CAC AGT TT-3′), MMP1 gene (MMP1: sense primer, 5′-AAA GGG AAT AAG TAC TGG GC-3′; antisense primer, 5′-AAT TCC AGG AAA GTC ATG TG-3′), MMP9 gene (MMP9: sense primer, 5′-CAC TGT CCA CCC CTC AGA GC-3′; antisense primer, 5′-GCC ACT TGT CGG CGA TAA GG-3′), hyaluronan synthase1 gene (HAS1: sense primer, 5′-GGC TTG TCA GAG CTA CTT C-3′; antisense primer, 5′-GCC ACG AAG AAG GGG AA-3′), and filaggrin gene (filaggrin: sense primer, 5′-AGT GCA CTC AGG GGG CTC ACA-3′; antisense primer, 5′-CCG GCT TGG CCG TAA TGT GT-3′). The incubation conditions were pre-denaturation at 95 °C for 5 min, 40 cycles of denaturation at 95 °C for 30 s, annealing at 55 °C for 40 s, extension at 72 °C for 50 s, and a final elongation step for 10 min at 72 °C. The PCR was performed using a SimpliAmp Thermal Cycler (Applied Biosystems; Thermo Fisher Scientific, Inc.). The products obtained by RT-PCR were separated on a 1% agarose gel and stained with ethidium bromide at room temperature for 5 min. The expression levels of the mRNA were quantified using ImageJ software (version 1.42q; National Institutes of Health, Bethesda, MD, USA) with GAPDH as an internal control.

2.8. Western Blot Analysis

Cells were harvested, and the cell pellets were incubated in one volume of lysis buffer containing 20 mM Tris–HCl (pH 7.5), 150 mM NaCl, 1 mM EDTA, 1 mM Na2EDTA, 1 mM EGTA, 1% NP-40, 1% sodium deoxycholate, 1 mM DTT, 1 mM PMSF, and PI cocktail on ice for 30 min and centrifuged at 13,000 rpm for 20 min at 4 °C. Aliquots (20 μl) were transferred to nitrocellulose membranes (Protran Nitrocellulose Membrane, Whatman, UK). The membranes were blocked with 2% skim milk for 1 h, probed with specific primary antibodies (1:1000), and transferred to nitrocellulose membranes (Protran Nitrocellulose Membrane, Whatman, UK). After washing, the membranes were incubated with diluted enzyme-linked secondary antibodies (1:10,000). Protein bands were detected by a chemiluminescence system ECL (Amersham Pharmacia Biotech) and visualized by exposing the membranes to X-ray films. Each protein was blotted with the appropriate antibodies as follows: anti-GAPDH, tyrosinase, and MITF antibodies were purchased from Cell Signaling Technology (Danvers, MA, USA).

2.9. Statistical Analysis

All quantitative data derived from this study were analyzed statistically. The results are expressed as the means ± standard deviations (SDs) or means ± SEM of at least three separate tests. p < 0.05 was considered to indicate a statistically significant difference, and p < 0.05, p < 0.01, and p < 0.001 were assigned symbols that are indicated in the figures. Statistical significance was determined using one-way analysis of variance followed by the Tukey–Kramer multiple comparisons post-test to analyze differences between groups. Statistical analyses were performed using PRISM software (version 5.0; GraphPad Software Inc., La Jolla, CA, USA).

3. Results

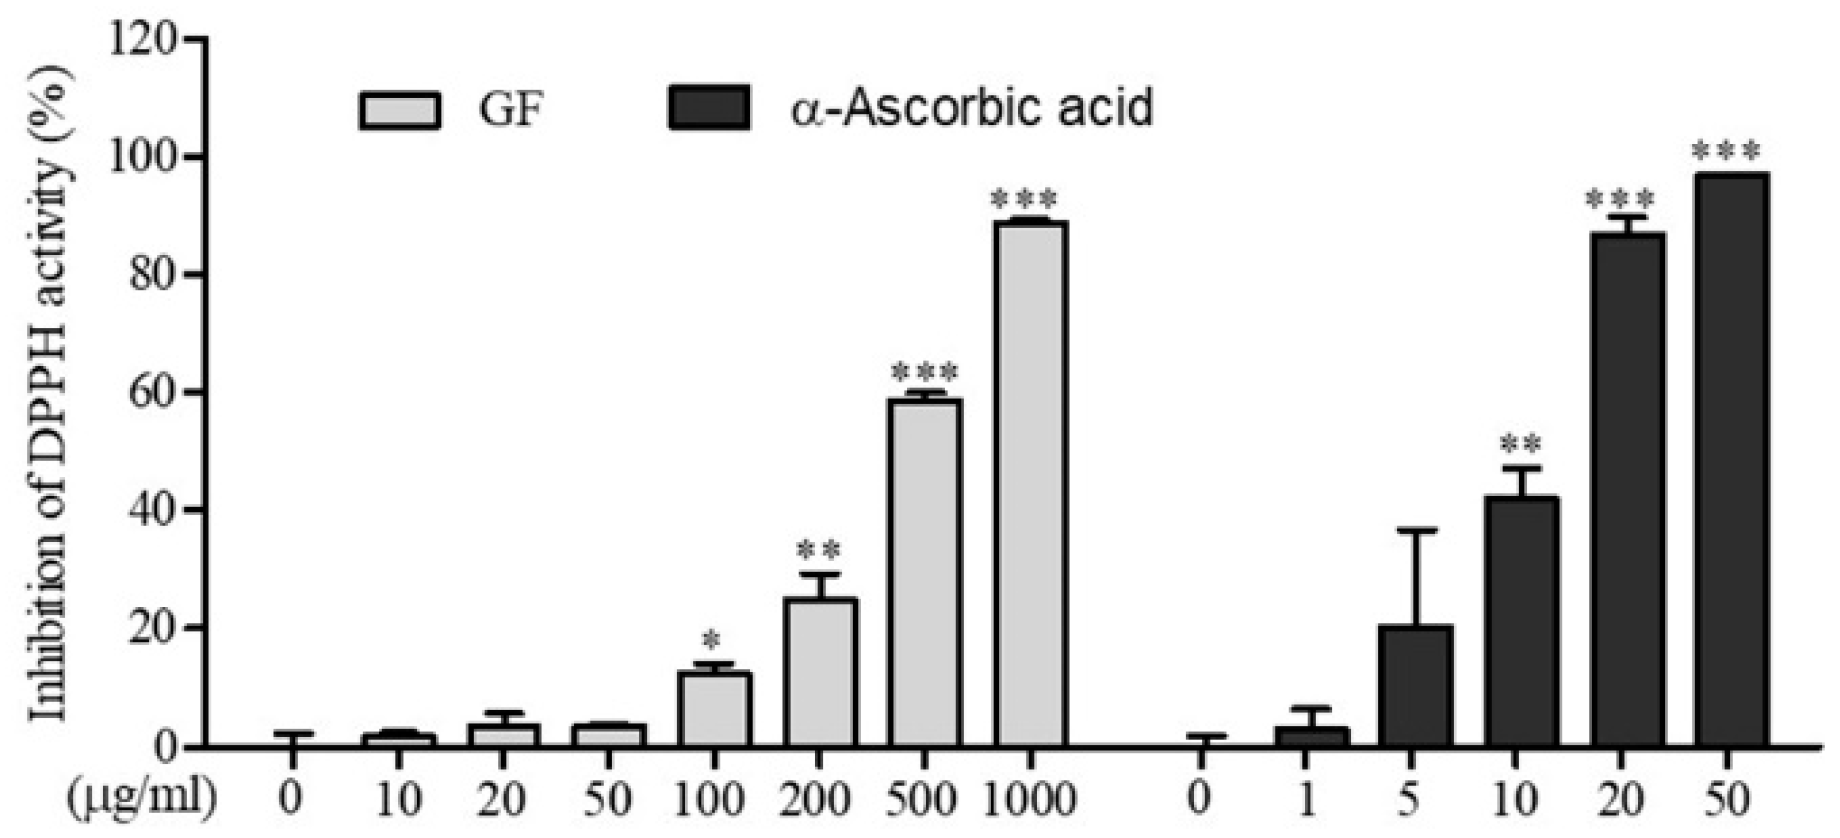
3.1. In Vitro Antioxidant Activity of GF

To determine whether GF has antioxidant activity, DPPH free radical scavenging assays were performed: α-ascorbic acid, known as vitamin C, was used as a positive control for DPPH scavenging assays, as α-ascorbic acid is an effective antioxidant in vivo and in vitro [22,23]. The DPPH free radical scavenging activity of GF increased in a dose-dependent manner, similar to α-ascorbic acid (Figure 1). There were significant differences in DPPH radical scavenging activity between GF and the untreated group (GF 0 μg/ml). At a dose of 500 μg/ml GF, 56.6% activity was observed, whereas at 1000 μg/mL, GF exhibited 88.7% of the activity. These results demonstrate that GF significantly increased antioxidant activity.

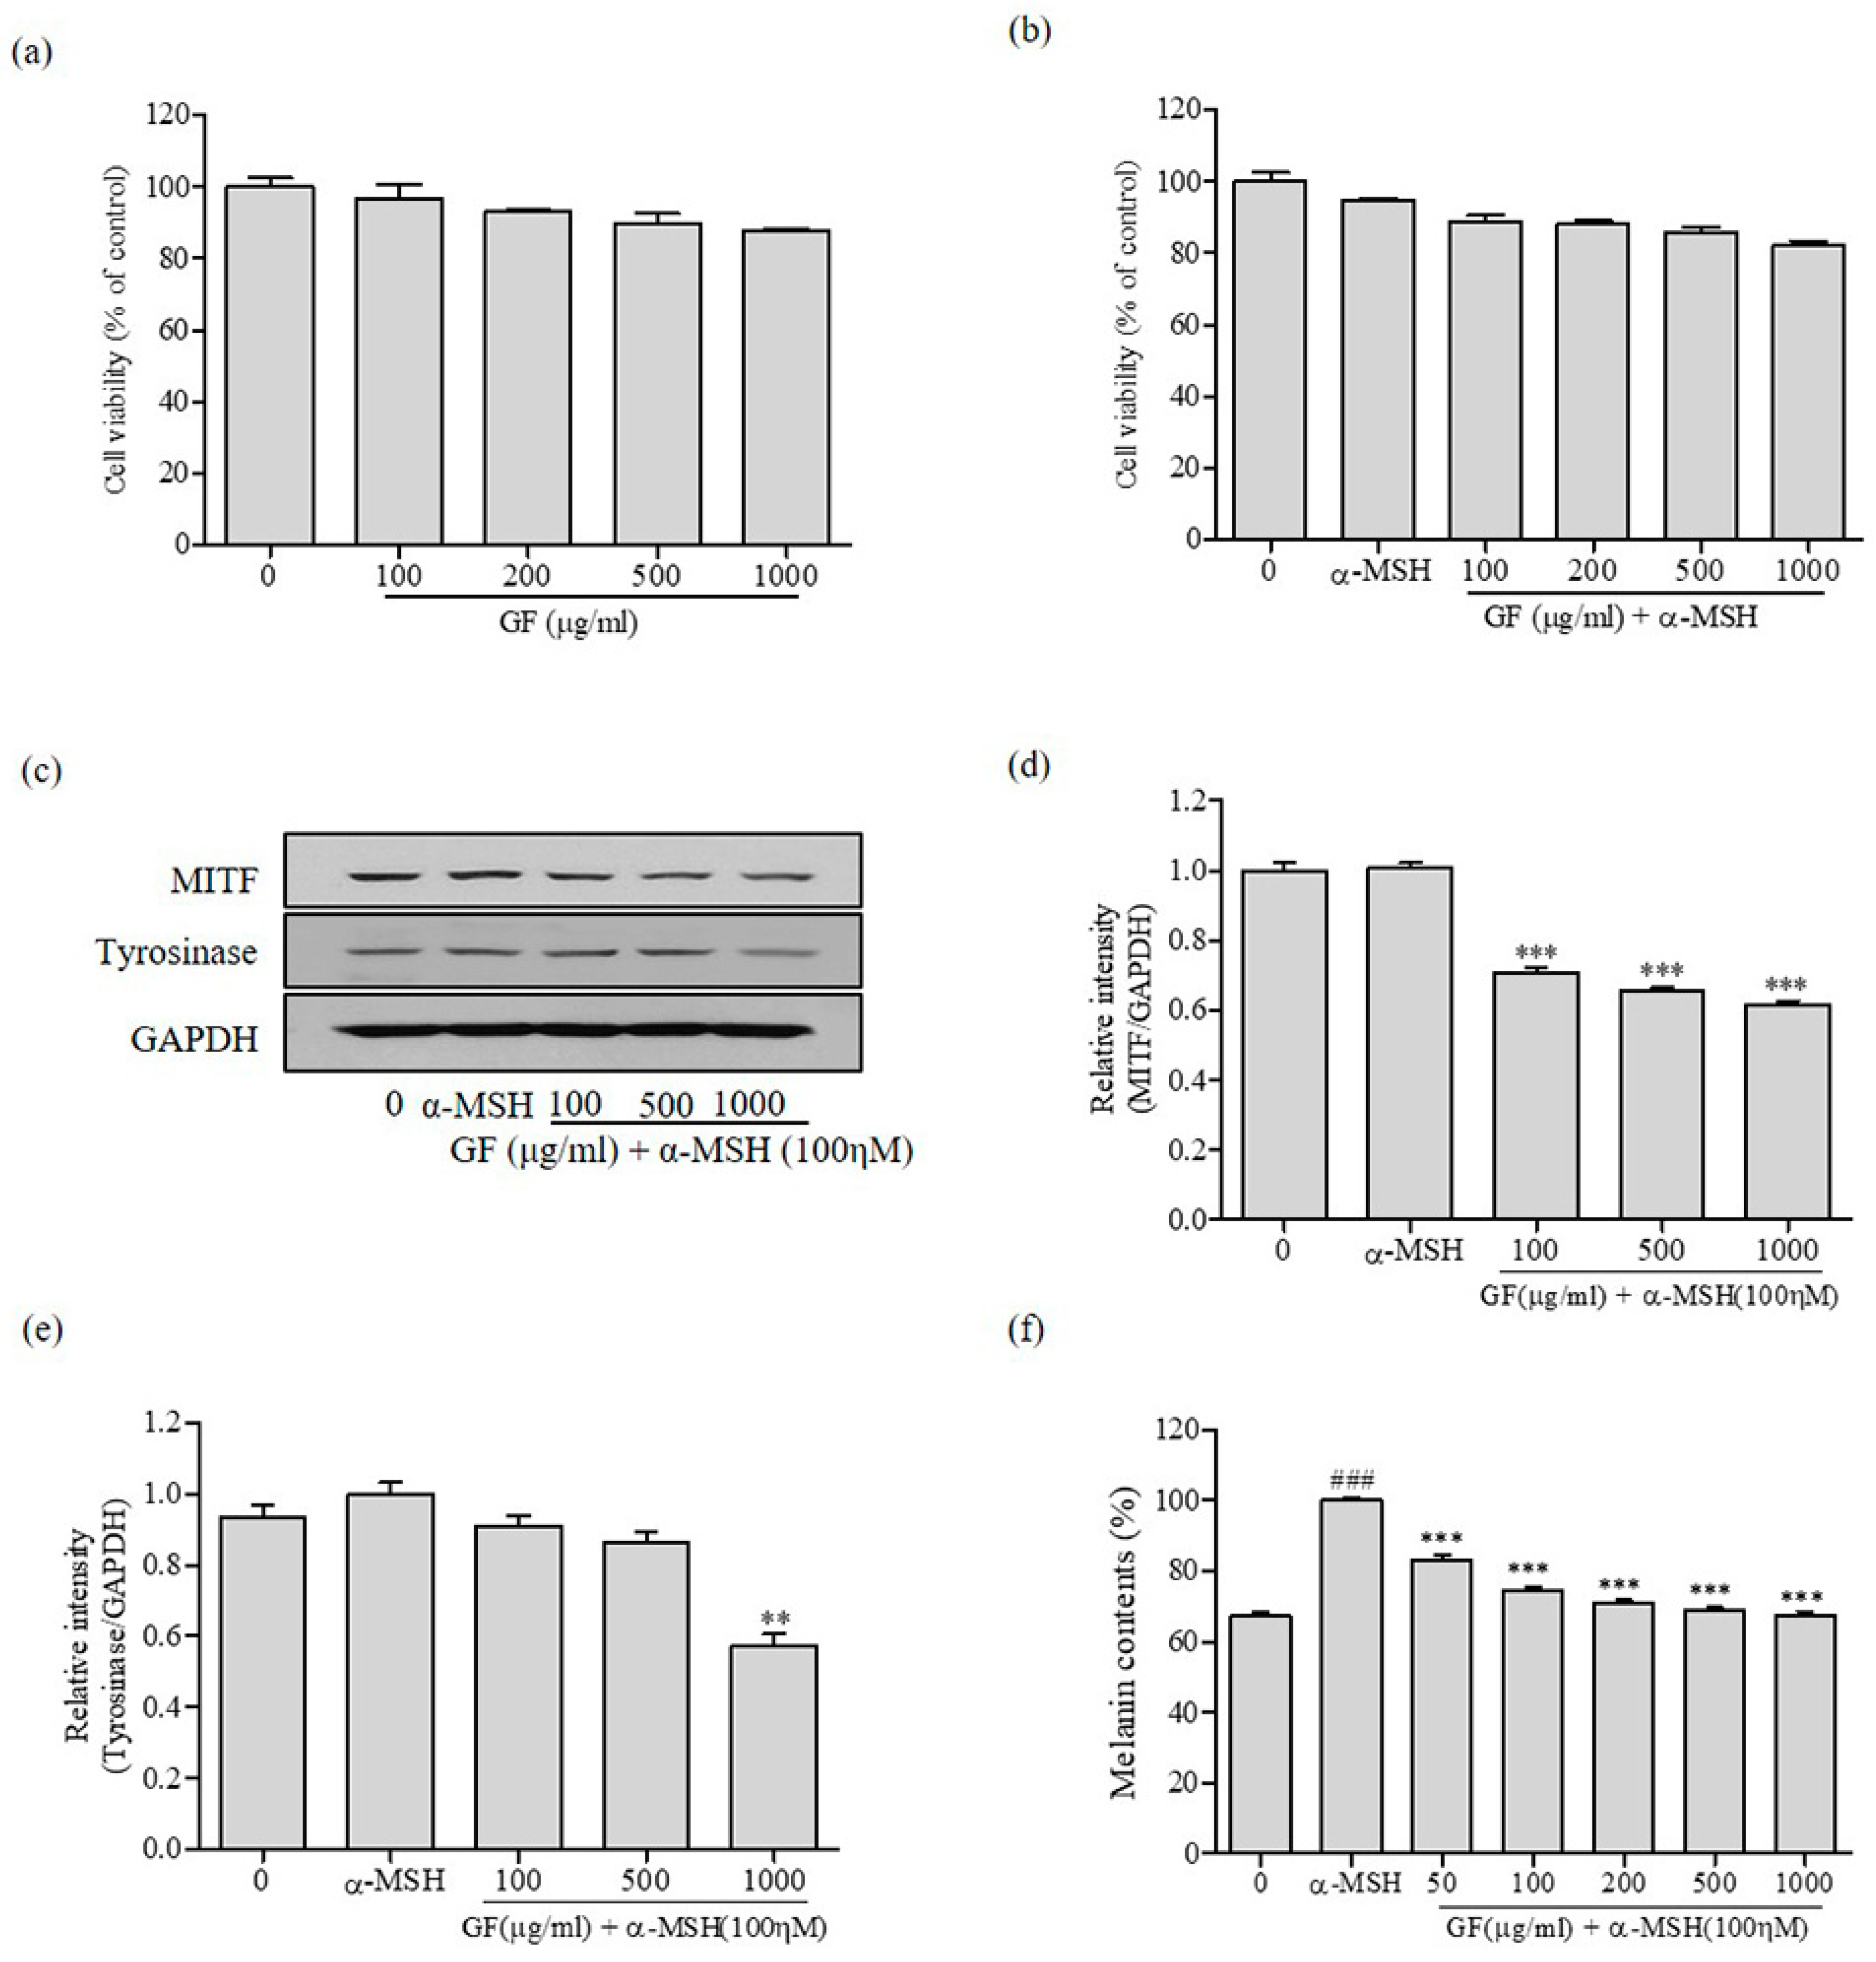
3.2. Inhibition of Melanin Production by GF in B16F10 Melanoma Cells

Next, the cell viability of B16F10 mouse melanocytes treated with various doses (100–1000 μg/ml) of GF for 24 h was tested, and their viability was greater than 90% (Figure 2a). In addition, the cell viability of B16F10 cells treated with 1000 μg/ml GF and stimulated by α-MSH (100 ηM) was almost 85% (Figure 2b). GF did not induce any cytotoxicity in B16F10 cells over a 24-h period. To investigate whether GF can influence melanogenic protein expression, western blotting analysis was carried out using the lysate of B16/F10 cells treated with GF and stimulated by α-MSH (Figure 2c–e). When B16/F10 cells were stimulated by α-MSH, a significant increase in MITF protein was observed, and tyrosinase expression also increased. However, GF inhibited α-MSH-stimulated MITF and tyrosinase expression in B16F10 cells in a dose-dependent manner. Therefore, we used GF at doses of 50–1000 μg/ml to determine the cellular melanin synthesis activity in B16F10 mouse melanocytes. The levels of melanin content were satisfactorily reduced by 16.9% ± 2.58%, 28.8% ± 0.75%, and 32.5% ± 1.51% at concentrations of 50, 200, and 1000 μg/ml GF, respectively, when compared to cells treated with 100 ηΜ α-MSH (Figure 2f). Taken together, these findings suggest that the inhibitory effects of GF on melanogenesis in B16F10 cells might be mediated through the downregulation of melanogenic proteins (tyrosinase and MITF) and melanin content.

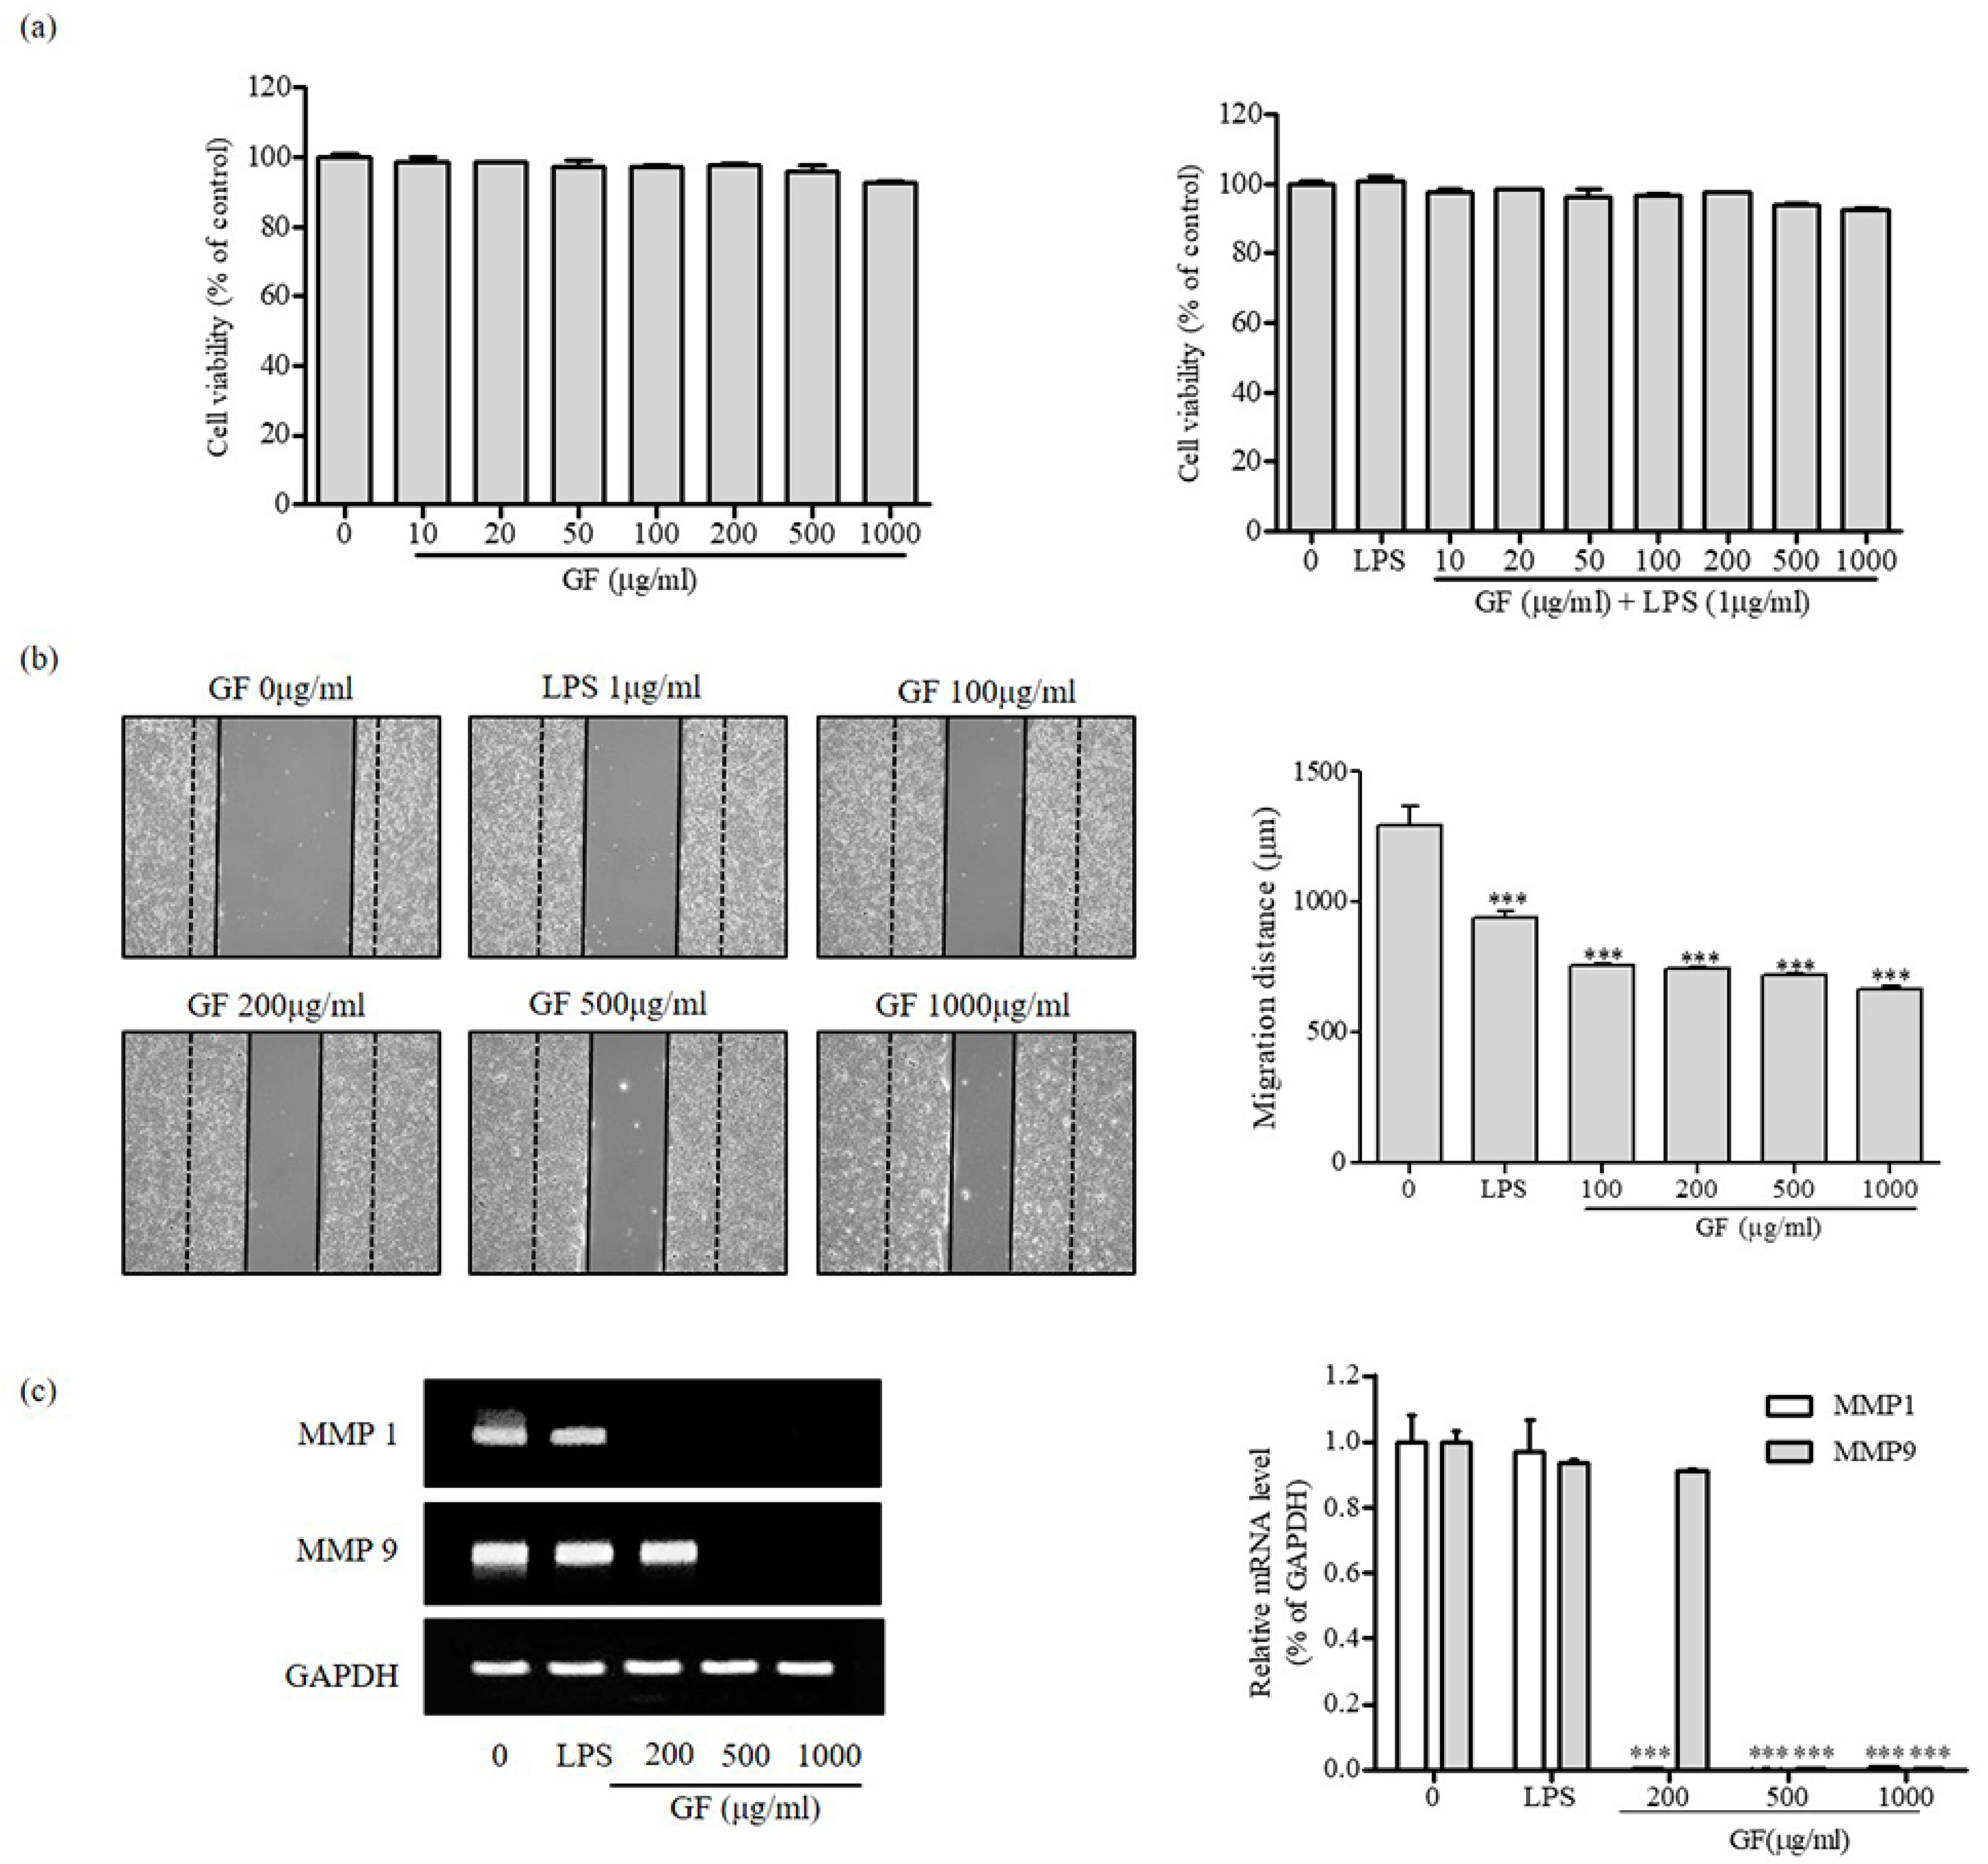
3.3. Inhibition of MMP1 and MMP9 Expression by GF in HaCaT Keratinocyte Cells

To examine the inhibitory effects of GF on MMPs, HaCaT human keratinocytes were cultured with GF for 24 h, similarly to B16F10 cells. HaCaT keratinocytes were treated with various doses (0–1000 μg/ml) of GF and stimulated by LPS (1 μg/ml) (Figure 3a). GF also did not induce cytotoxicity in HaCaT keratinocytes over a 24 h period. In this study, the effects of GF on the migration rates of HaCaT cells were examined utilizing a wound healing assay. The GF concentration of the HaCaT layer was determined to be 100–1000 μg/ml (Figure 3b). GF was able to improve the cell migration rates. The results indicate that the cells in the nontreatment group (GF 0 μg/ml) showed some migration, and the GF treated group exhibited a dose dependent increase in migration compared to the LPS treatment group. Furthermore, we also verified the mRNA expression of MMPs (MMP-1 and MMP-9) after GF treatment using RT-PCR to determine the antiwrinkle effects in HaCaT keratinocytes. As shown in Figure 3c, MMP (MMP-1 and MMP-9) expression significantly decreased in a low dose-dependent manner when GF was added to HaCaT cells. These results show that GF prevented MMP (MMP-1 and MMP-9) expression related to wrinkle production in HaCaT keratinocytes.

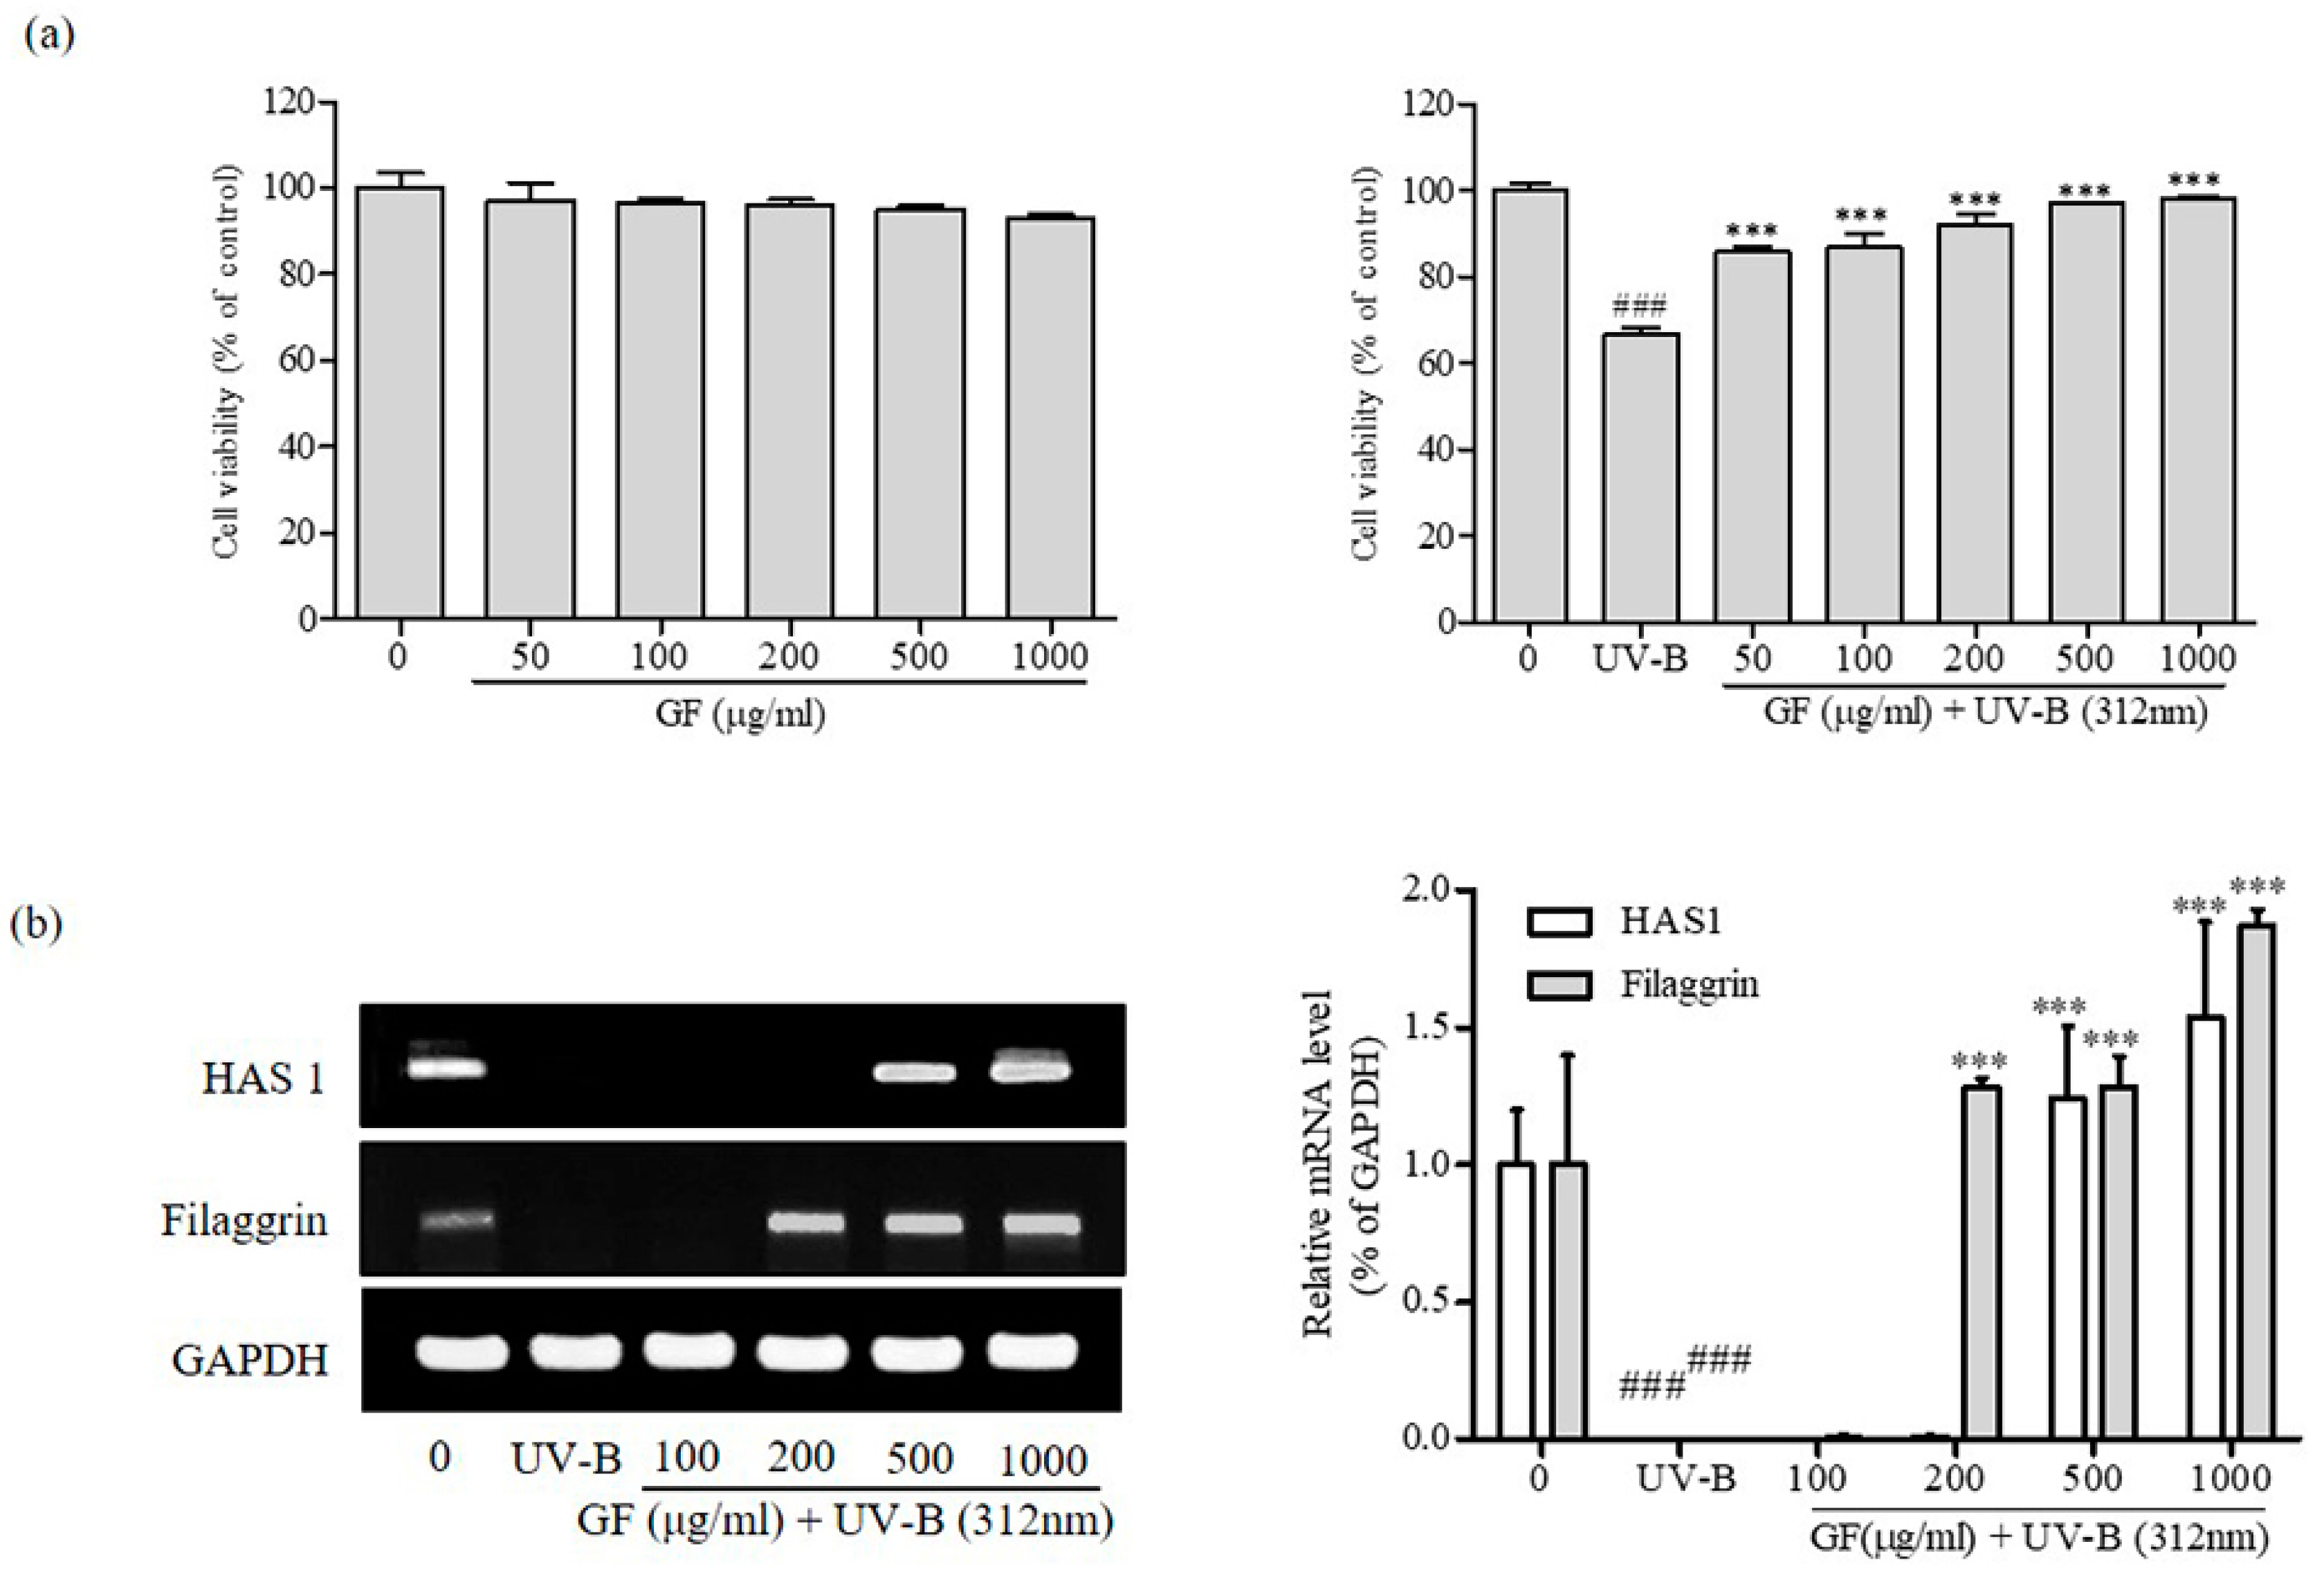
3.4. Activation of HAS1 and Filaggrin Expression by GF in CCD-986sk Fibroblast Cells

To confirm the skin protection effects of GF on HAS1 and filaggrin, human fibroblast CCD-986sk cells were cultured with GF for 24 h. The CCD-986sk fibroblast cells were treated with a dose (0–1000 μg/ml) of GF and stimulated by UV-B (312 nm) (Figure 4a). GF induced no cytotoxicity in CCD-986sk fibroblast cells. In addition, UV-B-stimulated CCD-986sk human fibroblast cells showed decreased HAS1 and filaggrin mRNA expression for skin moisturization, but HAS1 and filaggrin expression increased in a dose-dependent manner when GF was added to CCD-986sk cells (Figure 4b). These results suggest that GF is important for maintaining the intercellular area and retaining water and that it plays a main role in moisture retention by stimulating the expression of genes.

4. Discussion

Gardeniae fructus extract (GF) is a traditional medicinal herb that is prepared by boiling it in water [14,15,16,17,18,19]. However, GF is not well known as a functional cosmetic for improving antiwrinkling, whitening, and skin moisturizing effects. In this work, we analyzed the antioxidant, antiwrinkling, skin moisturizing, and whitening activities of GF in keratinocytes, melanocytes, and fibroblast cells.
To determine whether the free radical scavenging activity of GF extract provided cell protection against oxidative stress, cell viability was monitored after stimulation with α-MSH, LPS, and UV-B in B16F10 mouse melanocytes, HaCaT human keratinocytes, and CCD-986sk human fibroblast cells, respectively. GF did not show any toxicity and effectively suppressed free radical scavenging activity. In this study, we demonstrated the antioxidant activity of GF compared to α-ascorbic acid as a positive control.
To examine the skin whitening effects, the inhibition of intracellular tyrosinase and melanin biosynthesis was determined in α-MSH-stimulated B16F10 mouse melanoma cells treated with GF. Tyrosinase and microphthalmia-associated transcription factor (MITF) play important roles in melanin biosynthesis [24]. Melanin content and blotting analysis revealed that GF had an inhibitory effect on tyrosinase and the MITF protein, which are related to melanin biosynthesis. These results demonstrated that GF had a whitening effect via the inhibition of tyrosinase, a key enzyme for melanin biosynthesis.
Therefore, GF also decreased the production of matrix metalloproteinases (MMPs) in HaCaT human keratinocytes, which are assumed to have antiwrinkle effects. MMPs are induced in response to cytokines, growth factors, cell–matrix interactions, and LPS [25,26]. The results demonstrate that the nontreatment group (GF 0 μg/ml) showed migration ability, and the GF-treated group exhibited a dose-dependent increase in migration compared to the LPS-treated group. Furthermore, in our study, decreased MMP-1 and MMP-9 mRNA expression was observed in the GF-treated group. Thus, GF was able to confer superior cell migration ability and antiwrinkle activity in human keratinocytes.
Environmental factors, such as UV-B, are essential in skin diseases and can decrease skin barrier function [27]. Therefore, we explored the effect of GF on skin barrier function, as well as its effect on the expression of hyaluronic acid synthase-1 (HAS1) and filaggrin in CCD-986sk human fibroblast cells. GF significantly increased the production of HAS-1 and filaggrin, and UV-B reduced the expression rates. Consequently, the skin moisturizing effects of GF on the expression of these genes reveal its potential in the improvement of skin barrier function.
In this study, GF showed antioxidant, antiwrinkling, skin moisturizing, and whitening activity in keratinocytes, melanocytes, and fibroblast cells. Overall, it seems that GF can be used as a natural component of functional cosmetics.

Author Contributions

S.H.H. carried out the experiment and drafted the manuscript. S.H.H., J.M.K., S.H.L., H.J.S., D.S.P. and J.W.S. assisted with the research. S.H.H. and Y.C.S. guided the research and revised and submitted the manuscript. S.-G.K. supervised the research. All of the authors read and approved the final manuscript.

Funding

This work was supported by a grant from the Korean Medicine R&D Project of the Ministry of Health and Welfare (HI18C2382).

Conflicts of Interest

The authors declare that there are no conflicts of interest.

Ethics Approval

All experiments were performed in accordance with the protocols approved by the Institutional Care and Use Committees of Kyung Hee University.

Consent for Publication

This section is not applicable in this research.

Availability of Data and Materials

All data and materials are contained and described within the manuscript.

References

  1. Freeman, B.A.; Crapo, J.D. Biology of disease: Free radicals and tissue injury. Lab. Investig. 1982, 47, 412–426. [Google Scholar] [PubMed]
  2. Chiang, H.M.; Chen, H.C.; Lin, T.J.; Shih, I.C.; Wen, K.C. Michelia alba extract attenuates UVB-induced expression of matrix metalloproteinases via MAP kinase pathway in human dermal fibroblasts. Food Chem. Toxicol. 2012, 50, 4260–4269. [Google Scholar] [CrossRef] [PubMed]
  3. Gilchrest, B.A. Skin aging and photoaging. Dermatol. Nurs. 1990, 2, 79–82. [Google Scholar] [PubMed]
  4. Maddodi, N.; Jayanthy, A.; Setaluri, V. Shining light on skin pigmentation: The darker and the brighter side of effects of UV radiation. Photochem. Photobiol. 2012, 88, 1075–1082. [Google Scholar] [CrossRef] [PubMed]
  5. Dessinioti, C.; Stratigos, A.J.; Rigopoulos, D.; Katsambas, A.D. A review of genetic disorders of hypopigmentation: Lessons learned from the biology of melanocytes. Exp. Dermatol. 2009, 18, 741–749. [Google Scholar] [CrossRef] [PubMed]
  6. Kanlayavattanakul, M.; Lourith, N. Plants and Natural Products for the Treatment of Skin Hyperpigmentation—A Review. Planta Med. 2018, 84, 988–1006. [Google Scholar] [CrossRef] [PubMed]
  7. Garraway, L.A.; Widlund, H.R.; Rubin, M.A.; Getz, G.; Berger, A.J.; Ramaswamy, S.; Beroukhim, R.; Milner, D.A.; Granter, S.R.; Du, J.; et al. Integrative genomic analyses identify MITF as a lineage survival oncogene amplified in malignant melanoma. Nature 2005, 436, 117–122. [Google Scholar] [CrossRef] [PubMed]
  8. Hsiao, J.J.; Fisher, D.E. The roles of microphthalmia-associated transcription factor and pigmentation in melanoma. Arch. Biochem. Biophys. 2014, 563, 28–34. [Google Scholar] [CrossRef] [PubMed] [Green Version]
  9. Park, H.J.; Ock, S.M.; Kim, H.J.; Lee, Y.B.; Choi, J.M.; Cho, C.S.; Lee, J.Y.; Cho, B.K.; Cho, D.H. Vitamin C attenuates ERK signalling to inhibit the regulation of collagen production by LL-37 in human dermal fibroblasts. Exp. Dermatol. 2010, 19, e258–e264. [Google Scholar] [CrossRef] [PubMed]
  10. Song, J.H.; Piao, M.J.; Han, X.; Kang, K.A.; Kang, H.K.; Yoon, W.J.; Ko, M.H.; Lee, N.H.; Lee, M.Y.; Chae, S.; et al. Anti-wrinkle effects of Sargassum muticum ethyl acetate fraction on ultraviolet B-irradiated hairless mouse skin and mechanistic evaluation in the human HaCaT keratinocyte cell line. Mol. Med. Rep. 2016, 14, 2937–2944. [Google Scholar] [CrossRef] [Green Version]
  11. Albanesi, C.; De Pita, O.; Girolomoni, G. Resident skin cells in psoriasis: A special look at the pathogenetic functions of keratinocytes. Clin. Dermatol. 2007, 25, 581–588. [Google Scholar] [CrossRef]
  12. Rittie, L.; Fisher, G.J. Isolation and culture of skin fibroblasts. Methods Mol. Med. 2005, 117, 83–98. [Google Scholar] [PubMed]
  13. Choi, J.W.; Kwon, S.H.; Huh, C.H.; Park, K.C.; Youn, S.W. The influences of skin visco-elasticity, hydration level and aging on the formation of wrinkles: A comprehensive and objective approach. Skin Res. Technol. 2013, 19, e349–e355. [Google Scholar] [CrossRef] [PubMed]
  14. Peng, K.; Yang, L.; Zhao, S.; Chen, L.; Zhao, F.; Qiu, F. Chemical constituents from the fruit of Gardenia jasminoides and their inhibitory effects on nitric oxide production. Bioorg. Med. Chem. Lett. 2013, 23, 1127–1131. [Google Scholar] [CrossRef] [PubMed]
  15. Hong, Y.J.; Yang, K.S. Anti-inflammatory activities of crocetin derivatives from processed Gardenia jasminoides. Arch. Pharmacal Res. 2013, 36, 933–940. [Google Scholar] [CrossRef]
  16. Nagaki, Y.; Hayasaka, S.; Abe, T.; Zhang, X.Y.; Hayasaka, Y.; Terasawa, K. Effects of oral administration of Gardeniae fructus extract and intravenous injection of crocetin on lipopolysaccharide- and prostaglandin E2-induced elevation of aqueous flare in pigmented rabbits. Am. J. Chin. Med. 2003, 31, 729–738. [Google Scholar] [CrossRef]
  17. Zang, C.X.; Bao, X.Q.; Li, L.; Yang, H.Y.; Wang, L.; Yu, Y.; Wang, X.L.; Yao, X.S.; Zhang, D. The Protective Effects of Gardenia jasminoides (Fructus Gardenia) on Amyloid-beta-Induced Mouse Cognitive Impairment and Neurotoxicity. Am. J. Chin. Med. 2018, 46, 389–405. [Google Scholar] [CrossRef] [PubMed]
  18. Oliveira, H.; Cai, X.; Zhang, Q.; de Freitas, V.; Mateus, N.; He, J.; Fernandes, I. Gastrointestinal absorption, antiproliferative and anti-inflammatory effect of the major carotenoids of Gardenia jasminoides Ellis on cancer cells. Food Funct. 2017, 8, 1672–1679. [Google Scholar] [CrossRef]
  19. Lin, W.H.; Kuo, H.H.; Ho, L.H.; Tseng, M.L.; Siao, A.C.; Hung, C.T.; Jeng, K.C.; Hou, C.W. Gardenia jasminoides extracts and gallic acid inhibit lipopolysaccharide-induced inflammation by suppression of JNK2/1 signaling pathways in BV-2 cells. Iran J. Basic Med. Sci. 2015, 18, 555–562. [Google Scholar]
  20. Jameel, F.; Phang, M.; Wood, L.G.; Garg, M.L. Acute effects of feeding fructose, glucose and sucrose on blood lipid levels and systemic inflammation. Lipids Health Dis. 2014, 13, 195. [Google Scholar] [CrossRef] [PubMed]
  21. Hosoi, J.; Abe, E.; Suda, T.; Kuroki, T. Regulation of melanin synthesis of B16 mouse melanoma cells by 1 alpha, 25-dihydroxyvitamin D3 and retinoic acid. Cancer Res. 1985, 45, 1474–1478. [Google Scholar] [PubMed]
  22. Russo, A.; Cardile, V.; Lombardo, L.; Vanella, L.; Vanella, A.; Garbarino, J.A. Antioxidant activity and antiproliferative action of methanolic extract of Geum quellyon Sweet roots in human tumor cell lines. J. Ethnopharmacol. 2005, 100, 323–332. [Google Scholar] [CrossRef] [PubMed]
  23. Dutta, S.; Chakraborty, A.K.; Dey, P.; Kar, P.; Guha, P.; Sen, S.; Kumar, A.; Sen, A.; Chaudhuri, T.K. Amelioration of CCl4 induced liver injury in swiss albino mice by antioxidant rich leaf extract of Croton bonplandianus Baill. PLoS ONE 2018, 13, e0196411. [Google Scholar] [CrossRef] [PubMed]
  24. Kippenberger, S.; Loitsch, S.; Solano, F.; Bernd, A.; Kaufmann, R. Quantification of tyrosinase, TRP-1, and Trp-2 transcripts in human melanocytes by reverse transcriptase-competitive multiplex PCR-regulation by steroid hormones. J. Investig. Dermatol. 1998, 110, 364–367. [Google Scholar] [PubMed]
  25. Vaalamo, M.; Mattila, L.; Johansson, N.; Kariniemi, A.L.; Karjalainen-Lindsberg, M.L.; Kahari, V.M.; Saarialho-Kere, U. Distinct populations of stromal cells express collagenase-3 (MMP-13) and collagenase-1 (MMP-1) in chronic ulcers but not in normally healing wounds. J. Investig. Dermatol. 1997, 109, 96–101. [Google Scholar] [CrossRef] [PubMed]
  26. Xue, M.; Thompson, P.; Kelso, I.; Jackson, C. Activated protein C stimulates proliferation, migration and wound closure, inhibits apoptosis and upregulates MMP-2 activity in cultured human keratinocytes. Exp. Cell Res. 2004, 299, 119–127. [Google Scholar] [CrossRef] [PubMed]
  27. Nakamizo, S.; Egawa, G.; Doi, H.; Natsuaki, Y.; Miyachi, Y.; Kabashima, K. Topical treatment with basic fibroblast growth factor promotes wound healing and barrier recovery induced by skin abrasion. Skin Pharmacol. Physiol. 2013, 26, 22–29. [Google Scholar] [CrossRef] [PubMed]
Figure 1. Antioxidant activity of Gardeniae fructus extract (GF). DPPH free radical scavenging activities of GF and of α-ascorbic acid. Data are presented as mean ± SEM. * p < 0.05, ** p < 0.01, and *** p < 0.001 compared to nontreated cells.
Cosmetics 06 00048 g001
Figure 2. GF inhibited melanin production in mouse melanocyte B16F10 cells. B16F10 cells were treated with various concentrations of GF (100, 200, 500, and 1000 μg/ml) for 24 h after vehicle (a) or α-melanocyte stimulating hormone (α-MSH) (100 ηM) (b) pretreatment for 1 h. After treatment, cell viability was measured using a WST-1 assay. (c) Tyrosinase and microphthalmia-associated transcription (MITF) from cell lysates were determined by immunoblotting analysis. (d, e) The bar graphs represent the quantitation of tyrosinase and MITF blotting data. The absorbance was measured by an ImageJ. GAPDH was used as an internal control. (f) Melanin content assay of the GF on the B16F10 cells. The absorbance was measured at 420 nm by an ELISA. Data are presented as mean ± SEM. ### p < 0.001 compared to nonstimulated cells (GF 0 μg/ml). ** p < 0.01 and *** p < 0.001 compared to α-MSH-stimulated cells.
Cosmetics 06 00048 g002
Figure 3. GF inhibited matrix metalloproteinase (MMP) mRNA expression and exhibited migration ability in human keratinocyte HaCaT cells. (a) HaCaT cells were treated with various concentrations of GF (10–1000 μg/ml) for 24 h after vehicle (upper panel) or LPS (1 μg/ml) (lower panel) pretreatment for 1 h (upper panel). After treatment, cell viability was measured using a WST-1 assay. (b) The migration ability of HaCaT cells was observed using an optical microscope, and photographs were obtained. HaCaT cells were treated with concentrations of GF (100, 200, 500, and 1000 μg/ml) and LPS (1 μg/ml). The bar graphs represent the quantitation of migration distance data. (c) The MMP-1 and MMP-9 mRNA levels were measured by RT-PCR analysis in HaCaT cells. The bar graphs represent the quantitation of RT-PCR data. The absorbance was measured by an ImageJ. GAPDH was used as an internal control. Data are presented as mean ± SEM. *** p < 0.001 compared to nonstimulated cells (GF 0 μg/ml).
Cosmetics 06 00048 g003
Figure 4. GF activates HAS1 and filaggrin mRNA expression in human fibroblast CCD-986sk cells. (a) CCD-986sk cells were treated with various concentrations of GF (50–1000 μg/ml) for 24 h after vehicle (left panel) or UV-B (312 nm) exposure for 5 min (right panel). After treatment, cell viability was measured using a WST-1 assay. (b) The HAS 1 and filaggrin mRNA levels were measured by RT-PCR analysis in CCD-986sk cells. The bar graphs represent the quantitation of RT-PCR data. The absorbance was measured by an ImageJ. GAPDH was used as an internal control. Data are presented as mean ± SEM. ### p < 0.001 compared to nonstimulated cells (GF 0 μg/ml). *** p < 0.001 compared to UV-B exposed cells.
Cosmetics 06 00048 g004

