Article

Antioxidant and Moisturizing Effect of Camellia assamica Seed Oil and Its Development into Microemulsion

by
Wantida Chaiyana
1,2,*,
Pimporn Leelapornpisid
1,2,
Jaroon Jakmunee
3,4 and
Chawalit Korsamphan
5
1
Department of Pharmaceutical Science, Faculty of Pharmacy, Chiang Mai University, Chiang Mai 50200, Thailand
2
Innovation Center for Holistic Health, Nutraceuticals, and Cosmeceuticals, Faculty of Pharmacy, Chiang Mai University, Chiang Mai 50200, Thailand
3
Department of Chemistry and Research Laboratory for Analytical Instrument and Electrochemistry Innovation, Faculty of Science, Chiang Mai University, Chiang Mai 50200, Thailand
4
Center of Excellence for Innovation in Chemistry, Faculty of Science, Chiang Mai University, Chiang Mai 50200, Thailand
5
Agricultural Scientist, Highland Research and Training Center, Faculty of Agriculture, Chiang Mai University, Chiang Mai 50200, Thailand
*
Author to whom correspondence should be addressed.
Cosmetics 2018, 5(3), 40; https://doi.org/10.3390/cosmetics5030040
Submission received: 4 June 2018 / Revised: 25 June 2018 / Accepted: 26 June 2018 / Published: 1 July 2018

Abstract

:
The present study aimed to investigate the fatty acid content, and antioxidant and moisturizing effect of Camellia assamica seed oil (CA). Additionally, microemulsions containing CA were also developed for topical use. The antioxidant activity of CA and two commercial Camellia oleifera seed oils were investigated by means of 1,1-diphenyl-2-picrylhydrazy radical (DPPH) assay and lipid peroxidation by ferric thiocyanate method. Moreover, the in vitro skin moisturizing effect was investigated on stillborn piglet skin by using a Corneometer®. CA microemulsions were developed and characterized by photon correlation spectroscopy, rheometer, and heating-cooling stability tests. The results revealed that the major fatty acid components of CA were cis-9-oleic acid, cis-9,12-linoleic acid, and palmitic acid. CA had a significantly higher lipid peroxidation inhibition and DPPH scavenging capacity compared to the commercial oils (p < 0.05). Lipid peroxidation inhibition of CA was 39.2% ± 0.6% at 37.5 mg/mL and the IC50 value of DPPH assay was 70.8 ± 27.1 mg/mL. The skin moisture content after applying CA, commercial oils, and tocopheryl acetate were significantly higher than untreated skin (p < 0.05) and the moisturizing efficacy increased with time. Interestingly, radical scavenging and antioxidant effect of CA microemulsions were significantly higher than the native oil even after the stability test (p < 0.05). In conclusion, incorporating CA into microemulsion increased its antioxidant activity indicating that it would be beneficial as a cosmeceutical application for anti-aging.

Graphical Abstract

1. Introduction

Tea originated in East and South Asia. China was the first country to use tea as a beverage by infusing the dried leaves into hot water [1]. Since ancient times, tea has been widely used as a medicinal plant and popularly used in various traditional medicines such as Ayurveda, Unani, and Homoeopathy. Nowadays, tea beverages are widely distributed throughout the world and are the most consumed after water. Not only is the leaf part of tea utilized, but the seed can be used to produce oil. Tea seed oil is an edible oil widely consumed in China. It is estimated that more than 2.5 million tons of tea seed oil will be produced by the year 2020 [2].
Cultivated tea was originally classified as Thea sinensis and Thea bohea by Linnaeus in 1752. However, the classification was revised to Camellia sinensis (Chinese tea: small-leaves, resistant to cold) and Camellia assamica (Assam tea: large-leaves, less resistant to cold), both of which belong to the family Theacea [3]. Altogether there are more than 65 species in the genus Camellia distributed in China but only 18 species can produce seeds that can be used for oil production [4]. Tea seed oil is rich in vitamin A, B, and E while having no cholesterol, leading to be the “king of cooking oil” with high nutritional value and health benefits [2]. Moreover, tea seed oil has desirable nutritional properties (high oleic acid, medium linoleic acid, and low linolenic acid) [5] and contains many natural antioxidants and functional components which was not only good for cardiovascular disease, cirrhosis, hypertension, and hyperlipidemia, but also have the special function of cancer prevention [6]. The physical and chemical constants of tea seed oil are similar to those of olive oil, thus it is sometimes referred to “Eastern olive oil”. As it is high in antioxidant properties, it could be a promising oil to use in cosmetic formulations.
Microemulsion (ME) is the isotropic colloidal system that forms spontaneously with the appropriate combinations of oil, water, surfactant, and co-surfactant [7]. ME is optically transparent since the internal phase droplet size ranges from 5 to 200 nm which is below the wavelength of visible light [8,9]. The advantages of ME over the conventional topical formulations such as creams, ointments and gels are easy production and thermodynamic stability which will lead to a good shelf-life [10]. Therefore, ME is of interest for pharmaceutical and cosmeceutical applications as a carrier system.
The present study focused on tea seed oil extracted from C. assamica cultivated in the high-attitude area in the Northern part of Thailand. The cosmeceutical properties, including antioxidant and moisturizing effects, of C. assamica seed oil (CA) were investigated. ME from CA were developed and characterized for topical use as a carrier system in cosmetic formulations.

2. Materials and Methods

2.1. Materials

CA was obtained from the Department of Chemistry and Research Laboratory for Analytical Instrument and Electrochemistry Innovation, Faculty of Science, Chiang Mai University. Two commercial Camellia oleifera seed oils (CO1 and CO2) were purchased from local market in Chiang Mai, Thailand.
DPPH (1,1-diphenyl-2-picrylhydrazyl radical), linoleic acid, quercetin, Triton X-114, tocopheryl acetate, and propylene glycol were purchased from Sigma–Aldrich (St. Louis, MO, USA). Polyethylene glycol sorbitan monolaurate (Tween 20), polyethylene glycol sorbitan monostearate (Tween 60), polyethylene glycol sorbitan monooleate (Tween 80), polyethylene glycol sorbitan trioleate (Tween 85), sorbitan monooleate (Span 80), and polyoxyethylene monooctylphenyl ether (Triton X-114) were purchased from Acros Organics (Morris Plains, NJ, USA). Glycerin, BP/USP was purchased from Malaysia. Polyethylene glycol 400, USP was purchased from Wilhelmshaven, Germany. Ammonium thiocyanate, and ferrous chloride were purchased from Fisher Chemicals (Loughborough, UK). Hydrochloric acid was analytical grade and purchased from Merck (Darmstadt, Germany). Ethanol, acetone, dimethyl sulfoxide (DMSO), and propan-2-ol were AR grade and purchased from Labscan (Dublin, Ireland).

2.2. Determination of Fatty Acid Composition of Tea Seed Oils

Fatty acid composition of CA and commercial tea seed oils (CO1) were analyzed according to the method reported by Lucchetti et al. [11]. Briefly, fatty acids were converted to methyl esters before the analysis to reduce their polarity and increase their volatility. Then the methyl esters were quantified by gas chromatography (GC) equipped with a flame ionization detector (FID) (Perkin Elmer Autosystem, Waltham, MA, USA). The fatty acids were identified by their retention times as compared to those of standards purchased from Sigma–Aldrich (St. Louis, MO, USA).

2.3. Biological Activities Determination of Tea Seed Oils

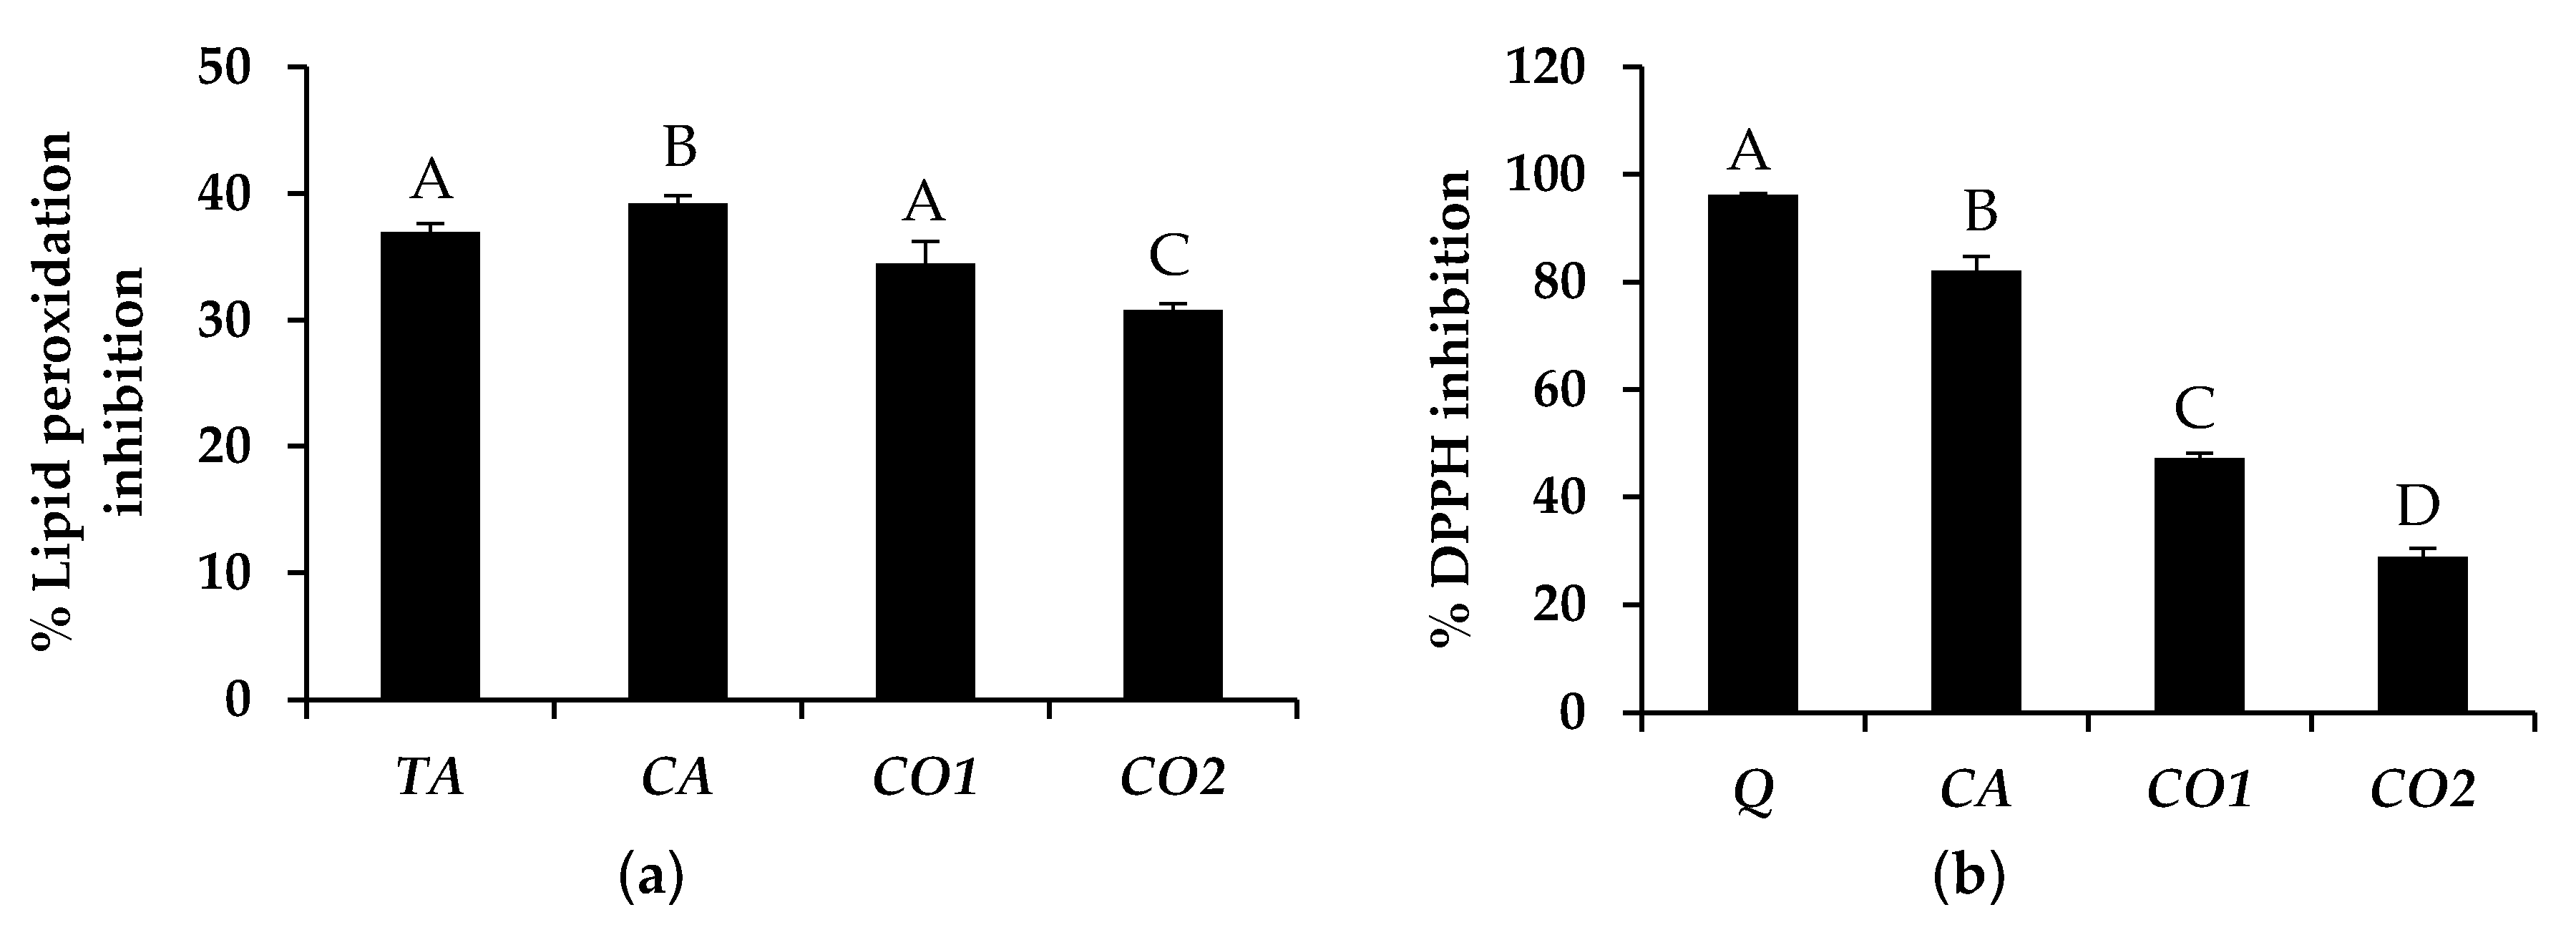
2.3.1. Antioxidant Activity Determination

Inhibition of Lipid Peroxidation by the Ferric Thiocyanate Assay

Antioxidant activity of CA and two commercial tea seed oils (CO1 and CO2) were tested for the inhibition of lipid peroxidation by the ferric thiocyanate method reported by Motamed and Naghibi with slight a modification [12]. Briefly, 100 μL of a test sample solution or tocopheryl acetate (TA) as standard solution in DMSO was mixed with 1 mL of 25 mM linoleic acid in acetone and 1 mL of 0.1 M phosphate buffer pH 7.0 in the test tube with cork lid stock. The reaction was carried out in the dark for 6 h at 60 °C. Then 50 μL of the mixture was mixed with 3 mL of 75% EtOH, 20 μL of 35% ammonium thiocyanate, and 20 μL of 20 mM ferrous chloride in 3.5% HCl. After mixing by vortex for 1 min, the absorbance was measured at 500 nm by using a UV-Visible spectrophotometer (Biochrom, Cambridge, UK). % Inhibition was calculated using the following equation;
% Inhibition = [(BS)/B)] × 100,
where B is the absorbance of the mixture of 100 μL of acetone, 1 mL of 25 mM linoeic acid in acetone, and 1 mL of 0.1 M phosphate buffer pH 7.0 in the absence of test sample and S is the absorbance of 1 mL of 25 mM linoeic acid in acetone, and 1 mL of 0.1 M phosphate buffer pH 7.0 in the presence of 100 μL of test sample. The experiment was performed in triplicate.

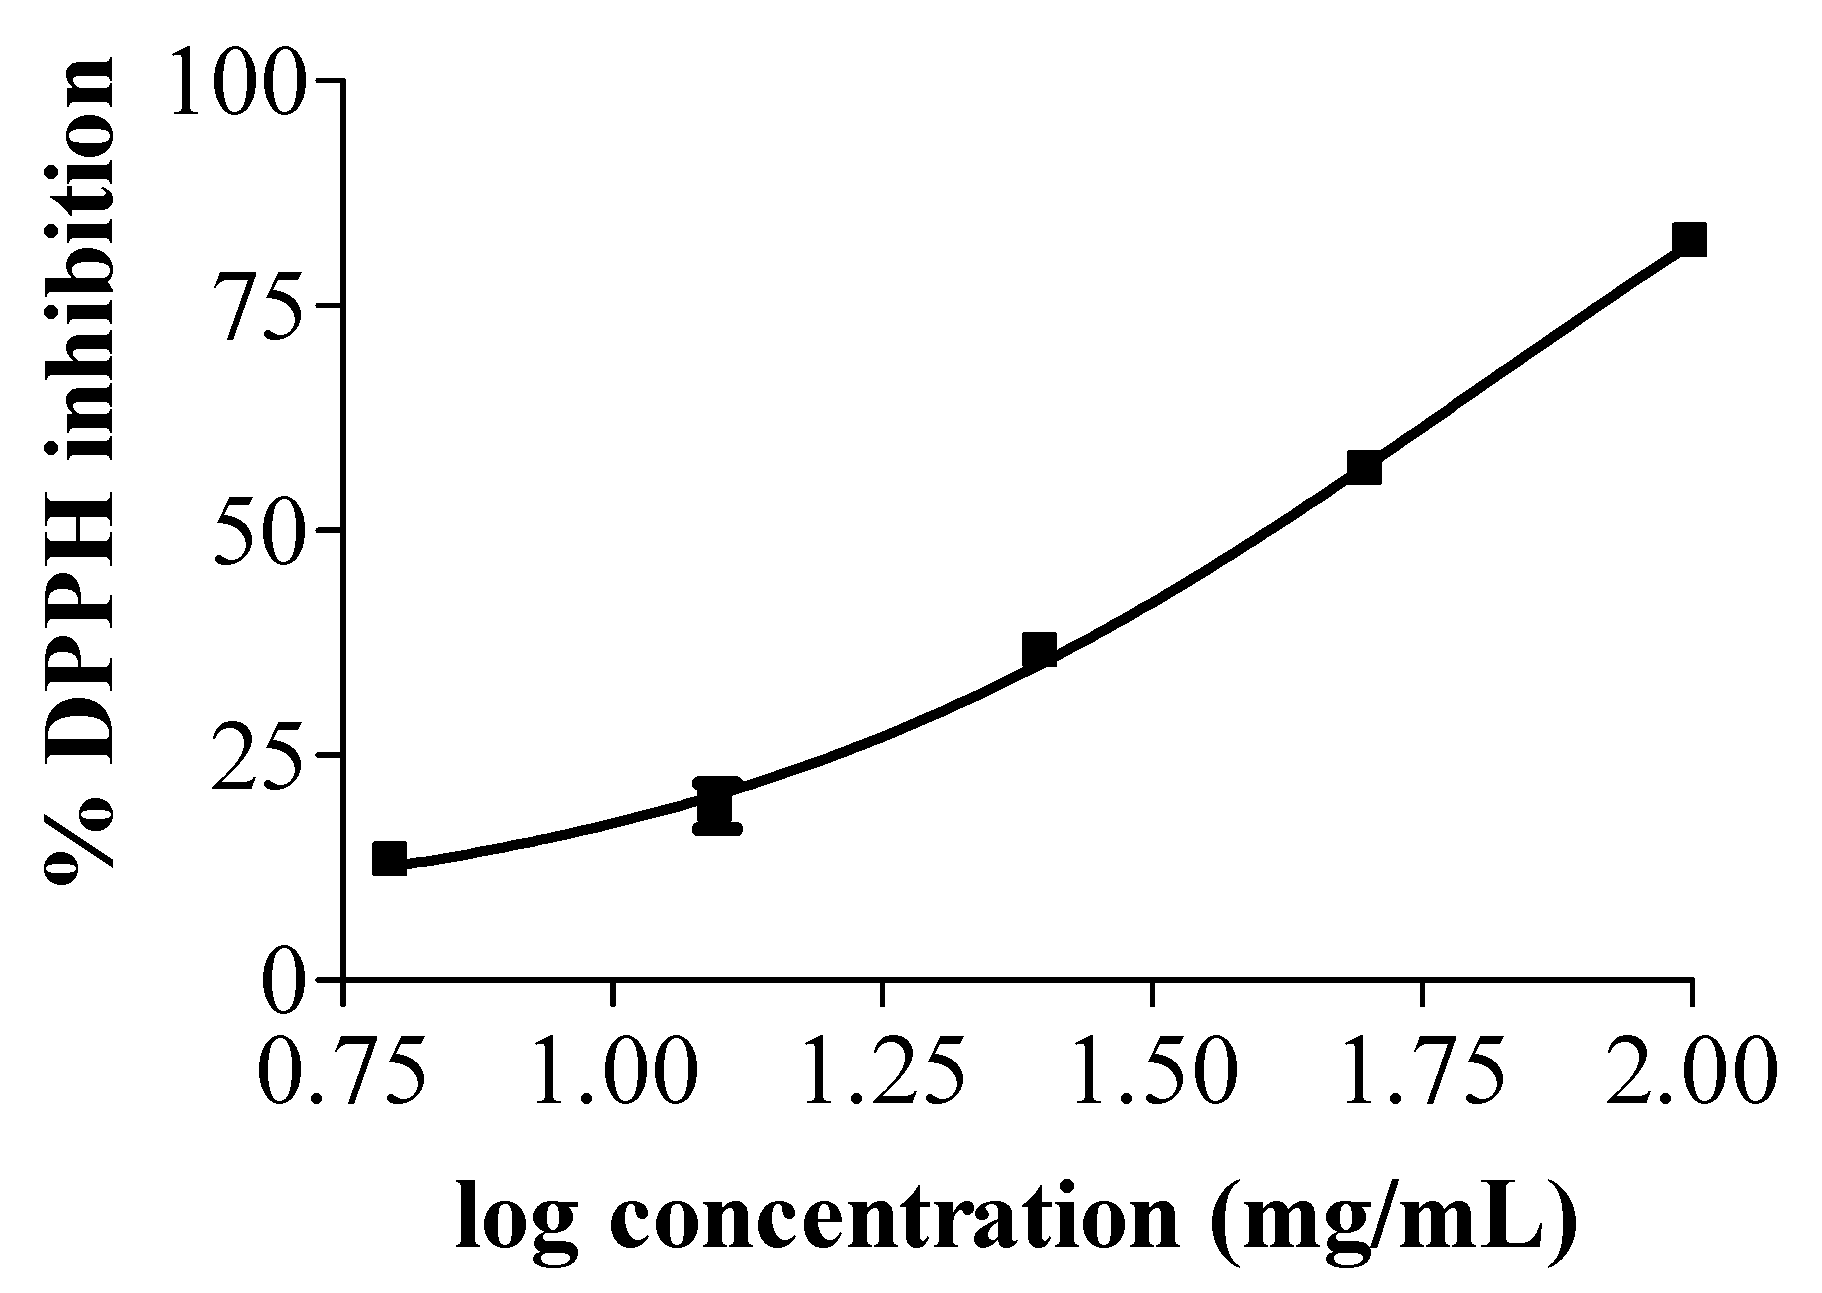
Scavenging of 1,1-Diphenyl-2-picrylhydrazy Radical (DPPH Assay)

Tea seed oils including CA, CO1, and CO2 were tested for radical scavenging activity against stable DPPH using the method reported by Blois [13] with a slight modification. Briefly, 20 μL of test sample solution or quercetin (Q) as a standard solution in DMSO was mixed with 180 μL of 167 μM DPPH (1,1-diphenyl-2-picrylhydrazyl radical) solution. The reaction was carried out in the dark for 30 min at room temperature. Then the absorbance was measured at 520 nm using a DTX-880 Multimode Detector (Biochrom, Cambridge, UK). % Inhibition was calculated using the following equation;
% Inhibition = {[(PCNC) − (SB)]/(PCNC)} × 100,
where PC is the absorbance of 20 μL of acetone and 180 μL of 167 μM DPPH mixture, NC is the absorbance of 200 μL of acetone, S is the absorbance of 20 μL of test sample and 180 μL of 167 μM DPPH mixture, and B is the absorbance of 20 μL of test sample and 180 μL of acetone mixture. The experiment was performed in triplicate.

2.3.2. In Vitro Skin Moisturizing Effect Determination

The tea seed oils including CA, CO1, and CO2 were examined in comparison with tocopheryl acetate (TA). The tested skins were prepared from the flank area of stillborn piglets which were accidentally died before birth. The piglets were obtained fresh from a local farm. The fat layer was removed, and the skin was cut into 3 × 3 cm2. The skins were left at room temperature (25 ± 1 °C) with 50–60% relative humidity (RH) for at least 30 min before further testing. After preparation, 60 μL of each test sample was applied on the skin surface. The moisture content was measured before and after applying the sample for 15 and 30 min using a Corneometer® CM 825 (Courage and Khazaka, Köln, Germany). All the measurements were performed in triplicate. This method had been modified from O’Goshi et al. [14].

2.4. Development of Microemulsion Containing Tea Seed Oils

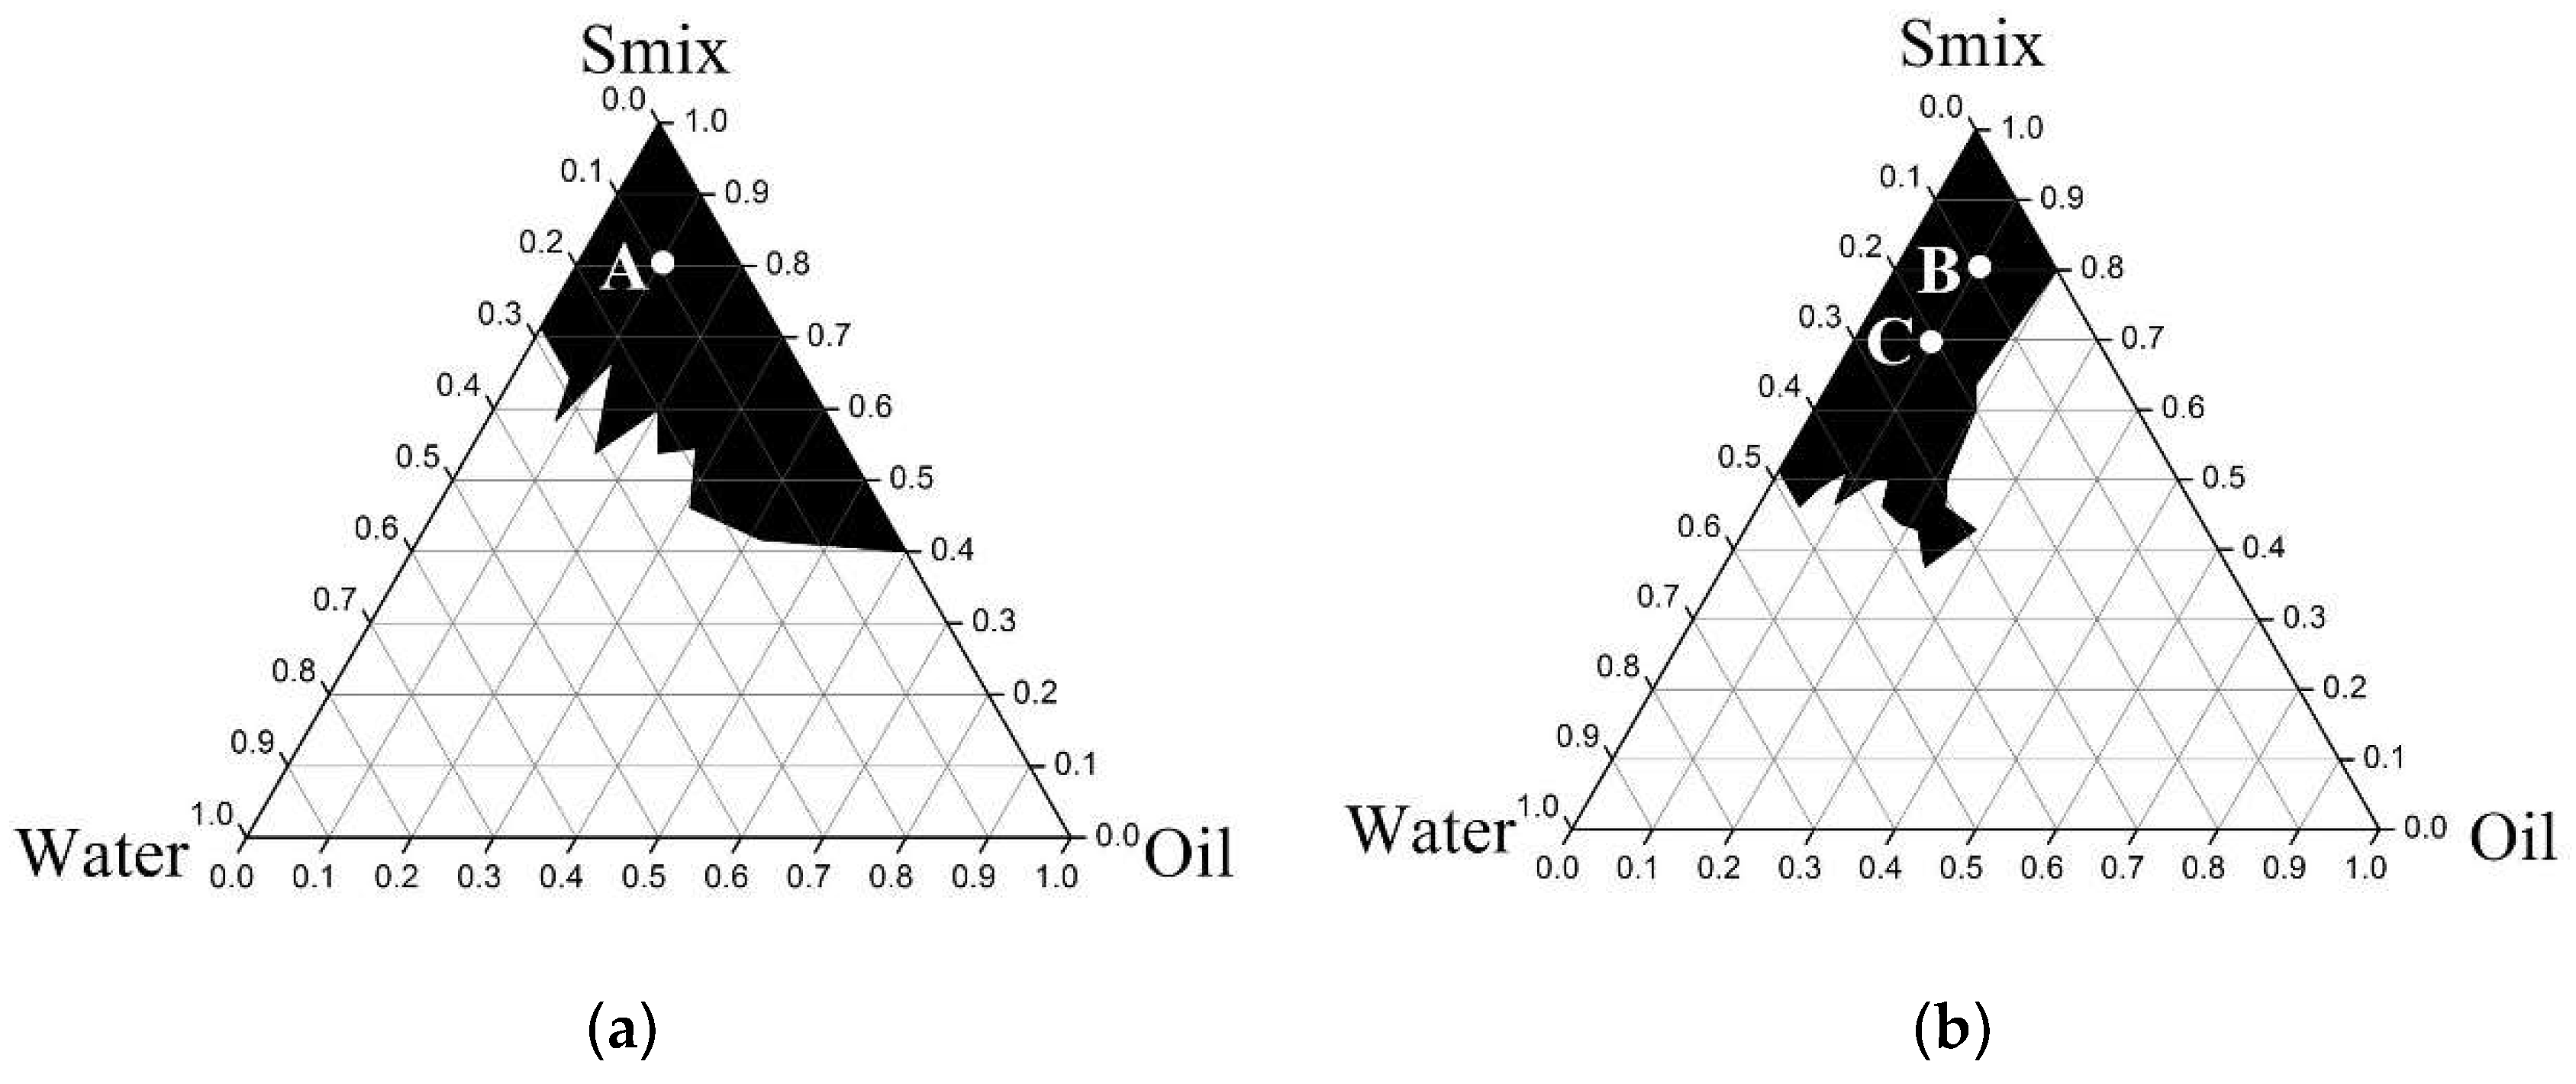
2.4.1. Pseudoternary Phase Diagram Construction

Pseudoternary phase diagrams of CA were constructed using a slightly modified water titration method [15]. Three components used for the construction of pseudoternary phase diagrams were oil phase, water phase, and surfactant mixture (Smix). CA was used as the oil phase. Various non-ionic surfactants (Tween 20, Tween 60, Tween 80, Tween 85, Span 80, or Triton X-114) were mixed with various co-surfactants (ethanol, propan-2-ol, glycerine, PG, or PEG-400) at a weight ratio of 1:1 to obtain Smix. The effect of surfactant to co-surfactant weight ratio were also investigated by using the ratio of 6:1, 4:1, 2:1, 1:1, and 1:2. The oil phase and Smix were then mixed at various weight ratios (0:1, 1:9, 2:8, 3:7, 4:6, 5:5, 6:4, 7:3, 8:2, 9:1, and 1:0) and the resulting mixtures were subsequently titrated with water under moderate agitation at room temperature. The samples were classified as MEs when they appeared visually as clear liquids. The different formulations were made in triplicate. The pseudoternary phase diagrams were drawn by OriginPro 8 software. The ME regions were measured by ImageJ 1.47v software.

2.4.2. Microemulsion Development

MEs were developed by mixing CA (oil phase) with Smix and water, when Smix were the combination of Tween 85 and ethanal (4:1) or Tween 85 and PG (2:1). Three ME formulations were developed and were classified as ME A, B, and C. Tween 85 and ethanal (4:1) were used as Smix in formulation A, where the CA:Smix:water ratio was 1:8:1. Tween 85 and propylene glycol (2:1) were used as Smix in formulation B and C, where the CA:Smix:water ratio were 1:8:1 and 1:7:2, respectively.

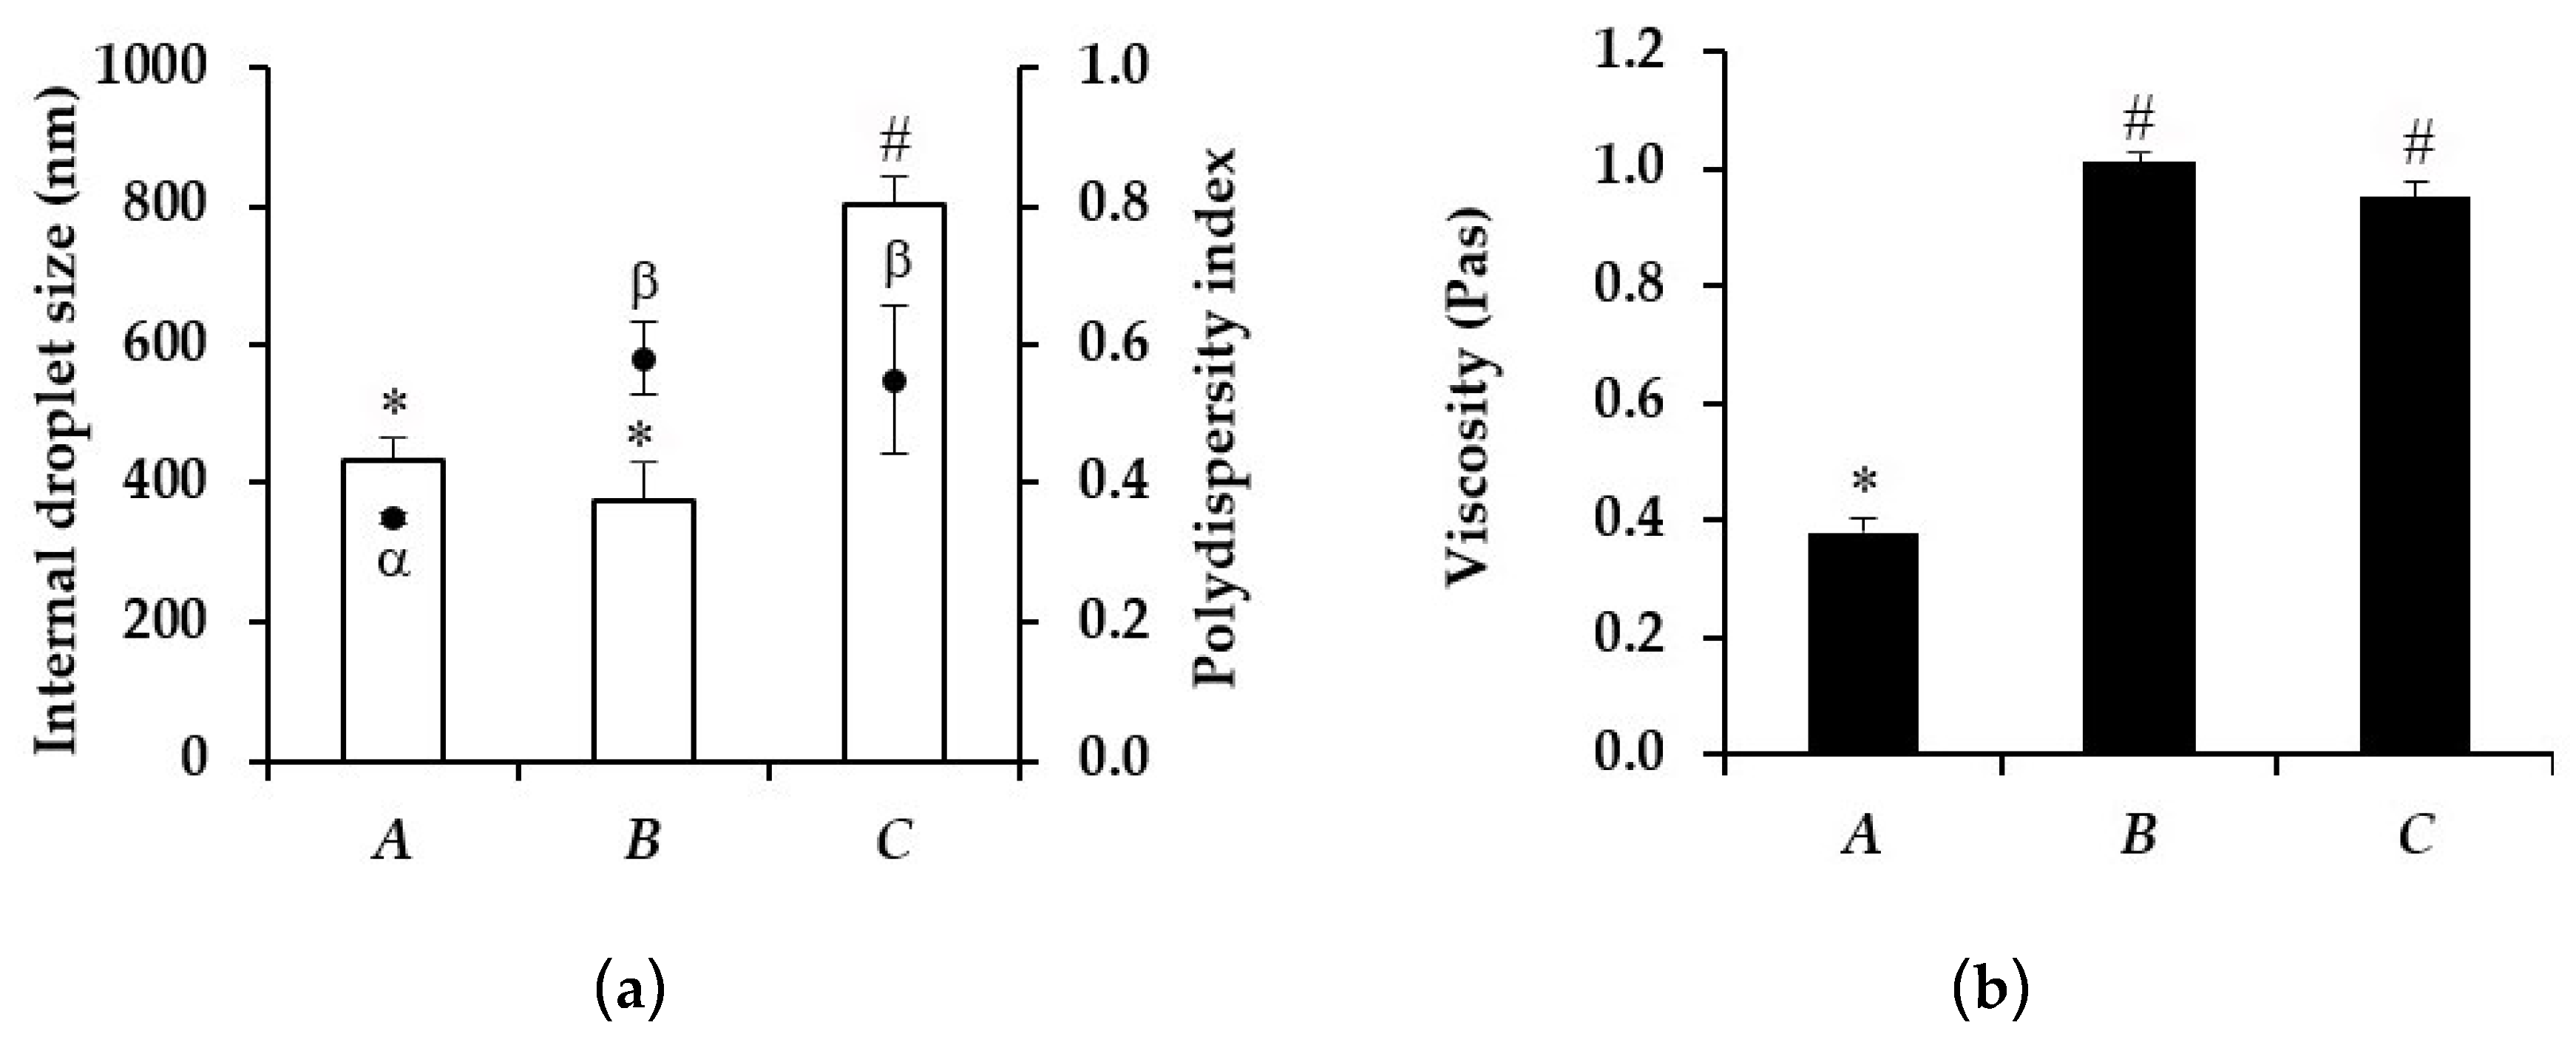
2.4.3. Characterization of Microemulsion

Photon Correlation Spectroscopy

Particle size analysis was carried out using photon correlation spectroscopy (Zetasizer® version 5.00, Malvern Instruments Ltd., Malvern, UK). The sizing measurements were carried out at a fixed angle of 173°. The reported results are mean ± standard deviation (S.D.) of at least ten measurements on the sample.

Rheology Study

Viscosity of MEs was measured using a Brookfield DVIII rheometer (Brookfield Engineering Laboratories, Stroughton, MA, USA) fitted with a bob spindle. Brookfield Rheocalc operating software was used to control the measurement. A sample volume of 70 mL was used. The measurements were performed in triplicate at 25 °C.

Biological Activities Determination of Microemulsion Containing Tea Seed Oil

Antioxidant activities of ME s containing tea seed oil were tested as mentioned in Section 2.3.1.

2.4.4. Stability Study

MEs were kept in air-tight containers under the accelerated conditions, i.e., six heating-cooling cycles consisting of 4 °C for 24 h switching to 45 °C for 24 h. The ME were then characterized for the particle size by using photon correlation spectroscopy (Zetasizer® version 5.00, Malvern Instruments Ltd., Malvern, UK) and the viscosity by using a Brookfield DVIII rheometer (Brookfield Engineering Laboratories, Stroughton, MA, USA) fitted with a bob spindle.

2.5. Statistical Analysis

All data are presented as a mean ± standard deviation (S.D.). Individual differences were evaluated by t-test and One-Way ANOVA with post-hoc testing. Statistical difference was set at p < 0.05.

3. Results

3.1. Fatty Acid Composition of Tea Seed Oils

The fatty acid composition of CA and CO1 are shown in Table 1. The major components of CA were cis-9-oleic acid, cis-9,12-linoleic acid, and palmitic acid. CO1 had similar major components as CA but with higher amount.

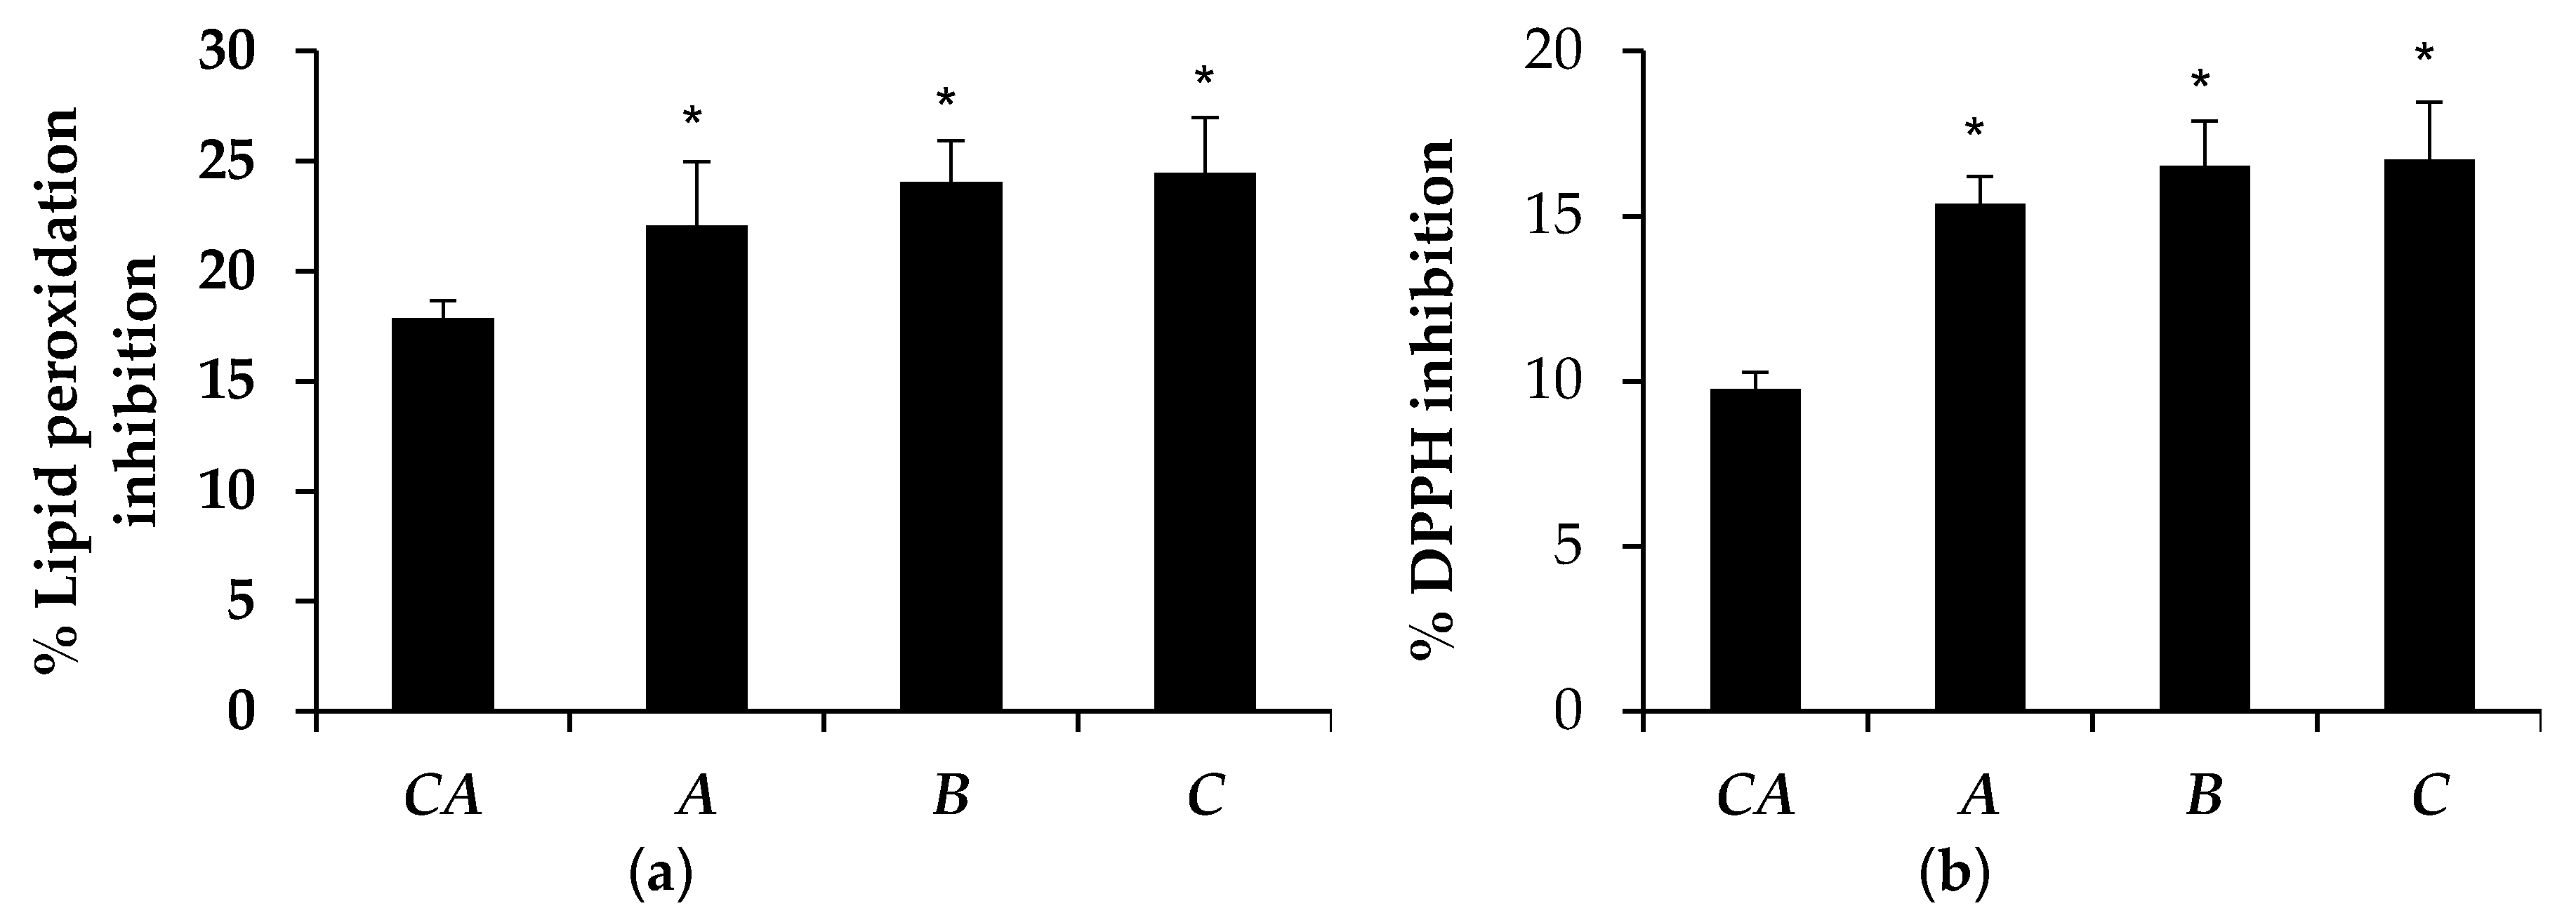
3.2. Antioxidant Activity of Tea Seed Oils

The antioxidant activity of tea seed oils, as shown in Figure 1, indicated that CA possessed the significantly highest antioxidant activity in both lipid peroxidation and DPPH assay. Interestingly, CA showed a significantly higher lipid peroxidation inhibition compared to tocopheryl acetate (TA) and significantly higher scavenging effects against DPPH. Moreover, CA also had the highest DPPH inhibitory activity among the tea seed oils (Figure 1b) with the IC50 of 70.76 ± 27.14 mg/mL (Figure 2).

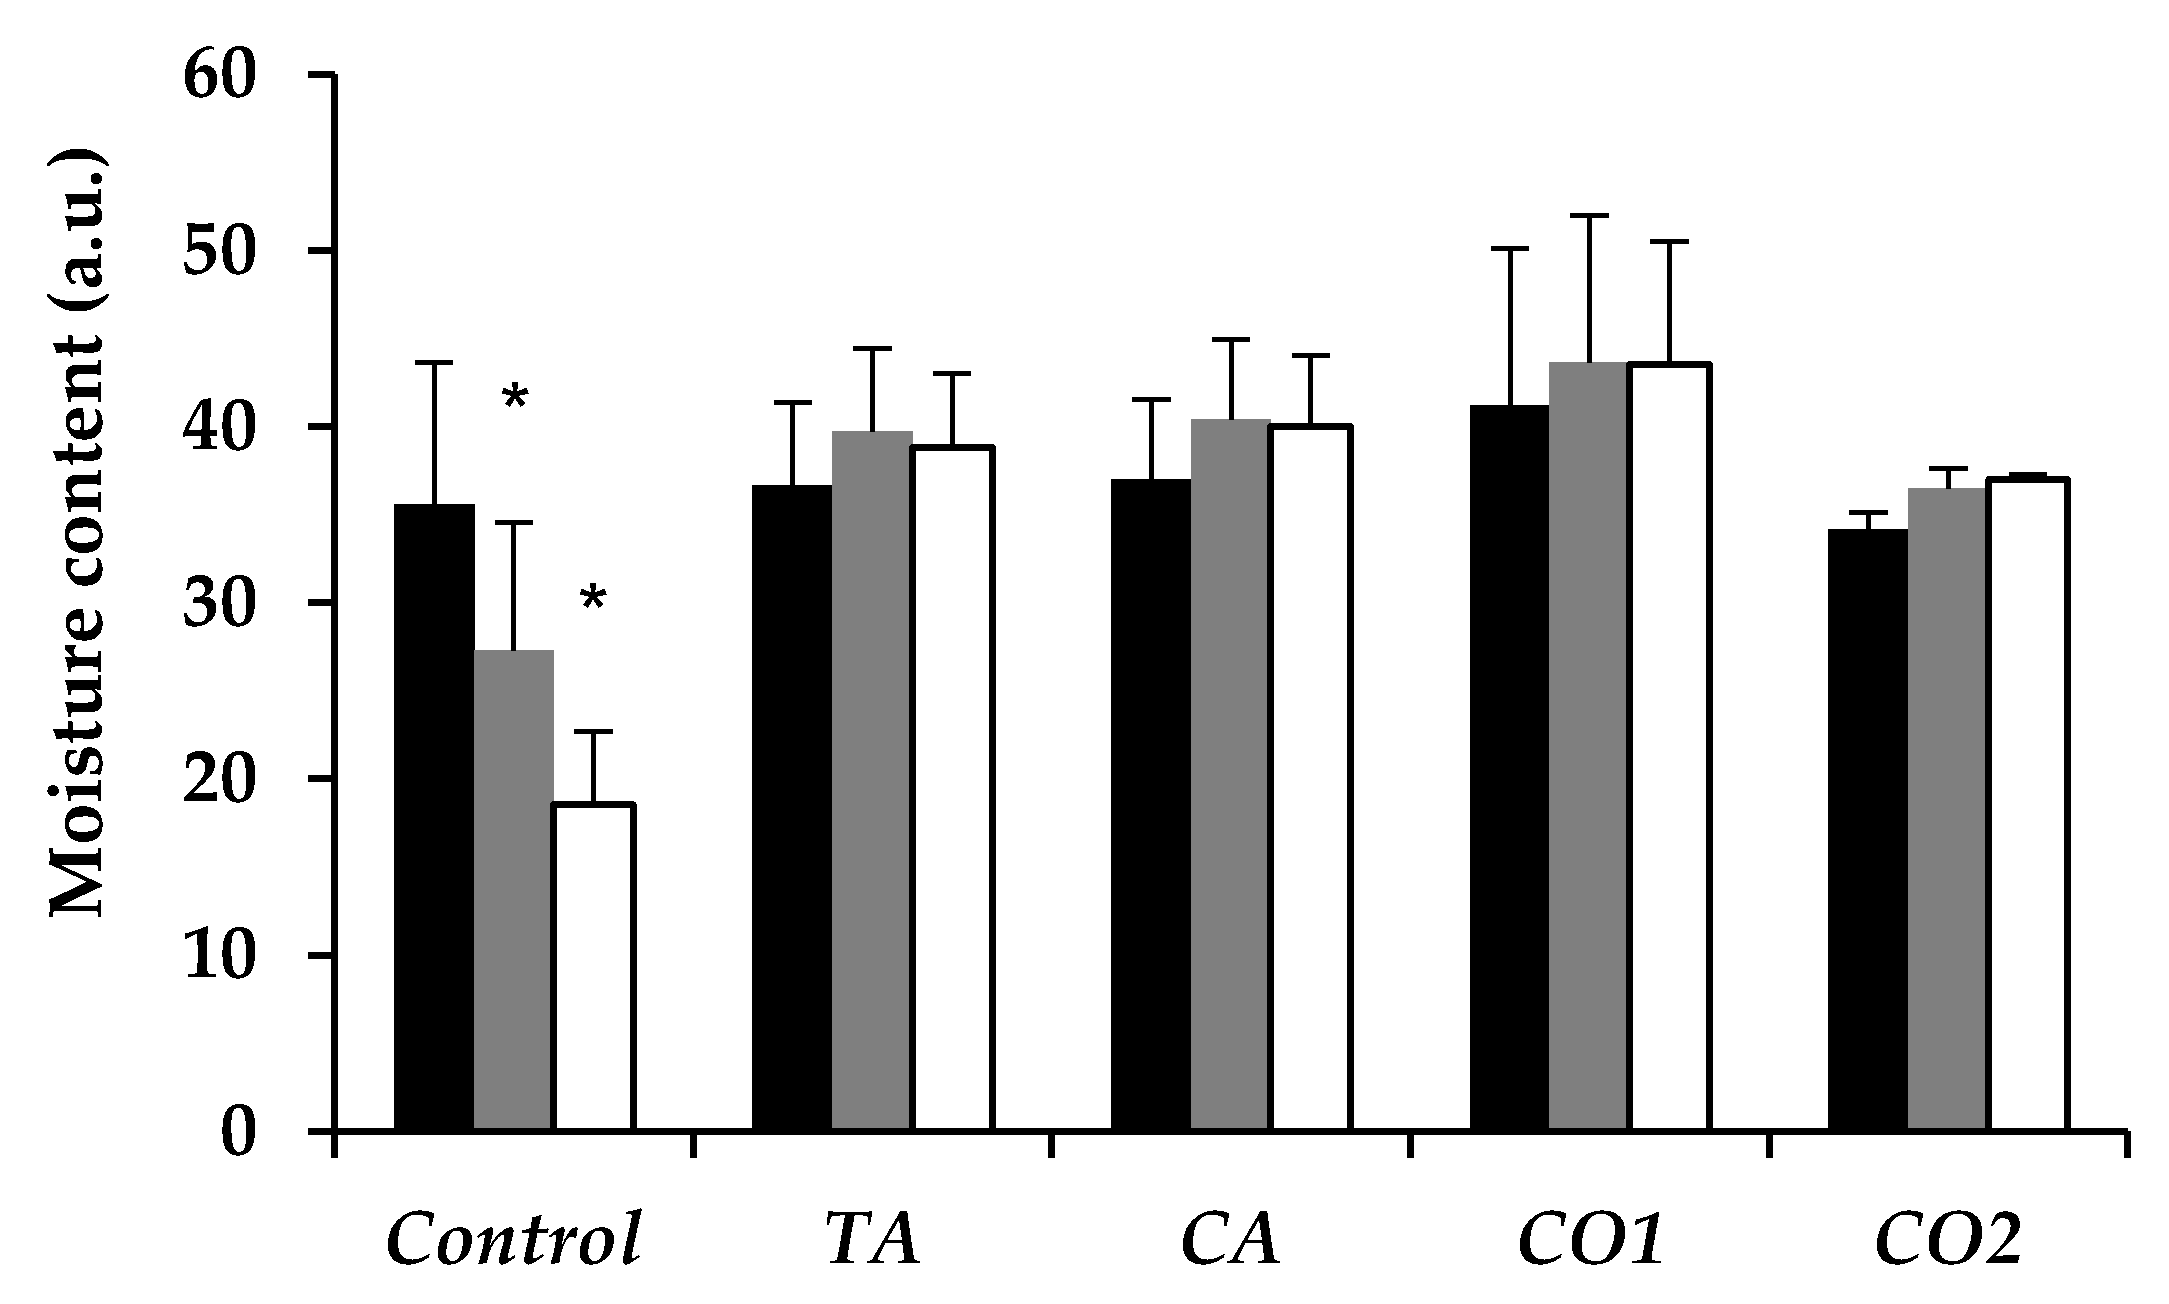
In Vitro Skin Moisturizing Effect of Tea Seed Oils

The skin moisturizing effect of tea seed oils was investigated using a Corneometer. The results are shown in Figure 3. The so called short-term moisturizing effect of all tested substances presented significantly different from the controls (untreated area) at p < 0.05 with increasing efficacy over time. These may be due to the occlusive property of the oils. CO1 had the highest skin moisturizing effect, followed by CA (which was equal to TA) and then CO2, respectively.

3.3. Development of Microemulsion Containing Tea Seed Oils

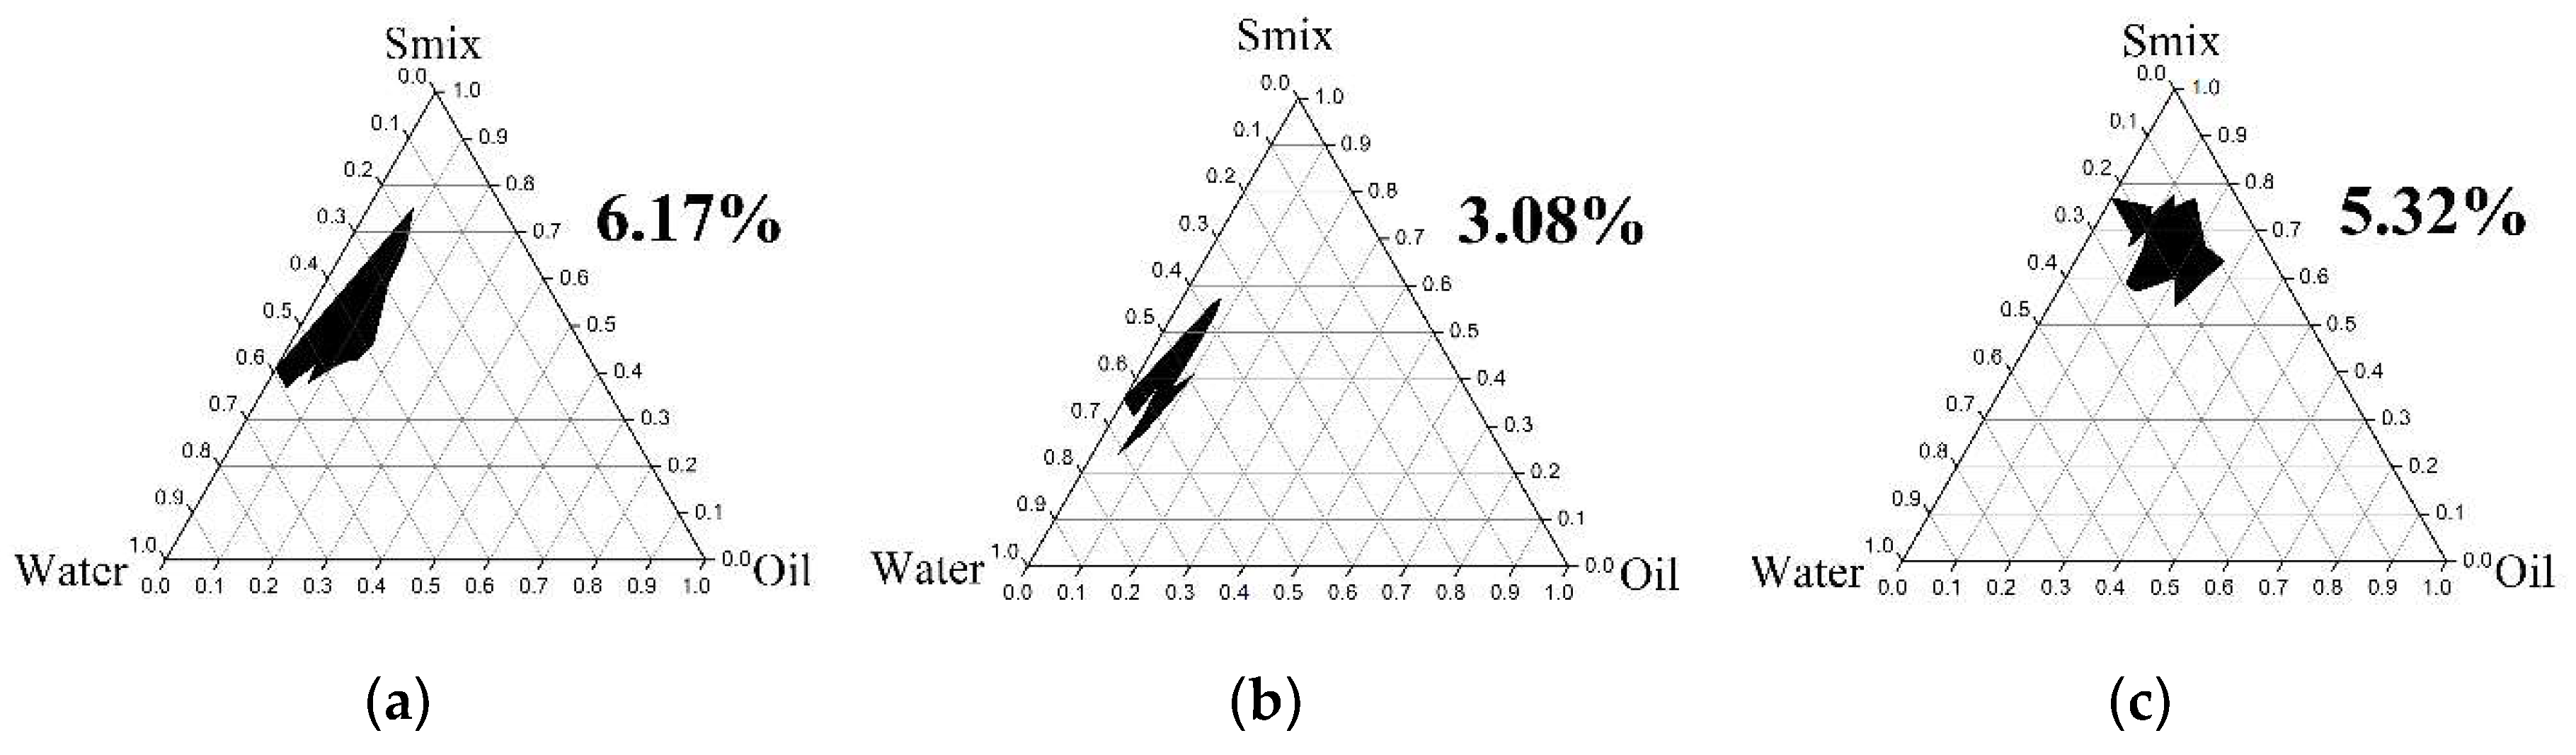
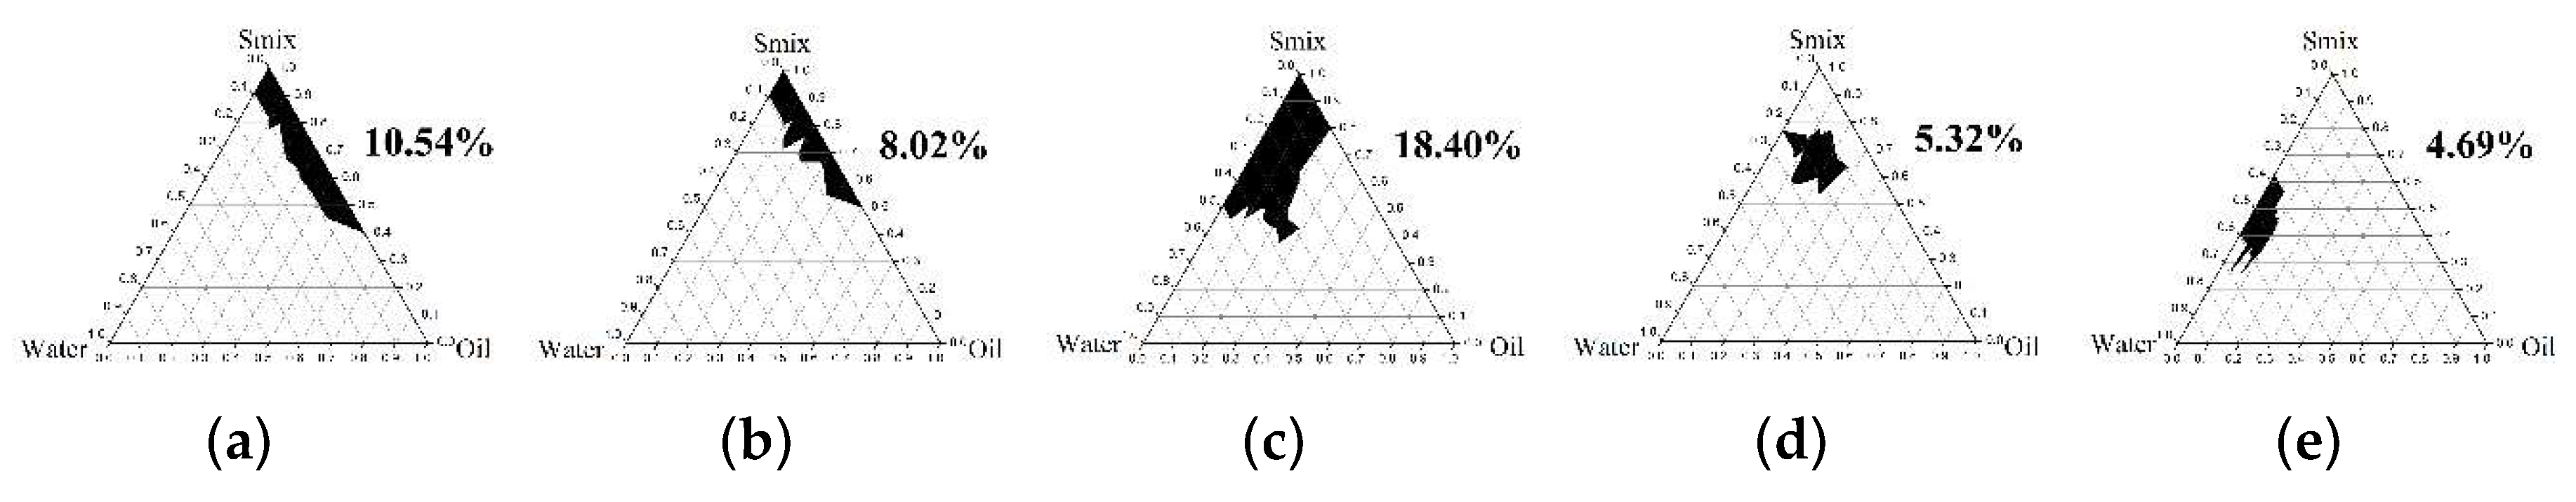
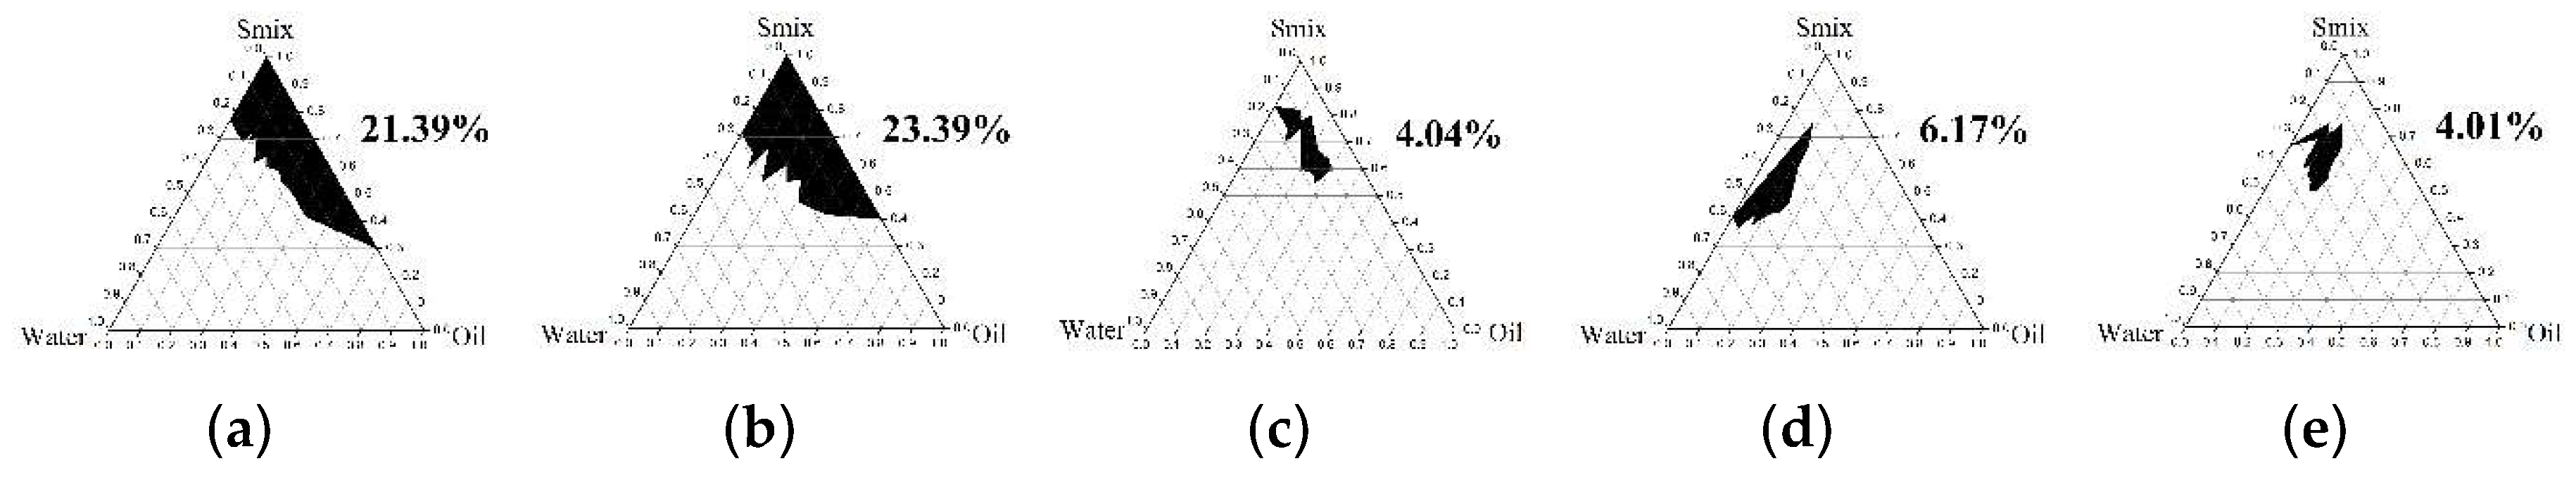
3.3.1. Pseudoternary Phase Diagram Construction

Pseudoternary phase diagram is an important tool for the screening of self-dispersible formulation components and evaluating the effect of different components of the ME [16]. The effect of surfactant type on ME development was investigated. Six surfactants (Tween 20, Tween 60, Tween 80, Tween 85, Span 80, and Triton X-114) were used in this study. Only Tween 85 produced a ME region in the phase diagram (Figure 4a).
The effect of co-surfactant type was also investigated when the surfactant was Tween 85. The five co-surfactants were ethanol, isopropanol, propylene glycol, glycerin, and polyethylene glycol-400. The results (Figure 4) indicated that ethanol, isopropanol, and propylene glycol produced MEs with a ME region of 6.17%, 3.08%, and 5.32%, respectively, whereas, glycerin and polyethylene glycol-400 did not produce any MEs (Figure not shown).
Since ethanol and propylene glycol produced a promising ME region, the various ratios of Smix (6:1, 4:1, 2:1, 1:1, and 1:2) were investigated using these two co-surfactants. The results (Figure 5) indicated that the optimum ratio of Tween 85 to ethanol was 4:1 as it produced the largest ME region in the phase diagram. On the other hand, the optimum ratio of Tween 85 to propylene glycol was 2:1 (Figure 6).

3.3.2. Microemulsion Formulations

Three formulations of ME (A, B, and C) which contained 10% of oil phase were formulated and characterized. The compositions of each formulation are shown in pseudoternary phase diagrams in Figure 7. The MEs were isotropic systems with a yellow color.

3.4. Characterization of Microemulsion

The internal droplet size and polydispersity index of formulation A, B, and C are shown in Figure 8a. The formulation containing 10% of oil phase (A and B) had significantly smaller internal droplet size than that containing 20% (C) (p < 0.05). Therefore, the oil phase content had a strong effect on the internal droplet size, whereas, the type of co-surfactants had no effect. The internal droplet size of A and B was almost the same although PG has a larger molecular size compared to ethanol.
All formulations developed in this study showed a Newtonian flow behavior which is a characteristic of ME. The formulations using PG as a co-surfactant (B and C) had a higher viscosity than that using ethanol (A) (Figure 8b). The explanation might be that the viscosities of the formulations are derived from the native viscosity of each co-surfactant.

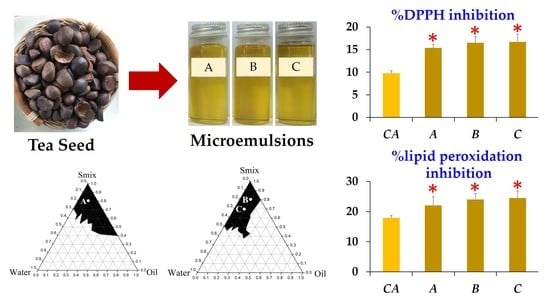
3.5. Antioxidant Activity of Microemulsion Containing Tea Seed Oils

The antioxidant activity of 10% CA and the ME containing 10% CA were determined by lipid peroxidation and DPPH assay. The results from both methods were comparable to each other as shown in Figure 9. The MEs had a significantly higher antioxidant effect compared to the native CA oil.

3.6. Stability of Microemulsion Containing Tea Seed Oils

Viscosity and internal droplet size of each ME is shown in Table 2. After the heating-cooling stability test, the ME A, in which ethanol was used as a co-surfactant, significantly increased in viscosity (p < 0.05). The increment of viscosity may be due to the evaporation of ethanol during the storage time. Since PG was used in ME B and C, the evaporation did not occur and no alteration in the viscosity occurred after the stability test.
The antioxidant activity of MEs containing tea seed oil was also investigated after the heating-cooling cycles (Table 3). The DPPH inhibition of all MEs was not altered by the storage conditions, whereas, lipid peroxidation inhibition was significantly decreased (p < 0.05).

4. Discussion

Tea seed oil is rich in vitamin A, B, and E with no cholesterol [2,17]. The major fatty acids of CA were cis-9-oleic acid (57.97%), cis-9,12-linoleic acid (18.57%), and palmitic acid (17.32%). The fatty acid contents of CO1 were slightly different from CA, as cis-9-oleic acid, the major component in both oils, was more pronounced in CO1 (79.96%) rather than that in CA (57.97%). Furthermore, the amount of cis-9,12-linoleic acid and palmitic acid in CO1 was about half of the amount that detected in CA. However, the results in this study were in an accordance with the literature which noted that tea seed oil contained high amount of oleic acid, medium amount of linoleic acid, and low amount of linolenic acid [5].
The antioxidant activities of tea seed oil from Camellia oleifera Abel. and Camellia sinensis L. have been extensively investigated and their prophylactic properties against free radical related conditions have been reported [18,19]. However, the antioxidant activity of CA is first described in the present study. The antioxidant activity of the oil was determined in a comparison with two commercial oils (CO1 and CO2) by using the inhibition of lipid peroxidation and DPPH assays. These two methods were used as the previous studies emphasized that the antioxidant activity was depended on the method used and it recommended the use of at least two different test methods [20]. DPPH assay is the test system using a stable free radical to give information on radical scavenging or antiradical activity, whereas, the lipid peroxidation assay is the most studied biologically relevant free radical chain reaction that gives information on the antioxidant activity. Both assays revealed that CA possessed higher antioxidant activity compared to the commercial oils. Therefore, tea seed oil is rich in antioxidant activity and can be used as alternative source of oil phase in cosmetics production. Additionally, CA possessed moisturizing efficacy on a pig skin model which has structural similarities to human skin [21]. Therefore, it would be an attractive component for ME development for topical use purposes.
ME is one of the delivery systems that is suitable for topical use. The construction of pseudoternary phase diagrams greatly helps to elucidate the ME region that exists in the diagram depending upon the composition ratios since the variety of structure of ME is a function of the formulation’s composition [22]. The previous study indicated that among various surfactants, Tween 85 can produce ME, when the oil phase was isopropyl myristate, the co-surfactant was ethanol, and Smix ratio was 1:1 [17,23]. In some cases, Tween 85 produces smaller ME regions compared to the others [17]. Therefore, there was no universal surfactant that suitable for all types of oil in ME development. For tea seed oil, Tween 85 was suggested.
In the present study, co-surfactants (ethanol and PG) and the ratios of Smix affected the ME region in the phase diagram. The results agree with the previous study where different types of co-surfactant brought about the various ME formations and ME regions in the phase diagram [24]. Additionally, the higher proportion of surfactant in Smix, the larger area of ME region. Gao et al. reported that ME region respectively increased when the ratio of Cremophor EL to Transcutol increased from 0.5:1 to 4:1 [25]. Similarly, Guan et al. reported that ME region increased when the ratio of Tween 20 to PEG-400 increased from 1:2 to 4:1 [17]. However, in the present study, there was an optimum ratio of the Smix. The ME region decreased at a higher proportion of surfactant and the lower proportion of co-surfactant because there was not enough co-surfactant to ensure flexibility of interfacial layer and reduce the interfacial tension.
In the present study, the tea seed oil content affected the ME formation. This agrees with the previous study that droplet size of oil-in-water MEs were influenced by the total content of the oil phase [26]. In additions, the surfactant to co-surfactant ratio was an important parameter in determining the size of the internal phase of the ME systems [27].
ME A and C were isotropic systems with a yellow color which had the same appearance as the original after stability testing. On the other hand, ME B separated into two layers made of a ME (top) and water-rich region (bottom) which was the characteristic of a Winsor type II system. The internal droplet size of ME B significantly increased after the heating-cooling cycles (p < 0.05) which related well with a change of external appearance. Normally, ME containing a non-ionic surfactant is a Winsor type I system (oil in water ME with excess oil) at low temperature and turns to a Winsor type II system (water in oil ME with excess water) when the temperature increases. Increasing temperature decreases the degree of hydration of the head group of non-ionic surfactants, thereby decreasing its effective area at the interface [28,29]. ME B turned into a Winsor type II system during the storage at high temperature (45 °C) which led to the phase separation.
After the stability test, the DPPH inhibition of all MEs still remained the same while lipid peroxidation inhibition was significantly decreased (p < 0.05). These two different methodologies revealed distinctly different results. Lipid peroxidation is a complex process involving various mechanisms, including lipid radical formation, oxygen uptake, and rearrangement of the double bonds in unsaturated lipids [30], whereas, DPPH assay was only related to the scavenging ability. In this study, the scavenging ability of MEs containing CA did not decrease over the time but the ability to inhibit the rearrangement of the double bonds in unsaturated lipids could be reduced. In conclusion, the ME retained the radical scavenging activity; however, the antioxidant activity decreased during the storage time.

5. Conclusions

The antioxidant and moisturizing properties of CA was firstly described in the present study. CA had a significantly higher lipid peroxidation and DPPH inhibition compared to two commercial tea seed oils (CO1 and CO2). The lipid peroxidation inhibition of CA was 39.20% ± 0.63% at a concentration of 37.5 mg/mL and the IC50 against DPPH was 70.76 ± 27.14 mg/mL. The moisturizing effect of CA, TA, CO1, and CO2 were not significantly different. However, the short-term moisturizing effect of CA, TA, CO1, and CO2 was significantly higher than that of controls (untreated area) and the increasing moisturizing efficacy with time of the oils was also observed. The ME of CA was then developed and the factors affecting ME formation were investigated. The surfactant types, co-surfactant types, and Smix ratio influenced ME region based on observation of the pseudoternary phase diagrams. Tween 85 was found to be the only surfactant suitable for the ME formation. The ME containing CA were prepared by mixing CA with Smix and water. Smix was the combination of Tween 85 and ethanal (4:1) or Tween 85 and propylene glycol (2:1). The oil phase content had a strong effect, whereas, the type of co-surfactant had no effect on the internal droplet size. The radical scavenging activity and antioxidant effect of MEs were significantly higher compared to the native CA oil. Furthermore, the ME retained the radical scavenging activity after 6 cycles of heating-cooling stability test, but the antioxidant activity decreased during a storage time. It concluded that the ME of CA was suitable for topical use as carrier system in cosmetic formulations.

Author Contributions

Conceptualization, W.C., P.L.; Methodology, W.C., J.J., C.K.; Investigation, W.C.; Writing-Original Draft Preparation, W.C.; Supervision, P.L.; Funding Acquisition, P.L.

Funding

This research was funded by the Research Administration Center, Chiang Mai University, Thailand.

Acknowledgments

We thank Karl Bailey, Scientific Officer, Department of Human Nutrition, University of Otago, New Zealand and Pummy Krittaphol, assistant research fellow, School of Pharmacy University of Otago, New Zealand for improving the use of English in the manuscript.

Conflicts of Interest

The authors declare no conflict of interest.

References

  1. Paul, S.; Wachira, F.N.; Powell, W.; Waugh, R. Diversity and genetic differentiation among populations of Indian and Kenyan tea (Camellia sinensis (L.) O. Kuntze) revealed by AFLP markers. Theor. Appl. Genet. 1997, 94, 255–263. [Google Scholar] [CrossRef]
  2. Li, S.; Zhu, X.; Zhang, J.; Li, G.; Su, D.; Shan, Y. Authentication of pure camellia oil by using near infrared spectroscopy and pattern recognition techniques. J. Food Sci. 2012, 77, C374–C380. [Google Scholar] [CrossRef] [PubMed]
  3. Richards, A.V. The breeding, selection and propagation of tea. Tea Res. Inst. 1966, 1966, 154–160. [Google Scholar]
  4. He, S.; Gu, Y. The comprehensive utilization of camellia fruits. In American Camellia Yearbook; CAB Direct: Oxfordshire, UK, 1982; pp. 104–107. [Google Scholar]
  5. Sahari, M.A.; Ataii, D.; Hamedi, M. Characteristics of tea seed oil in comparison with sunflower and olive oils and its effect as a natural antioxidant. J. Am. Oil Chem. Soc. 2004, 81, 585–588. [Google Scholar] [CrossRef]
  6. Zeb, A. Triacylglycerols composition, oxidation and oxidation compounds in camellia oil using liquid chromatography–mass spectrometry. Chem. Phys. Lett. 2012, 165, 608–614. [Google Scholar] [CrossRef] [PubMed]
  7. Baker, R.C.; Florence, A.T.; Ottewill, R.H.; Tadros, T.F. Investigations into the formation and characterization of micro-emulsions. II. Light scattering conductivity and viscosity studies of microemulsions. J. Colloid Interface Sci. 1984, 100, 332–349. [Google Scholar] [CrossRef]
  8. Pedro, A.S.; Cabral-Albuquerque, E.; Ferreira, D.; Sarmento, B. Chitosan: An option for development of essential oil delivery systems for oral cavity care? Carbohydr. Polym. 2009, 76, 501–508. [Google Scholar] [CrossRef]
  9. Sinico, C.; De Logu, A.; Lai, F.; Valenti, D.; Manconi, M.; Loy, G.; Fadda, A.M. Liposomal incorporation of Artemisia arborescens L. essential oil and in vitro antiviral activity. Eur. J. Pharm. Biopharm. 2005, 59, 161–168. [Google Scholar] [CrossRef] [PubMed]
  10. Lawrence, M.J.; Rees, G.D. Microemulsion-based media as novel drug delivery systems. Adv. Drug Deliv. Rev. 2012, 45, 98–121. [Google Scholar] [CrossRef]
  11. Lucchetti, S.; Ambra, R.; Pastore, G. Effects of peeling and/or toasting on the presence of tocopherols and phenolic compounds in four Italian hazelnut cultivars. Eur. Food Res. Technol. 2018, 244, 1057–1064. [Google Scholar] [CrossRef]
  12. Motamed, S.M.; Naghibi, F. Antioxidant activity of some edible plants of the Turkmen Sahra region in northern Iran. Food Chem. 2010, 119, 1637–1642. [Google Scholar] [CrossRef]
  13. Blois, M.S. Antioxidant determination by the use of a stable free radical. Nature 1958, 181, 1199–1200. [Google Scholar] [CrossRef]
  14. O’Goshi, K.I.; Tabata, N.; Sato, Y.; Tagami, H. Comparative study of the efficacy of various moisturizers on the skin of the ASR miniature swine. Skin Pharmacol. Appl. Skin Physiol. 2000, 13, 120–127. [Google Scholar] [CrossRef] [PubMed]
  15. Chaiyana, W.; Saeio, K.; Hennink, W.E.; Okonogi, S. Characterization of potent anticholinesterase plant oil based microemulsion. Int. J. Pharm. 2010, 401, 32–40. [Google Scholar] [CrossRef] [PubMed]
  16. Ahmad, J.; Amin, S.; Kohli, K.; Mir, S.R. Construction of pseudoternary phase diagram and its evaluation: Development of self-dispersible oral formulation. Int. J. Drug Dev. Res. 2013, 5, 84–90. [Google Scholar]
  17. Guan, L.E.I.; Chung, H.Y.; Chen, Z.Y. Comparison of hypocholesterolemic activity of tea seed oil with commonly used vegetable oils in hamsters. J. Food Biochem. 2011, 35, 859–876. [Google Scholar] [CrossRef]
  18. Lee, C.P.; Yen, G.C. Antioxidant activity and bioactive compounds of tea seed (Camellia oleifera Abel.) oil. J. Agric. Food Chem. 2006, 54, 779–784. [Google Scholar] [CrossRef] [PubMed]
  19. Wang, Y.; Sun, D.; Chen, H.; Qian, L.; Xu, P. Fatty acid composition and antioxidant activity of tea (Camellia sinensis L.) seed oil extracted by optimized supercritical carbon dioxide. Int. J. Mol. Sci. 2011, 12, 7708–7719. [Google Scholar] [CrossRef] [PubMed]
  20. Janaszewska, A.; Bartosz, G. Assay of total antioxidant capacity: Comparison of four methods as applied to human blood plasma. Scand. J. Clin. Lab. Investig. 2002, 62, 231–236. [Google Scholar] [CrossRef]
  21. Sullivan, P.T.; Eaglstein, H.W.; Davis, C.S.; Mertz, P. The pig as a model for human wound healing. Wound Repair Regen. 2001, 9, 66–76. [Google Scholar] [CrossRef] [PubMed]
  22. Mehta, S.K.; Kaur, G. Microemulsions: Thermodynamic and Dynamic Properties; INTECH: London, UK, 2011. [Google Scholar]
  23. Yuan, Y.; Li, S.M.; Mo, F.K.; Zhong, D.F. Investigation of microemulsion system for transdermal delivery of meloxicam. Int. J. Pharm. 2006, 321, 117–123. [Google Scholar] [CrossRef] [PubMed]
  24. Alany, R.G.; Rades, T.; Agatonovic-Kustrin, S.; Davies, N.M.; Tucker, I.G. Effects of alcohols and diols on the phase behaviour of quaternary systems. Int. J. Pharm. 2000, 196, 141–145. [Google Scholar] [CrossRef]
  25. Gao, Z.G.; Choi, H.G.; Shin, H.J.; Park, K.M.; Lim, S.J.; Hwang, K.J.; Kim, C.K. Physicochemical characterization and evaluation of a microemulsion system for oral delivery of cyclosporin A. Int. J. Pharm. 1998, 161, 75–86. [Google Scholar] [CrossRef]
  26. Moreno, M.A.; Ballesteros, M.P.; Frutos, P. Lecithin-based oil-in-water microemulsions for parenteral use: Pseudoternary phase diagrams, characterization and toxicity studies. J. Pharm. Sci. 2003, 92, 1428–1437. [Google Scholar] [CrossRef] [PubMed]
  27. Kale, N.J.; Allen, L.V. Studies on microemulsions using Brij 96 as surfactant and glycerin, ethylene glycol and propylene glycol as cosurfactants. Int. J. Pharm. 1989, 57, 87–93. [Google Scholar] [CrossRef]
  28. Friberg, S.; Lapczynska, I.; Gillberg, G. Microemulsions containing nonionic surfactants--the importance of the pit value. J. Colloid Interface Sci. 1976, 56, 19–32. [Google Scholar] [CrossRef]
  29. Clint, J.H. Microemulsions. In Surfactant Aggregation; Springer: Cham, The Netherlands, 1992. [Google Scholar]
  30. Buege, J.A.; Aust, S.D. Microsomal lipid peroxidation. In Methods in Enzymology; Academic Press: Cambridge, MA, USA, 1978; pp. 302–310. [Google Scholar]
Figure 1. (a) Lipid peroxidation inhibition; (b) DPPH inhibition of tocopheryl acetate (TA), quercetin (Q), CA, CO1, and CO2 at the concentration of 37.5 mg/mL (different letters (A, B, C, and D) denote significant statistically differences between groups; p < 0.05).
Cosmetics 05 00040 g001
Figure 2. Dose response curve of DPPH inhibition versus log concentration of CA (R2 = 0.998 ± 0.002).
Cosmetics 05 00040 g002
Figure 3. Skin moisture content before application (■), 15 min after application (), and 30 min after application (□) of TA, CA, CO1, and CO2. (Asterisks denote significant statistically differences from before application; p < 0.05).
Cosmetics 05 00040 g003
Figure 4. Pseudoternary phase diagram of CA/Tween 85 and co-surfactant (1:1)/water, when the co-surfactant was (a) ethanol; (b) isopropanol; (c) propylene glycol. The dark area represents the microemulsion region.
Cosmetics 05 00040 g004
Figure 5. Pseudoternary phase diagram of CA/Tween 85 and ethanol/water, when the Smix ratio was (a) 6:1; (b) 4:1; (c) 2:1; (d) 1:1; (e) 1:2. The dark area represents the microemulsion region.
Cosmetics 05 00040 g005
Figure 6. Pseudoternary phase diagram of CA/Tween 85 and propylene glycol/water, when the Smix ratio was (a) 6:1; (b) 4:1; (c) 2:1; (d) 1:1; (e) 1:2. The dark area represents the microemulsion region.
Cosmetics 05 00040 g006
Figure 7. (a) Formulation A composing of CA/Tween 85 and ethanol/water, when the Smix ratio was 4:1; (b) Formulation B and C composing of CA/Tween 85 and propylene glycol/water, when the Smix ratio was 2:1.
Cosmetics 05 00040 g007
Figure 8. Internal droplet size and polydispersity index (a) and viscosity (b) of microemulsion A, B, and C (different letters (* and #) denote significant statistically different internal droplet size and viscosity between groups; p < 0.05, whereas, different symbols (α and β) denote significant statistically different polydispersity index; p < 0.05).
Cosmetics 05 00040 g008
Figure 9. (a) Lipid peroxidation inhibition; (b) DPPH inhibition of microemulsion A, B, and C compared to 10% CA (Asterisks (*) denote significant statistically differences from 10% CA; p < 0.05).
Cosmetics 05 00040 g009
Table 1. Fatty acid composition of tea seed oils (CA) and commercial tea seed oils (CO1).
Fatty Acid CompositionAmount (%)
CACO1
Myristic acid (C14:0)0.090.04
Pentadecanoic acid (C15:0)0.02ND
Palmitic acid (C16:0)17.327.00
Heptadecanoic acid (C17:0)0.180.05
Stearic acid (C18:0)3.73.02
Arachidic acid (C20:0)0.110.16
Behenic acid (C22:0)0.050.39
Tricosanoic acid (C23:0)0.02ND
Lignoceric acid (C24:0)0.070.11
Palmitoleic acid (C16:1n7)0.180.11
Trans-9-Eladic acid (C18:1n9t)ND0.26
cis-9-Oleic acid (C18:1n9c)57.9779.96
cis-11-Eicosenoic acid (C20:1n11)0.850.44
Erucic acid (C22:1n9)0.060.04
Nervonic acid (C24:1n9)0.090.04
cis-9,12-Linoleic acid (C18:2n6)18.578.32
alpha-Linolenic acid (C18:3n3)0.660.06
cis-11,14-Eicosadienoic acid (C20:2)0.040.02
cis-13,16-Docosadienoic acid (C22:2)0.01ND
Total99.99100.02
Table 2. Viscosity and internal droplet size of microemulsions before and after the heating-cooling stability test.
MicroemulsionViscosity (Pas)Internal Droplet Size (nm)
Before Stability TestAfter Stability TestBefore Stability TestAfter Stability Test
A0.38 ± 0.030.52 ± 0.03 *426.07 ± 56.96351.43 ± 47.14
B0.95 ± 0.071.24 ± 0.12374.67 ± 43.051126.00 ± 125.04 *
C1.01 ± 0.030.95 ± 0.01801.47 ± 40.131013.93 ± 140.90
A: 10% CA, 64% Tween 85, 16% ethanol, 10% water; B: 10% CA, 53.3 Tween 85, 26.7% propylene glycol, 10% water; C: 10% CA, 46.7 Tween 85, 23.4% propylene glycol, 20% water; Asterisks (*) denote significantly different between the results before and after stability test, p < 0.05.
Table 3. Lipid peroxidation and DPPH inhibition of microemulsions before and after the heating-cooling stability test.
MicroemulsionLipid Peroxidation Inhibition (%)DPPH Inhibition (%)
Before Stability TestAfter Stability TestBefore Stability TestAfter Stability Test
A22.07 ± 2.8915.08 ± 0.93 *15.39 ± 0.8215.08 ± 0.67
B24.47 ± 2.5015.80 ± 1.74 *16.72 ± 1.7516.25 ± 2.89
C24.05 ± 1.8815.58 ± 1.02 *16.52 ± 1.3515.16 ± 0.86
A: 10% CA, 64% Tween 85, 16% ethanol, 10% water; B: 10% CA, 53.3 Tween 85, 26.7% propylene glycol, 10% water; C: 10% CA, 46.7 Tween 85, 23.4% propylene glycol, 20% water; Asterisks (*) denote significantly different between the results before and after stability test, p < 0.05.

