Article

Preconditioning Human Skin Fibroblasts with 505 nm Blue–Green Light Reduces UVB-Induced Cyclobutane Pyrimidine Dimers


1
Unit of Molecular and Cellular Toxicology, Department of Bioscience and Engineering, College of Systems Engineering and Science, Shibaura Institute of Technology, Saitama 337-0003, Japan
2
HYOJO Science Lab, Research and Development Department, YA-MAN Co., Ltd., Tokyo 135-0016, Japan
*
Author to whom correspondence should be addressed.
Cosmetics 2026, 13(4), 198; https://doi.org/10.3390/cosmetics13040198
Submission received: 19 June 2026 / Revised: 24 July 2026 / Accepted: 30 July 2026 / Published: 4 August 2026
(This article belongs to the Section Cosmetic Dermatology)

Abstract

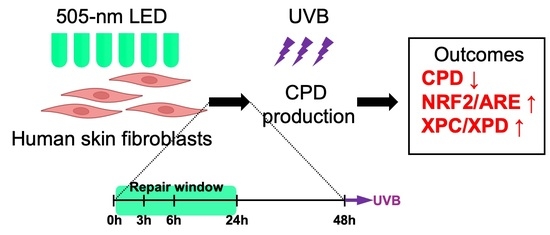
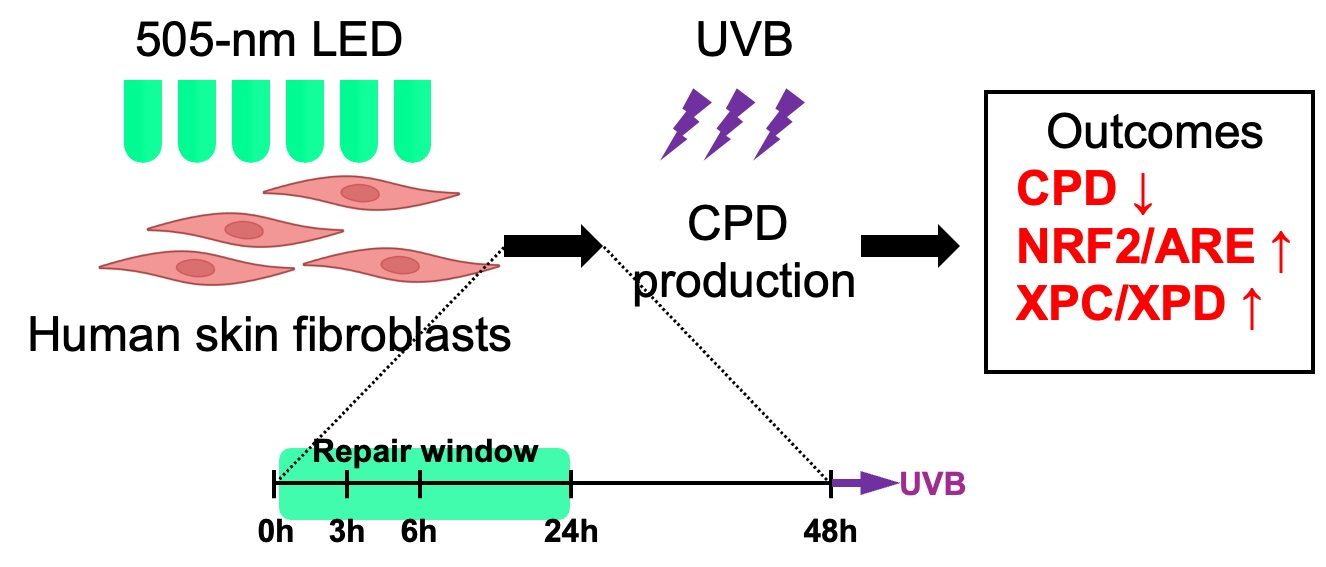
Visible-light preconditioning may complement sunscreen use by enhancing intrinsic DNA damage responses. We pre-irradiated Hs27 human dermal fibroblasts with 505 nm blue–green light (5.0 mW/cm2, 3–10 min; 0.9–3.0 J/cm2) before UVB irradiation (20 mJ/cm2). At 505 nm, the residual cyclobutane pyrimidine dimer (CPD) burden measured 24 h after UVB was reduced when UVB followed immediately or after 3–24 h (with residual CPDs falling to approximately 67% of the UVB-alone level—an approximately 33% reduction—at the most effective 3.0 J/cm2, 24 h condition), whereas protection was lost by 48 h. Under the 0 h interval condition, CPDs were also quantified immediately after UVB to compare the early CPD signal with the 24 h residual endpoint; all three visible wavelengths (505, 470 and 630 nm) lowered the immediate post-UVB signal, but only 505 nm preconditioning sustained the protective effect at the 24 h endpoint. Blue light (470 nm) produced a limited delayed benefit, whereas red light (630 nm) did not confer consistent protection and increased the residual CPD burden under selected conditions. Non-toxic 505 nm exposure primed an amplified NRF2/ARE response to subsequent UVB; XPC and XPD mRNAs rose at 2–6 h, while XPA and XPB declined early. Together, these findings support further evaluation of 505 nm blue–green light as a proof-of-concept, device-oriented strategy for timed photoprotection against UVB-induced photoaging; because these findings were obtained in a single dermal fibroblast model, they will require validation in keratinocytes and more complex skin systems before any practical application.

Graphical Abstract

1. Introduction

Ultraviolet B (UVB) is defined by the CIE as radiation from 280 to 315 nm, whereas solar UVB reaching the Earth’s surface is largely restricted to approximately 295–315 nm because shorter wavelengths are strongly attenuated by stratospheric ozone. Solar UVB represents approximately 5% of solar UVR at noon. Action spectroscopy for human erythema, DNA damage in the human epidermis in vivo, and photoaging in mouse models has shown that UVB is responsible for most of the damage to the human skin [1]. Its main photoproduct, cyclobutane pyrimidine dimer (CPD), distorts the DNA double helix, inhibits replication and transcription, and, if left unrepaired, induces C to T substitution mutations, accelerating photocarcinogenesis and photoaging [2]. In placental mammals, CPDs are removed primarily by nucleotide excision repair because photolyase-dependent photoreactivation has been lost, whereas many non-placental vertebrates retain photolyases that directly reverse CPDs under light [3]. In global-genome NER, the XPC/RAD23B complex detects damage, the TFIIH helicase complex containing XPB and XPD unwinds the damaged strand, and after XPA verifies the distortion, dual incision and gap filling are performed [4]. Structural analyses have supported the process by which damaged DNA is transferred from XPC to TFIIH and then to XPA [5]. Epidemiological studies have shown a strong correlation between CPD accumulation and skin cancer incidence [6].
Although sunshades and sunscreens are currently the main means of photoprotection, issues such as incomplete application and lack of adherence indicate that protection is not fully effective. Therefore, strategies to enhance the intrinsic DNA repair capacity are being explored. Photobiomodulation (PBM), a technique that uses low-power visible or near-infrared light to regulate cellular signaling, has been increasingly applied in clinical settings for purposes such as wound healing, anti-inflammatory effects, and pain relief [7,8]. However, research on the direct effect of PBM on reducing DNA damage caused by UV exposure remains limited [9].
Many clinical PBM devices use red (approximately 630 nm) or near-infrared (approximately 810 nm) light to target the mitochondrial cytochrome c oxidase. In contrast, blue (approximately 470 nm) and blue–green (approximately 505 nm) light primarily excite flavins and porphyrin pigments outside the mitochondria, reaching the epidermis and superficial dermis [7]. Blue light can suppress DNA synthesis and regulate differentiation in keratinocytes [10]; however, at high doses, it increases reactive oxygen species (ROS) levels in fibroblasts [11] and may cause cell proliferation arrest [12]. In contrast, blue–green light is reported to offer a better balance between penetration and receptor activation and is less likely to generate ROS than shorter wavelengths [13]. However, it has yet to be verified whether irradiation with low-output 505 nm light “before” UVB exposure can protect nuclear DNA.
Opsin-3 (OPN3), a photoreceptor present in skin cells that responds to the 450–530 nm wavelength range, is expressed in keratinocytes and fibroblasts. OPN3 has been implicated in light-responsive signaling associated with inflammatory and barrier-related responses in skin cells [10]. Cryptochrome-1 (CRY1) accumulates in response to blue light, influencing circadian rhythms and transcriptional programs [14]. Furthermore, spectroscopic analyses have demonstrated that blue light-activated cryptochrome becomes semi-reduced and reverts to its original state under green light [15], indicating that blue–green light may fine-tune the cryptochrome signaling. However, it remains uncertain whether OPN3- or CRY-associated signaling contributes to enhanced genomic protection.
Another noteworthy pathway is the KEAP1–NRF2 antioxidant system. Normally, NRF2 is directed toward degradation by KEAP1, but under oxidative stress, it becomes stabilized, translocates to the nucleus, and induces a set of genes containing antioxidant response elements (AREs) [16]. Interestingly, NRF2 not only activates antioxidant enzymes but also stimulates the promoters of XPC and XPD, thereby linking redox homeostasis to NER efficiency [17]. Mice with constitutively activated NRF2 exhibit a reduced burden of skin tumors induced by simulated solar UV radiation [18]. As NRF2 activation typically follows UVB-induced damage, initiating NRF2 activation before exposure could potentially increase the levels of NER proteins or enhance the mobilization of existing protein pools, thereby facilitating the removal of CPDs more efficiently. Recent studies have indicated that ROS signals can activate NRF2 through DNA damage response kinases [19], suggesting a possible interaction between visible-light-associated redox signaling and DNA repair mechanisms. Because NRF2 is typically activated in response to UV-associated oxidative stress, delivering a controlled, timed visible-light pre-exposure with a device could in principle raise this intrinsic defense in advance of UVB; this device-oriented rationale motivated our focus on the KEAP1–NRF2 axis as a tractable target for preconditioning.
Three questions about the effects of visible light on skin cells therefore remain open. To our knowledge, no study has tested whether low-output 505 nm light delivered before UVB protects nuclear DNA in human dermal fibroblasts. It is also unclear how any such protection depends on wavelength, output and the length of the dark interval before UVB. Finally, the molecular pathways involved—including reactive oxygen species (ROS)–nuclear factor erythroid 2-related factor 2 (NRF2) signaling and wavelength-dependent transcription of nucleotide excision repair (NER) genes—have not been characterized.
We therefore tested whether 505 nm blue–green light reduces UVB-induced CPDs in human dermal fibroblasts and examined the associated molecular responses. We reasoned that 505 nm pre-irradiation primes the KEAP1–NRF2 axis, increases XPC and XPD mRNAs, and mobilizes existing XPA/XPB pools, so that the residual CPD burden after UVB is lowered. Red (630 nm) and blue (470 nm) light served as wavelength controls. Accordingly, the study was designed to compare three narrow-band wavelengths at matched irradiance, to vary the dark interval between preconditioning and UVB, and to read out both NER-gene transcription and NRF2/ARE activity, thereby linking the timing of an external light cue to the intrinsic DNA damage response.

2. Materials and Methods

2.1. Reagents

Murine monoclonal antibodies against cyclobutane pyrimidine dimers (CPDs) (Cosmo Bio, Tokyo, Japan) and dsGreen (Lumiprobe Corporation, Hallandale Beach, FL, USA) were used as the primary antibody and for DNA staining for dot blotting, respectively. According to the manufacturer, the anti-CPD monoclonal antibody recognizes CPDs in denatured single-stranded DNA and detects CPDs formed in all dipyrimidine sequence contexts (TT, TC, CT, and CC).

2.2. LED Irradiation Device

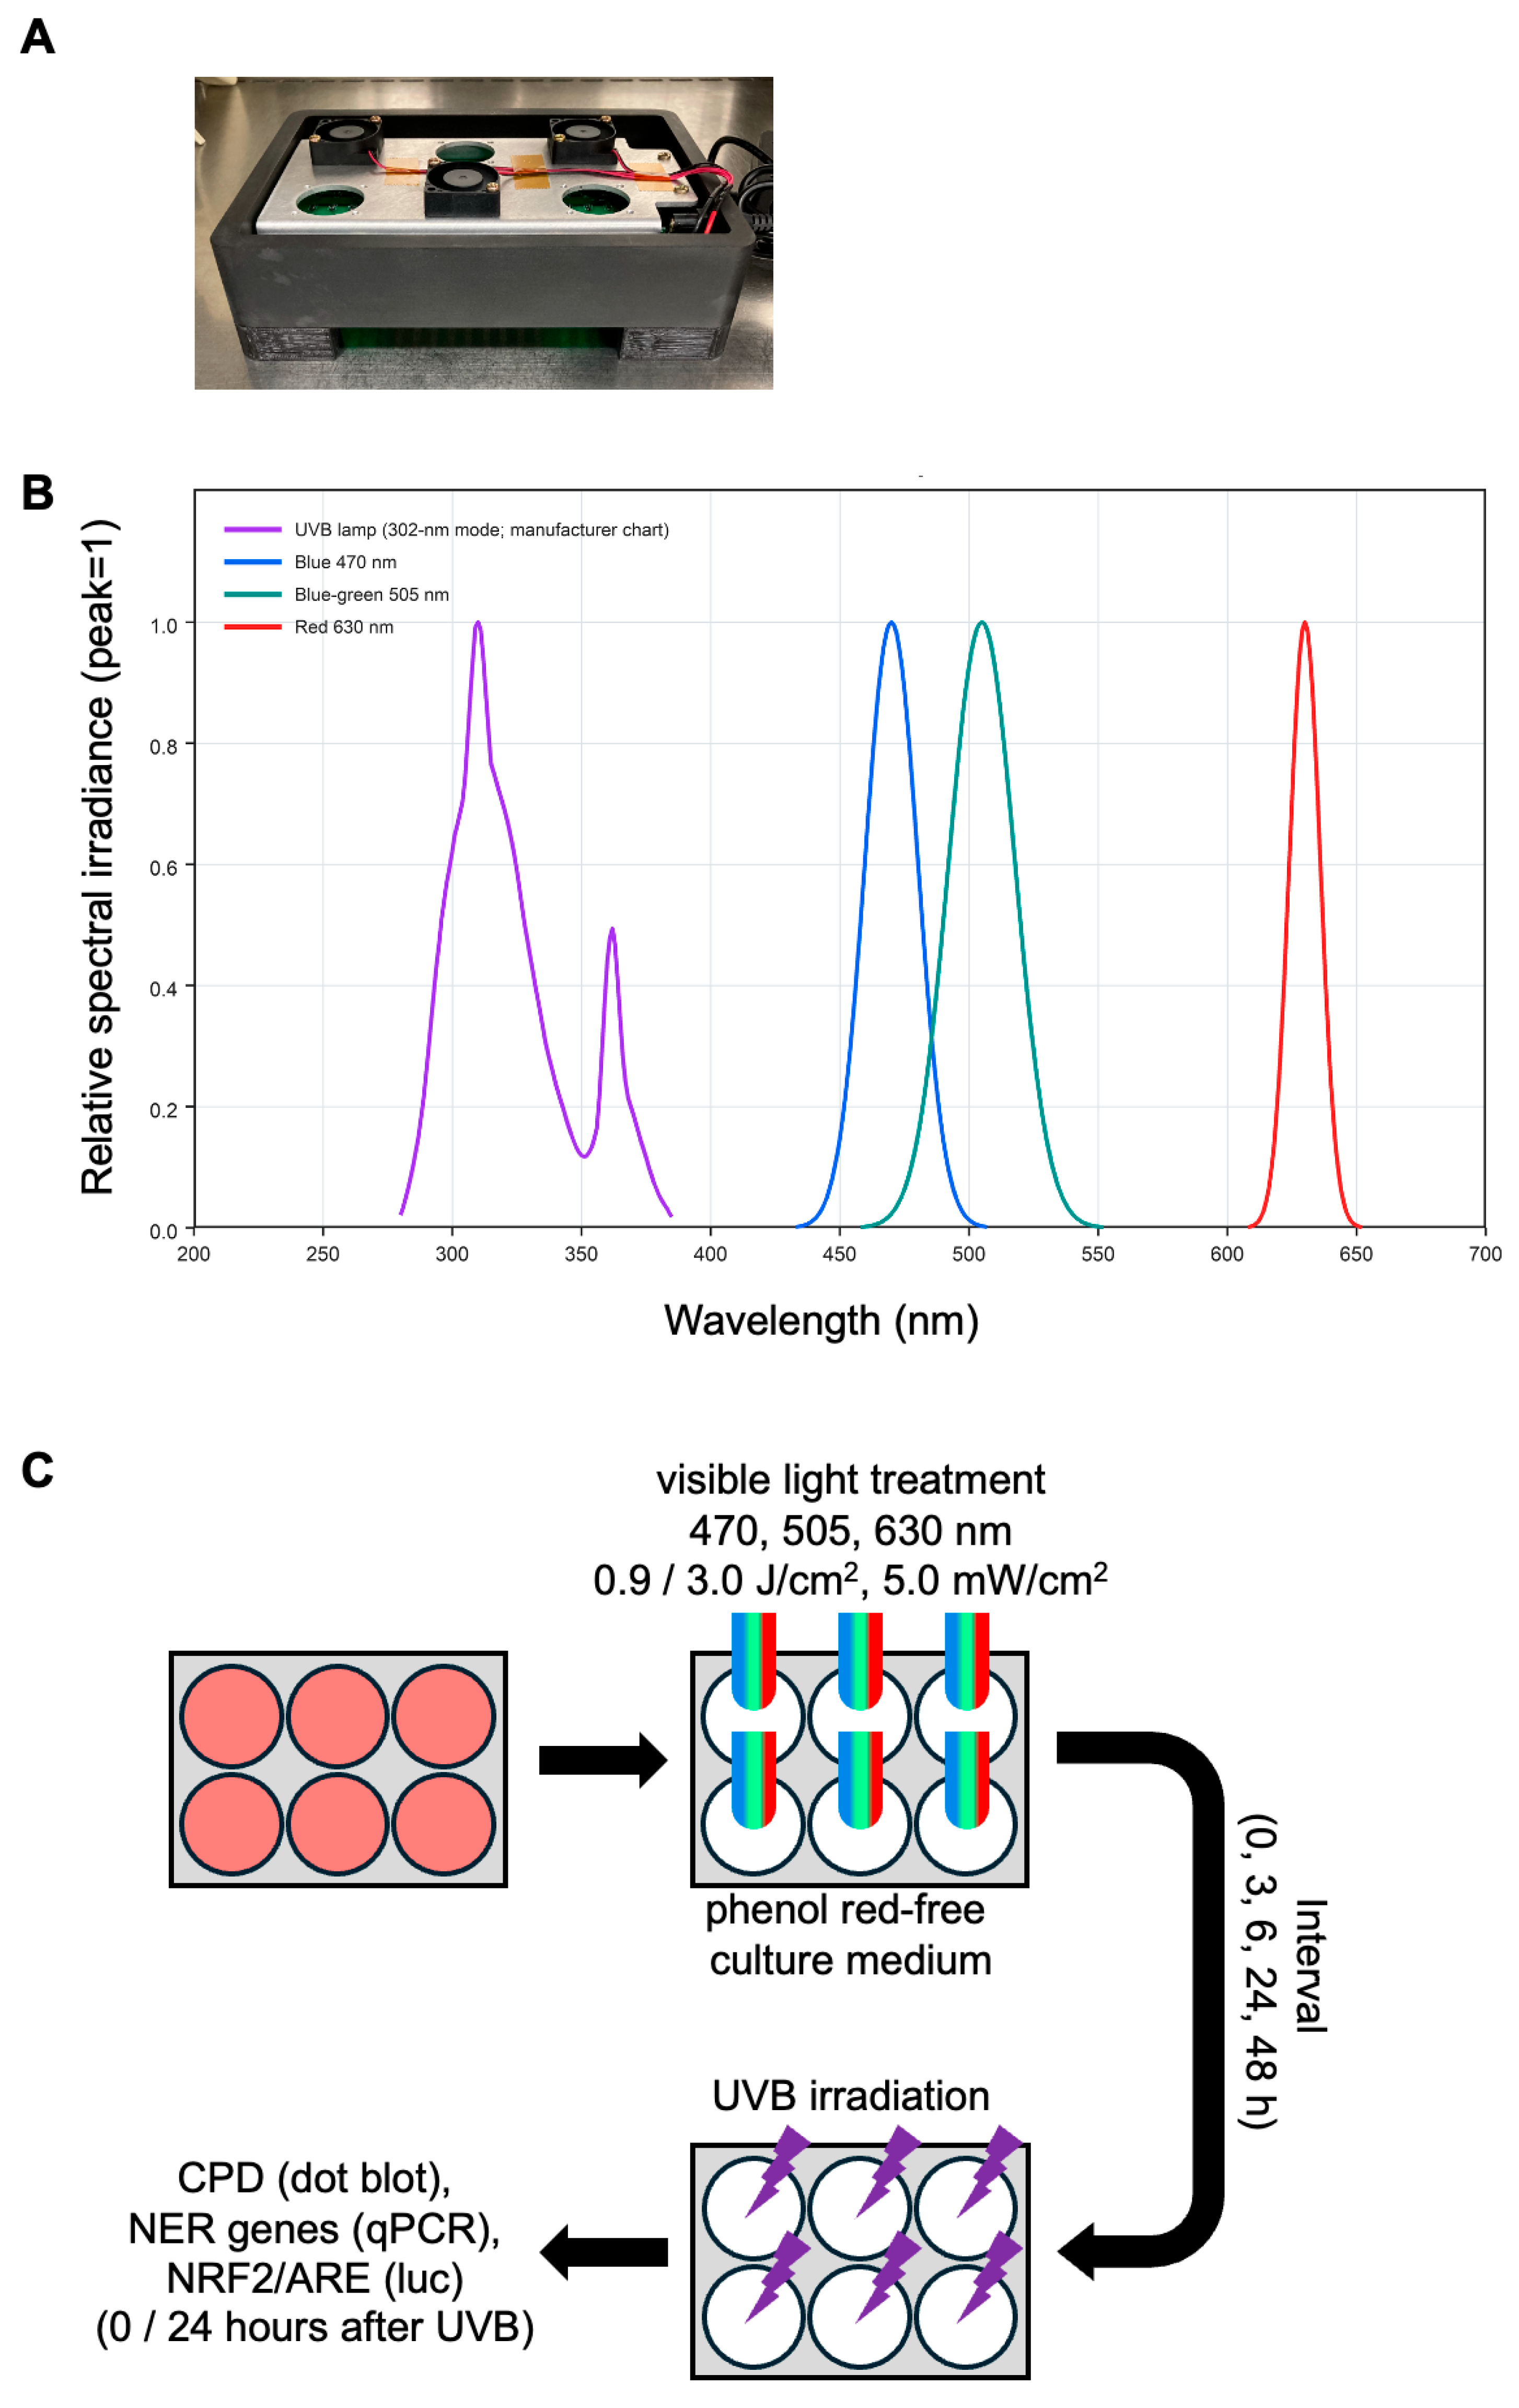
The visible-light irradiation device is shown in Figure 1A; normalized emission spectra of the four light sources are shown in Figure 1B; and the experimental workflow is shown in Figure 1C. The custom-built device delivered narrow-band emission at 470 nm (blue, FWHM 24 nm), 505 nm (blue–green, FWHM 30 nm) and 630 nm (red, FWHM 14 nm), with a light-off setting available for shielding. Each unit consisted of 108 (470 nm), 252 (505 nm) or 208 (630 nm) light-emitting diodes arranged at a fixed distance of 33 mm above the culture surface, and could be operated at two irradiance levels (3.0 and 5.0 mW/cm2) controlled by a programmable current source. Cooling fans maintained a stable temperature during irradiation. Irradiance at the cell plane was measured before each experiment with an Ophir power meter (StarBright; Ophir Optronics Solutions, Jerusalem, Israel) equipped with a PD300RM-8W sensor placed at the cell-plane distance and oriented parallel to the culture surface. Wavelength correction was applied at each measurement, and irradiance (W/cm2) was read directly from the power-meter configuration. Spatial uniformity was checked by sampling several positions within the culture area; variation stayed within ±8.6% of the maximum value. At 5.0 mW/cm2, 3 and 10 min of exposure delivered 0.9 and 3.0 J/cm2. At 3.0 mW/cm2, 30 s, 3 min and 10 min of exposure delivered 0.09, 0.54 and 1.8 J/cm2, respectively. Throughout this study, the three visible wavelengths are referred to as blue light (470 nm), blue–green light (505 nm) and red light (630 nm); the collective term “visible light” is used only when referring to all three sources together.

2.3. Cell Culture

The normal human skin fibroblast cell line Hs27 (CRL-1634; ATCC, Manassas, VA, USA; obtained from KAC, Kyoto, Japan) was cultured in Dulbecco’s modified Eagle’s medium (DMEM) supplemented with 10% fetal bovine serum (FBS) and 1% penicillin/streptomycin (FUJIFILM Wako Chemicals, Osaka, Japan) at 37 °C in 5% CO2. The cells were routinely subcultured every 2–3 days to maintain exponential growth. Mycoplasma contamination was tested using the MycoAlert Mycoplasma Detection Kit (Lonza, Basel, Switzerland) and was found to be negative for mycoplasma. For the experimental assays, the cells were seeded at appropriate densities to ensure logarithmic growth during the treatment period.

2.4. Cell Viability Assay

Cell viability was assessed using the resazurin method [ready-to-use solution; Tokyo Chemical Industry, Tokyo, Japan]. Briefly, the cells were seeded in 96-well plates at a density of 4.53 × 10³ cells per well and allowed to adhere overnight. The medium was then replaced with phenol red-free DMEM with 0.5% FBS (to eliminate the color of the culture medium), and the cells were incubated for 16 h. The cells were irradiated with red (630 nm), blue–green (505 nm), or blue (470 nm) LEDs for 30 s, 3 min, and 10 min. Irradiance was set to two levels: 3.0 or 5.0 (mW/cm2). After 24 h, ready-to-use resazurin solution was added at a volume equal to 10% of the volume of the cell culture medium, and the cells were incubated for 2 h. Finally, the absorbance of each well was measured at 570 nm. Cell viability was expressed as the percentage of optical density (OD) of control wells (100%).

2.5. Dot Blot Assay

The cells were seeded in a 6-well plate at a density of 2.0 × 10⁵ and cultured for 24 h. The culture medium was then replaced with phenol red-free DMEM containing 0.5% FBS, and the cells were cultured for an additional 16 h. The cells were then irradiated with red (630 nm), blue–green (505 nm), or blue (470 nm) LEDs at 5.0 mW/cm2 for 3 or 10 min. UVB irradiation was delivered using the 302 nm mode of an EL Series UV lamp (UVLM-28, 8 W; Analytik Jena US, Upland, CA, USA) and a dual-wavelength 365/302 nm handheld lamp. Only the 302 nm tube was activated during the experiments. UVB irradiance at the cell plane was measured using the same Ophir power meter and PD300RM-8W sensor setup described above, with a wavelength correction applied according to the measurement conditions. The exposure time was adjusted to deliver a UVB radiant exposure of 20 mJ/cm2 to the culture surface. The UV source was used as a nominal 302 nm UV source, and its emission profile was referenced from the manufacturer’s technical spectral chart (https://www.uvp.com/fileadmin/content/country_content/us/UV-Spectral-Chart-302nm-with-Filter.pdf (accessed on 17 November 2025)). According to this manufacturer-provided chart, the source shows a principal emission band in the 302 nm region with a smaller secondary emission component at longer wavelengths. Because this spectral profile was based on manufacturer-supplied data rather than direct measurements in our experimental setup, it was provided as a source characterization. Genomic DNA was extracted from the cells 24 h after UVB exposure, 800 ng of DNA was blotted onto a ClearTrans PVDF Membrane (FUJIFILM Wako Chemicals, Osaka, Japan) using a Bio-Dot SF (Bio-Rad, Hercules, CA, USA), and the membrane was baked at 80 °C for 3 h. The UVB radiant exposure of 20 mJ/cm2 (200 J/m2, unweighted) was selected as a biologically relevant but sub-lethal dose that yields readily quantifiable CPDs in Hs27 cells; under a narrow-band 302 nm approximation, this corresponds to roughly 0.8–0.9 standard erythema doses (SED), although a precise value would require direct spectroradiometric measurement in our setup. For each sample, a constant 800 ng of genomic DNA was loaded, and the CPD signal was normalized to the total DNA of the same dot (dsGreen), which controls for loading differences. The dot-blot readout was treated as semi-quantitative: assay linearity was not systematically validated with a DNA dilution series, and this is acknowledged as a limitation. For the immediate post-UVB analysis, genomic DNA was instead extracted immediately after UVB exposure rather than 24 h afterwards.
The membranes were immunoblotted with the anti-CPD antibody described earlier, and the bound antibodies were visualized with horseradish peroxidase-conjugated antibodies against rabbit or mouse IgG (Calbiochem, Darmstadt, Germany) using ImmunoStar Zeta or ImmunoStar LD (FUJIFILM Wako Chemicals). Images were captured using a Lumicube (Liponics, Tokyo, Japan). The bands were quantified using Just TLC software (version 4.0; Liponics, Tokyo, Japan). CPD levels were normalized to the total DNA treated with dsGreen, as previously described.

2.6. Real-Time RT-PCR

Total RNA was prepared from the cultured cells using ISOGEN II (NIPPON GENE, Tokyo, Japan) according to the manufacturer’s protocol. cDNA was then synthesized by reverse transcription of total RNA using ReverTra Ace qPCR RT Master Mix with gDNA Remover (TOYOBO, Osaka, Japan), according to the manufacturer’s protocol. Real-time quantitative RT-PCR with SYBR Green was performed using a QIAquant 96 (QIAGEN, Hilden, Germany). The expression levels of human XPA, XPB, XPC, and XPD transcripts were measured using quantitative RT-PCR (real-time PCR) and normalized to the transcript expression level of human TATA-box-binding protein (TBP). The primer sequences used for these genes are listed in Table 1. TBP (TATA-box-binding protein) was selected as the reference gene because it is a commonly used and stably expressed reference gene for RT-qPCR normalization in human fibroblasts [20].

2.7. Luciferase Assay

The pGL4.37 [luc2P/ARE/Hygro] and pRL-EF1-alpha Renilla Luciferase Reporter vectors (Promega, Tokyo, Japan) were transfected into the Hs27 cells using Linear PEI HCl (TCI, Tokyo, Japan). The procedure followed the protocol provided by Linear PEI HCl. After transfection, LED irradiation was performed, followed 6 h later by UVB exposure. Twelve hours after UVB exposure, luciferase activity was measured using the Dual-Luciferase Reporter Assay System (Promega, Tokyo, Japan). The method followed the manufacturer’s protocol, and firefly luciferase activity was normalized to Renilla Luciferase activity. The 12 h post-UVB time point was chosen as a single, pre-specified endpoint within the interval over which NRF2/ARE-dependent transcriptional responses are generally reported after oxidative or ultraviolet stress [21,22,23]; the full time course was not measured, so the values are interpreted only as the 12 h response.

2.8. Statistical Analysis

Each experiment used at least three independent biological replicates, and data are mean ± standard deviation. Analyses were performed in JMP Pro 16.0.0 (SAS Institute, Cary, NC, USA). Normality (Shapiro–Wilk) and homogeneity of variance (Levene) were checked, and group comparisons used one-way ANOVA followed by Tukey–Kramer or Dunnett post hoc tests, as indicated in the figure legends. p < 0.05 was considered significant.

3. Results

3.1. Visible-Light Exposure Differentially Modulates Fibroblast Viability

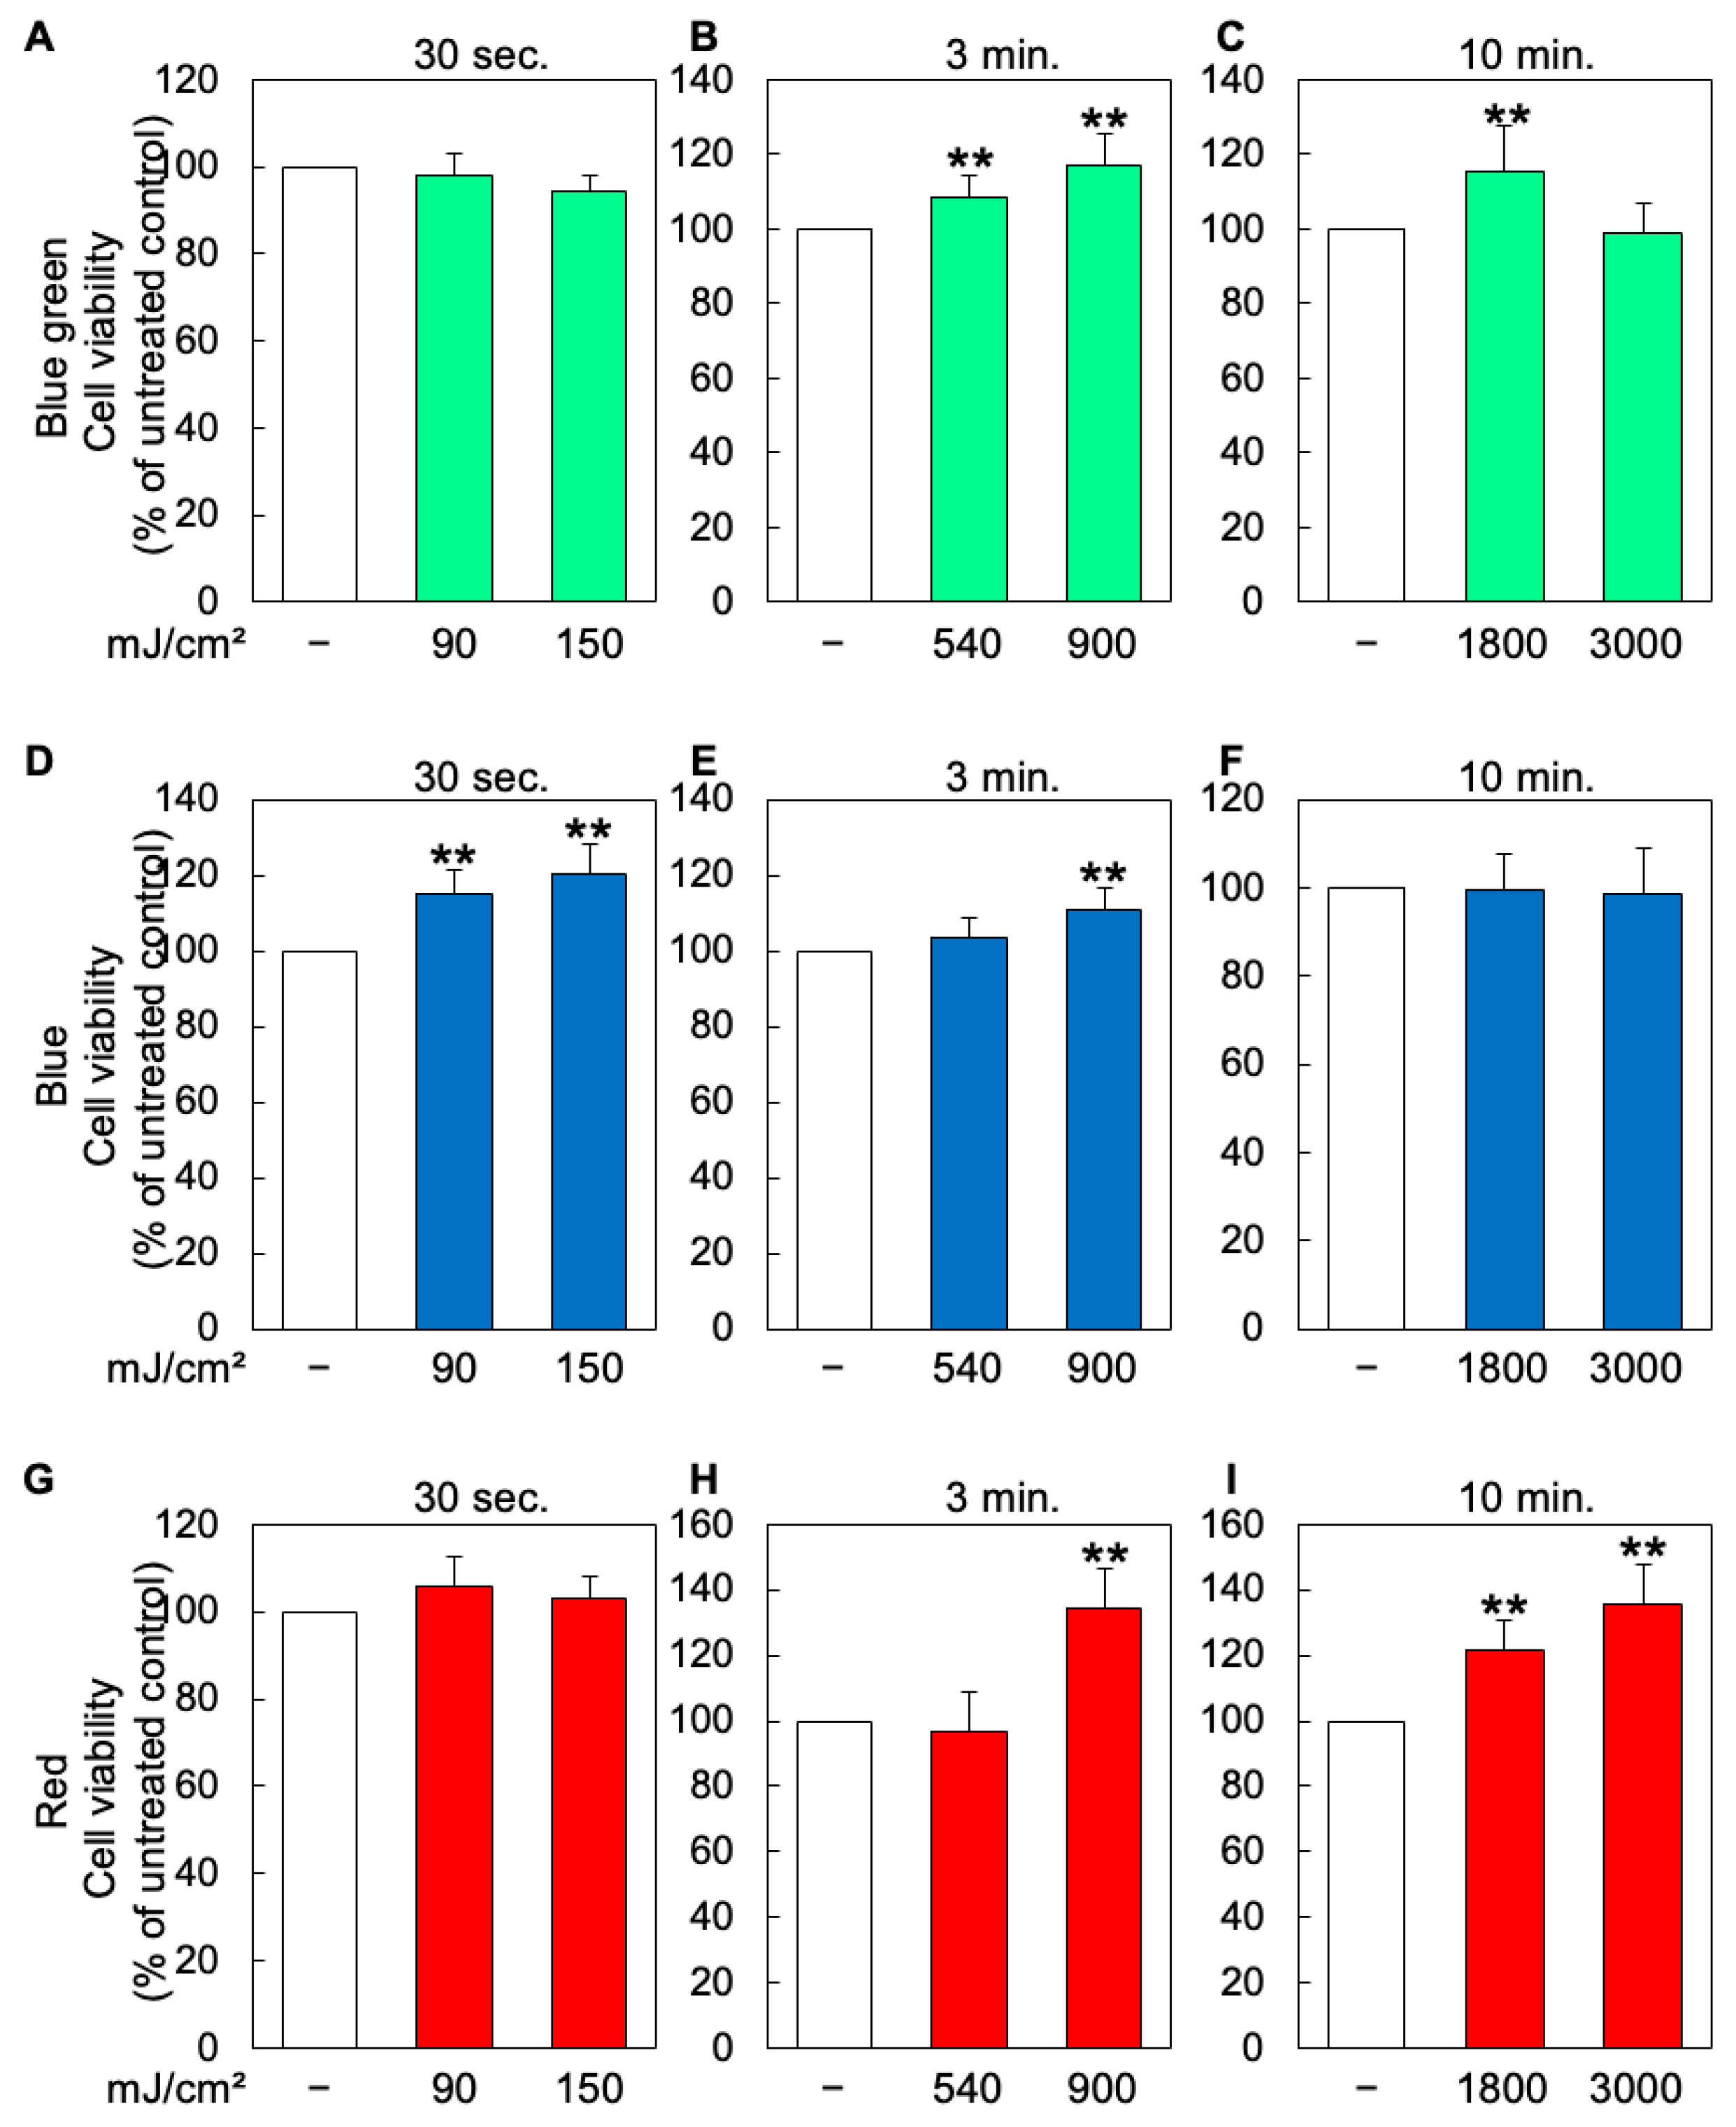
To define non-toxic irradiance and fluence ranges for the subsequent CPD experiments, Hs27 fibroblasts were exposed to blue–green (505 nm), blue (470 nm) or red (630 nm) LEDs at 3.0 or 5.0 mW/cm2 for 30 s, 3 min or 10 min, and cell viability was measured 24 h later (Figure 2). The 505 nm light produced a biphasic, hormesis-like response and showed no toxicity up to 10 min; viability rose significantly under several conditions, including 5.0 mW/cm2 for 10 min. The 470 nm light gave a transient proliferation-promoting effect after 30 s, with no detectable toxicity at longer exposures. The 630 nm light also showed no toxicity and increased viability after longer exposures. Based on these results, 5.0 mW/cm2 for 3 min (0.9 J/cm2) and 10 min (3.0 J/cm2) were selected for the CPD experiments because they were non-toxic across the three wavelengths.

3.2. Wavelength- and Fluence-Dependent Effects of Visible-Light Preconditioning on UVB-Induced CPDs

We next asked whether visible-light preconditioning changes the UVB-induced CPD burden. Hs27 fibroblasts were pre-irradiated at 5.0 mW/cm2 for 3 min (0.9 J/cm2) or 10 min (3.0 J/cm2), exposed to UVB (20 mJ/cm2) after a defined dark interval, and analyzed by dot blot. CPD signals were normalized to dsGreen-stained total DNA and expressed relative to the UVB-alone control. Unless otherwise stated, CPDs were measured 24 h after UVB. Figure 3, Figure 4, Figure 5, Figure 6 and Figure 7 group the data by light source and fluence across the dark interval.

3.3. The 505 nm Blue–Green Light Reduces Residual CPD Burden over a Defined Preconditioning Window

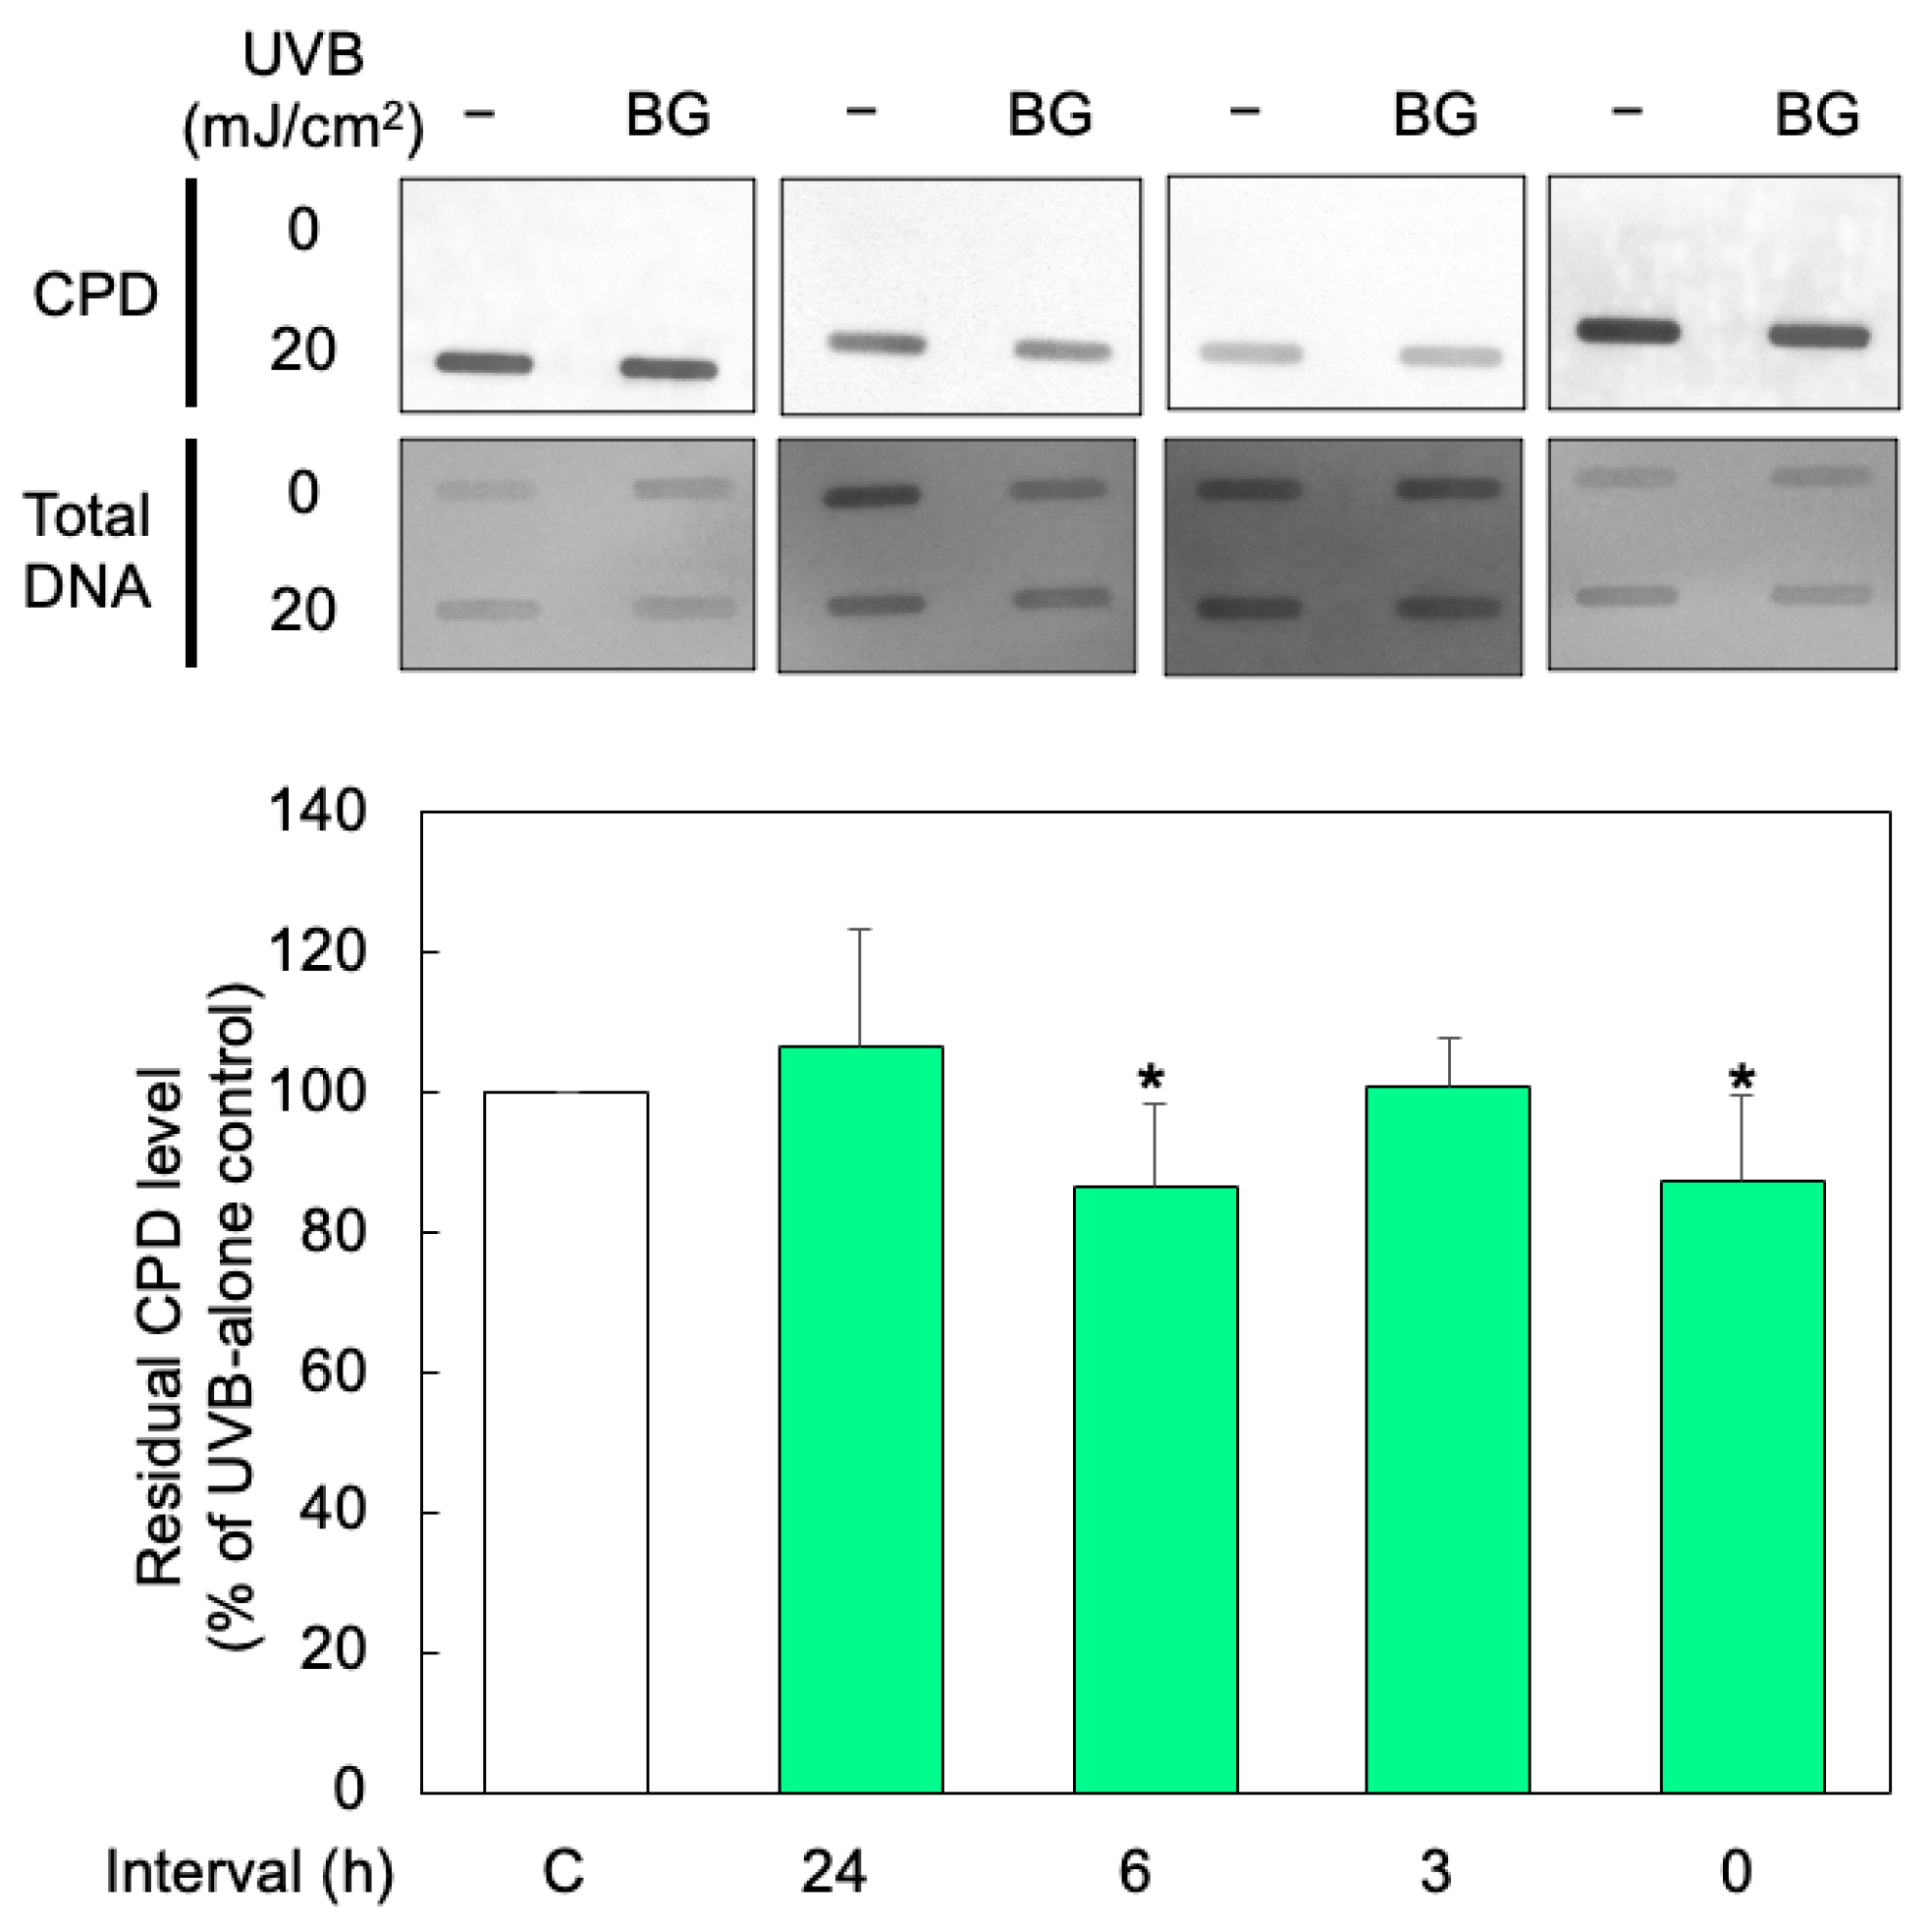
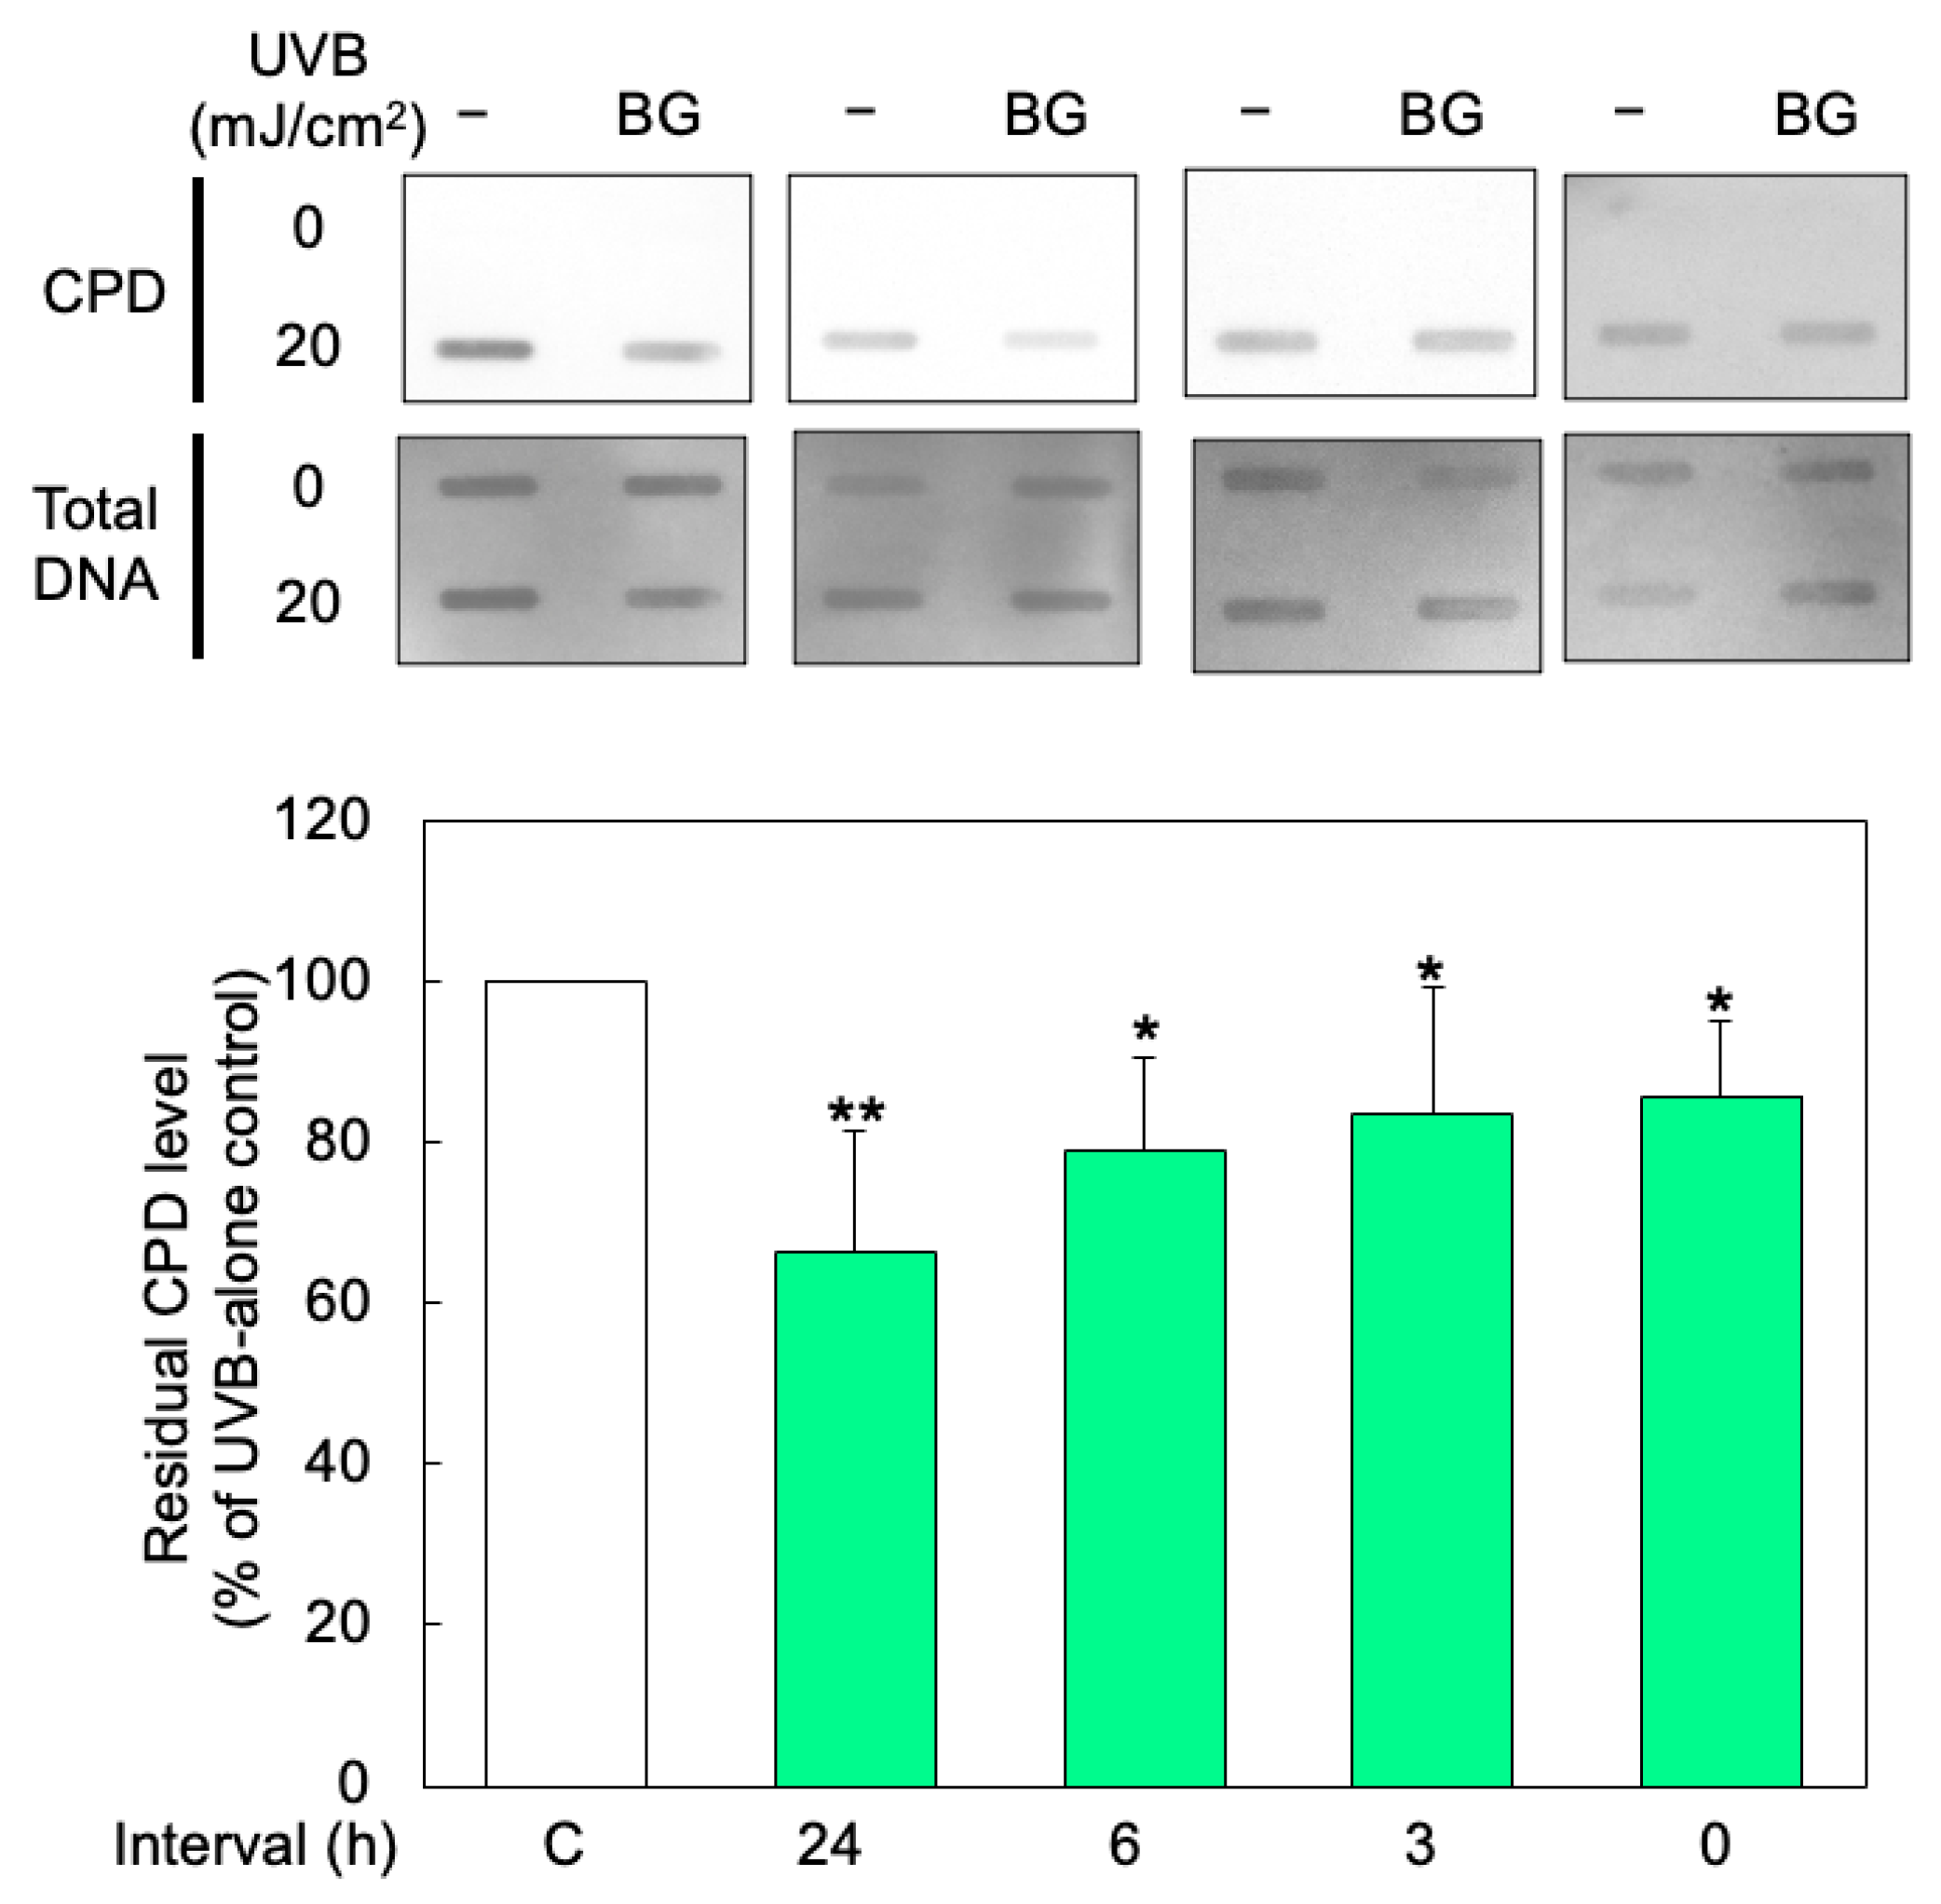
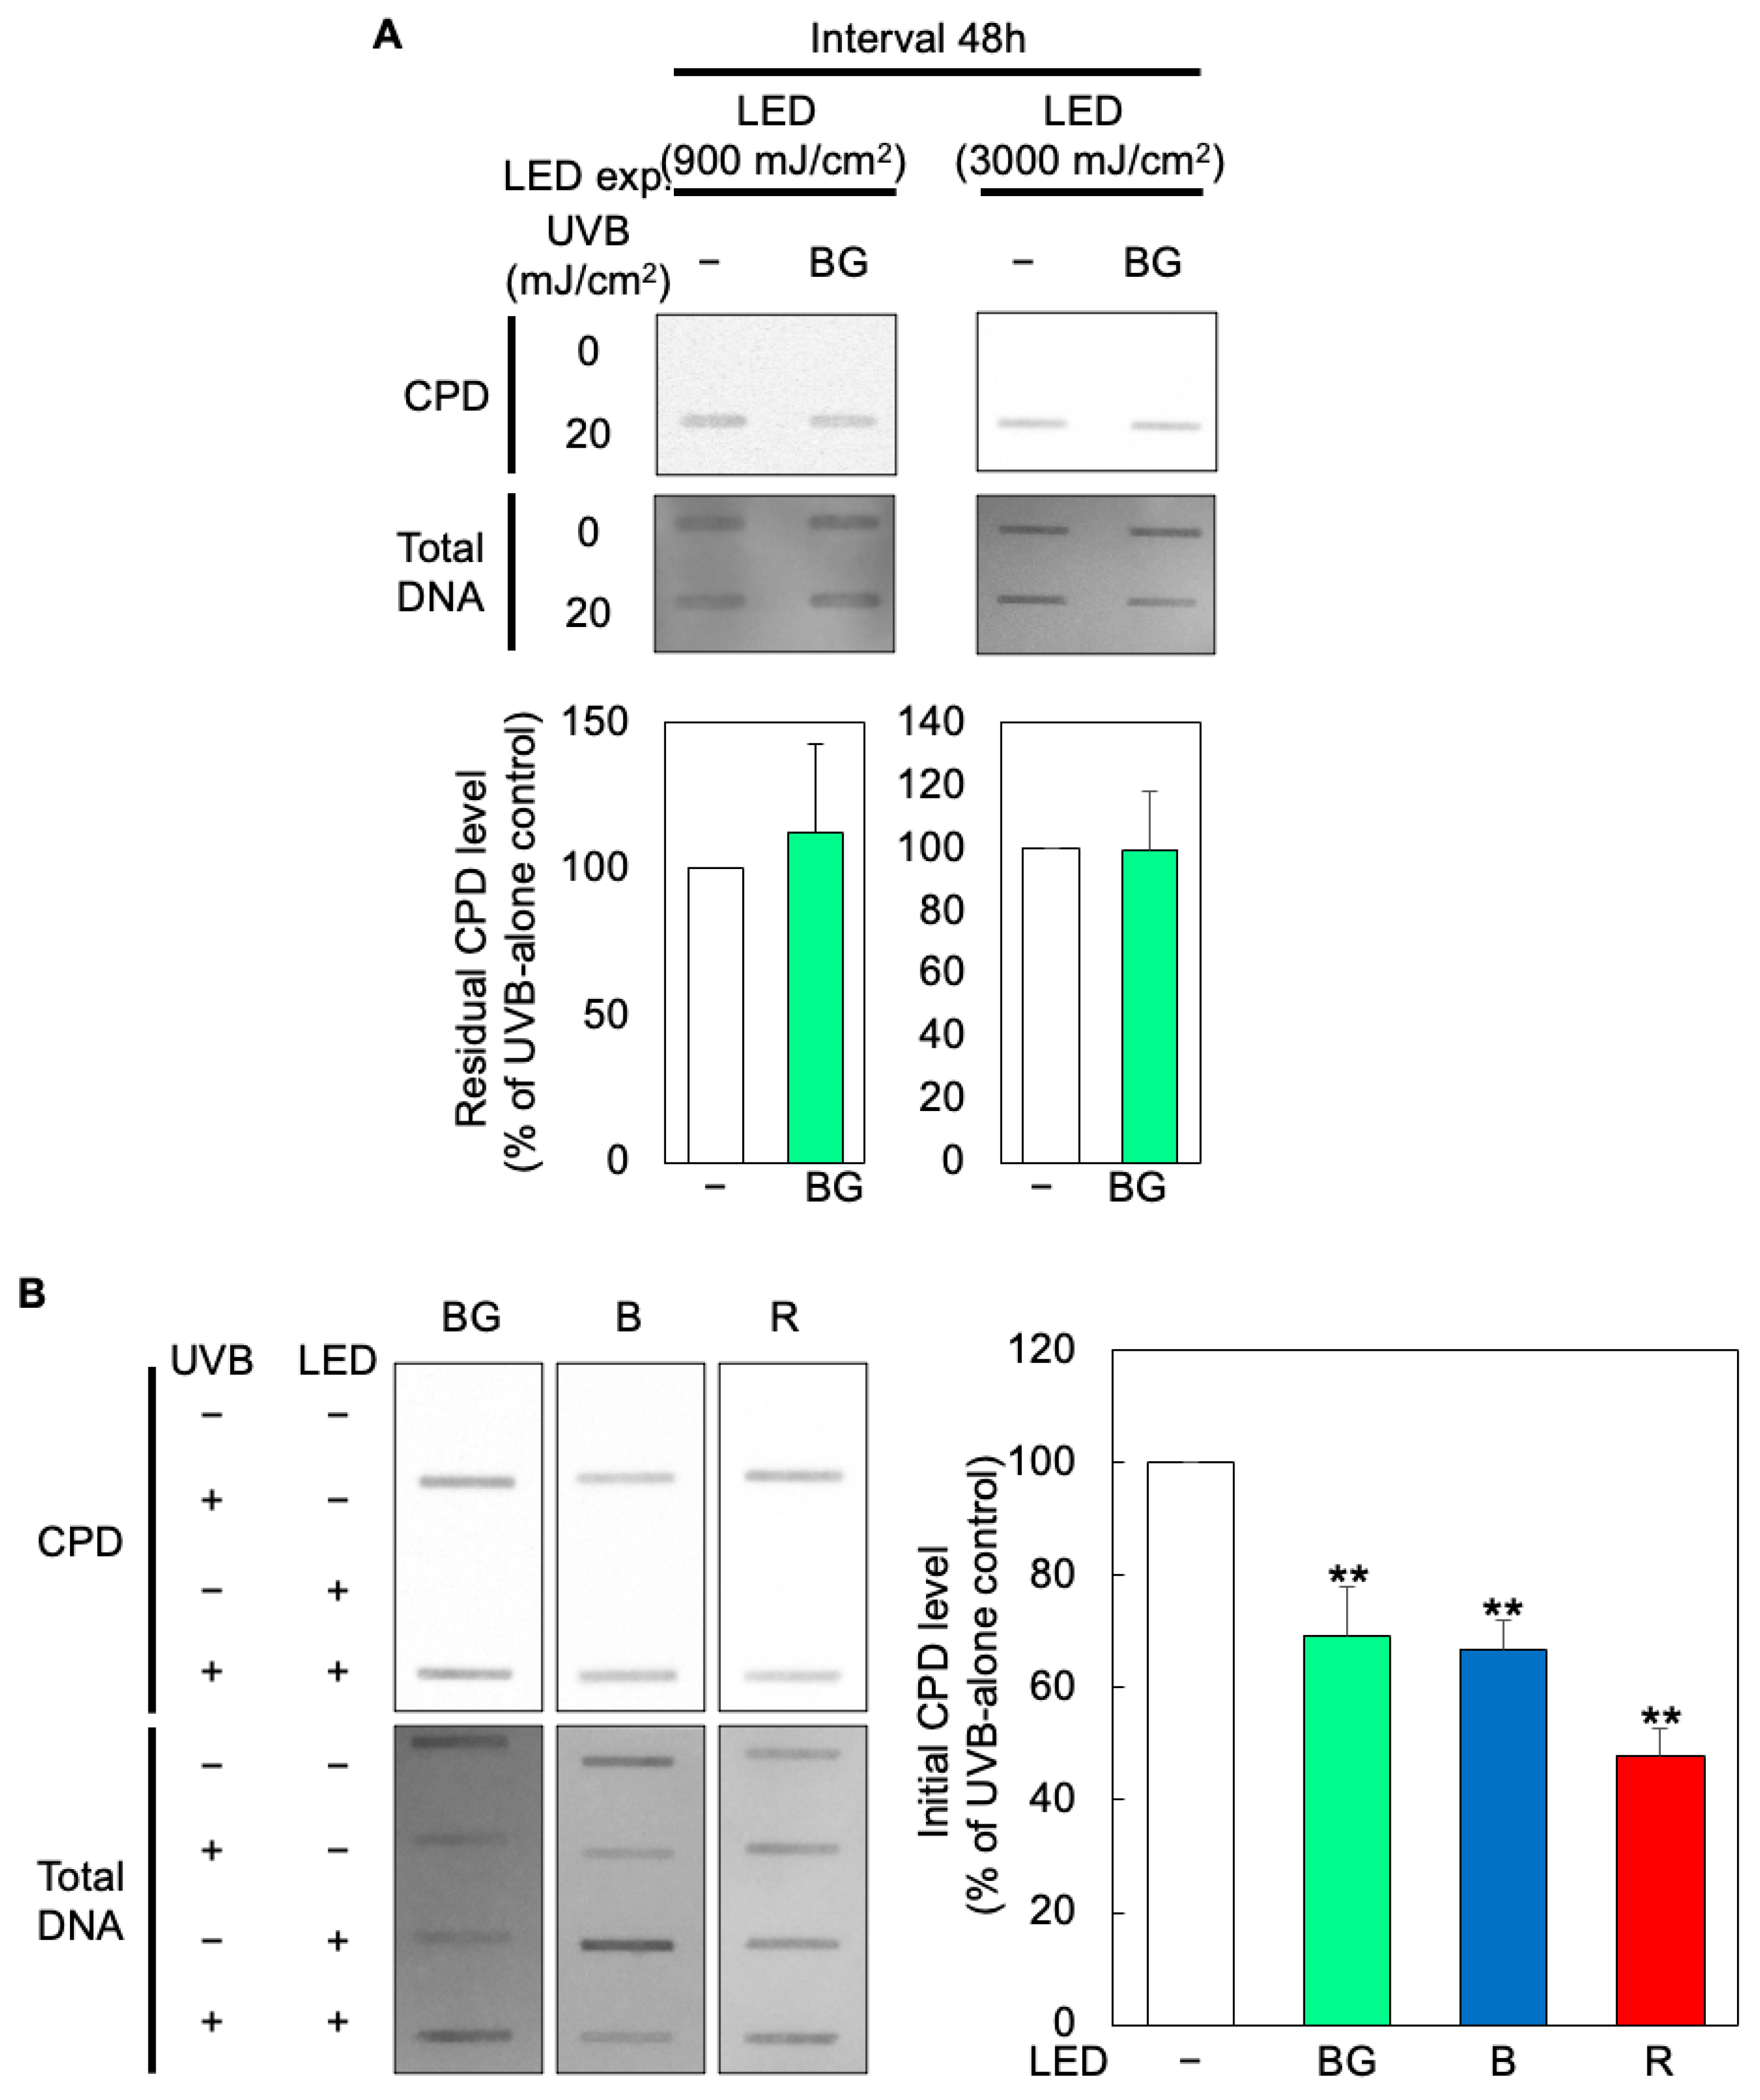
At 505 nm, 0.9 J/cm2 reduced residual CPDs when UVB followed immediately (p = 0.022) and after a 6 h interval (p = 0.019), whereas 3.0 J/cm2 reduced residual CPDs immediately (p = 0.020) and after 3, 6 and 24 h (Figure 3 and Figure 4). A sustained reduction was observed at 3.0 J/cm2, with CPDs reduced to approximately 84% at 3 h (p = 0.031), 79% at 6 h (p = 0.022) and 67% at 24 h (p = 0.009) relative to UVB alone. The effect disappeared when the interval was extended to 48 h (p = 0.19 and p = 0.69 for 3.0 and 0.9 J/cm2, respectively) (Figure 7A). Thus, 505 nm preconditioning lowers the residual CPD burden for up to about 24 h but is not maintained at 48 h. Exact p-values for all the preconditioning conditions are provided in Table S1.
Figure 3. Effects of 505 nm blue–green light at 0.9 J/cm2 on UVB-induced residual CPDs across preconditioning intervals. Hs27 fibroblasts were pre-irradiated with 505 nm blue–green light at 5.0 mW/cm2 for 3 min (0.9 J/cm2), exposed to UVB (20 mJ/cm2) after the indicated dark interval, and analyzed using dot blotting 24 h after UVB exposure. The CPD signals were normalized to dsGreen-stained total DNA and expressed relative to the UVB-alone control. The bars represent the mean + SD (n = 3). * p < 0.05 (one-way ANOVA with Dunnett’s test, compared with UVB alone). The white bar (C) represents the UVB-alone control.
Cosmetics 13 00198 g003
Figure 4. Effects of 505 nm blue–green light at 3.0 J/cm2 on UVB-induced residual CPDs across preconditioning intervals. Hs27 fibroblasts were pre-irradiated with 505 nm blue–green light at 5.0 mW/cm2 for 10 min (3.0 J/cm2), exposed to UVB (20 mJ/cm2) after the indicated dark interval, and analyzed using dot blotting 24 h after UVB exposure. The CPD signals were normalized to dsGreen-stained total DNA and expressed relative to the UVB-alone control. The bars represent the mean + SD (n = 3). * p < 0.05, ** p < 0.01 (one-way ANOVA with Dunnett’s test, compared with UVB alone). The white bar (C) represents the UVB-alone control.
Cosmetics 13 00198 g004
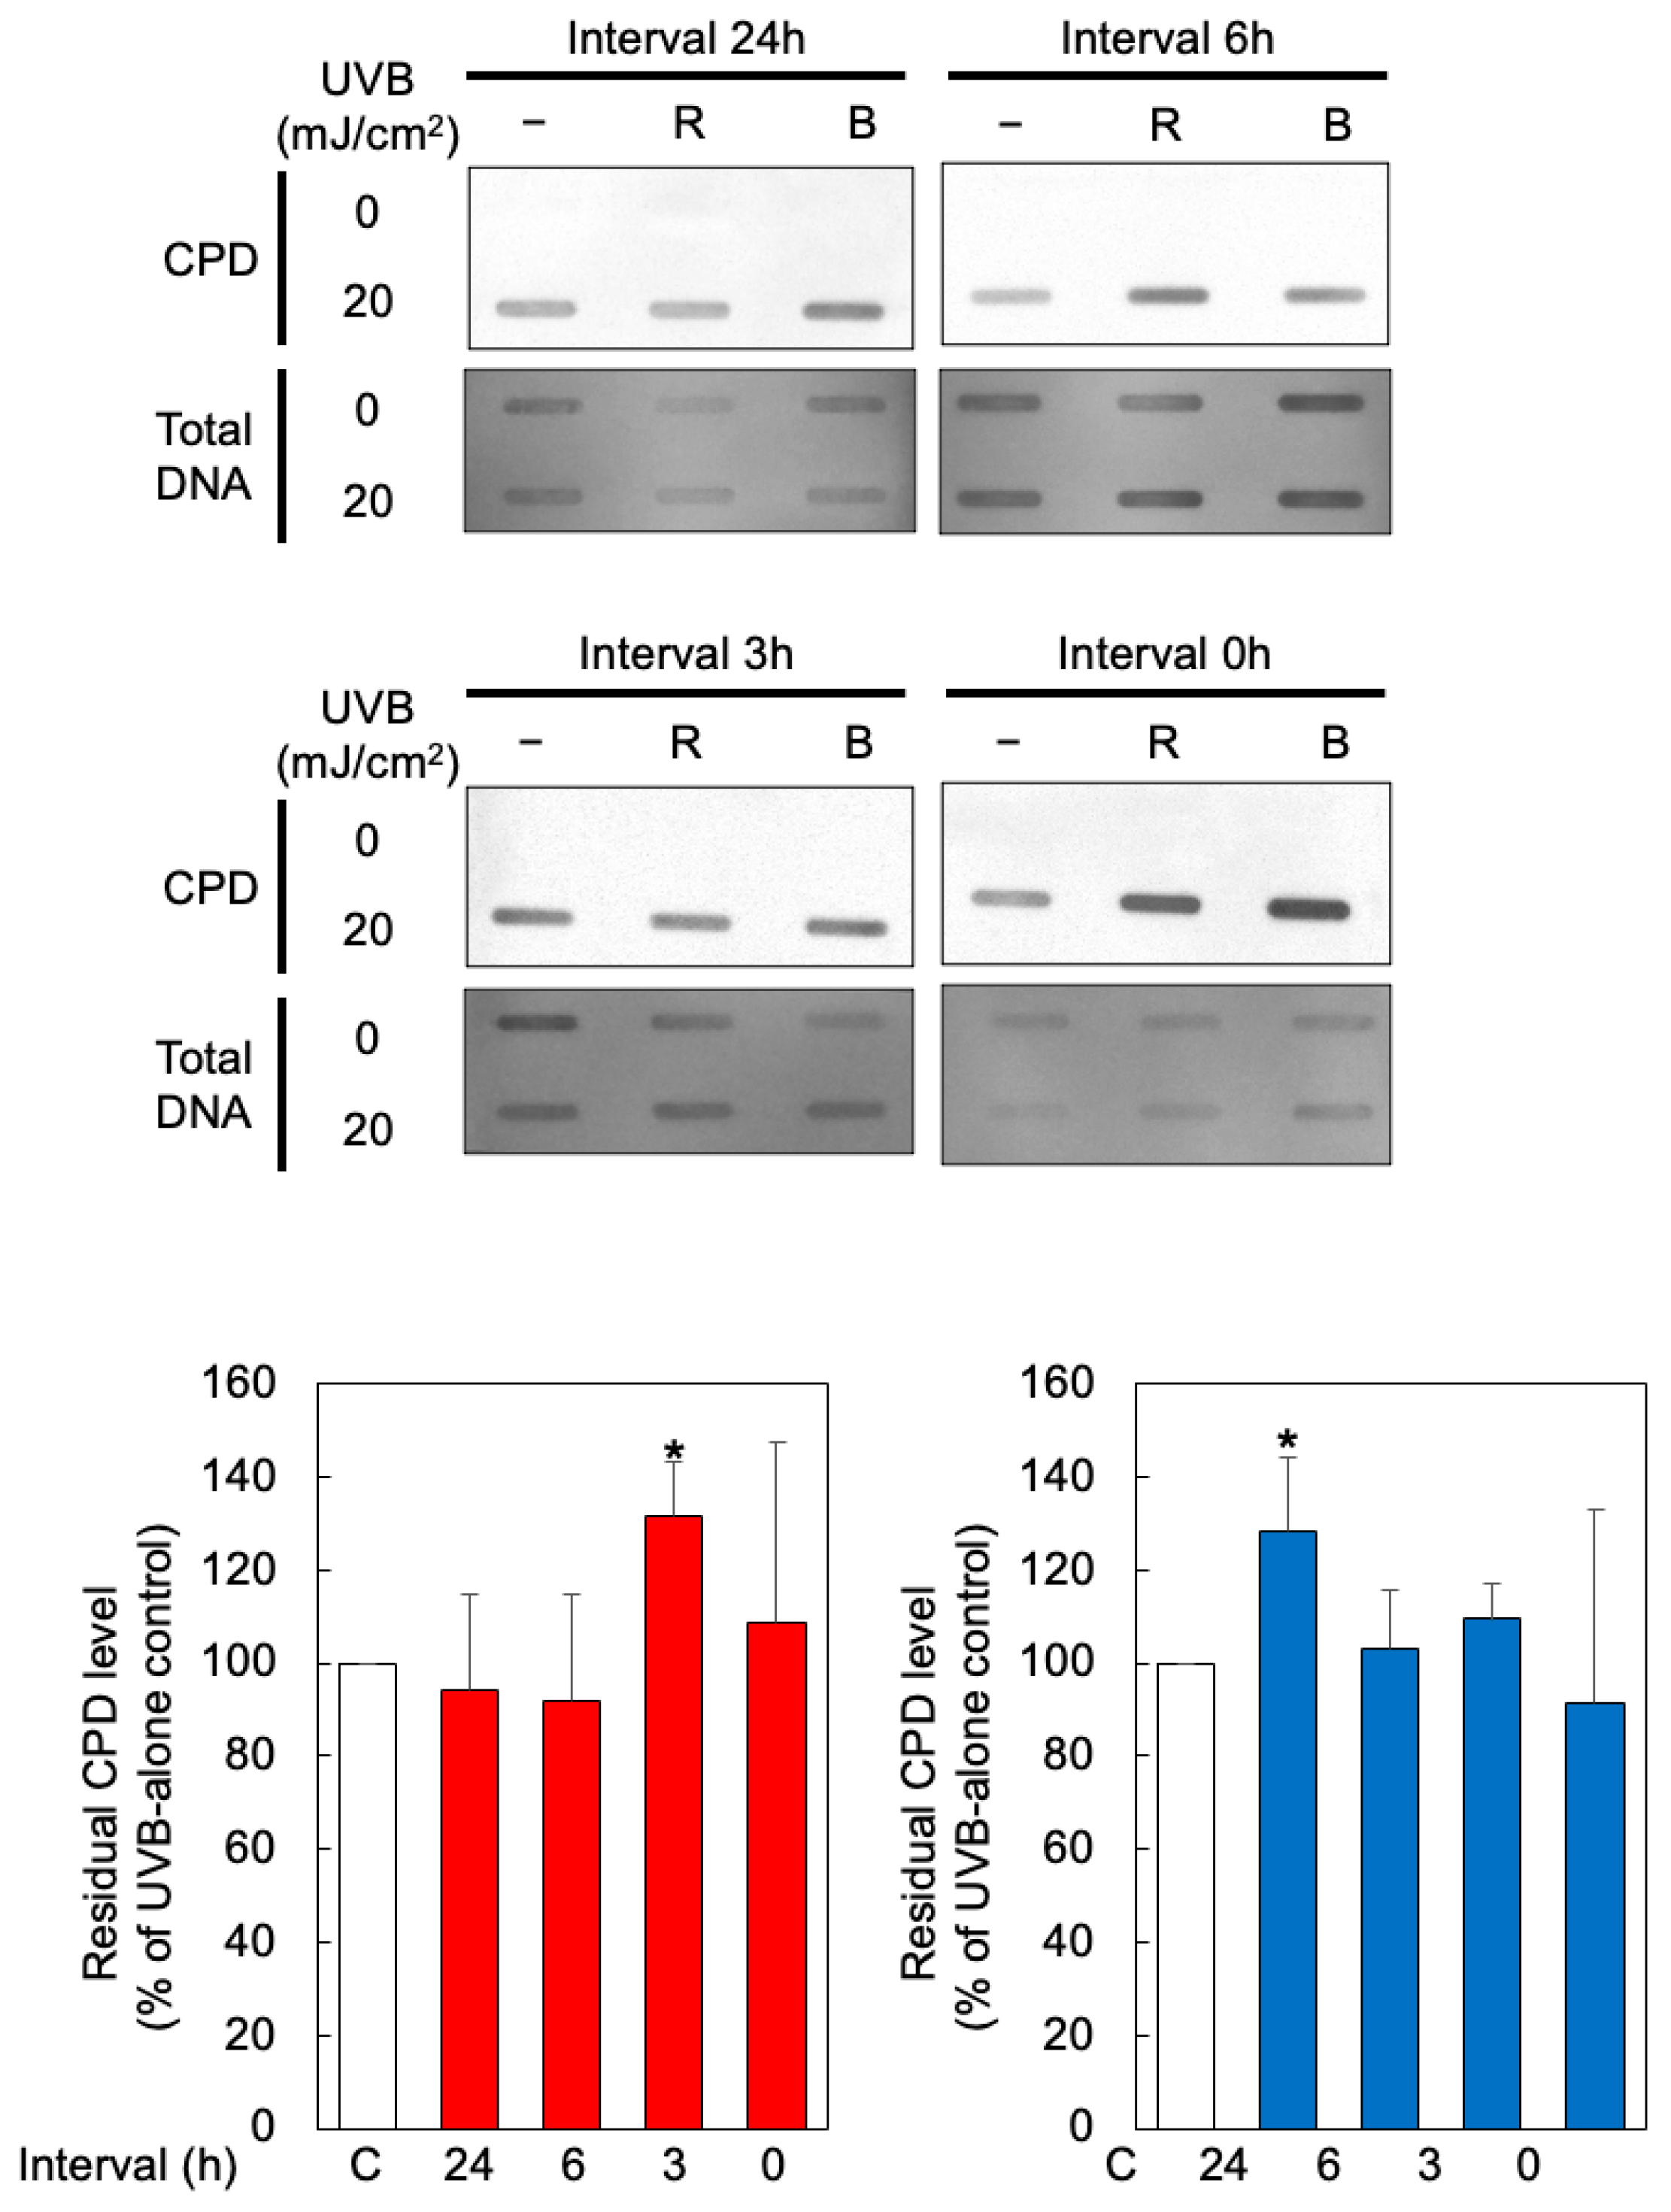
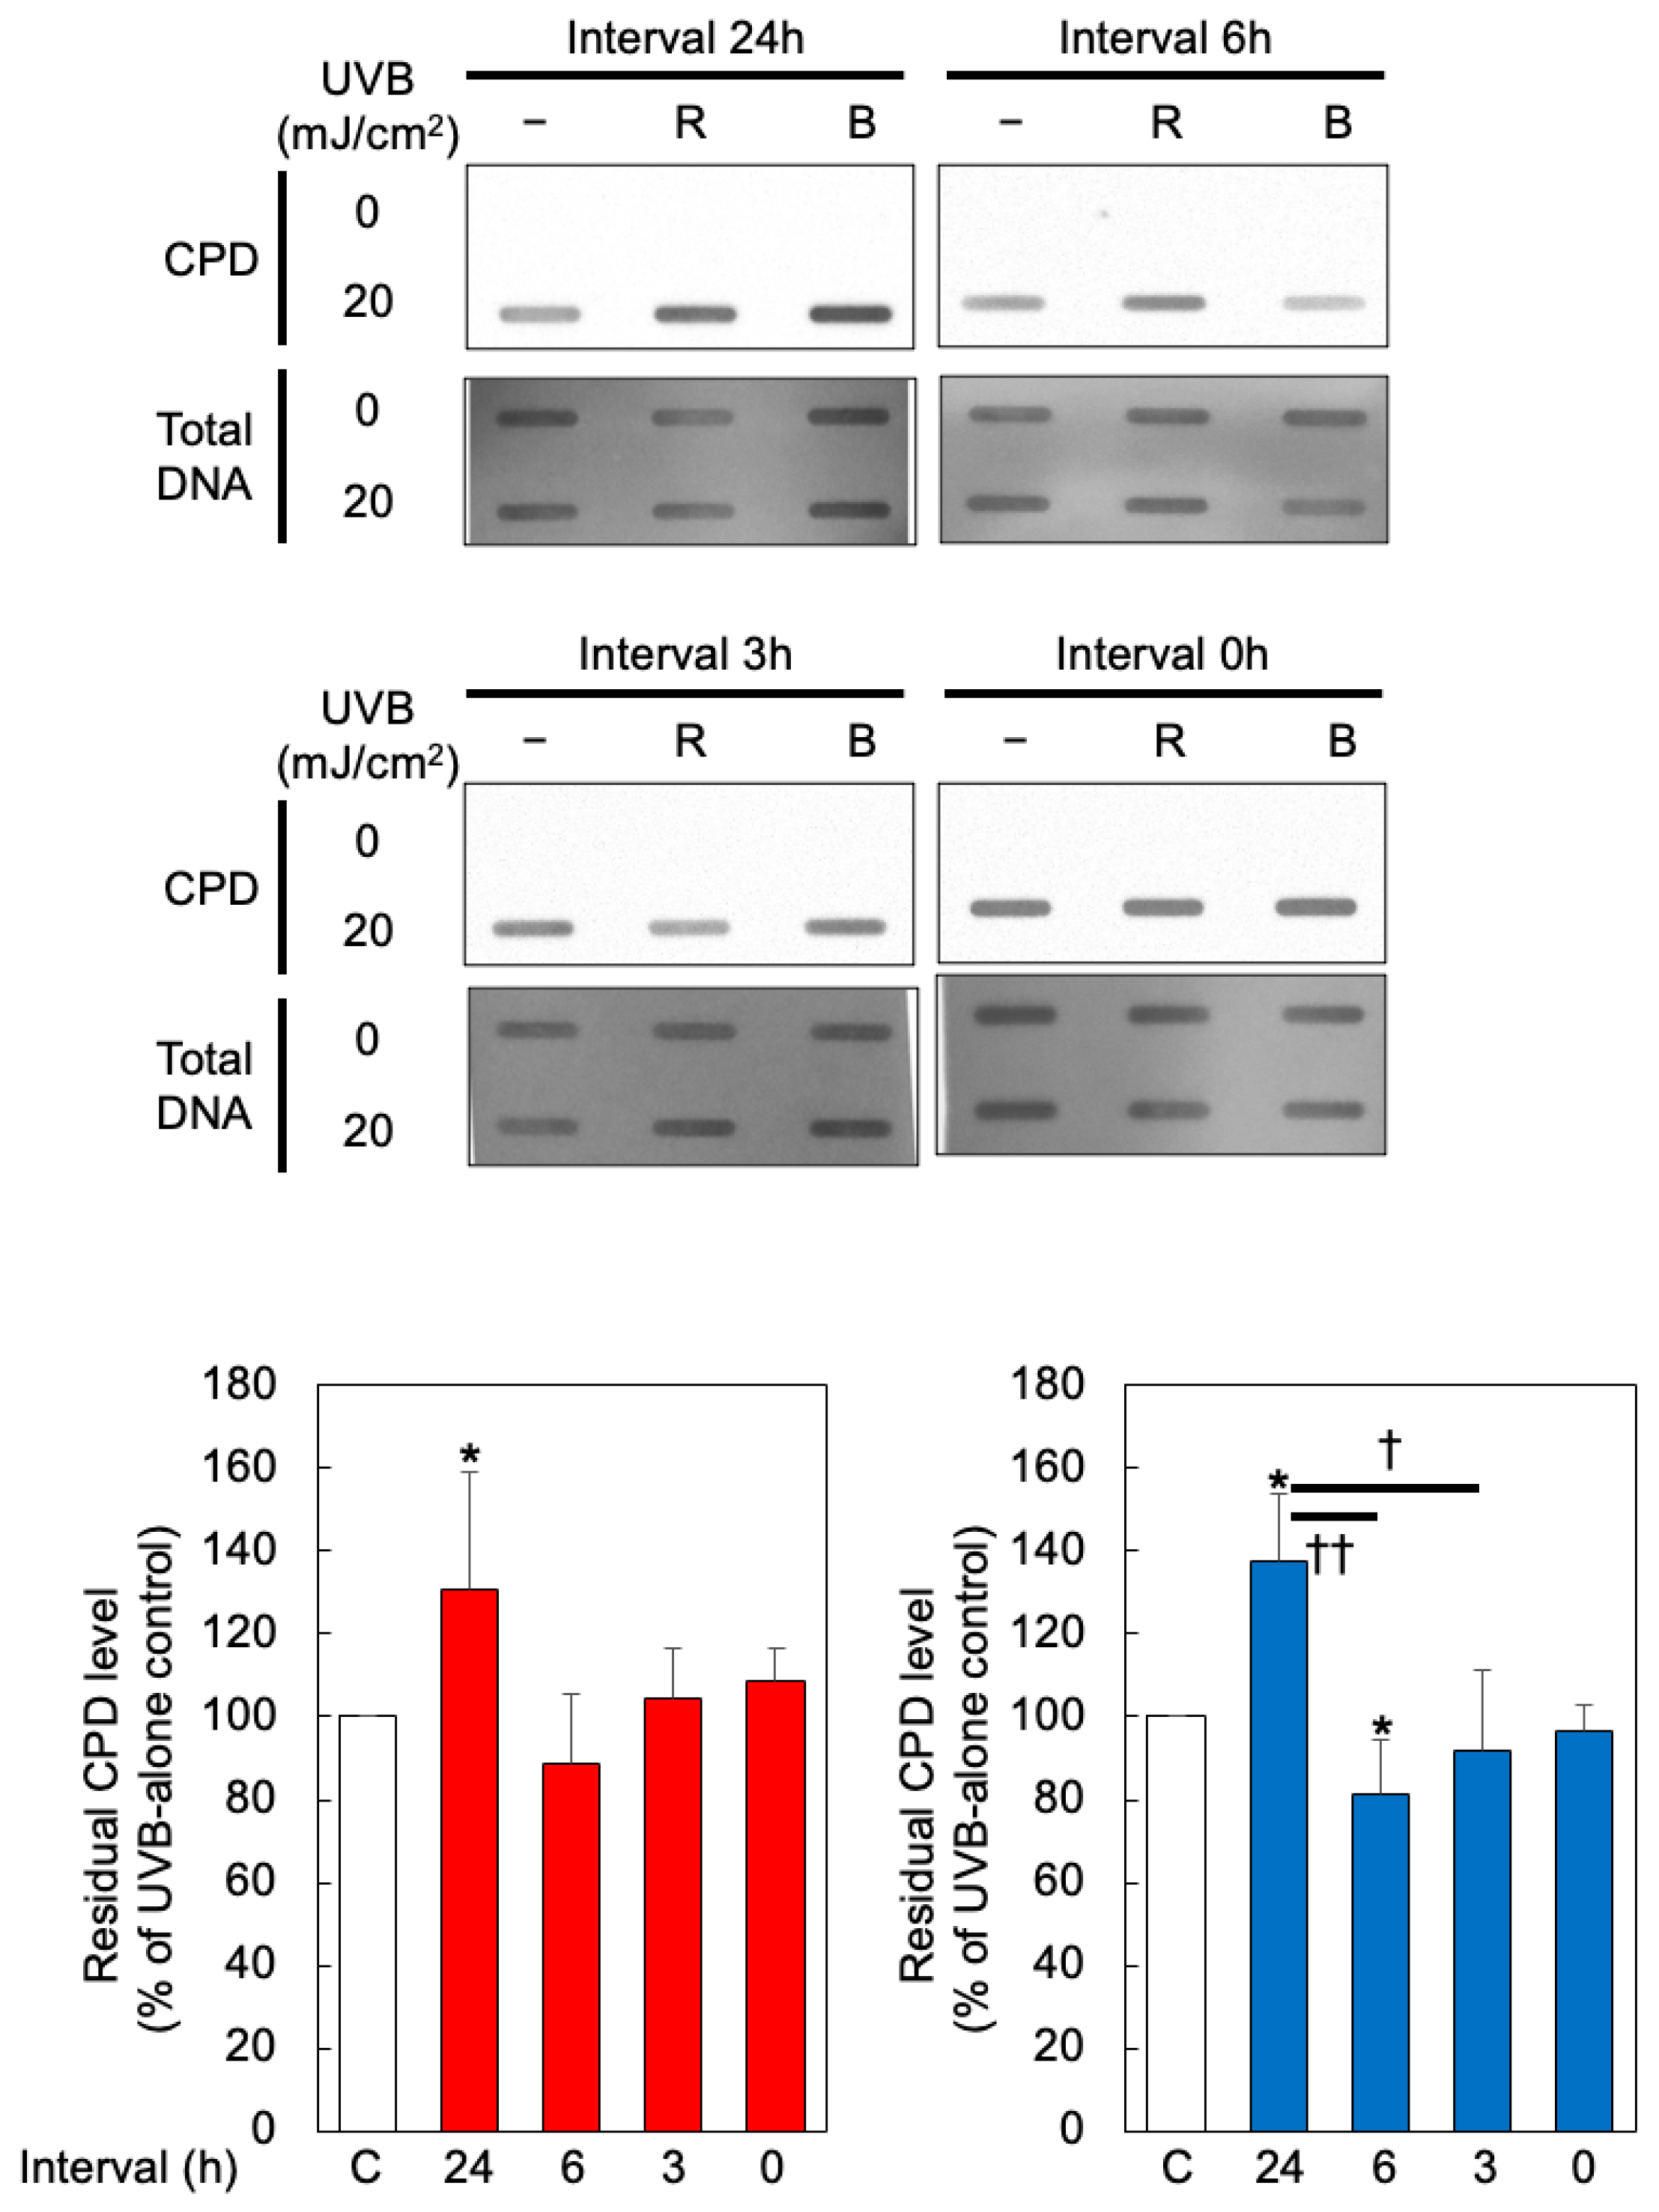
In contrast, 470 nm blue and 630 nm red light did not show a consistent protective profile (Figure 5 and Figure 6). At 0.9 J/cm2, 630 nm pre-irradiation increased residual CPDs to approximately 131% (p = 0.040) when UVB was applied 3 h later, whereas 470 nm light remained unchanged at that interval. At 3.0 J/cm2, 470 nm light reduced CPDs to approximately 82% only after a 6 h interval (p = 0.039). However, at the 24 h interval, 470 nm light increased residual CPDs at both 0.9 (p = 0.044) and 3.0 J/cm2 (p = 0.023), and 630 nm light increased residual CPDs at 3.0 J/cm2 (p = 0.044). Thus, 505 nm was the only wavelength that produced a reproducible and durable reduction, unlike the blue or red wavelengths. Notably, under these specific interval and fluence settings, the 470 and 630 nm preconditioning conditions not only failed to protect but significantly increased the residual CPD burden at 24 h relative to UVB alone, an outcome of direct relevance to the safe selection of visible-light wavelengths for any preconditioning strategy.
Figure 5. Effects of 470 nm blue and 630 nm red light at 0.9 J/cm2 on UVB-induced residual CPDs across preconditioning intervals. Hs27 fibroblasts were pre-irradiated with red light (R, 630 nm) or blue light (B, 470 nm) at 5.0 mW/cm2 for 3 min (0.9 J/cm2), exposed to UVB (20 mJ/cm2) after the indicated dark interval, and analyzed using dot blotting 24 h after UVB exposure. Dot blots show the indicated interval conditions, and bar graphs summarize the CPD signals for red and blue light across the interval series. The CPD signals were normalized to dsGreen-stained total DNA and expressed relative to the UVB-alone control. The bars represent the mean + SD (n = 3). * p < 0.05 (one-way ANOVA with Dunnett’s test, compared with UVB alone). White bars, UVB-alone control; red bars, red light (630 nm); blue bars, blue light (470 nm).
Cosmetics 13 00198 g005
To probe whether visible-light pre-irradiation altered the initial CPD burden, CPDs were also quantified immediately after UVB under the 0 h interval condition (Figure 7B). All three preconditioning wavelengths significantly lowered the immediate post-UVB CPD signal relative to UVB alone (505 nm ≈ 70%; 470 nm ≈ 67%; 630 nm ≈ 48%; all p < 0.05). When CPDs were re-measured 24 h after UVB (Figure 3), only 505 nm preconditioning kept its effect, while the apparent benefit of 470 and 630 nm light was lost. These data suggest two temporally distinct components: an immediate, low-specificity reduction shared by all three wavelengths, followed by a 505 nm selective effect that persists through the main period of NER. Time-resolved CPD repair experiments and chromatin-level analyses of NER-factor recruitment will be needed to test this model directly.
Figure 6. Effects of 470 nm blue and 630 nm red light at 3.0 J/cm2 on UVB-induced residual CPDs across preconditioning intervals. Hs27 fibroblasts were pre-irradiated with red light (R, 630 nm) or blue light (B, 470 nm) at 5.0 mW/cm2 for 10 min (3.0 J/cm2), exposed to UVB (20 mJ/cm2) after the indicated dark interval, and analyzed using dot blotting 24 h after UVB exposure. Dot blots show the indicated interval conditions, and bar graphs summarize the CPD signals for red and blue light across the interval series. The CPD signals were normalized to dsGreen-stained total DNA and expressed relative to the UVB-alone control. The bars represent the mean + SD (n = 3). * p < 0.05 (one-way ANOVA with Dunnett’s test, compared with UVB alone); † p < 0.05, †† p < 0.01 between the indicated preconditioning intervals (Tukey–Kramer test). White bars, UVB-alone control; red bars, red light (630 nm); blue bars, blue light (470 nm); the horizontal lines denote the compared preconditioning intervals.
Cosmetics 13 00198 g006

3.4. The 505 nm Irradiation Differentially Regulates Core NER-Gene Transcription
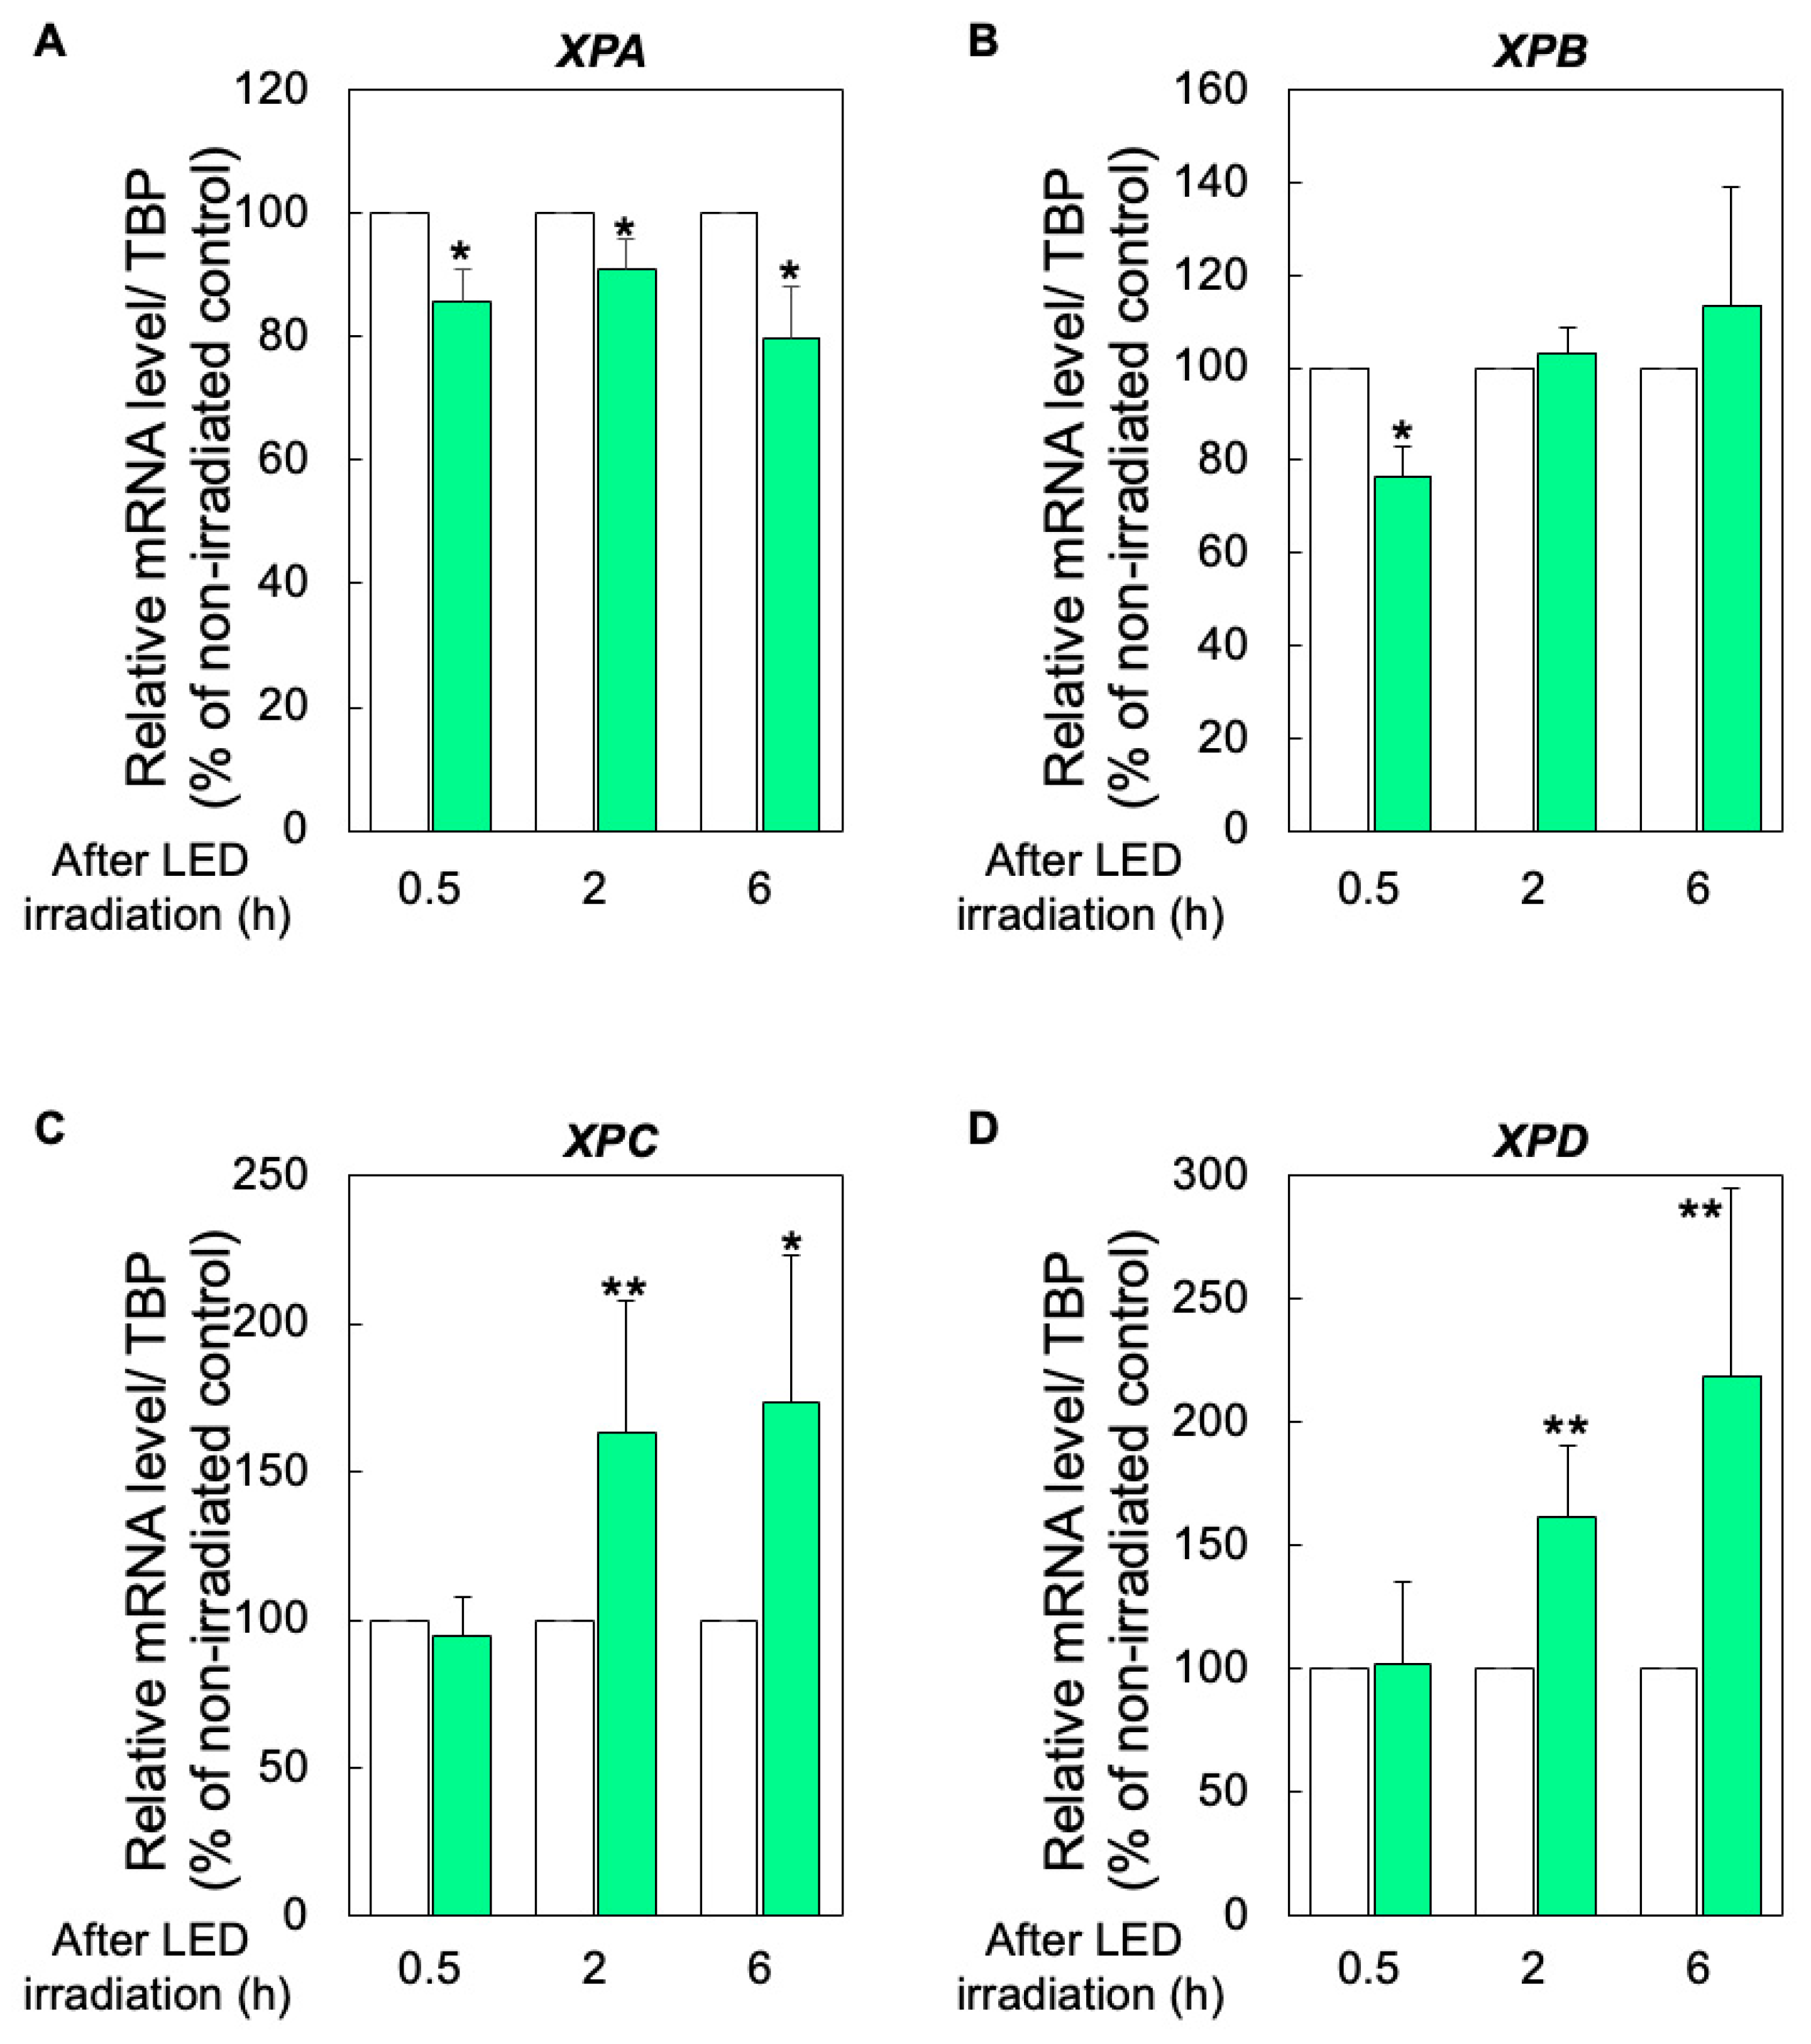
Within global-genome NER, XPC recognizes the lesion, the XPB/XPD helicases in TFIIH locally unwind DNA, and XPA verifies the damage and sets the excision boundaries; all four factors are rate-limiting for CPD removal [24,25,26]. To ask whether blue–green light regulates NER at the transcriptional level, mRNA levels of XPA, XPB, XPC and XPD were measured by real-time RT-PCR after 505 nm irradiation (Figure 8), with sampling at 0.5, 2 and 6 h after irradiation. XPA mRNA was significantly decreased at all time points, whereas XPB mRNA was significantly decreased only at 0.5 h. By contrast, XPC was unchanged at 0.5 h but rose to approximately 163% at 2 h and 174% at 6 h, and XPD was unchanged at 0.5 h but rose to approximately 162% at 2 h and 219% at 6 h. The early suppression of XPA/XPB and the later induction of XPC/XPD are consistent with a transcriptional shift in the relative mRNA levels of these NER components hours after 505 nm exposure. Protein-level changes in these factors were not measured here and are addressed below in the limitations.
Figure 7. Persistence of 505 nm preconditioning and immediate post-UVB CPD analysis: (A) Hs27 fibroblasts were pre-irradiated under the indicated visible-light conditions and exposed to UVB 48 h later. The 48 h interval experiment included 0.9 and 3.0 J/cm2 LED exposure conditions, and CPDs were quantified 24 h after UVB exposure. (B) Under the 0 h interval condition, the cells were pre-irradiated with blue–green (BG, 505 nm), red (R, 630 nm), or blue (B, 470 nm) light, and CPDs were quantified immediately after UVB exposure to evaluate the initial CPD burden. The CPD signals were normalized to total DNA staining and expressed relative to the UVB-alone control. Bars represent the mean + SD (n = 3). ** p < 0.01. In (B), the dot blots also include visible-light-alone conditions (UVB−, LED+); no CPD signal distinguishable from background was detected in these lanes, confirming that visible light alone did not generate CPDs, and they were therefore not included in the quantification. White bars, control; green, BG (505 nm); blue, B (470 nm); red, R (630 nm).
Cosmetics 13 00198 g007
Figure 8. Time-dependent changes in NER gene transcription levels after a single 505 nm irradiation. Hs27 fibroblasts were irradiated at 505 nm (5.0 mW/cm2 for 10 min; 3.0 J/cm2) without ultraviolet B (UVB) exposure. Total RNA was extracted at 0.5, 2, and 6 h, and the expression levels of XPA (A), XPB (B), XPC (C), and XPD (D) were measured by qPCR after reverse transcription. Transcript levels were normalized to TBP and expressed relative to the non-irradiated controls. Bars represent the mean + SD (n = 4). * p < 0.05, ** p < 0.01 (one-way ANOVA with Tukey–Kramer test). White bars, non-irradiated control.
Cosmetics 13 00198 g008

3.5. The 505 nm Pre-Irradiation Enhances the UVB-Induced ARE-Luciferase Reporter Response

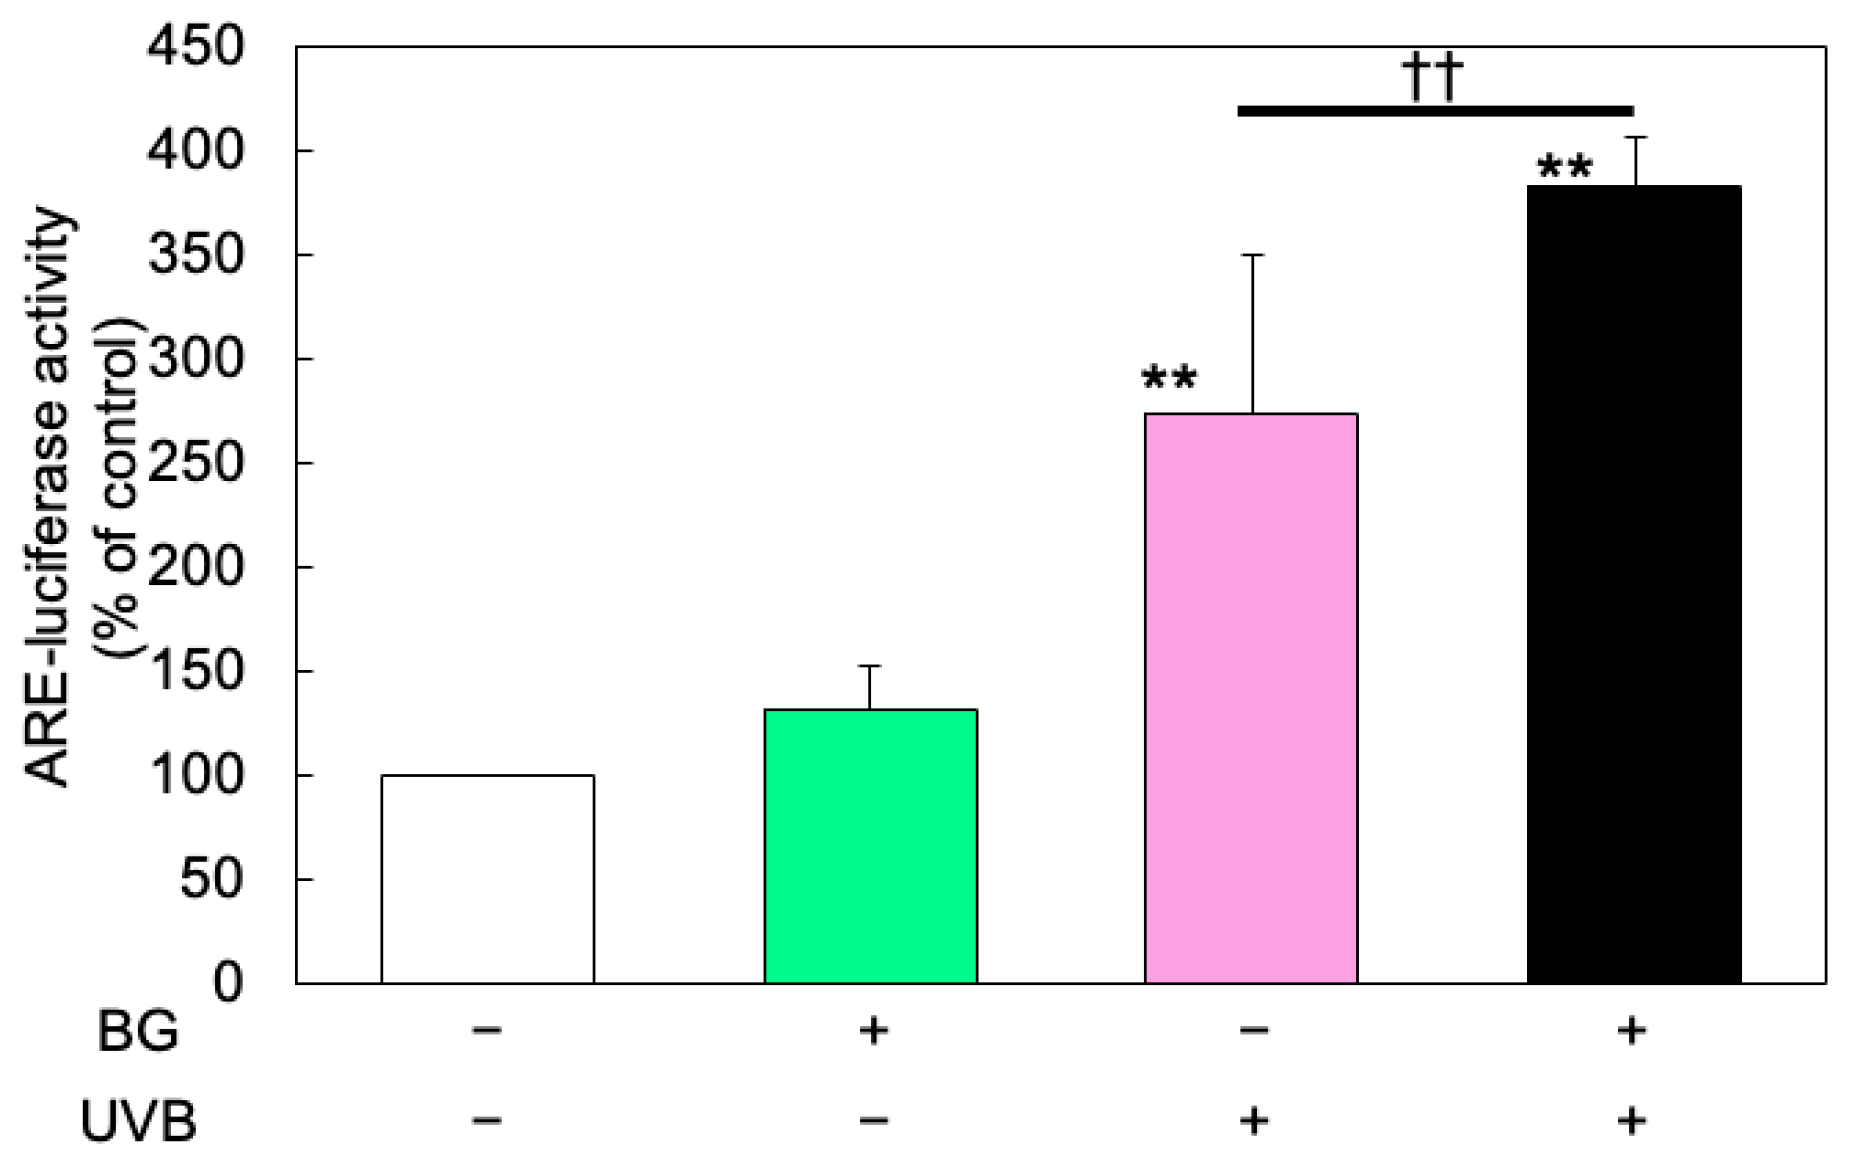
Under oxidative stress, KEAP1 cysteine modification frees NRF2, which translocates to the nucleus, dimerizes with small Maf proteins and binds AREs to drive transcription of NQO1, HO-1, GCLC and GSTs, supporting redox balance and DNA repair [21,22,23]. We used an ARE–luciferase reporter to quantify the priming effect on antioxidant-response signaling (Figure 9). The 505 nm light alone (5.0 mW/cm2, 10 min; 3.0 J/cm2) did not change reporter activity, which remained at control levels. UVB alone (20 mJ/cm2) increased reporter activity to approximately 274%, and exposing cells to UVB 6 h after 505 nm irradiation gave a significantly higher signal than UVB alone. Thus, 505 nm light alone did not drive ARE activity, but it amplified the subsequent UVB-triggered ARE response—a pattern that is temporally consistent with the delayed CPD reduction observed at 505 nm; however, the present data do not establish a causal link between the amplified ARE response and the reduction in residual CPDs.

4. Discussion

The principal finding of this study was that low-fluence 505 nm blue–green light reduced the residual burden of UVB-induced CPDs in human dermal fibroblasts, whereas 470 nm blue light and 630 nm red light did not show a consistent protective profile. This wavelength-specific effect was observed over a defined preconditioning interval and was accompanied by the delayed induction of XPC/XPD transcripts and amplification of the UVB-induced NRF2/ARE response. In this study, UVB refers to the CIE-defined 280–315 nm band, whereas solar UVB that reaches the Earth’s surface is concentrated mainly around 295–315 nm. Thus, the 302 nm UVB challenge used here models a highly genotoxic portion of terrestrial UVB exposure, rather than the entire solar spectrum.
These wavelength-dependent outcomes matter because longer-wavelength visible light can, under some conditions, oxidize repair components rather than protect DNA. Douki and colleagues reported that blue light impaired repair of UVB-induced pyrimidine dimers in a human skin model [27], and Karran and Brem summarized evidence that UVA-induced oxidation of DNA-repair proteins can inhibit NER [28]. At first glance these reports seem to contrast with the protective profile we observed at 505 nm, but the 470- and 630 nm conditions in our own data increased the residual CPD burden at selected intervals and fluence settings (Figure 5 and Figure 6). The pattern across all three wavelengths is therefore consistent with a redox-dose model: visible or near-visible wavelengths can become detrimental when they push the cell past the adaptive repair response, but a mild 505 nm dose delivered well before UVB instead appears to favor a more protective state.
The protective profile at 505 nm may reflect a balance between mild flavin/cryptochrome-related signaling and limited oxidative stress. The 505 nm wavelength falls within the absorption shoulder of flavins and may gently generate FADH• radicals. In the context of cryptochrome signaling, this spectral range can stabilize semireduced flavin states and may engage CRY-related downstream signaling [29]. In parallel, mild ROS may reversibly modify KEAP1 cysteine residues, allowing NRF2 to accumulate in a primed state [23]. During this preparatory stage, the transcription of XPC and XPD gradually increases, which may enhance global genome NER capacity [30]. Compared with 470 nm, 505 nm is also expected to generate less singlet oxygen [31,32], which may explain why it induced a protective, hormesis-like response without cytotoxicity. Consistent with this, the protective 505 nm fluences (0.9 and 3.0 J/cm2) lay within the range that produced no reduction in the resazurin signal in the LED-only viability screen (Figure 2); because viability after UVB was not assessed, this indicates only that the preconditioning doses themselves were non-cytotoxic under the LED-only conditions tested.
We chose 24 h after UVB as the principal CPD endpoint because most NER in human dermal fibroblasts is completed by then, so the residual signal reflects unrepaired damage rather than the initial photoproduct yield alone. This design tests whether preconditioning lowers unrepaired CPDs, but it cannot, on its own, separate altered formation from accelerated repair: the lower signal at 505 nm could come from either, or both. The 0 h measurements in Figure 7B were included to control for the formation step, and the delayed XPC/XPD induction (Figure 8) together with the primed ARE response (Figure 9) are consistent with a possible repair-priming contribution. Time-resolved CPD repair experiments will be needed to weigh these contributions more directly.
The environmental relevance of these doses should be considered separately for UVB and visible light. The UVB challenge dose used here, 20 mJ/cm2 (200 J/m2, unweighted), was chosen as an experimental dose that generated quantifiable CPDs in Hs27 cells. Because erythemal effectiveness is strongly wavelength-dependent, conversion to standard erythema dose (SED) requires spectral weighting; under a narrowband 302 nm approximation this dose is approximately 0.8–0.9 SED, and a precise value would require direct spectral irradiance measurement in the experimental setup. For visible-light preconditioning, 5.0 mW/cm2 for 3 and 10 min corresponded to 0.9 and 3.0 J/cm2, respectively. These fluences are within a practical range for short, localized device exposure but should not be treated as equivalent to broad-spectrum daylight. Because consumer UV-monitoring devices are increasingly available [33], any device-based use of 505 nm preconditioning would require direct testing in skin-relevant models and appropriate safety evaluation before clinical or cosmetic application. We therefore frame 505 nm preconditioning as a form of photobiomodulation in which a timed, low-fluence visible-light cue primes intrinsic DNA damage responses; the intended application is mitigation of UVB-induced dermal photoaging rather than replacement of conventional sunscreen.
A strength of this work is the side-by-side comparison of three visible wavelengths at matched irradiance, paired with a temporal analysis of the preconditioning interval (0–48 h) and mechanistic readouts at the levels of NER transcripts and NRF2/ARE signaling. This design distinguished the more consistent 505 nm response from the variable effects of 470 and 630 nm light, and defined the dark-interval window over which the residual CPD burden is reduced. Because most non-melanoma skin cancers arise from epidermal keratinocytes rather than dermal fibroblasts, our data are most relevant to UVB-induced photoaging. Earlier work by Yarosh and colleagues [34] linked persistent UV-induced DNA damage and its repair to clinical photoprotection and photoaging endpoints through topical DNA-repair-enzyme therapy. Although most matrix metalloproteinases implicated in photoaging are produced in the epidermis, accumulation of CPDs in dermal fibroblasts is increasingly recognized as one contributor to dermal photoaging, which also involves paracrine crosstalk between UV-damaged keratinocytes and dermal fibroblasts [35,36]. Our fibroblast results are therefore best read as evidence that timed 505 nm exposure may influence dermal DNA damage responses relevant to photoaging, not as direct evidence for skin-cancer prevention.
This study has several limitations. First, all the experiments were performed in a single human dermal fibroblast cell line (Hs27). Although this model is relevant to dermal responses and photoaging, most UVB-associated photocarcinogenesis originates in epidermal keratinocytes, and keratinocytes or melanocytes may respond differently to 505 nm pre-irradiation. The present findings should therefore be interpreted as proof-of-concept evidence in a dermal fibroblast model rather than a conclusion that applies across all skin compartments. Future work should test primary keratinocytes, melanocyte-containing co-cultures, three-dimensional skin equivalents and in vivo models, and should evaluate how skin phototype and tissue optical properties alter the effective fluence of 505 nm light. Second, we focused on residual CPDs 24 h after UVB; more detailed CPD repair kinetics, oxidative-stress measurements and direct protein-level analyses of NER factors are needed to define the mechanism more precisely. The proposed two-phase preconditioning model is parsimonious but remains hypothetical; direct validation will require time-resolved CPD repair kinetics and chromatin-level analyses of NER-factor recruitment. Third, our SED conversion is based on a narrowband 302 nm approximation rather than direct spectroradiometry of the lamp output in the experimental setup. We also did not evaluate cell viability after UVB exposure or in keratinocytes: the viability screen (Figure 2) was designed only to identify non-toxic preconditioning conditions, so dose safety in keratinocytes and post-UVB survival across wavelengths remain to be assessed. Finally, the 0.9 and 3.0 J/cm2 preconditioning conditions were generated as separate experimental series, each normalized to its own UVB-alone control; we therefore did not make a direct statistical comparison between the two fluences and describe their effects only relative to UVB alone, leaving a systematic within-study comparison of fluences and of wavelengths to future work.

5. Conclusions

Low-fluence 505 nm blue–green light lowered the residual burden of UVB-induced CPDs in human dermal fibroblasts over a defined preconditioning window. The combined immediate (0 h) and 24 h data are consistent with a two-phase working hypothesis: an early, wavelength-non-specific reduction in initial CPD signal, followed by a 505 nm associated change in NER-gene transcription and ARE-reporter activity, lost by 48 h. Future studies in keratinocytes, melanocytes, three-dimensional skin equivalents and in vivo models will be necessary to determine whether timed 505 nm preconditioning may represent a candidate approach for photoprotection against UVB-induced photoaging; further validation in keratinocytes, melanocyte-containing models, three-dimensional skin equivalents and in vivo systems is required before any practical application can be considered.

Supplementary Materials

The following supporting information can be downloaded at https://www.mdpi.com/article/10.3390/cosmetics13040198/s1: Table S1: Residual CPD burden (mean, SD, n) and exact p-values for the visible-light preconditioning conditions in Figure 3, Figure 4, Figure 5, Figure 6 and Figure 7, together with the between-group comparisons for Figure 6 and Figure 9.

Author Contributions

Conceptualization, N.K. and I.Y.; methodology, N.K., S.F., H.I., and N.S.; validation, N.K., S.F., H.I., and N.S.; formal analysis, N.K. and I.Y.; investigation, N.K., S.F., H.I., and N.S.; resources, M.O., S.S., K.Y., and I.Y.; data curation, N.K. and I.Y.; writing—original draft preparation, N.K. and I.Y.; writing—review and editing, all the authors; visualization, N.K. and I.Y.; supervision, I.Y.; project administration, I.Y.; funding acquisition, M.O., S.S., K.Y., and I.Y. All authors have read and agreed to the published version of the manuscript.

Funding

This study was funded by YA-MAN Co., Ltd. (grant number 725KB28978); the company also provided the light device used in this research.

Institutional Review Board Statement

Not applicable.

Informed Consent Statement

Not applicable.

Data Availability Statement

The data presented in this study are available from the corresponding author upon reasonable request.

Acknowledgments

During the preparation of this manuscript, the authors used Paperpal 2.0 (Cactus Communications, Mumbai, India) and ChatGPT (GPT-4o; OpenAI, San Francisco, CA, USA) for language editing and formatting support. The authors reviewed and edited the output and take full responsibility for the content of this publication.

Conflicts of Interest

M.O., S.S., and K.Y. are employees of YA-MAN Co., Ltd. YA-MAN Co., Ltd. contributed to the study design and provided the light device used in this research but had no role in data analysis or interpretation. The manuscript was reviewed by the sponsor for factual accuracy; however, the decision to submit was made independently by the authors. All the authors had full access to the data. The remaining authors declare that the research was conducted in the absence of any commercial or financial relationships that could be construed as a potential conflict of interest.

References

  1. Bustamante, M.; Hernandez-Ferrer, C.; Tewari, A.; Sarria, Y.; Harrison, G.I.; Puigdecanet, E.; Nonell, L.; Kang, W.; Friedlander, M.R.; Estivill, X.; et al. Dose and time effects of solar-simulated ultraviolet radiation on the in vivo human skin transcriptome. Br. J. Dermatol. 2020, 182, 1458–1468. [Google Scholar] [CrossRef] [Scilit] [PubMed]
  2. Tang, X.; Yang, T.; Yu, D.; Xiong, H.; Zhang, S. Current insights and future perspectives of ultraviolet radiation (UV) exposure: Friends and foes to the skin and beyond the skin. Environ. Int. 2024, 185, 108535. [Google Scholar] [CrossRef] [Scilit] [PubMed]
  3. Kato, T., Jr.; Todo, T.; Ayaki, H.; Ishizaki, K.; Morita, T.; Mitra, S.; Ikenaga, M. Cloning of a marsupial DNA photolyase gene and the lack of related nucleotide sequences in placental mammals. Nucleic Acids Res. 1994, 22, 4119–4124. [Google Scholar] [CrossRef] [Scilit] [PubMed]
  4. D’Souza, A.; Blee, A.M.; Chazin, W.J. Mechanism of action of nucleotide excision repair machinery. Biochem. Soc. Trans. 2022, 50, 375–386. [Google Scholar] [CrossRef] [Scilit] [PubMed]
  5. Kim, J.; Li, C.L.; Chen, X.; Cui, Y.; Golebiowski, F.M.; Wang, H.; Hanaoka, F.; Sugasawa, K.; Yang, W. Lesion recognition by XPC, TFIIH and XPA in DNA excision repair. Nature 2023, 617, 170–175. [Google Scholar] [CrossRef] [Scilit] [PubMed]
  6. Al-Sadek, T.; Yusuf, N. Ultraviolet Radiation Biological and Medical Implications. Curr. Issues Mol. Biol. 2024, 46, 1924–1942. [Google Scholar] [CrossRef] [Scilit] [PubMed]
  7. Serrage, H.; Heiskanen, V.; Palin, W.M.; Cooper, P.R.; Milward, M.R.; Hadis, M.; Hamblin, M.R. Under the spotlight: Mechanisms of photobiomodulation concentrating on blue and green light. Photochem. Photobiol. Sci. 2019, 18, 1877–1909. [Google Scholar] [CrossRef] [Scilit] [PubMed]
  8. Hernandez-Bule, M.L.; Naharro-Rodriguez, J.; Bacci, S.; Fernandez-Guarino, M. Unlocking the Power of Light on the Skin: A Comprehensive Review on Photobiomodulation. Int. J. Mol. Sci. 2024, 25, 4483. [Google Scholar] [CrossRef] [Scilit] [PubMed]
  9. Kabakova, M.; Wang, J.; Stolyar, J.; Austin, E.; Jagdeo, J. Visible Blue Light Does Not Induce DNA Damage in Human Dermal Fibroblasts. J. Biophotonics 2025, 18, e202400510. [Google Scholar] [CrossRef] [Scilit] [PubMed]
  10. Mao, L.; Yin, H.; Qiu, Z.; Zhao, L.; Wang, S.; Wang, Y.; Wu, Y.; Gu, C.; Yao, X.; Li, W. Opsin 3 in keratinocytes mediates the light-induced exaggeration of atopic dermatitis. J. Allergy Clin. Immunol. 2025, 156, 980–992. [Google Scholar] [CrossRef] [Scilit] [PubMed]
  11. Mann, T.; Eggers, K.; Rippke, F.; Tesch, M.; Buerger, A.; Darvin, M.E.; Schanzer, S.; Meinke, M.C.; Lademann, J.; Kolbe, L. High-energy visible light at ambient doses and intensities induces oxidative stress of skin-Protective effects of the antioxidant and Nrf2 inducer Licochalcone A in vitro and in vivo. Photodermatol. Photoimmunol. Photomed. 2020, 36, 135–144. [Google Scholar] [CrossRef] [Scilit] [PubMed]
  12. Mignon, C.; Uzunbajakava, N.E.; Raafs, B.; Botchkareva, N.V.; Tobin, D.J. Photobiomodulation of human dermal fibroblasts in vitro: Decisive role of cell culture conditions and treatment protocols on experimental outcome. Sci. Rep. 2017, 7, 2797. [Google Scholar] [CrossRef] [Scilit] [PubMed]
  13. Allegra, A.; Pioggia, G.; Tonacci, A.; Musolino, C.; Gangemi, S. Oxidative Stress and Photodynamic Therapy of Skin Cancers: Mechanisms, Challenges and Promising Developments. Antioxidants 2020, 9, 448. [Google Scholar] [CrossRef] [Scilit] [PubMed]
  14. Buscone, S.; Mardaryev, A.N.; Westgate, G.E.; Uzunbajakava, N.E.; Botchkareva, N.V. Cryptochrome 1 is modulated by blue light in human keratinocytes and exerts positive impact on human hair growth. Exp. Dermatol. 2021, 30, 271–277. [Google Scholar] [CrossRef] [Scilit] [PubMed]
  15. Bouly, J.P.; Schleicher, E.; Dionisio-Sese, M.; Vandenbussche, F.; Van Der Straeten, D.; Bakrim, N.; Meier, S.; Batschauer, A.; Galland, P.; Bittl, R.; et al. Cryptochrome blue light photoreceptors are activated through interconversion of flavin redox states. J. Biol. Chem. 2007, 282, 9383–9391. [Google Scholar] [CrossRef] [Scilit] [PubMed]
  16. Tonelli, C.; Chio, I.I.C.; Tuveson, D.A. Transcriptional Regulation by Nrf2. Antioxid. Redox Signal. 2018, 29, 1727–1745. [Google Scholar] [CrossRef] [Scilit] [PubMed]
  17. Li, J.; Xu, C.; Liu, Q. Roles of NRF2 in DNA damage repair. Cell. Oncol. 2023, 46, 1577–1593. [Google Scholar] [CrossRef] [Scilit] [PubMed]
  18. Knatko, E.V.; Ibbotson, S.H.; Zhang, Y.; Higgins, M.; Fahey, J.W.; Talalay, P.; Dawe, R.S.; Ferguson, J.; Huang, J.T.; Clarke, R.; et al. Nrf2 Activation Protects against Solar-Simulated Ultraviolet Radiation in Mice and Humans. Cancer Prev. Res. 2015, 8, 475–486. [Google Scholar] [CrossRef] [Scilit] [PubMed]
  19. Jiang, X.Y.; Guo, Q.Q.; Wang, S.S.; Guo, R.; Zou, Y.; Liu, J.W.; Feng, Y.L.; Guo, Y.; Li, Y.H.; Liu, X.Y.; et al. DNA damage response pathway regulates Nrf2 in response to oxidative stress. Sci. Adv. 2025, 11, eadu9555. [Google Scholar] [CrossRef] [Scilit] [PubMed]
  20. Kirschneck, C.; Batschkus, S.; Proff, P.; Köstler, J.; Spanier, G.; Schröder, A. Valid gene expression normalization by RT-qPCR in studies on hPDL fibroblasts with focus on orthodontic tooth movement and periodontitis. Sci. Rep. 2017, 7, 14751. [Google Scholar] [CrossRef] [Scilit] [PubMed]
  21. Kensler, T.W.; Wakabayashi, N.; Biswal, S. Cell survival responses to environmental stresses via the Keap1-Nrf2-ARE pathway. Annu. Rev. Pharmacol. Toxicol. 2007, 47, 89–116. [Google Scholar] [CrossRef] [Scilit] [PubMed]
  22. Hayes, J.D.; Dinkova-Kostova, A.T. The Nrf2 regulatory network provides an interface between redox and intermediary metabolism. Trends Biochem. Sci. 2014, 39, 199–218. [Google Scholar] [CrossRef] [Scilit] [PubMed]
  23. Yamamoto, M.; Kensler, T.W.; Motohashi, H. The KEAP1-NRF2 System: A Thiol-Based Sensor-Effector Apparatus for Maintaining Redox Homeostasis. Physiol. Rev. 2018, 98, 1169–1203. [Google Scholar] [CrossRef] [Scilit] [PubMed]
  24. Sugitani, N.; Sivley, R.M.; Perry, K.E.; Capra, J.A.; Chazin, W.J. XPA: A key scaffold for human nucleotide excision repair. DNA Repair 2016, 44, 123–135. [Google Scholar] [CrossRef] [Scilit] [PubMed]
  25. Sugasawa, K. Molecular mechanisms of DNA damage recognition for mammalian nucleotide excision repair. DNA Repair 2016, 44, 110–117. [Google Scholar] [CrossRef] [Scilit] [PubMed]
  26. Kokic, G.; Wagner, F.R.; Chernev, A.; Urlaub, H.; Cramer, P. Structural basis of human transcription-DNA repair coupling. Nature 2021, 598, 368–372. [Google Scholar] [CrossRef] [Scilit] [PubMed]
  27. Douki, T.; Bacqueville, D.; Jacques, C.; Genies, C.; Roullet, N.; Bessou-Touya, S.; Duplan, H. Blue light impairs the repair of UVB-induced pyrimidine dimers in a human skin model. Photochem. Photobiol. 2024, 100, 1359–1364. [Google Scholar] [CrossRef] [Scilit] [PubMed]
  28. Karran, P.; Brem, R. Protein oxidation, UVA and human DNA repair. DNA Repair 2016, 44, 178–185. [Google Scholar] [CrossRef] [Scilit] [PubMed]
  29. Hoang, N.; Schleicher, E.; Kacprzak, S.; Bouly, J.P.; Picot, M.; Wu, W.; Berndt, A.; Wolf, E.; Bittl, R.; Ahmad, M. Human and Drosophila cryptochromes are light activated by flavin photoreduction in living cells. PLoS Biol. 2008, 6, e160. [Google Scholar] [CrossRef] [Scilit] [PubMed]
  30. Ohtsuji, M.; Katsuoka, F.; Kobayashi, A.; Aburatani, H.; Hayes, J.D.; Yamamoto, M. Nrf1 and Nrf2 play distinct roles in activation of antioxidant response element-dependent genes. J. Biol. Chem. 2008, 283, 33554–33562. [Google Scholar] [CrossRef] [Scilit] [PubMed]
  31. Oplander, C.; Hidding, S.; Werners, F.B.; Born, M.; Pallua, N.; Suschek, C.V. Effects of blue light irradiation on human dermal fibroblasts. J. Photochem. Photobiol. B 2011, 103, 118–125. [Google Scholar] [CrossRef] [Scilit] [PubMed]
  32. Szymanski, L.; Ciepielak, M.; Cios, A.; Palusinska, M.; Stankiewicz, W.; Lewicki, S. Effects of 445 nm, 520 nm, and 638 nm Laser Irradiation on the Dermal Cells. Int. J. Mol. Sci. 2021, 22, 11605. [Google Scholar] [CrossRef] [Scilit] [PubMed]
  33. Huang, X.; Chalmers, A.N. Review of Wearable and Portable Sensors for Monitoring Personal Solar UV Exposure. Ann. Biomed. Eng. 2021, 49, 964–978. [Google Scholar] [CrossRef] [Scilit] [PubMed]
  34. Yarosh, D.B.; O’Connor, A.; Alas, L.; Potten, C.; Wolf, P. Photoprotection by topical DNA repair enzymes: Molecular correlates of clinical studies. Photochem. Photobiol. 1999, 69, 136–140. [Google Scholar] [CrossRef] [Scilit]
  35. Wang, X.Y.; Bi, Z.G. UVB-irradiated human keratinocytes and interleukin-1α indirectly increase MAP kinase/AP-1 activation and MMP-1 production in UVA-irradiated dermal fibroblasts. Chin. Med. J. 2006, 119, 827–831. [Google Scholar] [CrossRef] [Scilit]
  36. Ko, H.J.; Kim, J.; Ahn, M.; Kim, J.H.; Lee, G.S.; Shin, T. Ergothioneine alleviates senescence of fibroblasts induced by UVB damage of keratinocytes via activation of the Nrf2/HO-1 pathway and HSP70 in keratinocytes. Exp. Cell Res. 2021, 400, 112516. [Google Scholar] [CrossRef] [Scilit] [PubMed]
Figure 1. LED irradiation device, normalized emission spectra, and exposure workflow: (A) Visual overview of the LED irradiation device used for visible light preconditioning. (B) Normalized emission spectra of the visible-light sources used for preconditioning: blue light, 470 nm (FWHM = 24 nm); blue–green light, 505 nm (FWHM = 30 nm); and red light, 630 nm (FWHM = 14 nm). The manufacturer-provided spectrum of the UVB lamp used in the 302 nm mode is shown for source characterization. (C) Experimental workflow. Hs27 fibroblasts were pre-irradiated with blue (470 nm), blue–green (505 nm) or red (630 nm) light at 5.0 mW/cm2 for 3 min (0.9 J/cm2) or 10 min (3.0 J/cm2), maintained in phenol red-free culture medium in the dark for the indicated interval (0, 3, 6, 24 or 48 h) and exposed to UVB (20 mJ/cm2). The measured endpoints were residual CPDs (dot blot, immediately or 24 h after UVB), NER-gene transcription (XPA, XPB, XPC and XPD; qPCR) and NRF2/ARE activity (luciferase assay), as indicated. In (C), the lightning symbols denote UVB irradiation.
Cosmetics 13 00198 g001
Figure 2. Effect of visible light pretreatment on the viability of Hs27 human dermal fibroblasts. LEDs of blue–green (BG, 505 nm), blue (B, 470 nm), and red (R, 630 nm) were applied at 3.0 or 5.0 mW/cm2 for 30 s, 3 min, or 10 min. Panels (AC) show 505 nm blue–green light, panels (DF) show 470 nm blue light, and panels (GI) show 630 nm red light. The panels correspond to 30 s, 3 min, and 10 min exposures at each wavelength. At 3.0 mW/cm2, these exposure durations corresponded to 0.09, 0.54, and 1.8 J/cm2, respectively, and at 5.0 mW/cm2, they corresponded to 0.15, 0.9, and 3.0 J/cm2, respectively. Cell viability was measured 24 h later and expressed as a percentage relative to that of the untreated control. Bars represent the mean + SD (n = 4). ** p < 0.01 (one-way ANOVA with Tukey–Kramer test). White bars, untreated control; green bars, blue–green light (505 nm); blue bars, blue light (470 nm); red bars, red light (630 nm).
Cosmetics 13 00198 g002
Figure 9. Blue–green light preconditioning enhances the UVB-induced ARE-luciferase reporter response. Hs27 fibroblasts transfected with the ARE promoter-luciferase reporter were subjected to 505 nm irradiation alone (5.0 mW/cm2, 10 min; 3.0 J/cm2), UVB irradiation alone (20 mJ/cm2), or 505 nm irradiation followed by UVB irradiation 6 h later. Luciferase activity was measured after UVB exposure and normalized to that of the control, which was set at 100%. Bars indicate mean + SD (n = 4). ** p < 0.01 vs. the control (BG−/UVB−); †† p < 0.01 between the indicated groups (one-way ANOVA with Tukey–Kramer test). White bar, BG−/UVB−; green, BG+/UVB−; pink, BG−/UVB+; black, BG+/UVB+.
Cosmetics 13 00198 g009
Table 1. Primer sequences used for real-time RT-PCR.
Gene NameForward PrimerReverse Primer
TBPCACGAACCACGGCACTGATTTTTTCTTGCTGCCAGTCTGGAC
XPAGCAGCCCCAAAGATAATTGATTTCCCACATTCTTCGCATA
XPBCATGATCCTGGATGAAGTGCCGCAGTCAAACCCAGCTTAC
XPCTGCAGAACTTTCAGCCAGTGTCTTTCCCTTTGCTGTTGCT
XPDGTTTCTGGGACTGGCTCTGACCTCATAGAATCGGCAGTGG
Disclaimer/Publisher’s Note: The statements, opinions and data contained in all publications are solely those of the individual author(s) and contributor(s) and not of MDPI and/or the editor(s). MDPI and/or the editor(s) disclaim responsibility for any injury to people or property resulting from any ideas, methods, instructions or products referred to in the content.