Article

Comparative Characterization of Injectable Dermal Fillers: Physicochemical Properties, Cytotoxicity, Collagen-Stimulating Activity, and Macrophage Cytokine Profiles

1
Therapeutic Bio Research Center, CGBIO Co., Ltd., Seoul 04349, Republic of Korea
2
Department of Pharmacy, Graduate School, Hanyang University, Seoul 04763, Republic of Korea
*
Author to whom correspondence should be addressed.
Cosmetics 2026, 13(4), 188; https://doi.org/10.3390/cosmetics13040188
Submission received: 13 May 2026 / Revised: 7 July 2026 / Accepted: 21 July 2026 / Published: 23 July 2026
(This article belongs to the Section Cosmetic Dermatology)

Abstract

Injectable dermal fillers are widely used in aesthetic medicine for soft-tissue augmentation and facial rejuvenation; however, systematic comparative data on their physicochemical properties and biological activities remain limited. This study aimed to characterise five commercially available dermal filler products—Facetem®, cCaHA, PDLLA, PLLA, and PCL—with respect to particle morphology and size distribution, in vitro cytotoxicity, collagen-stimulating gene expression, and macrophage cytokine secretion profiles. Particle size and distribution were determined by laser diffraction. Cytotoxicity was assessed in L929 mouse fibroblasts using the CCK-8 assay at concentrations of 0.1–5 mg/mL. Collagen-stimulating activity was evaluated by measuring COL1A1 and COL3A2 mRNA expression in primary human fibroblasts via quantitative RT-PCR. Macrophage immune responses were profiled by a multiplexed cytokine array (40 analytes) in lipopolysaccharide/interferon-γ-polarised M1 and interleukin-4/interleukin-13-polarised M2 macrophages. Scanning electron microscopy revealed distinct morphological differences among the five products. PDLLA exhibited the smallest median particle size (d(0.5) = 24.9 μm) and highest specific surface area (701.4 m2/kg), while PLLA showed the broadest size distribution (Span = 1.617). All products maintained cell viability above 85% at all tested concentrations, indicating acceptable biocompatibility. Facetem®, PDLLA, and PLLA significantly upregulated COL1A1 expression in human fibroblasts; PDLLA and Facetem® also significantly increased COL3A2 expression. Cytokine profiling demonstrated that the products did not substantially alter pro-inflammatory cytokine secretion in M1 macrophages, whereas selected products at high concentrations modulated several mediators in M2 macrophages, suggesting a tissue-remodelling rather than inflammatory response. These findings demonstrate product-specific physicochemical and biological profiles that may guide clinician selection and formulation development of injectable dermal fillers. Facetem® exhibited a favourable combination of biocompatibility, collagen-stimulating activity, and immune-modulatory properties comparable or superior to established reference products.

1. Introduction

Injectable dermal fillers have become among the most commonly performed minimally invasive cosmetic procedures worldwide, with millions of treatments administered annually [1]. These products are used to restore lost facial volume, efface rhytides, and reshape contours by occupying space within the dermis and subcutaneous tissue [2,3]. The landscape of available fillers has expanded considerably beyond hyaluronic acid-based formulations to include biostimulatory agents that promote endogenous collagen synthesis, such as calcium hydroxylapatite (CaHA), poly-L-lactic acid (PLLA), poly-ε-caprolactone (PCL), and poly-D,L-lactic acid (PDLLA) microspheres [4,5].
Biostimulatory fillers are distinguished by their capacity to induce a controlled foreign-body response, activating fibroblasts and macrophages to deposit new extracellular matrix components, particularly fibrillar collagens [6]. The long-term efficacy and safety of these products are therefore critically dependent on their physicochemical characteristics—including particle size, morphology, and surface area—as well as their biological interactions with resident and recruited cells in the dermal microenvironment [7,8]. Particle size, in particular, influences the degree of macrophage phagocytosis, the magnitude of the inflammatory response, and the durability of the collagen-stimulatory effect [9,10,11].
Despite the widespread clinical use of biostimulatory fillers, head-to-head comparative data on the physicochemical and biological properties of commercially available products are scarce [12,13]. Most published studies evaluate single products, utilise disparate methodologies, or focus exclusively on clinical outcomes without mechanistic characterisation [14,15]. This evidence gap complicates evidence-based product selection for clinicians and impedes rational formulation optimisation by manufacturers.
The present study was therefore designed to provide a systematic, multi-parametric comparative characterisation of five injectable dermal filler products: Facetem® (a novel PDLLA-based biostimulatory filler), CaHA (CaHA) [7], PDLLA (PDLLA/hyaluronic acid) [12], PLLA (PLLA) [9], and PCL (PCL) [10]. These five products were selected to represent the principal classes of biostimulatory filler chemistries currently in clinical use—namely CaHA-, PLLA-, PCL-, and PDLLA-based platforms—so that Facetem®, a recently introduced PDLLA-based product, could be benchmarked directly against the established reference products from each chemical class rather than against a single comparator. This design allows the relative performance of Facetem® to be interpreted in the context of the full range of biostimulatory mechanisms currently available to clinicians. We evaluated particle size distribution by laser diffraction, assessed in vitro cytotoxicity in a standardised fibroblast model [16], quantified COL1A1 and COL3A2 mRNA expression in primary human fibroblasts as biomarkers of collagen-stimulating activity [17,18], and profiled macrophage cytokine secretion patterns using a 40-plex array in both M1 (pro-inflammatory) and M2 (anti-inflammatory/reparative) polarisation states [19,20]. Together, these analyses provide an integrated biological characterisation of each product relevant to both safety and efficacy.

2. Materials and Methods

2.1. Study Products

Five commercially available injectable dermal filler products were included in this study: Facetem® (PDLLA microspheres in carboxymethylcellulose carrier; CGBIO Co., Ltd., Seoul, Republic of Korea), CaHA (CaHA microspheres in aqueous gel carrier; Merz Aesthetics, Frankfurt, Germany), PDLLA (PDLLA/hyaluronic acid composite; Hana Pharm, Seoul, South Korea), PLLA (PLLA microspheres; Galderma, Lausanne, Switzerland), and PCL (PCL microspheres in carboxymethylcellulose gel; Sinclair Pharma, London, UK). Products were stored and handled according to manufacturer instructions and analysed within their stated shelf lives. A summary of the compositional and formulation characteristics of each product, compiled from manufacturer product information and regulatory filings, is provided in Table 1; where manufacturers do not publicly disclose specific polymer concentrations or molecular weights, this is indicated accordingly.

2.2. Scanning Electron Microscopy

Particle morphology was examined by scanning electron microscopy (SEM). Samples were prepared by diluting each product in deionised water, depositing a small volume onto aluminium stubs, and sputter-coating with gold-palladium under vacuum. Images were acquired at ×100 and ×300 magnification using a field-emission SEM (Hitachi S-4500, Tokyo, Japan) operated at 5 kV accelerating voltage.

2.3. Particle Size Analysis

Particle size distributions were determined by laser diffraction using a Mastersizer 3000 (Malvern Panalytical, Malvern, UK) with the wet dispersion unit (Hydro MV). Each product was dispersed in deionised water under gentle stirring. Volume-weighted particle size parameters—d(0.1), d(0.5), d(0.9), and the volume-weighted mean diameter—were calculated from triplicate measurements. Distribution breadth was characterised by the Uniformity index and the Span [(d(0.9) − d(0.1))/d(0.5)]. Specific surface area was calculated from the particle size distribution assuming spherical particles.

2.4. Cell Culture

L929 mouse fibroblasts (ATCC CCL-1; ATCC, Manassas, VA, USA) were maintained in Dulbecco’s modified Eagle’s medium (DMEM; Gibco, Waltham, MA, USA) supplemented with 10% foetal bovine serum (FBS) and 1% penicillin-streptomycin at 37 °C in a humidified atmosphere with 5% CO2. Human primary dermal fibroblasts (HDFs) were cultured in Fibroblast Growth Medium-2 (FGM-2; Lonza, Basel, Switzerland). All experiments were performed on cells between passages 4 and 8. THP-1 human monocytic cells (ATCC TIB-202) were cultured in RPMI-1640 supplemented with 10% FBS. L929 mouse fibroblasts were selected specifically for the cytotoxicity assay because this cell line is the internationally standardised model prescribed by ISO 10993-5 for the biological evaluation of medical devices and biomaterials [16], allowing our cytotoxicity results to be directly compared with regulatory thresholds and previously published filler safety data [7,9,21]. Human dermal fibroblasts and THP-1-derived macrophages were used for the mechanistic, efficacy-related endpoints (collagen gene expression and cytokine secretion) because these cell types are more directly relevant to the human dermal wound-healing and foreign-body response that fillers are intended to elicit in vivo. We acknowledge that combining a murine standard-cytotoxicity model with human-derived mechanistic models within the same study is a limitation, as species-specific differences in receptor expression and extracellular matrix biology may affect the direct comparability of cytotoxicity and efficacy endpoints; this is discussed further in Section 4.

2.5. Cytotoxicity Assay

L929 fibroblasts were seeded in 96-well plates at 5 × 10³ cells/well and allowed to adhere overnight. Each filler product was diluted in serum-free DMEM to concentrations of 0.1, 0.5, 1, 2, and 5 mg/mL and sterile-filtered (0.22 μm). This concentration range was selected to span the local tissue concentrations estimated to occur at the injection site immediately after implantation down to several-fold dilutions anticipated following interstitial fluid distribution, and is consistent with concentration ranges used in previous comparative filler cytotoxicity studies [7,9,21]. After 24 h treatment, cell viability was determined using the Cell Counting Kit-8 (CCK-8; Dojindo, Kumamoto, Japan) according to the manufacturer’s instructions. Absorbance was measured at 450 nm. Cell viability (%) was calculated as the absorbance of treated cells relative to the mean absorbance of the untreated control × 100. Results are expressed as mean ± standard deviation (SD) of four independent replicates (n = 4). Prior to hypothesis testing, the normality of residuals was assessed by the Shapiro–Wilk test and the homogeneity of variances by Levene’s test; both assumptions were satisfied for all comparisons reported. Statistical significance was determined by Dunnett’s multiple comparison test against the respective untreated control group using GraphPad Prism 10 (GraphPad Software, San Diego, CA, USA).

2.6. Quantitative RT-PCR for Collagen mRNA Expression

HDFs were seeded in 6-well plates (3 × 10⁵ cells/well) and treated with each filler product at concentrations of 0, 1, 2, and 5 mg/mL for 48 h, with each concentration applied in biological triplicate wells derived from independent passages; each biological replicate was additionally assayed in technical duplicate by qPCR. Total RNA was extracted using TRIzol reagent (Invitrogen, Carlsbad, CA, USA) and reverse-transcribed with the iScript cDNA Synthesis Kit (Bio-Rad Laboratories, Hercules, CA, USA). Quantitative PCR was performed on a CFX96 Real-Time System (Bio-Rad) using SYBR Green master mix. Primer sequences for COL1A1, COL3A2 (COL3A1 type III), and the reference gene GAPDH were designed using Primer-BLAST (NCBI, Bethesda, MD, USA). GAPDH was selected as the reference gene based on its stable Ct values (coefficient of variation < 5%) across all treatment conditions in preliminary runs, confirming its suitability as an internal normalisation control for this cell system. Relative mRNA expression was normalised to GAPDH and quantified by the 2−ΔΔCt method, expressed as fold-change relative to the untreated (0 mg/mL) control. Data are presented as mean ± standard error (SE) of three independent experiments (biological replicates). Prior to hypothesis testing, normality and homogeneity of variance were assessed by the Shapiro–Wilk and Levene’s tests, respectively; statistical analysis was then performed by one-way ANOVA with Tukey’s post hoc test.

2.7. Macrophage Polarisation and Cytokine Array

THP-1 cells were differentiated into macrophages with 100 nM phorbol 12-myristate 13-acetate (PMA; Sigma-Aldrich, St. Louis, MO, USA) for 72 h, then polarised to M1 by treatment with 100 ng/mL LPS and 20 ng/mL IFN-γ, or to M2 by treatment with 20 ng/mL IL-4 and 20 ng/mL IL-13, for 24 h. Polarised macrophages were then treated with each filler product diluted 1:50 or 1:100 in serum-free RPMI-1640 for a further 24 h; these dilutions were selected to approximate the range of local tissue dilution expected following interstitial distribution of injected filler material and to remain within the linear detection range of the cytokine array in preliminary optimisation experiments. Conditioned media were collected, centrifuged to remove debris, and cytokine concentrations were measured using a 40-plex human cytokine array (RayBio® Human Cytokine Array C5; RayBiotech, Peachtree Corners, GA, USA). Array images were acquired on a fluorescence scanner and quantified as mean fluorescence units (MFU) from three independent biological replicates per condition. Data are expressed as mean ± SE. Normality and homogeneity of variance were assessed by the Shapiro–Wilk and Levene’s tests, respectively, prior to one-way ANOVA with Tukey’s post hoc test.

2.8. Ethical Considerations

All experiments were conducted with commercially available, anonymised cell lines in accordance with institutional guidelines. Ethical approval was not required for cell-based in vitro studies under the applicable national regulations. The study was conducted in compliance with the Declaration of Helsinki principles where applicable.

3. Results

3.1. Particle Morphology by Scanning Electron Microscopy

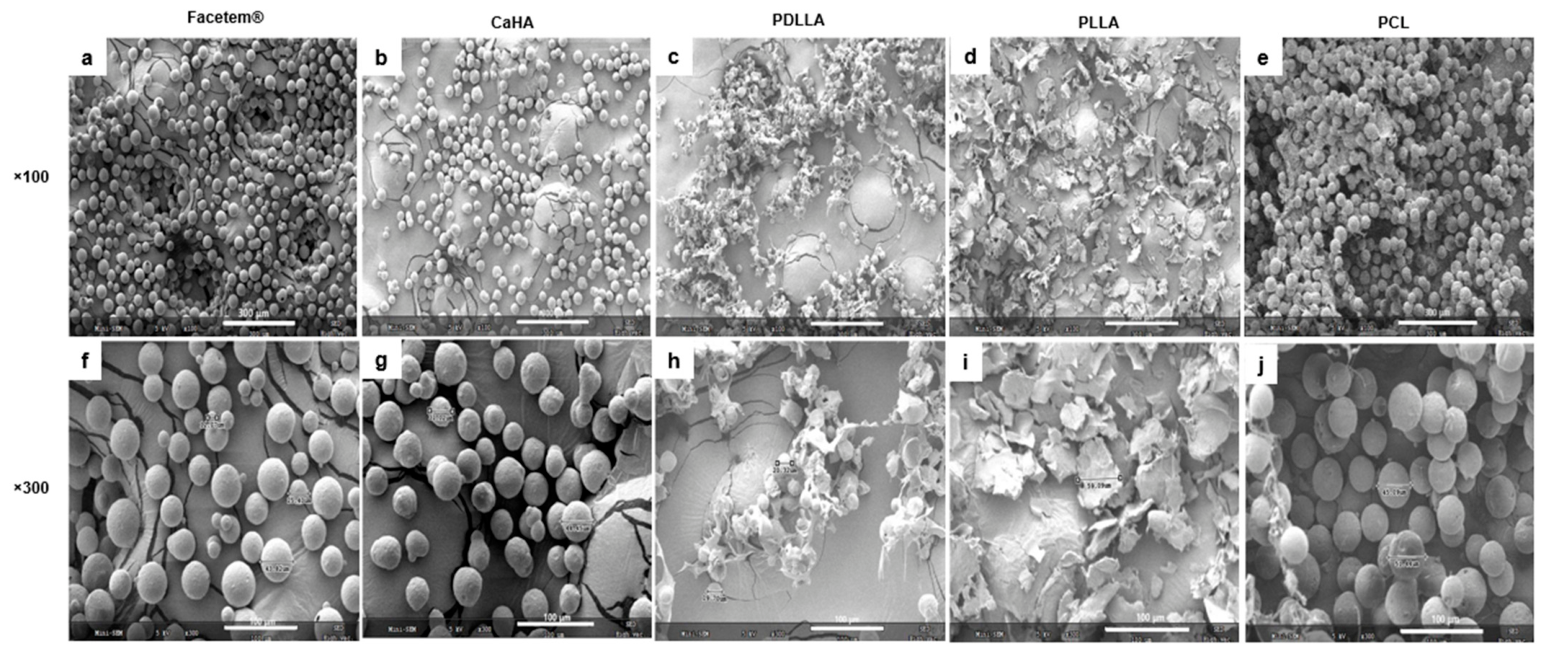
SEM imaging revealed clear morphological differences among the five filler products (Figure 1). Facetem® and CaHA displayed uniformly spherical particles of similar diameter at both ×100 and ×300 magnification, with smooth surface textures and consistent inter-particle spacing. PCL similarly comprised spherical particles with comparable size homogeneity. In contrast, PDLLA exhibited an irregular, flake-like morphology consistent with its PDLLA/HA composite formulation, with a high degree of particle aggregation. PLLA showed irregularly shaped particles with a heterogeneous size distribution and notably broader range than the other products. These morphological features were consistent with the quantitative particle size data described below.

3.2. Particle Size Distribution

Laser diffraction analysis demonstrated product-specific differences in particle size distribution (Table 2). PDLLA had the smallest median particle diameter (d(0.5) = 24.9 μm) and the highest specific surface area (701.4 m2/kg), reflecting its relatively small, flake-like particles. PLLA showed the largest median diameter (d(0.5) = 51.4 μm), the broadest distribution (Span = 1.617; Uniformity = 0.560), and the lowest specific surface area (151.8 m2/kg). Facetem® and CaHA exhibited closely similar size profiles, with d(0.5) values of 34.6 and 34.9 μm, respectively, and comparable Span values (~0.87). PCL displayed the narrowest size distribution (Span = 0.612; Uniformity = 0.188) with a d(0.5) of 38.4 μm.

3.3. In Vitro Cytotoxicity

All five filler products maintained L929 fibroblast viability above 85% across the entire concentration range tested (0.1–5 mg/mL), demonstrating acceptable biocompatibility in vitro (Table 3). At the lowest concentration (0.1 mg/mL), mean viability ranged from 94.6% (Facetem®) to 99.1% (PDLLA), with no statistically significant differences from the untreated control for any product. At 1 mg/mL, PLLA and CaHA showed modest but statistically significant reductions in viability (87.0 ± 2.5%, p < 0.01; and 90.4 ± 7.4%, p < 0.05, respectively). Facetem® did not reach statistical significance at any tested concentration, suggesting excellent biocompatibility across the full dose range. Notably, PDLLA demonstrated significantly elevated viability at 1 mg/mL (120.7 ± 2.1%, p < 0.001) and 2 mg/mL (111.0 ± 3.4%, p < 0.01), consistent with a proliferative or metabolic stimulatory effect attributable to its hyaluronic acid component.

3.4. Collagen mRNA Expression

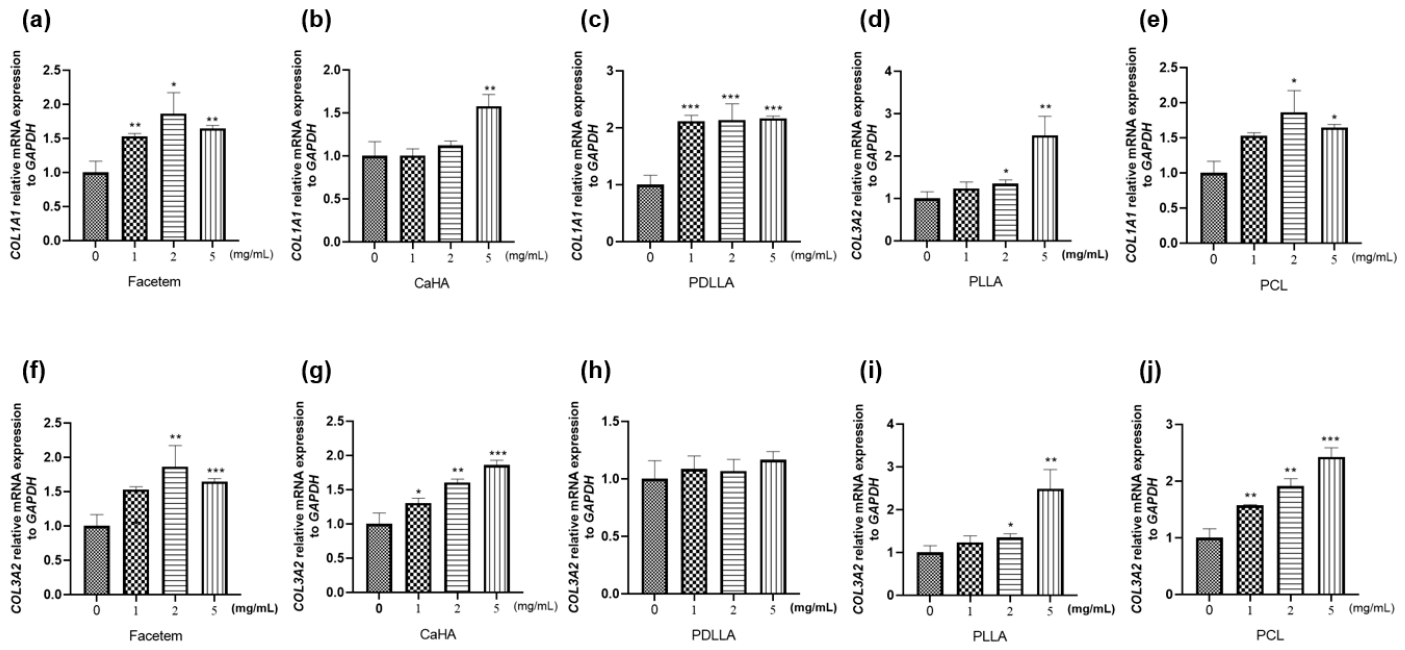
All five products upregulated COL1A1 (type I collagen α1 chain) mRNA expression in human dermal fibroblasts in a concentration-dependent manner (Figure 2a–e). PDLLA produced the most pronounced COL1A1 upregulation, with significant increases at 1, 2, and 5 mg/mL reaching approximately 2.1-fold over the vehicle control (all p < 0.001). Facetem® and PLLA also significantly induced COL1A1 expression, with maximum fold changes of approximately 1.85 and 2.1, respectively. CaHA and PCL produced more modest but statistically significant COL1A1 increases at the highest concentrations tested.
COL3A2 (type III collagen α2 chain) expression was also induced by multiple products (Figure 2f–j). Facetem® produced significant COL3A2 upregulation at 2 mg/mL (approximately 2.5-fold, p < 0.01) and 5 mg/mL (approximately 2.0-fold, p < 0.001). PLLA significantly increased COL3A2 at 5 mg/mL (~2.5-fold, p < 0.01). PCL demonstrated progressive and statistically significant COL3A2 upregulation across all concentrations (all p ≤ 0.01). In contrast, PDLLA and CaHA did not produce statistically significant COL3A2 changes at most concentrations tested, suggesting product-specific differences in the relative stimulation of type I versus type III collagen.

3.5. Macrophage Cytokine Profiles

A 40-plex cytokine array was used to characterise the immunomodulatory profiles of the five filler products in M1- and M2-polarised macrophages (Table 4). In M1 macrophages, none of the filler products induced significant changes in the majority of cytokines assayed compared with the vehicle control. The only statistically significant alteration in M1 macrophages was a reduction in MIP-1α (CCL3) secretion by PDLLA at 1:50 dilution (3504 ± 2745 vs. 9906 ± 434 MFU in vehicle; p < 0.05), suggesting a dampening of chemokine-mediated macrophage recruitment. These data indicate that none of the tested products elicited a broad pro-inflammatory cytokine response in M1 macrophages.
In M2 macrophages, a more heterogeneous pattern was observed. At a 1:100 dilution, PDLLA significantly increased G-CSF (6868 ± 695 vs. 348 ± 90 MFU; p < 0.05), IL-5 (194 ± 16 vs. 123 ± 6 MFU; p < 0.05), IL-6 (50,866 ± 5526 vs. 2462 ± 543 MFU; p < 0.05), RANTES/CCL5 (9242 ± 1816 vs. 3128 ± 254 MFU; p < 0.05), and TNF RII (1684 ± 318 vs. 701 ± 127 MFU; p < 0.05). GM-CSF was modestly but significantly elevated by Facetem® at 1:100 in M2 macrophages (350 ± 4 vs. 310 ± 3 MFU; p < 0.05). In contrast, Facetem® and PLLA did not induce significant changes in pro-inflammatory cytokines (e.g., TNF-α, IL-1β, IFN-γ) in either macrophage polarisation state, consistent with a predominantly tissue-remodelling rather than pro-inflammatory immune interaction.

4. Discussion

This study provides a comprehensive, comparative in vitro characterisation of five injectable biostimulatory dermal fillers across four complementary biological dimensions: particle morphology and size, cytotoxicity, collagen gene expression, and macrophage cytokine secretion. To our knowledge, this is the first report to systematically integrate all four of these parameters for this specific panel of commercially available products.
Particle size and morphology are critical determinants of both the biological response and the clinical durability of injectable fillers. Particles in the range of 1–10 μm are readily phagocytosed by macrophages, potentially limiting their persistence and collagen-stimulatory lifespan, whereas particles larger than 20 μm generally evade phagocytosis and instead provoke a sustained foreign-body giant cell reaction conducive to fibroblast activation and collagen deposition [22,23,24]. Our data demonstrate that PDLLA had the smallest d(0.5) (24.9 μm) among the five products and the highest specific surface area, which may enhance initial fibroblast contact and early collagen induction but could also reduce long-term tissue persistence relative to larger-particle products. The narrow, homogeneous size distribution of PCL (Span = 0.612) is consistent with its engineered PCL formulation, which may contribute to a more predictable and sustained biological response [10]. PLLA’s broad distribution (Span = 1.617) reflects the less uniform PLLA manufacturing process and is consistent with previous reports in the literature [12]. Beyond particle size and morphology, the carrier/excipient system in which each particle type is suspended is also likely to contribute to the observed biological responses. Facetem® and PCL are both formulated in a carboxymethylcellulose (CMC) gel, whereas CaHA is suspended in an aqueous glycerin-based gel and PDLLA is embedded within a cross-linked hyaluronic acid matrix (Table 1). CMC and HA carriers differ in viscosity, water-retention capacity, and rate of in vivo clearance, and could therefore modulate the local residence time and effective concentration of the active particles at the injection site, independently of the particle material itself. Because this study did not include the carrier vehicles alone (i.e., without particulate material), the relative contribution of the carrier versus the particle to the biological signals reported here cannot be fully deconvoluted, and this should be regarded as a limitation of the current design (see Section 4, limitations, below). With respect to the particle material itself, PLLA and PCL are both slowly bioresorbable aliphatic polyesters that are thought to act principally as an inert physical scaffold that triggers a chronic, low-grade foreign-body response, with macrophages and fibroblasts progressively encapsulating and infiltrating the particles as they degrade by bulk hydrolysis over months to years [9,10,23]. This mechanism is consistent with the more gradual, sustained COL3A2 induction observed for PCL in the present study. PDLLA degrades considerably faster than PLLA or PCL owing to its amorphous, racemic structure, which may explain its more rapid and pronounced early COL1A1 response but a less consistent COL3A2 signal. These mechanistic hypotheses linking core particle chemistry, carrier composition, and the observed gene-expression and cytokine profiles warrant direct confirmation in future studies that isolate each variable independently.
All products demonstrated in vitro biocompatibility in the L929 fibroblast model, with cell viability consistently above 85%—the ISO 10993-5 threshold for cytotoxicity [16,21]. This finding is in agreement with prior regulatory and academic assessments of these product classes [7,9,25]. The apparent proliferative effect of PDLLA at 1–2 mg/mL is consistent with published evidence that hyaluronic acid promotes fibroblast proliferation and migration through CD44 and RHAMM receptor signalling [26,27]. The absence of cytotoxicity for Facetem® across all tested concentrations supports its favourable safety profile as a novel biostimulatory filler.
The collagen mRNA data demonstrate that all five products can stimulate COL1A1 expression, confirming their biostimulatory mechanism of action [17,18,28,29]. Notably, despite Facetem® and CaHA sharing identical calcium hydroxylapatite composition and excipient formulation, their differences in collagen-stimulating activity can be attributed to distinct particle morphological characteristics observed in SEM analysis, which may influence particle-cell surface interactions and subsequent biological responses. The relative magnitude of COL3A2 upregulation—particularly pronounced for Facetem® and PCL—is of clinical interest, as type III collagen is the predominant collagen of early wound healing and is subsequently remodelled to the more mechanically robust type I collagen [18,23]. A product that stimulates both collagen subtypes may therefore support a more comprehensive fibroproliferative response. The dissociation between COL1A1 and COL3A2 responses observed for PDLLA and CaHA suggests that the pathway(s) by which different filler materials activate fibroblast collagen synthesis are not uniform and may reflect differences in particle-cell contact, surface chemistry, or paracrine macrophage signalling [6,29,30]. It should be emphasised that collagen-stimulating activity was assessed exclusively at the transcript level; because mRNA abundance does not necessarily translate proportionally into secreted or matrix-deposited collagen protein, due to post-transcriptional regulation, translational efficiency, and protein degradation, the mRNA fold-changes reported here should be interpreted as an indication of fibroblast activation rather than as direct evidence of increased collagen protein synthesis or deposition. Confirmatory protein-level analyses (e.g., ELISA, Western blot, or hydroxyproline quantification of secreted collagen) are required before firm conclusions can be drawn regarding the comparative collagen-producing capacity of these products.
The cytokine array data support the favourable immunological profile of biostimulatory fillers as a class [31]. The absence of broad pro-inflammatory cytokine induction in M1 macrophages by any of the five products is reassuring and consistent with clinical observations of infrequent severe inflammatory reactions [3,4]. The significant elevation of several cytokines by PDLLA at high concentrations in M2 macrophages—including IL-6, G-CSF, and RANTES—warrants further investigation. While IL-6 can promote fibroblast activation and collagen synthesis in a paracrine manner [32], sustained or excessive IL-6 secretion has been associated with chronic inflammation and foreign-body reactions [22,24,33]. The clinical relevance of these in vitro findings at a 1:100 macrophage conditioned medium dilution requires careful contextualisation, as in vivo concentrations and the complex tissue milieu may modulate these responses considerably [34,35]. Facetem®’s overall macrophage cytokine profile was notably quiescent, suggesting that it is unlikely to elicit an exaggerated inflammatory response at the injection site. The marked elevation of IL-6 by PDLLA in M2 macrophages should, however, be interpreted with caution. IL-6 is a pleiotropic cytokine that can support fibroblast activation and matrix remodelling in physiological wound healing, but persistently elevated IL-6 has also been implicated in fibrotic foreign-body capsule formation and nodule development in the dermal filler literature. Because this signal was observed in an isolated in vitro macrophage assay at a single conditioned-medium dilution and time point, it cannot be determined from the present data alone whether this reflects a transient, self-limited pro-reparative signal or a sustained pro-fibrotic stimulus in vivo; the two possibilities have divergent clinical implications (respectively, enhanced collagen deposition versus increased risk of nodularity or delayed-onset inflammatory nodules) that cannot be distinguished without longitudinal in vivo or clinical safety data. We therefore present this finding as a hypothesis-generating signal warranting dedicated follow-up (e.g., time-course cytokine profiling and in vivo histological assessment) rather than as evidence of either a beneficial or an adverse clinical effect.
Several limitations of this study should be acknowledged. First, all experiments were conducted in vitro using established cell lines or polarised monocyte-derived macrophages, which may not fully recapitulate the complex multicellular interactions in the human dermis [34,36]. Second, the cytokine array employed an antibody-based detection format that quantifies relative rather than absolute cytokine concentrations; comparisons between analytes should therefore be made cautiously. Third, the mRNA expression analyses were performed at a single time point (48 h), which may not capture the full temporal kinetics of collagen gene induction [17]. Fourth, we did not assess the effects of the carrier materials in isolation from the particulate components, nor did we evaluate protein adsorption on filler particles, which could influence macrophage recognition and response [22]. Future studies should address these limitations by incorporating three-dimensional tissue models, longer-term co-culture systems, and in vivo validation in appropriate animal models. Fifth, cytotoxicity was assessed in a murine (L929) fibroblast line in accordance with ISO 10993-5, while collagen and cytokine endpoints were assessed in human-derived cells; interspecies differences in receptor biology could limit direct cross-referencing of the safety and efficacy datasets. Sixth, and more broadly, in vitro monoculture and cytokine-array systems cannot capture the dynamic, multicellular, and mechanically loaded environment of the human dermis, nor the years-long clinical timeframes over which biostimulatory fillers are intended to act; consequently, the relative rankings of the five products observed here should be regarded as mechanistic and hypothesis-generating rather than as predictive of comparative clinical longevity, aesthetic outcome, or adverse-event rates, and should be corroborated by long-term in vivo and clinical follow-up studies before influencing product selection in practice.

5. Conclusions

This comparative in vitro study demonstrates product-specific differences in the physicochemical and biological properties of five commercially available injectable biostimulatory dermal fillers. Facetem® exhibited a physicochemical profile similar to CaHA, demonstrated excellent in vitro biocompatibility, induced significant COL1A1 and COL3A2 mRNA upregulation, and displayed a quiescent macrophage cytokine profile. These data collectively support Facetem® as a biostimulatory filler with a favourable safety and efficacy profile that is at least comparable to established reference products. The differences identified among the five products in collagen subtype stimulation and macrophage cytokine modulation provide a mechanistic basis for clinically observed differences in duration, tissue quality, and tolerability, and may guide future formulation development and evidence-based product selection.

Author Contributions

Conceptualisation, S.M. and G.H.; methodology, S.M., G.H. and J.K.; formal analysis, S.M. and J.K.; data curation, J.K.; writing—original draft preparation, S.M.; writing—review and editing, S.M., G.H. and J.K.; supervision, S.M.; funding acquisition, S.M. All authors have read and agreed to the published version of the manuscript.

Funding

This research was funded by internal resources from CGBIO Co., Ltd. The funder had no role in study design, data collection, analysis, interpretation, writing of the report, or the decision to submit for publication.

Institutional Review Board Statement

Not applicable. This study did not involve human participants. L929 mouse fibroblasts (ATCC CCL-1) and THP-1 human monocytic cells (ATCC TIB-202) were obtained from the American Type Culture Collection (ATCC, Manassas, VA, USA). Human dermal fibroblasts (HDFs) were obtained commercially from Lonza (Basel, Switzerland).

Informed Consent Statement

Not applicable.

Data Availability Statement

The original contributions presented in this study are included in the article. Further inquiries can be directed to the corresponding author.

Acknowledgments

During the preparation of this manuscript, the authors used ChatGPT (GPT-4o, OpenAI) for the purpose of improving the English language and readability of the text. The authors have reviewed and edited the output and take full responsibility for the content of this publication.

Conflicts of Interest

The authors declare that this study received funding from CGBio Co. Ltd. The funder was not involved in the study design, collection, analysis, interpretation of data, the writing of this article, or the decision to submit it for publication. The funder did not affect the experimental process and results in the study. The funding relationship does not affect the scientific quality of the manuscript.

References

  1. American Society of Plastic Surgeons. 2022 Plastic Surgery Statistics Report; ASPS: Arlington Heights, IL, USA, 2023. [Google Scholar]
  2. Wollina, U.; Goldman, A. Fillers for the improvement in acne scars. Clin. Cosmet. Investig. Dermatol. 2015, 8, 493–499. [Google Scholar] [CrossRef] [Scilit] [PubMed]
  3. Sclafani, A.P.; Fagien, S. Treatment of injectable soft tissue filler complications. Dermatol. Surg. 2009, 35, 1672–1680. [Google Scholar] [CrossRef] [Scilit] [PubMed]
  4. De Boulle, K.; Heydenrych, I. Patient factors influencing dermal filler complications: Prevention, assessment, and treatment. Clin. Cosmet. Investig. Dermatol. 2015, 8, 205–214. [Google Scholar] [CrossRef] [Scilit] [PubMed]
  5. Shin, J.W.; Kwon, S.H.; Choi, J.Y.; Na, J.I.; Huh, C.H.; Choi, H.R.; Park, K.C. Molecular mechanisms of dermal aging and antiaging approaches. Int. J. Mol. Sci. 2019, 20, 2126. [Google Scholar] [CrossRef] [Scilit] [PubMed]
  6. Lemperle, G.; Morhenn, V.; Charrier, U. Human histology and persistence of various injectable filler substances for soft tissue augmentation. Aesthet. Plast. Surg. 2003, 27, 354–366. [Google Scholar] [CrossRef] [Scilit] [PubMed]
  7. Merz Aesthetics. Radiesse Injectable Implant Instructions for Use; Merz North America: Raleigh, NC, USA, 2020. [Google Scholar]
  8. Goldberg, D.J. Correction of tear trough deformity with novel porcine collagen dermal filler (Dermicol-P35). Aesthet. Surg. J. 2011, 31, 60S–64S. [Google Scholar] [CrossRef] [Scilit] [PubMed]
  9. Zhang, Y.; Zhang, X.; Gao, X.; Wei, Y.; Qian, W.; Sun, Z.; Ding, J.; Bao, S.; Ren, R.; Zhao, H. Efficacy and safety of poly-L-lactic acid for correction of midfacial volume loss and contour defects: A prospective, multicenter, randomized, parallel-controlled, evaluator-blinded, superiority trial. J. Cosmet. Dermatol. 2025, 24, e70230. [Google Scholar] [CrossRef] [Scilit] [PubMed]
  10. Kim, J.A.; Van Abel, D. Neocollagenesis in human tissue injected with a polycaprolactone-based dermal filler. J. Cosmet. Laser Ther. 2015, 17, 99–101. [Google Scholar] [CrossRef] [Scilit] [PubMed]
  11. McCarthy, A.D.; Hartmann, C.; Durkin, A.; Shahriar, S.; Khalifian, S.; Xie, J. A morphological analysis of calcium hydroxylapatite and poly-L-lactic acid biostimulator particles. Skin Res. Technol. 2024, 30, e13764. [Google Scholar] [CrossRef] [Scilit] [PubMed]
  12. Vleggaar, D.; Fitzgerald, R.; Lorenc, Z.P.; Andrews, J.T.; Butterwick, K.; Caruso, R.; Comstock, J.; Dhir, R.; Fabi, S.G.; Gorman, P. Consensus recommendations on the use of injectable poly-L-lactic acid for facial and nonfacial volumization. J. Drugs Dermatol. 2014, 13, s44–s51. [Google Scholar] [PubMed]
  13. Park, K.Y.; Kim, H.K.; Kim, B.J. Comparative study of hyaluronic acid fillers by in vitro and in vivo testing. J. Eur. Acad. Dermatol. Venereol. 2014, 28, 565–568. [Google Scholar] [CrossRef] [Scilit] [PubMed]
  14. De Boulle, K.; Glogau, R.; Kono, T.; Nathan, M.; Tezel, A.; Roca-Martinez, J.X.; Paliwal, S.; Stroumpoulis, D. A review of the metabolism of 1,4-butanediol diglycidyl ether–crosslinked hyaluronic acid dermal fillers. Dermatol. Surg. 2013, 39, 1758–1766. [Google Scholar] [CrossRef] [Scilit] [PubMed]
  15. Jordan, D.R.; Stoica, B. Filler migration: A number of mechanisms to consider. Ophthal. Plast. Reconstr. Surg. 2015, 31, 257–262. [Google Scholar] [CrossRef] [Scilit] [PubMed]
  16. ISO 10993-5:2009; Biological Evaluation of Medical Devices—Part 5: Tests for In Vitro Cytotoxicity. International Organization for Standardization: Geneva, Switzerland, 2009.
  17. Nowag, B.; Schäfer, D.; Hengl, T.; Corduff, N.; Goldie, K. Calcium hydroxylapatite microspheres activate fibroblasts through direct contact to stimulate neocollagenesis. J. Cosmet. Dermatol. 2023, 22, 426–432. [Google Scholar] [CrossRef] [Scilit] [PubMed]
  18. Nicolau, P.J.; Marijnissen-Hofsté, J. Neocollagenesis after injection of a polycaprolactone based dermal filler in a rabbit. Eur. J. Aesthet. Med. Dermatol. 2013, 3, 19–26. [Google Scholar] [CrossRef] [Scilit]
  19. Murray, P.J.; Allen, J.E.; Biswas, S.K.; Fisher, E.A.; Gilroy, D.W.; Goerdt, S.; Gordon, S.; Hamilton, J.A.; Ivashkiv, L.B.; Lawrence, T. Macrophage activation and polarization: Nomenclature and experimental guidelines. Immunity 2014, 41, 14–20. [Google Scholar] [CrossRef] [Scilit] [PubMed]
  20. Ginhoux, F.; Guilliams, M. Tissue-resident macrophage ontogeny and homeostasis. Immunity 2016, 44, 439–449. [Google Scholar] [CrossRef] [Scilit] [PubMed]
  21. Pantermehl, S.; Foth, A.; Meyer, E.; Barbeck, M.; Jung, O. In vitro cytocompatibility analysis and comparison of different hyaluronic acid fillers for minimally invasive esthetics. In Vivo 2024, 38, 1621–1635. [Google Scholar] [CrossRef] [Scilit] [PubMed]
  22. Anderson, J.M.; Rodriguez, A.; Chang, D.T. Foreign body reaction to biomaterials. Semin. Immunol. 2008, 20, 86–100. [Google Scholar] [CrossRef] [Scilit] [PubMed]
  23. Brissett, A.E.; Sherris, D.A. Scar contractures, hypertrophic scars, and keloids. Facial Plast. Surg. 2001, 17, 263–272. [Google Scholar] [CrossRef] [Scilit] [PubMed]
  24. Li, R.; Feng, D.; Han, S.; Zhai, X.; Yu, X.; Fu, Y.; Jin, F. Macrophages and fibroblasts in foreign body reactions: How mechanical cues drive cell functions? Mater. Today Bio 2023, 22, 100783. [Google Scholar] [CrossRef] [Scilit] [PubMed]
  25. Kunzler, C.; Hartmann, C.; Nowag, B.; Shah, R.; El-Banna, R.; Backfisch, S.; Schäfer, D.; Hengl, T.; Hagedorn, N. Comparison of physicochemical characteristics and biostimulatory functions in two calcium hydroxyapatite-based dermal fillers. J. Drugs Dermatol. 2023, 22, 910–916. [Google Scholar] [CrossRef] [PubMed]
  26. Gao, F.; Yang, C.X.; Mo, W.; Liu, Y.W.; He, Y.Q. Hyaluronan oligosaccharides are potential stimulators to angiogenesis via RHAMM mediated signal pathway in wound healing. Clin. Investig. Med. 2008, 31, E106–E116. [Google Scholar] [CrossRef] [Scilit] [PubMed]
  27. Toole, B.P. Hyaluronan: From extracellular glue to pericellular cue. Nat. Rev. Cancer 2004, 4, 528–539. [Google Scholar] [CrossRef] [Scilit] [PubMed]
  28. Zhu, Y.; Zhang, X.; Cao, C.; Zhu, T. Poly-L-lactic acid increases collagen gene expression and synthesis in cultured dermal fibroblast (Hs68) through the TGF-β/Smad pathway. J. Cosmet. Dermatol. 2023, 22, 1213–1219. [Google Scholar] [CrossRef] [Scilit] [PubMed]
  29. Oh, S.; Lee, J.H.; Kim, H.M.; Batsukh, S.; Sung, M.J.; Lim, T.H.; Lee, M.H.; Son, K.H.; Byun, K. Poly-L-lactic acid fillers improved dermal collagen synthesis by modulating M2 macrophage polarization in aged animal skin. Cells 2023, 12, 1320. [Google Scholar] [CrossRef] [Scilit] [PubMed]
  30. Vasconcelos, G.V.; Peres, L.C.; de Castro, C.A.P.; de Castro-Filice, L.S. Mechanistic aspects of collagen biostimulators: Calcium hydroxyapatite, poly-L-lactic acid and polycaprolactone—A review. Braz. J. Health Rev. 2025, 8, e84742. [Google Scholar] [CrossRef] [Scilit]
  31. Nowag, B.; Schäfer, D.; Hengl, T.; Corduff, N.; Goldie, K. Biostimulating fillers and induction of inflammatory pathways: A preclinical investigation of macrophage response to calcium hydroxylapatite (CaHA) and poly-L lactic acid (PLLA). J. Cosmet. Dermatol. 2024, 23, 99–106. [Google Scholar] [CrossRef] [Scilit] [PubMed]
  32. Dufour, A.M.; Alvarez, M.; Russo, B.; Chizzolini, C. Interleukin-6 and type-I collagen production by systemic sclerosis fibroblasts are differentially regulated by interleukin-17A in the presence of transforming growth factor-beta 1. Front. Immunol. 2018, 9, 1865. [Google Scholar] [CrossRef] [Scilit] [PubMed]
  33. Wang, H.; Wu, D.; Lo, C.; Liu, S.; Ji, Q.; Al-Attab, R.; Qiu, H. Foreign body granulomas reaction related to collagen stimulatory cosmetic fillers: A systematic review. J. Cosmet. Dermatol. 2025, 24, e70459. [Google Scholar] [CrossRef] [Scilit]
  34. Tran, C.; Carraux, P.; Micheels, P.; Kaya, G.; Salomon, D. In vivo bio-integration of three hyaluronic acid fillers in human skin: A histological study. Dermatology 2014, 228, 47–54. [Google Scholar] [CrossRef] [Scilit] [PubMed]
  35. Chen, L.; Arora, M.; Yarlagadda, M.; Oriss, T.B.; Krishnamoorthy, N.; Ray, A.; Ray, P. Distinct responses of lung and spleen dendritic cells to the TLR9 agonist CpG oligodeoxynucleotide. J. Immunol. 2006, 177, 2373–2383. [Google Scholar] [CrossRef] [Scilit] [PubMed]
  36. ten Brink, T.; Damanik, F.; Rotmans, J.I.; Moroni, L. Unraveling and harnessing the immune response at the cell–biomaterial interface for tissue engineering purposes. Adv. Healthc. Mater. 2024, 13, 2301939. [Google Scholar] [CrossRef] [Scilit] [PubMed]
Figure 1. Scanning electron microscopy (SEM) images of injectable dermal filler particles. (ae) Low-magnification (×100) and (fj) high-magnification (×300) SEM images of Facetem®, CaHA, PDLLA, PLLA, and PCL, respectively. A 300 μm (low magnification) or 100 μm (high magnification) scale bar is annotated in the bottom-right corner of each panel; absolute particle dimensions should be interpreted with reference to the corresponding magnification and scale bar rather than by visual comparison across panels alone.
Cosmetics 13 00188 g001
Figure 2. COL1A1 and COL3A2 mRNA expression in human dermal fibroblasts treated with injectable filler products. Panels (ae): relative COL1A1 mRNA expression normalised to GAPDH for Facetem®, PLLA, PDLLA, CaHA, and PCL, respectively, at 0, 1, 2, and 5 mg/mL. Panels (fj): corresponding COL3A2 mRNA expression. Data represent mean ± SE of three independent experiments. Statistical significance vs. untreated control (0 mg/mL): * p < 0.05; ** p < 0.01; *** p < 0.001 (one-way ANOVA with Tukey’s post hoc test).
Cosmetics 13 00188 g002
Table 1. Compositional and formulation characteristics of the five injectable dermal filler products evaluated in this study, compiled from manufacturer product information, instructions for use, and regulatory filings.
ProductManufacturer (Location)Particle/Active MaterialCarrier/Excipient SystemReported Polymer ConcentrationAdditional Active Agents
Facetem®CGBIO Co., Ltd. (Seoul, Republic of Korea)PDLLA microspheresCarboxymethylcellulose gelNot publicly disclosed by manufacturerNone reported
CaHAMerz Aesthetics (Frankfurt, Germany)Calcium hydroxylapatite (CaHA) microspheresAqueous gel (glycerin/carboxymethylcellulose)~30% (w/w) CaHA microspheres [7]None reported
PDLLAHana Pharm (Seoul, Republic of Korea)PDLLA particulate matrixCross-linked hyaluronic acidNot publicly disclosed by manufacturerHyaluronic acid (biostimulatory carrier)
PLLAGalderma (Lausanne, Switzerland)Poly-L-lactic acid (PLLA) microspheresLyophilised powder, reconstituted in sterile waterNot publicly disclosed by manufacturer [9,12]Carboxymethylcellulose, mannitol (excipients)
PCLSinclair Pharma (London, UK)Polycaprolactone (PCL) microspheresCarboxymethylcellulose gel~30% (w/w) PCL microspheres [10]None reported
Table 2. Particle size analysis of injectable dermal filler products measured by laser diffraction.
ProductParticle Size d(0.1) (μm)Particle Size d(0.5) (μm)Particle Size d(0.9) (μm)Vol. Weighted Mean (μm)UniformitySpanSpecific Surface Area (m2/kg)
Facetem®24.134.653.945.40.5080.863177.0
CaHA25.034.955.448.80.5790.873174.3
PDLLA13.324.942.426.10.3731.168701.4
PLLA16.951.410059.50.5601.617151.8
PCL28.238.451.839.40.1880.612140.2
d(0.1), d(0.5), d(0.9): particle diameters at the 10th, 50th, and 90th volume percentiles, respectively. Vol. Weighted Mean: volume-weighted mean diameter. Uniformity: absolute deviation relative to d(0.5). Span: (d(0.9) − d(0.1))/d(0.5). Specific Surface Area: surface area per unit volume.
Table 3. Cell viability (%) of L929 fibroblasts after exposure to injectable dermal filler products at concentrations of 0.1–5 mg/mL. Values are expressed as mean ± SD (n = 4).
ConcentrationFacetem® (%)PLLA (%)CaHA (%)PCL (%)PDLLA (%)
0.1 mg/mL94.6 ± 3.294.9 ± 3.795.6 ± 2.997.9 ± 3.499.1 ± 4.4
0.5 mg/mL92.4 ± 5.598.3 ± 1.797.1 ± 0.489.1 ± 6.1 *102.7 ± 3.6
1 mg/mL89.6 ± 6.887.0 ± 2.5 **90.4 ± 7.4 *89.1 ± 5.1 *120.7 ± 2.1 ***
2 mg/mL89.9 ± 7.694.6 ± 4.289.9 ± 6.8 *88.3 ± 8.3 *111.0 ± 3.4 **
5 mg/mL96.3 ± 4.488.2 ± 7.6 **91.6 ± 3.986.3 ± 4.8 **101.5 ± 2.6
Statistical significance determined by Dunnett’s test vs. untreated control. * p < 0.05; ** p < 0.01; *** p < 0.001. PDLLA was tested in an independent experiment with its own untreated control (mean OD = 1.430 ± 0.053). Values exceeding 100% indicate a stimulatory effect on cell proliferation.
Table 4. Cytokine array profiles (mean ± S.E., MFU) in M1- and M2-polarised macrophages treated with Facetem®, Sculptra, and Juvelook.
CytokineM1 MacrophageM2 Macrophage
VehicleFacetemSculptraJuvelookVehicleFacetemSculptraJuvelook
(n = 3)1:50 (n = 2)1:100 (n = 3)1:50 (n = 2)1:100 (n = 3)1:50 (n = 2)1:100 (n = 3)(n = 2)1:50 (n = 2)1:100 (n = 2)1:50 (n = 2)1:100 (n = 2)1:50 (n = 2)1:100 (n = 2)
BLC (CXCL13)155 ± 39132 ± 11167 ± 12175 ± 45139 ± 13183 ± 22194 ± 28222 ± 22204 ± 19224 ± 11236 ± 7189 ± 38180 ± 18168 ± 8
Eotaxin-1 (CCL11)224 ± 56281 ± 60216 ± 9264 ± 20226 ± 39194 ± 2237 ± 51199 ± 18233 ± 30212 ± 17217 ± 15199 ± 7171 ± 5259 ± 35
Eotaxin-2 (MPIF-2/CCL24)8253 ± 6735836 ± 636956 ± 5657435 ± 5846945 ± 13615323 ± 6056104 ± 17789934 ± 5997401 ± 2707578 ± 3317405 ± 1207565 ± 1935511 ± 2138125 ± 5031
G-CSF147 ± 11176 ± 2202 ± 13185 ± 16176 ± 12133 ± 6176 ± 14348 ± 90296 ± 36254 ± 53235 ± 4266 ± 36371 ± 276868 ± 695 *
GM-CSF59,942 ± 327858,269 ± 205369,080 ± 132268,956 ± 894965,318 ± 302439,493 ± 15,72057,419 ± 1387310 ± 3328 ± 20350 ± 4 *356 ± 11316 ± 13300 ± 02510 ± 1903
I-309 (TCA-3/CCL1)4625 ± 7954001 ± 1253263 ± 7033484 ± 2683410 ± 8753187 ± 10213566 ± 123526,876 ± 92219,196 ± 346117,654 ± 178210,310 ± 195612,338 ± 62413,671 ± 198145,787 ± 10,518
ICAM-1 (CD54)579 ± 80730 ± 13778 ± 125749 ± 138774 ± 44554 ± 95698 ± 1521982 ± 82519 ± 732139 ± 932004 ± 762415 ± 1042000 ± 691537 ± 187
IFN-γ66 ± 469 ± 1375 ± 574 ± 1097 ± 3664 ± 9104 ± 1582 ± 683 ± 1996 ± 985 ± 8105 ± 582 ± 4114 ± 11
IL-1α (IL-1F1)92 ± 891 ± 1396 ± 387 ± 1292 ± 694 ± 22126 ± 7124 ± 1115 ± 26146 ± 1154 ± 10135 ± 11125 ± 14153 ± 8
IL-1β (IL-1F2)66 ± 256 ± 267 ± 081 ± 166 ± 676 ± 1893 ± 12115 ± 3104 ± 1136 ± 9112 ± 12127 ± 1120 ± 4304 ± 147
IL-1ra (IL-1F3)64 ± 962 ± 1570 ± 377 ± 354 ± 347 ± 480 ± 8281 ± 98270 ± 40181 ± 0218 ± 38250 ± 23194 ± 41362 ± 54
IL-2162 ± 30111 ± 11120 ± 4109 ± 13153 ± 18121 ± 15191 ± 23174 ± 2138 ± 12139 ± 16179 ± 6174 ± 16160 ± 2228 ± 43
IL-4188 ± 19161 ± 21169 ± 17149 ± 11170 ± 12184 ± 2245 ± 47173 ± 3181 ± 6202 ± 8196 ± 8206 ± 12182 ± 27758 ± 424
IL-581 ± 686 ± 1893 ± 696 ± 1172 ± 288 ± 6151 ± 34123 ± 6131 ± 1132 ± 7135 ± 2140 ± 5148 ± 5194 ± 16 *
IL-6753 ± 101666 ± 45706 ± 26686 ± 104703 ± 23750 ± 185754 ± 592462 ± 5433845 ± 13433164 ± 2772826 ± 4573358 ± 11023166 ± 34150,866 ± 5526 *
IL-6sR231 ± 10249 ± 9275 ± 19269 ± 33266 ± 16257 ± 39270 ± 39432 ± 1813 ± 17791 ± 144787 ± 98890 ± 9608 ± 30615 ± 122
IL-7357 ± 45354 ± 25442 ± 11389 ± 49390 ± 16339 ± 10456 ± 45385 ± 12401 ± 28425 ± 14410 ± 5409 ± 15378 ± 34480 ± 17
IL-8 (CXCL8)62,507 ± 390364,051 ± 212271,461 ± 251469,071 ± 891765,882 ± 331561,474 ± 317063,140 ± 343057,690 ± 156659,946 ± 774768,659 ± 357468,466 ± 315568,401 ± 342658,483 ± 462861,294 ± 4848
IL-10390 ± 48372 ± 53433 ± 27365 ± 53373 ± 22376 ± 25448 ± 36830 ± 51910 ± 6602481 ± 1731414 ± 2612191 ± 2562204 ± 8915,616 ± 9995
IL-11252 ± 18262 ± 2316 ± 19287 ± 15282 ± 7221 ± 33264 ± 19253 ± 30302 ± 29295 ± 6286 ± 30269 ± 21228 ± 5323 ± 32
IL-12 p40194 ± 31194 ± 10229 ± 5242 ± 20232 ± 9181 ± 23210 ± 19193 ± 48190 ± 25179 ± 10182 ± 22144 ± 6147 ± 29162 ± 26
IL-12 p70266 ± 38246 ± 37231 ± 4235 ± 33234 ± 17250 ± 7328 ± 30259 ± 15277 ± 20330 ± 27311 ± 2322 ± 3282 ± 10290 ± 30
IL-1378 ± 1870 ± 2298 ± 1274 ± 1566 ± 878 ± 9121 ± 2893 ± 18144 ± 48120 ± 14150 ± 0126 ± 3136 ± 16178 ± 2
IL-1556 ± 939 ± 949 ± 151 ± 843 ± 238 ± 175 ± 1873 ± 1566 ± 357 ± 1161 ± 1063 ± 1282 ± 178 ± 9
IL-1695 ± 593 ± 394 ± 1064 ± 1973 ± 1159 ± 25117 ± 1293 ± 12133 ± 23166 ± 5192 ± 3171 ± 8178 ± 14118 ± 12
IL-17A75 ± 1580 ± 086 ± 158 ± 055 ± 746 ± 1683 ± 1566 ± 380 ± 2381 ± 676 ± 365 ± 176 ± 2111 ± 14
MCP-1 (CCL2)3194 ± 5554260 ± 4154743 ± 1983954 ± 1953350 ± 2891331 ± 11892298 ± 77757,632 ± 121860,133 ± 765268,760 ± 360368,618 ± 325268,443 ± 337258,512 ± 461461,322 ± 4841
M-CSF39 ± 148 ± 1341 ± 343 ± 1630 ± 537 ± 1769 ± 148734 ± 16659842 ± 338611,101 ± 86313,196 ± 165715,664 ± 146814,290 ± 171314,659 ± 283
MIG (CXCL9)34 ± 937 ± 1627 ± 827 ± 123 ± 324 ± 542 ± 535 ± 840 ± 927 ± 242 ± 532 ± 433 ± 557 ± 22
MIP-1α (CCL3)9906 ± 4348561 ± 14010,733 ± 7059956 ± 9289325 ± 7023504 ± 2745 *8524 ± 92815,218 ± 89615,490 ± 368619,565 ± 313517,556 ± 24117,947 ± 153017,997 ± 302823,667 ± 3059
MIP-1β (CCL4)2929 ± 2283020 ± 4453215 ± 3052778 ± 562745 ± 3341277 ± 7102425 ± 57045,408 ± 57743,276 ± 548649,134 ± 462238,982 ± 165740,833 ± 102141,328 ± 536834,061 ± 11,505
MIP-1δ (CCL15)52 ± 852 ± 2363 ± 770 ± 1351 ± 442 ± 071 ± 363 ± 1155 ± 1469 ± 560 ± 662 ± 961 ± 161 ± 2
PDGF-BB97 ± 1488 ± 298 ± 487 ± 1087 ± 575 ± 1118 ± 14144 ± 4138 ± 29150 ± 14157 ± 15143 ± 6131 ± 4145 ± 17
RANTES (CCL5)251 ± 19215 ± 6234 ± 5183 ± 21209 ± 9100 ± 47227 ± 553128 ± 2542230 ± 3342952 ± 532651 ± 1042502 ± 2042956 ± 7279242 ± 1816 *
TIMP-11209 ± 1491219 ± 2851716 ± 1611518 ± 91385 ± 151503 ± 293730 ± 13511,934 ± 93614,718 ± 124412,782 ± 235017,767 ± 136216,350 ± 136414,837 ± 26918,208 ± 1231
TIMP-2261 ± 41246 ± 0281 ± 20260 ± 23245 ± 29100 ± 60260 ± 69699 ± 47839 ± 221103 ± 331125 ± 71170 ± 300695 ± 162317 ± 142
TNF-α206 ± 10206 ± 3210 ± 10185 ± 15184 ± 22124 ± 47256 ± 27220 ± 18209 ± 14204 ± 19199 ± 21222 ± 17236 ± 5921,619 ± 19,844
TNF-β (TNFSF1B)190 ± 18165 ± 16213 ± 23189 ± 25184 ± 2070 ± 70186 ± 18170 ± 13159 ± 7165 ± 2175 ± 4165 ± 5168 ± 20226 ± 60
TNF RI (TNFRSF1A)31 ± 922 ± 1531 ± 526 ± 637 ± 1014 ± 1434 ± 779 ± 671 ± 1363 ± 373 ± 186 ± 748 ± 659 ± 34
TNF RII (TNFRSF1B)55 ± 1341 ± 553 ± 077 ± 1863 ± 78 ± 852 ± 17701 ± 127648 ± 4794 ± 54611 ± 55721 ± 114528 ± 151684 ± 318 *
Data are presented as mean ± S.E. (MFU, mean fluorescence unit). Statistical analysis was performed by one-way ANOVA with Tukey’s post hoc test. * p < 0.05 vs. the corresponding vehicle control.
Disclaimer/Publisher’s Note: The statements, opinions and data contained in all publications are solely those of the individual author(s) and contributor(s) and not of MDPI and/or the editor(s). MDPI and/or the editor(s) disclaim responsibility for any injury to people or property resulting from any ideas, methods, instructions or products referred to in the content.