Article

Growth Phenology of Tubers and Accumulation of Metabolite Compounds on Two Accessions of Jicama (Pachyrhizus erosus L.)


by
Fetti Andriyani Kurniya Ningsih
1,
Yulia Rahmah
2,
Youngkwan Cho
2 and
Ani Kurniawati
1,*
1
Department of Agronomy and Horticulture, Faculty of Agriculture, Bogor Agricultural University, IPB Dramaga Bogor Campus, Bogor 16602, Indonesia
2
Research and Innovation (R&I) Center, PT Cosmax Indonesia, Cilandak 12560, Indonesia
*
Author to whom correspondence should be addressed.
Cosmetics 2026, 13(3), 108; https://doi.org/10.3390/cosmetics13030108
Submission received: 2 February 2026 / Revised: 26 February 2026 / Accepted: 11 March 2026 / Published: 30 April 2026
(This article belongs to the Special Issue Advanced Cosmetic Sciences: Sustainability in Materials and Processes)

Abstract

Jicama (Pachyrhizus erosus L.) is a tropical tuber crop that has potential not only as a food source but also as a natural active ingredient in the cosmetics industry. This study aims to evaluate the phenology of tuber development and the content of primary and secondary metabolites of two jicama accessions (Bogor and Kebumen) at three tuber ages (3, 4, and 5 months). The parameters observed included tuber weight, starch yield, total soluble solids (TSS), total titratable acidity (TTA), vitamin C, total phenols, total flavonoids, and antioxidant activity (% inhibition). For data analysis, we used the T-test to compare differences between accessions. The results showed that tuber weight and starch yield increased significantly up to 5 months of age, while secondary metabolite content (phenols, flavonoids, antioxidant activity) was higher in young tubers (3–4 months). This study shows a trade-off between productivity (starch and vitamin C) and bioactive metabolite content (phenols, flavonoids, antioxidants) as the tubers age. The Bogor accession has a more stable vitamin C content, phenol levels, and antioxidant activity, while the Kebumen accession shows higher flavonoid levels in young tubers. The optimal tuber age and accession recommended to obtain a balance between productivity and secondary metabolite content is the Bogor accession at 4 months of age. This supports the potential use of jicama in the cosmetics industry as a brightening agent (vitamin C), humectant (sugar), anti-aging agent (phenols, flavonoids), and base ingredient for natural starch-based formulations. This study provides the first integrated evaluation of tuber phenology, primary metabolites, and secondary metabolite dynamics of two Indonesian jicama accessions in relation to cosmetic functionality. The results highlight a clear trade-off between productivity and bioactive compound accumulation, offering a scientific basis for selecting optimal harvest age and accession for cosmetic raw materials This study provides the first integrated evaluation of tuber phenology, primary metabolites, and secondary metabolite dynamics of two Indonesian jicama accessions in relation to cosmetic functionality. The results highlight a clear trade-off between productivity and bioactive compound accumulation, offering a scientific basis for selecting the optimal harvest age and accession for cosmetic raw materials.

1. Introduction

The cosmetics industry in Indonesia experienced an increase in revenue of around 48% in the period 2021–2024 and is projected to continue to increase until 2028 with an average growth rate of 5.35% per year [1]. This development is still accompanied by a high dependence on raw materials, with 60–80% of production needs still being sourced from imports [2]. This condition increases production costs and limits the competitiveness and independence of the national cosmetics industry. In line with this, consumer demand for natural cosmetic products continues to increase from year to year [3].
Pachyrhizus erosus (L.) Urban, commonly known as jicama, is a tuberous legume belonging to the family Fabaceae [4]. In Indonesia, this plant is widely known by the name “bengkuang” and is traditionally consumed as fresh food as well as used as a natural skin care ingredient. Pachyrhizus erosus is native to Central America and Mexico and was introduced to Indonesia in the 17th century. At present, bengkuang is widely cultivated in various tropical regions of Indonesia [5]. In addition to its use as a food crop with a productivity of up to 35 tons ha−1 [6,7,8], bengkuang has long been utilized as a traditional cosmetic ingredient in Indonesia [9].
The main usable part of the plant is its tuberous root, which functions as a storage organ [4] and is valued for its high content of starch, vitamin C, sugars, and various bioactive compounds [10,11]. These compounds play an important role in cosmetic formulations, including vitamin C as a brightening agent, phenolic compounds and flavonoids as antioxidants and anti-aging agents, sugar as a humectant, and starch as a binder and filler [12,13,14]. The multifunctional nature of these compounds highlights the potential of jicama tubers as a sustainable and locally sourced raw material for cosmetic products. Moreover, the effectiveness of these compounds in cosmetic applications is strongly influenced by their concentration, which is closely associated with tuber developmental stage and genetic background [15].
The content and quality of bioactive compounds in jicama are influenced by genetic factors and the phenology of tuber development [16]. As the tuber ages, the starch and vitamin C content tends to increase, while secondary metabolites generally decrease due to the shift in metabolite allocation towards the enlargement of storage organs [17,18]. Accessions have also been reported to significantly influence the accumulation patterns of bioactive compounds [19,20].
Although bengkuang has long been utilized as a traditional cosmetic ingredient, scientific studies integrating tuber developmental stages and accession differences in relation to metabolite accumulation remain limited. Understanding these factors is essential for optimizing harvest age and accession selection for cosmetic applications [21]. Previous studies on jicama in China have demonstrated the dynamics of phytohormones during tuber development; these studies primarily focus on hormone profiling at specific stages, without examining other hormones, environmental factors, or functional gene validation [22]. Therefore, this study aims to analyze the phenology of tuber development, productivity, and the content of primary and secondary metabolites in jicama accessions (Bogor and Kebumen) at various harvest ages as a scientific basis for the development of jicama as a value-added and sustainable local cosmetic raw material [23].

2. Materials and Methods

2.1. Time, Site and Experimental Design

This research was conducted from December 2023 to September 2024. Planting was carried out at the Cikabayan Atas Experimental Farm, Dramaga District, Bogor Regency, West Java, Indonesia, in January–June 2024. Plant biomass observation and postharvest analysis were conducted at the Postharvest Laboratory of the Department of Agronomy and Horticulture of IPB in June–July 2024. Phytochemical analysis of tubers, phenol compounds, flavonoids, and antioxidant activity was carried out at the Laboratory of the Center for Biopharmaca Studies of IPB, Bogor city, West Java, Indonesia, in August–September 2024. This study was arranged based on the Split Plot Complete Randomized Group design (Split Plot-CRGd), with accession as the subplot factor and tuber age as the main plot factor.

2.2. Material and Plant Management

The plant material used in this study was jicama seeds from the Bogor (West Java) and Kebumen (Central Java) Indonesia accessions. Other materials used were dolomite, insecticide (carbofuran), cow manure, NPK 16:16:16 fertilizer, NaOH solution, iodine, amylum indicator, and phenolphthalein indicator. The equipment used consisted of agricultural cultivation and harvesting tools. Postharvest handling and laboratory equipment such as scales, a Sanyo MOV-112 oven (Sanyo Electric Co., Ltd., Osaka, Japan), Ohaus MB25 moisture analyzers (Ohaus Corporation, Parsippany, NJ, USA), an Atago PAL-1 refractometer (Atago Co., Ltd., Tokyo, Japan), laboratory equipment for titration, an Epoch ELISA reader biotech (BioTek Instruments, Inc., Winooski, VT, USA), and a UV-Vis spectrophotometer (Agilent BioTek, Inc., Santa Clara, CA, USA) were used to analyze the phenol, flavonoid, and antioxidant content.
The jicama tested were Bogor and Kebumen accessions that were planted with seeds and harvested gradually at 3, 4, and 5 months after planting. For each accession at each tuber age (3, 4, and 5 months), three tuber samples were collected from each replication for analysis. The observation parameters included tuber weight, starch yield, total soluble solids (TSS), vitamin C, total titratable acid (TTA) for primary metabolites analysis, and total phenols, total flavonoids, and antioxidant activity for secondary metabolites analysis.

2.3. Sample Preparation

Jicama tubers used for tuber weight, starch content, total titratable acidity (TTA), total soluble solids (TSS), and vitamin C were analyzed in a fresh state. Tubers were harvested, cleaned to remove adhering soil, transported to the laboratory, and immediately weighed. Fresh tuber samples were then processed according to the requirements of each respective analysis.
In contrast, tubers used for secondary metabolite analysis were prepared in the form of dried simplicia. Fresh tubers were sliced into 1–2 mm thickness and air-dried for 12 h, followed by oven drying at 60 °C for 48 h [24] in the Postharvest Laboratory of IPB University. The dried tubers were subsequently ground into a fine powder and transported to the laboratory for further secondary metabolite analysis.

2.4. Tuber Weight and Starch Yield (%)

Tuber weight (g plant−1) was determined by weighing the fresh (wet) tubers harvested from each sampled plant. Starch content was measured by extracting starch from tuber samples following precipitation of the starch from the juice of jicama, which was then dried in an oven at 60 °C for 48 h. The dried starch was weighed to determine starch content per tuber sample, following the method described by [24].

2.5. Total Soluble Solids

The total soluble solids (TSS) of the tuber juice were measured using an Atago PAL-1 digital refractometer and expressed as Brix (°Bx). The measurement was performed by crushing the tuber, followed by blending and filtering the resulting mixture through a filter cloth to obtain the tuber juice. The juice was then dripped onto the refractometer lens to determine the TSS value, which reflects the sweetness level of the tuber.

2.6. Vitamin C

Vitamin C content was analyzed using the 0.01 N iodine titration method with amylum solution as the indicator. For this, 10 g of jicama tuber was mashed. After that, it was filtered and rinsed with distilled water to release the juice of the tuber. The juice was put into a measuring flask and measured to 100 mL. From the solution in the measuring flask, as much as 10 mL of solution was taken and put into an Erlenmeyer flask and three drops of amylum indicator were added, then titrated with 0.01 N iodine solution. Titration was carried out until it produced a stable dark blue color. The equivalent weight (BE) value of vitamin C refers to the ascorbic acid value of 0.88 [25]. Vitamin C measurements were calculated using standard titrimetry [26] based on the AOAC [27] official method 967.21 ascorbic acid (AOAC) using the following formula:
Vit C (mg/100 g sample) = (mL Iodine × 0.01 N × BE × fp)/(Sample (g)) × 100%
where
  • fp = dilution factor (100 mL/10 mL).
  • BE = ascorbic acid equivalent = 0.88.
  • mL Iodine = mL iodine final − mL iodine initial.

2.7. Total Titratable Acid

Total titratable acidity (TTA) was determined using a NaOH titration method with phenolphthalein (PP) as an indicator. Approximately 10 g of fresh jicama tubers was mashed, filtered, and rinsed with distilled water to extract the juice. The filtrate was transferred into a volumetric flask and diluted to a final volume of 100 mL with distilled water. An aliquot of 10 mL of the extract was then transferred into an Erlenmeyer flask, and three drops of phenolphthalein indicator were added. The solution was titrated with 0.1 N NaOH until a persistent pale pink color appeared. Jicama tubers contain ascorbic acid and folic acid [28]. The ascorbic acid content in jicama tubers is 20 mg in 100 g tubers [29]. The equivalent weight (BE) used in the calculation of total titratable acid (TTA) of pomelo tubers is 64. The calculation of TTA content of jicama tubers was calculated based on the formula of Sadler and Murphy [30] as follows:
TTA (%) = (mL NaOH × N NaOH × fp × BE)/(Bobot sample (g) × 10,000) × 100%
where
  • BE = Equivalent weight.
  • fp = Dilution factor = 10.
  • mL NaOH = mL NaOH final − mL NaOH initial.

2.8. Total Phenol Analysis

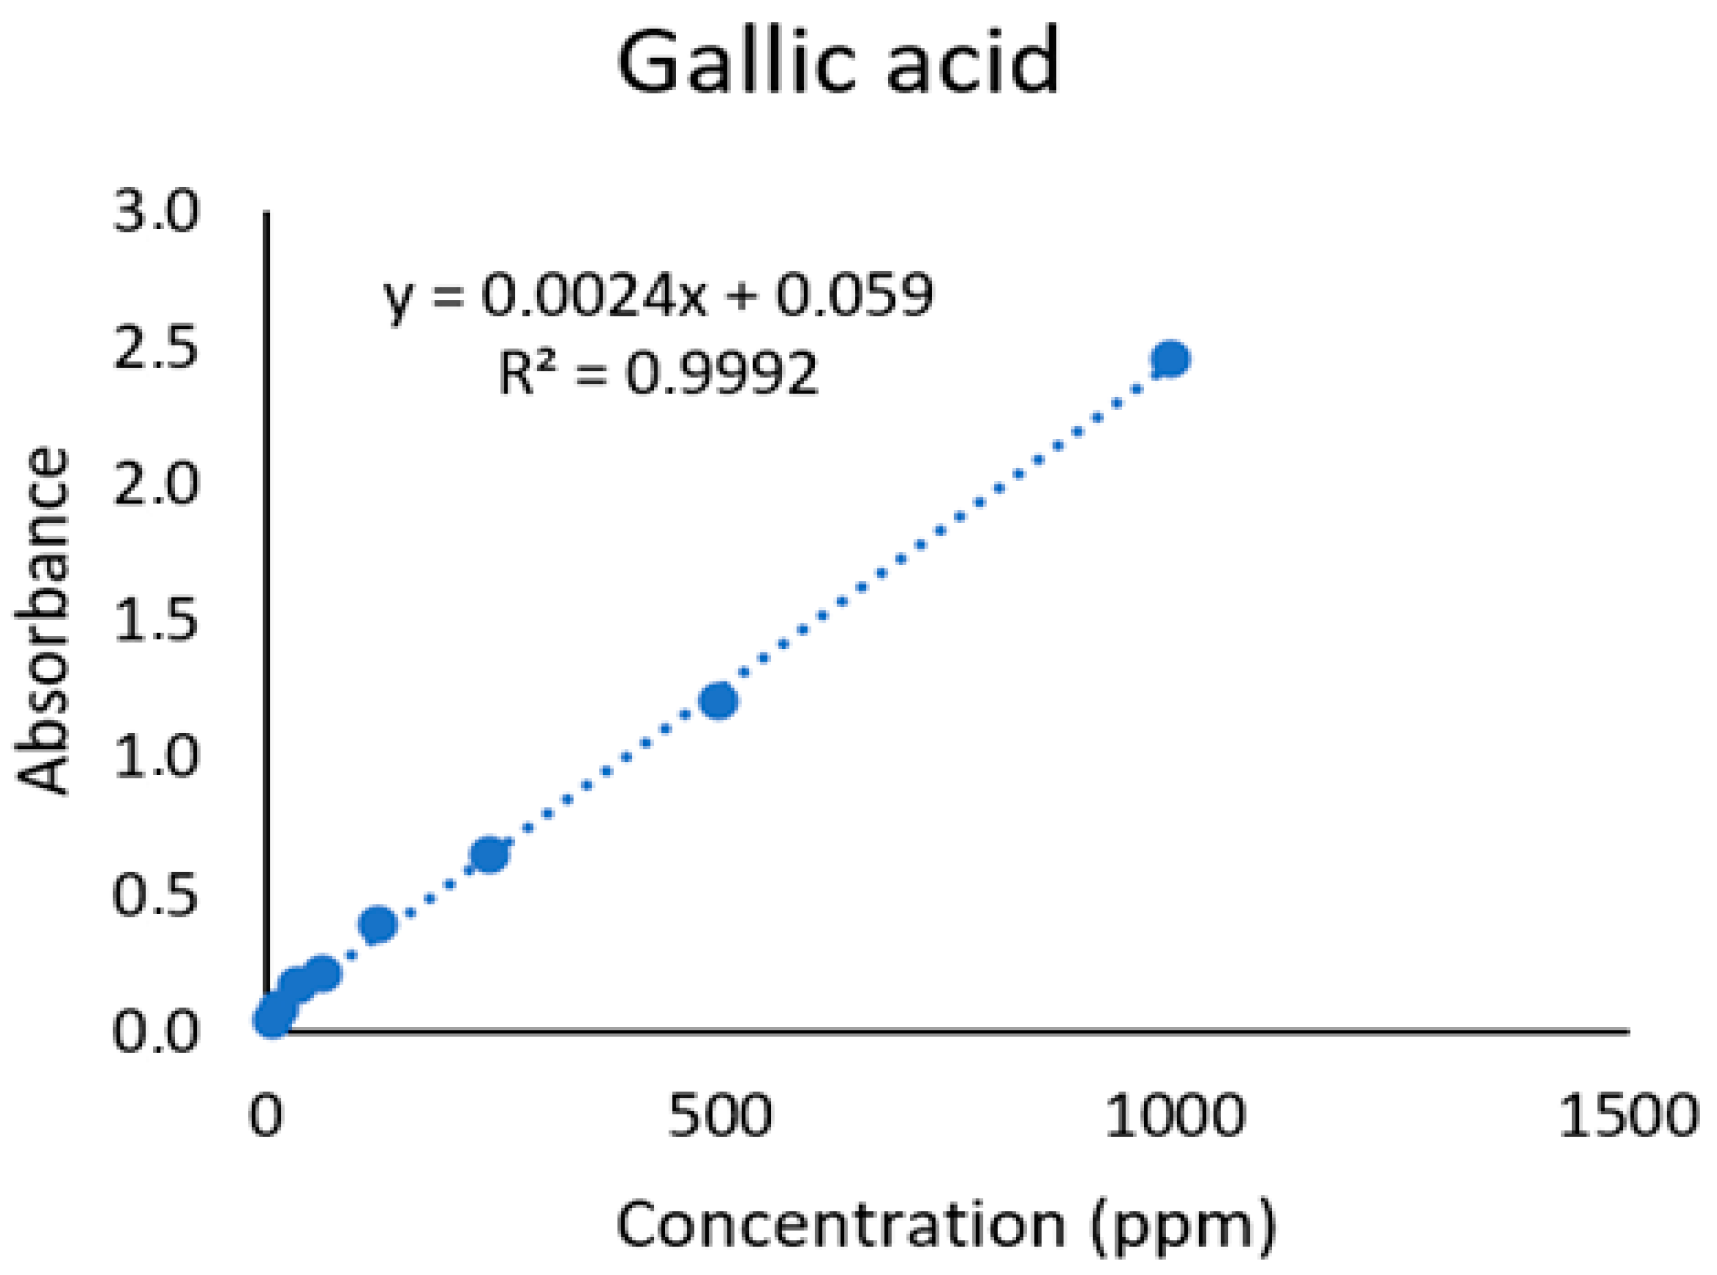
Total phenolic content was determined using the Folin–Ciocalteu method [31]. A 7.5% Folin–Ciocalteu reagent was prepared by diluting 7.5 mL of the reagent with distilled water to 100 mL, and a 0.1% NaOH solution was prepared by dissolving 1 g of NaOH in 100 mL of distilled water. Gallic acid was used as a standard, with a 500 ppm stock solution prepared by dissolving 12.5 mg of gallic acid in methanol, from which standard solutions of 0, 10, 30, 50, 70, and 100 ppm were prepared. For each standard, 1 mL was mixed with 5 mL of Folin–Ciocalteu reagent, vortexed, and incubated in the dark for 8 min, followed by the addition of 4 mL of NaOH, vortexing, and incubation in the dark for 1 h. Absorbance was measured at 730 nm using a spectrophotometer, and a calibration curve was constructed using the resulting absorbance values, yielding the regression equation (Figure 1) y = 0.0024x + 0.059 (R2 = 0.9992). For the samples, 10 mg of extract was dissolved in 5 mL of methanol, and 1 mL of the solution was treated following the same procedure as the standards. Absorbance was measured at 730 nm, and total phenolic content was calculated using the gallic acid calibration curve.

2.9. Total Flavonoid Analysis

Total flavonoid content was determined quantitatively using a colorimetric method and measured using visible spectrophotometry, following the protocol of [32], with absorbance readings taken at 730 nm. Flavonoid content was determined by preparing reagents, stock solutions, blanks, and sample solutions and performing spectrophotometric measurements. The reagents included 0.5% (w/v) hexamethylenetetramine (HMT), 25% HCl, 5% (v/v) glacial acetic acid in methanol, and 2% AlCl3 in glacial acetic acid.
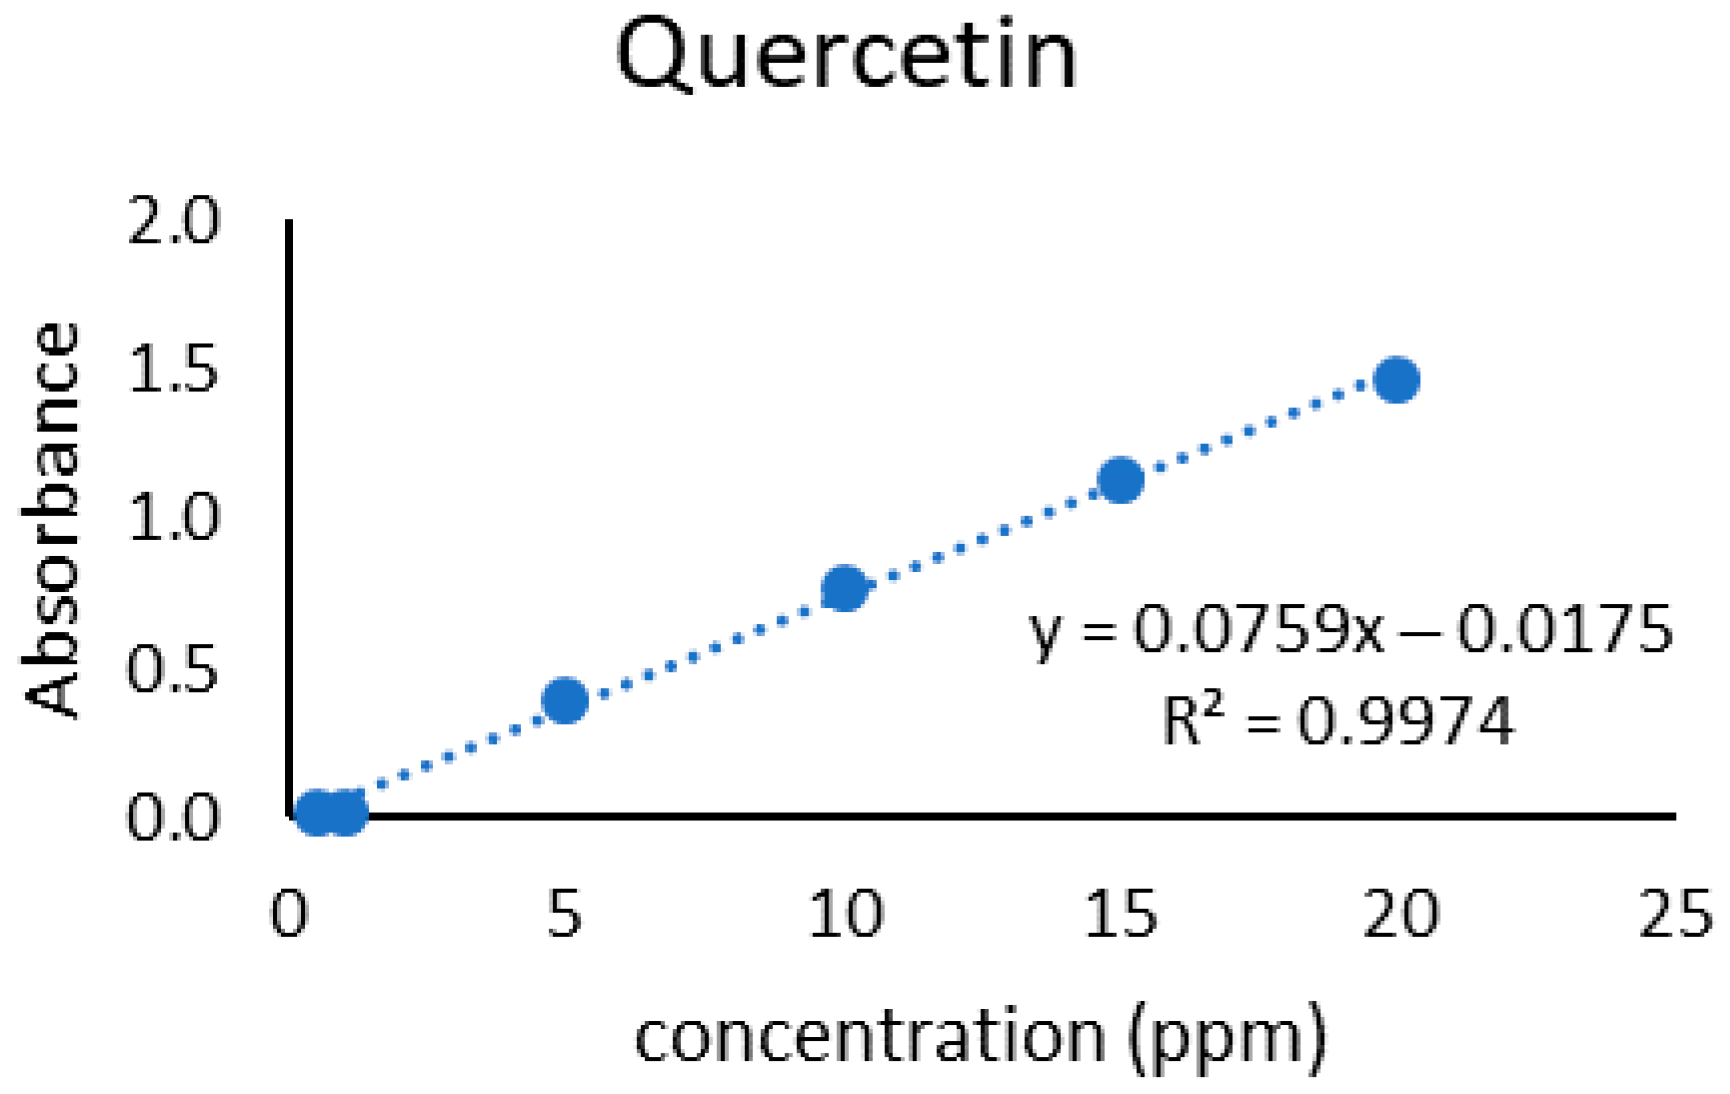
For the stock solution, an equivalent amount of simplicia was placed in a round-bottom flask, combined with 1 mL HMT, 20 mL acetone, and 2 mL HCl, and hydrolyzed by refluxing for 30 min. The mixture was filtered through cotton, and the filtrate was transferred to a 100 mL volumetric flask. The residue was re-extracted with 20 mL of acetone for 30 min, filtered, and the filtrates were combined to 100 mL with acetone. From this solution, 20 mL of filtrate was transferred to a separatory funnel, mixed with 20 mL of water, and extracted three times with 15 mL of ethyl acetate; the combined ethyl acetate fractions were adjusted to 50 mL in a volumetric flask. The blank solution was prepared by mixing 10 mL of the stock solution with glacial acetic acid to a final volume of 25 mL. The sample solution was prepared by mixing 10 mL of the stock solution with 1 mL of AlCl3 and diluting with glacial acetic acid to 25 mL. Measurements were performed 30 min after the addition of AlCl3 using a spectrophotometer at 425 nm, with quercetin used as the reference standard. A quercetin calibration curve was constructed, yielding the regression equation (Figure 2) y = 0.0759x − 0.0175 (R2 = 0.9974), which was used to calculate total flavonoid content. Results were expressed as mg quercetin equivalents per gram of dry extract (mg QE/g DE).

2.10. Antioxidant Activity Analysis

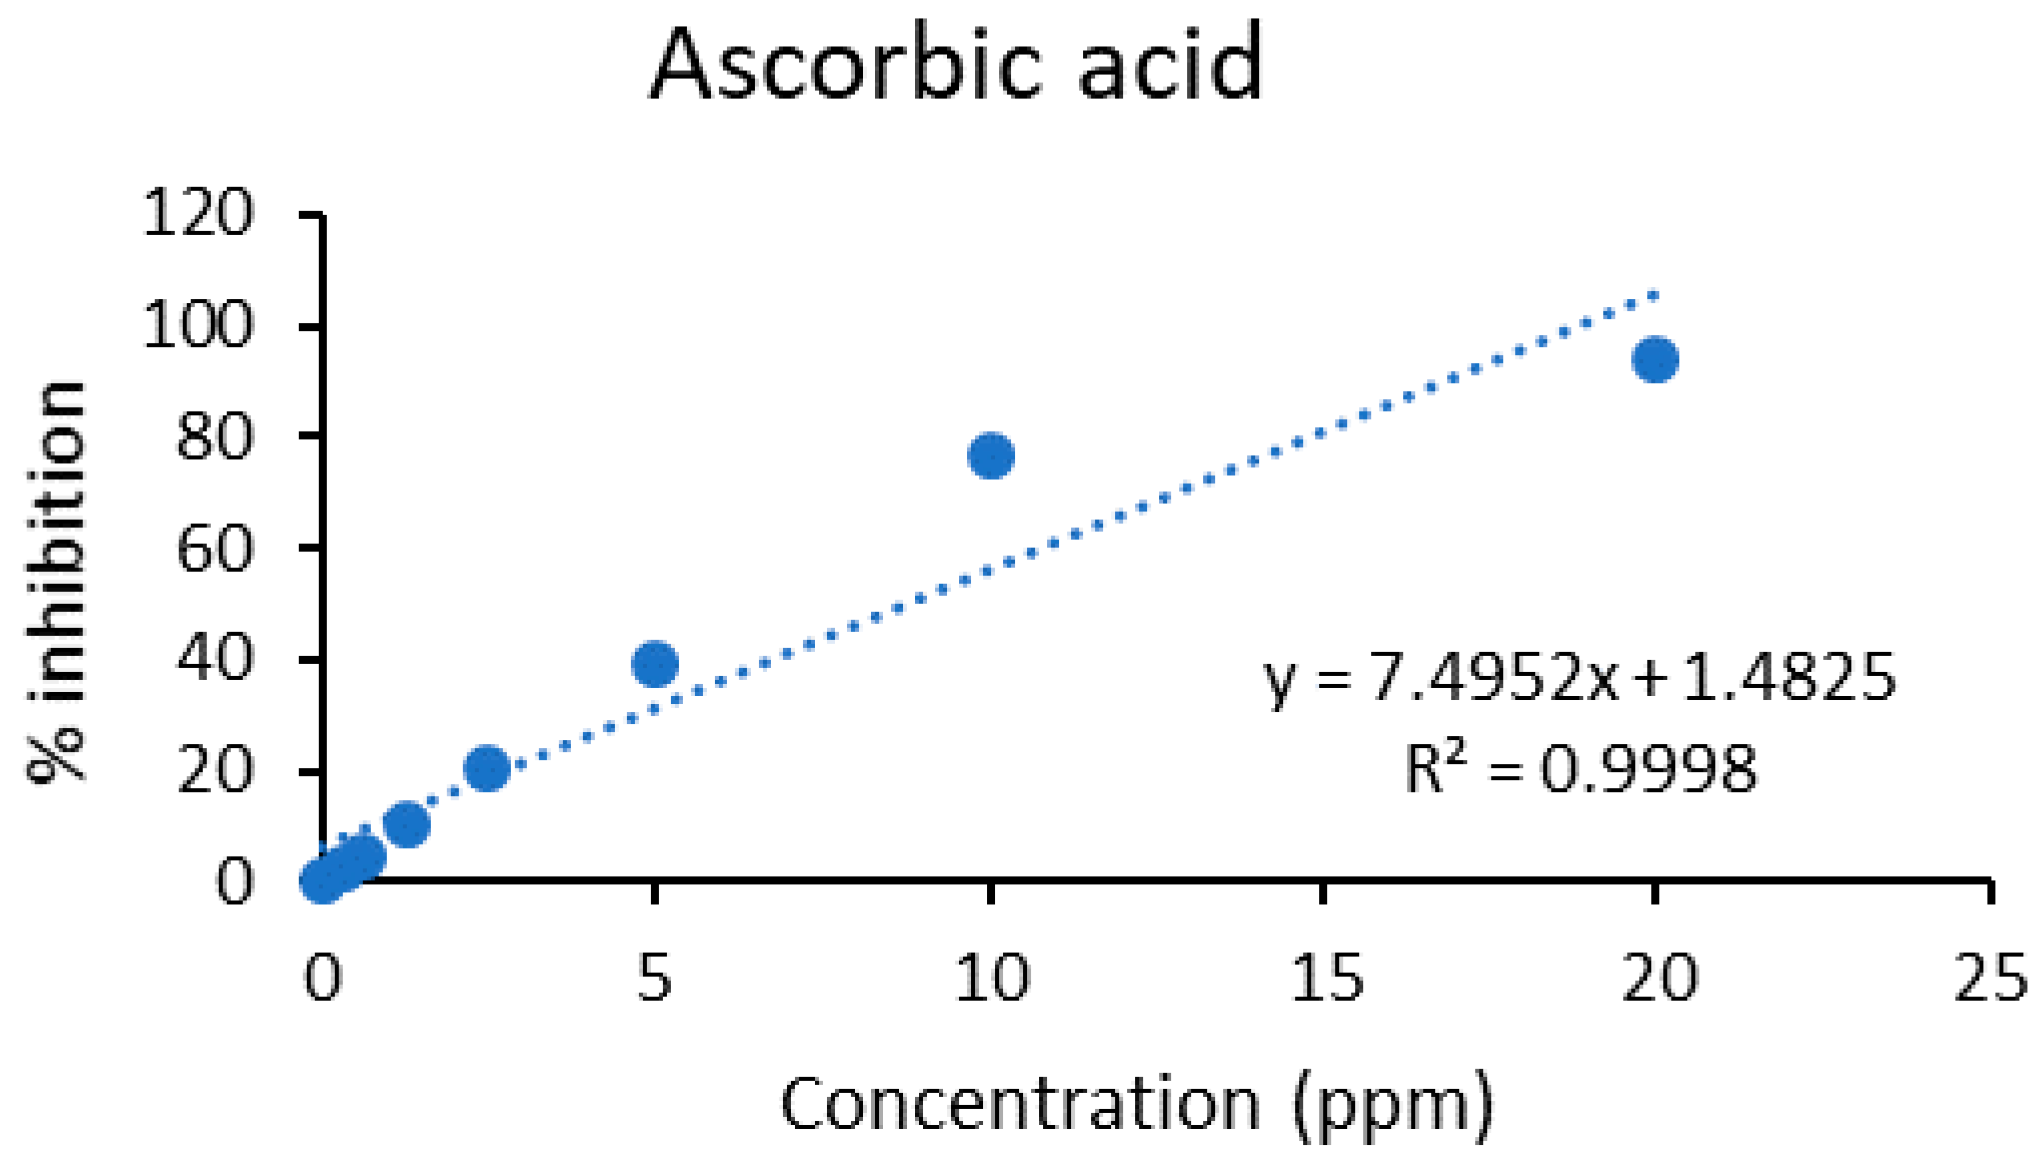
Antioxidant activity was evaluated using a DPPH radical scavenging assay [33]. A 125 µM DPPH stock solution was prepared by dissolving 2.5 mg of DPPH in analytical-grade ethanol and adjusting the volume to 50 mL in a volumetric flask; the solution was transferred to a vial, wrapped in aluminum foil, and stored until use. Extract and vitamin C samples were each weighed (10 mg), dissolved in 1 mL of DMSO, sonicated until fully dissolved, and vortexed; the solutions were then diluted to the desired concentrations. For measurement, 40 µL of sample or control solution was added to each well of a microplate (including replicates 1, 2, etc., and negative controls). For the sample wells, 250 µL of DPPH solution was added, whereas negative controls received 250 µL of ethanol. The plate was incubated at room temperature in the dark for 30 min, and absorbance was measured at 517 nm using an ELISA reader. Blanks for the sample replicates consisted of 40 µL ethanol plus 250 µL DPPH, while negative control blanks contained 290 µL ethanol only. Antioxidant activity was determined using the DPPH spectrophotometric method with ascorbic acid as the reference standard. Tubers harvested at 3 and 4 months were tested at concentrations of 937.5, 1875, 3740, 7500, 15,000, and 30,000 ppm using a preliminary compound screening approach to determine the IC50 value. Tubers harvested at 5 months were analyzed at concentrations of 6.25, 12.5, 25, 50, 100, and 200 ppm. A standard curve of ascorbic acid was constructed, yielding the regression equation (Figure 3) y = 7.4952x + 1.4825 (R2 = 0.9998), which was used to calculate antioxidant activity and IC50 values.

2.11. Data Analysis

Data analysis was collected using Microsoft excel 2024 and performed using SAS OnDemand on version 9.4 (Asia Pacific 2) for Academics, employing a t-test to compare parameter values between the two accessions at each tuber age separately, with a significance level of 5% (p < 0.05).

3. Results

3.1. Tuber Growth and Production

Tuber growth in jicama plants consists of the tuber initiation, tuber enlargement, and tuber maturation phases. Tuber initiation begins after the maximum vegetative phase, which is marked by the differentiation of plant roots into storage structures [15]. This phase generally occurs when the plant is 6–12 weeks old. Photosynthates produced by the plant begin to be allocated to the roots for tuber formation. Environmental conditions such as nutrient availability, water, and light determine the success of tuber formation at this stage. The tuber enlargement phase begins at 10–12 weeks after planting. In this phase, the jicama tuber functions as the main sink that receives photosynthetic products and stores them in the form of starch. Optimal tuber growth occurs during the tuber maturation phase. This phase generally begins when the plant reaches 4 months, marked by a decline in the plant’s vegetative growth. Jicama tubers begin to reach their maximum size when they reach 5 months and have more optimal starch, fiber, and vitamin C contents, so that at this stage the tubers are ready for harvest [14]. However, the older the tubers are, the harder they become due to an increase in starch content and a decrease in water content in the tubers [34].
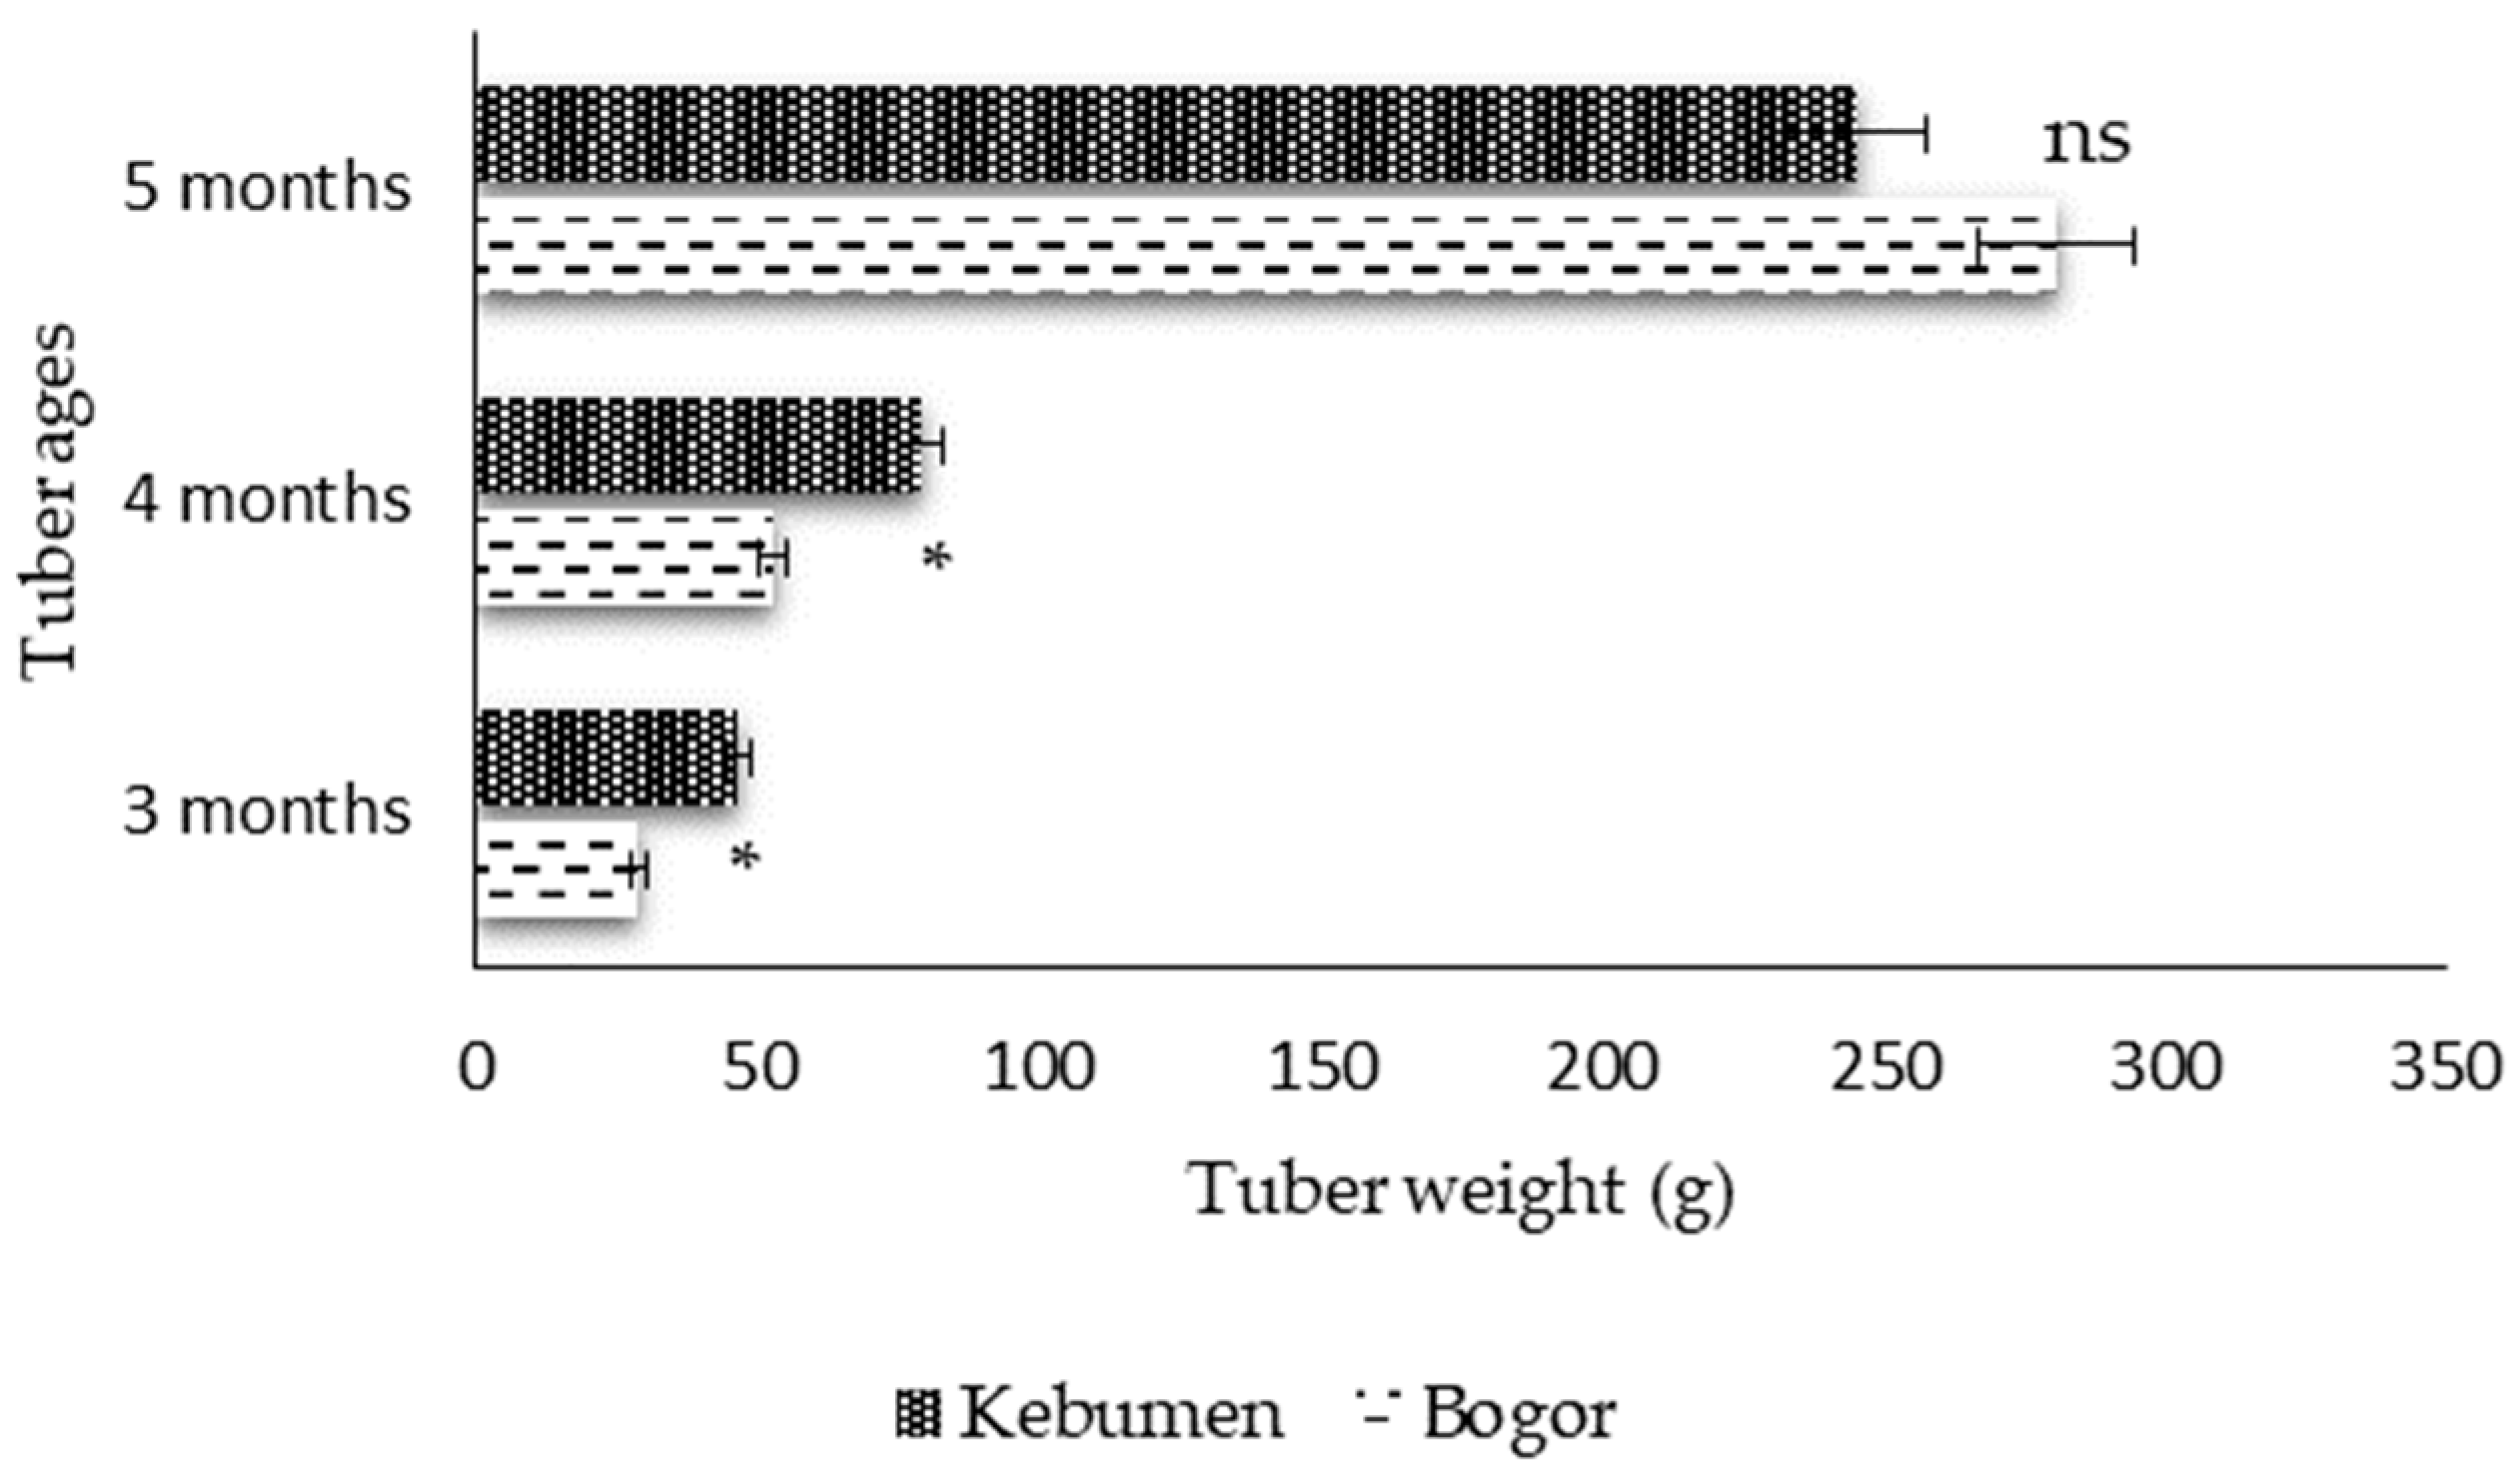
Figure 4 shows the results of the T-test of the growth of jicama tubers of the two accessions at each tuber age. Jicama harvested at 3 months of age showed significant differences between accessions. The Bogor accession had an average weight of 28.50 g, while the Kebumen accession had an average weight of 46.50 g. Tuber weight increased at 4 months of age and showed significant differences between accessions, with 52.50 g (Bogor) and 79 g (Kebumen). A more significant increase occurred in 5-month-old tubers, but there was no statistically significant difference. The average tuber weight was 280.85 g for the Bogor accession and 256.6 g for the Kebumen accession. This indicates that there are genetic differences between accessions, where at the beginning of tuber initiation, the Kebumen accession was superior, but when the tubers were in the ripening process at 5 months of age, the Bogor accession was able to produce tubers equivalent to those of the Kebumen accession. The Bogor accession is thought to have better adaptability to the growing environment compared to the Kebumen accession, which requires adaptation to grow in a new environment in this study. This indicates that environmental factor significantly influent plant performe and may interact with genetic background, leading to different responses between accessions [35].
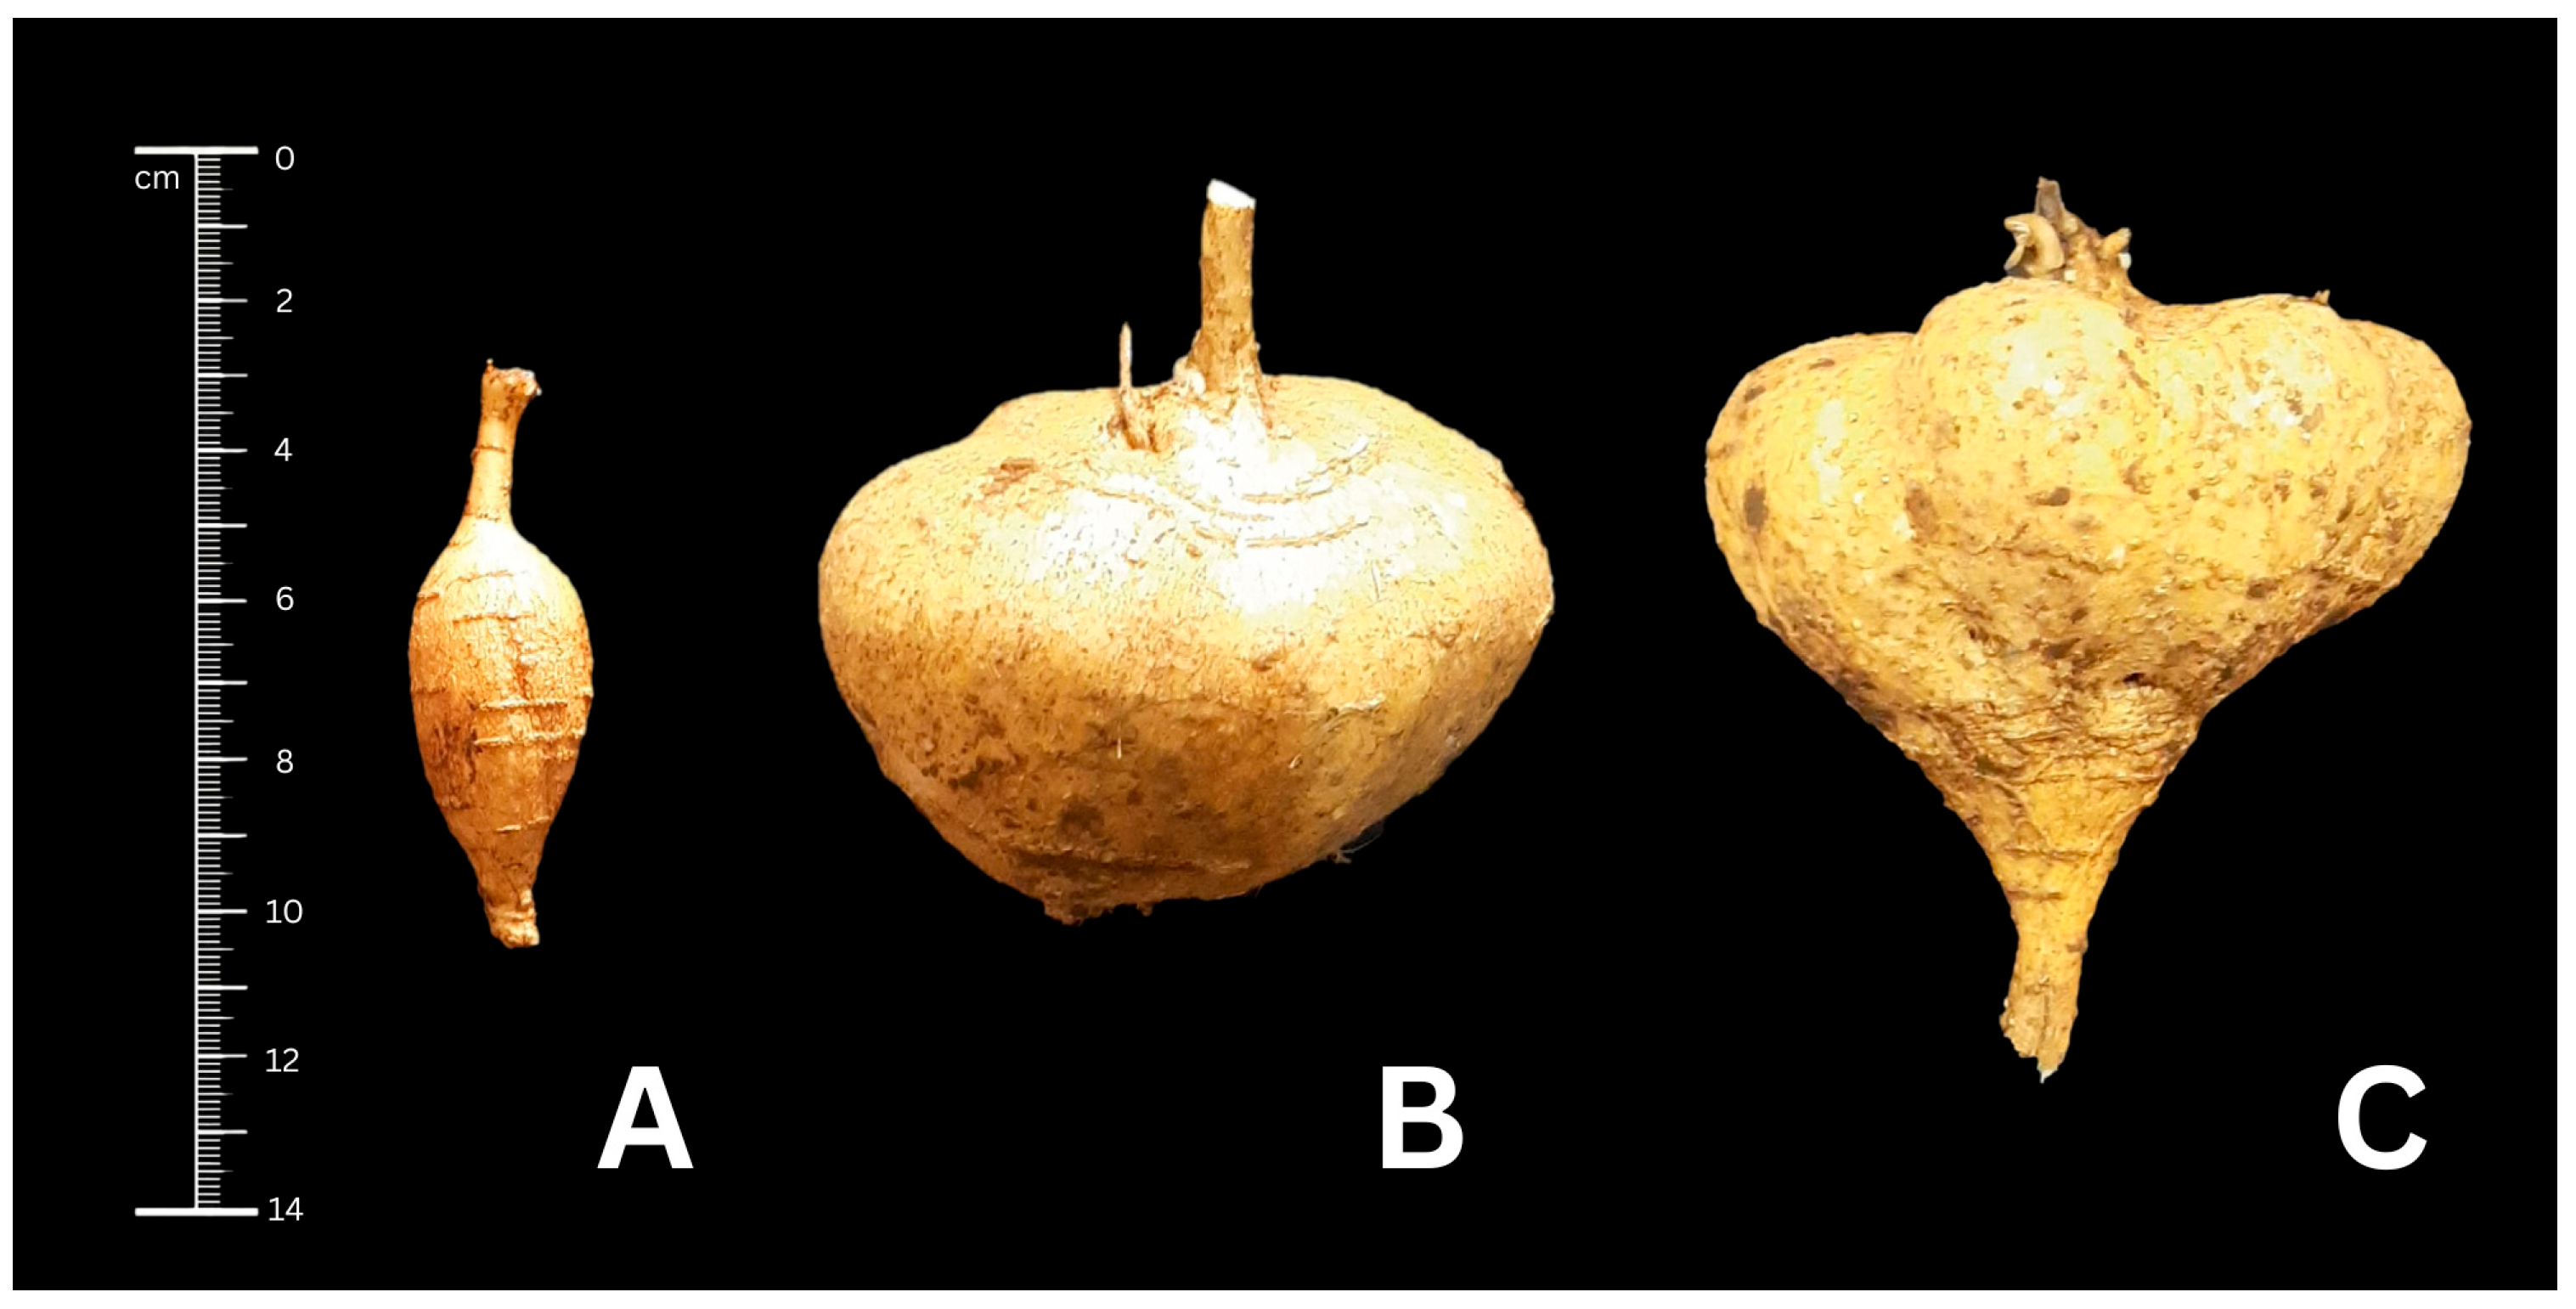
This study also showed significant morphological differences in the shape of the yam tubers between the two accessions. The Bogor accession tubers were oval-shaped, while the Kebumen accession tubers tended to be flat and round. The Bogor accession yams at 3 months were small and oval-shaped. Tuber size began to increase at 4 months, with a shape that began to round out until it reached its maximum size at 5 months. The Bogor accession yam tubers had a brownish-white skin, as shown in Figure 5. Changes in tuber shape and size reflect the gradual filling and ripening of the tubers with age.
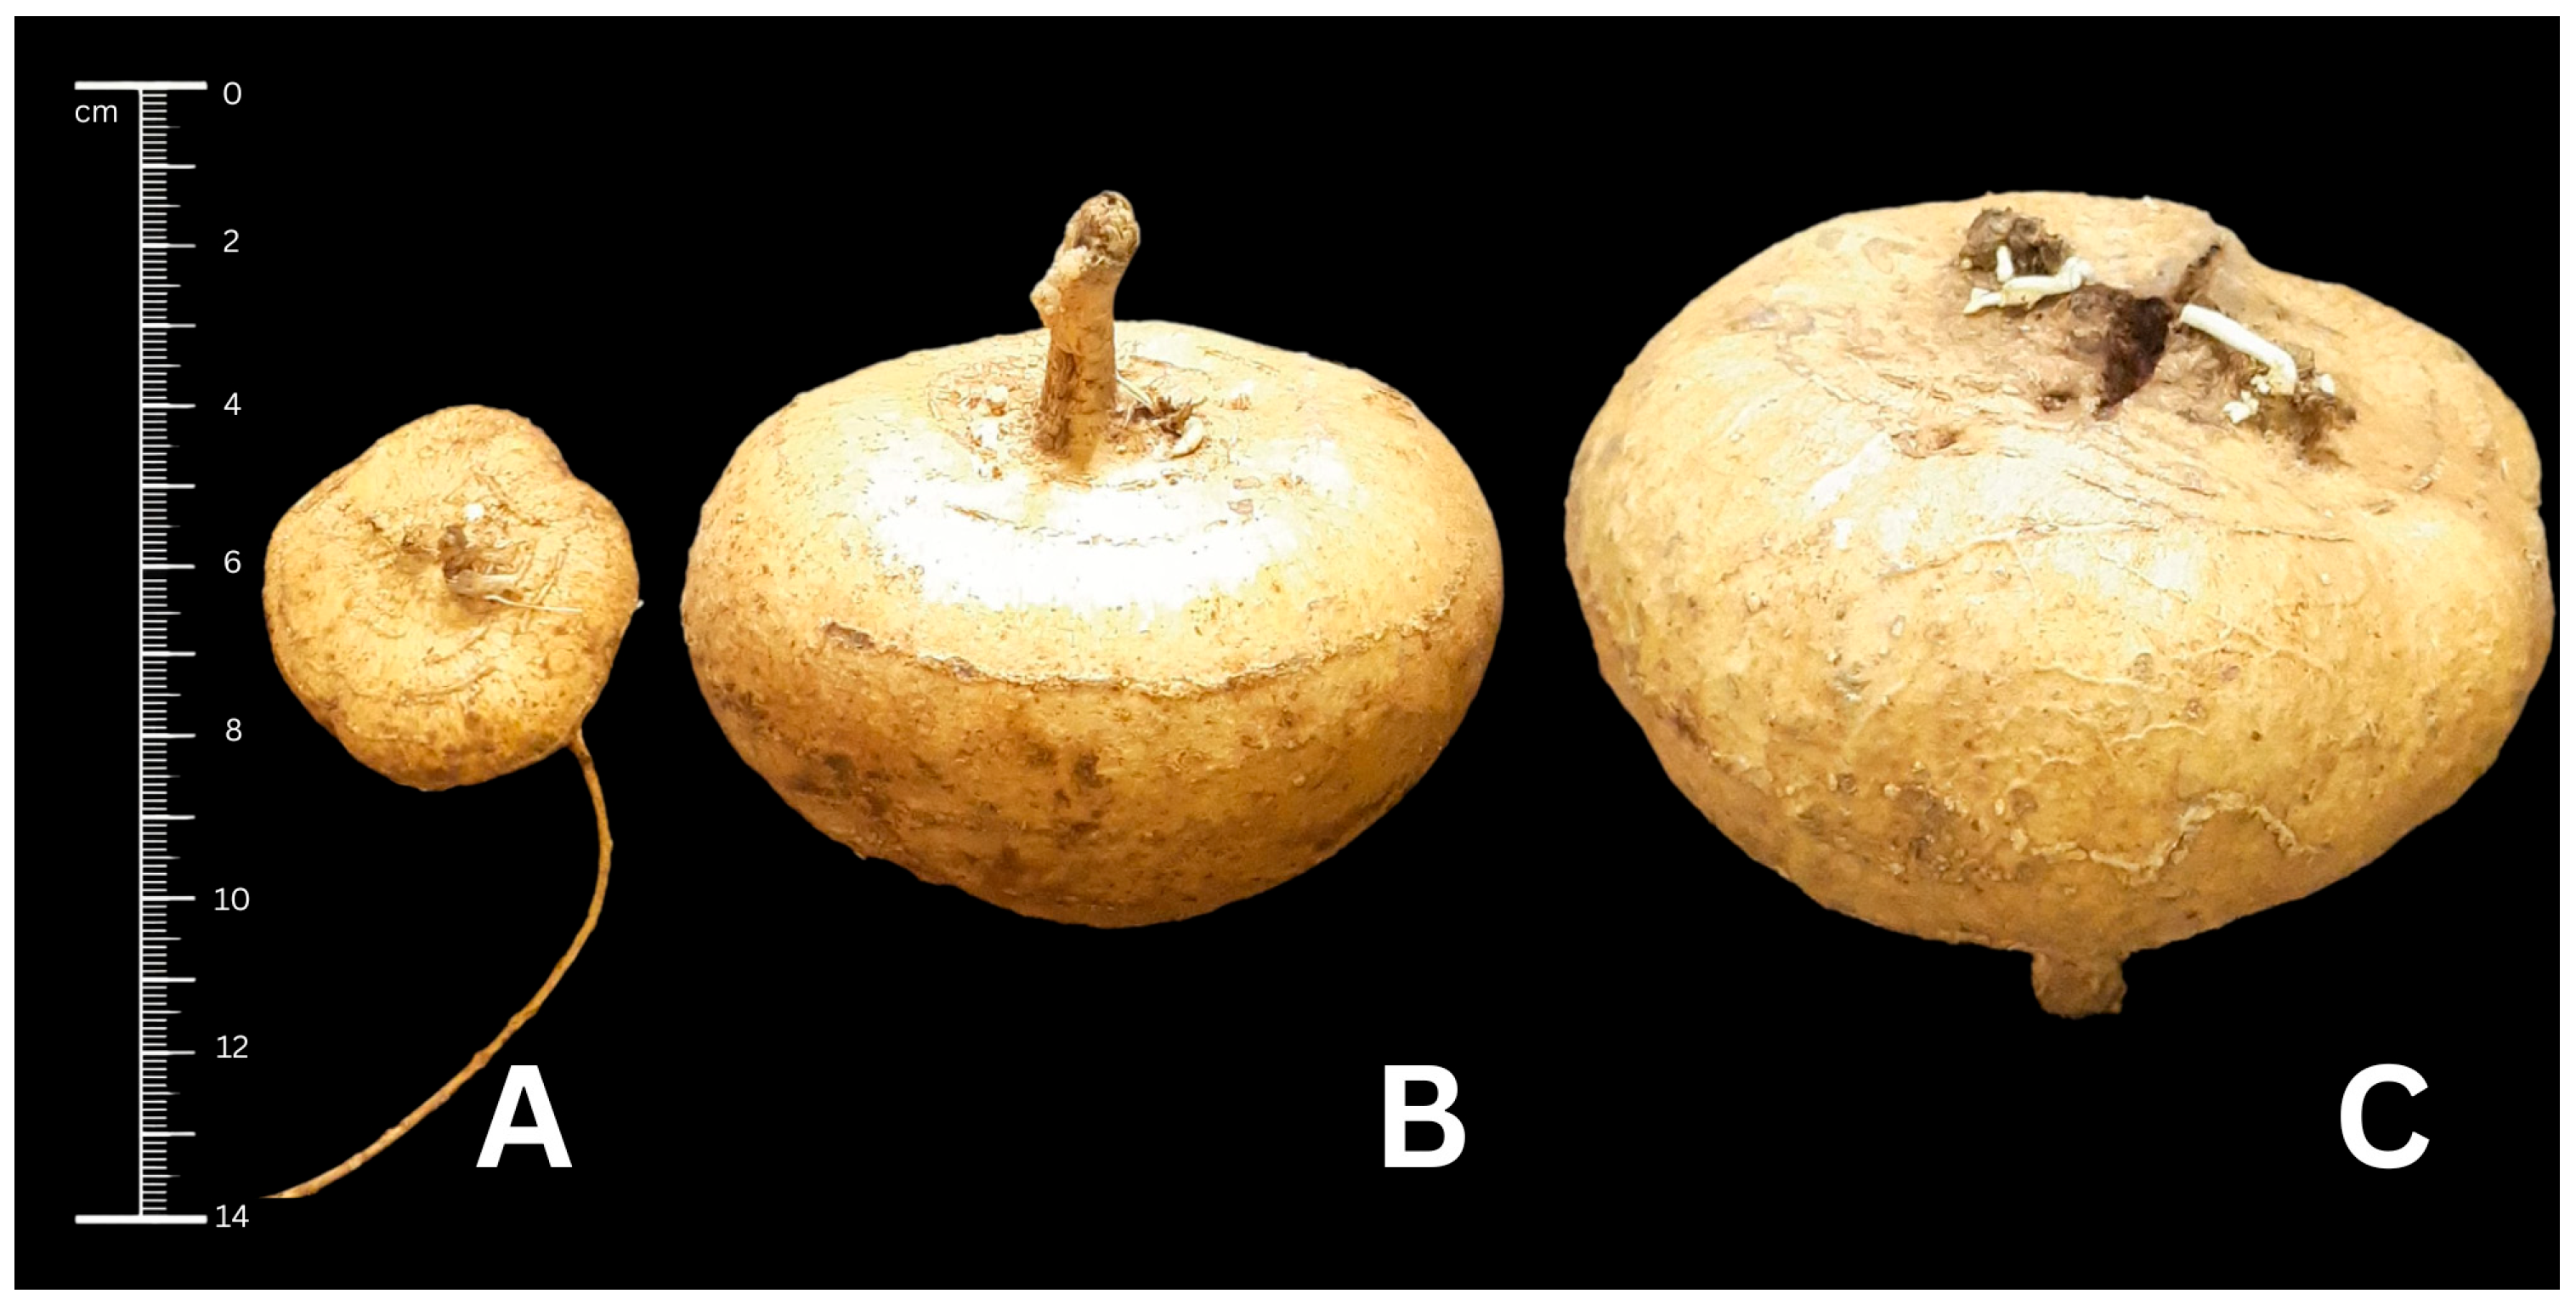
Kebumen accession tubers (Figure 6) have flat round tubers with a white skin. There was a significant increase in tuber size during observations at 3, 4, and 5 months. This indicates that the tubers underwent a gradual filling and ripening process until physiological maturity as the tubers aged [14].
The morphological differences and tuber growth in both accessions provide a basis for determining and analyzing the compounds contained therein so that metabolite characterization can describe the quality and potential of each accession.

3.2. Metabolite Content of Jicama

Primary metabolites are essential compounds that play a fundamental role in plant growth, development, and energy metabolism. These metabolites include carbohydrates, organic acids, amino acids, lipids polyamines, and vitamins that are directly involved in physiological processes such as respiration, biosynthesis, and energy storage in plant tissues [36]. In tuber crops, primary metabolites are particularly important because storage organs act as reservoirs of carbohydrates and other nutrients that influence crop quality [4]. On the contrary, secondary metabolites or phytochemicals are compounds produced by plants through metabolic processes [37]. Secondary metabolites in plants are present in small amounts and play a role in defending plants from biotic and abiotic stresses [38]. In plants, the content of secondary metabolites can be influenced by internal and external factors. Internal factors are influenced by genetic differences in plants, while external factors include temperature, humidity, pH, light, nutrient content in the soil, and differences in region and altitude. These factors influence the metabolic process in plants, causing differences in the content of the compounds produced [39]. Jicama tubers contain secondary metabolite compounds that have potential health benefits, such as phenols, flavonoids, alkaloids, saponins, and triterpenoids. Secondary metabolites in plants have functions as attractants to attract other organisms, help adaptation to environmental stress, protect plants from ultraviolet exposure, act as growth regulators, and enable allelopathy to increase competitiveness with other plants [40].

3.2.1. Starch Yield

In addition to tuber weight, starch yield also increases with tuber age. Tuber age affects carbohydrate content, including starch, because the longer the photosynthetic products are stored in the tuber, the higher they will be. Sumbaga stated that the starch content of jicama increases with tuber age by 10.07%, 11.21%, and 12.12% at 3, 4, and 5 months of age, respectively [14].
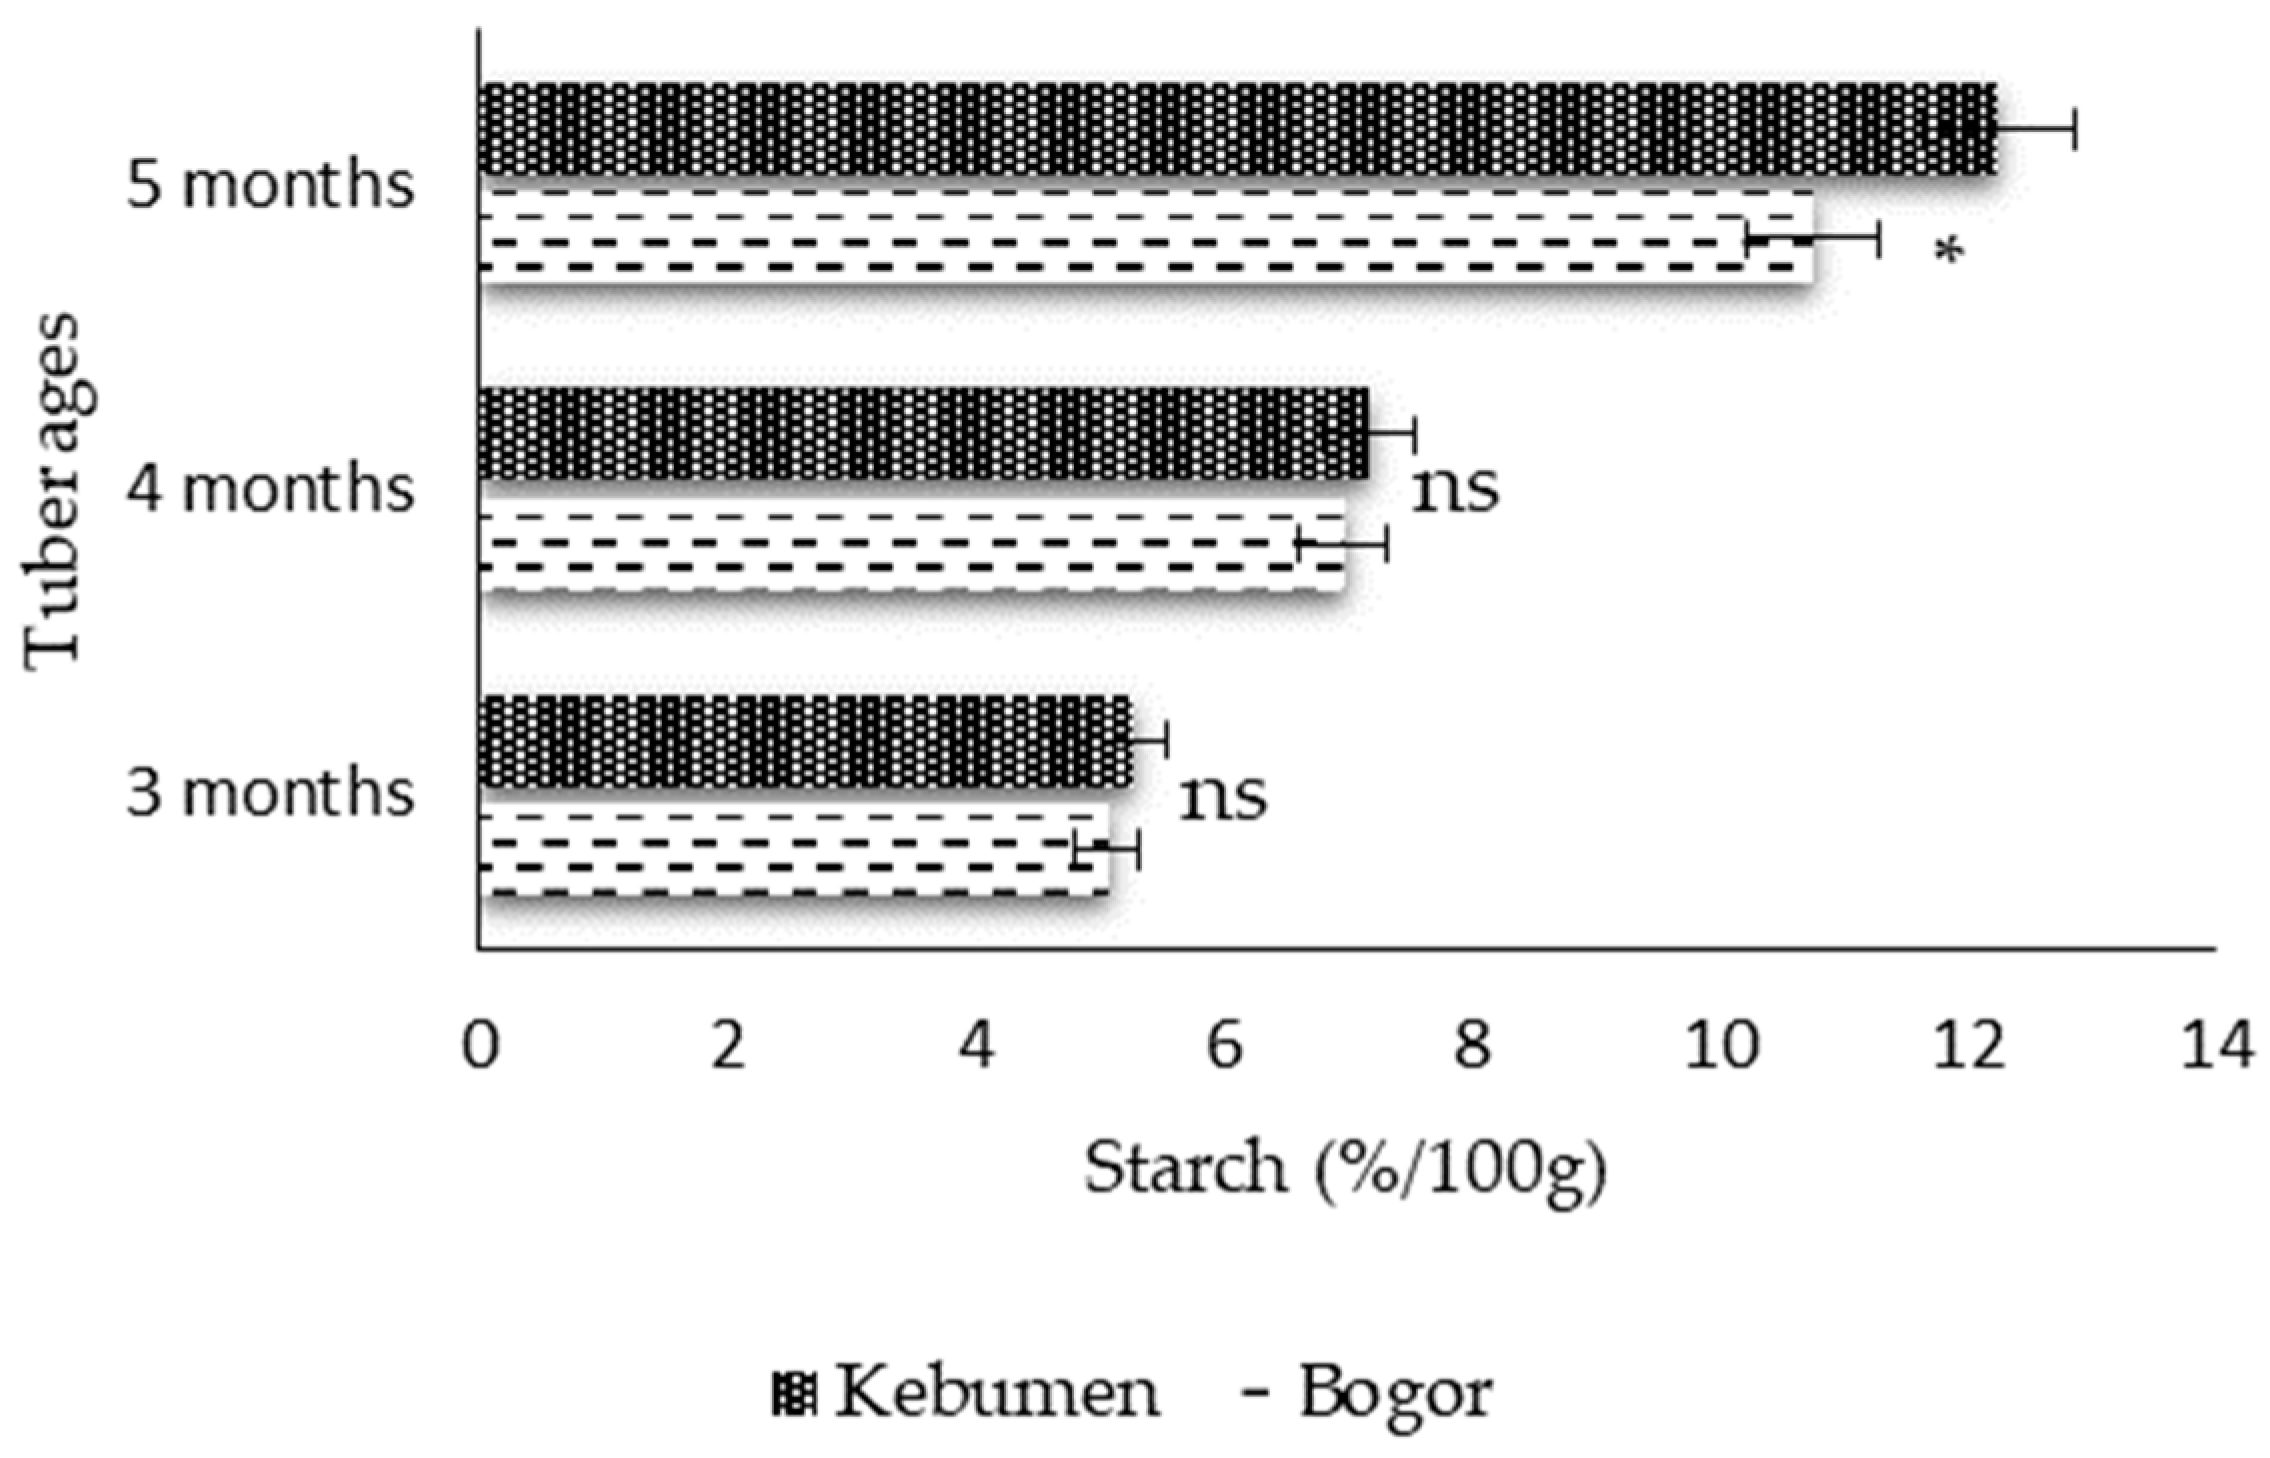
The results of the statistical test of the starch content of Bogor and Kebumen accessions at various tuber ages are presented in Figure 7. There were no significant differences between the two accessions at 3 and 4 months of age. The Bogor accession had a starch yield of 5.06% at 3 months of age and 6.96% per 100 g of tuber at 4 months of age, while the Kebumen accession had a starch yield of 5.27% at 3 months of age and 7.17% at 4 months of age per 100 g of tuber. A significant difference in starch yield was found in 5-month-old tubers, which was 10.76% per 100 g of tubers for the Bogor accession and 12.25% per 100 g of tubers for the Kebumen accession. This shows that the Kebumen accession has superior potential in starch content so that it can be developed in the food and cosmetics industries. Starch has high utility in the cosmetics industry, particularly as a stabilizer and filler material commonly used in facial masks and loose powder products [14,41].

3.2.2. Total Soluble Solids (TSS)

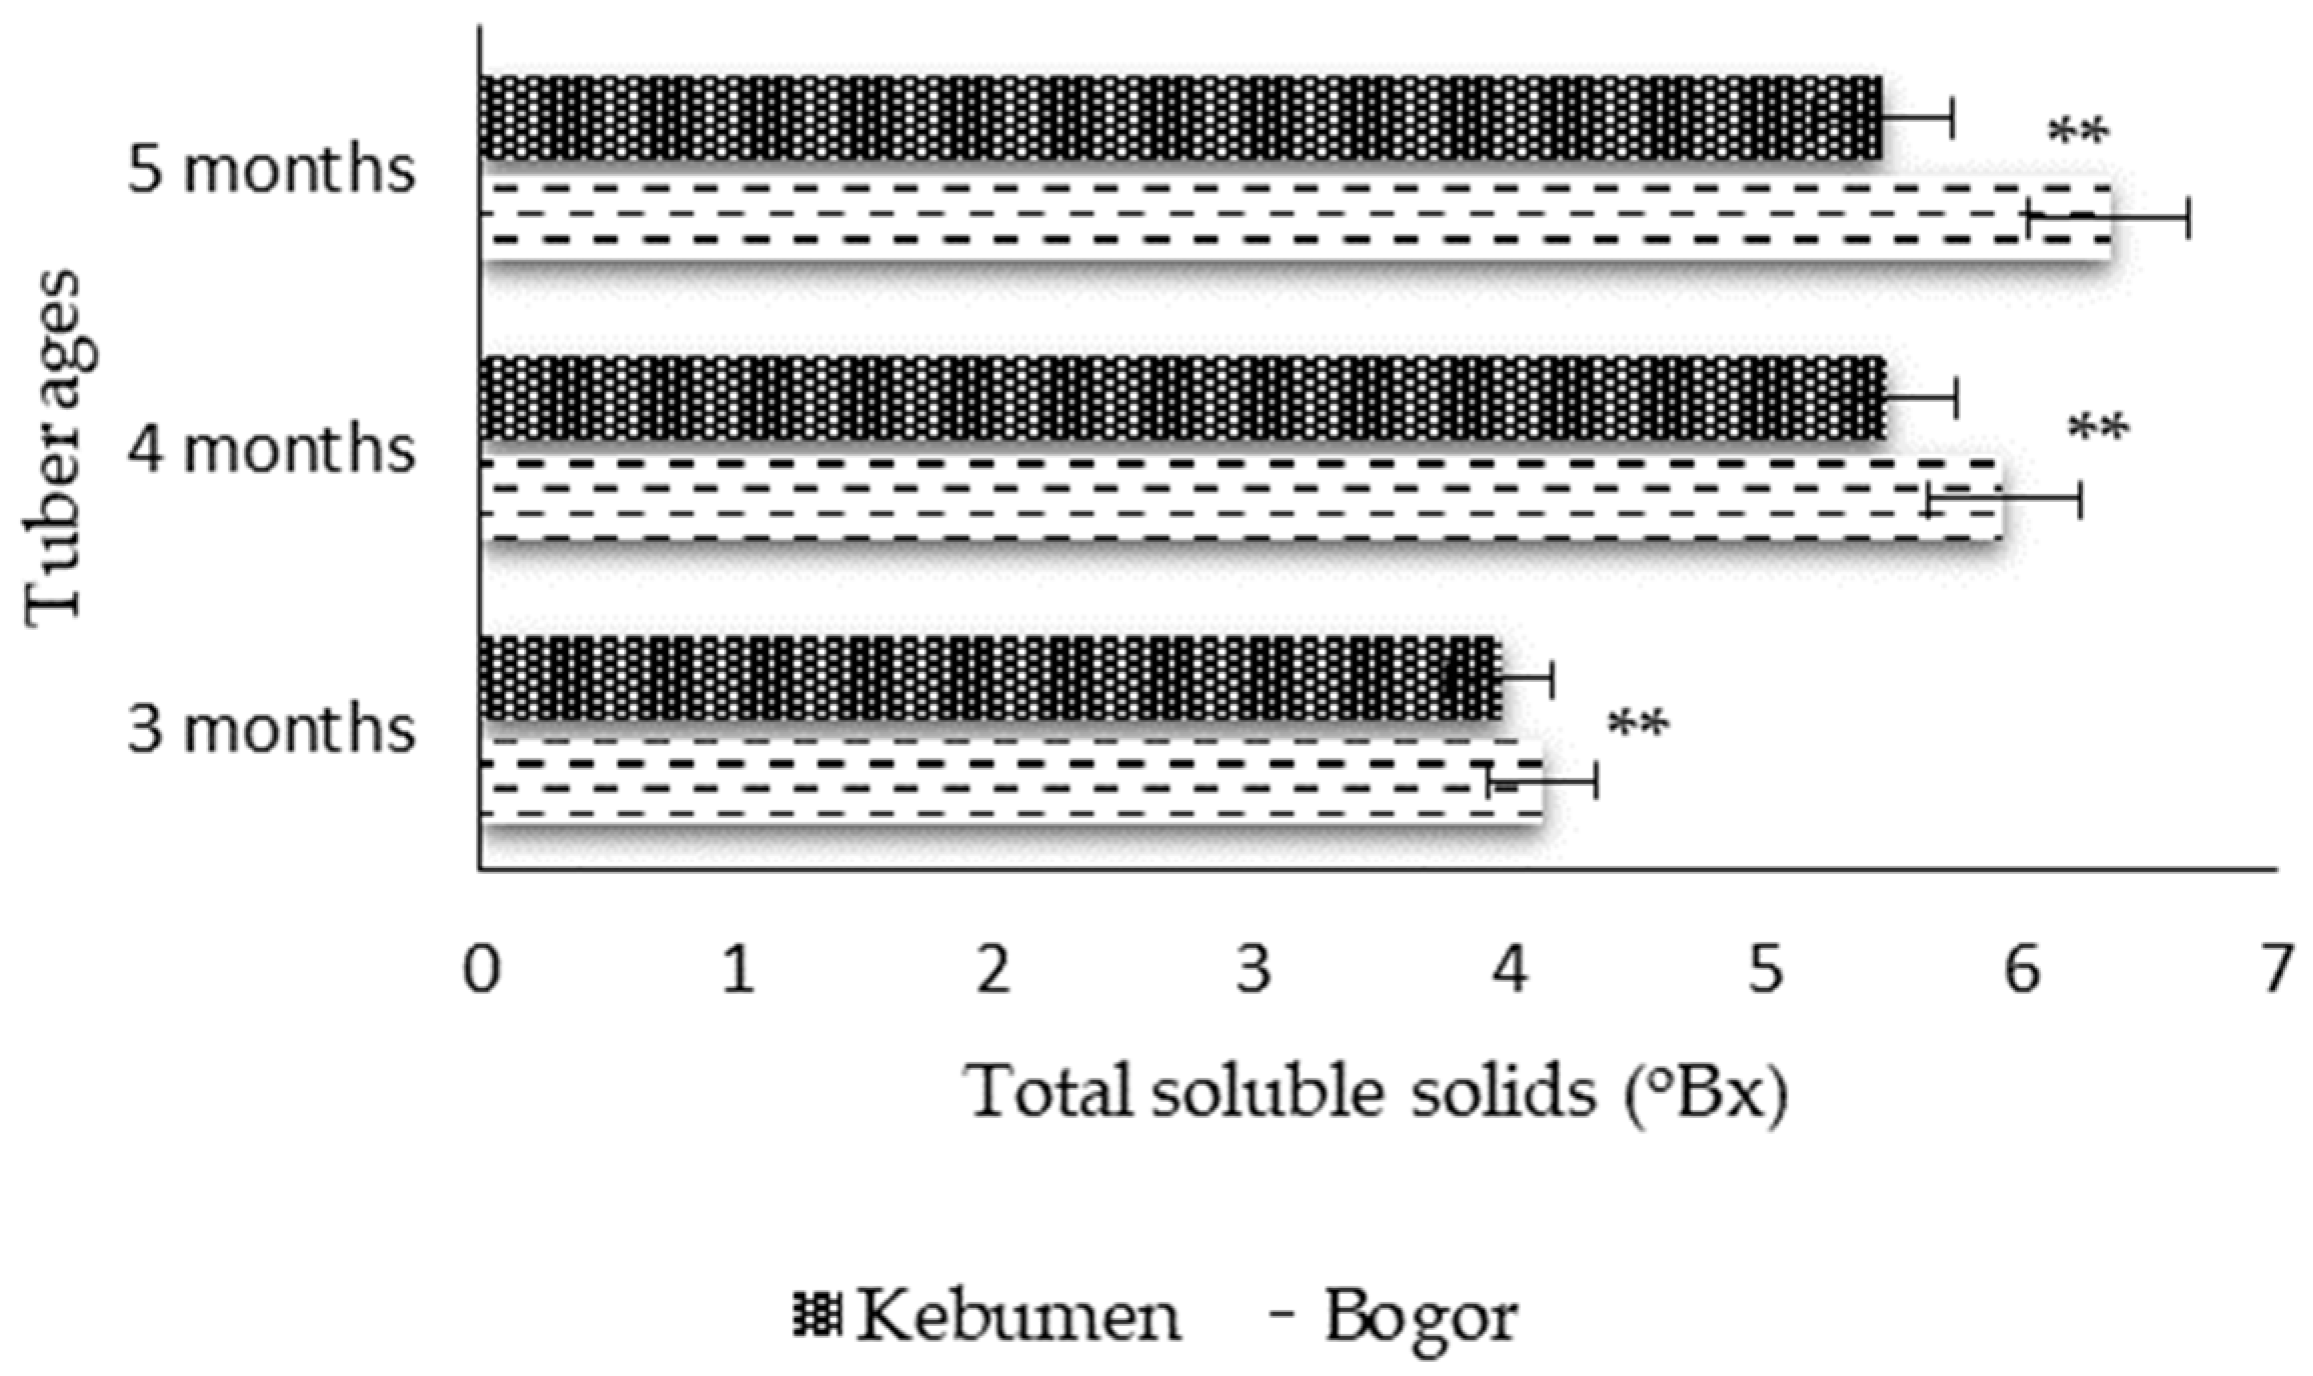
Total soluble solids measurement is carried out to determine the sweetness level of tubers so that it can be used as a consideration for the appropriate harvest age to produce tubers that have a sweet taste in line with marketing targets. The total soluble solids (°Bx) of jicama tubers showed an increasing trend along with the age of the tubers in the Bogor accession, but there was a decrease in the old age of the Kebumen accession. The TSS value in the Bogor accession increased from 4.13 (°Bx) at 3 months of age, 5.93 (°Bx) at 4 months of age, and 6.28 (°Bx) at 5 months of age. Meanwhile, the Kebumen accession had a value of 3.96 (°Bx) at 3 months of age, 5.46 (°Bx) at 4 months of age, and decreased to 5.44 (°Bx) at 5 months of age (Figure 8). Total soluble solids measurements were taken to determine the sweetness level of the tubers so that it could be used as a consideration for the appropriate harvest age to produce tubers with a sweet taste in line with marketing targets. The increase in sugar accumulation in the tubers was due to the hydrolysis of starch into simple sugars (sucrose, fructose, and glucose), supported by optimal environmental conditions [14,42].
Total soluble solids in tubers are related to the content of simple sugars such as glucose, sucrose, and fructose. These compounds have the potential to act as humectant substances that can attract and retain water when applied to the skin, thereby enhancing skin hydration and moisture [43]. In cosmetic formulations, naturally derived sugars are commonly used to improve skin softness and maintain moisture balance. Therefore, variations in total soluble solids across tuber ages may influence the suitability of jicama tubers as moisturizing agents in cosmetic products.

3.2.3. Total Titratable Acids (TTA)

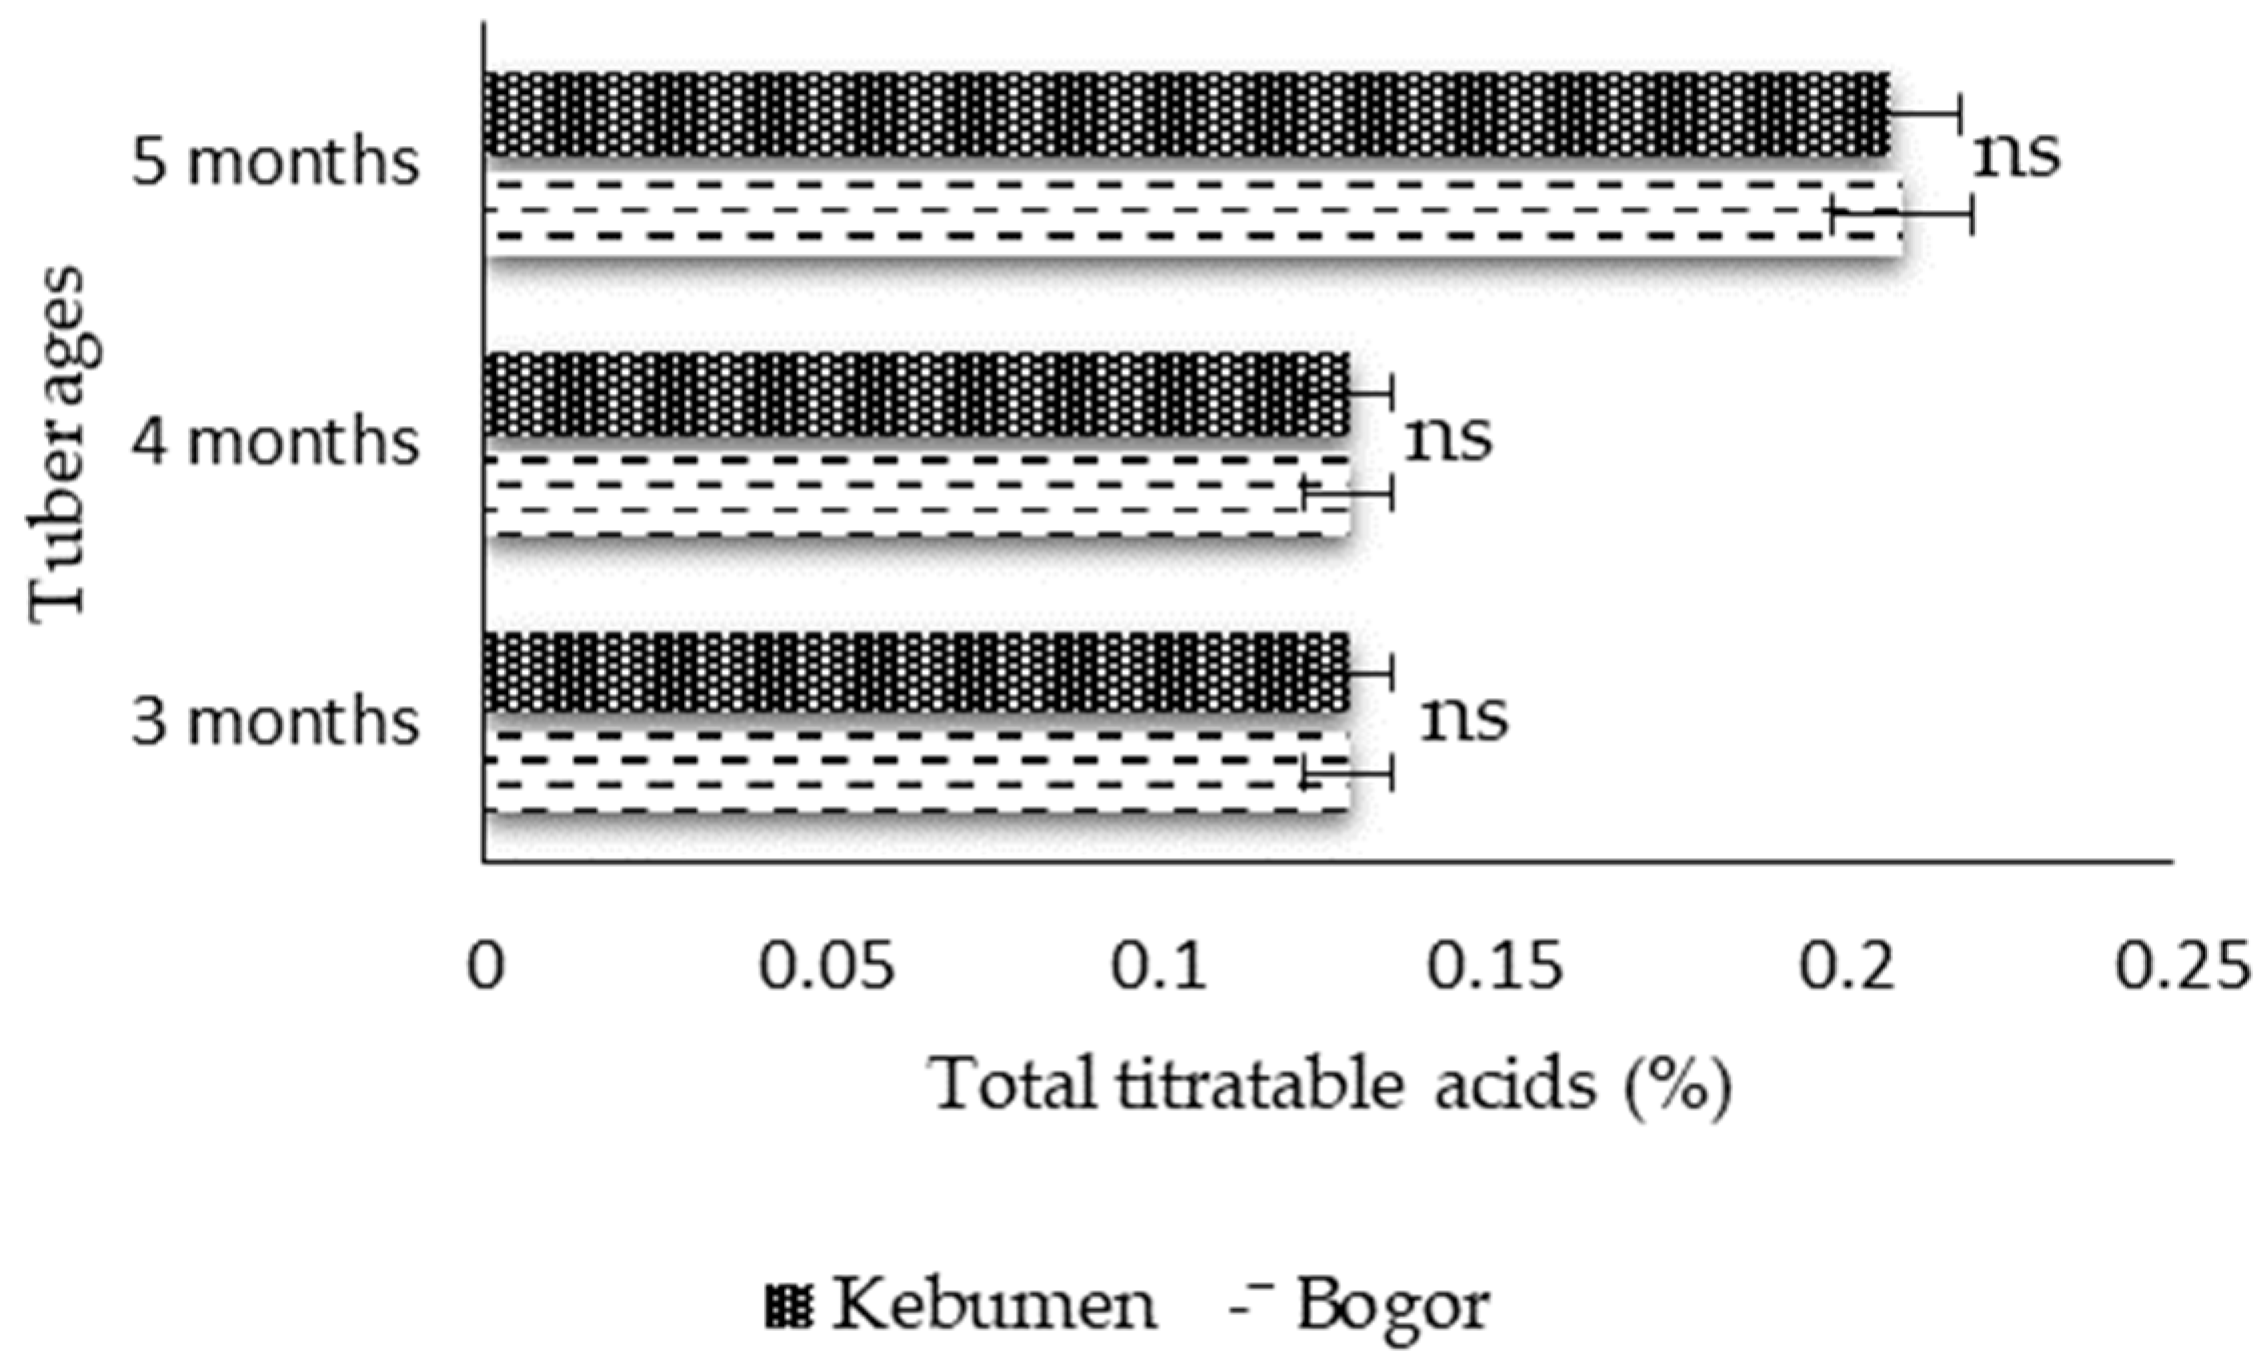
Total titratable acids (TTA) did not show any significant differences between accessions (Figure 9). TTA increased in line with the increase in tuber age in both cases. Bogor accession jicama tubers had a TTA value of 0.128% at 3 and 4 months of age, then increased at 5 months of age to 0.192%. Meanwhile, the Kebumen accession had a value of 0.106% at 3 months of age, 0.128% at 4 months of age, and 0.192% at 5 months of age. The acidity level in tuber crops is relatively stable compared to other chemical components, which aims to maintain the taste of the tubers produced. The titratable acid total (TTA) in both accessions did not differ significantly between accessions. Stable organic acid content plays an important role in maintaining the pH of raw materials. In cosmetic formulations, stable pH can increase the compatibility of active ingredients and provide a comfortable effect when the product is applied to the skin [44].

3.2.4. Vitamin C

Vitamin C is one of the bioactive compounds that has been widely developed in both the health and cosmetic fields because it has multifunctional roles. Vitamin C acts as a powerful antioxidant that can neutralize free radicals, boost immunity, contribute to collagen synthesis, and accelerate wound healing [45]. Vitamin C in the cosmetics industry is widely formulated in skin care products because it has benefits in brightening and evening out skin tone, reducing hyperpigmentation, and protecting the skin from UV exposure [11,46]. Jicama tubers are known to contain vitamin C; another study reported that jicama tubers contain vitamin C, vitamin A, and glycolic acid (alpha hydroxy acid), which play a role in accelerating skin cell regeneration and rejuvenation [47].
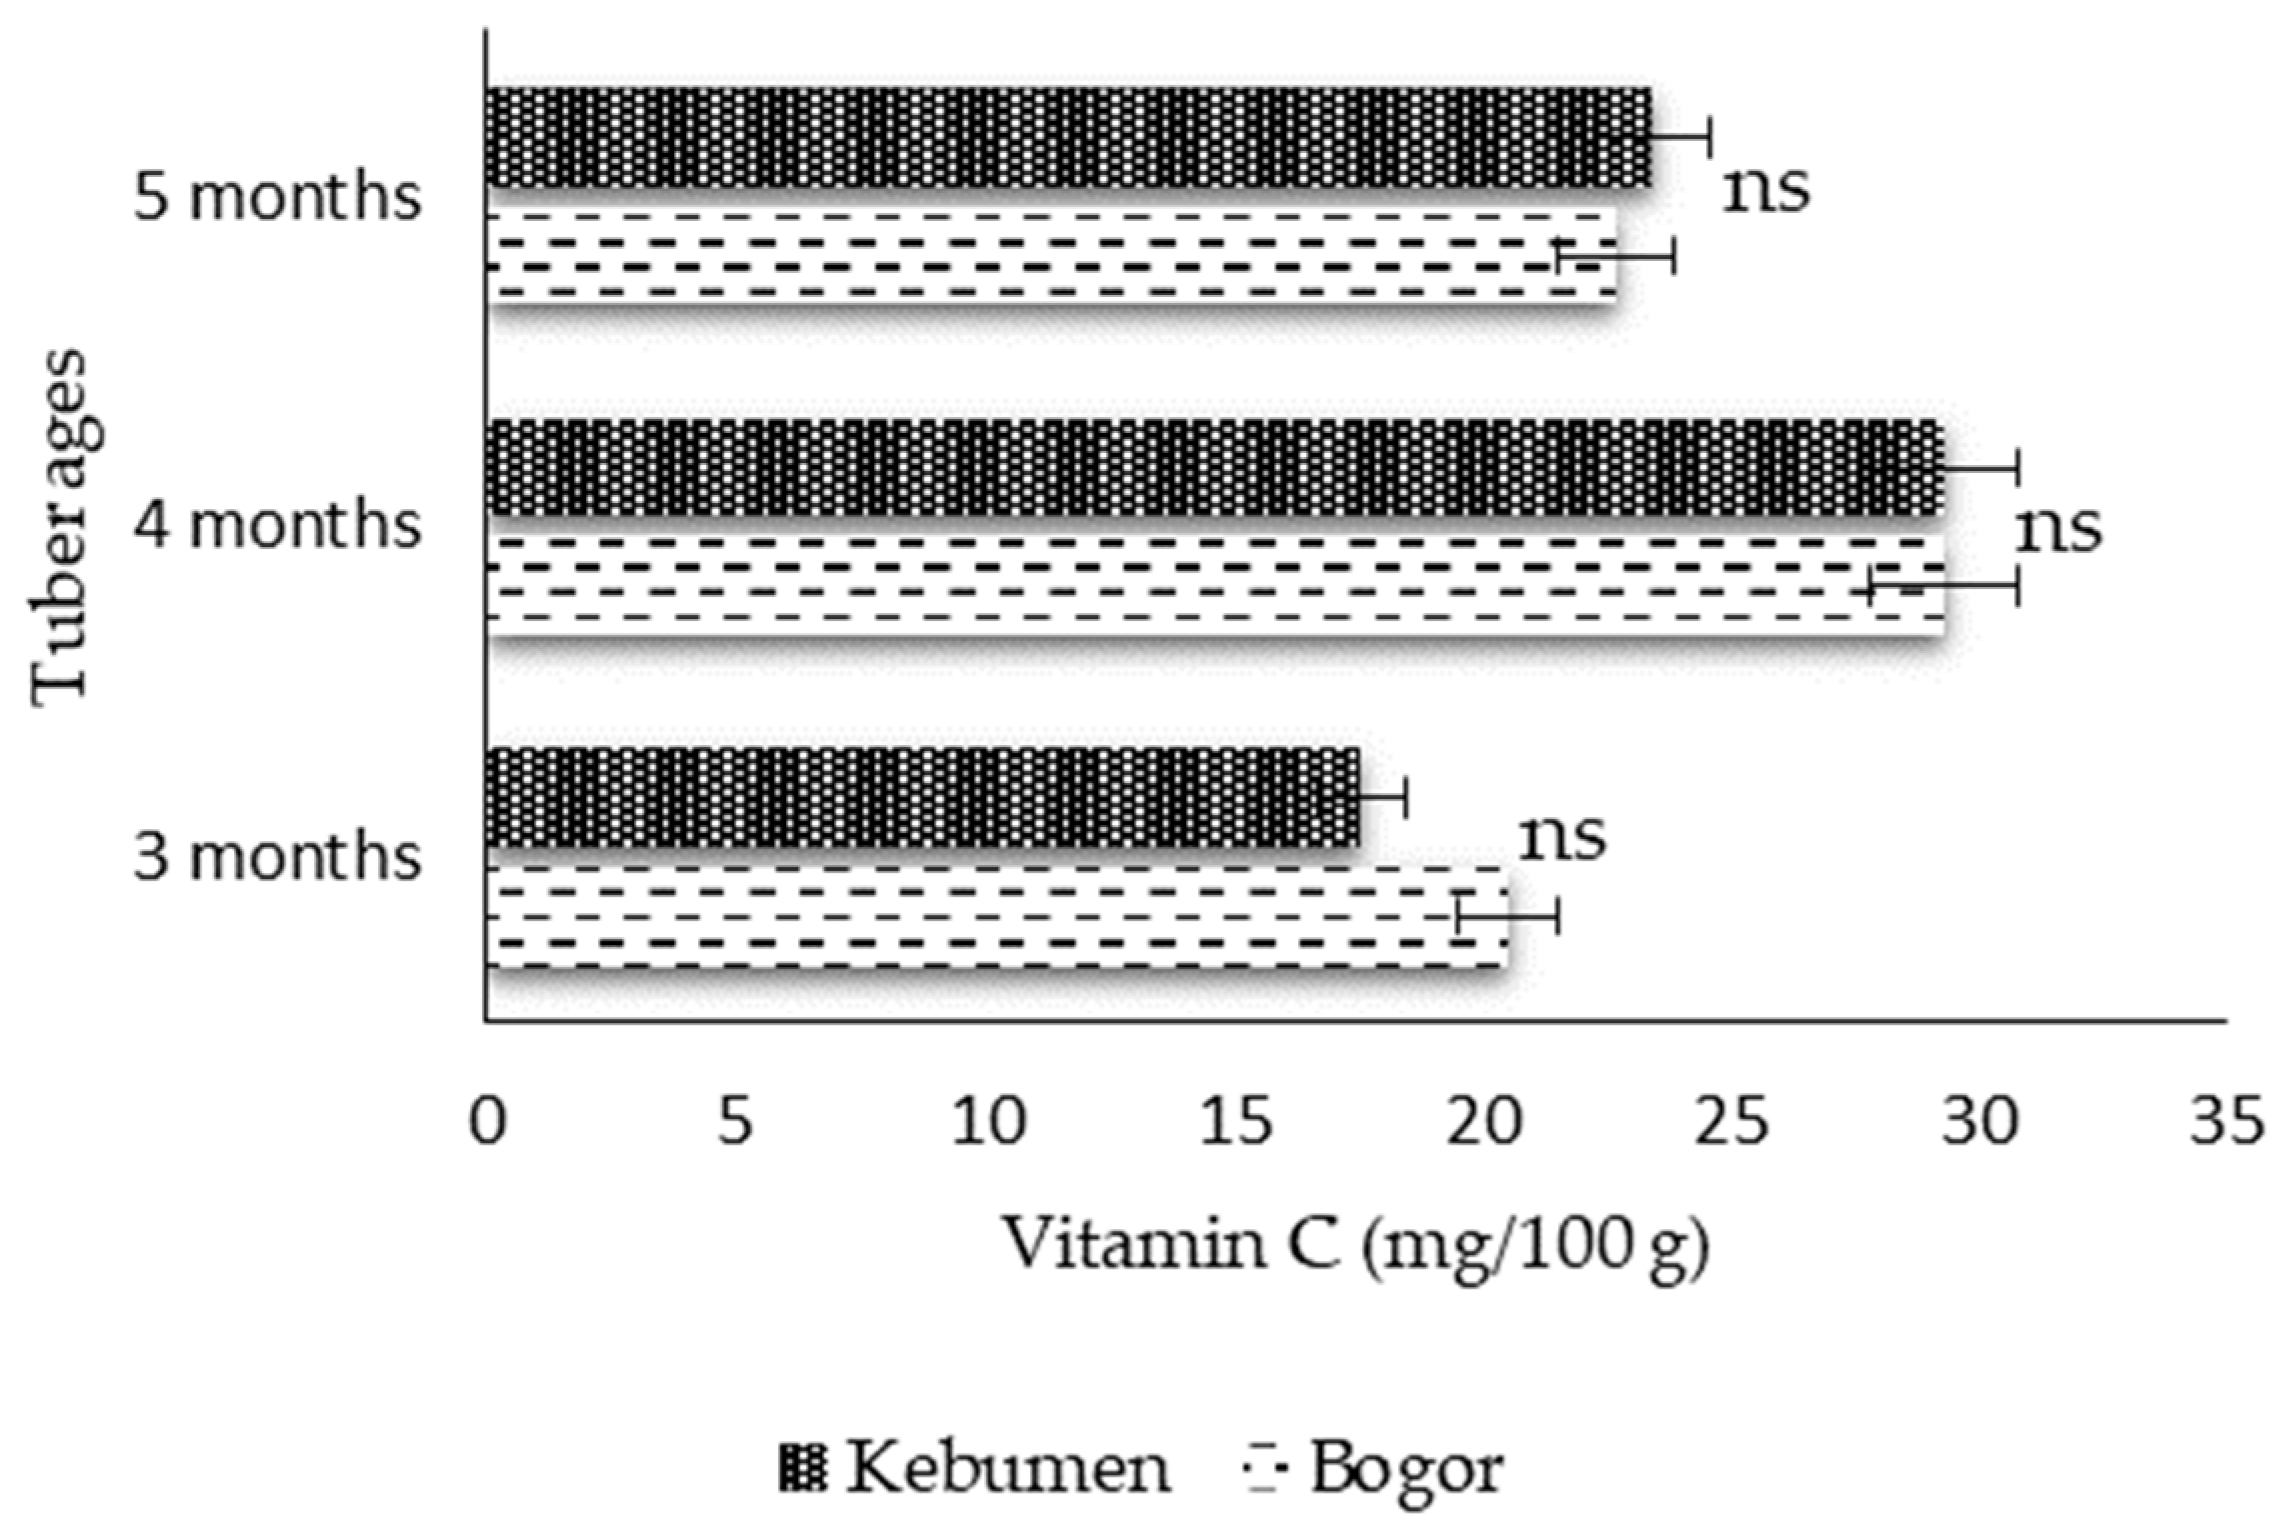
Vitamin C content in jicama tubers shows an increasing trend at a young age, then decreases as they age (Figure 10), although there is no significant difference between accessions. At 3 months of age, Bogor accession yam tubers had a vitamin C content of 20.53 mg/100 g, while Kebumen accession tubers had a content of 17.6 mg/g. The content of this compound increased at 4 months of age, namely 29.33 mg/100 g in the Bogor accession and 29.22 mg/100 g in the Kebumen accession. This increase is in line with [10], who found that the accumulation of metabolite compounds in plants can increase along with the development of organs and tissues in plants. However, there was a decrease in vitamin C levels at 5 months of age to 22.73 mg/100 g in the Bogor accession and 24.93 mg/100 g in the Kebumen accession. The decrease in vitamin C content may occur due to the degradation of ascorbic acid through oxidation into monodehydroascorbic acid (MDHA), dehydroascorbic acid (DHA), and other derivatives that cannot be reduced again [48]. This process is related to the physiological condition of plant tissue, where older plants can accelerate ascorbic acid degradation [49]. The United States Department of Agriculture states that the standard vitamin C content in jicama is 20.2 mg/100 g [12]. This reinforces the potential of jicama tubers as a cosmetic raw material because they have a good vitamin C content. Vitamin C itself is widely formulated in cosmetic products that act as whitening, brightening, and protective agents for the skin from oxidative damage due to UV exposure and others [11,46].

3.2.5. Total Phenols

Phenolic compounds are known to have strong antioxidant activity, so they are often formulated as anti-aging agents due to their ability to ward off free radicals that can damage the skin [50,51]. These compounds were tested using the Folin–Ciocalteu method [31] with gallic acid as the standard testing solution. Gallic acid is a strong phenolic polyphenol compound commonly used as a standard for testing total phenols because it is stable and easily obtained. The test results are expressed in units of mg gallic acid equivalent per gram per sample (mg GAE/g DE).
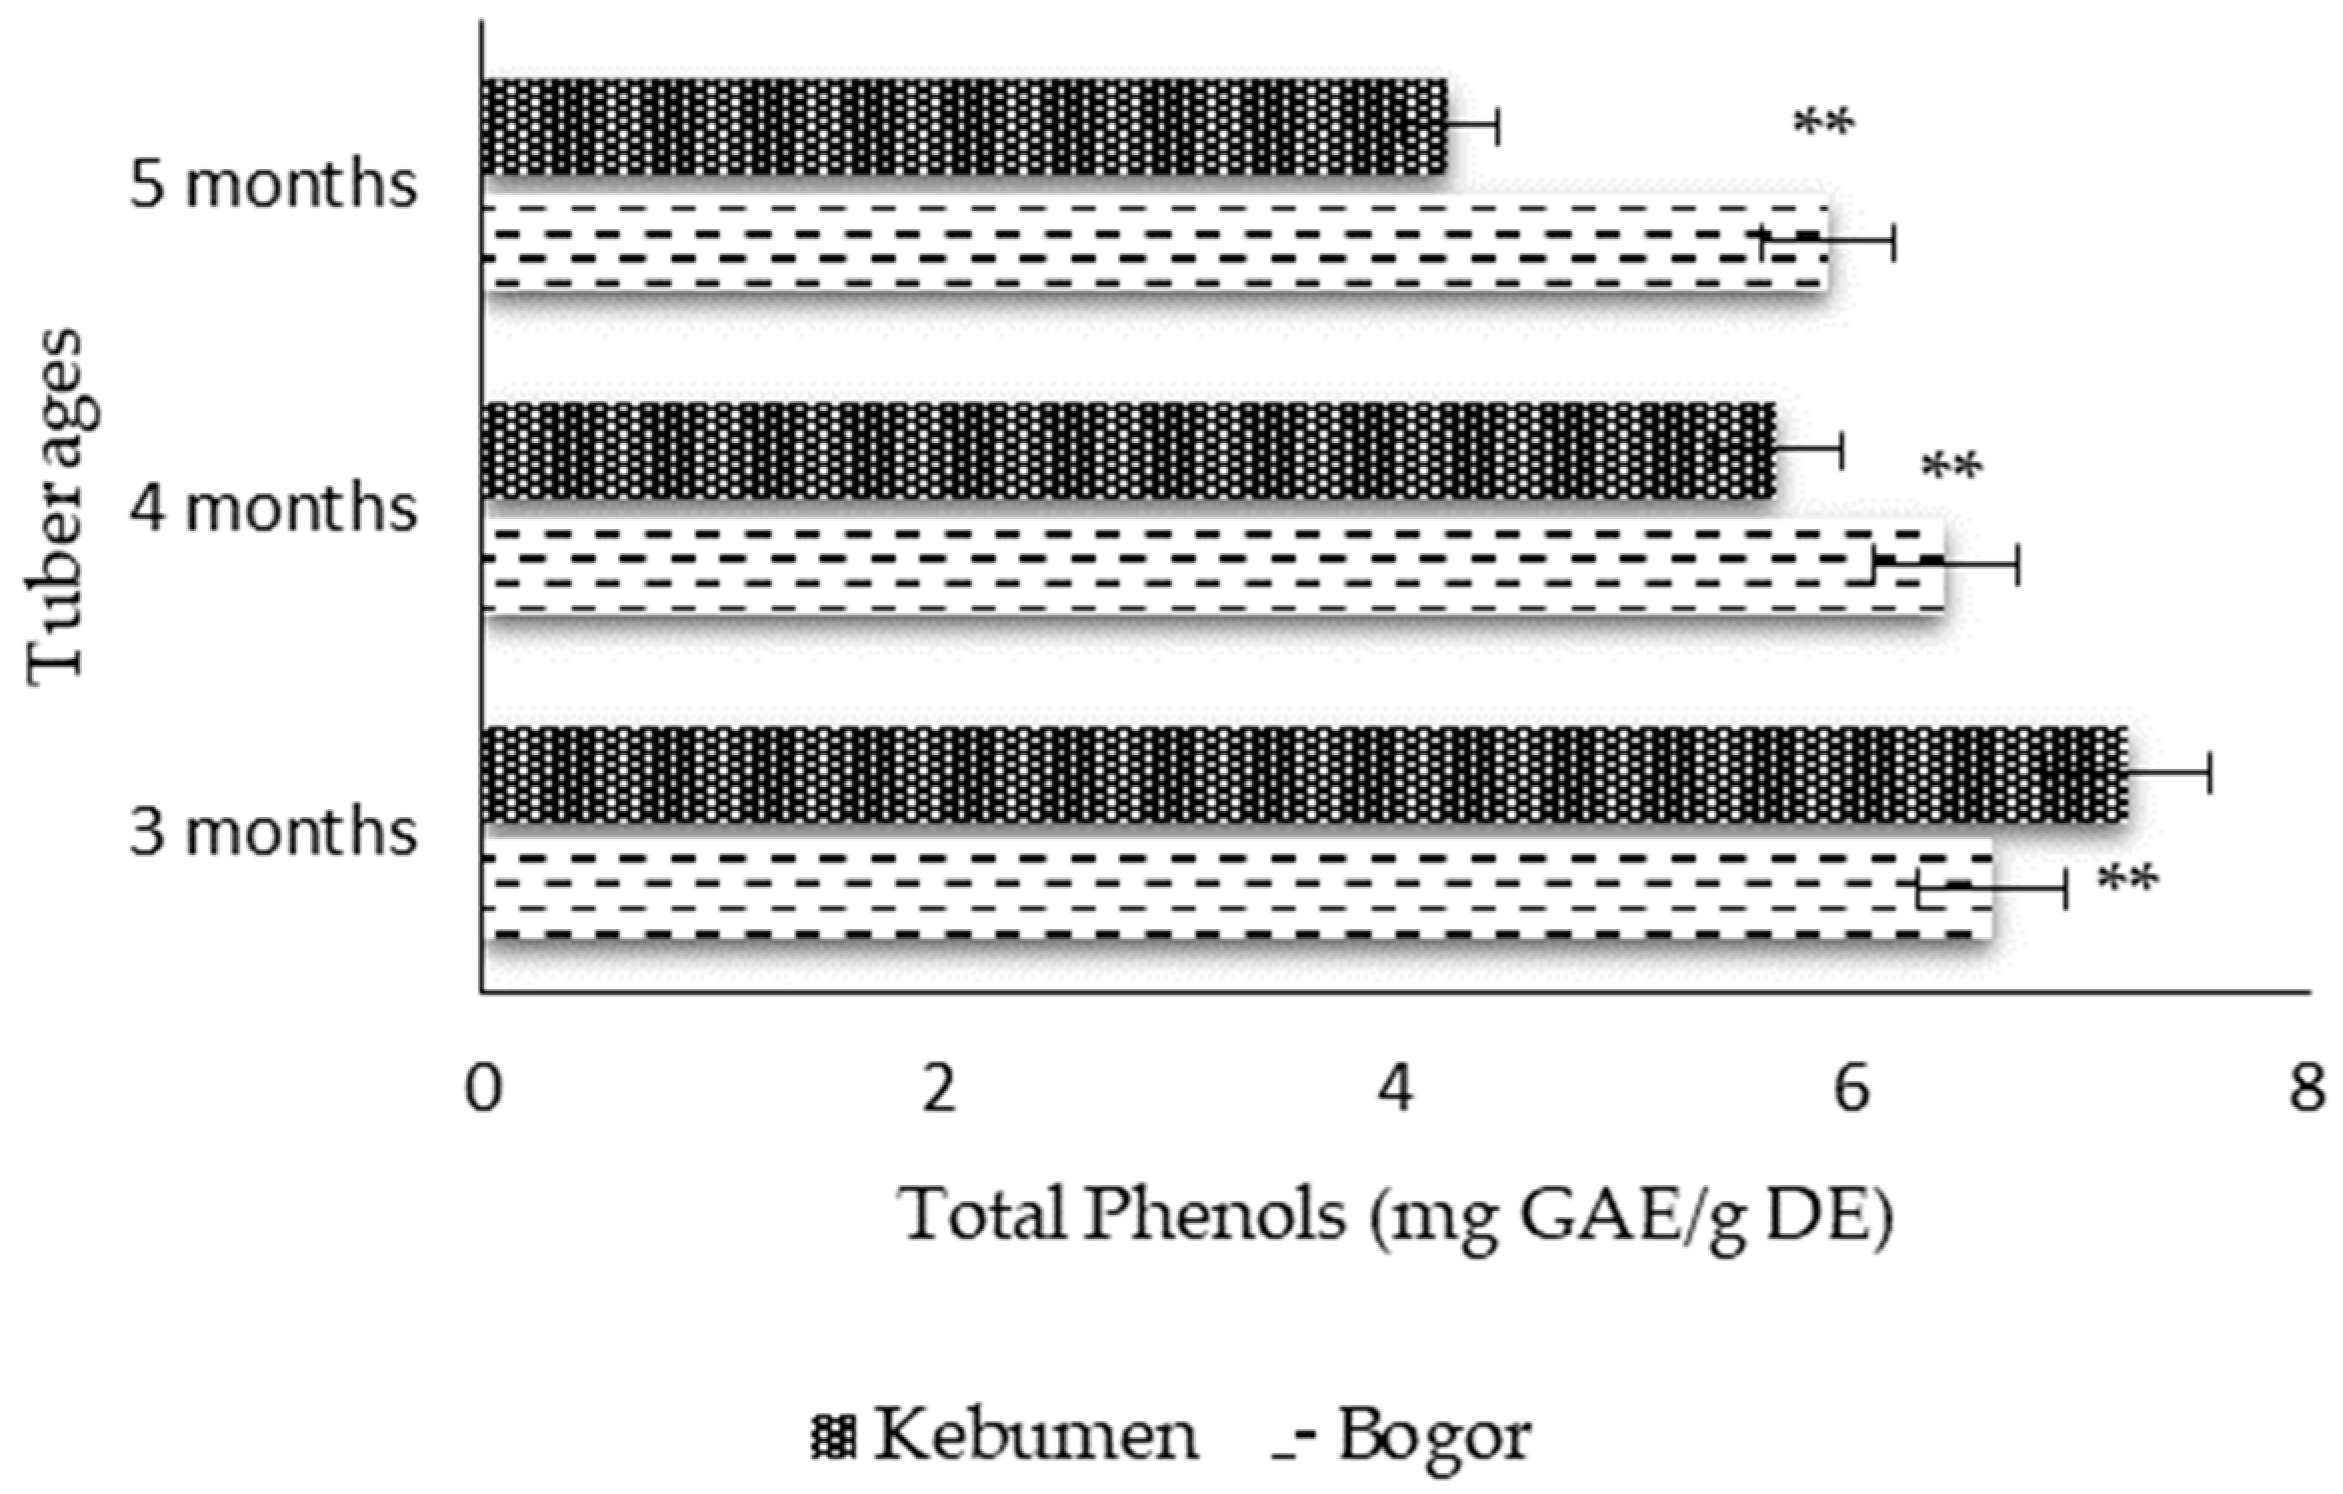
The total phenol content of jicama tubers is presented in Figure 11, calculated using the gallic acid standard curve. Observations of the content of secondary plant metabolites show a different pattern from the production parameters and primary metabolite content of jicama tubers. Figure 6 shows that the highest phenol content was found in 3-month-old tubers, amounting to 6.61 mg GAE/g DE in the Bogor accession and 7.21 mg GAE/g DE in the Kebumen accession. There was a decrease in total phenols at 4 months of age to 6.41 mg GAE/g DE in the Bogor accession and 5.67 mg GAE/g DE in the Kebumen accession. At 5 months of age, the content of this compound continued to decrease to 5.89 mg GAE/g DE in the Bogor accession and 4.23 mg GAE/g DE in the Kebumen accession. Phenolic compounds act as a defense mechanism for young plants, but their levels decrease with age and are diverted for the enlargement and maturation of plant organs [52].
A previous study reported that Jicama tubers contain 8.27–11.97 mg GAE/g DE total flavonoids [53]. This value is superior to the results in this study. This is thought to be due to other factors such as differences in nutrient supply during cultivation, the accessions used, and the cultivation environment.

3.2.6. Total Flavonoids

Jicama tubers contain several types of flavonoids, including flavones, flavonols, isoflavones, anthocyanidins, and flavan-3-ols [54]. The flavonoid groups most commonly found in jicama tubers are daidzein (C15H10O4) and genistein (C15H10O5), which belong to the isoflavone group [55]. The compound quercetin (C15H10O7) is used as a standard solution and also belongs to the flavonol group in jicama tubers (Figure 2).
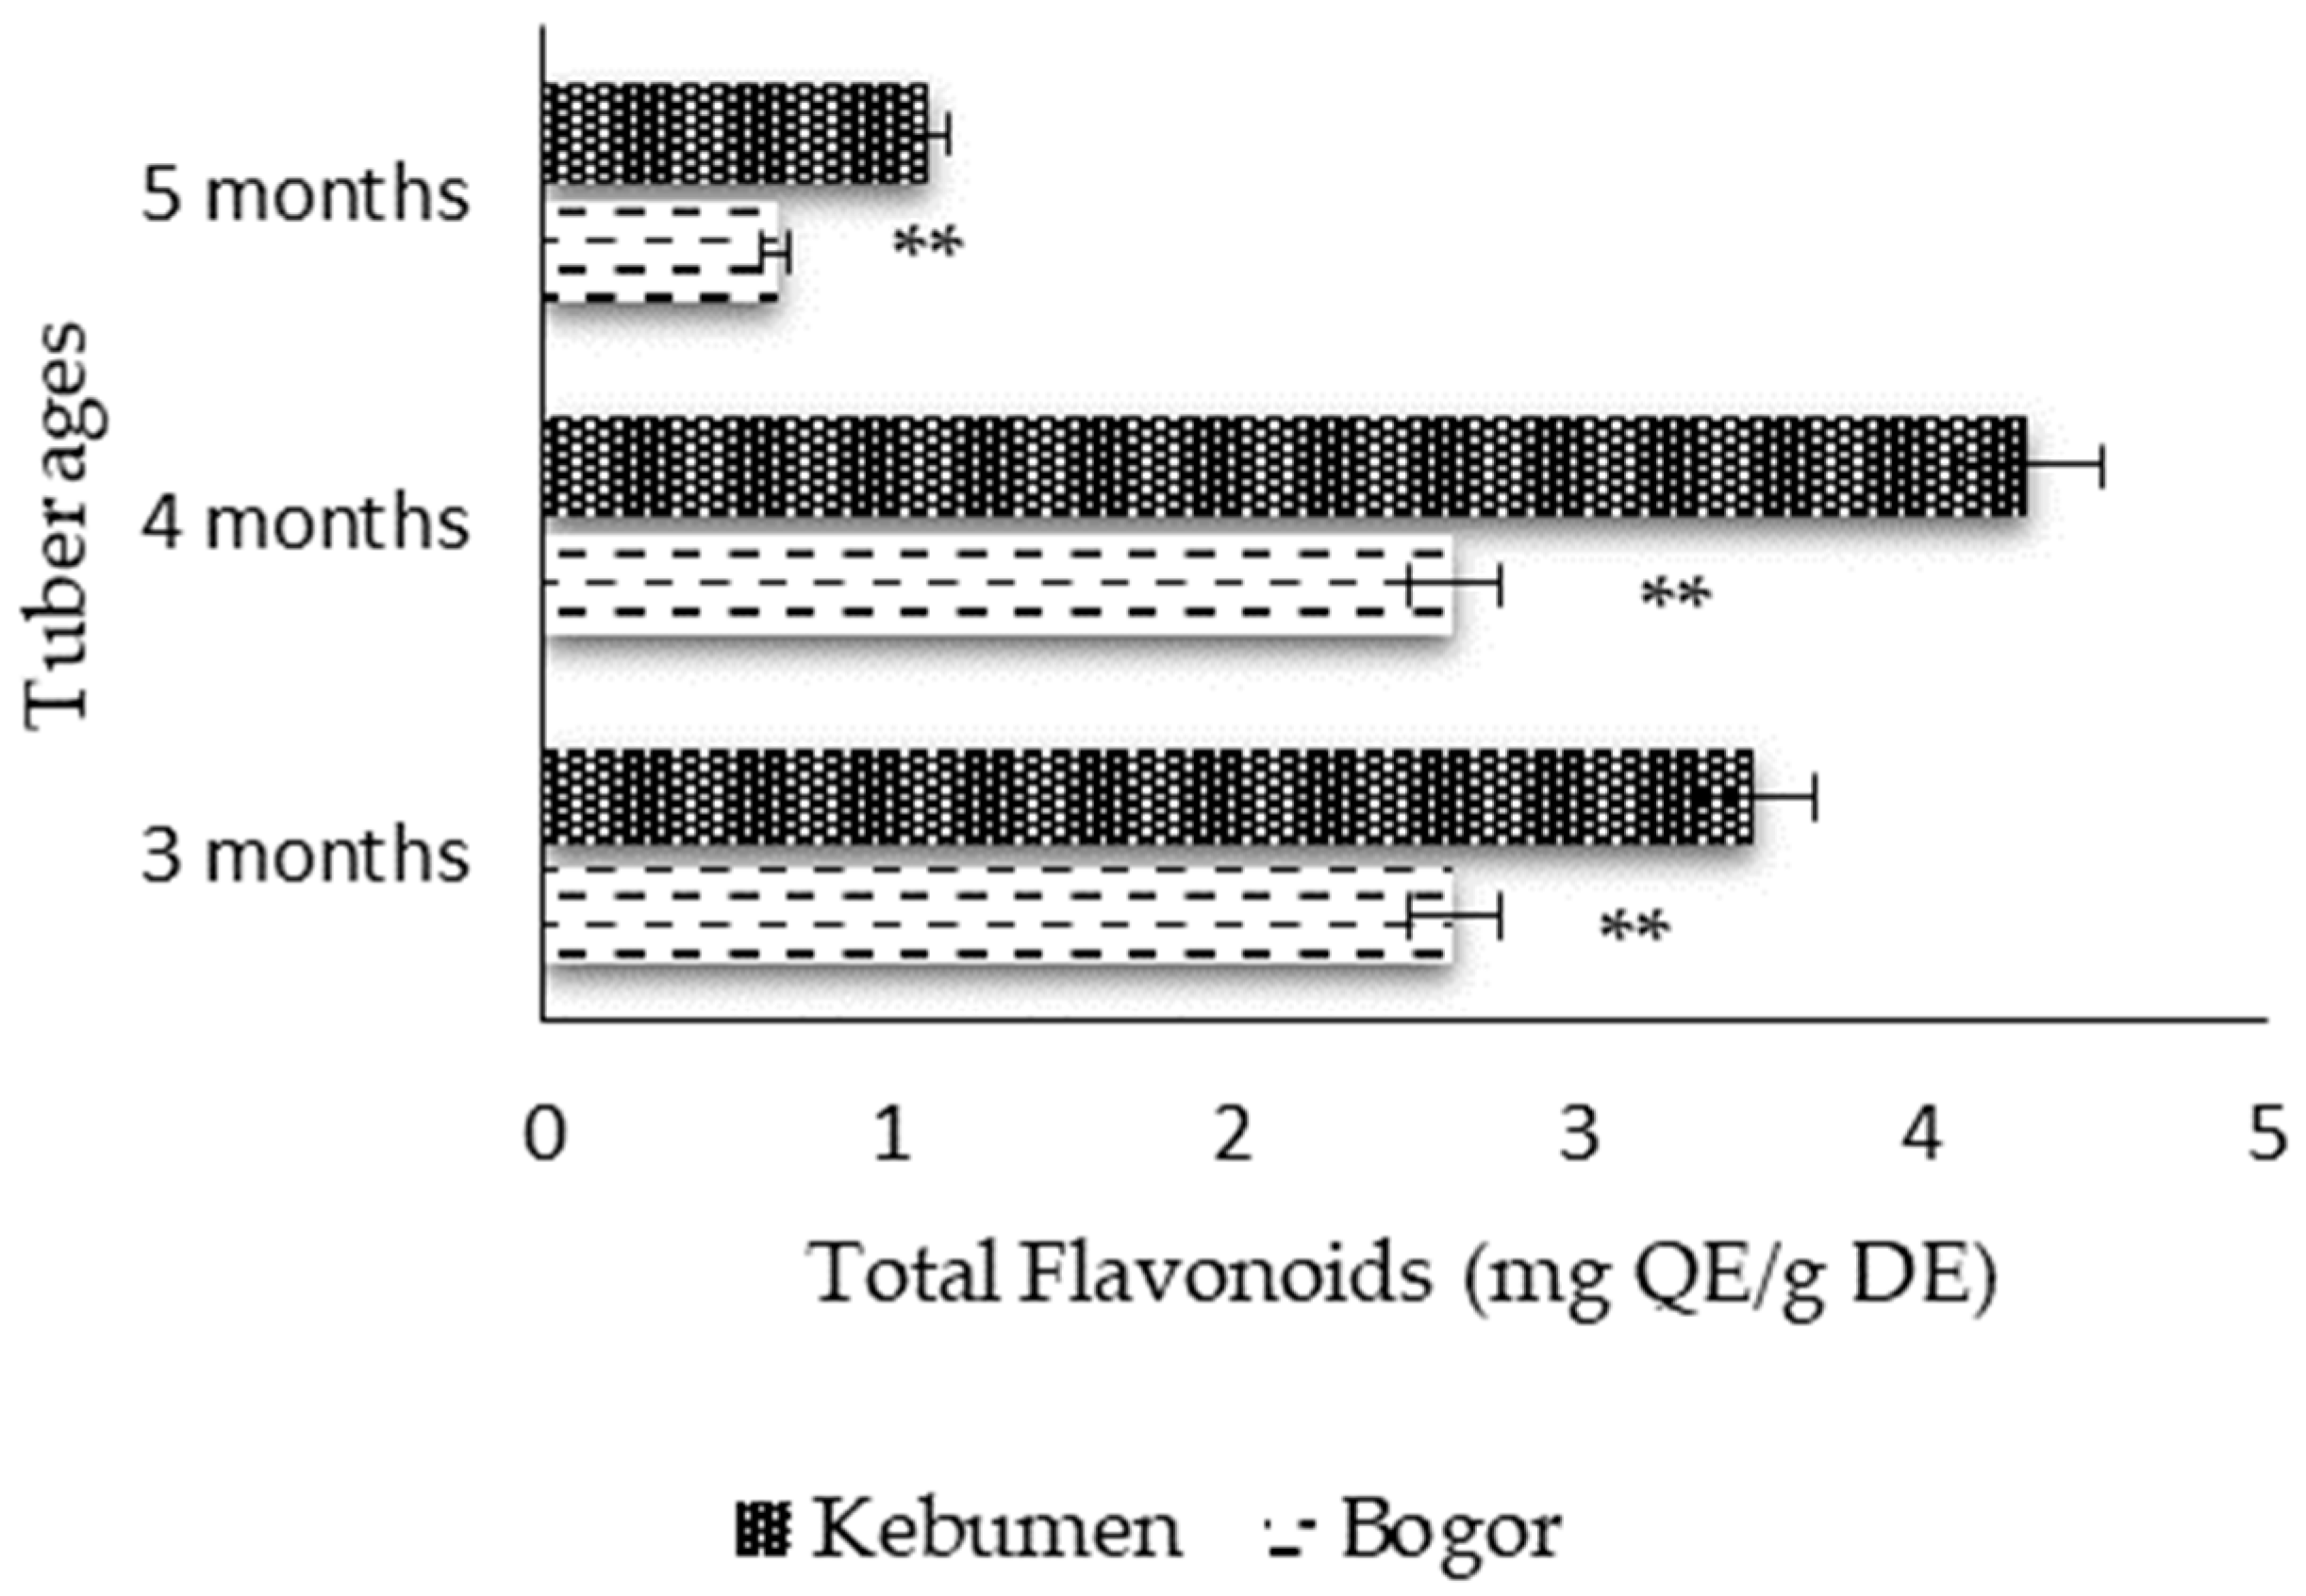
Total flavonoids in Figure 12 show a similar trend to total phenols in Figure 11, where they are relatively high at 3–4 months of tuber age and decrease significantly at 5 months. Flavonoids act as natural antioxidants that are produced in large quantities in the early stages of plant growth as a protective agent against environmental stress [51]. This decrease in flavonoid value is thought to be due to the plant focusing on tuber enlargement, thereby reducing the photosynthate for flavonoid synthesis. The increase in tuber mass is thought to be related to a decrease in the activity of the enzyme phenylalanine ammonia-lyase (PAL), which plays a role in the metabolic pathway of flavonoid formation [56]. This enzyme is active in the early stages of growth to support plants from environmental stress, but it decreases as the plant ages. In addition to physiological factors, environmental conditions such as nutrient availability, water, and light intensity also affect flavonoid production in tubers.
The total flavonoids in Bogor accessions of jicama tubers had stable values at 3 and 4 months of age, namely 2.64 mg QE/g DE, then decreased to 0.67 mg QE/g DE at 5 months of age. The same thing happened in the Kebumen accession, which had a total flavonoid value of 3.51 mg QE/g DE at 3 months of age and increased to 4.31 mg QE/g DE at 4 months of age, then decreased to 1.12 at 5 months of age (Figure 12). Another study reported that jicama tubers contain 4.20–9.93 mg QE/g DE of total flavonoids [51]. The Kebumen accession produced higher total flavonoid levels than the Bogor accession at 4 months of age. This is thought to be due to genetic and environmental differences that affect plant growth and metabolite content [57,58]. The Bogor accession in this study was reported to have more stable total phenol values, while Kebumen was superior in total flavonoid content. These two compounds are often formulated as skin protectants against oxidative stress, such as that caused by UV exposure [50,51].

3.2.7. Antioxidant Activity

The antioxidant activity of jicama tubers was analyzed using the DPPH (2,2-diphenyl-1-picrylhydrazyl) method using spectrophotometry with ascorbic acid as a positive control and standard. Ascorbic acid was chosen as the standard because it is able to effectively donate electrons to neutralize DPPH radicals, so it is widely used as a positive control in the analysis of antioxidant activity from natural materials [59,60].
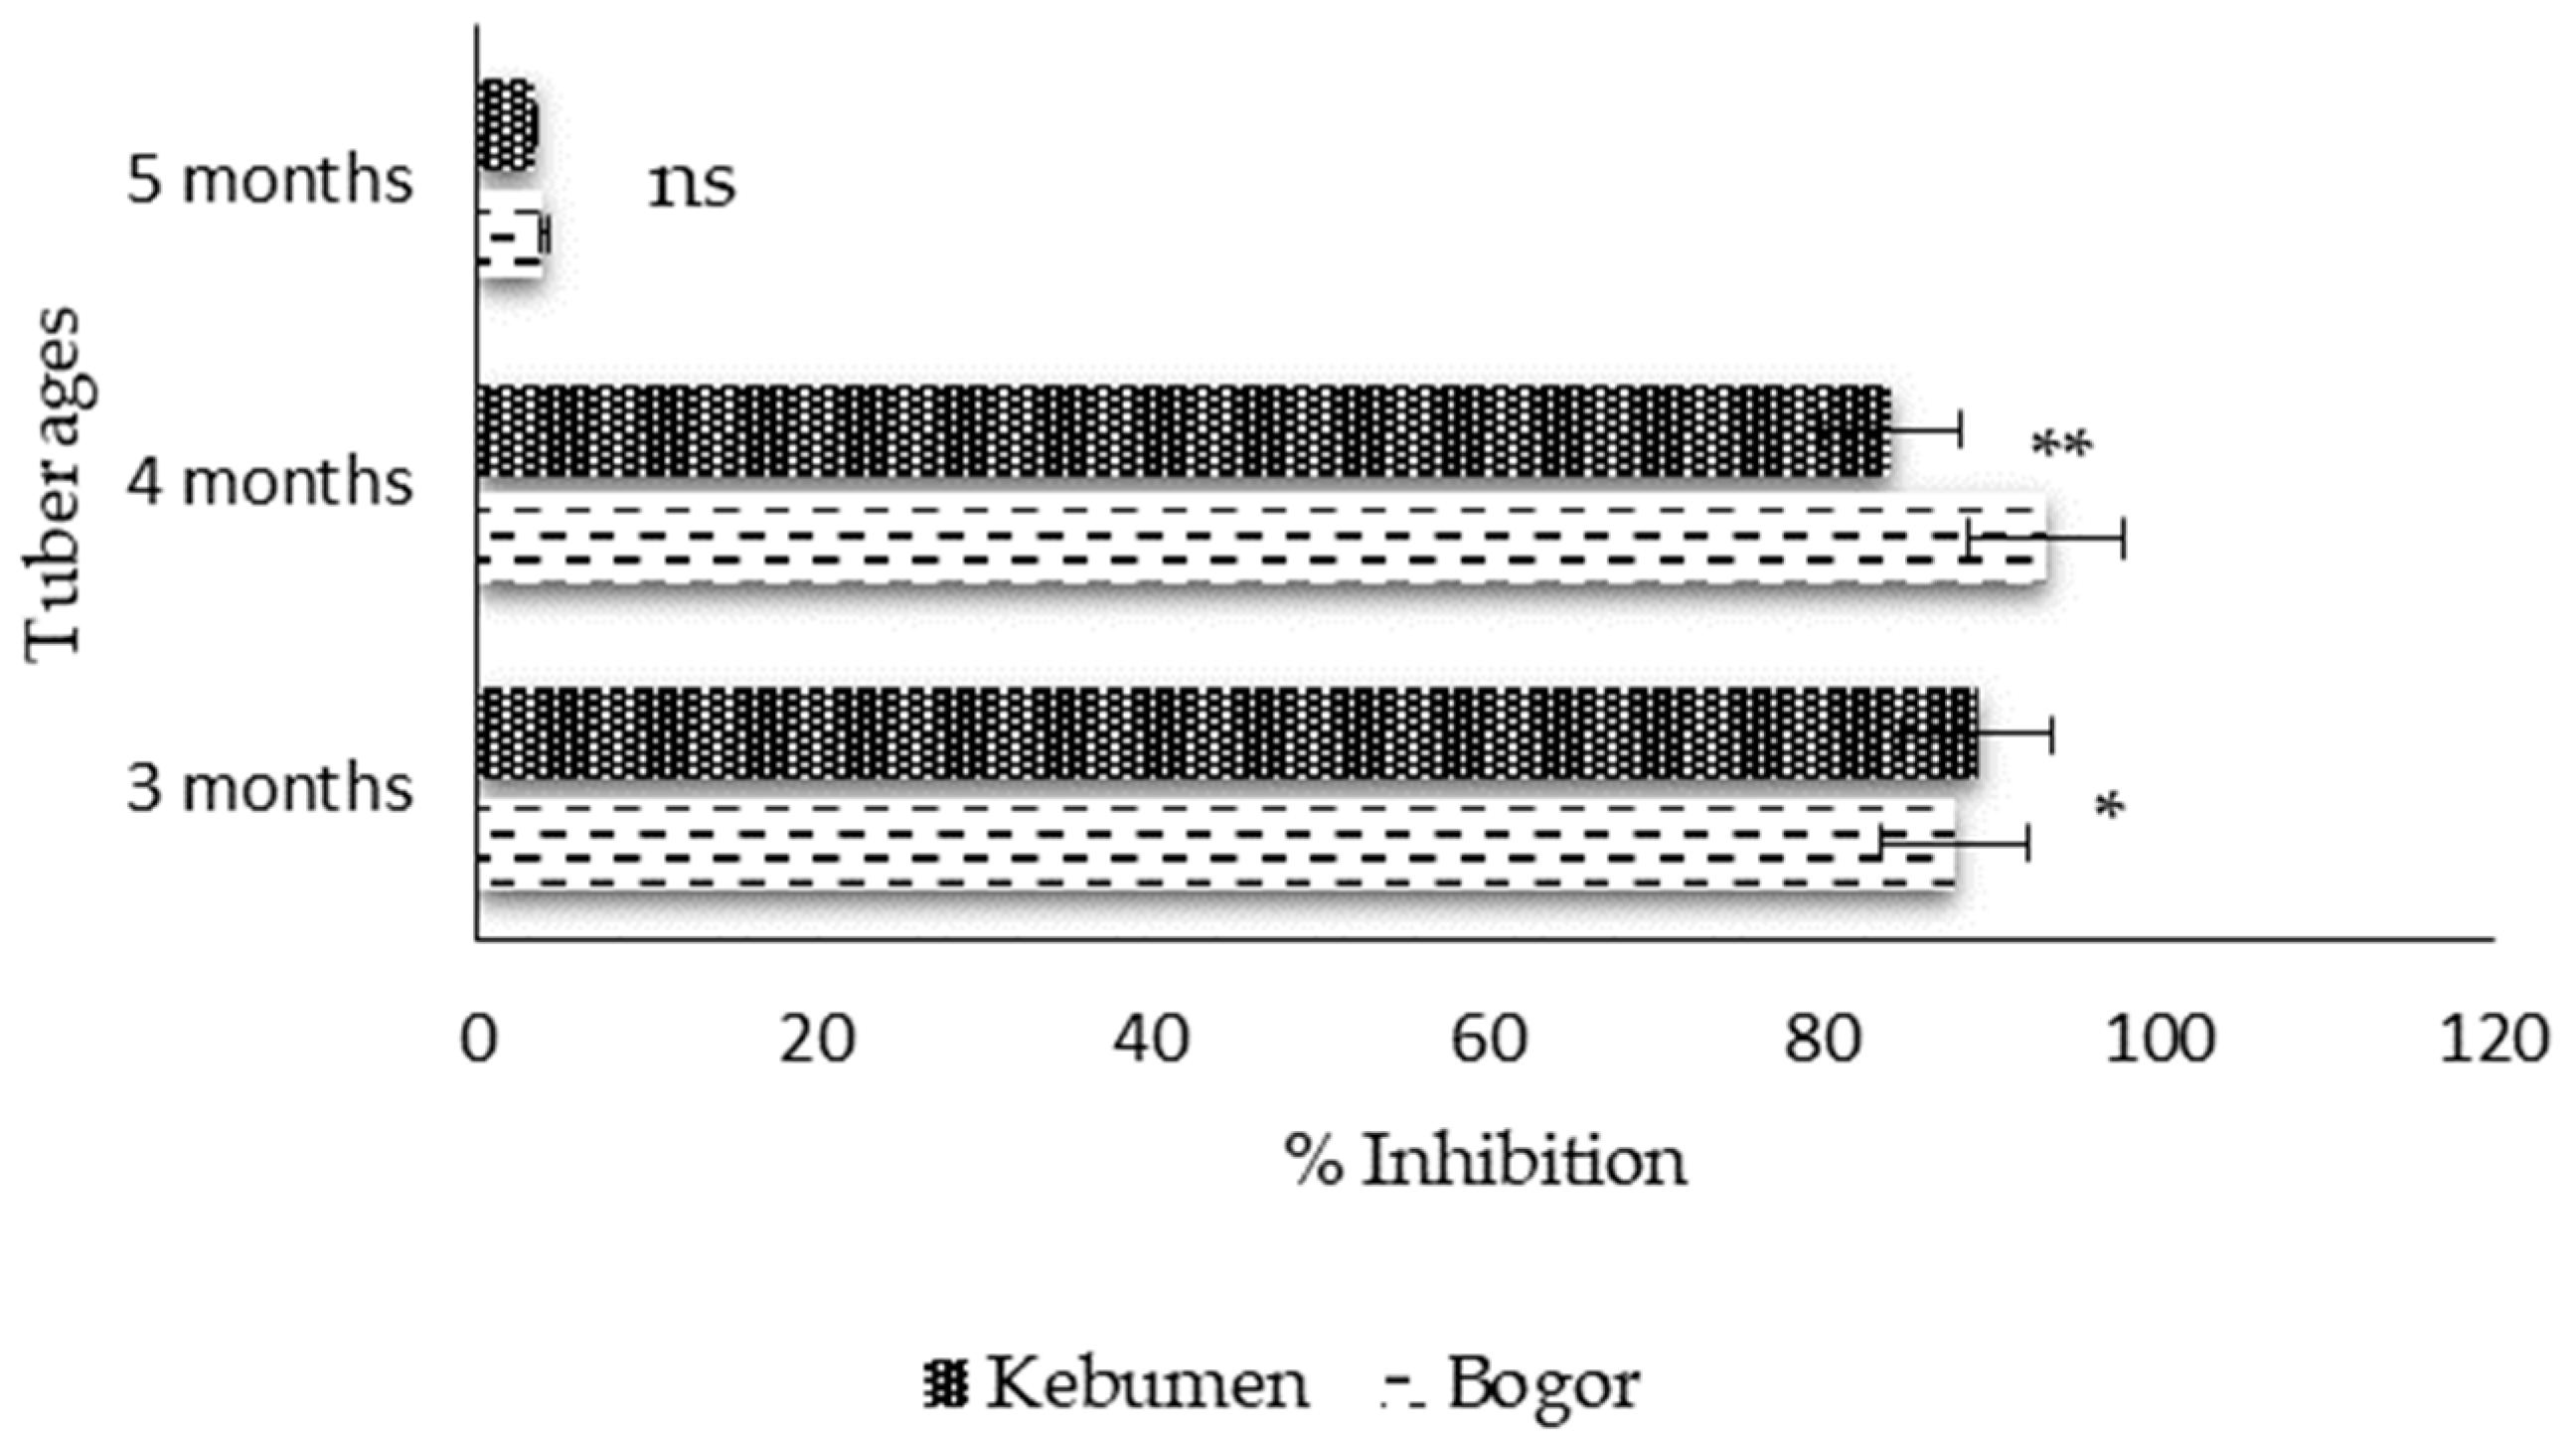
Antioxidant activity is the ability of bioactive compounds in plants to counteract free radicals, thereby preventing cell and tissue damage [61]. Phenolic compounds, flavonoids, and vitamin C content in jicama tubers act as antioxidants. The higher the content of metabolites produced, the higher the antioxidant activity [53]. These compounds are easily oxidized by light, temperature, and oxygen, so appropriate methods are necessary in the analysis process [60]. The inhibition percentage represents the percentage of a compound’s ability to inhibit free radicals. The inhibition percentage values of jicama tubers in both the Bogor and Kebumen accessions showed a decrease as the tubers aged (Figure 13).
The antioxidant activity of jicama tubers in Figure 13 shows a significant downward trend in line with the decrease in enol and flavonoid content in the tubers. The Bogor accession had an antioxidant activity inhibition value of 88.01% at 3 months of age, increasing to 93.34% at 4 months of age, then decreasing drastically to 3.93% at 5 months of age. A similar pattern occurred in the Kebumen accession, namely 89.32% at 3 months of age, 84.16% at 4 months of age, and 3.51% at 5 months of age. This shows that the ability of tubers to ward off free radicals is more optimal in the early stages of growth (young), when the content of phenols, flavonoids, and vitamin C is still high. The decrease in tuber antioxidant activity at an older age is related to the reduction in the biosynthesis of new secondary metabolites during the plant tissue maturation period [13,48]. The process of tissue aging in plants can increase oxidative activity, thereby accelerating the degradation of phenolic and flavonoid compounds, which affects the decline in antioxidant capacity [62].
Jicama tubers had an antioxidant activity inhibition percentage of 27.04% in tests with a concentration of 500 ppm [63]. Other studies reported that antioxidant activity testing using ethanol, acetone, and n-hexane extracts yielded average inhibition percentages (%) of 52.87%, 67.61%, and 44.08%, respectively [64]. Jicama tubers have an IC50 value of 40 ± 0.02 μg/mL using a test concentration above 200 ppm [53]. A higher inhibition percentage indicates that the antioxidant compound is more effective at warding off free radicals [65]. Antioxidants play an important role in the world of beauty, especially in brightening and maintaining skin elasticity. The use of natural ingredients as raw materials in beauty product formulations has been increasingly developed because they have a better impact than chemical ones [59,66]. Other studies also state that testing of jicama root and skin extracts has been found to be effective as anti-aging agents, skin whitening agents, and anti-melanogenic agents on the skin [55,67,68].

4. Discussion

The differences in accession and tuber age had a clear effect on the phenology of growth and metabolite accumulation in jicama. The Kebumen accession showed more significant tuber growth with higher tuber weights, namely 46.50 g (three months) and 79 g (four months), compared to Bogor (28.50 g and 52.50 g). However, at five months of age, the weights of the two accessions did not differ significantly, indicating that genetic differences can influence the early stages of tuber growth. Other studies stated that Pachyrhizus erosus growth between genotypes differs in the early stages of growth but tends to converge at older ages [20]. Starch yield in this study consistently increased from 3 to 5 months of age, indicating that the capacity to convert photosynthates to starch is stronger during the tuber maturation phase [10]. Total soluble solids (TSS) increased with tuber maturity in the Bogor accession from 4.13 (°Bx) at 3 months to 6.28 (°Bx) at 5 months, while the Kebumen accession increased from 3.96 (°Bx) to 5.46 (°Bx) at 4 months and slightly decreased to 5.44 (°Bx) at 5 months, indicating differences in sugar accumulation between accessions. In contrast, total titratable acids (TTA) increased gradually in both accessions, reaching 0.192% at 5 months, with no significant differences between accessions. The increase in sugar content and relatively stable organic acid levels may contribute to tuber sweetness and pH stability, which are important factors influencing the suitability of jicama tubers as plant-derived ingredients for moisturizing and skin-compatible cosmetic formulations. Vitamin C in tubers was found to increase until 4 months of age and decrease at 5 months of age. This pattern is in line with the regulation of ascorbate metabolism in aging plant tissues [47]. The vitamin C content of both accessions during the balsamic stage (±29 mg/100 g) was above the USDA reference value (20.2 mg/100 g), indicating strong potential as a vitamin C agent for the cosmetics and health industries [12].
Unlike primary metabolite content, the content of secondary metabolites in tubers, namely phenols and flavonoids, decreased with increasing tuber age. The phenol content in the Bogor accession decreased from 6.61 to 6.41 to 5.89 mg GAE/g DE, while in the Kebumen accession, it decreased from 7.21 to 5.67 to 4.23 mg GAE/g DE. A similar thing also happened to flavonoids in both accessions. This consistent decline is thought to be due to the trade-off between growth and the plant’s defense system, in which the photosynthates produced are diverted from the phenylpropanoid pathway to tuber enlargement [10,56]. A similar thing happened to the antioxidant activity value of the tubers. At a young age of 3–4 months, antioxidant inhibition reached 88–93% but decreased significantly at 5 months of age. This decrease reflects the decline in phenols and flavonoids; other research has found that the antioxidant activity of jicama is highly correlated with phenolic compounds in the tuber [53]. Integrally, 4-month-old yams, particularly the Bogor accession, showed better and more balanced values between productivity and bioactive content with high vitamin C (29.33 mg/100 g), stable phenols (6.41 mg GAE/g DE), and strong antioxidant activity (93.34%). Meanwhile, the 5-month-old Kebumen accession is more optimal for starch production.

5. Conclusions

This study demonstrates that both accession and tuber age significantly influence growth, primary metabolite accumulation, and secondary metabolite content in jicama tubers. Tuber weight and starch yield increased with tuber age, reaching their highest values at 5 months after planting. At this stage, tuber weight reached an average of 280.85 g (Bogor) and 256.60 g (Kebumen), while starch yield increased to 10.76% and 12.25%, respectively. Total soluble solids increased with maturity in the Bogor accession (4.13–6.28 °Bx) and peaked at 4 months in the Kebumen accession (5.46 °Bx), while total titratable acids gradually increased in both accessions to 0.192% at 5 months. These results indicate differences in sugar accumulation but relatively stable organic acid levels, suggesting the potential of jicama tubers as plant-derived ingredients with sweetness and pH stability relevant for cosmetic applications.
In contrast, secondary metabolites showed a declining trend with increasing tuber age. Total phenol content decreased from 6.61 to 7.21 mg GAE/g DE at 3 months to 4.23–5.89 mg GAE/g DE at 5 months, while total flavonoid content declined markedly from 2.64 to 4.31 mg QE/g DE at 3–4 months to below 1.12 mg QE/g DE at 5 months. Antioxidant activity followed a similar pattern, with high inhibition values at 3–4 months (88.01–93.34%) but a sharp decrease at 5 months (3.51–3.93%).
Vitamin C content increased until 4 months of age, reaching peak values of 29.33 mg/100 g (Bogor) and 29.22 mg/100 g (Kebumen), before declining at 5 months. Overall, the Bogor accession exhibited more stable vitamin C, phenolic content, and antioxidant activity across tuber ages, whereas the Kebumen accession showed a higher flavonoid content at younger tuber stages.
Based on the balance between productivity and bioactive compound content, the Bogor accession harvested at 4 months is recommended as the optimal raw material for cosmetic applications, particularly as a source of natural antioxidants and vitamin C. Meanwhile, 5-month-old tubers, especially from the Kebumen accession, are more suitable for starch-based applications.

Author Contributions

Conceptualization, methodology, formal analysis, investigation, data curation, validation, writing—original draft preparation, visualization, project administration, funding acquisition, F.A.K.N. Resources, project administration, supervision, funding acquisition Y.R. Resources, project administration, supervision, Y.C. Conceptualization, methodology, supervision, data curation, validation, writing—original draft preparation, writing—review and editing, A.K. All authors have read and agreed to the published version of the manuscript.

Funding

This research was funded by PT COSMAX Indonesia, through the Grant Research Student 2024 by number IPB: 419/IT3.F1/HK.07.00/P/T/2023.

Institutional Review Board Statement

Not applicable.

Informed Consent Statement

Not applicable.

Data Availability Statement

The data supporting the findings of this study are available from the corresponding author upon reasonable request.

Conflicts of Interest

Yulia Rahmah and Youngkwan Cho are employees of PT Cosmax Indonesia. All authors declare that the research was conducted in the absence of any commercial or financial relationships that could be construed as a potential conflict of interest.

References

  1. Direktorat Jenderal Industri Direktorat Jenderal Industri Kecil, Menengah. Kemenparin Pacu IKM Kosmetik Maksimalkan Pasar Yang Ekspansif. Available online: https://ikm.kemenperin.go.id/kemenperin-pacu-km-kosmetik-maksimalkan-pasar-yang-ekspansif (accessed on 10 December 2025).
  2. Tech in Asia. Tantangan Startup Kecantikan Lokal dari Ketergantungan Impor Bahan Baku. Available online: https://id.techinasia.com/rangkuman-kabar-startup-teknologi-30-mei-2025 (accessed on 15 December 2025).
  3. Manful, M.E.; Ahmed, L.; Barry-Ryan, C. Cosmetic formulations from natural sources: Safety considerations and legislative frameworks in the European union. Cosmet. J. 2024, 11, 72. [Google Scholar] [CrossRef]
  4. Sørensen, M. Yam Bean: Pachyrhizus DC Promoting the Conservation and Use of Underutilized and Neglected Crops 2; International Plant Genetic Resources Institute: Bonn, Germany, 1996. [Google Scholar]
  5. Ferdiansyah, M.R.; Santosa, E. Budi daya tanaman bengkuang (Pachyrhizus erosus L.) di Kelurahan Situgede, Kota Bogor. J. Pusat. Inov. Masy. 2020, 2, 723–731. [Google Scholar]
  6. Rukmana, R.; Yudirachman, H. Kiat Sukses Budi Daya Bengkuang: Tanaman Multi Manfaat; Andi Ofset: Yogyakarta, Indonesia, 2014. [Google Scholar]
  7. Karuniawan, A. Cultivation Status and Genetic Diversity of Yam Bean (Pachyrhizus erosus (L.) Urban) in Indonesia. Ph.D. Thesis, Georg-August-Universität Göttingen, Göttingen, Germany, 2004. [Google Scholar]
  8. Panggabean, F.; Mawarni, L.; Nissa, T. Respon pertumbuhan dan produksi bengkuang (Pachyrhizus erosus (L.) URBAN) terhadap waktu pemangkasan dan jarak tanam. J. Agroekoteknologi 2014, 2, 702–711. [Google Scholar]
  9. Mustika Ratu. Bengkoang Series Mustika Ratu: Pilihan Tepat Untuk Kulit Anda. Available online: https://mustika-ratu.co.id/2022/02/bengkoang-series-mustika-ratu/ (accessed on 15 December 2025).
  10. Li, Y.; Kong, D.; Fu, Y.; Sussman, M.R.; Wu, H. The effect of developmental and environmental factors on secondary metabolites in medicinal plants. Plant Physiol. Biochem. 2020, 148, 80–89. [Google Scholar] [CrossRef] [PubMed]
  11. Shultz, J.D.; Carita, A.C.; Mohd, H.; Michniak-Kohn, B.; Aiello, L.M.; Leonardi, G.R. Cosmetic formulation containing vitamin C and the instability challenge. Res. J. Trop. Cosmet. Sci. 2022, 13, 3–9. [Google Scholar] [CrossRef]
  12. United State Department of Agriculture. Food Data Central National Yam bean (Jicama), Raw USA. 2019. Available online: https://fdc.nal.usda.gov/food-details/2709787/nutrients (accessed on 24 August 2024).
  13. Fawole, O.A.; Opara, U.L. Changes in physical properties, chemical and elemental composition, and antioxidant capacity of pomegranate (cv. Ruby) fruit at five maturity stages. Sci. Hortic. 2013, 150, 37–46. [Google Scholar] [CrossRef]
  14. Sumbaga, D.R. Pengaruh Lokasi dan umur umbi Bengkuang Terhadap Kualitas dan Kuantitas Umbi Bengkuang. Bachelor’s Thesis, Universitas Muhammadiyah Purwokerto, Purwokerto, Indonesia, 2022. [Google Scholar]
  15. Pati, K.; Kaliyappan, R.; Chauhan, V.B.S.; Bansode, V.; Nedunchexhiyan, M.; Hegde, V.; Koudinya, A.V.V. Phenological growth stages of underutilised crop yam bean (Pachyrhizus erosus L. Urban) according to the extended BBCH scale. Ann. Int. J. 2020, 177, 417–423. [Google Scholar] [CrossRef]
  16. González-Vázquez, M.; Calderón-Domínguez, G.; Mora-Escobedo, R.; Salgado-Cruz, M.P.; Arreguín-Centeno, J.H.; Monterrubio-López, R. Polysaccharides of nutritional interest in jicama (Pachyrhizus erosus) during root development. Food Sci. Nutr. 2022, 10, 1146. [Google Scholar] [CrossRef]
  17. Ghasemzadeh, A.; E Jaafar, H.Z.; Ashkani, S.; Rahmat, A.; Juraimi, A.S.; Puteh, A.; Muda, M.M.T. Variation in secondary metabolite production as well as antioxidant and antibacterial activities of Zingiber zerumbet (L.) at different stages of growth. BMC Complement. Altern. Med. 2016, 16, 104. [Google Scholar] [CrossRef]
  18. Cao, T.; Wang, S.; Ali, A.; Shan, N.; Sun, J.; Chen, X.; Wang, P.; Zhu, Q.; Xiao, Y.; Luo, A.; et al. Transcriptome and metabolome analysis reveals the potential mechanism of tuber dynamic development in yam (Dioscorea polystachya Turcz.). Food Sci. Technol. 2023, 181, 114764. [Google Scholar] [CrossRef]
  19. Krisnawati, A.; Sutrisno, S.; Adie, M.M. Diversity in tuber characteristics of local cultivars of yam bean (Pachyrhizus erosus) in Indonesia. Biosaintifika J. Biol. Biol. Edu. 2018, 10, 267–274. [Google Scholar] [CrossRef]
  20. Jean, N.; Patrick, R.; Phenihas, T.; Rolland, A.; Placide, R.; Robert, M.O.M.; Silver, T.; Vestine, K.; Evrard, K.; Grüneberg, W.J. Evaluation of performance of introduced yam bean (Pachyrhizus spp.) in three agro-ecological zones of Rwanda. Trop Plant Biol. 2017, 10, 97–109. [Google Scholar] [CrossRef]
  21. Lintang, J.A.; Rusmarilin, H.; Lubis, L.M. Aktivitas antioksidan ekstrak umbi bengkoang pada berbagai umur panen dengan metode DPPH (2,2-diphenyl-1-picrylhydrazyl). J. Rekayasa Pangan Pert 2014, 2, 47–56. [Google Scholar]
  22. Gong, M.; Luo, H.; Wang, A.; Zhou, Y.; Huang, W.; Zhu, W.; Zhu, P.; He, L. Phytohormone profiling during tuber development of chinese yam by ultra-high performance liquid chromatography-triple quadrupole tandem mass spectrometry. J. Plant Growth Regul. 2017, 36, 362–373. [Google Scholar] [CrossRef]
  23. An, L.; Yuan, Y.; Chen, H.; Li, M.; Ma, J.; Zhou, J.; Zheng, L.; Ma, H.; Chen, Z.; Hao, C.; et al. Comprehensive widely targeted metabolomics to decipher the molecular mechanisms of Dioscorea opposita thunb. Cv. Tiegun quality formation during harvest. Food Chem. 2024, 10, 101159. [Google Scholar] [CrossRef]
  24. Nursandi, F.; Machmudi, M.; Santoso, U.; Indratami, D. Properties of different aged yam bean (Pachyrhizus erozus) plants. In IOP Conference Series: Earth and Environmental Science; Institute of Physics Publishing: Bristol, UK, 2017; Volume 77, pp. 1–4. [Google Scholar]
  25. Ismillayli, N.; Hermanto, D.; Andayani, I.G.A.S.; Honiar, R.; Zuryati, U.K.; Mariana, B.; Shofiyana, L.M. Determination of ascorbic acid content using the reverse phase-high performance liquid chromatography (rp-hplc) method. Al-Kimia 2020, 8, 168–176. [Google Scholar]
  26. Pegg, R.B.; Landen, W.O.; Eitenmiller, R.R. Vitamin Analysis; Springer: New York, NY, USA, 2010. [Google Scholar]
  27. AOAC. Official Methods of Analysis of the AOAC; AOAC International: Rockville, MD, USA, 2006. [Google Scholar]
  28. Noman, A.S.M.; Hoque, M.A.; Haque, M.M.; Pervin, F. Nutritional and anti-nutritional components in Pachyrhizus erosus L. tuber. Food Chem. 2007, 102, 1112–1118. [Google Scholar] [CrossRef]
  29. Miksusanti Solihah, I.; Wijaya, D.P. Pati Umbi-Umbian dan Resisten Starch Sebagai Prebiotik Untuk Kesehatan; NEM: Pekalongan, Indonesia, 2020. [Google Scholar]
  30. Sadler, G.D.; Murphy, P.A. pH and Titrable Acidity. In Food Analysis, 4th ed.; Nielsen, S.S., Ed.; Springer: New York, NY, USA, 2010; pp. 219–238. [Google Scholar]
  31. Folin, O.; Denis, W. On phosphotungstic-phosphomolybdic compounds as color reagents. J. Biol. Chem. 1912, 12, 239–243. [Google Scholar] [CrossRef]
  32. Park, C.H.; Yeo, H.J.; Kim, Y.J.; Van, N.B.; Park, Y.E.; Sathasivam, R.; Kim, J.K.; Park, S.U. Profiles of secondary metabolites (phenolic galantamine) and primary metabolites (carbohydrates, amino acids, and organic acids) during flower development in Lycoris radiata. Biomolecules 2021, 11, 248. [Google Scholar] [CrossRef]
  33. Blois, M.S. Antioxidant determinations by the use of a stable free radical. Nature 1958, 181, 1199–1200. [Google Scholar] [CrossRef]
  34. Setyono, C. Pengaruh Umur Umbi dan Lama Penyimpanan Terhadap Mutu Fisik dan Kimia Umbi Bengkuang (Pachyrhizus erosus L.). Bachelor’s Thesis, Universitas Muhammadiyah Malang, Malang, Indonesia, 2017. [Google Scholar]
  35. Li, P.; An, Z.; Xu, N.; Li, J.; Li, Q.; He, C. Phenotypic plasticity and stability in plants: Genetic mechanisms, environmental adaptation, evolutionary implications, and future directions. Plant Cell Environ. 2025, 48, 5847–5860. [Google Scholar] [CrossRef]
  36. Salam, U.; Ullah, S.; Tang, Z.H.; Elateeq, A.A.; Khan, Y.; Khan, J.; Khan, A.; Ali, S. Plant metabolomics: An overview of the role of primary and secondary metabolites against different environmental stress factors. Life 2023, 13, 706. [Google Scholar] [CrossRef]
  37. Nugroho, A. Teknologi Bahan Alam; Lambung Mangkurat University Press: Banjarmasin, Indonesia, 2017. [Google Scholar]
  38. Rahman, R.; Thamrin, G.A.R.; Kurdiansyah, K. Uji fitokimia jelatang gajah (Dendrocnide stimulans) di Kawasan hutan dengan tujuan khusus Universitas Lambung Mangkurat. J. Sylva Sci. 2021, 4, 501–508. [Google Scholar] [CrossRef]
  39. Katuuk, R.H.H.; Wanget, S.A.; Tumewu, P. The effect of differences in site height on the content of secondary metabolites of babandotan weeds (Ageratum conyzoides L.). E-J. Unstrad. 2018, 10, 1–6. [Google Scholar] [CrossRef]
  40. Dalimunthe, C.I.; Rachmawan, A. Prospek pemanfaatan metabolit sekunder tumbuhan sebagai pestisida nabati untuk pengendalian pathogen pada tanaman karet. War. Perkaretan. 2017, 36, 15–28. [Google Scholar]
  41. Kaur, C.D.; Saraf, S. In vitro sun protection factor determination of herbal oils used in cosmetics. Pharmacogn. Res. 2010, 2, 22–25. [Google Scholar] [CrossRef]
  42. Solihin, M.A.; Sitorus, S.R.P.; Sutandi, A.; Widiatmaka, M. Karakteristik lahan dan kualitas kemanisan ubi jalar cilembu. J. Peng SDA Ling 2017, 7, 251–259. [Google Scholar] [CrossRef]
  43. Draelos, Z.D. Active agents in common skin care products. Plast Reconstr. Surg. 2010, 125, 719–724. [Google Scholar] [CrossRef]
  44. Albuquerque, G.N.; Costa, R.G.; Barba, F.J.; Gomez, B.; Ribeiro, N.L.; Filho, E.M.B.; Sousa, S.D.; Santos, J.G.; Lorenzo, J.M. Effect of organic acid on the quality of sheep “buchada”; from food safety to physicochemical, nutria, and sensorial evaluation. J. Food Process. Preserv. 2019, 43, e13877. [Google Scholar] [CrossRef]
  45. Chambial, S.; Dwivedi, S.; Shukla, K.K.; Jhon, P.J.; Sharma, P. Vitamin C in disease prevention and cure: An overview. Indian J. Clin. Biochem. 2013, 28, 314–328. [Google Scholar] [CrossRef] [PubMed]
  46. Pullar, J.M.; Carr, A.C.; Vissers, M.C.M. The roles of vitamin C in skin health. Nutrients 2017, 9, 866. [Google Scholar] [CrossRef]
  47. Widyatmoko, A.; Hastutik, D.; Sudarmanto, A.; Lukitaningsih, E. Kandungan vitamin C, vitamin A dan alpha hydroxy acid dalam bengkoang (Pachyrhizus erosus). Tradit. Med. J. 2016, 21, 48–54. [Google Scholar]
  48. Zheng, X.; Gong, M.; Zhang, Q.; Tan, H.; Li, L.; Tang, Y.; Li, Z.; Peng, M.; Deng, W. Metabolism and regulation of ascorbic acid in fruits. Plants 2022, 11, 1602. [Google Scholar] [CrossRef] [PubMed]
  49. Zhang, L.; Zhang, F.; Wang, Y.; Ma, X.; Shen, Y.; Wang, X.; Yang, H.; Zhang, W.; Lakshmanan, P.; Hu, Y.; et al. Physiological and metabolomic analysis reveals maturity stage-dependent nitrogen regulation of vitamin C content in pepper fruit. Front. Plant Sci. 2023, 13, 1049785. [Google Scholar] [CrossRef]
  50. Kabera, J.N.; Semana, E.; Mussa, A.R.; He, X. Plant secondary metabolites: Biosynthesis, classification, function and pharmacological properties. J. Pharm. Pharmacol. 2014, 2, 377–392. [Google Scholar]
  51. Rodriguez-Arce, E.; Saldias, M. Antioxidant properties of flavonoid metal complexes and their potential inclusion in the development of novel strategies for the treatment against neurodegenerative diseases. Biomed. Pharmacother. 2021, 143, 112236. [Google Scholar] [CrossRef]
  52. Zhang, T.; Zheng, J.; Yu, Z.; Huang, X.; Zhang, Q.; Tian, X.; Peng, C. Functional characteristics of phenolic compounds accumulated in young leaves of two subtropical forest tree species of different successional stages. Tree Physiol. 2018, 38, 1486–1501. [Google Scholar] [CrossRef]
  53. Laovachirasuwan, P.; Phadungkit, M. Total Phenolic and Flavonoid Contents, Anti-tyrosinase and Antioxidant Activities of Pachyrhizus erosus Extracts. Pharmacogn. J. 2023, 15, 839–842. [Google Scholar] [CrossRef]
  54. Eware, K.T.; Louis, N.B.; Gosdon, T.F.B. Intra-specific flavonoid classes, content and relationships in african yam bean (Sphenostylis stenocarpa [Hochst ex A. Richmond] Harms] tubers. Res. J. Bot. 2024, 19, 1–9. [Google Scholar] [CrossRef]
  55. Lukitaningsih, E. Bioactive compounds in bengkoang (Pachyrhizus erosus) as antioxidant and tyrosinase inhibiting agents. Indones J. Pharm. 2014, 25, 68. [Google Scholar] [CrossRef]
  56. Dong, N.Q.; Lin, H.X. Contribution of phenylpropanoid metabolism to plant development and plant–environmentinteractions. J. Integr. Plant Biol. 2021, 6, 180–209. [Google Scholar] [CrossRef] [PubMed]
  57. Jaiswal, V.; Chauhan, S.; Lee, H.J. The bioactivity the bioactivity and phytochemicals of Pachyrhizus erosus (L.) urb.: A multifunctional underutilized crop plant. Antioxid. J. 2022, 11, 58. [Google Scholar] [CrossRef]
  58. Obidiegwu, J.E.; Bryan, J.G.; Jones, H.G.; Prashar, A. Coping with drought: Stress and adaptive responses in potato and perspective for improvement. Front. Plant Sci. 2015, 6, 542. [Google Scholar] [CrossRef]
  59. Masaki, H. Role of antioxidants in the skin: Anti-aging effects. J. Dermatol. Sci. 2010, 58, 85–90. [Google Scholar] [CrossRef] [PubMed]
  60. Kruk, J.; Aboul-Enein, B.H.; Duchnik, E.; Marchlewicz, M. Antioxidative properties of phenolic compounds and their effect on oxidative stress induced by severe physical exercise. J. Physiol. Sci. 2022, 72, 19–24. [Google Scholar] [CrossRef] [PubMed]
  61. Rahmi, H. Aktivitas antioksidan dari berbagai sumber buah-buahan di Indonesia. J. Agrotek Ind. 2017, 2, 34–38. [Google Scholar] [CrossRef]
  62. Xu, D.P.; Li, Y.; Meng, X.; Zhou, T.; Zhou, Y.; Zheng, J.; Zhang, J.J.; Li, H.B. Natural antioxidants in food and medical plants: Extraction, assessment and resources. Int. J. Mol. Sci. 2017, 18, 96. [Google Scholar] [CrossRef]
  63. Kardono, L.B.S.; Liandhajani, L.; Artanti, N.; Iskandar, Y.M.; Sutaryo, S.M.B. Development of papaya latex, papaya extract (Carica papaya L.) and yam bean tuber extract (Pachyrrhizus erosus (L.) urb.) for skin lightening lotion based on tyrosinase inhibition and antioxidant activities. JIFI 2013, 11, 191–196. [Google Scholar]
  64. Chandra, B.; Wijaya, J.; Yetti, R.D.; Azizah, Z. Identifikasi metabolit sekunder dan pengujian aktivitas antioksidan pada umbi bengkuang (Pachyrizius erosus (L.) Urb.). J. Far. Higea 2023, 15, 206–2014. [Google Scholar] [CrossRef]
  65. Bahriul, P.; Nurdin, R.; Anang, W.M.D. Uji aktivitas antioksidan ekstrak daun salam (Syzygium polyanthum) dengan menggunakan 1,1-difenil-2-pikrihidrazil. JAK 2014, 3, 143–149. [Google Scholar]
  66. Kusumawati, I.; Indrayanto, G. Natural antioxidants in cosmetics. In Studies in Natural Products Chemistry; Elsevier: Amsterdam, The Netherlands, 2013; Volume 40, pp. 485–505. [Google Scholar]
  67. Lee, A.; Kim, G.N.; Kim, H.O.; Song, W.; Roh, S.S. Antioxidant activity and melanin inhibitory effects of yam bean (Pachyrhizus erosus) extract. Korea J. Herbol. 2017, 32, 57–64. [Google Scholar]
  68. Siregar, I.D.; Kusuma, H.S.W.; Widowati, W.; Marpaung, H.H.; Ferdinand, S.; Fachrial, E.; Lister, I.N.E. Antioxidant and antityrosinase activities of ethanolic Pachyrhizus erosus peel and tuber extract. Maj. Kedokt. 2019, 51, 75–81. [Google Scholar]
Figure 1. Calibration curve of gallic acid used for the determination of total phenol (n = 3). The dots represent the measured data points, and the dashed line indicates the linear regression.
Cosmetics 13 00108 g001
Figure 2. Calibration curve of quercetin used for the determination of total flavonoid content (n = 3). The dots represent the measured data points, and the dashed line indicates the linear regression.
Cosmetics 13 00108 g002
Figure 3. Calibration curve of ascorbic acid used for the determination of antioxidant activity (n = 3). The dots represent the measured data points, and the dashed line indicates the linear regression.
Cosmetics 13 00108 g003
Figure 4. Phenology of tuber weight of Bogor and Kebumen jicama accessions at different tuber ages. * significant (p < 0.05); ns not significant (p > 0.05) t-test. The error bars represent a fixed 5% of the mean, calculated to provide a clear visual comparison. Significance levels are based on t-test results (n = 3 tubers per accession, with 3 replications at each tuber age).
Cosmetics 13 00108 g004
Figure 5. Phenology of Bogor accession tuber growth at 3 months (A), 4 months (B), and 5 months (C).
Cosmetics 13 00108 g005
Figure 6. Phenology of tuber growth in Kebumen at 3 months (A), 4 months (B), and 5 months (C).
Cosmetics 13 00108 g006
Figure 7. Starch yield of Bogor and Kebumen jicama accessions at different tuber ages. * significant (p < 0.05); ns not significant (p > 0.05) t-test. The error bars represent a fixed 5% of the mean, calculated to provide a clear visual comparison. Significance levels are based on t-test results (n = 3 tubers per accession, with 3 replications at each tuber age).
Cosmetics 13 00108 g007
Figure 8. Total soluble solids of Bogor and Kebumen jicama accessions at different tuber ages. ** very significant (p < 0.01) t-test. The error bars represent a fixed 5% of the mean, calculated to provide a clear visual comparison. Significance levels are based on t-test results (n = 3 tubers per accession, with 3 replications at each tuber age).
Cosmetics 13 00108 g008
Figure 9. Total titratable acid of Bogor and Kebumen jicama accessions at different tuber ages. ns not significant (p > 0.05) t-test. The error bars represent a fixed 5% of the mean, calculated to provide a clear visual comparison. Significance levels are based on t-test results (n = 3 tubers per accession, with 3 replications at each tuber age).
Cosmetics 13 00108 g009
Figure 10. Vitamin C of Bogor and Kebumen jicama accessions at different tuber ages. ns not significant (p > 0.05) t-test. The error bars represent a fixed 5% of the mean, calculated to provide a clear visual comparison. Significance levels are based on t-test results (n = 3 tubers per accession, with 3 replications at each tuber age).
Cosmetics 13 00108 g010
Figure 11. Total phenols of Bogor and Kebumen jicama accessions at different tuber ages. ** very significant (p < 0.01) t-test. The error bars represent a fixed 5% of the mean, calculated to provide a clear visual comparison. Significance levels are based on t-test results (n = 3 tubers per accession, with 3 replications at each tuber age).
Cosmetics 13 00108 g011
Figure 12. Total flavonoids of Bogor and Kebumen jicama accessions at different tuber ages. ** very significant (p < 0.01) t-test. The error bars represent a fixed 5% of the mean, calculated to provide a clear visual comparison. Significance levels are based on t-test results (n = 3 tubers per accession, with 3 replications at each tuber age).
Cosmetics 13 00108 g012
Figure 13. Percentage inhibition of antioxidant activity of Bogor and Kebumen jicama accessions at different tuber ages. ** very significant (p < 0.01); * significant (p < 0.05); ns not significant (p > 0.05) t-test. The error bars represent a fixed 5% of the mean, calculated to provide a clear visual comparison. Significance levels are based on t-test results (n = 3 tubers per accession, with 3 replications at each tuber age).
Cosmetics 13 00108 g013
Disclaimer/Publisher’s Note: The statements, opinions and data contained in all publications are solely those of the individual author(s) and contributor(s) and not of MDPI and/or the editor(s). MDPI and/or the editor(s) disclaim responsibility for any injury to people or property resulting from any ideas, methods, instructions or products referred to in the content.