3.1. Selection of Oil Phase
The successful formulation of NEs relies on the ability of oil phase (vehicle) to solubilize the active substance, as solubility directly influences the loading capacity, and, consequently, the pharmaceutical efficiency of the final system. In the case of Cur (a highly hydrophobic polyphenolic compound), selecting an appropriate oil phase is particularly critical for achieving both stability and efficacy [
14]. Another significant aspect concerns the thermodynamic stability of the system. When the active compound exhibits high solubility in the oil phase, the likelihood of Cur molecules migrating out of the oil is reduced, thereby helping to prevent destabilization mechanisms such as Ostwald ripening or recrystallization [
21]. This is particularly important in cosmeceutical formulations, where the stability of the final product directly affects its efficacy. Therefore, the selection of the optimal oil (the one that can dissolve the highest possible amounts of the bioactive molecule) is vital.
The Cur solubility results in the various tested oils are presented in
Table 3. Significant differences were observed in the solubilization capacity across the tested oils. Coconut oil exhibited the highest solubility (0.529 mg/mL), nearly twice that of calendula oil, while all other oils showed substantially lower values. This superior performance can be attributed to the fatty acid profile of coconut oil, which is rich in short-chain saturated fatty acids—primarily octanoic acid (53.1%
w/
w) and capric acid (30.8%
w/
w), corresponding to C8 and C10 chains, respectively. Literature reports indicate that Cur solubility in individual fatty acids generally follows the order: octanoic acid >> linoleic acid > oleic acid [
14,
22]. This trend is associated with differences in hydrophilic–lipophilic balance (HLB), which reflects the relative proportions of hydrophilic and hydrophobic components and determines the suitability of an oil for stabilizing oil-in-water (O/W) or water-in-oil (W/O) emulsions. Octanoic acid, with a balanced HLB, promotes the diffusion and integration of Cur molecules into both polymeric and fluid lipid matrices, resulting in higher solubility. Calendula oil (HLB 7), which exhibited the second-highest solubility for Cur (0.291 mg/mL), consists mainly of linoleic and palmitic acid. These fatty acids provide modest, yet notable, solubilizing potential [
23]. Jojoba oil exhibited an intermediate solubilization ability (0.155 mg/mL), relative to other tested oils. Structurally, jojoba oil consists of long, linear alkyl esters lacking polar groups, a characteristic that limits its capacity to solubilize hydrophobic molecules with high polarity or aromatic character, such as Cur [
24]. Additionally, the presence of free hydroxyl or carboxyl groups in the oil may increase the dispersibility of Cur within this system. The low solubility observed for argan oil is likely associated with its high oleic acid (C18) content—reported to be less effective for Cur dissolution than short-chain fatty acids [
25]. In contrast, the purely hydrophobic nature of squalene is the likely reason behind its complete inability to dissolve Cur. Due to the absence of polar or semi-polar groups and its linear molecular structure, squalene lacks the capacity to interact with Cur, precluding the formation of a compatible microenvironment for incorporating hydrophobic active molecules.
3.2. Pseudo-Ternary Phase Diagrams
Studying NE formation in the absence of an active ingredient (blank systems) is a critical step in the design of stable systems, as it enables the determination of the stability region and the appropriate preparation conditions. In this context, pseudoternary phase diagrams were constructed based on the three main components of NEs: (1) coconut oil, (2) water and (3) the emulsifier/co-emulsifier (mass ratio) mixture (S
mix). The objective was to examine the effect of the component mass ratios and the flow rates of the aqueous and oil phases on NE formation using microfluidic devices.
Figure 2a presents the pseudo-ternary phase diagram. Red circles indicate compositions that yielded NEs with an average diameter < 350 nm and ζ-potential < −30 mV, whereas black squares correspond to compositions that did not form NEs. According to the results, the diagram clearly demonstrates that only S
mix values of 1, 2, and 3, combined with aqueous-to-oil phase flow ratios of 50:1 and 100:1, produced NEs meeting the defined particle size and ζ-potential criteria. In contrast, lower flow ratios (e.g., 10:1 and 20:1) failed to generate NEs within the target specifications.
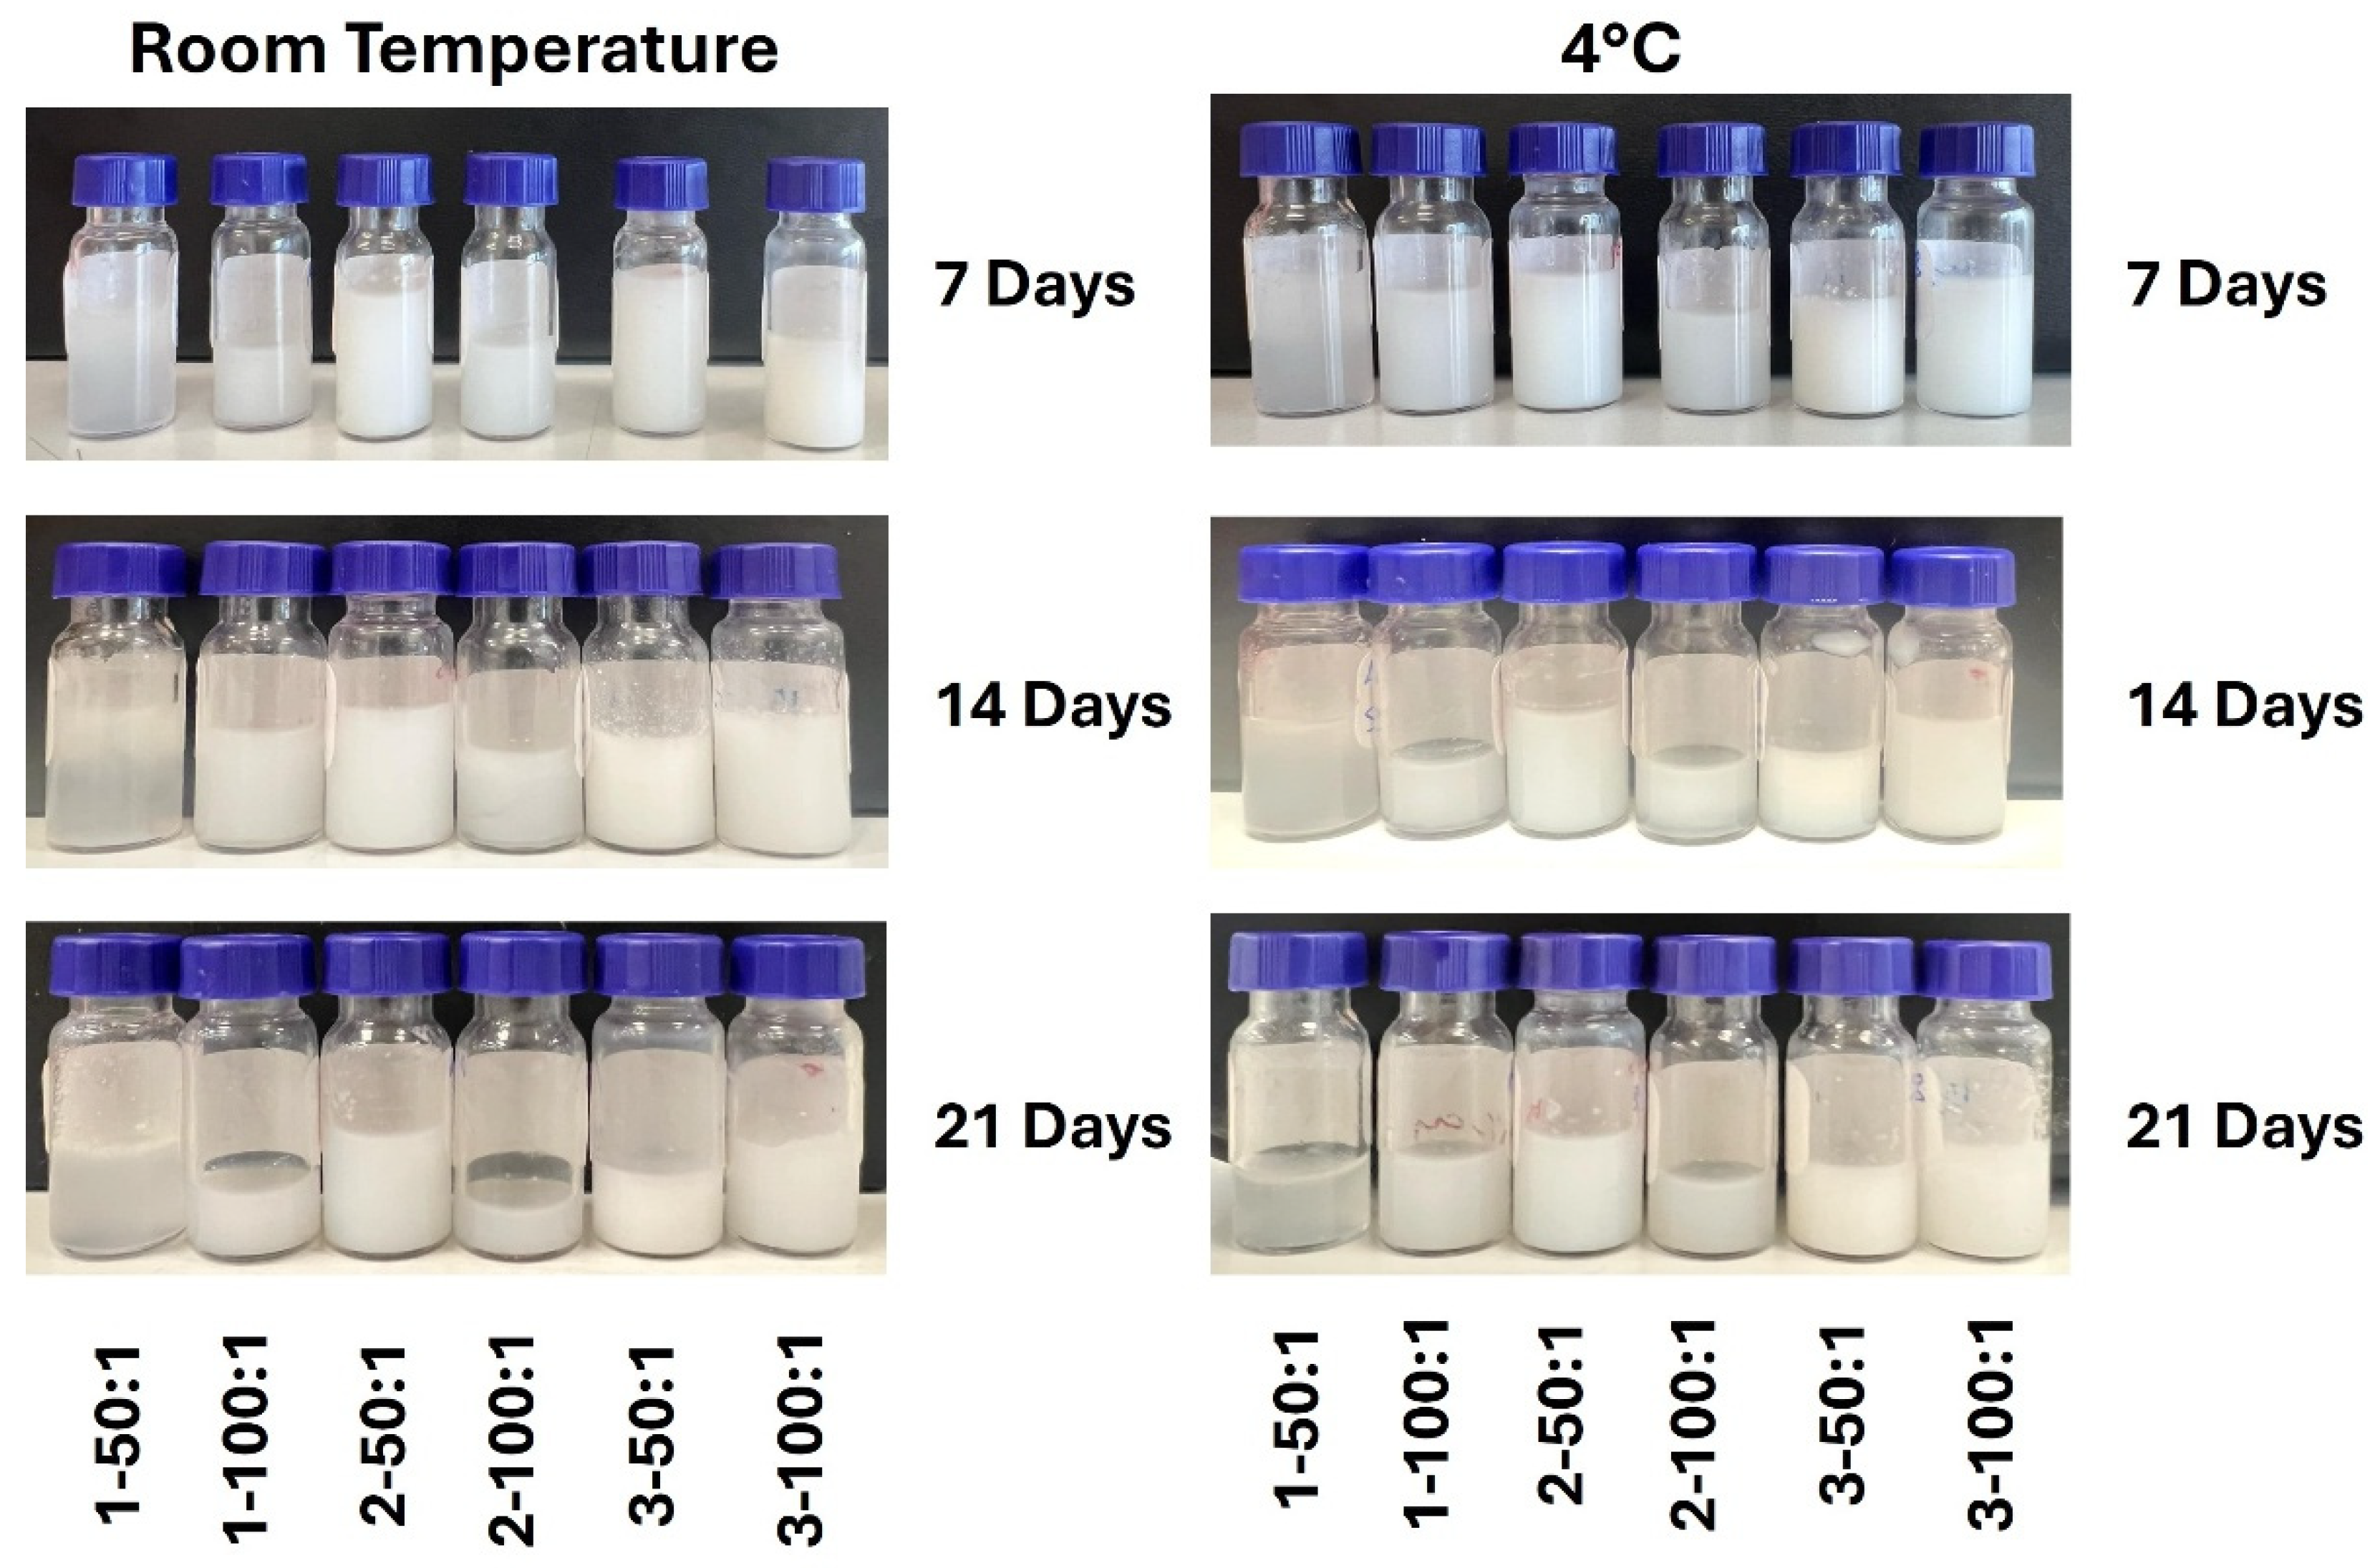
Visual observation of the nanoemulsified systems immediately after preparation is given in
Figure 2b. According to the obtained images, all NEs exhibited a milky appearance and light white color, indicating evident stability at the macroscopic level. This milky character is a typical indicator of successful nanostructure formation, associated with a high refractive index and homogeneous particle distribution.
DLS analysis revealed that the average hydrodynamic droplet diameter ranged between 154 nm and 343 nm (
Table 4). Among the tested formulations, sample 2-50:1 (i.e., S
mix = 2 and flow ratio 50:1) exhibited the smallest diameter (154 nm), while sample 1-50:1 (S
mix = 1, flow ratio 50:1) resulted in the largest (343 nm). The ζ-potential values varied from −13.96 to −40.79 mV, with most samples exceeding the absolute threshold of 30 mV, indicative of good kinetic stability in NEs. The polydispersity index (PDI), which reflects size distribution and homogeneity, ranged from 0.269 to 1.000. The lowest value was observed in sample 2-50:1 (0.269), indicating good homogeneity, whereas sample 1-50:1 exhibited the highest PDI (1.000), suggesting size heterogeneity and reduced stability. The differentiation between these two examples underscores the critical influence of both the S
mix ratio and the aqueous-to-oil flow rate on the physicochemical quality of NEs prepared via microfluidics.
The effect of the aqueous-to-oil phase flow ratio on microfluidics production can be attributed to three main mechanisms. First, as reported by Fathordoobady et al. [
15] and Amoyav & Benny [
26], a higher proportion of aqueous phase promotes immediate dilution of oil droplets, thereby reducing the rate of coalescence. Second, the increased water content facilitates more efficient and rapid distribution of the emulsifier at the oil–water interface, lowering the interfacial tension and enabling the stabilization of droplets at smaller sizes [
27]. Third, the increased flow of the continuous phase generates conditions of higher shear stress and inertial resistance, which facilitates the faster and more stable breakup of droplets in flow regions with enhanced size control [
28].
3.3. Stability During Storage
Following preparation, ΝΕs were stored in the dark for 21 days at both +4 °C and RT, without the addition of preservatives. Stability during storage was assessed by monitoring changes in droplet size (nm), Z-potential (mV) and PDI. During this storage period, no apparent visual changes or phase separation were observed, indicating the macroscopic stability of the prepared NEs (
Figure 3).
It is important to emphasize that most systems exhibited greater stability when stored under refrigeration (+4 °C) compared to RT. This enhanced stability can be attributed to the reduction in droplet kinetic energy, which slows down coalescence and molecular rearrangement processes. In some samples, refrigeration further contributed to smaller droplet diameters and more consistent PDI values, without evidence of phase separation or sediment formation.
Regarding the size of the nanodroplets, the results from the stability study are presented in
Figure 4a. The most stable profile was observed for sample 2-50:1. This particular NE maintained an average diameter below 166 nm across all time points and storage conditions, with only a ±12 nm variation between day 0 and day 21. This low variability underscores the structural robustness of the system and the ability of the emulsifiers to preserve nanodroplet integrity. By contrast, sample 2-100:1 displayed more pronounced fluctuations, with its initial diameter (261 nm) decreasing to 137 nm on day 7 at RT, before increasing again to 221 nm by day 21 at +4 °C. Such transient destabilization is likely attributable to temporary interfacial redistributions. Similarly, sample 1-100:1 showed significant size variation. It started at 225 nm, increased to 388 nm by day 14 (RT), and stabilized at 319 nm on day 21 (+4 °C). This instability correlates with the initially high polydispersity index of this sample, suggesting heterogeneity in the droplet population and a tendency toward coalescence. These large changes may also be attributed to insufficient stabilization at the oil–water interfaces.
Z-potential (
Figure 4b) hardly changed with time, whereas PDI (
Figure 4c) was more ‘vulnerable’ to long-term storage, which corroborates also with the findings of Ye et al. [
14]. In brief, the Z-potential provides an indication of the surface charge of the emulsion particles. When its absolute value is high, it creates repulsive forces between the particles, which can enhance the physical stability of multiphase systems [
29]. Sample 2-50:1 consistently demonstrated superior thermal and kinetic stability. Its Z-potential ranged from −36.4 to −41.3 mV throughout the storage period, values that are considered highly indicative of good stability due to the electrostatic repulsion between droplets. Relatively stable Z-potentials were also observed in samples 3-50:1 and 3-100:1 (varying from −37.9 to −40.6 mV), likewise indicating the achievement of an acceptable kinetic stability profile. The high negative values likely result from the distribution of ionic groups within the emulsified layers and surface rearrangement during storage. Both RH40 and lecithin can contribute to the overall negative charge due to their molecular structure and ionizable groups at the interface, which reflects in the negative Z-potential measurement [
30].
The most monodisperse systems were samples 2-50:1 and 3-50:1, with PDIs ranging from 0.252 to 0.321 and 0.472 to 0.517, respectively. These values fall within the acceptable range for monodisperse NEs (PDI < 0.3–0.5) [
31]. Sample 2-100:1 exhibited a higher PDI (~0.8), indicating the presence of mixed populations, despite the relative stability of its droplet size. Such polymodal distributions may be associated with a slower rate of droplet stabilization due to the higher aqueous-to-oil phase flow ratio, thus leading these NEs to a transitional increase in their droplet size.
3.4. Characterization of Cur NEs
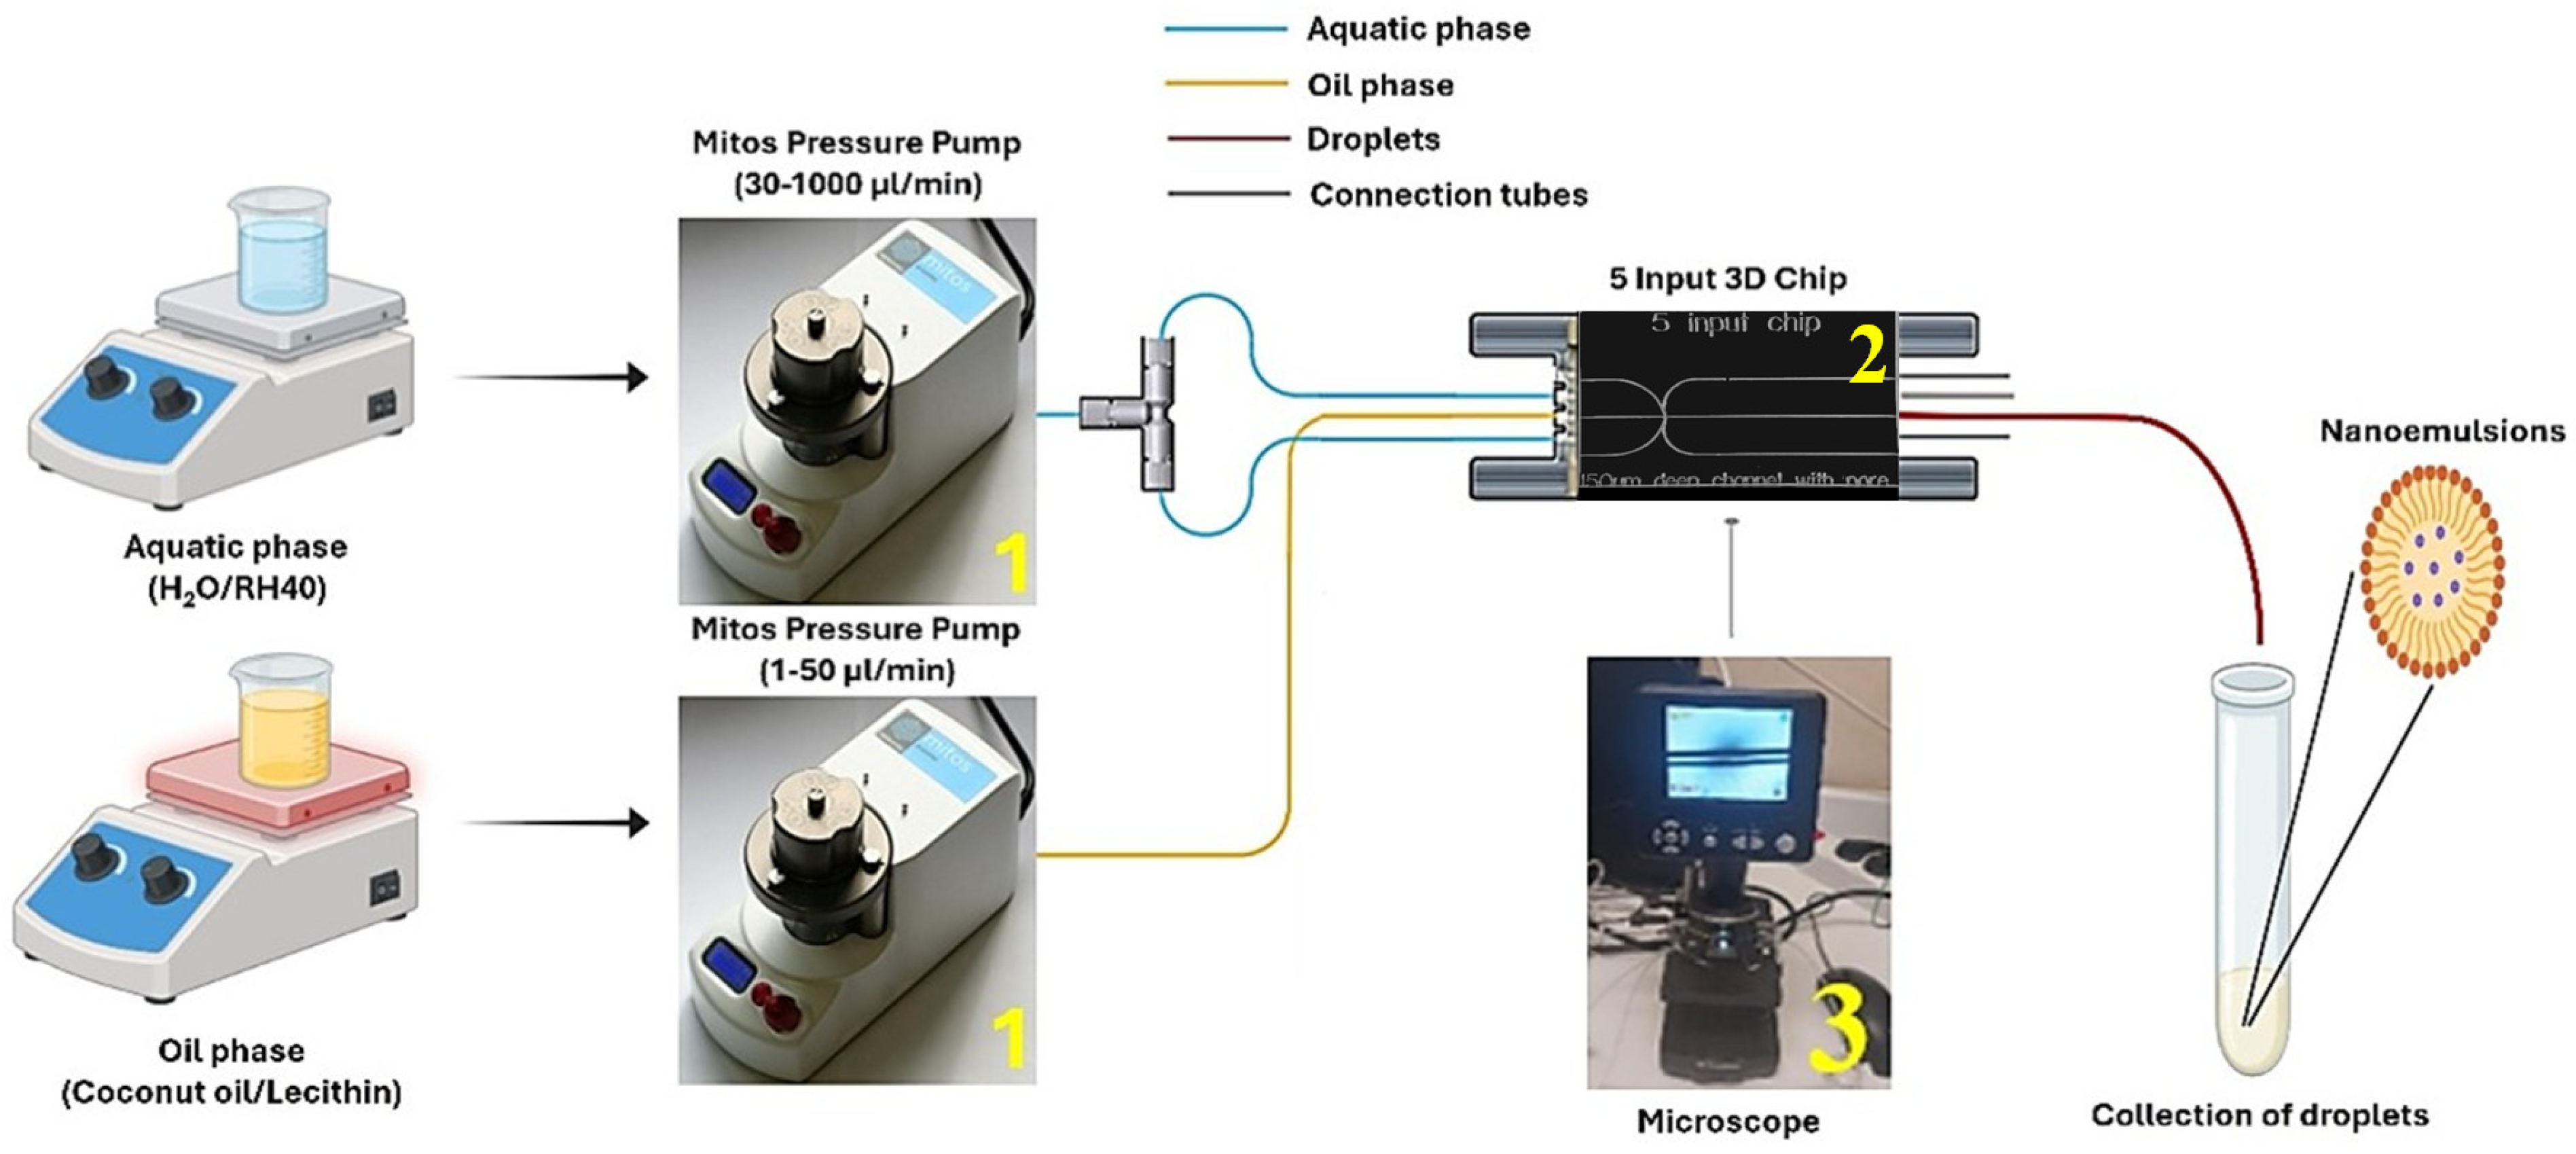
The parameters for Cur-loaded NE preparation were based on the optimal conditions identified in the previous section for blank NEs. Specifically, a fixed S
mix ratio (=2) was applied, and two aqueous-to-oil phase flow ratios (50:1 and 100:1) were selected, both of which had already demonstrated the ability to produce blank NEs with the desired properties (small droplet size, satisfactory Z-potential and low PDI). Two different Cur amounts, namely 25 and 50 mg, were dissolved in 20 mL of coconut oil and were further used for encapsulation in order to determine whether increasing the concentration of the active substance affects the morphology and macroscopic appearance of the NEs. Cur-loaded NEs with two different concentrations were thus prepared, namely 0.06%
w/
w and 0.13%
w/
w.
Figure 5a shows the images of Cur NEs immediately after preparation.
ΝΕs exhibited a milky texture and an intense, bright yellow color, regardless of the flow rate ratio or Cur content. The color homogeneity and the absence of precipitates or sedimentation suggest good distribution of the drug within the core of the nanodroplets. Furthermore, the fact that the optical properties are not significantly affected by the increase in Cur concentration suggests that the system has the capacity to incorporate larger amounts of the API without immediate risk of saturation or phase separation.
In general, NEs are carrier systems consisting of an oil and a water phase stabilized by surfactants and co-surfactants, distinguished from conventional emulsions by having droplets sized at the nanometer scale [
32]. The successful encapsulation of the active substance is explained at the molecular level through the proposed droplet formation mechanism, as presented in
Figure 5b. Soy lecithin, a natural phospholipid, acts as a co-emulsifier by forming a stable film at the interface between the two phases (aqueous and oil). Its hydrophilic phosphate head orients towards the external aqueous phase, while the hydrophobic chains anchor within the droplet core, along with the oil phase containing the dissolved Cur. RH40, a polyoxyethylene derivative of hydrogenated castor oil, further enhances system stability by also acting as an emulsifier, filling the gaps between lecithin molecules at the interface of the two phases. The PEG moieties within the RH40 structure orient towards the aqueous phase, providing an electrostatic and steric barrier, whereas its saturated C18 chains structurally integrate into the oily core. This mechanism promotes the formation of small-sized droplets by reducing the interfacial tension and enhancing the thermodynamic stability of the nanodroplets, as demonstrated in previous studies [
33]. The selection of coconut oil as the lipid phase, primarily composed of medium chain saturated fatty acids, offers a low-viscosity core that facilitates the diffusion of Cur and maintains stability within the nanodroplets.
An additional crucial factor for the successful production of drug-loaded NEs is the use of droplet microfluidics with a flow focusing configuration. This technology allows precise control over flow rates, mixing intensity, and shear energy, providing significant advantages over other conventional NE production methods. As reported, nanodroplets formed under controlled flow conditions exhibited reduced size distribution, greater thermal stability, and higher encapsulation efficiency compared to those produced by probe sonication or simple mechanical stirring methods (such as homogenization [
34,
35,
36]). The preservation of the physicochemical properties of sensitive active compounds, such as Cur, is markedly enhanced by the limited thermal and mechanical stresses imposed by the microfluidics approach. Therefore, these findings support the suitability of microfluidics technology for the production of Cur-loaded NEs suitable for topical application.
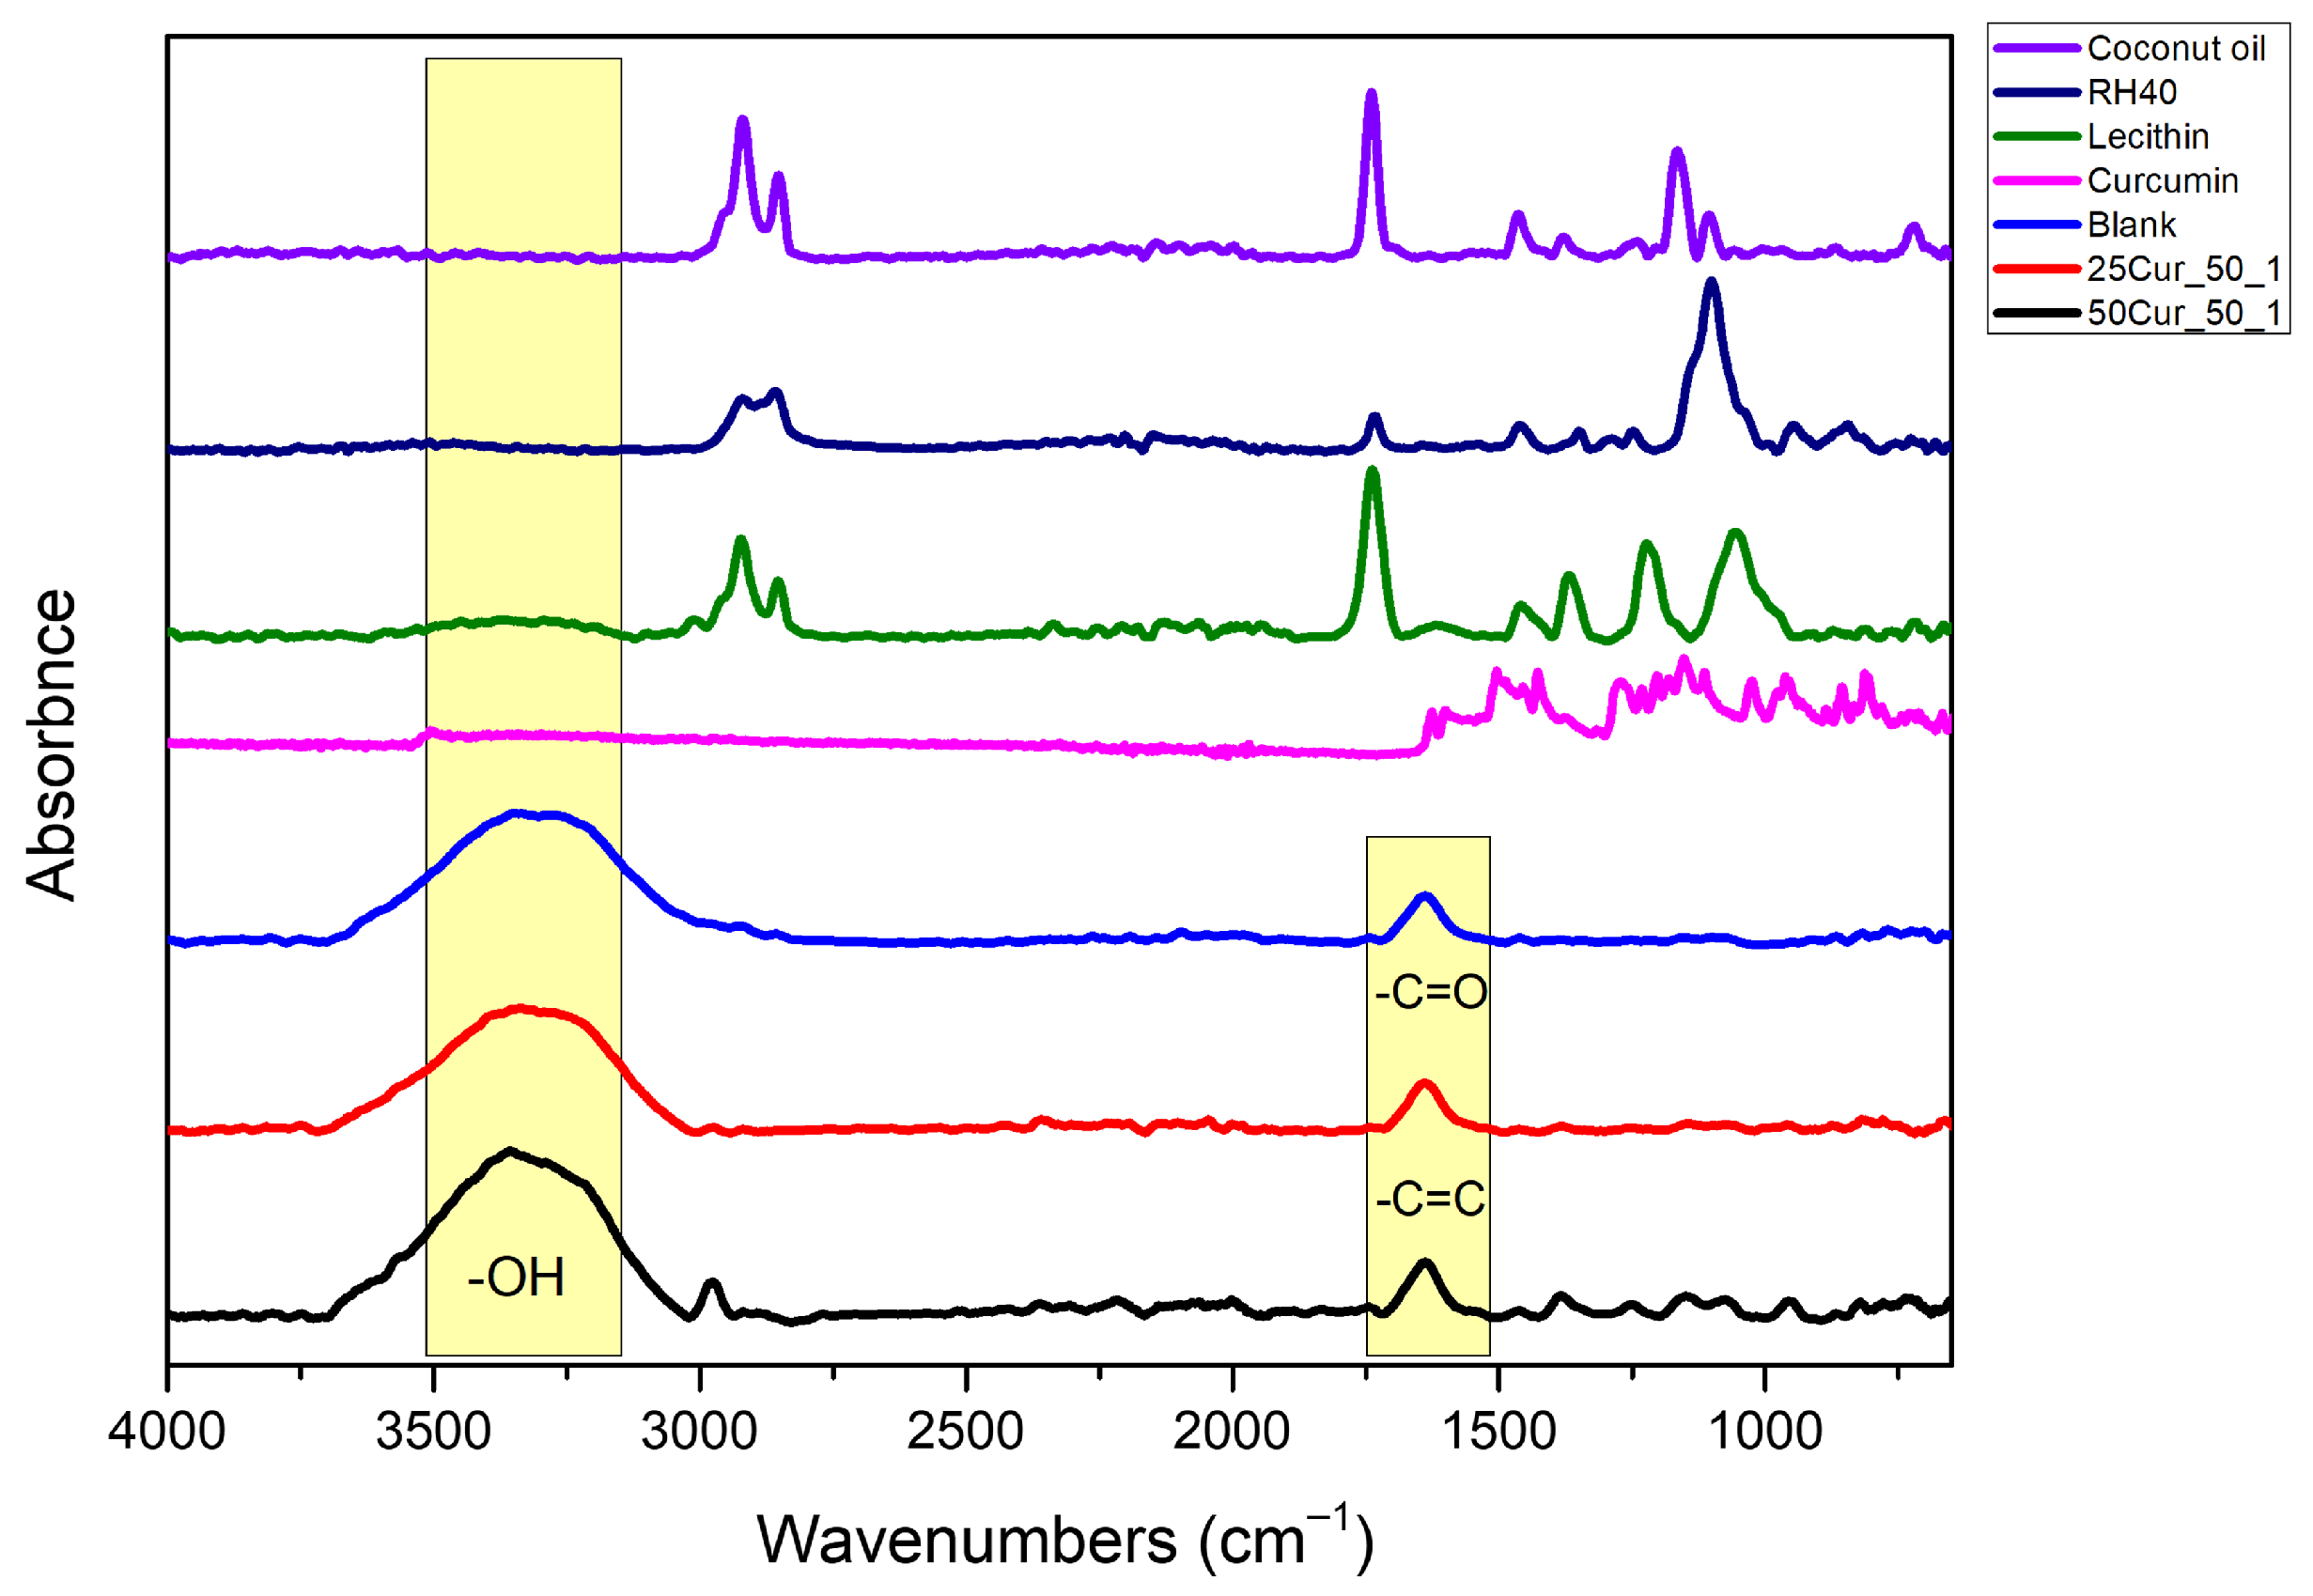
The IR spectra of the raw materials and the NEs (both blank and Cur-loaded) are shown in
Figure 6. The presence of Cur was confirmed by the characteristic peaks observed in the spectra of the NEs containing the active compound. Specifically, the peak at 1637 cm
−1 is attributed to overlapping stretching vibrations of the C=C bonds of alkenes and the C=O bonds of carbonyl groups. This peak further supports the encapsulation of Cur within the NE system. Additionally, the peak at 1250 cm
−1 corresponds to the bending vibrations of the C-O bond and is particularly characteristic of Cur’s chemical structure, while the peak at 1540 cm
−1 is assigned to in-plane bending vibrations of aliphatic and aromatic systems, including δ(CC–C), δ(CC=O), and ν(C–C) modes of aromatic bonds [
37].
The FTIR spectra of RH40 and soy lecithin exhibited distinct absorption patterns. The peak at 1462 cm
−1 is associated with the bending vibrations of the C-H bonds in the CH
2 and CH
3 groups, while the peak at 1735 cm
−1 corresponds to the stretching vibrations of carbonyl esters. The peaks at 2958, 2925, and 2854 cm
−1 arise from successive C-H stretching vibrations characteristic of the alkyl chains in triglycerides. These spectral regions are in full agreement with literature data for plant-derived lipid emulsifiers and confirm the presence of functional groups responsible for interfacial stabilization [
38]. The FTIR spectrum of pure coconut oil revealed pronounced double peaks at 2920 and 2852 cm
−1, characteristic of the asymmetric and symmetric stretching vibrations of the C-H bonds in CH
2 and CH
3 groups. These peaks are attributed to the high content of saturated fatty acids with linear carbon chains in the oil, such as palmitic, lauric, and stearic acids. Another significant peak was observed at 1739 cm
−1, corresponding to the carbonyl (C=O) stretching vibration of ester groups, while the peaks at 1165 and 1105 cm
−1 are associated with the C-O stretching vibrations [
37,
39].
Looking at the obtained spectra of the blank NEs and Cur-loaded NEs (at both drug loadings), the obtained results indicate that each ingredient, especially Cur, was well retained in the NEs after preparation.
The effectiveness of a NE as a carrier for bioactive compounds, such as Cur, depends on the encapsulation efficacy of the respective active substance and the stability of the system. Results, summarized in
Table 5, present, for each formulation, the amount of Cur initially added and ultimately encapsulated, the EE (%), the average hydrodynamic diameter (size), the Z-potential, the PDI and the pH values of each system.
Starting with the systems containing the lowest initial Cur quantity (25 mg), sample 25Cur_50_1 exhibited an encapsulation efficiency of 50.4%, with a droplet size of 172 nm, Z-potential of −44.11 mV, and PDI of 0.332. This performance is considered particularly satisfactory, as it achieves good incorporation of the active compound with a relatively low PDI and high Z-potential. The corresponding sample with a flow ratio of 100:1 (25Cur_100_1) showed a markedly reduced encapsulation efficiency (32.8%), while the droplet diameter slightly increased to 181 nm and the PDI to 0.468. The pH values of both systems ranged between 4.9 and 5.1, indicating a neutral to mildly acidic environment suitable for dermal applications.
In the case of samples with a higher Cur concentration (50 mg), the EE of the 50Cur_50_1 sample reached 49.6%, with a droplet size of 240 nm and a Z-potential of −42.67 mV. Although the droplet size increased, the encapsulation of the active compound remained high, indicating that the system can satisfactorily accommodate double the amount of the active ingredient without a dramatic loss in stability. The corresponding sample with a flow ratio of 100:1 (50Cur_100_1) showed the lowest EE (31.2%), with a size of 194 nm and a PDI of 0.486. The decrease in EE, despite the increase in initial Cur concentration, is likely attributed to saturation of the oil phase and the limited ability of the emulsifiers to sufficiently stabilize the excess active molecules. The significant difference in EE between samples prepared at aqueous-to-oil flow ratios of 50:1 and 100:1 highlights the critical importance of this parameter. The 50:1 flow ratio appears to provide optimal encapsulation regardless of the initial Cur concentration, possibly due to stronger interfacial stabilization during droplet formation. Conversely, formulations prepared at a 100:1 flow ratio, although yielding smaller droplet sizes, exhibited lower EE—a factor that should be balanced according to the final pharmaceutical objectives.
The Z-potential values in all samples remained below −40 mV, indicating high kinetic stability of the NEs. The maintenance of a high absolute Z-potential value is associated with the presence of the emulsifiers RH40 and lecithin, which create a surface barrier preventing nanodroplet coalescence, as previously noted. Furthermore, the consistency of the Z-potential regardless of the initial Cur amount suggests that the active compound is incorporated within the droplet core without affecting the interfacial structure between the aqueous and oil phases. Regarding PDI, results indicate an increase in the index with higher initial Cur content, attributed to a broader droplet size distribution due to altered stabilization dynamics. Notably, the 50Cur_50_1 sample exhibited a PDI of 0.547, suggesting a relatively wide size distribution, bordering on the upper acceptable limits for pharmaceutical applications. PDI values in systems with an aqueous-to-oil flow ratio of 100:1, were slightly lower, which may be explained by better dispersion and homogenization of the two phases, as well as the formation of a more stable interfacial layer in these more dilute preparations.
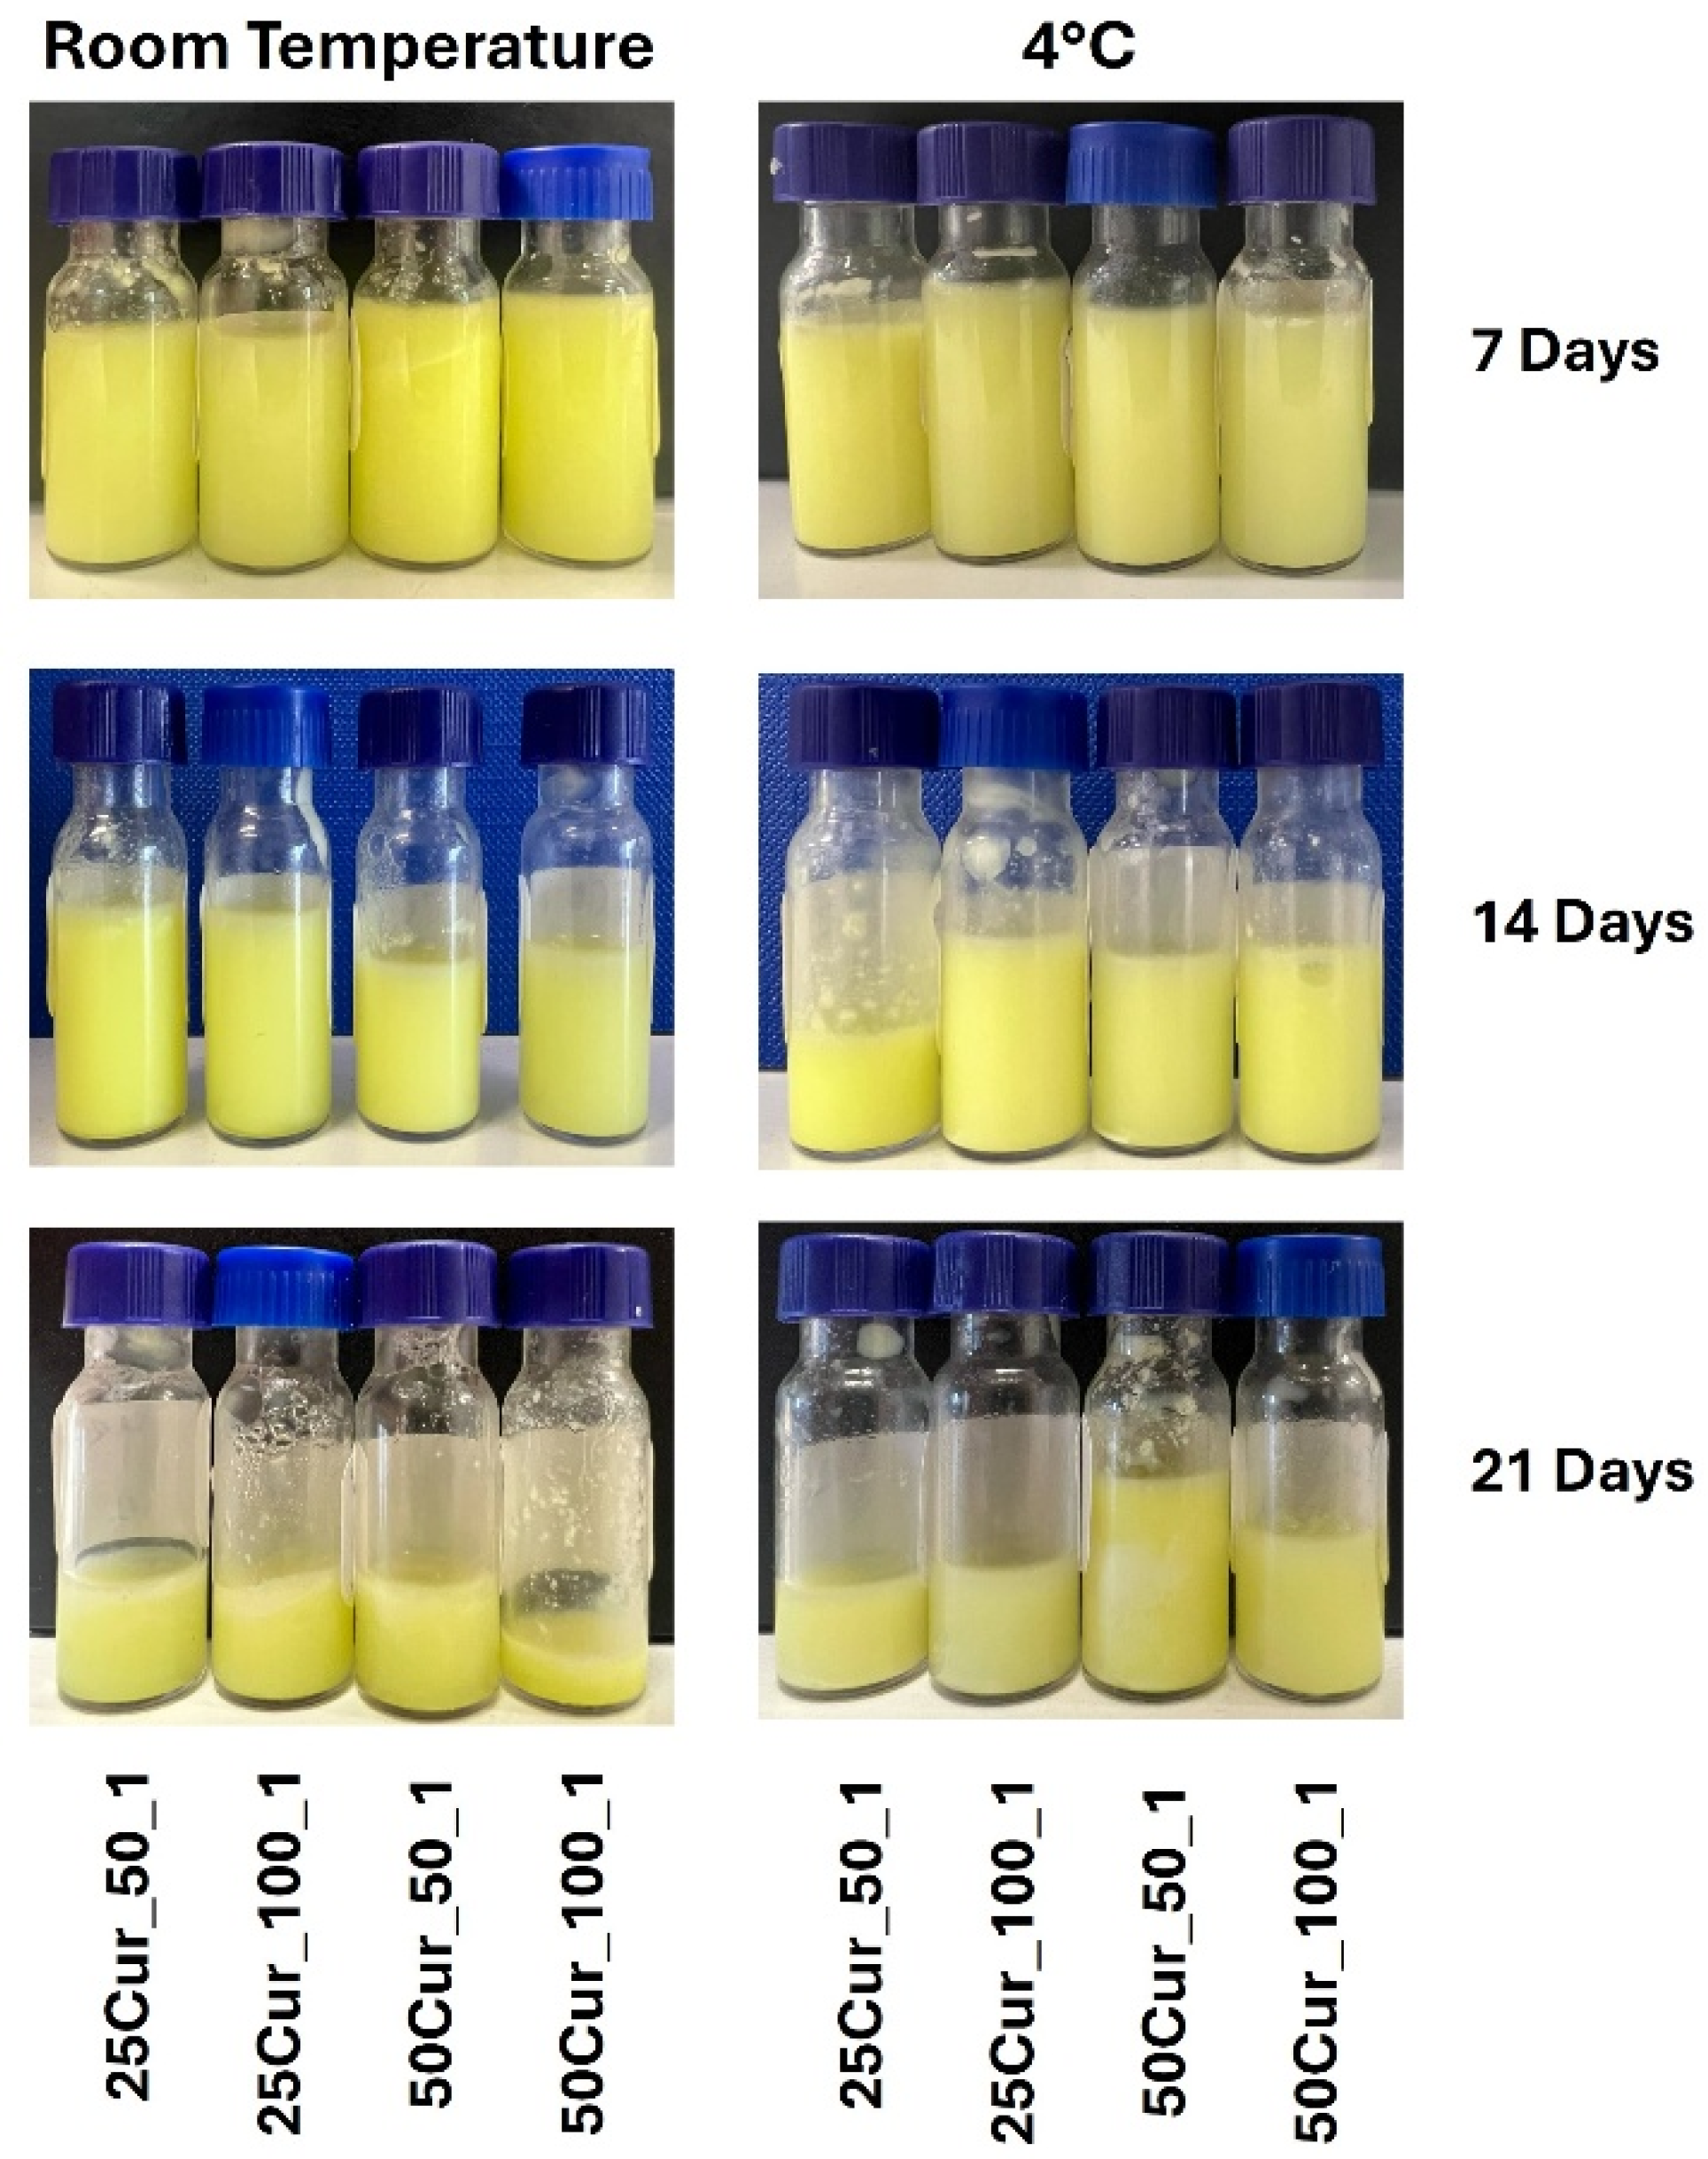
Stability studies of the Cur-loaded NEs showed no evidence of macroscopic phase separation in any sample throughout the testing period (
Figure 7), providing an initial indication of their long-term stability. Nevertheless, subsequent physicochemical analyses (droplet size, Z-potential, and PDI) revealed notable variations that were dependent on both formulation composition and storage conditions.
Regarding the droplet size (
Figure 8a), sample 25Cur_50/1 exhibited the smallest overall size variation, starting from 172 nm (day 1) and reaching 189 nm at RT (21st day). In contrast, 25Cur_100/1 started at 181 nm but showed stronger fluctuations, reaching 285 nm (at RT, 21st day), indicating lower stability at RT. Even more pronounced were the size increases in the samples with 50 mg of Cur. The sample 50Cur_50/1 increased from a droplet size of 240 nm up to 365 nm (at RT, 21st day), while the sample 50Cur_100/1 started at 194 nm and reached 326 nm. This increase in size correlates both with the higher concentration of the active substance and the system’s inability to maintain interfacial stability under higher loading and/or elevated temperature conditions (RT vs. +4 °C).
The results for the Z-potential (
Figure 8b) reveal the relative stability of the surface electrostatic balance, despite the variations in size. All samples maintained absolute values greater than 37 mV throughout the storage period. These values are considered sufficient for the kinetic stability of the NEs due to the significant repulsion generated between the formed nanodroplets. Specifically, the Z-potential for sample 25Cur_50/1 decreased from −44.11 mV on the first day to −39.1 mV on the 21st day (in refrigeration), without a significant impact on its size. Similarly, sample 50Cur_100_1 initially exhibited the highest Z-potential (−45.1 mV) and maintained relatively high values (−39.7 mV) until the end of the study, despite the significant increase in diameter.
The small fluctuations in Z-potential are not always accompanied by size stability, indicating that mechanisms such as Ostwald ripening or the redistribution of Cur in the oil phase may be responsible for the increases in size, even when electrostatic stability remains high. The analysis of the stability of the PDI values (
Figure 8c) also provided significant indications regarding the systems’ ability to maintain monodispersity. For example, the sample 25Cur_50_1 shifted from a PDI of 0.232 to 0.503, a value indicating a transition from monodispersity to polydispersity. A similar trend was observed in the sample 25Cur_100_1, which showed the highest final PDI value (0.651) and also repeatedly exhibited values greater than 0.6 in intermediate measurements, indicating an unstable droplet size distribution. Conversely, the sample 50Cur_50_1, despite having a larger initial diameter, showed a milder increase in PDI, from 0.547 to 0.511 (in refrigeration, 21st day). The same was observed in the sample 50Cur_100_1 (from 0.446 to 0.559), suggesting that samples with higher amounts of Cur maintained their size distribution more efficiently, possibly due to the reduced mobility of molecules within the oil phase.
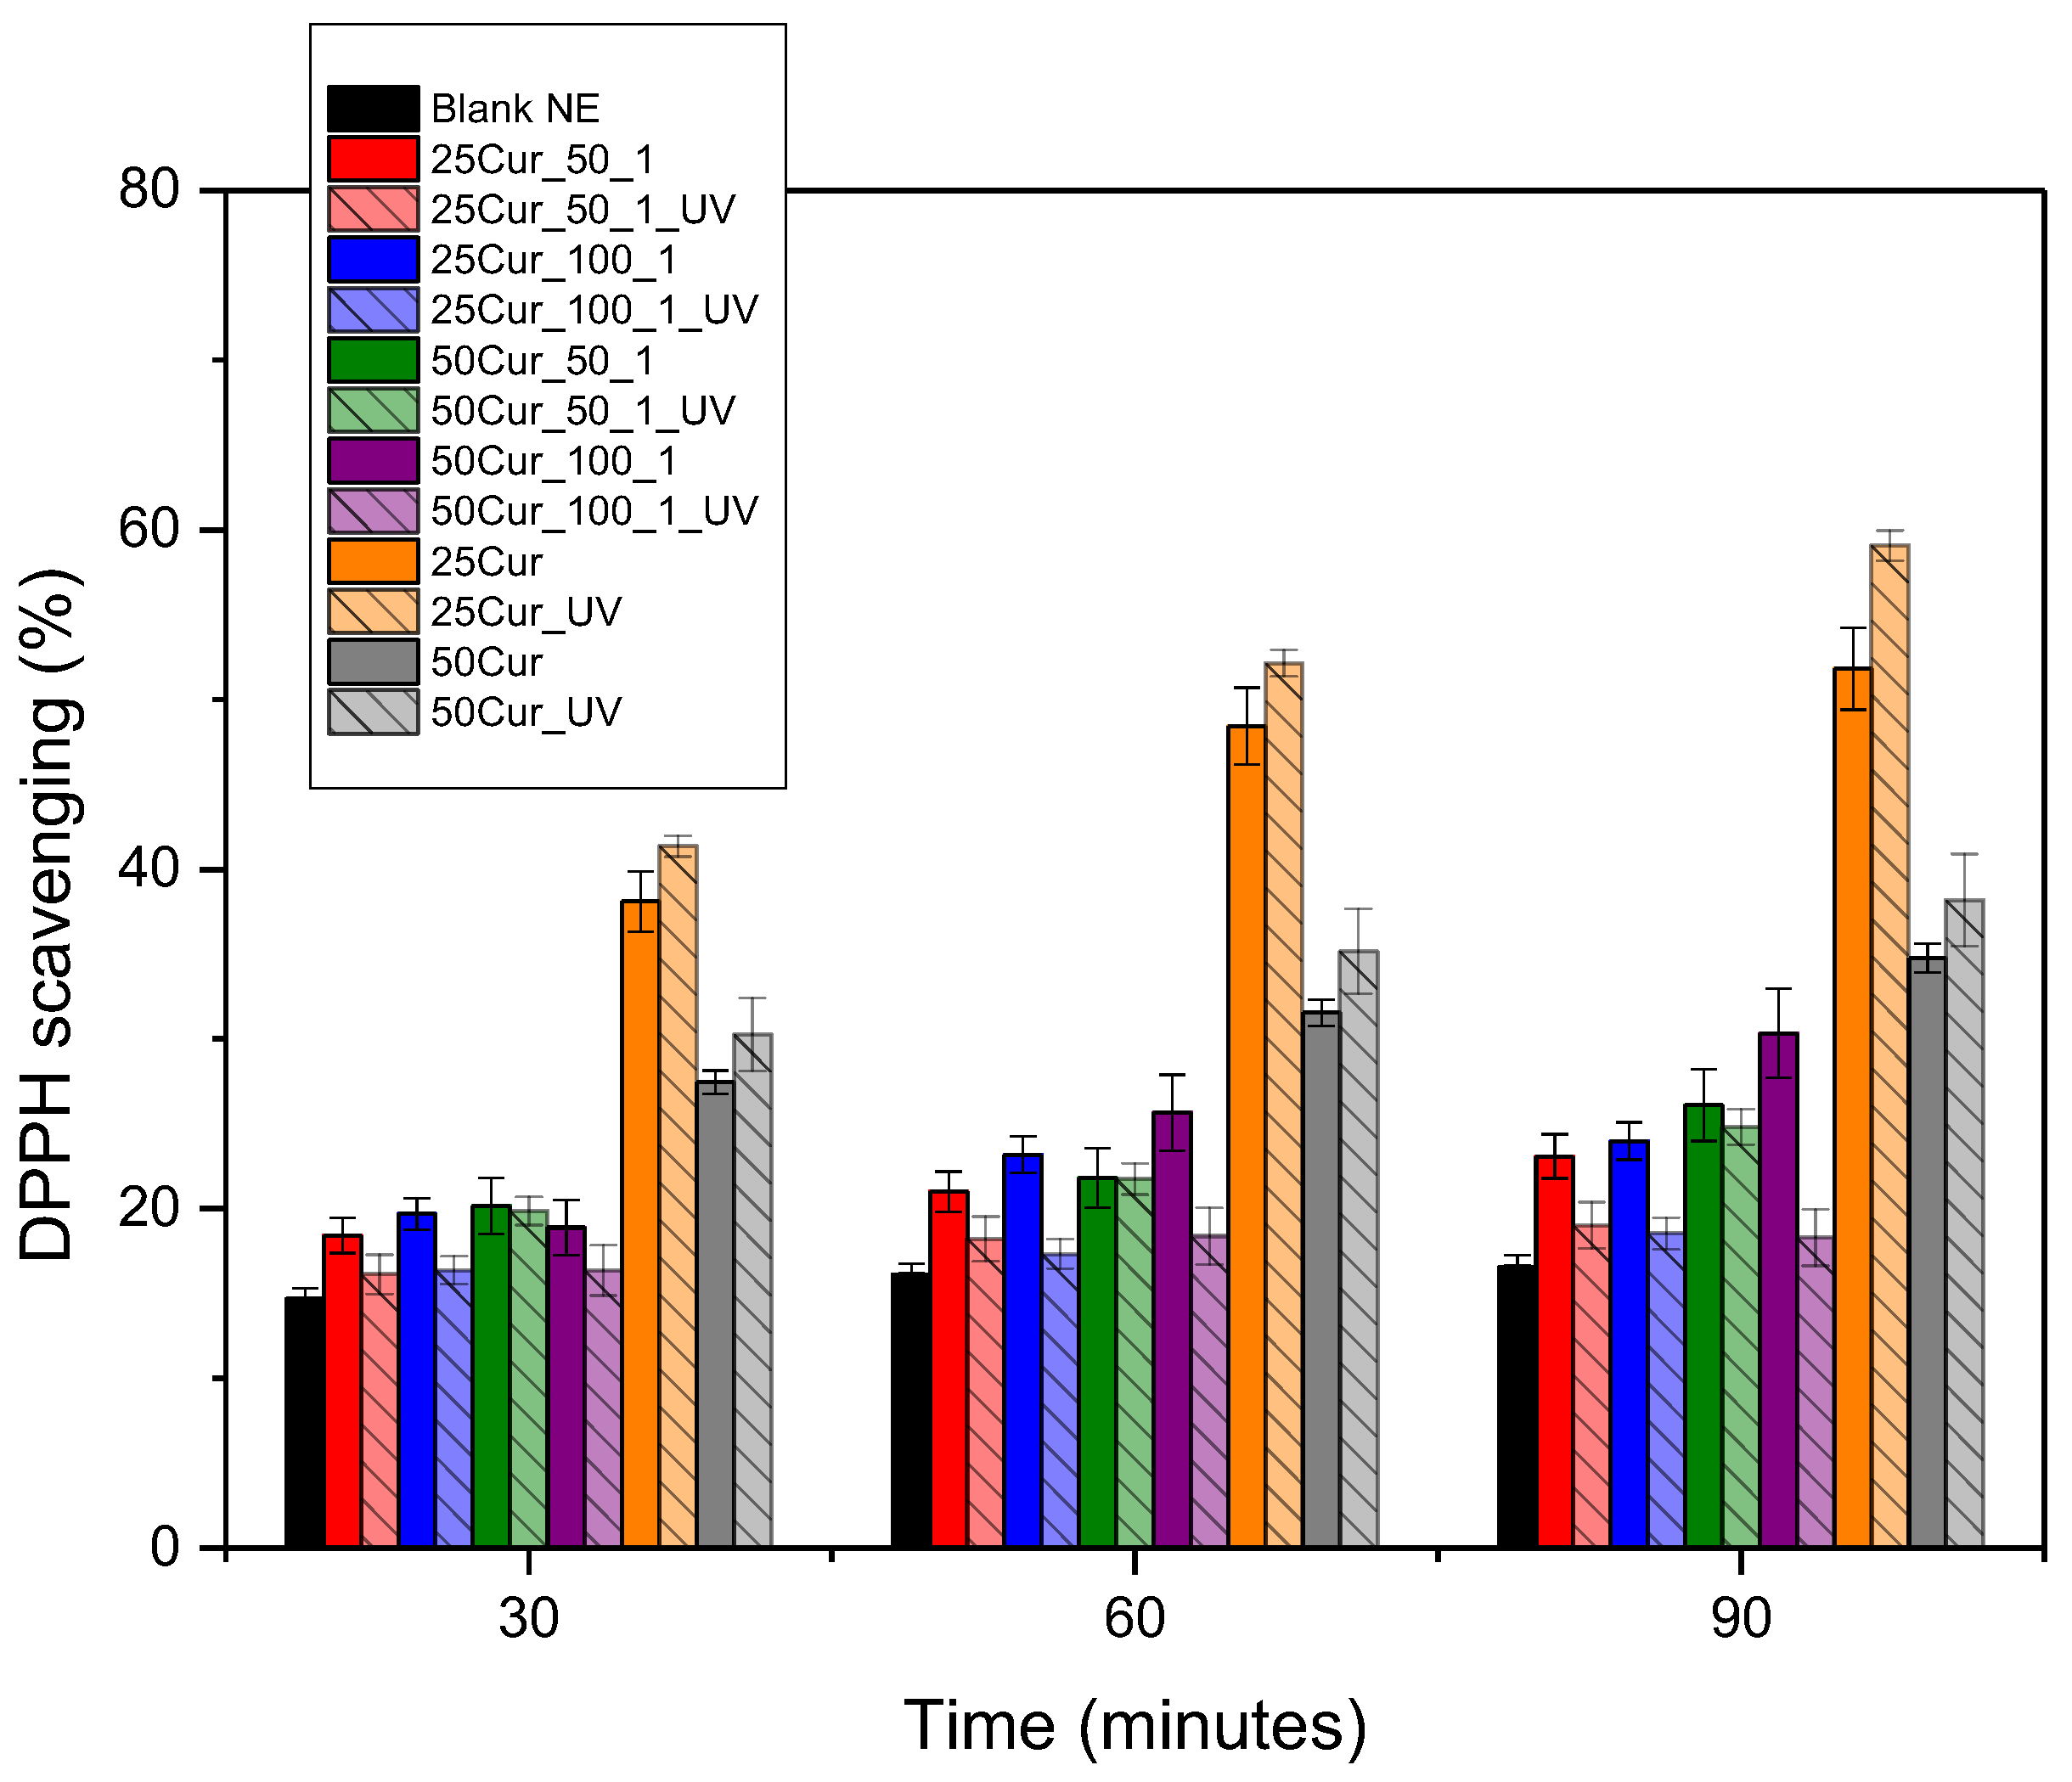
Studying the color of emulsions aids in understanding their microstructure. The relative proportions of light transmitted and reflected at different wavelengths depend on the scattering and absorption by each emulsion. Light scattering and absorption are influenced by the size, concentration, and distribution of the droplets, as well as the refractive indices of the dispersion medium and the dispersed substance, and naturally by the wavelengths contained in the incident light [
40,
41]. The color of emulsions results from the way light is reflected and transmitted. To better determine this change in the color of the systems,
Table 6 presents the color parameters measured for each NE. NEs containing 50 mg of Cur exhibited a slightly stronger yellow color compared to those containing half the amount (25 mg), while the latter were more transparent, and thus less bright, resulting in a lower intensity of white color. Compared to the initially prepared blank NEs, the Cur-loaded systems showed significantly higher L* values (90.01 to 97.19), indicating a brighter appearance, whereas the blank NEs displayed L* values around 66, corresponding to a much darker appearance. These results indicate that the encapsulation of Cur within the nanoemulsion droplets alters the light scattering and absorption properties, resulting in increased brightness and enhanced yellow coloration. This enhanced color intensity is attributed to the intrinsic yellow pigment of Cur and its uniform dispersion within the nanoscale droplets, which modulates the optical path and interaction with light, thereby improving the overall visual appearance of the emulsions.
3.6. In Vitro Permeation of Cur-Loaded NEs
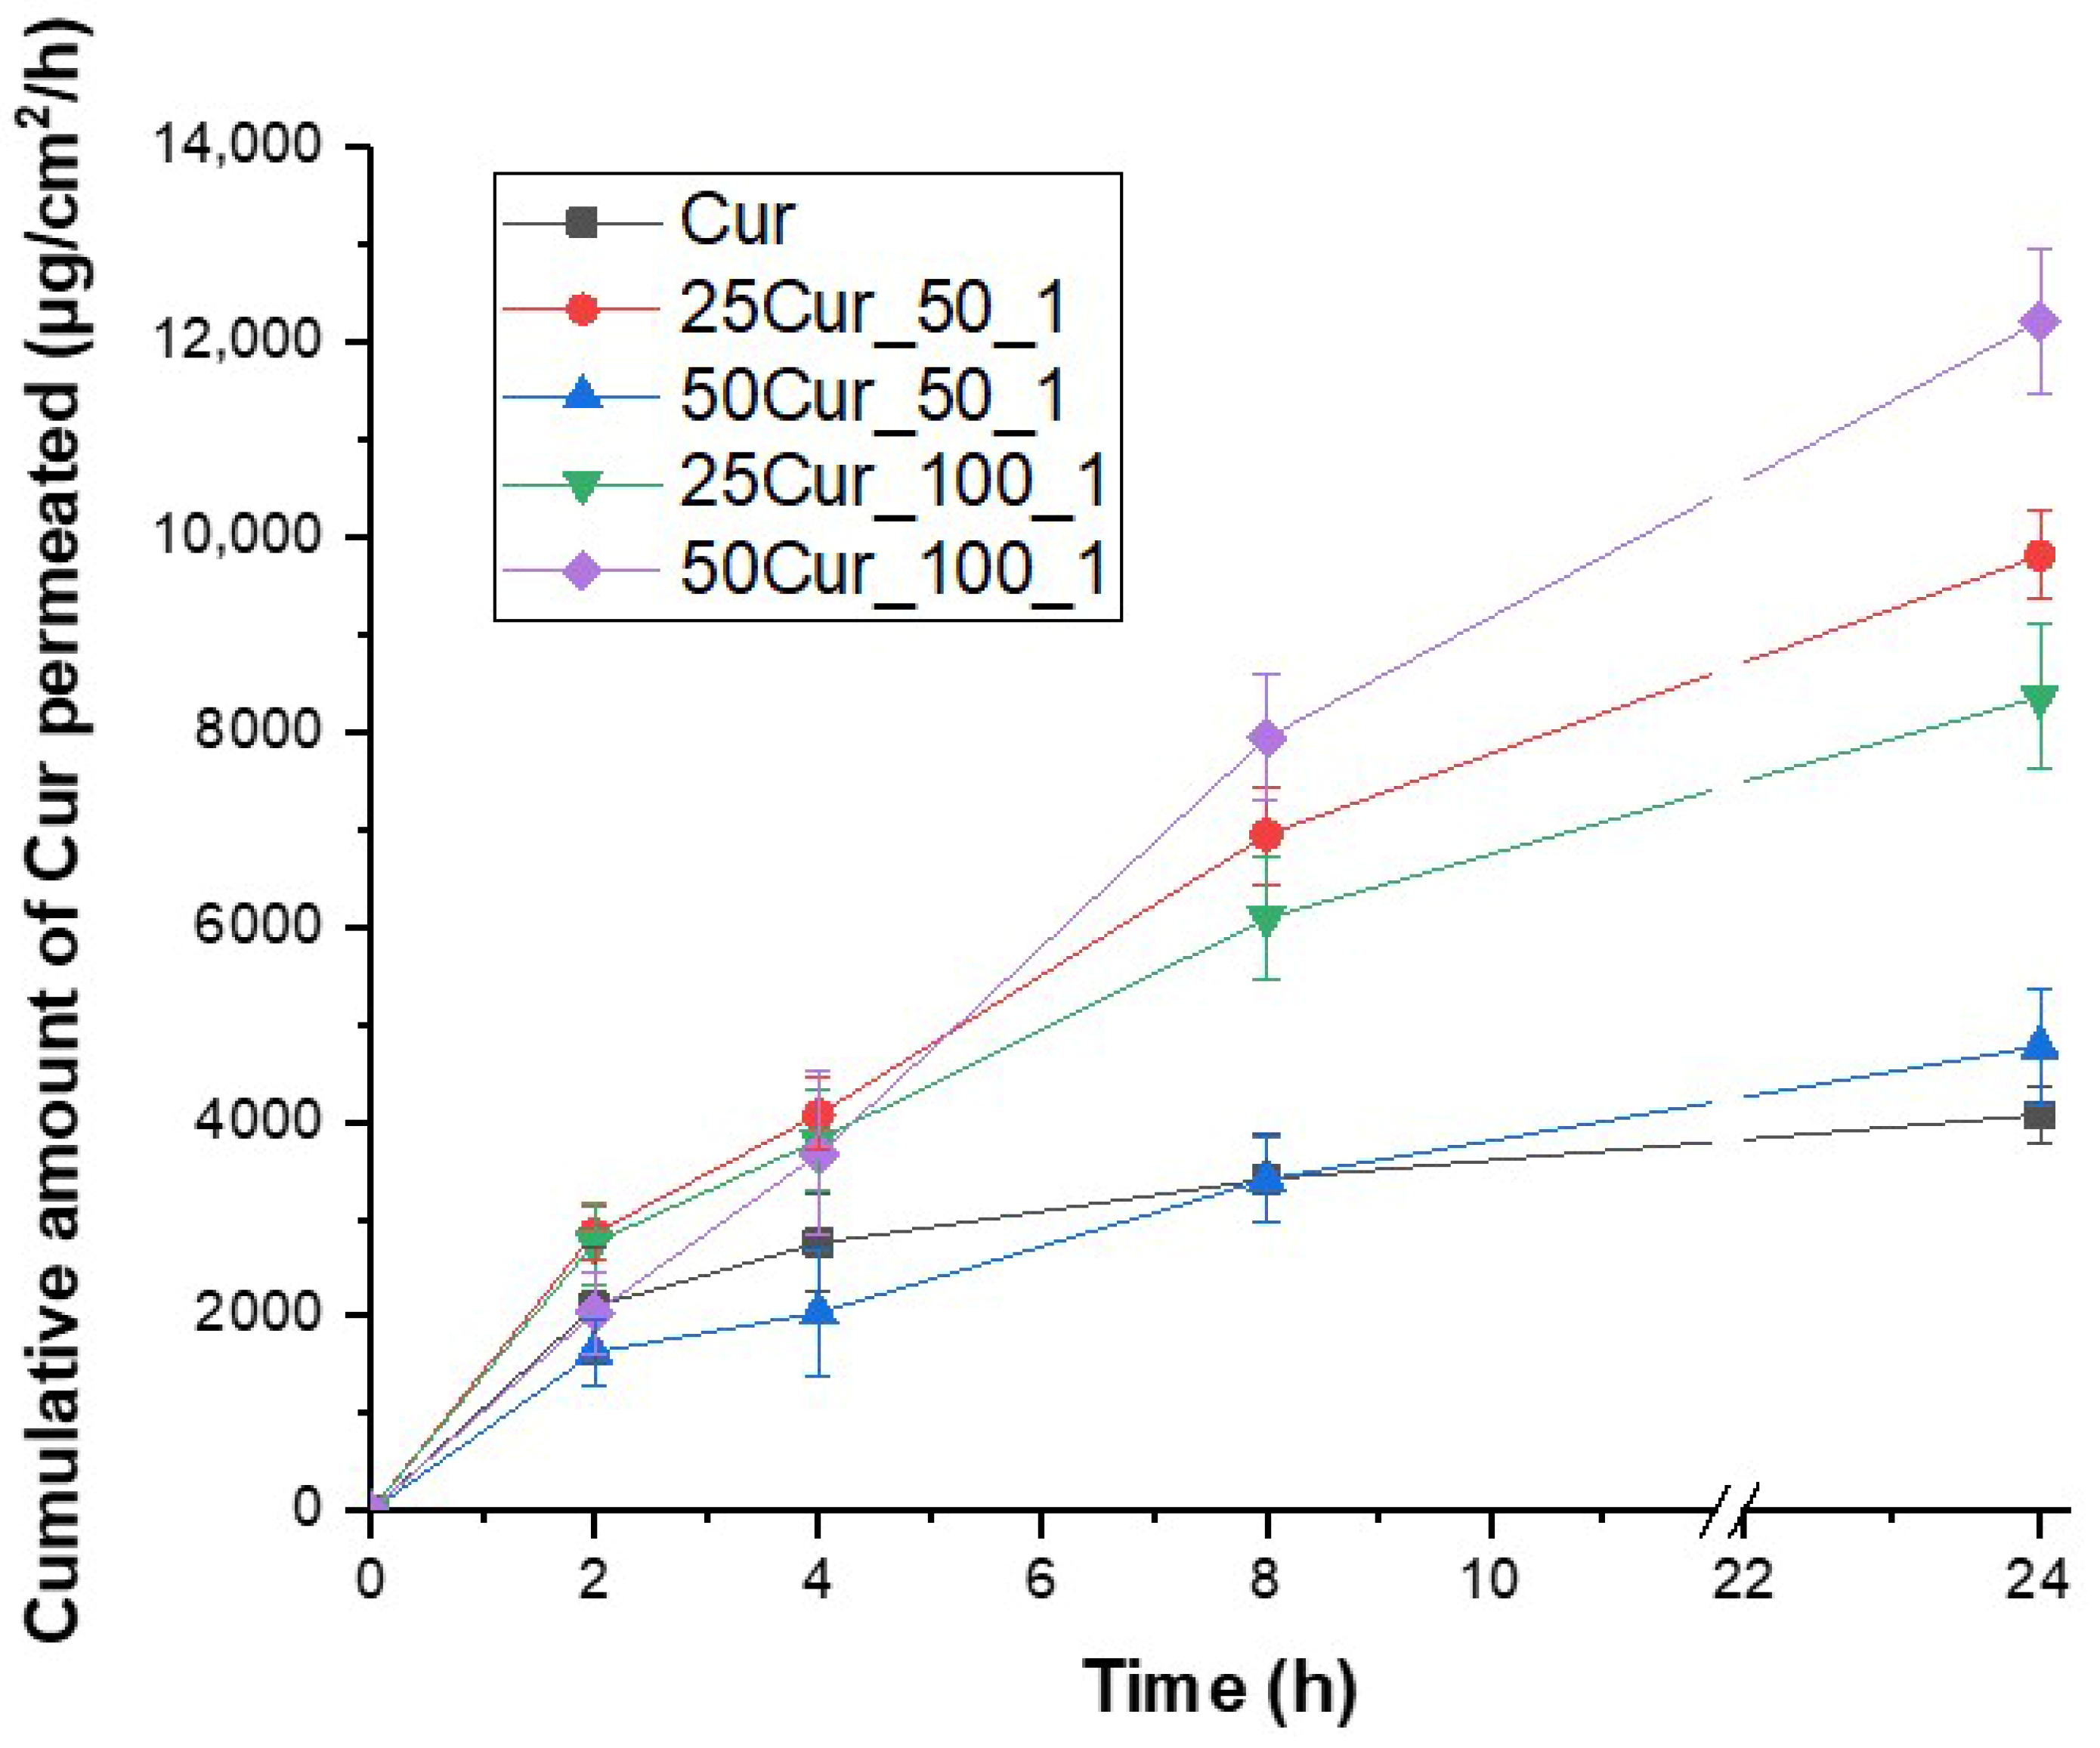
The permeability of Cur through a synthetic membrane (cellulose-based) was evaluated using Franz diffusion cells in order to investigate the ability of the NEs to facilitate the transdermal permeation of Cur. The parameters studied included various Cur concentration (i.e., 0.06% and 0.13%
w/
w) and various phase flow ratios during the preparation of the NEs (i.e., 50:1 and 100:1). The five formulations examined were (1) 25Cur_50_1, (2) 25Cur_100_1, (3) 50Cur_50_1, (4) 50Cur_100_1, and (5) the pure active substance (Cur) in the form of an aqueous dispersion. The results are presented in
Figure 10.
Initially, at the first time point of 2 h, the highest permeability (although marginally) was recorded for the sample 25Cur_50_1 (with 2851.3 μg/cm2), followed by 25Cur_100_1 (2753.2 μg/cm2) and pure Cur (2100.0 μg/cm2). In contrast, the samples 50Cur_100_1 and 50Cur_50_1 showed lower values (2036.6 and 1629.3 μg/cm2, respectively). The pronounced permeation of Cur from sample 25Cur_50_1 at the initial stage suggests possible surface incorporation of Cur into the droplets or a loose NE structure, which allowed faster initial diffusion of the active ingredient. Conversely, the lower performance of systems containing 50 mg indicates a probable gradual diffusion from a more compact or denser oily phase.
At 4 h, the samples 25Cur_50_1 and 25Cur_100_1 maintained high permeation levels. The 50Cur_100_1 sample displayed a remarkable increase (reaching 3665.9 μg/cm2), whereas 50Cur_50_1 exhibited some relative limitation. The pure compound showed no significant change, indicating that although free (i.e., non-encapsulated), the pure Cur initially achieves relatively good permeation, followed by saturation—likely due to precipitation or, more probably, its low solubility in the chosen dissolution medium. This observation further supports that NE can enhance the permeation of poorly soluble active compounds like Cur.
Finally, at 8 and 24 h, the formulations 50Cur_100_1, 25Cur_50_1, and 25Cur_100_1 emerged as the most effective, exhibiting high permeability values. In contrast, the 50Cur_50_1 sample and pure Cur showed significant restriction in the amount of substance capable of permeating through the membrane. From the analysis of these results, it is evident that the phase ratio during NE preparation and the initial Cur concentration exert a complex influence on substance permeation. The 50Cur_100_1 sample combines a high payload with a more diluted aqueous phase, providing a sufficient reservoir of active ingredients and controlled release. Conversely, 50Cur_50_1, despite having the same Cur amount, significantly underperforms in permeation, possibly due to differences in distribution or higher lipid phase density. Additionally, the observation that 25Cur_50_1 outperforms 25Cur_100_1 at most time points suggests that the lower flow ratio (50:1) may enhance faster permeation of the active ingredient. Moreover, the superiority of encapsulated forms within NEs compared to free Cur is clearly demonstrated and further supported by the fact that the permeation profile of the pure substance stabilizes and declines after 4–8 h. In contrast, NEs exhibit an increasing permeation trend even at 24 h, offering significant potential for achieving Cur’s sustained release.
