Abstract
The cosmetic industry is growing at an impressive rate worldwide. In the cosmetic field, natural-origin ingredients represent the new frontier in this industry. Among the main components of cosmetics, lipids, emulsifiers, rheological modifiers, preservatives, colorants, and antioxidants can be found. These compounds form emulsions, which are among the main cosmetic formulations. An important aspect in this regard is the evaluation of emulsions’ stability over time and emulsions’ production methodology. In this paper, a comparison is made between two emulsion production technologies, the Standard and the “One-Pot” methods, through the characterization of the raw material ABWAX® Revomul, a multifunctional wax for cosmetic use which consists of a low-melting structuring wax of vegetal origin (Rhus wax) and a natural emulsifier (Polyglyceril-3 Stearate). First, we evaluated the affinity between the wax raw materials and emollients of different chemical nature; then, we analyzed the impact of the production method on the emulsions to identify similarities and differences. ABWAX® Revomul demonstrated a high level of effectiveness in regard to stabilizing oil-in-water emulsions. This study suggests that from an industrial point of view, the application of the two procedures allows products with different characteristics to be obtained, consequently allowing a specific method to be chosen to obtain the desired product.
1. Introduction
The cosmetic industry is growing at an impressive rate worldwide. In 2024, the total value of this sector exceeded USD 670.8 billion [1]. By 2030, the total value of the sector is expected to reach USD 712 billion, with a compound annual growth rate of 9% [2]. In such a competitive and dynamic environment, characterized by incredible changes in trends, consumer behavior, and distribution channels, the United States has established the most competitive cosmetic market, followed by China [3].
In the cosmetic sector, the amount of chemical components available is very high, and they require detailed certifications and are of either synthetic or natural origin; the latter category represents the new frontier in the cosmetic industry [4].
Among the main ingredients of cosmetics are lipid components, which convey lipophilic substances and have an emollient effect on the skin; emulsifiers, which allow for the mixture of two immiscible phases, such as water and lipids; rheological modifiers, which are able to change the final consistency of the product; and finally, preservatives, colorants, and antioxidants, present in smaller quantities, which make the final product more stable and saleable [5,6].
A key element in achieving green cosmetics is the use of natural emulsifiers, and research in this area is increasingly focused on phospholipids, saccharolipids, lipopeptides, lecithins, and saponins. Furthermore, data reported in the literature show that the development of new cosmetic emulsifiers is focused on integrating natural ingredients into formulations and on the synergistic exploitation of different compounds to produce improved emulsifying compositions [7,8,9].
All of these components are used in emulsions, which are biphasic systems that represent one of the main cosmetic formulations [10]. From a technological point of view, emulsions can be considered colloidal dispersions. Based on the state of aggregation of the two phases, colloidal systems are divided into sols, gels, and emulsions [11]. Emulsions are formed by two liquids: the dispersed liquid constitutes the so-called “internal phase” (discontinuous phase), while the other one is known as the “external phase” (continuous phase). Emulsions can be classified as direct (oil in water, O/W) or inverse (water in oil, W/O), and they are also classified based on the dispersed-phase droplet size as follows: microemulsions (less than 0.1 μm), nanoemulsions (between 20 and 100 nm), and macroemulsions (0.1 to 100 μm) [12].
The performance of an emulsified product depends on its properties and its stability over time, which are key factors for any application, including cosmetics [13]. The most important properties are the interfacial tension (molecular level), droplet size (microscopic level), and viscosity (macroscopic level). These properties are strongly influenced by the product formulation and the operating conditions of the process [14].
Several instability phenomena can be identified during this process, including gravitational separation (creaming/sedimentation), flocculation, coalescence, Ostwald ripening, and phase inversion [15]. There are several methods for testing stability, which can be characterized as empirical or analytical. Empirical methods provide quantitative information on the structural properties of the product [16]. Particle size, morphology, and rheology are just some of the characteristics that are investigated during these analyses, using standard analytical tools and methodologies [17,18]. The procedure that is generally applied during analysis phases is subjecting the samples to environmental stress tests.
Stability studies also include all of the analytical techniques that can be conducted to evaluate the physicochemical changes in emulsions that develop over time. In this sense, infrared spectroscopy, the peroxide value (POV) test, and the determination of the CMC concentration, HLB values, viscosity, and surface tension are some of the analytical parameters used to evaluate the stability of emulsions [9]. Generally, all of these procedures are applied by subjecting the samples to environmental stress tests, where thermal stress is the most commonly used [19].
From an industrial point of view, the production of low-energy emulsions is becoming increasingly important. These emulsions save energy and improve process efficiency by reducing processing times and increasing plant productivity [20]. Regardless of the production methodology, this type of emulsion is in high demand [21]. Several methods can be selected according to the temperature conditions and the number of steps needed to produce the emulsion. Despite the large number of steps involved, traditional emulsion production can be considered a single-step process in which the homogenization phase, the main production phase, occurs only once [22]. An alternative process that reduces the number of steps, and consequently the total production time and cost, is the “all-in-one” or “One-Pot” method. Compared with the traditional method, the various phases take place in a single fuser, saving time and energy and reducing the amount of water needed for subsequent cleaning.
This paper compares two emulsion production technologies, the Standard method and the “One-Pot” method, by characterizing the raw material ABWAX® Revomul. ABWAX® Revomul is a multifunctional cosmetic wax consisting of a low-melting structuring wax of plant origin (rhus wax) and a natural emulsifier (polyglyceryl-3 stearate). The first objective of this study was to investigate the compatibility between the wax raw material and emollients of different chemical compositions by producing simple O/W cosmetic macroemulsions for skincare. The second objective was to evaluate the impact of the production method on emulsions containing ABWAX® Revomul wax. The emulsions were developed using the same ingredients with both the Standard and One-Pot methods. The results of the emulsion analyses were then compared to identify any similarities or differences between the products acquired using the two methods.
2. Materials and Methods
2.1. Raw Materials
The emulsions reported in this study were produced using the raw materials listed in Table 1.

Table 1.
Raw materials used by function and chemical class.
2.2. General Procedure for Emulsion Preparation
The emulsions were obtained with two different technologies: the so-called Standard method and the One-Pot one.
In the Standard method, hydrophilic ingredients (water, glycerin, and xanthan gum) and lipophilic ones (oils and wax) were weighed separately. To achieve correct dispersion of xanthan gum, glycerin and the rheological modifier were manually mixed before water addition. Then, both solutions were stirred and heated to 70 °C. The lipophilic phase was slowly poured into the hydrophilic one under turbo-stirring with an OV5 Homogenizer (VELP Scientifica, Usmate, Italy) at 2000–3000 rpm for 90 s (n = 3 independent batches). Next, the emulsion was transferred to the AM-20 D Overhead Stirrer (ARGO LAB, Carpi, Italy) to cool down. Once room temperature (RT) was reached, the preservative was added.
With the One-Pot method, all the ingredients, except for the preservative, were weighed together, stirred, and heated to 70 °C. Then, the mixture was turbo-stirred at 2000–3000 rpm for 90 s (n = 3 independent batches) with the OV5 Homogenizer (VELP Scientifica, Usmate Velate, Italy). The obtained emulsion was then transferred under stirring to cool down. Once RT was reached, the preservative was added.
These procedures were applied in the preparation of all the samples reported in Table S1.
The laboratory formulations included several variability factors: % w/w of the emulsifying wax ABWAX® Revomul (3%, 5%, and 8%), the chosen emollient (CCT, OD, and PL), its % w/w (10%, 20%, and 30%), and the applied production method (Standard and One-Pot). Other ingredients were used at fixed concentrations: glycerin (2% w/w), xanthan gum (0.3% w/w), and preservative (0.7% w/w). The amount of water used was calculated starting from other ingredients’ % w/w, which varied from 59 to 84% w/w, and subtracting it from 100%.
These quantities were selected starting from a composition representative of commercial formulations. Then, minor variations were applied to study the behavior of the wax under more stressful conditions. The general composition of the emulsions is shown in Table S2.
Emulsion Characterization
Each emulsion was transferred into a plastic container to perform characterization analyses both at RT and at 40 °C in the TCF 200 SUPER-forced air oven thermostatic chamber (ARGO LAB, Carpi, Italy).
Visual macroscopic and microscopic analyses were performed to study the evolution of the product over time. The separation of the hydrophilic and lipophilic phases represented the main instability phenomenon beyond which observations were interrupted.
During stability checks, viscosity data were obtained using the instrument DVE Digital Viscometer (AMETEK Brookfield, Middleborough, MA, USA) equipped with spindle 04 or 05 and set to a speed of 10 rpm for 60 s, while pH analysis was performed with the pH 50 VioLab (XS Instruments, Carpi, Italy). The microscopic analyses, alongside the macroscopic ones, involved the use of an Olympus IX51 microscope (Olympus Corporation, Tokyo, Japan) connected to an OPTIKA mod. C-P20CM digital camera (OPTIKA Srl., Ponteranica, Italy) to analyze emulsion’s micelles. These images were used to evaluate the actual size of the micelles depending on the emulsion preparation variables and to understand, from a microscopic point of view, whether the Standard and One-Pot methods were comparable. The average particle sizes were determined using ImageJ software (version 1.54k).
The analyses were repeated at fixed times: t0 (starting time), t1 (after 24 h), t7 (after 7 days), t30 (after 30 days), and t90 (after 90 days). The tests were stopped after this period of time because, in the cosmetic field, 90 days at 40 °C are used to represent 2/3 year of shelf life under the correct storage condition [23].
Microscopic analyses were conducted on the sample of choice prepared with the most used composition in the cosmetic market (5% of wax and 20% of emollient).
2.3. Manufacture and Characterization of Finished Products
The work was completed by proposing an industrial study based on the preparation of a face cream with moisturizing properties. Production outputs of 2 kg were obtained for both the Standard and One-Pot methods using the Vertical Turbo-Emulsifier TEV5 (CO.M.ER., Cernusco sul Naviglio, Italy) for pilot industrial production. The finished product formulation is reported in Table 2.
Table 2.
Ingredients used for final products.
The formulation has a higher number of ingredients than previous laboratory tests: this choice was based on the desire to mimic a more complex preparation as similar as possible to a commercial face cream. There are two different waxes, chosen for their properties: ABWAX® Revomul, used at 5%, for its emulsifying and structuring power, which was supplemented with 4% of ABWAX® Mimic Beeswax MK wax, working as a consistency agent. Also, two emollients were used, CCT and Isononyl Isononanoate, reaching a total percentage of 12.5%. Finally, an active ingredient, a fragrance, and a preserving system were added to complete the formula. The quantities used were selected in order to obtain the best consistency, viscosity, and smoothness for a face cream.
Production using the Standard method involved weighing and loading phase A ingredients into the fuser, while phase B ingredients (except for the preservative) were weighed and loaded into a 2 L beaker. Both phases were heated under stirring up to 76 °C; then, they were mixed inside the fuser. The homogenization at 2500 rpm was then performed for 10–15 min. During the cooling phase, once 40 °C was reached, the fragrance and preservative were added, following which a 2 min homogenization phase was included.
Production by the One-Pot method involved the weighing and initial loading of glycerin and the rheological modifier inside the fuser, following which manual dispersion was performed. Then, water and phase B ingredients were added. The ingredients were heated under stirring up to 76 °C, and homogenization was performed at 2500 rpm for 10–15 min. During the cooling phase, once 40 °C was reached, the fragrance was added, following which a 2 min homogenization phase was included.
Each product was transferred into a plastic container to perform the stability analyses listed in Emulsion Characterization Section.
Panel Test on Finished Product
In addition to stability and viscosity analyses over time, a panel test was submitted to a group of 25 people (Table S3) composed of non-habitual consumers, average consumers, and experts in the cosmetic field. A questionnaire was requested to be completed with sensory evaluations of the following parameters: homogeneity, stickiness, softness, smoothness, richness of texture, absorption, film forming, glow effect, and nourishment feeling. For each section, the examinees were asked to express a numerical evaluation on a scale between 1 (negative) and 5 (positive) according to their preferences. The panel test’s outcomes were then added together and averaged.
2.4. Statistics
Statistical analyses were performed using the Log-Rank test (STATISTICA 7, TIBCO Software Inc., Palo Alto, CA, USA) [24]. Tests were performed considering data with a p-value lower than 0.05 to be significant.
3. Results and Discussion
3.1. Preparation of Semi-Finished Emulsion Products
The laboratory formulations included several variability factors: the % w/w of emulsifying wax (ABWAX® Revomul) (3%, 5%, and 8%), the chosen emollients (CCT, OD, and PL) and their % w/w (10%, 20%, and 30%), and the production method (Standard or One-Pot). Other ingredients were used at fixed concentrations: glycerin (2% w/w), xanthan gum (0.3% w/w), and a preservative (0.7% w/w). The amount of water used was calculated by subtracting the % w/w of the other ingredients (which varied from 59 to 84%) from 100%. These quantities were selected based on a composition representative of commercial formulations. Then, minor variations were applied to study the behavior of the wax under more stressful conditions. The general composition of the emulsions is shown in Table S2 of the Materials and Methods Section.
3.2. Characterization of Semi-Finished Products
3.2.1. Macro- and Microscopic Analyses at RT
The results of emulsion viscosity are reported in Figure 1, while the pH data of each emulsion are presented in Figure S1.
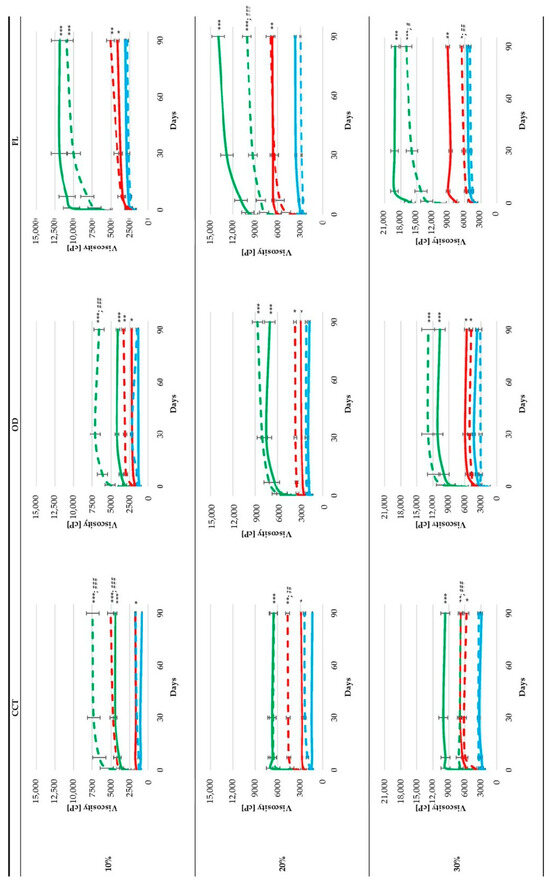
Figure 1.
Viscosity [cP] of CCT, OD, and PL emulsions maintained at RT. Emulsions were prepared with 3% (blue), 5% (red), and 8% (green) of wax ABWAX® Revomul and 10%, 20%, and 30% of emollient with Standard (continuous line) or One-Pot (dotted line) method. Means ± SDs of three independent batches. *** p < 0.001, ** p < 0.01, and * p < 0.05, vs. 3% relative method. ### p < 0.001, ## p < 0.01 and # p < 0.05, Standard vs. One-Pot method.
Viscosity was studied for two reasons: to evaluate the structuring capability of ABWAX® Revomul and understand how it evolves over time and to understand which wax and production method is more suitable for a specific cosmetic market sector. Different viscosities produce different sensations; thus, thickening agents are dosed in the formula bearing in mind the final application [25]. For example, high viscosity is used for body and night creams, whereas low viscosity is used for lotions and shampoos. Therefore, viscosity does not define product quality but rather its application. The most important quality parameter is emulsion stability.
All the emulsions stored at RT remained stable throughout the observation period, with no signs of instability, such as oil/water phase separation, significant changes in viscosity, or variations in pH. This stability demonstrates good chemical interaction between the wax and the emollient used in this study.
As can be seen in Figure 1, an increase in viscosity is directly related to an increase in the concentration of ABWAX® Revomul within the formulations, regardless of the emollient’s chemical characteristics or its concentration (10, 20, or 30%). This behavior is due to the wax’s ability to act as a thickening agent for the oil contained in the preparations [26,27], resulting in higher viscosity as the wax concentration increases.
When fixed percentages of wax were considered, an increase in viscosity values was also associated with an increased amount of emollient when using the Standard method (continuous line), particularly at the highest % of wax. This behavior was not observed when CCT and PL were used in the One-Pot method (dotted line) with the highest % of wax. Although the viscosity of an emulsion tends to increase with a higher volume fraction of the dispersed phase [28], the curves in Figure 1 show that the viscosity increased more with the wax concentration than with the oil concentration. This suggests that changing the amount of emollient has a smaller impact on viscosity than changing the amount of emulsifying wax [29,30].
A comparison of the Standard and One-Pot methods suggests that different viscosity values were achieved depending on the type of oil and its percentage: Higher viscosity values were obtained with the One-Pot method at CCT levels of 10% and 20%. However, when using 30% oil, higher viscosity values were obtained using the Standard method. Similar behavior was observed with OD, where the highest viscosity values were consistently found with the Standard method at 30% oil. In the case of PL, an inversion of the viscosity values was observed at an oil percentage of 20%. These data suggest that this behavior is linked to an increase in oil concentration in formulations. It is plausible that the higher emollient concentration and separate heating procedure of the Standard method applied to the lipophilic phase enables ABWAX® Revomul to exert its structuring power more efficiently, resulting in higher final viscosity values. Therefore, the Standard method can be considered to produce more consistent products [31].
As previously mentioned, optical microscopy analysis was performed on selected samples representative of the formulations present on the market. The results made it possible to observe the microscopic characteristics of emulsions in detail, clearly identifying the presence of emollient droplets dispersed in water (Figure 2). Here, we only report the images collected at t0 and t90; all the pictures registered at intermediate times are shown in Figure S2. Micelle morphology is influenced by numerous factors, such as the ability of the emulsifier to separate the phases, the production method, and the storage conditions.
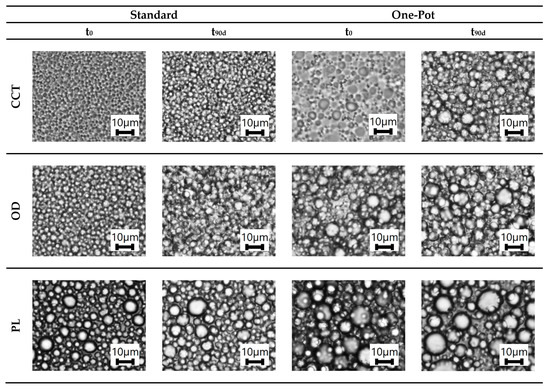
Figure 2.
Optical microscopy photographs of Standard and One-Pot emulsions obtained with 5% of ABWAX® Revomul and 20% of CCT, OD, and PL emollient maintained at RT. Magnification: 40×.
As can be seen from the results reported in Table 3, the smallest micelles were obtained with CCT, the intermediate ones were very similar to the previous ones with OD, and larger, less homogeneous, and less spherical micelles were observed with PL. This result may be due to differences in the oils’ chemical structures. As observed by Terescenco et al. [32], hydrocarbons produce larger and less homogeneous micelles than oils with heteroatoms in their structure.
Table 3.
Average diameter expressed in nm determined by ImageJ in microscope images of Standard and One-Pot emulsions obtained with 5% of ABWAX® Revomul and 20% of CCT, OD, and PL emollient maintained at RT.
The analysis showed a considerable difference in micelle size between the preparations obtained using the two different methods. Emulsions obtained through the Standard method had smaller, more homogeneous micelles than emulsions obtained through the One-Pot method.
The reason for this phenomenon is unclear, but one convincing hypothesis is linked to the different homogenization times of the two methods. Indeed, it was noted that preparations obtained using the Standard process took slightly longer than those obtained using the One-Pot method due to the time taken to transfer the lipophilic phase into the hydrophilic phase. As J. H. Lee et al. have stated, the droplet dimension decreases as the emulsification stage time increases under the same shear mixing rate conditions. We observed the same effect: emulsions prepared using the One-Pot method were exposed to emulsification for 90 s and presented larger droplets than Standard emulsions, which were exposed to the turboemulsifier for 90 s plus the time required to add the lipophilic phase to the water (approximately 30 s) [31].
Microscopic monitoring also helped to evaluate the stability of the emulsions over time. In general, an emulsion can be considered stable if its morphological characteristics remain unchanged over time. Observation showed only a slight increase in micellar size over the 90-day period, indicating that the emulsions prepared using the proposed method are stable. Furthermore, the smaller size of the micelles highlights the effective interaction between CCT and ABWAX® Revomul. The main difference between the two methods lies in the homogeneity of the micelle dimensions. While the Standard methodology produces more homogeneous micelles, the One-Pot method produces a greater variety of sizes. However, this difference does not result in instability over the 90-day observation period.
3.2.2. Macro- and Microscopic Analyses at 40 °C
Maintaining the emulsions at a constant temperature of 40 °C enabled us to study their strength and stability capabilities in a more stressful environment.
Figure 3 shows the variation in viscosity and pH over 90 days for various emulsions based on different wax (3%, 5%, and 8%) and oil (10%, 20%, and 30%) concentrations. The pH variations are reported in Figure S3. As can be seen from the results, pH variation is negligible at RT, while a minor pH excursion was detected at 40 °C. However, even in the latter case, the pH remained within an acceptable range for cosmetic applications throughout the observation period.
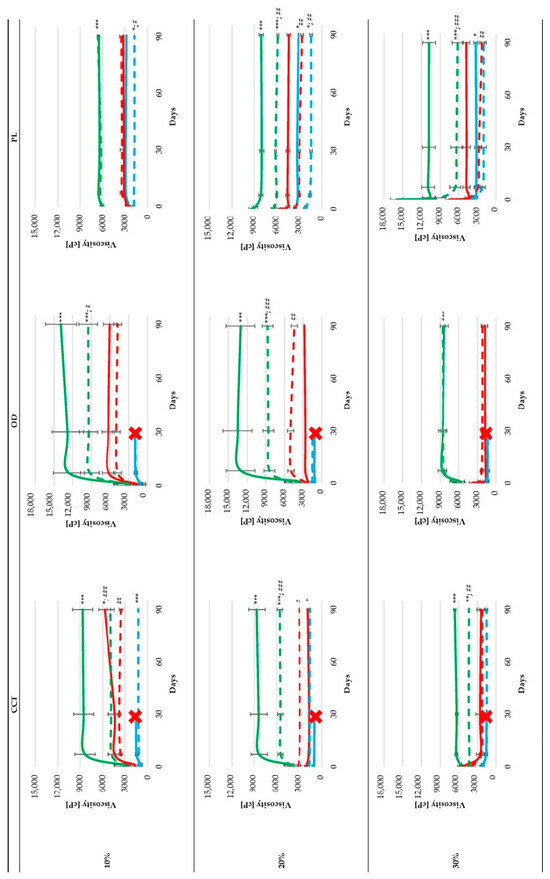
Figure 3.
Viscosity [cP] of CCT, OD, and PL emulsions maintained at 40 °C. Emulsions were prepared with 3% (blue), 5% (red), and 8% (green) of wax ABWAX® Revomul and 10%, 20%, and 30% of CCT emollient prepared with Standard (continuous line) or One-Pot (dotted line) method. Instabilities are indicated by a red cross. Means ± SDs of three independent batches. *** p < 0.001, ** p < 0.01, and * p < 0.05, vs. 5% relative method. ### p < 0.001, ## p < 0.01, and # p < 0.05, Standard vs. One-Pot method.
As can be seen in Figure 3, it was not possible to analyze the emulsions prepared using the Standard method and containing 3% ABWAX® Revomul after 30 days of storage. This was the case for samples containing CCT and OD emollients, where phase separation was observed. With One-Pot technology, phase separation was only observable using the OD emollient (see Figure S5).
The main cause of these instabilities may be the concentration of emulsifying wax used: the amount of emulsifier present (3% w/w) is insufficient to keep the emulsions stable over time. Consequently, it can be confirmed that CCT and OD emulsions require more than 3% ABWAX® Revomul to achieve long-term stability.
In contrast, samples prepared with PL [26,33] oil remained stable throughout the 90-day observation period, even at the lowest wax concentration, demonstrating an excellent interaction with the emulsifying agent ABWAX® Revomul.
As was observed at RT, also in this case, an increase in the viscosity of the emulsions was observed here as the concentration of ABWAX® Revomul increased, confirming the structuring role of the wax.
The role of the emollient in the viscosity value is less relevant than in storage at RT; in fact, increasing the emollient percentage from 10 to 20 up to 30% never correlates to an increase in viscosity (except in the case of PL), confirming the less important role of this element in the viscosity parameter.
In all cases the emulsions stored at 40 °C and prepared with 10% of emollient had higher viscosity when produced using the Standard method than the One-Pot method [34].
Samples obtained using 3% and 5% wax were equally or more viscous than those with 20% oil when prepared using the One-Pot method. In all cases with 8% wax, however, the Standard method provided the highest viscosity. The increased concentration of ABWAX® Revomul and its interaction with the emollient prior to contact with water—a feature of the Standard production method—may amplify its structuring function, allowing higher viscosity to be achieved.
Finally, when using 30% oil with CCT, the viscosities obtained using the two preparation methods with 5% ABWAX® Revomul are comparable, while higher viscosities are observed using the Standard method in the case of 8%. In the case of OD, the viscosities obtained using the two preparation methods are comparable at all percentages. With PL, however, the Standard method always provided the highest viscosities.
Considering all the gathered data, we can observe the stability of the produced emulsion and conclude that ABWAX® Revomul remains an effective structuring and emulsifying agent, even under these stressful conditions.
A second sample of the emulsions considered in Figure 2 was kept at 40 °C and photographed at the same time intervals; the t0 and t90 images are shown in Figure 4, and the average diameters are reported in Table 4. All the images taken at various intermediate times are shown in Figure S4.
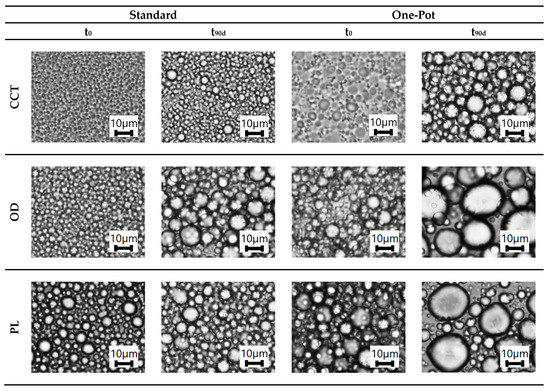
Figure 4.
Optical microscopy photographs of Standard and One-Pot emulsions obtained with 5% of ABWAX® Revomul and 20% of CCT, OD, and PL emollient maintained at 40 °C in a thermostatic chamber. Magnification: 40×.
Table 4.
Average diameter expressed in nm determined by ImageJ on the microscope images of the Standard and One-Pot emulsions obtained with 5% of ABWAX® Revomul and 20% of CCT, OD, and PL emollient maintained at 40 °C.
The higher temperature caused an increase in the size of all emulsions over time compared with the results obtained when the samples were stored at RT (Figure 2; Table 3). Additionally, a decrease in homogeneity over time was observed in the diameter of the micelles in each emulsion (Table 4). An increase in the diversity of micelle size is associated with the upcoming fusion of particles [35]. This situation is directly caused by the emulsifier’s inability to keep the lipophilic phase droplets separated, which lowers the interfacial tension over a long period of time. The result is the partial coalescence of the droplets [36].
3.3. Comparison Between Emollients
Comparing the results obtained using the three selected oils is a significant analytical method that reveals crucial information about ABWAX® Revomul, such as the ideal emulsifying wax concentrations, the quantity and type of emollients that can be used, and the differences in production methods. Depending on the choices made regarding these variables, it is possible to obtain a finished product with different characteristics.
From the viscosity kinetic graphs, it can be seen that semi-finished products reach stability, identifiable by a constant plateau over time, at different points: generally, stability is achieved with CCT after 7 days, with OD after 1 month, and with PL after 2 months. Thus, the wax exhibits different structuring activity depending on the chemical nature of the emollient used. ABWAX® Revomul appears to induce faster structuring of esters (CCT) than hydrocarbons (PL).
For all three emollients, viscosity increases with the concentration of emulsifying wax used at RT and at 40 °C, demonstrating the efficacy of ABWAX® Revomul as a structuring agent. However, this trend is not repeated when emulsions are prepared with fixed quantities of wax and increasing oil concentrations. Therefore, we can conclude that wax concentration is the factor that most influences emulsion viscosity [29,30].
At RT, the highest viscosities were recorded with the PL emollient, and the lowest with CCT oil. At 40 °C, the highest values were obtained with OD. The holding temperature played a central role in this behavior, although a clear explanation has not yet been identified.
Studying the results obtained by microscopic observation, it is possible to notice that the analyzed preparations display recurring differences between the two production methods. The samples prepared using the Standard method were characterized by smaller micelles than those prepared using the One-Pot method, regardless of the type of oil used.
The smallest micelles were obtained using CCT oil, while the largest diameters were observed with PL. This could indicate the actual interaction capacity between ABWAX® Revomul and the selected emollient, given their chemical structure [32].
The 40 °C temperature was a significant source of stress for all the samples. Compared with those stored at RT, the stressed samples showed an increase in the size of the dispersed phase particles. The increase in micelle size was more evident when switching from PL oil to CCT oil and finally to OD oil, which showed the highest increase in particle size. This explains why the largest number of unstable samples occurred with OD oil: as observed in another study, larger micelles produce fewer stable emulsions [35].
The stability analysis conducted over three months enables viewing the enlargement of the micelles over time. At RT, only the CCT and OD emollients show a slight increase in micelle size, while at 40 °C, OD shows the most noticeable difference. Finally, there was no increase in size for PL oil at either RT or 40 °C.
3.4. Characterization of Finished Products
3.4.1. Production Time Measurements
This information was then used to prepare a finished product using industrial-scale production methods. Specifically, two emulsions were produced using the Standard and One-Pot production methods with the ingredients indicated in Table 2 of the Materials and Methods Section 2.4. For each production method, the time required to complete each preparation step was recorded (see Table S1). For a complete overview, washing times were also recorded.
The formulation contains a greater number of ingredients than previous laboratory tests. This was performed to imitate the more complex preparation typically associated with finished cosmetic emulsions. For example, two different waxes are present, chosen for their properties: ABWAX® Revomul, which was used at an intermediate concentration of 5% (as determined in preliminary tests) for its emulsifying and structuring properties, and ABWAX® Mimic Beeswax MK, which was added as a consistency agent. CCT was chosen as the emollient because it provided the best stability results in previous tests. The percentage chosen was 7.5%, which is lower than that used in the tests because the finished product contains a second emollient, Isononyl Isononanoate, bringing the overall percentage to 12.5%. Finally, the hydrating and anti-ageing active ingredient is a blend based on Ceramide NP.
Monitoring production times highlighted the most significant differences between the steps involved (Table S4). The first significant difference was observed in the homogenization process: the Standard method required 27 min and 38 s of turboemulsion processing to achieve a homogeneous appearance, whereas the One-Pot method required only 15 min and 45 s. Therefore, based on this result, the One-Pot technology could be suitable for faster turboemulsification. Another relevant discrepancy was recorded in the cooling times: overall, the Standard method required much longer for the cooling procedures (37′09″) than the One-Pot method (27′12″). Finally, the washing and cleaning phase was 8′11″ longer for the Standard method when a higher number of tools were considered.
From an industrial point of view, the One-Pot method reduces the time taken for some of the most important phases, thereby reducing the energy costs associated with machinery and production personnel while increasing final volumes. In the experimental test undertaken, using the One-Pot method saved 32 min, which is 17.3% less than the time taken for the Standard method. It is essential to emphasize that these production times were recorded as the results of individual production tests and would require further repetition to confirm the results obtained.
3.4.2. Macro- and Microscopic Analyses
The finished products remained stable over time, with no signs of instability or separation at room temperature or 40 °C.
The viscosity values recorded for the finished products are higher than those for the simpler emulsions previously studied. This is due to the more complex formulation that includes a second wax and an active ingredient with thickening properties. Regarding variation, both samples stored at room temperature were found to exhibit a consistent increase in viscosity over time. In contrast, the two samples stored at 40 °C exhibited lower but more stable viscosity values, as observed in emulsions produced with 10% oil (Figure 5). Figure S6 shows the pH variation, and no difference in pH was observed between the two samples prepared with the two technologies and stored at RT and 40 °C.
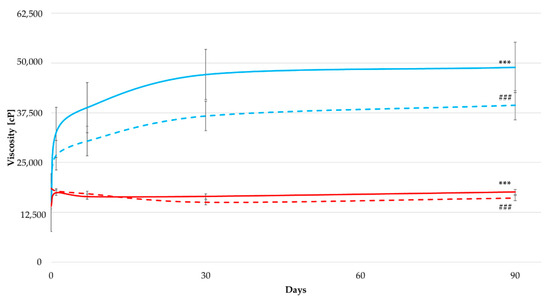
Figure 5.
Viscosity [cP] of emulsions prepared with the Vertical Turbo- Emulsifier TEV5 (CO.M.ER. Erba, Cernusco sul Naviglio, Italy) tool and maintained at RT (Blue) or 40 °C (Red). Emulsions were prepared with the Standard (continuous line) or One-Pot (dotted line) method. Means ± SDs of three independent batches. *** p < 0.001, RT vs. 40 °C. ### p < 0.001, Standard vs. One-Pot method.
As can be seen from Figure 5, there is a clear difference in viscosity between the two samples prepared with the two different technologies and stored at RT. The emulsion obtained using the Standard method had a higher viscosity than the emulsion obtained using the One-Pot method (see Figure 6). As reported in Table S4, the Standard method required longer stirring times to achieve a homogeneous final product than the One-Pot method. As previously observed, longer stirring times resulted in smaller, more homogeneous micelles, as can be seen in Figure 6 and Table 5. Therefore, this result is justified by the fact that smaller particle sizes lead to higher interfacial viscosity [37].
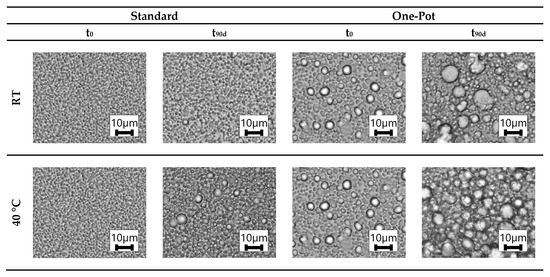
Figure 6.
Optical microscopy photographs of the final product obtained with Standard and One-Pot method maintained at RT or 40 °C in a thermostatic chamber. Magnification: 40×.
Table 5.
Average diameter expressed in nm determined by ImageJ on the optical microscopy photographs of the final product obtained with Standard and One-Pot method maintained at RT or 40 °C in a thermostatic chamber.
The two products stored at RT and 40 °C were confirmed to be stable. The viscosity of the products stored at RT increased, while that of the products stored at 40 °C remained constant, as observed in preliminary tests with various emollients. An increase in the size of the micelles was observed, resulting in a loss of homogeneity, particularly in the product obtained using the One-Pot procedure, as was observed in previous tests.
3.4.3. Panel Test
The two products were subjected to a panel test, in which a group of 25 people, comprising non-habitual consumers, average consumers, and cosmetic sector experts, were asked to complete a questionnaire containing sensory evaluations of certain parameters.
The average results obtained from the questionnaires are shown in Figure 7.
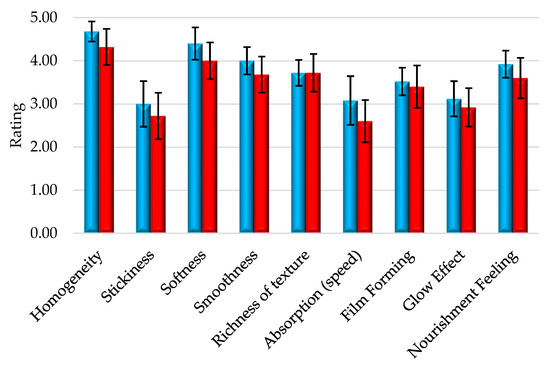
Figure 7.
Panel test depicting the results of the evaluations performed on the finished products obtained with One-Pot (blue) or Standard (red) method, where ratings: 1 (negative) and 5 (positive). Means ± SDs of the 25 panelists’ ratings.
The results of the sensory test suggest that the two products are similar in almost all the analyzed points. The most similar indicators were “richness of texture” and “film formation”, while the most evident differences were found in the “absorption speed” indicator due to the higher viscosity obtained using the Standard method.
Although the bars in the chart are close in height, confirming the similarity of the products, there is still a small gap that justifies the products not being evaluated as equal.
It should be emphasized that the One-Pot emulsion is characterized by consistently higher scores than the Standard formulation, leading to greater sensory appreciation.
4. Conclusions
ABWAX® Revomul demonstrated its effectiveness in stabilizing O/W emulsions at various concentrations ranging from 3% to 8%. It can effectively emulsify and structure formulations containing oils of different polarities, even at different concentrations (10–30%). All the emulsions obtained were analyzed over time at RT and at 40 °C for viscosity and pH. The formulations were obtained using two different procedures: a Standard technique and a One-Pot technique that saves time in the preparation of the emulsion.
This study suggests that from an industrial point of view, applying the two procedures enables products with different characteristics to be obtained, consequently allowing a specific method to be chosen to achieve the desired viscosity. In particular, the Standard method can be used to produce a more viscous emulsion, which could be used in products such as night creams or hand creams. Conversely, the One-Pot method produces less viscous emulsions, which can be used in face creams or sun lotions. Furthermore, the One-Pot methodology is an energy- and time-saving process that can reduce industry production costs. Furthermore, both production methods produce stable emulsions, enabling the method to be chosen based on the desired characteristics or the production time and energy required for the process.
Supplementary Materials
The following supporting information can be downloaded at: https://www.mdpi.com/article/10.3390/cosmetics12040164/s1: Table S1: Laboratory emulsion samples by production method and %w/w of wax and oil used, Table S2: Composition of emulsions, Table S3: Panelists’ demographics, Figure S1: pH of CCT, OD, and PL emulsions maintained at RT. Emulsions were prepared with 3% (blue), 5% (red), and 8% (green) of wax ABWAX® Revomul and 10%, 20%, and 30% of emollient with Standard (continuous line) or One-Pot (dotted line) method, Figure S2: Optical microscopy photographs of Standard and One-Pot emulsions obtained with 5% of ABWAX® Revomul and 20% of CCT, OD, and PL emollient maintained at RT. Magnification: 40X, Figure S3: pH of CCT, OD, and PL emulsions maintained at 40 °C. Emulsions were prepared with 3% (blue), 5% (red), and 8% (green) of wax ABWAX® Revomul and 10%, 20%, and 30% of emollient with Standard (continuous line) or One-Pot (dotted line) method, Figure S4: Optical microscopy photographs of Standard and One-Pot emulsions obtained with 5% of ABWAX® Revomul and 20% of CCT, OD, and PL emollient maintained at 40 °C. Magnification: 40×, Figure S5: Photography of unstable sample prepared with 3% of ABWAX® Revomul and 10%, 20%, and 30% of CCT or OD. Comparison between Standard and One-Pot emulsions after three months of maintenance at 40 °C. Separation regions are indicated by red arrows, Table S4: Preparation times of 2 kg of finished product obtained with the Vertical Turbo- Emulsifier TEV5 (CO.M.ER. Erba, Cernusco sul Naviglio, Italy) tool. Comparison between Standard and One-Pot methods, Figure S6: pH of emulsions prepared with the Vertical Turbo- Emulsifier TEV5 (CO.M.ER. Erba, Cernusco sul Naviglio, Italy) tool and maintained at RT (continuous line) or 40 °C (dotted line). Emulsions were prepared with Standard (blue) or One-Pot (red) method.
Author Contributions
Conceptualization, S.C. and E.C.; methodology, M.B. and P.S.; formal analysis, M.C.M.; resources, S.C. and E.C.; data curation, M.C.M. and P.S.; writing—original draft preparation, M.B., P.S. and M.C.M.; writing—review and editing, E.C. and S.C.; supervision, E.C. and S.C. All authors have read and agreed to the published version of the manuscript.
Funding
This research received no external funding.
Institutional Review Board Statement
Not applicable.
Informed Consent Statement
Not applicable.
Data Availability Statement
Data are contained within the article.
Conflicts of Interest
Author M.B., P.S., and S.C. were employed by the company Roelmi. The remaining authors (M.C.M. and E.C.) declare that the research was conducted in the absence of any commercial or financial relationships that could be construed as a potential conflict of interest.
Abbreviations
The following abbreviations are used in this manuscript:
| HLB | Hydrophile–Lipophile Balance |
| INCI | International Nomenclature of Cosmetic Ingredients |
| LLE | Low-energy emulsification |
| MC | Molecular mass of emulsifier |
| MH | Molecular mass of hydrophilic groups |
| O/W | Oil in water |
| O/W/O | Oil/water/oil |
| OD | Octyldodecanol |
| PL | Paraffinum Liquidum |
| R&D | Research and development |
| RT | Room temperature |
| W/O | Water in oil |
| W/O/W | Water/oil/water |
| W/S | Water in silicone oil |
References
- Cosmoprof. Available online: https://www.cosmoprof.com/en/media-room/news/the-global-beauty-industry-the-markets-to-monitor-in-the-next-future/ (accessed on 1 June 2025).
- Grand View Research. Available online: https://www.grandviewresearch.com/industry-analysis/cosmetics-market (accessed on 1 June 2025).
- Rocca, R.; Acerbi, F.; Fumagalli, L.; Taisch, M. Sustainability paradigm in the cosmetics industry: State of the art. Clean. Waste Syst. 2022, 3, 100057. [Google Scholar] [CrossRef]
- Guzmán, E.; Lucia, A. Essential oils and their individual components in cosmetic products. Cosmetics 2021, 8, 114. [Google Scholar] [CrossRef]
- Baki, G. Introduction to Cosmetic Formulation and Technology; John Wiley & Sons: Hoboken, NJ, USA, 2022. [Google Scholar]
- Desam, N.R.; Al-Rajab, A.J. The Importance of Natural Products in Cosmetics. In Bioactive Natural Products for Pharmaceutical Applications; Pal, D., Nayak, A.K., Eds.; Springer International Publishing: Berlin/Heidelberg, Germany, 2021; pp. 643–685. [Google Scholar] [CrossRef]
- Cortes, N.; Alves, I.A.; Aragon, D.M. Innovative Emulsifiers in Cosmetic Products: A Patent Review (2013–2023). ACS Omega 2024, 9, 48884–48898. [Google Scholar] [CrossRef]
- Johnson, W., Jr.; Bergfeld, W.F.; Belsito, D.V.; Hill, R.A.; Klaassen, C.D.; Liebler, D.C.; Marks, J.G., Jr.; Shank, R.C.; Slaga, T.J.; Snyder, P.W. Safety assessment of lecithin and other phosphoglycerides as used in cosmetics. Int. J. Toxicol. 2020, 39, 5S–25S. [Google Scholar] [CrossRef]
- Singh, R.D.; Kapila, S.; Ganesan, N.G.; Rangarajan, V. A review on green nanoemulsions for cosmetic applications with special emphasis on microbial surfactants as impending emulsifying agents. J. Surfactants Deterg. 2022, 25, 303–319. [Google Scholar] [CrossRef]
- Guzmán, E.; Ortega, F.; Rubio, R.G. Pickering Emulsions: A Novel Tool for Cosmetic Formulators. Cosmetics 2022, 9, 68. [Google Scholar] [CrossRef]
- Vanderhoff, J.W. Theory of colloids. In Pharmaceutical Dosage Forms; CRC Press: Boca Raton, FL, USA, 2020; pp. 91–152. [Google Scholar]
- Friberg, S.E.; Quencer, L.G.; Hilton, M.L. Theory of emulsions. In Pharmaceutical Dosage Forms; CRC Press: Boca Raton, FL, USA, 2020; pp. 53–90. [Google Scholar]
- Ravera, F.; Dziza, K.; Santini, E.; Cristofolini, L.; Liggieri, L. Emulsification and emulsion stability: The role of the interfacial properties. Adv. Colloid Interface Sci. 2021, 288, 102344. [Google Scholar] [CrossRef]
- Zhang, L.; Mao, H.; Liu, Q.; Gani, R. Chemical product design–recent advances and perspectives. Curr. Opin. Chem. Eng. 2020, 27, 22–34. [Google Scholar] [CrossRef]
- Silva, C.E.P.; Loh, W. Fundamentals of emulsion formation and stability. In Clay Minerals and Synthetic Analogous as Emulsifiers of Pickering Emulsions; Wypych, F., de Freitas, R.A., Eds.; Elsevier: Amsterdam, The Netherlands, 2022; Volume 10, pp. 37–59. [Google Scholar]
- Wulff-Pérez, M.; Martín-Rodríguez, A.; Gálvez-Ruiz, M.J.; de Vicente, J. The effect of polymeric surfactants on the rheological properties of nanoemulsions. Colloid Polym. Sci. 2013, 291, 709–716. [Google Scholar] [CrossRef]
- Hu, Y.T.; Ting, Y.; Hu, J.Y.; Hsieh, S.C. Techniques and methods to study functional characteristics of emulsion systems. J. Food Drug Anal. 2017, 25, 16–26. [Google Scholar] [CrossRef] [PubMed]
- McClements, D.J. Critical review of techniques and methodologies for characterization of emulsion stability. Crit. Rev. Food Sci. Nutr. 2007, 47, 611–649. [Google Scholar] [CrossRef]
- Mohsin, S.; Akhtar, N.; Mahmood, T.; Khan, H.; Mustafa, R. Formulation and stability of topical water in oil emulsion containing corn silk extract. Trop. J. Pharm. Res. 2016, 15, 1115–1121. [Google Scholar] [CrossRef]
- Calvo, F.; Gómez, J.M.; Alvarez, O.; Ricardez-Sandoval, L. Trends and perspectives on emulsified product design. Curr. Opin. Chem. Eng. 2022, 35, 100745. [Google Scholar] [CrossRef]
- Liu, J.K. Natural products in cosmetics. Nat. Prod. Bioprospect 2022, 12, 40. [Google Scholar] [CrossRef]
- Celeiro, M.; Garcia-Jares, C.; Llompart, M.; Lores, M. Recent Advances in Sample Preparation for Cosmetics and Personal Care Products Analysis. Molecules 2021, 26, 4900. [Google Scholar] [CrossRef] [PubMed]
- Kirkbride, L.; Humphries, L.; Kozielska, P.; Curtis, H. Designing a Suitable Stability Protocol in the Face of a Changing Retail Landscape. Cosmetics 2021, 8, 64. [Google Scholar] [CrossRef]
- Bewick, V.; Cheek, L.; Ball, J. Statistics review 12: Survival analysis. Crit. Care 2004, 8, 389–394. [Google Scholar] [CrossRef] [PubMed]
- Savary, G.; Grisel, M.; Picard, C. Cosmetics and Personal Care Products. In Natural Polymers; Olatunji, O., Ed.; Springer International Publishing: Berlin/Heidelberg, Germany, 2016; pp. 219–261. [Google Scholar] [CrossRef]
- Sakamoto, K.; Lochhead, R.Y.; Maibach, H.I.; Yamashita, Y. Cosmetic Science and Technology: Theoretical Principles and Applications; Elsevier: Amsterdam, The Netherlands, 2017. [Google Scholar]
- de Clermont-Gallerande, H. Functional roles of lipids in make-up products. OCL 2020, 27, 33. [Google Scholar] [CrossRef]
- Kundu, P.; Kumar, V.; Mishra, I.M. Modeling the steady-shear rheological behavior of dilute to highly concentrated oil-in-water (o/w) emulsions: Effect of temperature, oil volume fraction and anionic surfactant concentration. J. Pet. Sci. Eng. 2015, 129, 189–204. [Google Scholar] [CrossRef]
- Beri, A.; Norton, J.E.; Norton, I.T. Effect of emulsifier type and concentration, aqueous phase volume and wax ratio on physical, material and mechanical properties of water in oil lipsticks. Int. J. Cosmet. Sci. 2013, 35, 613–621. [Google Scholar] [CrossRef]
- Penagos, I.A.; Murillo Moreno, J.S.; Dewettinck, K.; Van Bockstaele, F. Carnauba Wax and Beeswax as Structuring Agents for Water-in-Oleogel Emulsions without Added Emulsifiers. Foods 2023, 12, 1850. [Google Scholar] [CrossRef]
- Kim, K.-M.; Oh, H.M.; Lee, J.H. Controlling the emulsion stability of cosmetics through shear mixing process. Korea-Aust. Rheol. J. 2020, 32, 243–249. [Google Scholar] [CrossRef]
- Terescenco, D.; Picard, C.; Clemenceau, F.; Grisel, M.; Savary, G. Influence of the emollient structure on the properties of cosmetic emulsion containing lamellar liquid crystals. Colloids Surf. A Physicochem. Eng. Asp. 2018, 536, 10–19. [Google Scholar] [CrossRef]
- Chuberre, B.; Araviiskaia, E.; Bieber, T.; Barbaud, A. Mineral oils and waxes in cosmetics: An overview mainly based on the current European regulations and the safety profile of these compounds. J. Eur. Acad. Dermatol. Venereol. 2019, 33, 5–14. [Google Scholar] [CrossRef] [PubMed]
- Dapčević Hadnađev, T.; Dokić, P.; Krstonošić, V.; Hadnađev, M. Influence of oil phase concentration on droplet size distribution and stability of oil-in-water emulsions. Eur. J. Lipid Sci. Technol. 2013, 115, 313–321. [Google Scholar] [CrossRef]
- Bibette, J.; Calderon, F.L.; Poulin, P. Emulsions: Basic principles. Rep. Prog. Phys. 1999, 62, 969. [Google Scholar] [CrossRef]
- Narayan, S.; Metaxas, A.E.; Bachnak, R.; Neumiller, T.; Dutcher, C.S. Zooming in on the role of surfactants in droplet coalescence at the macroscale and microscale. Curr. Opin. Colloid Interface Sci. 2020, 50, 101385. [Google Scholar] [CrossRef]
- Tadros, T.F. Fundamental principles of emulsion rheology and their applications. Colloids Surf. A Physicochem. Eng. Asp. 1994, 91, 39–55. [Google Scholar] [CrossRef]


Disclaimer/Publisher’s Note: The statements, opinions and data contained in all publications are solely those of the individual author(s) and contributor(s) and not of MDPI and/or the editor(s). MDPI and/or the editor(s) disclaim responsibility for any injury to people or property resulting from any ideas, methods, instructions or products referred to in the content. |
© 2025 by the authors. Licensee MDPI, Basel, Switzerland. This article is an open access article distributed under the terms and conditions of the Creative Commons Attribution (CC BY) license (https://creativecommons.org/licenses/by/4.0/).