
Digital Tools in Action: 3D Printing for Personalized Skincare in the Era of Beauty Tech


Abstract
1. Introduction
2. Materials and Methods
2.1. Materials
2.2. Formulations Development
2.3. 3D Printing
2.4. In Vitro Studies—Physical Analysis of the Patches’ Hydration Performance
2.5. In Vivo Studies—From Sensitization to Hydration Efficacy and Personalization
2.5.1. Sensitization—Human Repeat Insult Patch Test (HRIPT)
2.5.2. Hydration Efficacy
Conventional Methods
Confocal Raman Spectroscopy (CRS)
Reflectance Confocal Microscopy (RCM)
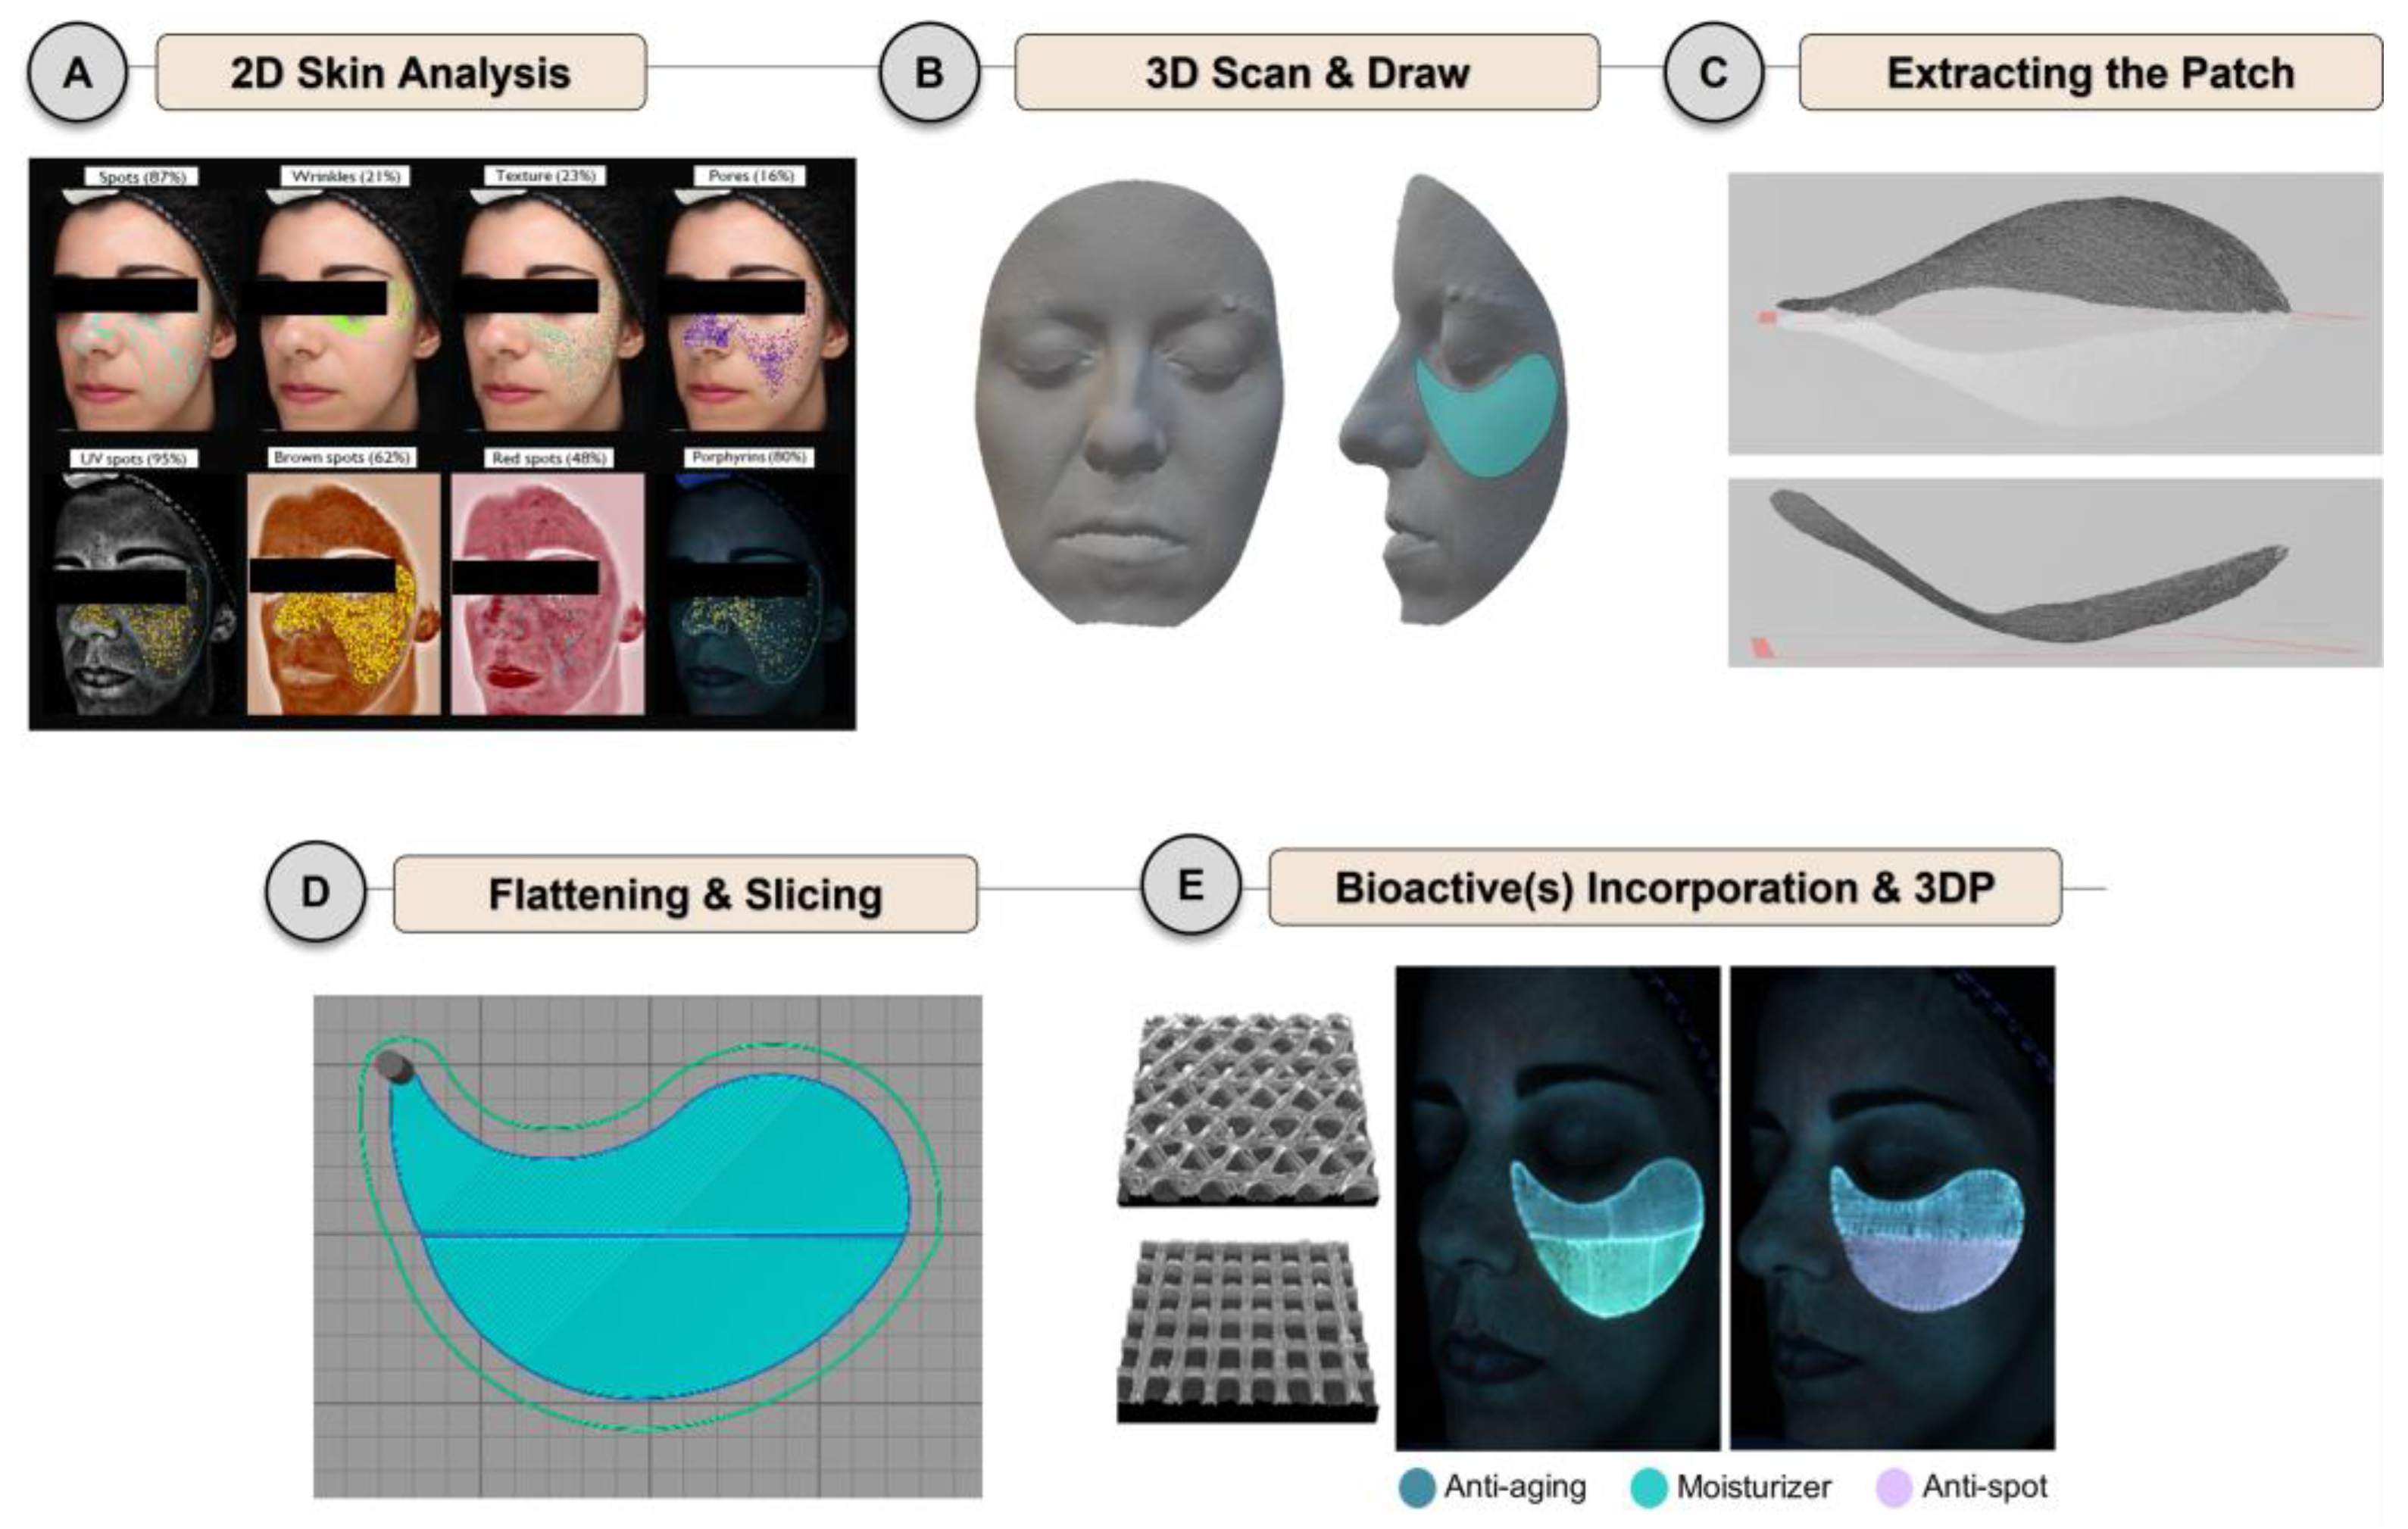
2.5.3. Biometric-Preference-Driven Personalization
Personalization Survey
Skin Needs
Size and Shape
Skin Conditions
Color and Fragrance
2.5.4. Affective Analysis
2.6. Statistical Analysis
3. Results and Discussion
3.1. Sensitization Assessment
3.2. Hydration Efficacy
3.2.1. Conventional Methods
3.2.2. Advanced Methods
3.2.3. Insights into the Physical Mechanisms Governing Patches’ Hydration
3.3. Biometric-Preference-Driven Personalization
3.3.1. From Size and Shape to Skin Needs
3.3.2. Skin Conditions
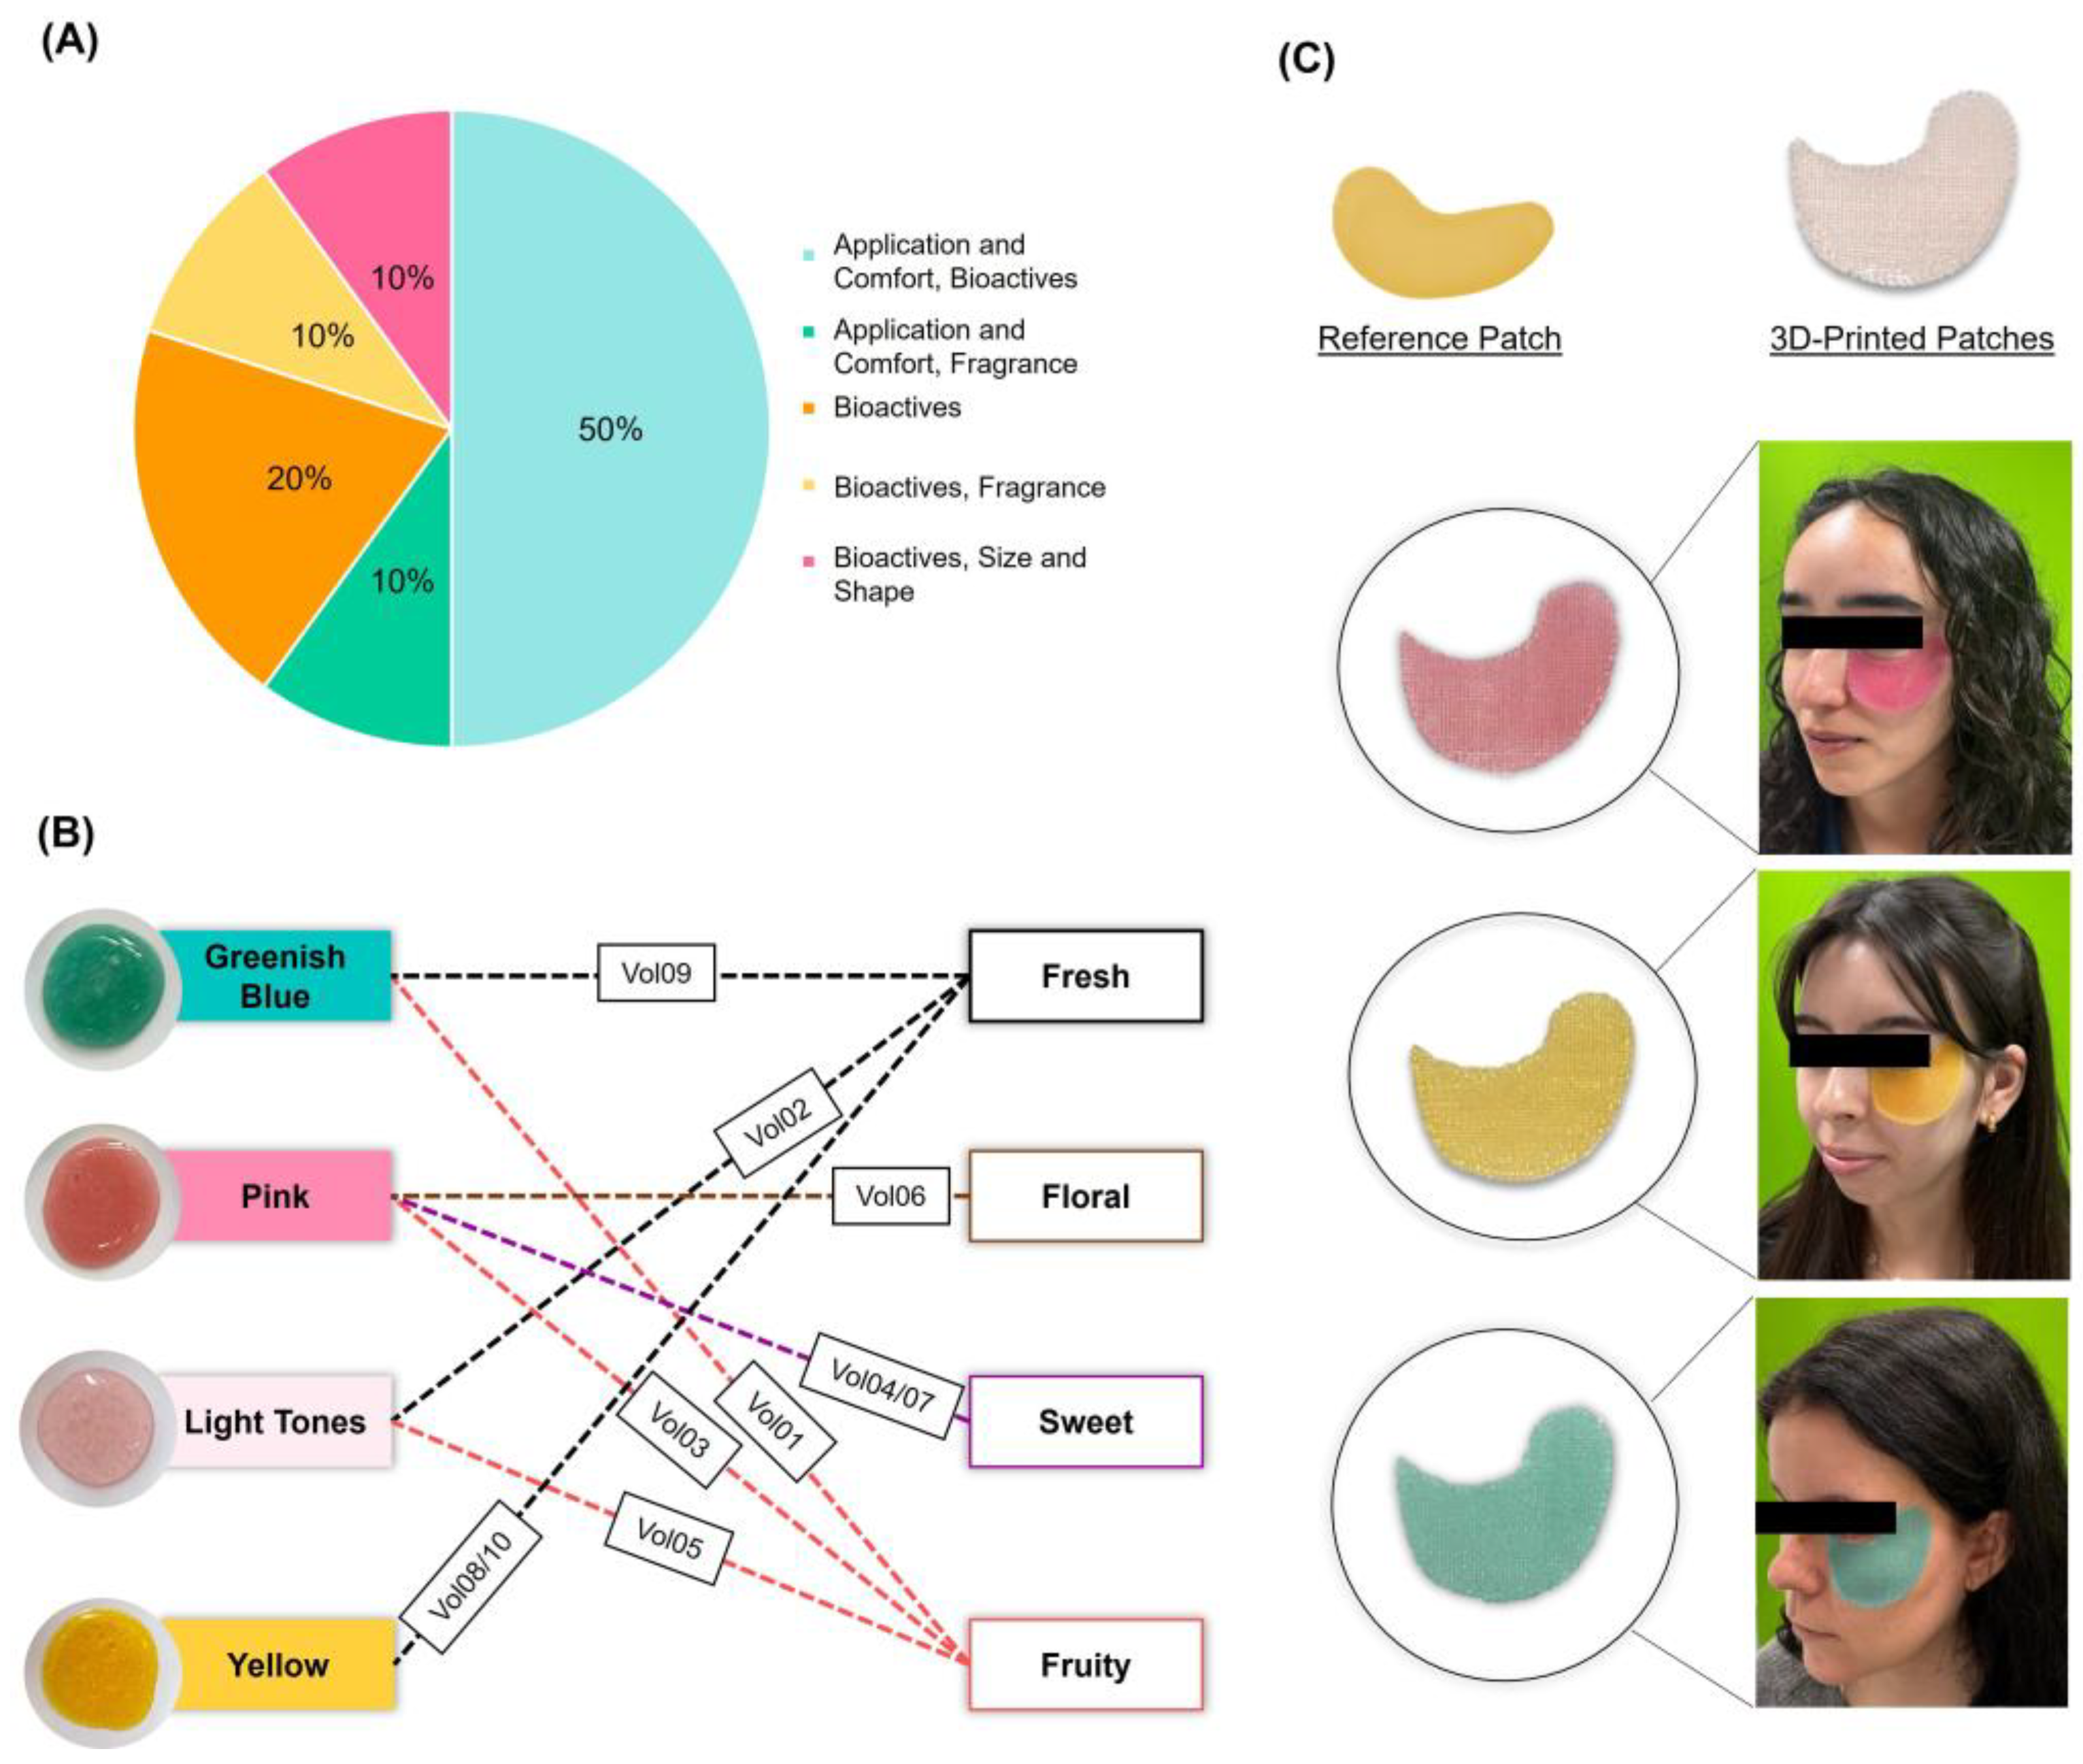
3.3.3. From Consumer Insights to Preferences
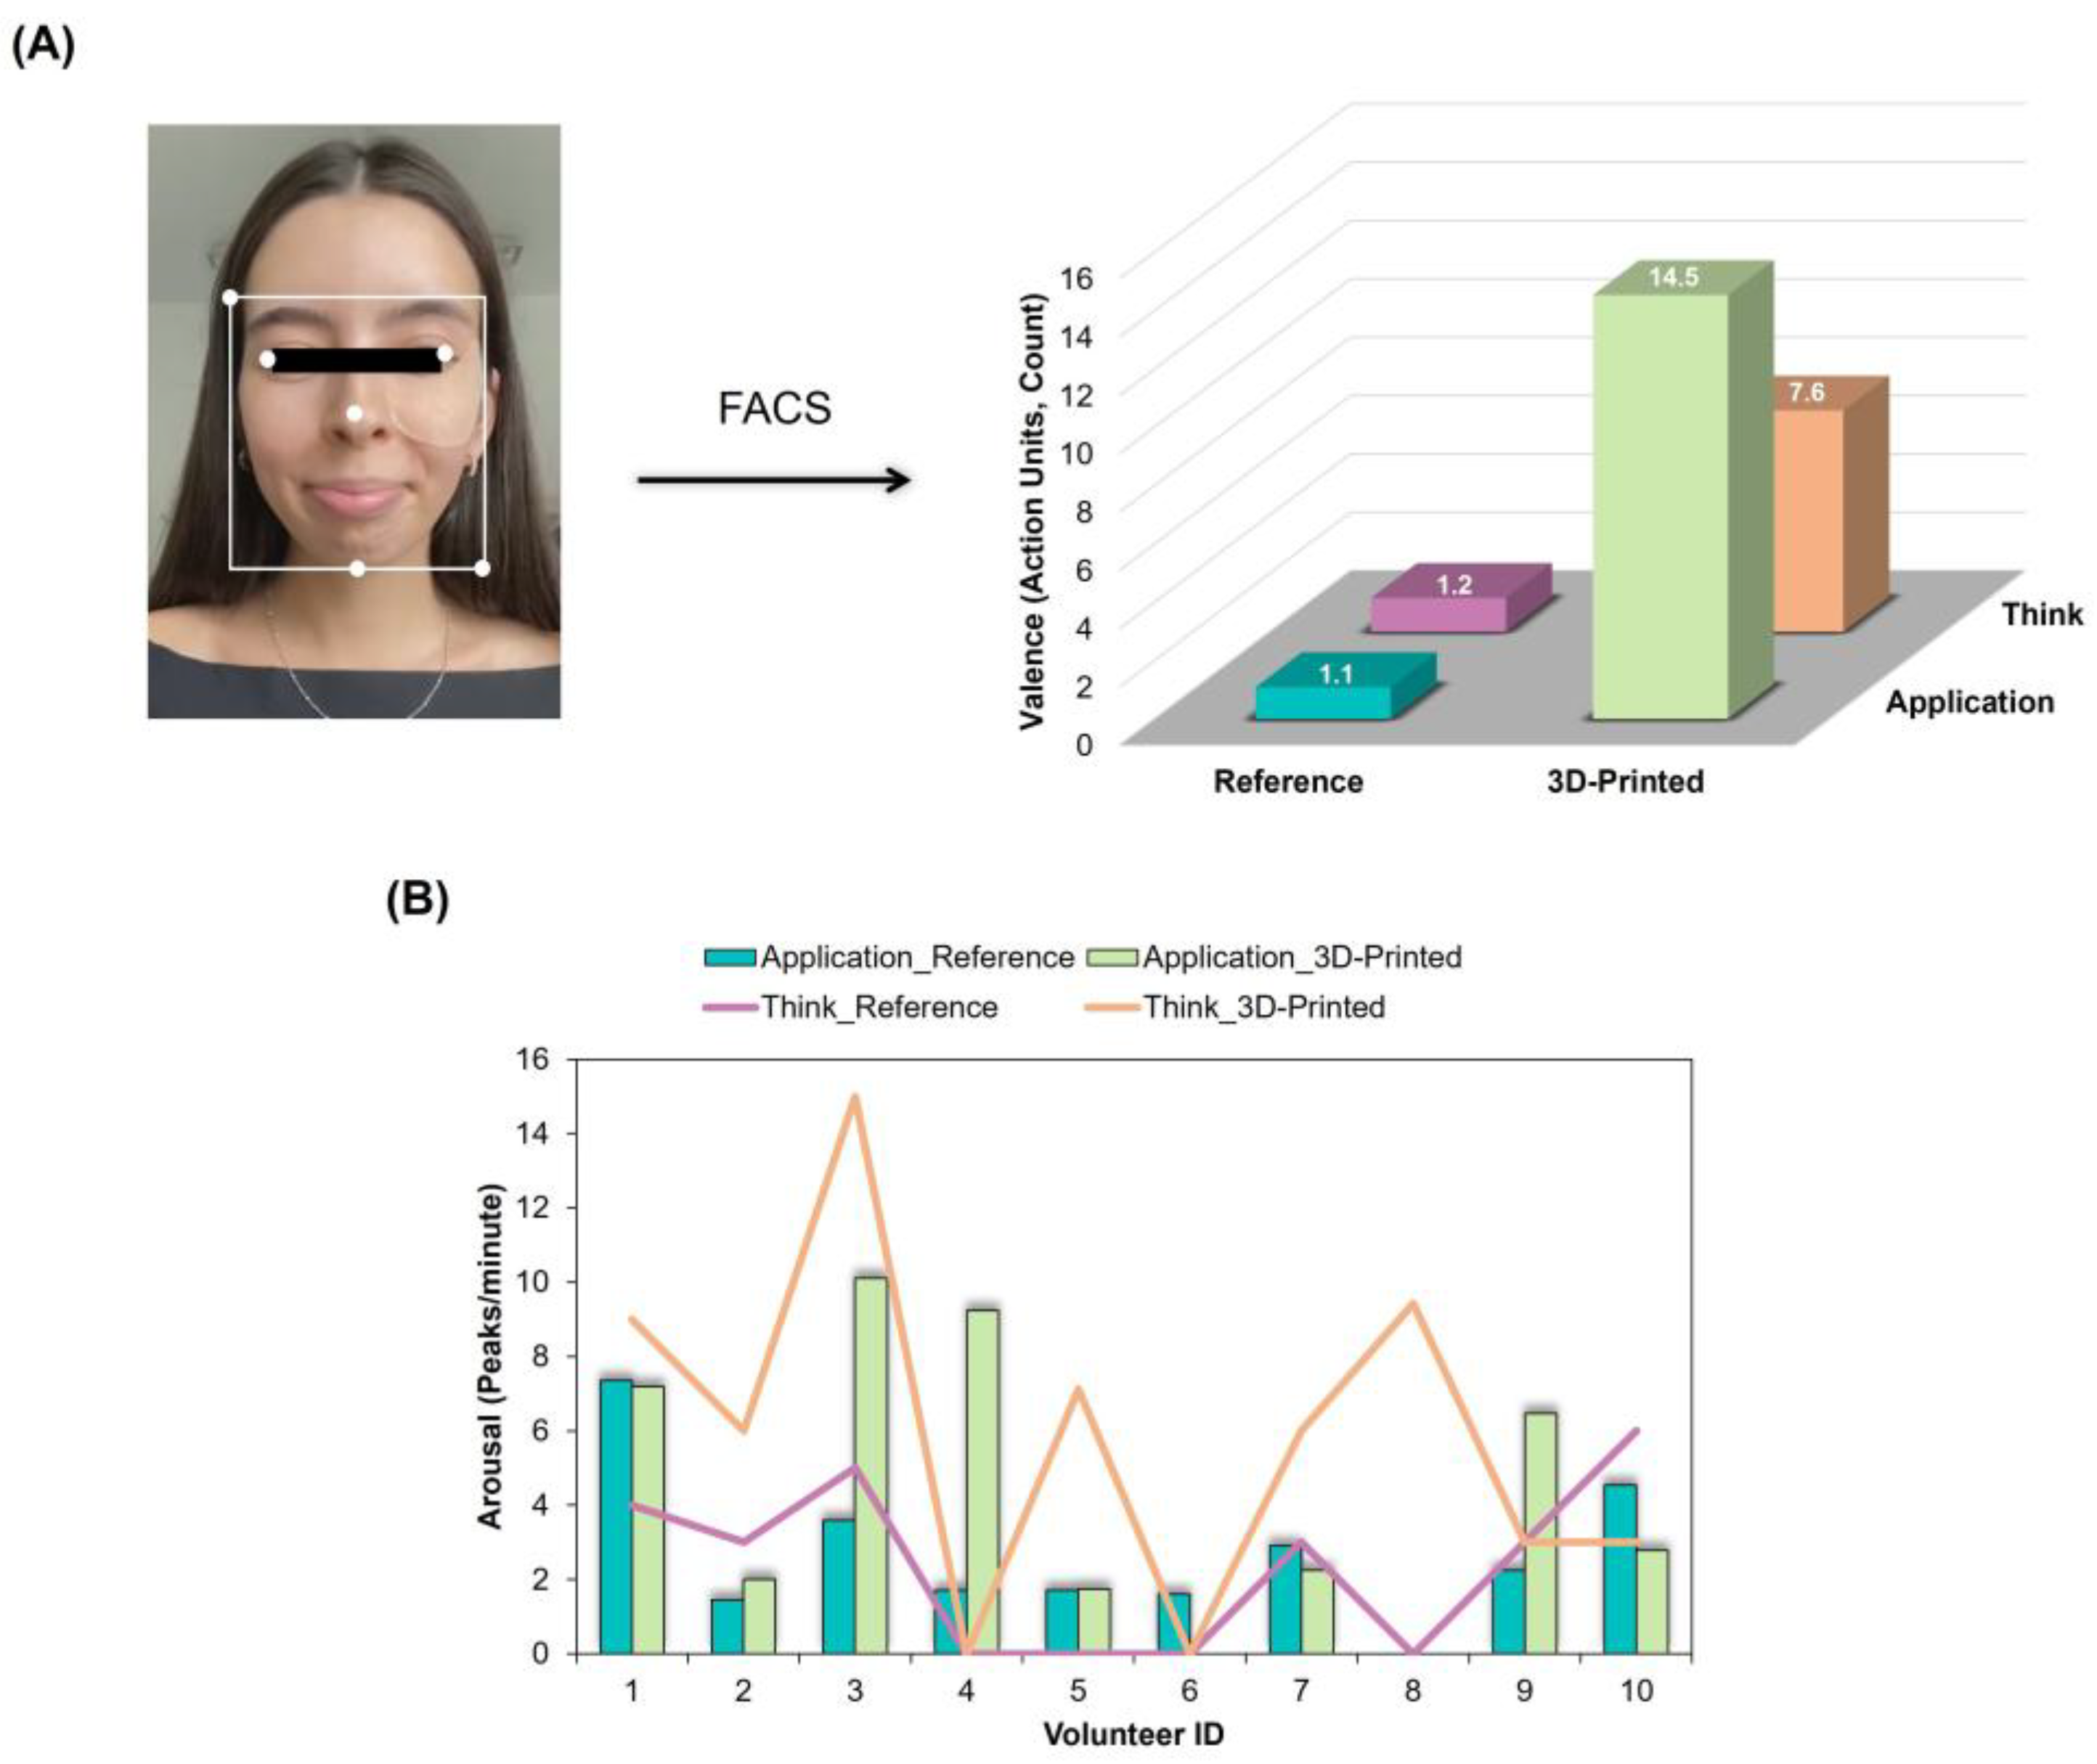
3.4. Affective Analysis
4. Conclusions
Author Contributions
Funding
Institutional Review Board Statement
Informed Consent Statement
Data Availability Statement
Conflicts of Interest
Abbreviations
| 3DP | 3D Printing |
| AI | Artificial Intelligence |
| AUC | Area Under Curve |
| CRS | Confocal Raman Spectroscopy |
| FACS | Facial Action Classification System |
| G | Gauge |
| HRIPT | Human Repeat Insult Patch Test |
| ICDRG | International Contact Dermatitis Research Group |
| INCI | International Nomenclature Cosmetic Ingredient |
| LD | Line Distance |
| M | Metal |
| Ocl | Occlusive |
| Por | Porous |
| POST | Plastic Occlusion Stress Test |
| RCM | Reflectance Confocal Microscopy |
| TEWL | Transepidermal Water Loss |
| Vol | Volunteer |
Appendix A
Personalization Survey
- Q1. How many times a month do you usually use face masks? Selecet 1 option.
- Q2. Why do you like using face masks? What is your skincare goal? (Open Question)
- Q3. If you could create your own face mask, what would be most important to you? Select up to 2 options.
- Q4. In terms of color, what would be your preference? Indicate 2 color options. (Open Question)
- Q5. What are your fragrance preferences? Select 1 option.

| Volunteer ID | Response |
|---|---|
| Vol01 | Intense treatment and care. |
| Vol02 | To get a clear skin, reduce signs of fatigue and prevent aging. |
| Vol03 | I like using face masks because they give my skin that extra boost it needs. It is a relaxing ritual that helps to deep cleanse, hydrate or just leave my skin feeling refreshed and glowing. My skincare goal is to have healthy skin that looks and feels great. |
| Vol04 | Hydration. |
| Vol05 | Hydration. |
| Vol06 | Fondness for self-care and the feeling of velvety skin after using a mask. Aim for intensive hydration. |
| Vol07 | Hydration. |
| Vol08 | Improve my skin appearance. |
| Vol09 | Hydration. |
| Vol10 | To have a good-looking, moisturized and beautiful skin. |
| Volunteer ID | Response | Preferences |
|---|---|---|
| Vol01 | I liked the product in box 2 better. It was more refreshing. Easier to apply. It is much more comfortable when applied to the skin. The surface area also helped a lot. The color is also very pleasant, and I can notice a subtle shine in the product. For me, 2 was without a doubt the best. | Box 2 Refreshing effect Comfort Patch size Color |
| Vol02 | I liked box 2 more, because in addition to the product being light, it also has a larger skin coverage area. I felt it was more refreshing. I feel that the product in box 1 has an oily application, while the product in box 2 does not, I really liked the sensation. | Box 2 Light Patch size Refreshing effect |
| Vol03 | Overall, I liked both products. However, the patch from box 2 was the one I liked the most. I feel the color is more attractive. I feel a good freshness. And I feel that the fact that it is bigger, covers a larger area of the face and that’s why I liked this factor more. I feel like it could be part of my skincare routine. | Box 2 Color Refreshing effect Patch size |
| Vol04 | I liked the product I put on the left side (box 2) better. Since it has a larger area, it covers more. I like this part the most, because it will give me better hydration. And the feeling I have of refreshed and awake skin is greater and lasts longer with this product, compared to the other. | Box 2 Patch size Hydration Refreshing and awake effect |
| Vol05 | I would say box 2. I like the color. I feel it has good structure, consistency and resistance. It feels much more comfortable on my skin than when applying the product from box 1. The one from box 1, I feel, is very dense. While the one in box 2 is much more comfortable. | Box 2 Color Structure Comfort |
| Vol06 | I liked the one in box 2 better. It’s more comfortable. It doesn’t feel so wet on the skin. I liked the smell. The shape is also very pleasant and doesn’t bother me as much. I liked the color. It’s nice, I liked the one in box 2 better. | Box 2 Comfort Fragrance Patch Format Comfort Color |
| Vol07 | I liked box 1 better. The feeling of freshness continues to be felt more in box 2 than in box 1. However, I enjoyed the application of the first one and prefer the texture of the patch itself. | Box 1 Application Texture Box 2 Refreshing effect |
| Vol08 | I liked the first one better, more pleasant on the skin. Fresher. And I didn’t like the smell of box 2. | Box 1 Comfort Refreshing effect |
| Vol09 | I liked the patch on box 2 better. Not only is the color blue (I love it). It’s also wider and more comfortable on the skin. I feel that a larger area is being moisturized. Besides having to apply the gel beforehand, which gives the skin more freshness. Whereas the one in box 1, apart from being difficult to pick up due to its slippery texture, doesn’t leave the skin as moisturized and doesn’t smell as good. | Box 2 Color Comfort Patch size Refreshing effect Hydration Fragrance |
| Vol10 | The one in box 2, for the moisturizing sensation and the icy feeling it gives. | Box 2 Moisturizing sensation Refreshing effect |
References
- Ustymenko, R. Trends and Innovations in Cosmetic Marketing. Econ. Educ. 2023, 8, 12–17. [Google Scholar] [CrossRef] [PubMed]
- Snekha, S.; Chandrasekar A Sanjana, M.; Krishnan, J.; Ranjith, R.; Vijayakumar, K. Cosmetic Products Customisation and Customer Segmentation. In Proceedings of the 2nd IEEE International Conference on Advances in Computing, Communication and Applied Informatics, ACCAI 2023, Chennai, India, 25–26 May 2023; Institute of Electrical and Electronics Engineers Inc.: Piscataway, NJ, USA, 2023; pp. 1–11. [Google Scholar]
- Bhosale, U.; Gaddam, S.; Koutam, H.; Sapre, P.; Nallan, C.; Syed, S.M. Empowering Consumers: The Evolving Paradigm of Customization in Personal Care Products. Curr. Cosmet. Sci. 2023, 2, E201023222482. [Google Scholar] [CrossRef]
- Dehghan, S.; Sattarpanah Karganroudi, S.; Echchakoui, S.; Barka, N. The Integration of Additive Manufacturing into Industry 4.0 and Industry 5.0: A Bibliometric Analysis (Trends, Opportunities, and Challenges). Machines 2025, 13, 62. [Google Scholar] [CrossRef]
- Elder, A.; Cappelli, M.O.D.; Ring, C.; Saedi, N. Artificial Intelligence in Cosmetic Dermatology: An Update on Current Trends. Clin. Dermatol. 2024, 42, 216–220. [Google Scholar] [CrossRef]
- Mangtani, N.; Bajpai, N.; Sahasrabudhe, S.; Wasule, D. Importance of Artificial Intelligence and Augment Reality in Cosmetic and Beauty Industry Post COVID 19. World J. Pharm. Res. 2020, 9, 2296–2308. [Google Scholar]
- Amornvit, P.; Sanohkan, S. The Accuracy of Digital Face Scans Obtained from 3D Scanners: An in Vitro Study. Int. J. Environ. Res. Public. Health 2019, 16, 5061. [Google Scholar] [CrossRef]
- Chandel, A.; Gain, N. A Review on Digital Transformation: Cosmetic Industry. Int. J. Innov. Sci. Eng. Manag. 2024, 3, 26–30. [Google Scholar]
- Bom, S.; Martins, A.M.; Ribeiro, H.M.; Marto, J. Diving into 3D (Bio)Printing: A Revolutionary Tool to Customize the Production of Drug and Cell-Based Systems for Skin Delivery. Int. J. Pharm. 2021, 605, 120794. [Google Scholar] [CrossRef]
- Kitić, A.; Randjelović, S. New Configurator Trends in the Cosmetic Industry. In Proceedings of the 10th International Conference on Mass Customization and Personalization—Community of Europe (MCP—CE 2022) Toward the Sustainable, User-Centric and Smart Industry 5.0, Novi Sad, Serbia, 21–23 September 2022; pp. 79–83. [Google Scholar]
- Eixarch, H.; Wyness, L.; Sibanda, M. The Regulation of Personalized Cosmetics in the EU. Cosmetics 2019, 6, 29. [Google Scholar] [CrossRef]
- Pech, M.; Vrchota, J. The Product Customization Process in Relation to Industry 4.0 and Digitalization. Processes 2022, 10, 539. [Google Scholar] [CrossRef]
- Goole, J.; Amighi, K. 3D Printing in Pharmaceutics: A New Tool for Designing Customized Drug Delivery Systems. Int. J. Pharm. 2016, 499, 376–394. [Google Scholar] [CrossRef] [PubMed]
- Liu, Z.; Jiang, Q.; Zhang, Y.; Li, T.; Zhang, H.C. Sustainability of 3D Printing: A Critical Review and Recommendations. In Proceedings of the ASME 2016 11th International Manufacturing Science and Engineering Conference, Blacksburg, VA, USA, 27 June–1 July 2016; Volume 2, pp. 1–8. [Google Scholar]
- Norman, J.; Madurawe, R.D.; Moore, C.M.V.; Khan, M.A.; Khairuzzaman, A. A New Chapter in Pharmaceutical Manufacturing: 3D-Printed Drug Products. Adv. Drug Deliv. Rev. 2017, 108, 39–50. [Google Scholar] [CrossRef]
- Jiao, Y.; Stevic, M.; Buanz, A.; Uddin, M.J.; Tamburic, S. Current and Prospective Applications of 3D Printing in Cosmetics: A Literature Review. Cosmetics 2022, 9, 115. [Google Scholar] [CrossRef]
- de Oliveira, R.S.; Fantaus, S.S.; Guillot, A.J.; Melero, A.; Beck, R.C.R. 3D-Printed Products for Topical Skin Applications: From Personalized Dressings to Drug Delivery. Pharmaceutics 2021, 13, 1946. [Google Scholar] [CrossRef] [PubMed]
- Saeed, H.A.M.; Yang, H. The Versatile World of Cosmetic Facial Masks in Skincare: Fabrication, Properties, and Future Directions: A Review. J. Drug Deliv. Sci. Technol. 2025, 108, 106895. [Google Scholar] [CrossRef]
- Rudolf, A.; Šterman, S.; Cupar, A. Development of a Textile Sheet Mask Design for Facial Care Based on a 3D Face Model of an Average Woman. J. Eng. Fibers Fabr. 2024, 19, 15589250241254443. [Google Scholar] [CrossRef]
- Triffin, M. Neutrogena® Unveils Neutrogena MaskiDTM Personalized 3-D Printed Face Masks. Available online: https://www.jnj.com/innovation/neutrogena-unveils-neutrogena-maskid-personalized-3-d-printed-face-masks (accessed on 21 April 2025).
- Sae-jin, P. AmorePacific to Attract Customers with 3D-Printed Cosmetic Mask Packs. Available online: https://www.ajupress.com/view/20200316133658351 (accessed on 21 April 2025).
- Tailored Facial Mask Pack 3D Printing System. Available online: https://www.apgroup.com/int/en/about-us/research-innovation/rni/beauty-research-innovation/beauty-research-innovation-12.html (accessed on 21 April 2025).
- Goyanes, A.; Det-Amornrat, U.; Wang, J.; Basit, A.W.; Gaisford, S. 3D Scanning and 3D Printing as Innovative Technologies for Fabricating Personalized Topical Drug Delivery Systems. J. Control. Release 2016, 234, 41–48. [Google Scholar] [CrossRef]
- Manousi, E.; Chatzitaki, A.T.; Vakirlis, E.; Karavasili, C.; Fatouros, D.G. Development and in Vivo Evaluation of 3D Printed Hydrogel Patches for Personalized Cosmetic Use Based on Skin Type. J. Drug Deliv. Sci. Technol. 2024, 92, 105306. [Google Scholar] [CrossRef]
- Pinto, P.; Rosado, C.; Parreirão, C.; Rodrigues, L.M. Is There Any Barrier Impairment in Sensitive Skin?: A Quantitative Analysis of Sensitive Skin by Mathematical Modeling of Transepidermal Water Loss Desorption Curves. Ski. Res. Technol. 2011, 17, 181–185. [Google Scholar] [CrossRef]
- Marzulli, F.N.; Maibach, H.I. Contact Allergy: Predictive Testing in Man. Contact Dermat. 1976, 2, 1–17. [Google Scholar] [CrossRef]
- Fregert, S.; Bandmann, H.-J. Patch Testing; Springer: Berlin/Heidelberg, Germany, 1975; ISBN 978-3-540-07229-4. [Google Scholar]
- Demšar, J.; Curk, T.; Erjavec, A.; Črt, G.; Hočevar, T.; Milutinovič, M.; Možina, M.; Polajnar, M.; Toplak, M.; Starič, A.; et al. Orange: Data Mining Toolbox in Python. J. Mach. Learn. Res. 2013, 14, 2349–2353. [Google Scholar]
- Rodriguesl, L.; Pinto’, P.; Galegol, N.; Da Silval, P.A.; Pereira2, L.M. Transepidermal Water Loss Kinetic Modeling Approach for the Parameterization of Skin Water Dynamics. Ski. Res. Technol. 1999, 5, 72–82. [Google Scholar] [CrossRef]
- Caspers, P.J.; Nico, C.; Bakker Schut, T.C.; de Sterke, J.; Pudney, P.D.A.; Curto, P.R.; Illand, A.; Puppels, G.J. Method to Quantify the in Vivo Skin Penetration of Topically Applied Materials Based on Confocal Raman Spectroscopy. Transl. Biophotonics 2019, 1, e201900004. [Google Scholar] [CrossRef]
- Zhang, Y.; Kung, C.P.; Iliopoulos, F.; Sil, B.C.; Hadgraft, J.; Lane, M.E. Dermal Delivery of Niacinamide—In Vivo Studies. Pharmaceutics 2021, 13, 726. [Google Scholar] [CrossRef]
- Caspers, P.J.; Lucassen, G.W.; Bruining, H.A.; Puppels, G.J. Automated Depth-Scanning Confocal Raman Microspectrometer for Rapid in Vivo Determination of Water Concentration Profiles in Human Skin. J. Raman Spectrosc. 2000, 31, 813–818. [Google Scholar] [CrossRef]
- Caspers, P.J.; Lucassen, G.W.; Carter, E.A.; Bruining, H.A.; Puppels, G.J. In Vivo Confocal Raman Microspectroscopy of the Skin: Noninvasive Determination of Molecular Concentration Profiles. J. Investig. Dermatol. 2001, 116, 434–442. [Google Scholar] [CrossRef]
- Bielfeldt, S.; Schoder, V.; Ely, U.; Van Der Pol, A.; De Sterke, J.; Wilhelm, K.-P. Assessment of Human Stratum Corneum Thickness and Its Barrier Properties by In-vivo Confocal Raman Spectroscopy. Int. J. Cosmet. Sci. 2009, 12, 2–8. [Google Scholar] [CrossRef]
- Kauschke, C.; Bahn, D.; Vesker, M.; Schwarzer, G. Review: The Role of Emotional Valence for the Processing of Facial and Verbal Stimuli—Positivity or Negativity Bias? Front. Psychol. 2019, 10, 1654. [Google Scholar] [CrossRef]
- Yan, L.; Murray, K.B. The Motivational Dynamics of Arousal and Values in Promoting Sustainable Behavior: A Cognitive Energetics Perspective. Int. J. Res. Mark. 2023, 40, 679–699. [Google Scholar] [CrossRef]
- Calzavara-Pinton, P.; Longo, C.; Venturini, M.; Sala, R.; Pellacani, G. Reflectance Confocal Microscopy for In Vivo Skin Imaging. Photochem. Photobiol. 2008, 84, 1421–1430. [Google Scholar] [CrossRef]
- Zhai, H.; Maibach, H.I. Effects of Skin Occlusion on Percutaneous Absorption: An Overview. Ski. Pharmacol. Appl. Skin. Physiol. 2001, 14, 1–10. [Google Scholar] [CrossRef] [PubMed]
- Goldsberry, A.; Hanke, W.; Hanke, K.E. VISIA System: A Possible Tool in the Cosmetic Practice. J. Drugs Dermatol. 2014, 13, 1312–1314. [Google Scholar] [PubMed]
- Lombardi, S.A.; Ratti, A. Emotional Effects Induced by Lip Balms Containing Different Emollients: Neuroscientific Approach to Studying the Tactual Experience. Househ. Pers. Care Today 2017, 12, 52–57. [Google Scholar]
- Roso, A.; Aubert, A.; Cambos, S.; Vial, F.; Schäfer, J.; Belin, M.; Gabriel, D.; Bize, C. Contribution of Cosmetic Ingredients and Skin Care Textures to Emotions. Int. J. Cosmet. Sci. 2024, 46, 262–283. [Google Scholar] [CrossRef]
- Spence, C.; Zhang, T. Multisensory Contributions to Skin-Cosmetic Product Interactions. Int. J. Cosmet. Sci. 2024, 46, 833–849. [Google Scholar] [CrossRef]


Disclaimer/Publisher’s Note: The statements, opinions and data contained in all publications are solely those of the individual author(s) and contributor(s) and not of MDPI and/or the editor(s). MDPI and/or the editor(s) disclaim responsibility for any injury to people or property resulting from any ideas, methods, instructions or products referred to in the content. |
© 2025 by the authors. Licensee MDPI, Basel, Switzerland. This article is an open access article distributed under the terms and conditions of the Creative Commons Attribution (CC BY) license (https://creativecommons.org/licenses/by/4.0/).
Share and Cite
Bom, S.; Pinto, P.C.; Ribeiro, H.M.; Marto, J. Digital Tools in Action: 3D Printing for Personalized Skincare in the Era of Beauty Tech. Cosmetics 2025, 12, 136. https://doi.org/10.3390/cosmetics12040136
Bom S, Pinto PC, Ribeiro HM, Marto J. Digital Tools in Action: 3D Printing for Personalized Skincare in the Era of Beauty Tech. Cosmetics. 2025; 12(4):136. https://doi.org/10.3390/cosmetics12040136
Chicago/Turabian StyleBom, Sara, Pedro Contreiras Pinto, Helena Margarida Ribeiro, and Joana Marto. 2025. "Digital Tools in Action: 3D Printing for Personalized Skincare in the Era of Beauty Tech" Cosmetics 12, no. 4: 136. https://doi.org/10.3390/cosmetics12040136
APA StyleBom, S., Pinto, P. C., Ribeiro, H. M., & Marto, J. (2025). Digital Tools in Action: 3D Printing for Personalized Skincare in the Era of Beauty Tech. Cosmetics, 12(4), 136. https://doi.org/10.3390/cosmetics12040136