Article

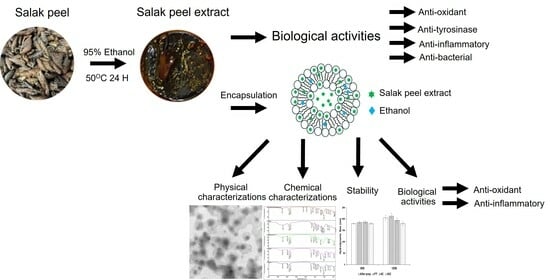
Exploration of Salak Peel Extract Activities for Cosmeceutical Applications and Its Encapsulation in Ethosomes Using Green Method

by
Supreeda Tambunlertchai
*,
Raweewan Thiramanas
,
Yodsathorn Wongngam
,
Pimnipa Yodkrahom
,
Sornsawan Batthong
,
Kunat Suktham
,
Suvimol Surassmo
,
Udom Asawapirom
and
Duangporn Polpanich
National Nanotechnology Center, National Science and Technology Development Agency, Pathum Thani 12120, Thailand
*
Author to whom correspondence should be addressed.
Cosmetics 2025, 12(3), 122; https://doi.org/10.3390/cosmetics12030122
Submission received: 13 March 2025 / Revised: 19 May 2025 / Accepted: 6 June 2025 / Published: 12 June 2025
(This article belongs to the Section Cosmetic Formulations)

Abstract

:
Salak peel extract has various biological properties befitting cosmeceutical applications; however, their practical uses are still limited due to their low water solubility and stability. Encapsulation technology was employed to alleviate these issues. In this work, we presented a simple method to prepare ethosome-encapsulated salak peel extract using green solvents (ethanol and water). For this purpose, we used 95% ethanol to extract salak peel and explored its activities. Results showed that, in addition to anti-oxidant, the extract also showed anti-tyrosinase, anti-inflammatory, and anti-bacterial (against S. aureus) activities. These activities indicate its potential uses in cosmeceutical applications. We further encapsulated the extract in ethosomes using a stirrer and green solvents for the preparation methods. The yielded ethosomes exhibited a size range of 120 to 205 nm, polydispersity index (PDI) of 0.15 to 0.25, and zeta potential of −35 to −60 mV depending on the amount of L-α-phosphatidylcholine used. The highest encapsulation efficiency was approximately 30%. The antiradical capacity and anti-inflammatory activities of salak peel extract were also found to be maintained after the encapsulation process. An in vitro biocompatibility study of the extract after encapsulation was also performed. The results not only indicated good biocompatibility, but also the potential skin-rejuvenating ability of salak peel ethosomes. A stability study was also performed, and the results suggested that these ethosomes were stable at different conditions. With further investigation, salak peel ethosomes, as presented here, can be suitable for cosmeceutical applications.

Graphical Abstract

1. Introduction

Salak plum, or snake fruit (Salacca edulis), is commonly consumed in Thailand. The fruit is reported to have many biological properties such as antiradical capacity, anti-hyperuricemic, and anti-cancer activities [1], as it contains polyphenols, acetic acid, pyrolle-2,4-dicarboxylic acid-methyl ester, and other beneficial substances [1]. In addition to its pulp, the peel is stated to possess many traits useful for cosmeceutical applications including antiradical, anti-hypertensive, and anti-microbial properties [2,3,4]. In fact, the peel’s antiradical capacity was comparable to that of the fruit, with the additional effect of lowering blood pressure and showing anti-diabetic activity [3]. Water, ethanol, and a mixture of the two are widely used in the extraction process of salak peel with higher amounts of ethanol resulting in better biological activities [2,3,5], potentially due to the higher total phenolic content in the extract as the amount of ethanol increases [3,5]. Despite their good biological properties, the use of salak peel extract in cosmeceutical applications is still infrequent due to the extract’s limited water solubility and stability, making it difficult to incorporate into formulations. Encapsulation technology can offer a solution to these two limitations of the extract.
Encapsulation technology enhances hydrophilicity, stability, and bioavailability of plant extracts. It also prolongs the release of the extract and, in some cases, reduces the potential toxicity. Various types of nanoparticles have been investigated including polymeric, protein, and lipid nanoparticles [6,7,8]. Liposomes and liposome-like structures (e.g., ethosomes, transferosomes, transethosomes, etc.) have advantages over other types of nanoparticles due to their ability to encapsulate both hydrophilic and hydrophobic substances in the same structure. Thus, the two types of substances can be encapsulated in the core and shell, respectively. This makes liposomes and liposome-like structures suitable for use as a plant extract delivery platform as most of them are a mixture of both substance types [9,10,11,12]. Encapsulating plant extracts in liposomes and liposome-like structures also enhances their biological properties. Using Differential Scanning Calorimetry (DSC), Gortzi et al. showed that the overall antiradical capacity of Myrtus communis extract increased after encapsulation in liposomes [9]. The properties of the loaded extract can also be further enhanced when liposome-like structures are used in place of liposomes. Ethosomes are liposome-like structures with alcohol inserted in the shell, providing the nanoparticles with enhanced stability and skin penetration ability. Encapsulating rosmarinic acid in ethosomes was shown to enhance skin penetration and enzyme inhibition activity as compared to liposomes [13]. Similar results were found when both types of nanoparticles were loaded with Curcuma heyneana rhizome extract [14]. Other liposome-like structures worth mentioning are ‘phytosomes’, where the polyphenol parts of the extract form chemical interactions with the shell [15,16]. The advantage of ‘phytosomes’ over liposomes is the improved delivery of extracts via the topical route and a better stability profile [17,18]. Because plant extracts normally contain polyphenols, when encapsulating plant extracts in liposome and liposome-like structures, it can be worth noting the possibility of the nanoparticles being classified as ‘phytosomes’.
Focusing on salak peel extract, to the best of the authors’ knowledge, there has been only one work that reported encapsulation of such a substance in nanoparticles. Kanlayavattanakul et al. developed liposome-loaded salak peel extract via the thin-film hydration method and probe sonication [2]. Results showed that the nanoparticle characteristics are dependent on their qualitative and quantitative compositions. For example, when the ratio between lecithin and hydrophobically modified hydroxyethylcellulose changed from 7:1 to 7:2, the hydrodynamic size and entrapment efficiency changed from 62 to 105 nm and 88 to 89%, respectively. Nevertheless, liposome characteristics significantly changed when stored for 1 month at different temperatures, indicating instability. The method used was complicated, required a toxic chemical (i.e., dimethyl ether), and would be difficult to carry out on a large scale. In addition, the biocompatibility of the encapsulated liposomes was not tested. Hence, to increase the possibility of the practical use of salak peel extract in cosmeceutical applications, further investigation on the encapsulation of salak peel extract is still required, especially using scalable methods.
In this work, we investigate the possibility of (1) using ‘green’ solvents (i.e., ethanol and water) from the extraction to the encapsulation process and (2) using simple and low-energy methods to prepare ethosomes (with and without encapsulation of the extract). Salak peel was extracted using ethanol, and its biological activities were investigated. The extract was then encapsulated in ethosomes prepared using only a stirrer and ethanol/water as solvents. The hydrodynamic size, polydispersity index (PDI), zeta potential, and stability of the yielded ethosomes were determined. To demonstrate the potential use of the prepared salak peel ethosomes in cosmeceutical applications, the antiradical and anti-inflammation properties and toxicity against fibroblast cells of both the ethosomes and salak peel ethosomes were evaluated, using in vitro testing. To the best of the authors’ knowledge, the novelties of this work include (1) exploring multiple biological properties of salak peel extract; (2) encapsulating it in ethosomes using simple, low-energy methods and only green solvents (water and ethanol); and (3) testing the biocompatibility of salak peel ethosomes.

2. Materials and Methods

2.1. Materials

Salak plum peels were collected from Nong Lalok, Ban Khai District, Rayong, Thailand (12.799819,101.230734). Ethanol (Commercial grade) and filter paper (Whatman NO.1) were purchased from Italmar Co., Ltd. (Bangkok, Thailand). Chlorogenic acid was purchased from Tokyo chemical industry (TCI) Co., Ltd. (Tokyo, Japan). Methanol (Chromatographic grade) was purchased from RCI Labscan (Dublin, Ireland). 2,2-di(4-tert-octylphenyl)-1-picrylhydrazyl (DPPH), 2,2′-azino-bis(3-ethylbenzothiazoline-6-sulfonic acid) (ABTS), L-ascorbic acid (98% purity), 2,2-diphenyl-1-picrylhydrazyl L-3,4-dihydroxyphenylalanine (L-DOPA), gallic acid, and kojic acid were purchased from Sigma-aldrich (Saint Louis, MO, USA). Dulbecco’s modified Eagle’s medium (DMEM) complete medium containing 10% fetal bovine serum, 1% L-glutamine, and 1% penicillin/streptomycin were obtained from Gibco (Grand Island, NY, USA). L-α-phosphatidylcholine was purchased from Sigma-Aldrich. Alcohol GR grade was purchased from Duksan Pure Chemicals (Ansan-si, Korea). Folin–Ciocalteu reagent was procured from Supelco (Darmstadt, Germany). Sodium carbonate was obtained from TCI (Tokyo, Japan). Mouse macrophage (RAW 264.7), human fibroblast BJ (ATCC® CRL-2522™) cell lines, Escherichia coli (E. coli) ATCC 25922, Staphylococcus aureus (S. aureus) ATCC 6538, and Cutibacterium acnes (C. acnes) ATCC 6919 were purchased from American Type Culture Collection (ATCC, Manassas, VA, USA). All cellular and bacterial experiments were performed in a biosafety level 2 laboratory.

2.2. Salak Peel Extraction Process and Characterizations

Salak plum peels were collected from Nong Lalok, Ban Khai District, Rayong, Thailand (12.799819, 101.230734). They were identified by Assoc. Prof. Dr. Chaisak Chansriniyom, Department of Pharmacognosy and Pharmaceutical Botany, Faculty of Pharmaceutical Sciences, Chulalongkorn University. The herbarium specimen (CC-SZ-022023) was kept at Department of Pharmacognosy and Pharmaceutical Botany, Chulalongkorn University. Salak peel was air dried and ground into powder. The powder (200 g) was extracted with 95% ethanol (1000 mL) by stirring at 500 rpm for 24 h (Heidolph magnetic stirrer, Schwabach, Germany). The process was conducted under three conditions which were 0 °C, 25 °C (room temperature), and 50 °C (Figure S1). The extract was then filtrated through Whatman paper No. 1 and evaporated under reduced pressure using rotary vacuum evaporator. The residue extract was treated by suction under high pressure with a vacuum pump in order to remove the residual solvent to yield the crude extract. Quantitative analysis was carried out using high-performance liquid chromatography equipped with a diode array detector (HPLC-DAD) (Agilent technologies, Santa Clara, CA, USA), where the area under the peak for each of the compounds was measured. These values were then compared with the standard curve of known concentrations of the pure compounds for determination. The detail of the apparatus and the method used can be found in the Supplementary Materials section.

2.3. Chemical Analysis of Salak Peel Extract

2.3.1. Antiradical Capacity

The antiradical capacity of salak peel extract was investigated using the DPPH and ABTS assays. L-ascorbic acid was used as positive control for both assays. Ethanol and deionized water were used as negative controls for DPPH and ABTS assay, respectively [19]. The samples (100 μL) with concentrations ranging from 0.002 to 1.000 mg/mL were mixed with DPPH or ABTS solution (100 mM, 100 μL) in a 96-well plate and incubated in the dark at 25 °C for 30 min. The absorbance of the mixture was then measured at 517 and 743 nm for DPPH and ABTS assays, respectively, using a spectrophotometer (Biotek, PowerWave XS, Winooski, VT, USA). The antiradical capacity was expressed as % inhibition of the sample at a given concentration and was calculated using Equation (1). The antiradical capacity of salak peel extract after the encapsulation process was also tested using a similar method.
% I n h i b i t i o n = A c o n t r o l A s a m p l e A c o n t r o l × 100
where Acontrol and Asample represent the absorbance of the control and the sample, respectively. The concentration of the sample that could inhibit the DPPH or ABTS scavenging radical at 50% (IC50) was estimated using the Quest Graph™ IC50 Calculator [20].

2.3.2. Anti-Tyrosinase Activity Assay

The anti-tyrosinase activity of salak peel extract was studied using L-DOPA scavenging assay with some modification [21]. L-DOPA (4.5 mM, 100 μL) and phosphate-buffered saline (PBS, pH 6.8, 25 mM, 100 μL) were mixed together in a 96-well plate, and 100 μL samples (with concentrations ranging from 0.002 to 1.000 mg/mL) were added to each well. The plate was incubated in the dark at 25 °C while shaking at 300 rpm for 10 min using Thermomixer (Thermomixer comfort, Eppendorf, Hamburg, Germany). The tyrosinase enzyme (4000 unit/mL, 10 μL) was added into each well and subsequently incubated at 25 °C for 20 min before measuring the absorbance at 475 nm. Kojic acid and PBS were used as positive and negative controls, respectively. The experiment was performed at least in triplicate. The anti-tyrosinase activity and the IC50 were calculated in a way similar to that described in the antiradical capacity section. The anti-tyrosinase activity of salak peel extract after the encapsulation process was also tested using a similar method.

2.4. Biological Activities of Salak Peel Extract

2.4.1. Cytotoxicity Assay

RAW 264.7 was resuspended in DMEM containing 10% fetal bovine serum, 1% L-glutamine, and 1% penicillin/streptomycin and seeded at a concentration of 10,000 cells/well. After 24 h of incubation at 37 °C, the cells were treated with salak peel extract with a concentration of 2.5–160 μg/mL for 24 h. Cell viability was evaluated using the PrestoBlue™ reagent (Invitrogen, Carlsbad, CA, USA), according to the manufacturer’s protocol. The sample without any treatment and the cells treated with 2.5% dimethyl sulfoxide (DMSO) were used as negative (100% cell viability) and positive controls, respectively. The half-maximal inhibitory concentration (IC50) value was calculated using the same software as in the antiradical section. The cytotoxicity assay of salak peel extract after the encapsulation process was also tested using a similar method.

2.4.2. Anti-Inflammatory Assay

RAW 264.7 cells with a concentration of 100,000 cells/well were seeded in a 96-well plate and incubated at 37 °C for 24 h. Salak peel extract with a concentration of 2.5–160 μg/mL was incubated with the cells for 2 h before adding lipopolysaccharide (LPS) from Escherichia coli O55:B5 (Sigma-Aldrich) at a final concentration of 1 µg/mL into the wells. After 16 h of incubation, cell supernatants were transferred to another 96-well plate, and nitric oxide (NO) production was measured using the modified Griess reagent (Sigma-Aldrich), according to the manufacturer’s protocol. The amount of nitrite was calculated from a sodium nitrite calibration curve. The inhibition percentage of NO production was calculated according to Equation (2). Diclofenac was used as a positive control.
% I n h i b i t i o n = A B A C × 100
where A, B, and C are nitrite concentrations (µM), and A: LPS (+), sample (−); B: LPS (+), sample (+); C: LPS (−), sample (−).

2.4.3. Anti-Bacterial Activity Assay

Broth microdilution assay was performed to determine the Minimum Inhibitory Concentration (MIC) and Minimum Bactericidal Concentration (MBC) of salak peel extract. Three different bacteria, Escherichia coli (E. coli) ATCC 25922, Staphylococcus aureus (S. aureus) ATCC 6538, and Cutibacterium acnes (C. acnes) ATCC 6919, were selected to represent the Gram-negative, Gram-positive, and acne causative agent, respectively. The details of the culturing condition of each bacterium are listed in Table 1. Starting from 100 mg/mL, samples were 2-fold serially diluted in a 96-well plate, and the bacterial suspension was added to obtain the final concentration of 106 CFU (colony-forming unit/mL). The plate was incubated at 37 °C under appropriate conditions. At a predetermined time, the MIC values were determined from the minimum concentration that produced transparent cultures. Then, 10 µL of each mixture was streaked onto appropriate agar. At a predetermined incubation time, the MBC values were determined from the minimum concentration showing no bacterial colony growth on the agar plate.

2.4.4. Biocompatibility Assay

Human fibroblast cells (ATCC® CRL-2522™) were seeded at 2000 cells/well in black clear-bottom 96-well plates and incubated at 37 °C for 24 h. The samples, resuspended and diluted in DMEM complete medium, were added to the cells and incubated at 37 °C for 7 days without changing the medium. Cell proliferation and membrane integrity of the treated cells were measured on days 1 and 7 using CellTiter-Glo® Luminescent Cell Viability Assay (Promega, Madison, WI, USA) and Image-iT DEAD Green Viability Stain (Invitrogen, USA), respectively. In brief, at a predetermined time, CellTiter-Glo® reagent was added to the samples and incubated at 37 °C for 10 min before measuring the luminescence signals using a microplate reader (Cytation 5, Biotek). The percentage of cell proliferation of the treated cells was calculated and compared to the non-treated cells. For membrane integrity assay, the Image-IT dye was added to the samples before incubating them at 37 °C for 30 min. The cells were fixed with 4% paraformaldehyde in PBS at room temperature (25 °C) for 15 min. Finally, the fluorescence intensity was measured using excitation/emission at 488/515 nm. The membrane permeability of the treated cells was calculated and compared to the non-treated cells and reported as normalized fluorescence intensity.

2.5. Encapsulation of Salak Peel Extract

Salak peel ethosomes were prepared using the solvent evaporation method, and the details of different formulations investigated are shown in Table 2. In brief, L-α-phosphatidylcholine and salak peel extract were solubilized in ethanol and 3:1 ethanol/type I water to obtain concentrations of 60 and 30 mg/mL, respectively. Salak peel extract (1 mL) was added to 3.25 mL type I water while stirring vigorously at 1000 rpm (MR HEI-TEC 0145, Heidolph). The solution of 3:1 ethanol/type I water (1 mL) was added to type I water in the sample without salak peel extract. L-α-phosphatidylcholine was diluted with ethanol to obtain a predetermined amount used in the formulations, and 2 mL of the solution was added slowly to the water/extract mixture drop by drop using a No. 18 needle. The mixture was kept stirring at 1000 rpm for 30 min (MR HEI-TEC 0145, Heidolph), followed by 600 rpm (IKA RT-10, Staufen, Germany), in a fume hood to evaporate the excess ethanol. The entire stirring process was performed at 25 °C. After 16–17 h of stirring, the suspension was centrifuged at 4 °C at 8000 rpm for 10 min to discard the visible precipitation (MDX-310 High Speed Refrigerated Micro Centrifuge, Tokyo, Japan). The supernatant was then transferred to a 12–14 kDa dialysis bag to separate out the excess ethanol and unencapsulated salak peel extract. The samples were kept at 4 °C for further use and characterizations.

2.6. Characterizations of Salak Peel Ethosomes

Many methods were used for ethosome characterizations. For physical characterization, the hydrodynamic diameter, PDI, and the zeta potential of the ethosomes were measured using the Zetasizer Nano ZS particle analyzer (Zetasizer Nanoseries, NANO-ZS model S4700, Worcestershire, UK). All samples were diluted 5-fold before the characterization process, and the measurements were conducted at 25 °C. The morphology of the ethosomes (60E, 60S, 120E, and 120S) was also investigated using a Transmission Electron Microscope (TEM, Hitachi HT7700, Hitachinaka, Ibaraki, Japan). All the samples were dropped onto the grid and left for nanoparticle adherence for 20 min, and the excess samples removed. Then, 2% uranyl acetate was dropped onto the grid to stain the ethosomes for 1 min, and the excess dye was removed. After that, the samples were subjected to TEM at 80 kV.
For other characterizations, Fourier-Transform Infrared Spectroscopy, ATR mode (Thermo Nicolet iS50 FTIR Thermo Fisher Scientific, Waltham, MA, USA) and Differential Scanning Calorimetry (Netzsch 214 Polyma, Selb, Germany) were employed. For FTIR, the scan was carried out from 400 to 4000 cm−1 in the absorption mode with a resolution of 4 cm−1. The measurement was repeated 64 times/sample. For DSC, each sample weighing around 1.5 mg was loaded into a standard DSC pan. Nitrogen with a flow rate of 40 mL/min was employed as the purge gas. Each heating cycle ramped the temperature up from 20 to 250 °C at a heating rate of 10 °C/min. Both FTIR and DSC samples were evaluated using the software accompanying the instruments. All the samples used for both processes were lyophilized before measurement. In addition to ethosomes and salak peel ethosomes, L-α-phosphatidylcholine, salak peel extract, and a physical mix between L-α-phosphatidylcholine and the extract in a 1:1 ratio by weight were also investigated for comparison.

2.7. Encapsulation Efficiency of Salak Peel Ethosomes

The encapsulation efficiency of salak peel ethosomes was calculated by comparing the total phenolic content in the salak peel ethosomes and that in the extract initially added to the formulation. The Folin–Ciocalteu assay was employed, using the reducing power of phenolic compounds to change the reagent color from yellow to blue. In brief, the shell part of the salak peel ethosomes was separated out from the samples using triton X-100 (final concentration: 0.1% v/v) and filtered through a 0.2 μm syringe. The samples were then diluted with type I water to ensure that the total phenolic content of the sample fell within the limit of the detection range of the assay. In a 96-well plate, 20 μL of sample was mixed with 100 μL of 10% v/v Folin–Ciocalteu reagent and incubated at 25 °C for 6 min in the dark. Then, 80 μL of 7% w/v sodium carbonate was added to the mixture and incubated at 25 °C for 30 min in the dark. The signal was measured at 760 nm. The encapsulation efficiency percentage of the salak peel ethosomes was calculated using Equation (3). Various concentrations of gallic acid were also used to construct the standard curve.
%   E n c a p s u l a t i o n   e f f i c i e n c y = A m o u n t   o f   t o t a l   p h e n o l i c   c o n t e n t   i n   s a l a k   p e e l   e t h o s o m e s A m o u n t   o f   t o t a l   p h e n o l i c   c o n t e n t   i n   t h e   i n i t i a l   e x t r a c t   a d d e d × 100  

2.8. Stability Study

Stability testing was performed by storing ethosomes at different temperatures (i.e., 4 and 45 °C) for 1 month [2]. The ability of the ethosomes to withstand temperature fluctuations was also tested via a freeze–thaw (FT) cycle. To elaborate, the ethosomes were stored at 45 °C for 24 h and 4 °C for 24 h. The process was repeated for 6 cycles. The changes in hydrodynamic size, PDI, and zeta potential of the sample at a certain temperature were evaluated using the Zetasizer Nano ZS particle analyzer (Zetasizer Nanoseries, NANO-ZS model S4700, Worcestershire, UK). The change in the encapsulation efficiency after the storage was also evaluated using the Folin–Ciocalteu assay.

2.9. Statistical Analysis

Student’s t-tests were performed for the biocompatibility assay, comparing the treated and the untreated cells. The change in the ethosome characteristics (with and without the encapsulation of salak peel extract) after storage was assessed for significance using Minitab® 19.2020.1 (64-bit) (two-sided one-way ANOVA, Dunnette multiple comparison at 95% confidence interval). All experiments conducted were repeated at least three times (n = 3), and the error bars represented the standard deviation.

3. Results and Discussion

3.1. Salak Peel Extraction and Characterizations

Polyphenols are mainly accountable for the biological activities of plant extracts; hence, it is desirable to use extraction conditions that maximize the amount of these substances in the extract. In this study, salak peel was extracted with 95% ethanol at three different temperatures, 0, 25, and 50 °C, to investigate the effect of temperature on the extraction yield and total phenolic content. The effect of ethanol concentration was not covered here as it has already been reported that a high concentration of ethanol usually results in high total phenolic content in the extract [2,3,5]. The result showed the yield of the extract to be dependent on the temperature used. Thus, when the extraction process was performed at 0, 25, and 50 °C, the yield of the extract was 0.54, 2.34, and 3.00%, respectively. Using chlorogenic acid as the marker for the total phenolic content, the results also showed it to be the highest when the extract was performed at 50 °C. In other words, the yield of the extract and the total phenolic content increased as the temperature rose [2,22,23]. Hence, salak peel extracted at 50 °C was selected for further study. It is worth mentioning that, despite the observed increase in the yield and total phenolic content, an extraction temperature beyond 50 °C was not investigated due to the solvent boiling point. Figure 1 and Table 3 also showed that salak peel extract also consisted of other types of polyphenols, but as chlorogenic acid was the most abundant among them, it was used as the marker for salak peel extract characterization. It is worth noting that the yield and the amount of chlorogenic acid and other phenolic compounds presented here were highly dependent on the type and amount of phytochemicals present in the raw materials. Hence, using the same method in the extraction process might not yield the exact same amount as the polyphenols reported here.

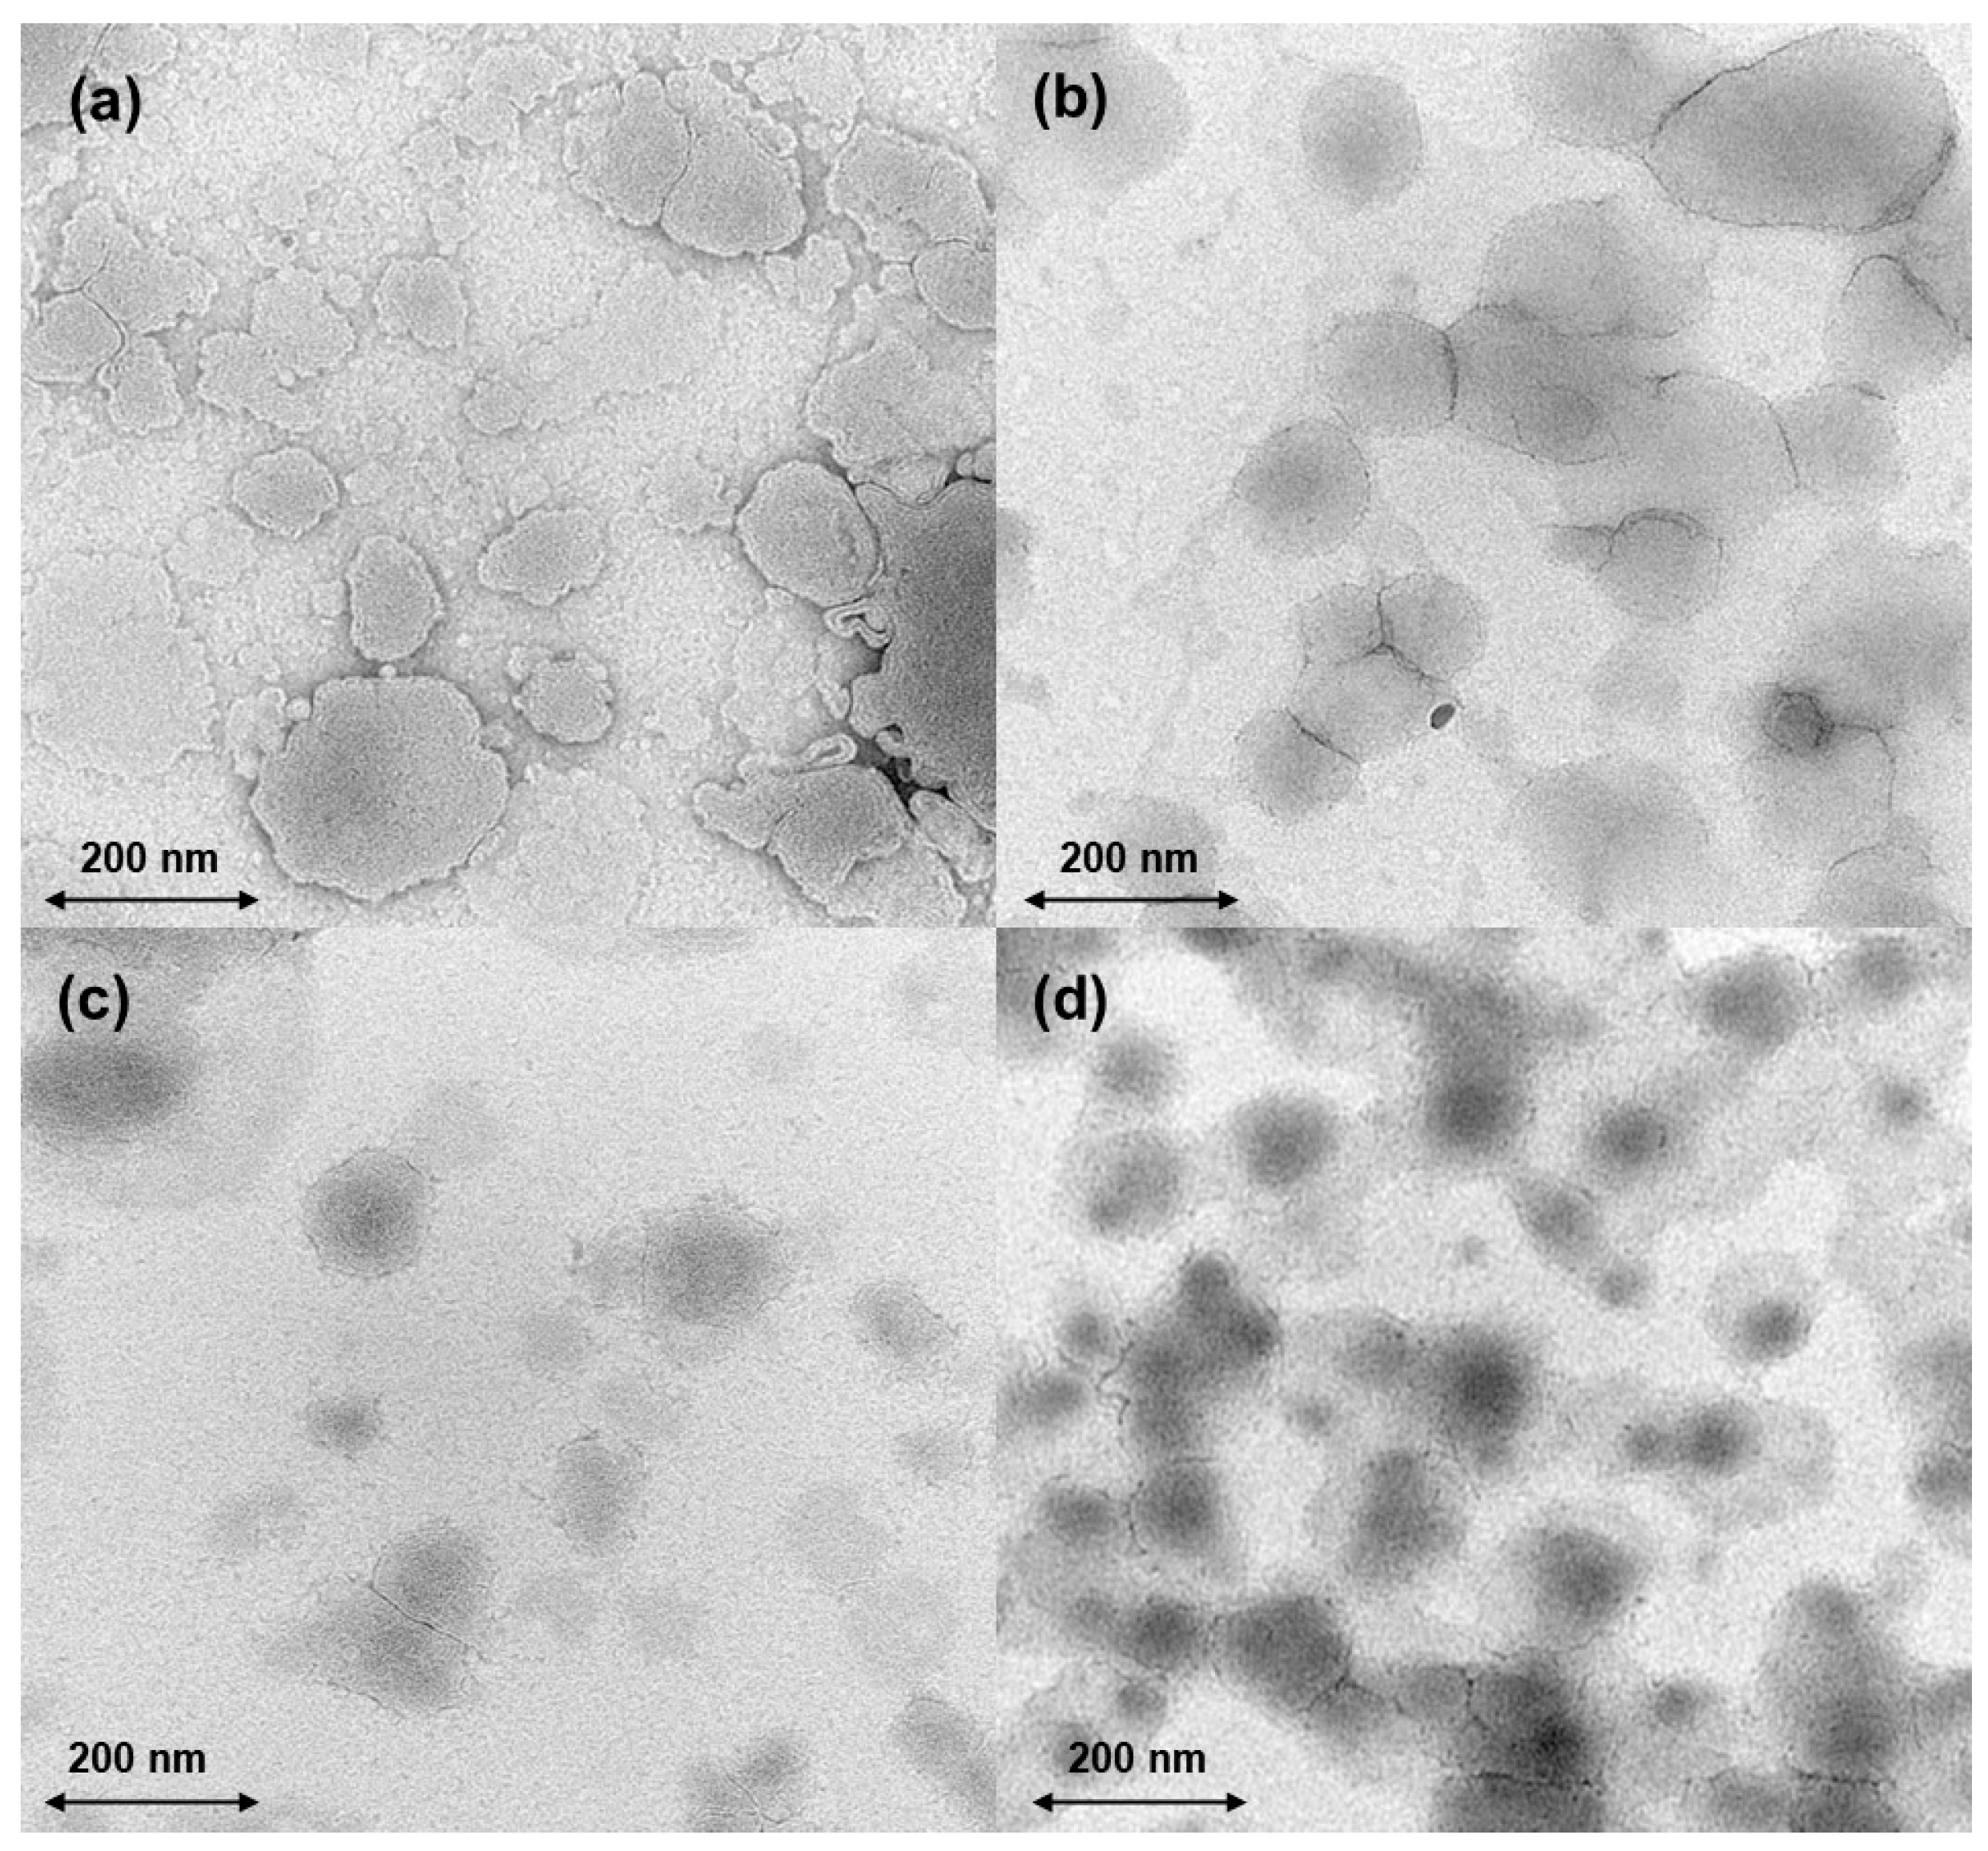
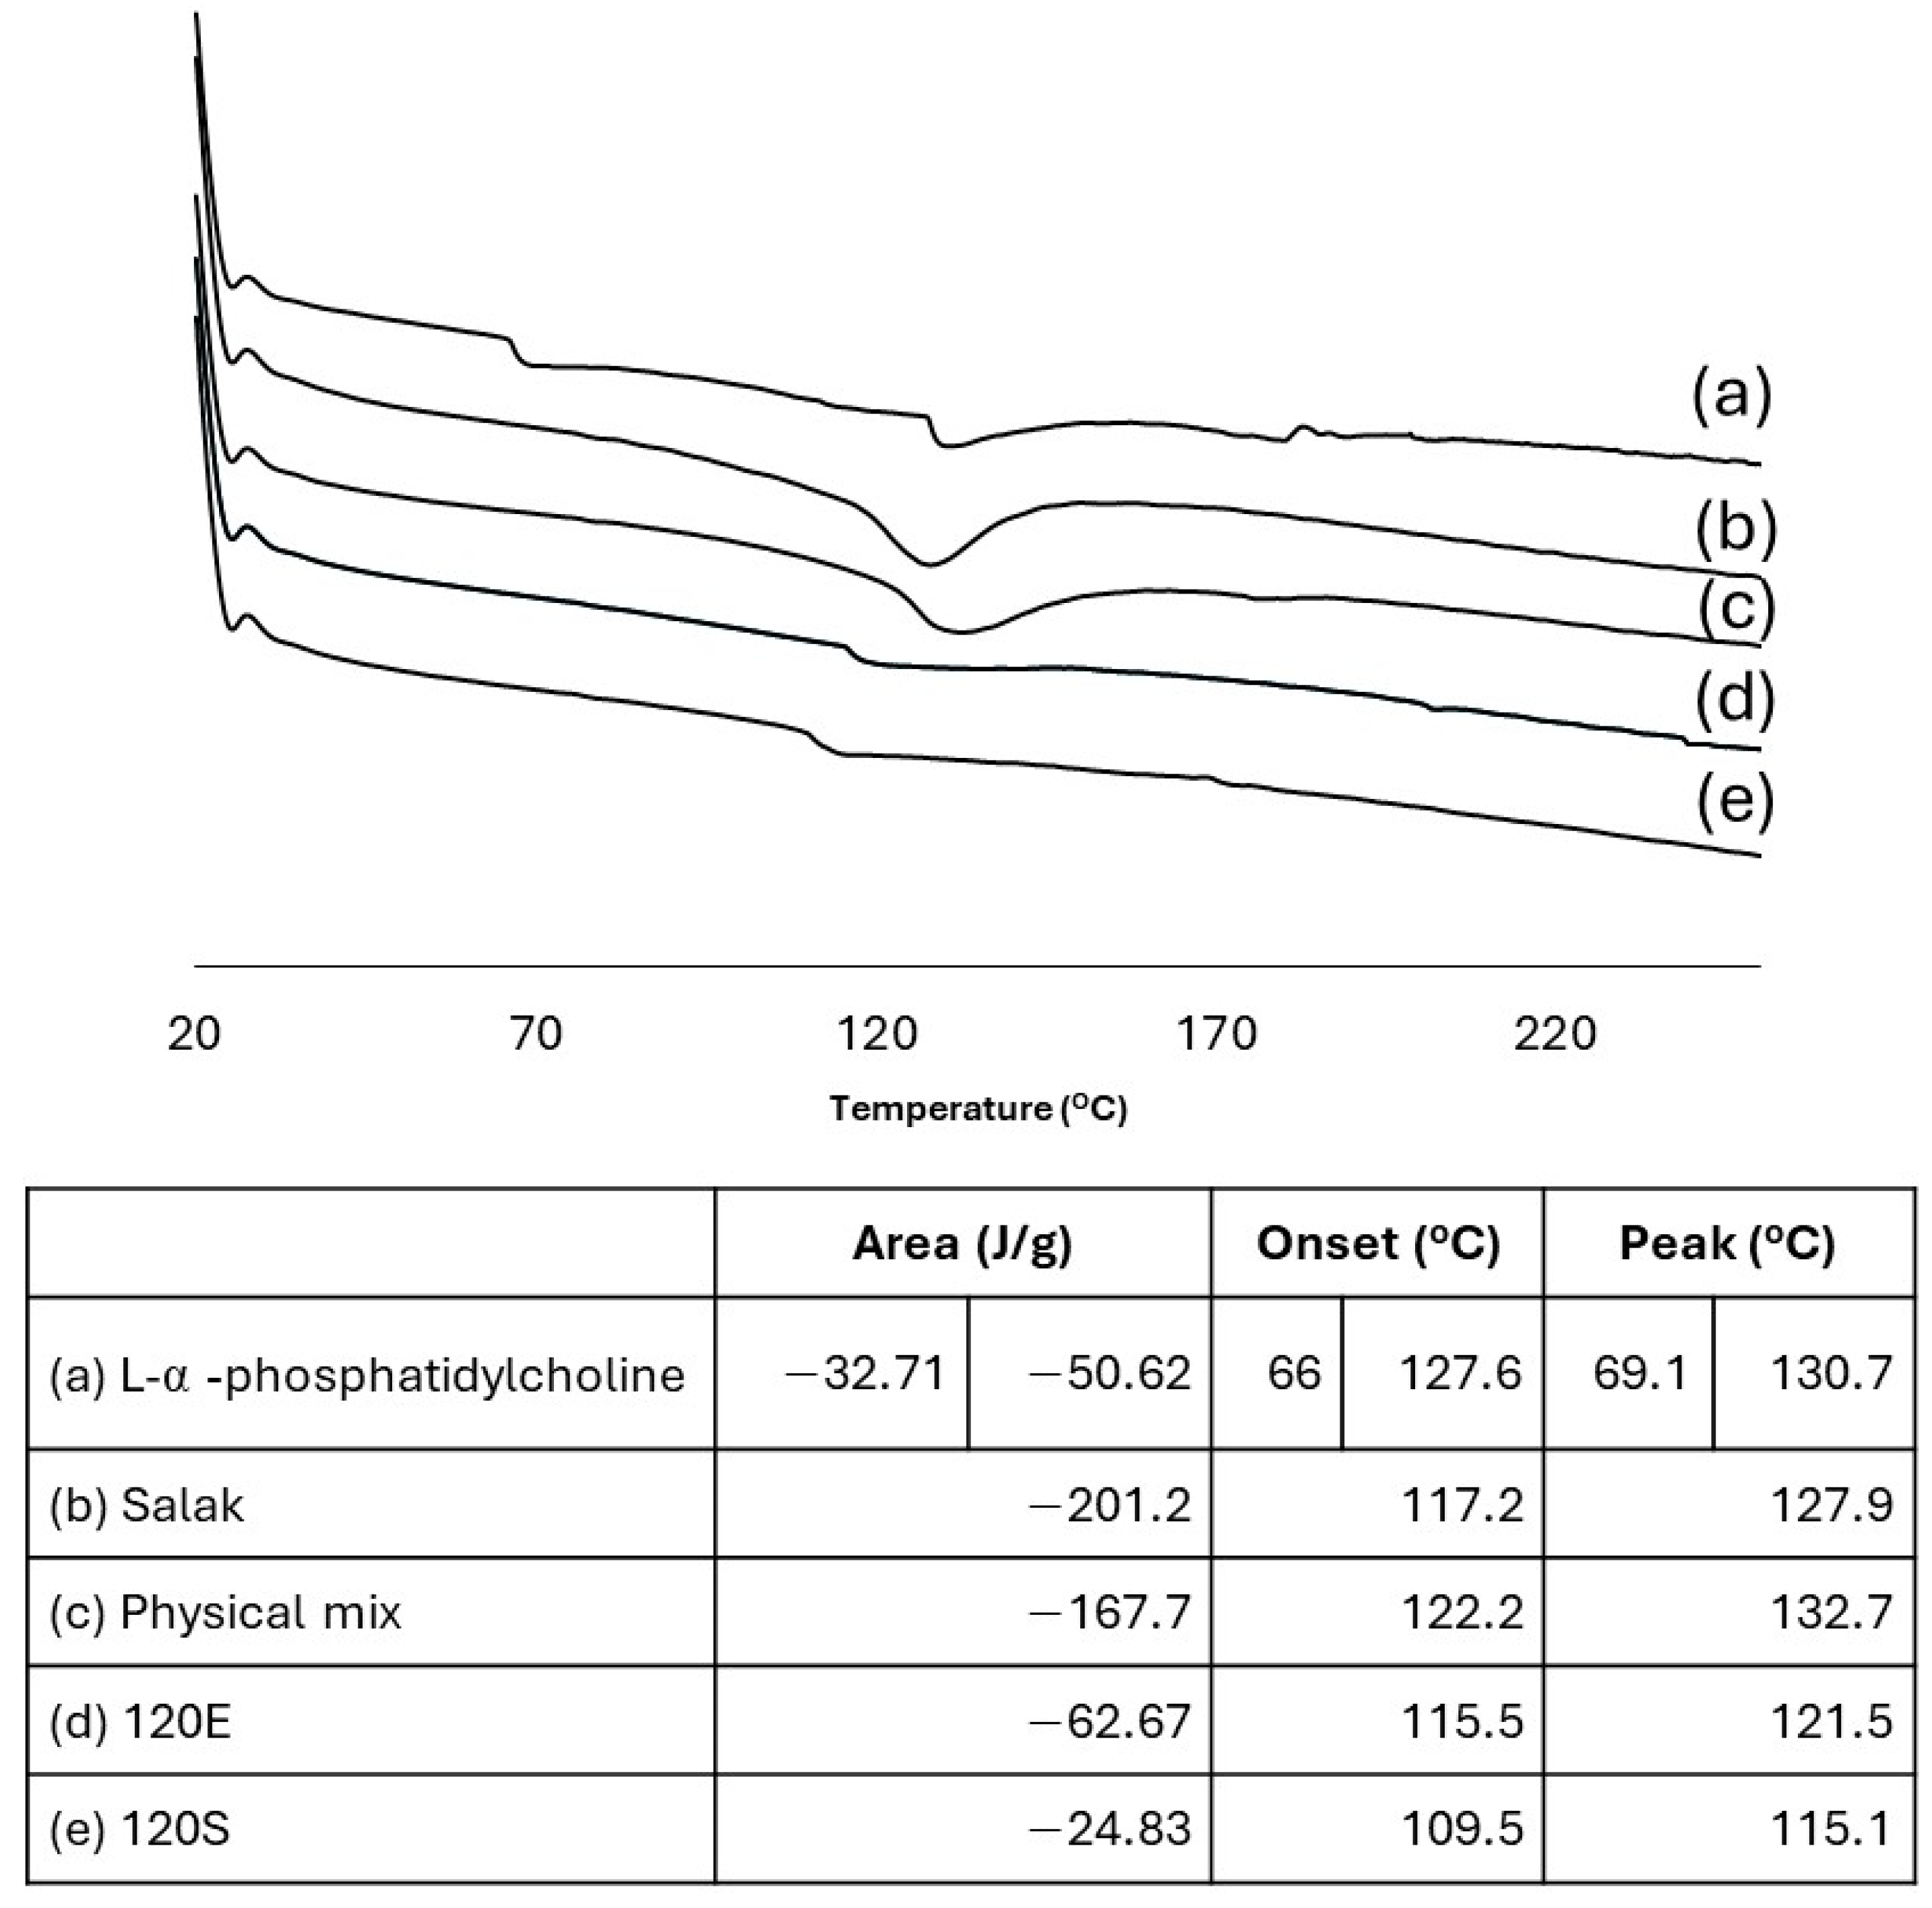
3.2. Salak Peel Ethosome Preparation and Characterizations

In this experiment, we demonstrated the possibility of preparing ethosomes with a simple low-energy method using only green solvents (i.e., ethanol and water). By using L-α-phosphatidylcholine in the range of 30–120 mg/formulation, the yielded ethosomes had a hydrodynamic size lesser than 200 nm with a uniform distribution (PDI < 0.3) (Table 4). They also had high absolute zeta potential (>25 mV), suggesting they are stable. All of the formulations investigated had a similar zeta potential with a slight decrease as the amount of L-α-phosphatidylcholine used decreased. This was potentially due to the similar amount of ethanol used in the initial formulations [24]. These results suggest the method is useful for preparing ethosomes capable of encapsulating any substances provided that they are soluble in either water or ethanol. The amount of L-α-phosphatidylcholine used in ethosome formation through the method presented can be below 30 mg. However, there could be variations in the hydrodynamic size, PDI, and precipitation as shown in Table S1.
The ethosomes prepared were used to encapsulate salak peel extract with the aim of facilitating their use in cosmeceutical applications. The results (Table 4) showed an elevation in encapsulation efficiency as the amount of L-α-phosphatidylcholine used increased. The maximum encapsulation efficiency was obtained when the amount of L-α-phosphatidylcholine was 120 mg, and it was 30.6 ± 8% [15]. Despite the observed trend, the use of a higher amount of L-α-phosphatidylcholine was not investigated due to the limitation of the material’s solubility in ethanol. For other characteristics, encapsulating salak peel extract in ethosomes increased their hydrodynamic size despite removing the precipitation seen after centrifugation at 8000 rpm. This enlargement of salak peel ethosomes was also dependent on the amount of L-α-phosphatidylcholine used in the formulation. It is worth noting that the hydrodynamic size of the ethosomes, both before and after the encapsulation, was still in the range of 100–300 nm. This suggests their suitability for cosmeceutical applications, as nanoparticles in this hydrodynamic size range would remain in the upper layers of the skin [25,26,27]. The PDI after the encapsulation process was less than 0.25, suggesting the monodispersity of the particle population. All of the PDI values found in this work were lower than those previously reported when salak peel extract was encapsulated in liposomes [2]. The absolute zeta potential of ethosomes decreased after the encapsulation process, suggesting some interaction between part of salak peel extract with the polar head group of L-α-phosphatidylcholine. More studies would be needed to confirm this. However, the absolute zeta potential of the ethosomes was still >ǀ±25 mVǀ, indicating that the ethosomes maintain good stability after the encapsulation process [28]. It is worth mentioning that the absolute zeta potential reported in this work was significantly higher than when salak peel extract was loaded into liposomes (−8 to −19 mV), possibly due to the addition of ethanol in the structure [2,29]. The pH of the formulation before and after the encapsulation of salak peel extract was in the range of 4–6, showing its suitability to be used in cosmeceutical applications [30]. It is worth mentioning that the amount of L-α-phosphatidylcholine used for the formation of salak peel ethosomes below 30 mg might not be suitable as there could be high variation in both hydrodynamic size and PDI. In addition, precipitation can also be seen at 7.5S after storing the salak peel ethosomes at 4 °C overnight (Table S1 and Figure S2). These results suggest that only formulations with L-α-phosphatidylcholine 60 mg can be employed for further studies as the encapsulation efficiency is more than 10%. The morphologies of the ethosomes with and without the encapsulation of salak peel extract were also investigated using TEM. The results (Figure 2) showed all the ethosomes in all formulations to be spherical. Similarly to other active ingredients, salak peel extract could affect the ethosome’s characteristics. Hence, using salak peel from different sources might yield different quantitative results from the presented work due to the difference in the amount and type of substances in the extract. However, the work shown here presents the possibility to use a green and simple method in the encapsulation of salak peel extract.

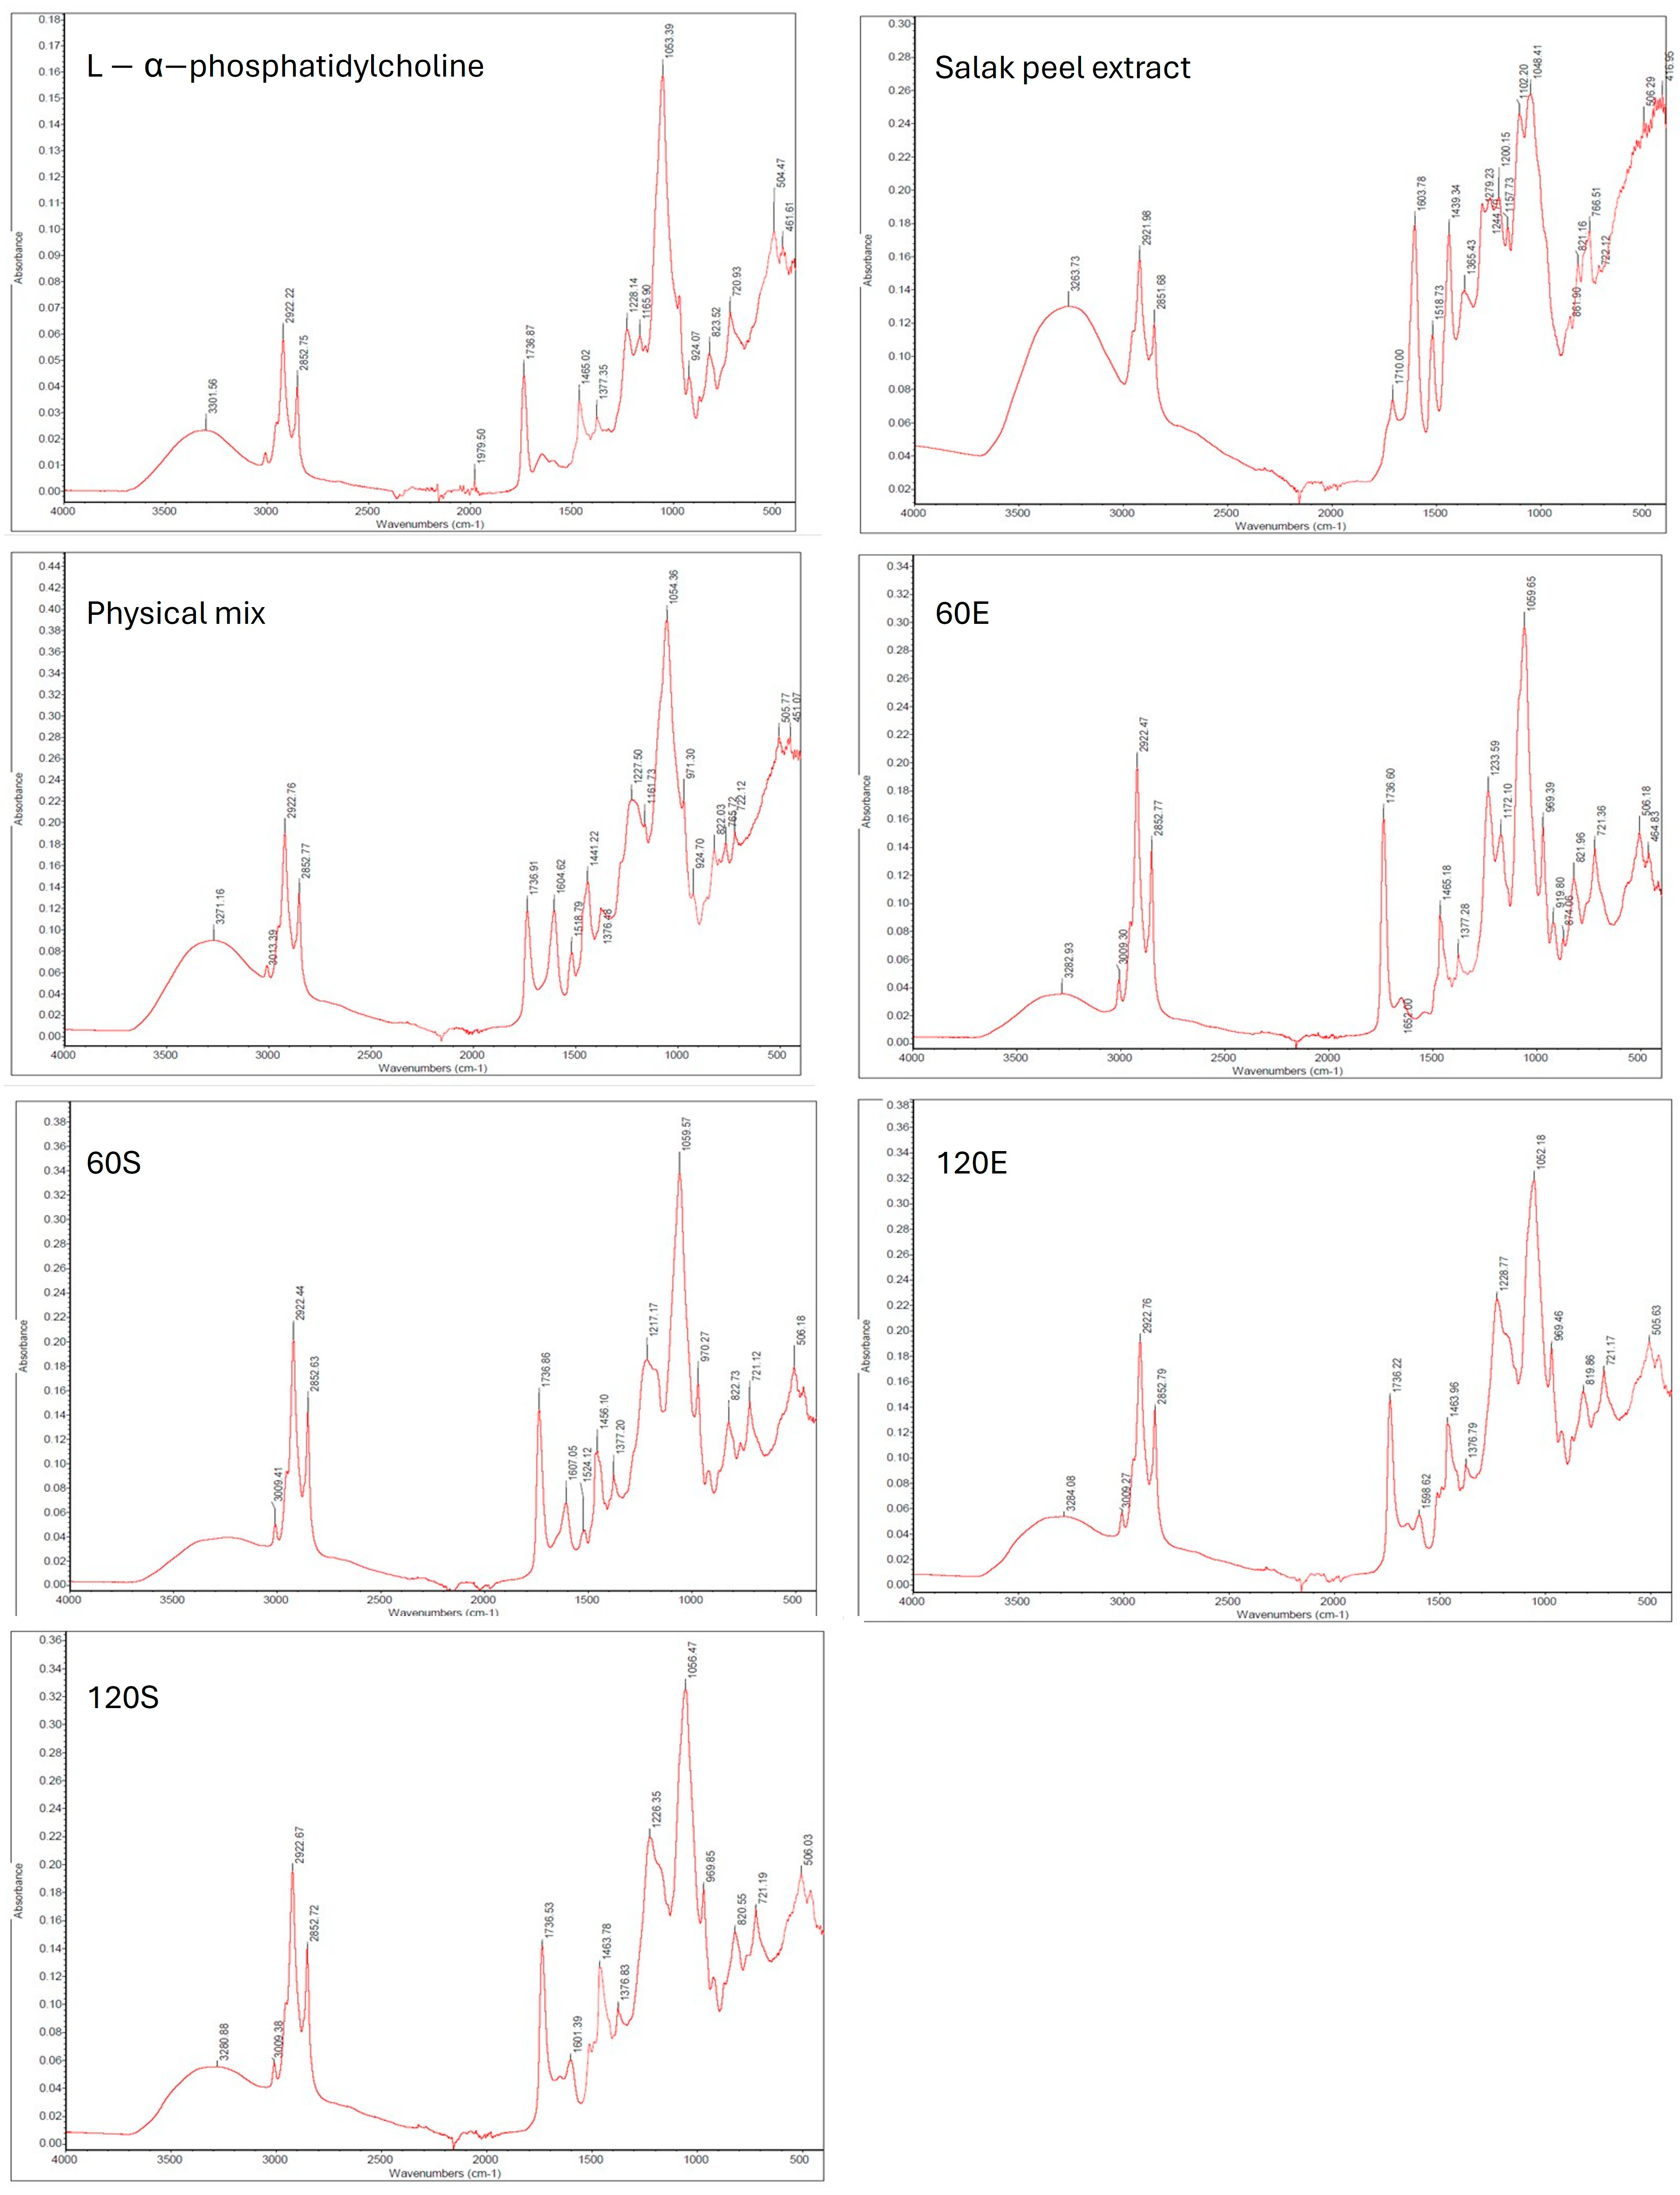
3.3. Other Characterizations of Ethosome-Encapsulated Salak Peel Extract

There have been studies reporting the interaction between the hydrophilic part of phospholipids and the polyphenol substances via hydrogen bonding in liposome derivatives known as ‘phytosomes’ [15,16]. In this work, we theorized similar interactions to occur as (1) both components were presented, (2) precipitation was rapidly formed when L-α-phosphatidylcholine and the extract were directly added together, and (3) there was a significant reduction in the absolute zeta potential once salak peel extract was added to the ethosomes (Table 4). To test this hypothesis, we used FTIR and DSC to explore the possibility of such interactions being present in salak peel ethosomes [16].
Figure 3 shows the FTIR results of L-α-phosphatidylcholine, salak peel extract, a physical mix of L-α-phosphatidylcholine and the extract in a ratio of 1:1, 60E, 60S, 120E, and 120S. Both the FTIR spectra of L-α-phosphatidylcholine and salak peel extract were similar to those previously reported [16,31]. To elaborate, the L-α-phosphatidylcholine spectrum appeared to have peaks at 1736, 1228, and 1053 cm−1, the three signature peaks of the lipid in the phosphatidylcholine group [16]. These peaks represent C=O, P=O, and C-N, respectively [32]. The 1736 and 1053 cm−1 peaks were found in other spectra with L-α-phosphatidylcholine with a slight shift (i.e., physical mix, 60E, 60S, 120E, and 120S). Interestingly, the peak representing P=O (i.e., 1228 cm−1) was absent only in 60S, suggesting some change in this functional group. For salak peel extract, in addition to the large peak around 3220-3540 cm−1, representing O-H, it also showed peaks at 1710, 1603, 1518, 1439, and 1102 cm−1. This indicated the presence of other functional groups’ antiradical capacity such as the ketonic group, carboxylic acid, and ascorbic acid [31,33]. It is worth noting that the peak positions reported in this work might be slightly different from those previously reported as they were sensitive to the solvent composition used in the extraction process [31]. The FTIR spectrum of the physical mixture between L-α-phosphatidylcholine and salak peel extract was the combination of the lipid and salak peel extract with most of the aforementioned peaks appearing in the spectrum (i.e., 1736, 1604, 1227, 1518, and 1441 cm−1). The FTIR spectra of both 60E and 120E were similar to that of L-α-phosphatidylcholine with a slight shift in the position of some peaks, possibly due to the interaction between the lipid and ethanol in the structure. Comparing to 60E and 120E, 60S and 120S had additional peaks around 1603 (1607 for 60S and 1601 for 120S) and 1518 (1518 for 60S and 1514 for 120S). These results suggest the presence of the extract in the ethosomes’ structure. However, these two peaks in 120S were not as prominent as the ones found in 60S, possibly due to the increase in the amount of L-α-phosphatidylcholine used in the formulations. In addition, the peak at 1217 cm−1 in 60S spectrum was not found in L-α-phosphatidylcholine, the salak peel extract spectrum, or their physical mixture. Hence, this might represent the new interaction that was formed between the extract and L-α-phosphatidylcholine. These results support the possibility of L-α-phosphatidylcholine and the extract interacting via chemical bonding.
Ethosome components and ethosomes with and without salak peel extract also showed different thermal behaviors. All samples investigated showed endothermic behavior; however, they differed in specific details depending on the compositions and the interactions presented in the sample (Figure 4). L-α-phosphatidylcholine thermogram showed two peaks with the onset of 66 and 127.6 °C [29]. The first peak was the pretransition peak that was sensitive to foreign molecules both qualitatively and quantitatively; hence, this peak was not found in other samples with L-α-phosphatidylcholine (i.e., physical mix, 120E, and 120S) [29,30]. The salak peel extract thermogram exhibited a broad peak. This was possibly due to the extract consisting of various substances [34]. The physical mix thermogram was shown to be similar to salak peel extract; however, the area (167 J/g) and onset (122.2 °C) of the thermogram were between those of L-α-phosphatidylcholine (50.62 J/g, 127.6 °C) and salak peel extract (201.2 J/g, 117.2 °C). The shifted broader and flatter peaks found in the 120E as compared to the L-α-phosphatidylcholine thermograms were potentially due to the insertion of ethanol in the lipid structure and the additional chemical interaction that occurred during the ethosome formation process [35]. Examples of these additional interactions include hydrogen bonding between the polar head group, water, and ethanol. The further shift in the 120S as compared to the 120E and L-α-phosphatidylcholine thermograms was possibly due to a similar reason but with the addition of the interaction between the extract and L-α-phosphatidylcholine [35]. Overall, the FTIR and DSC results suggest the presence of interactions between some parts of salak peel extract (i.e., polyphenols) with L-α-phosphatidylcholine. However, more investigations are needed for the ethosomes prepared in this work to be classified as ‘phytosomes’; hence, the word ‘ethosomes’ will still be used.

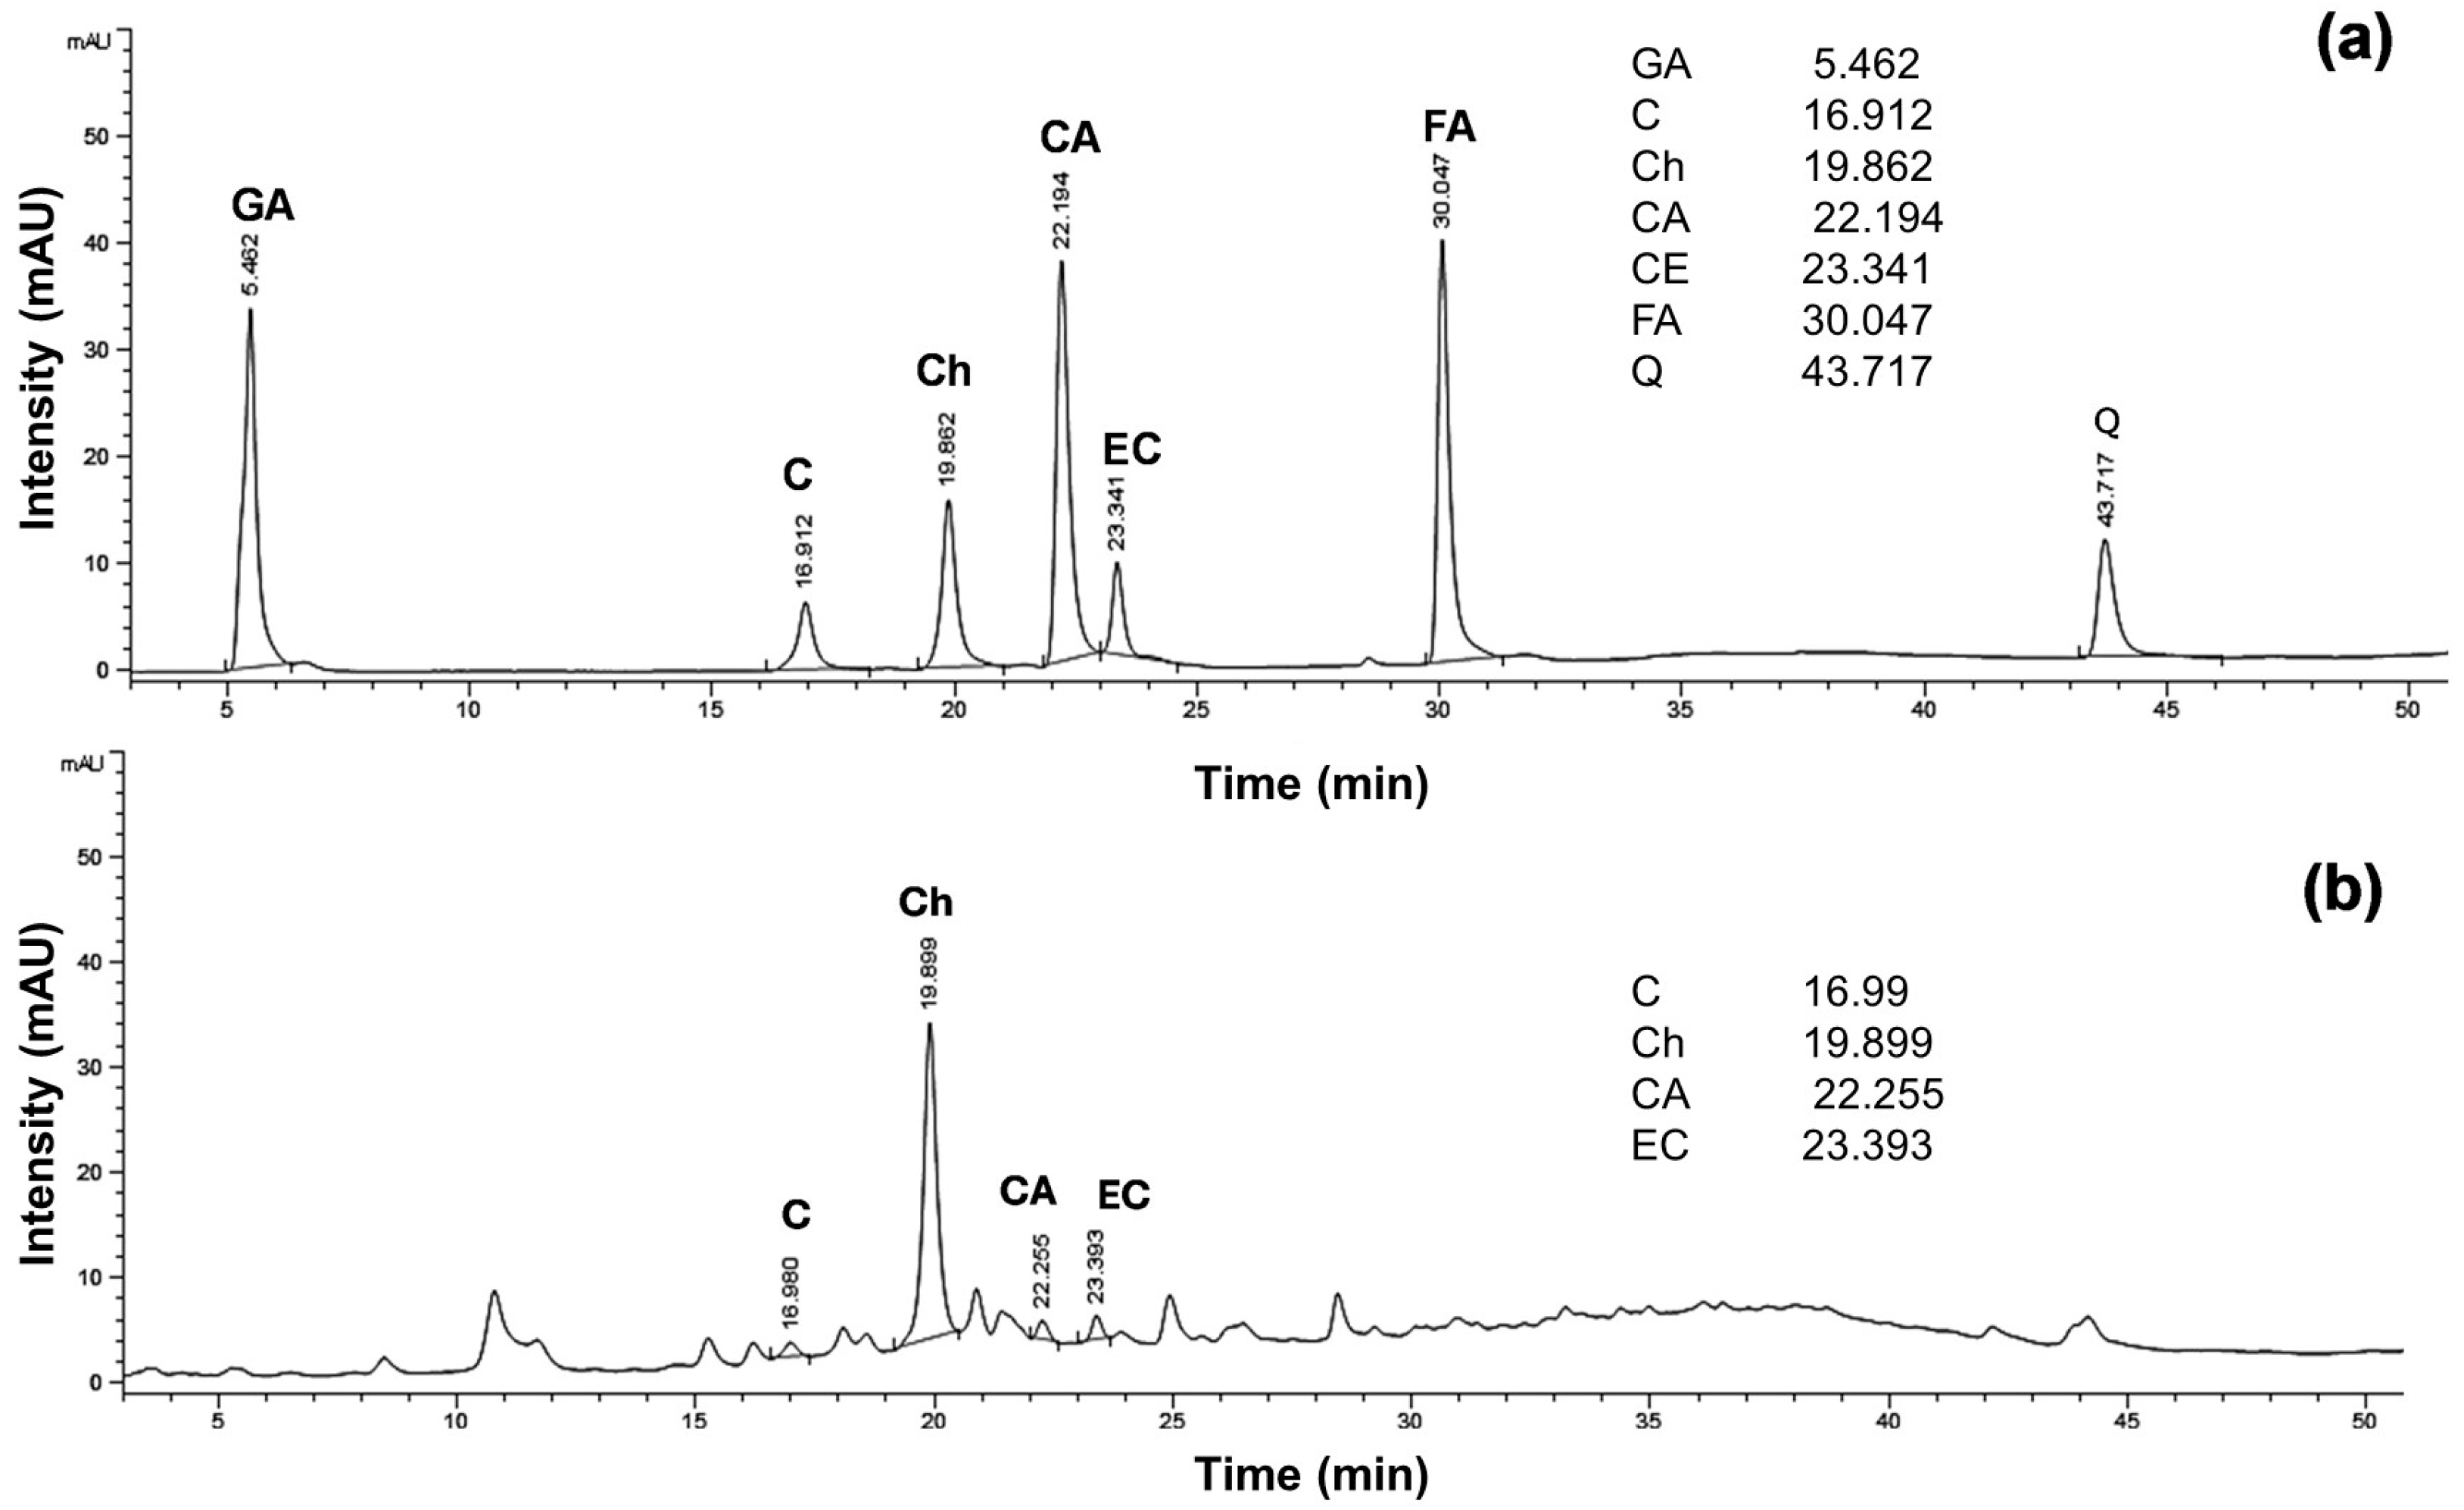
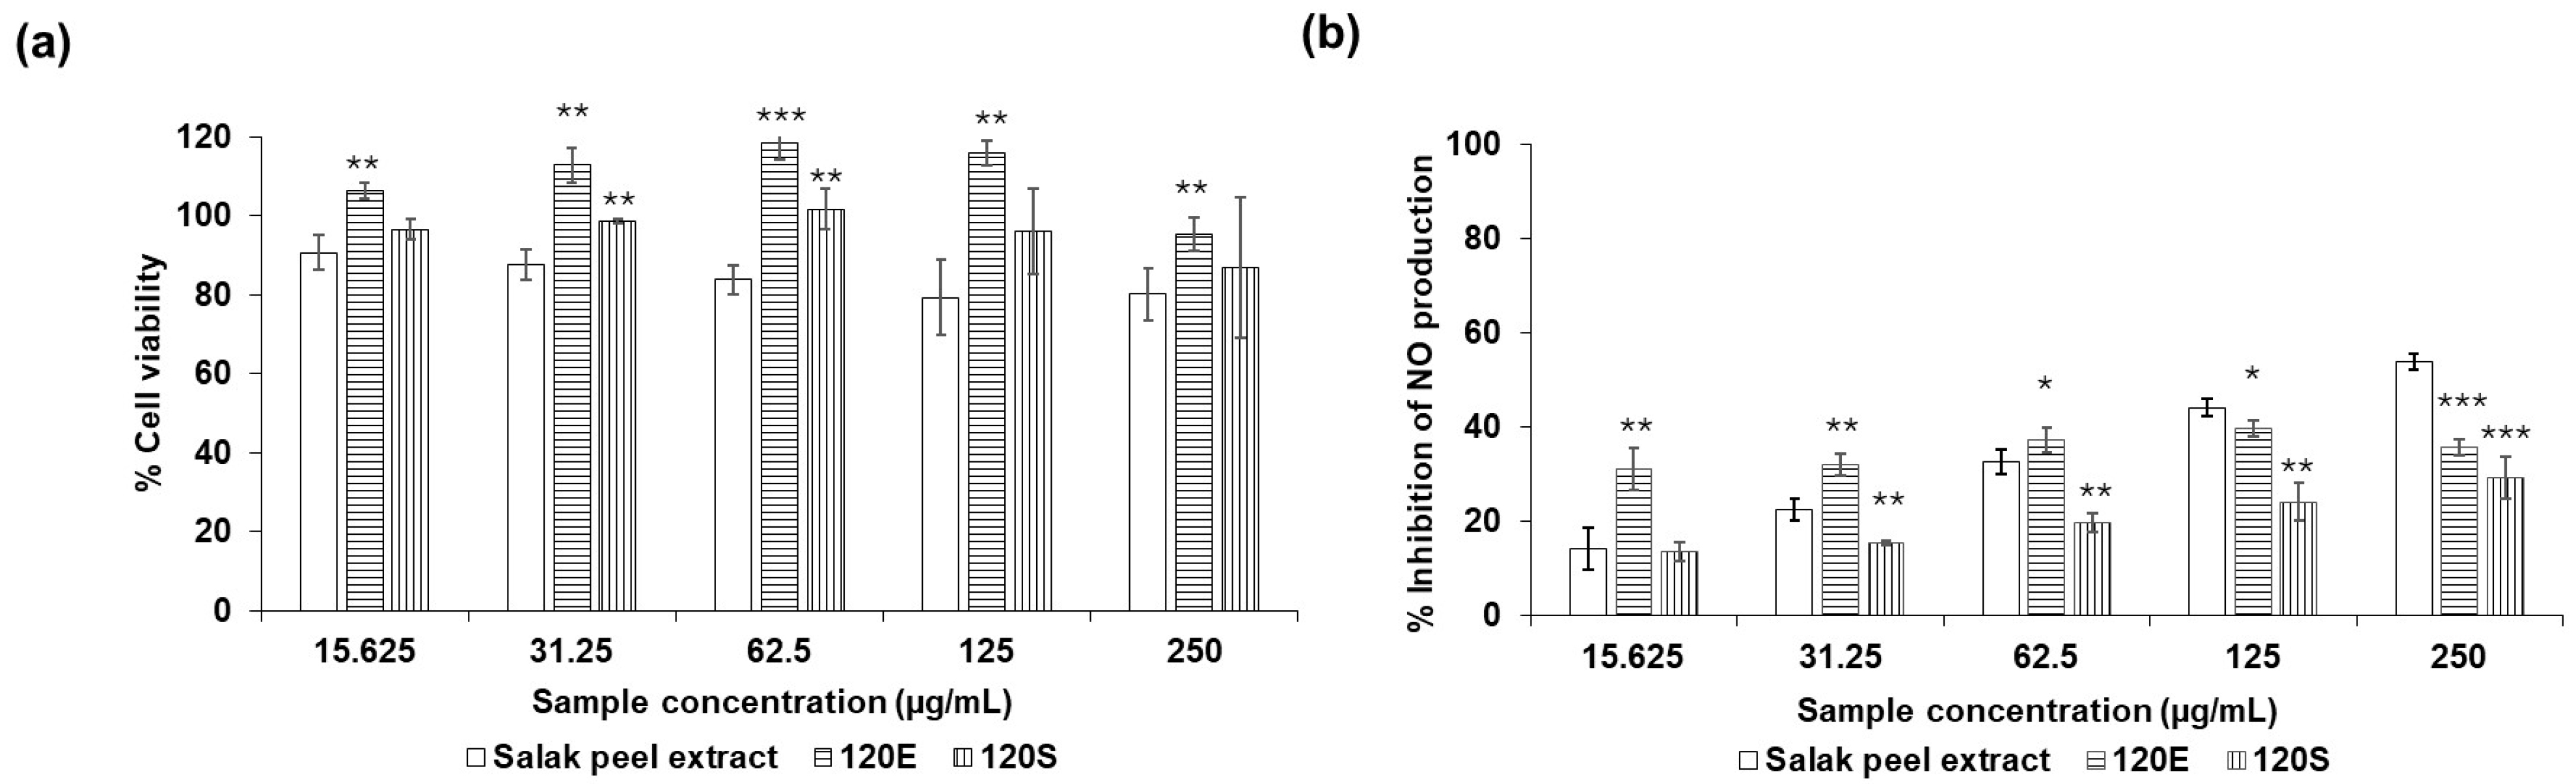
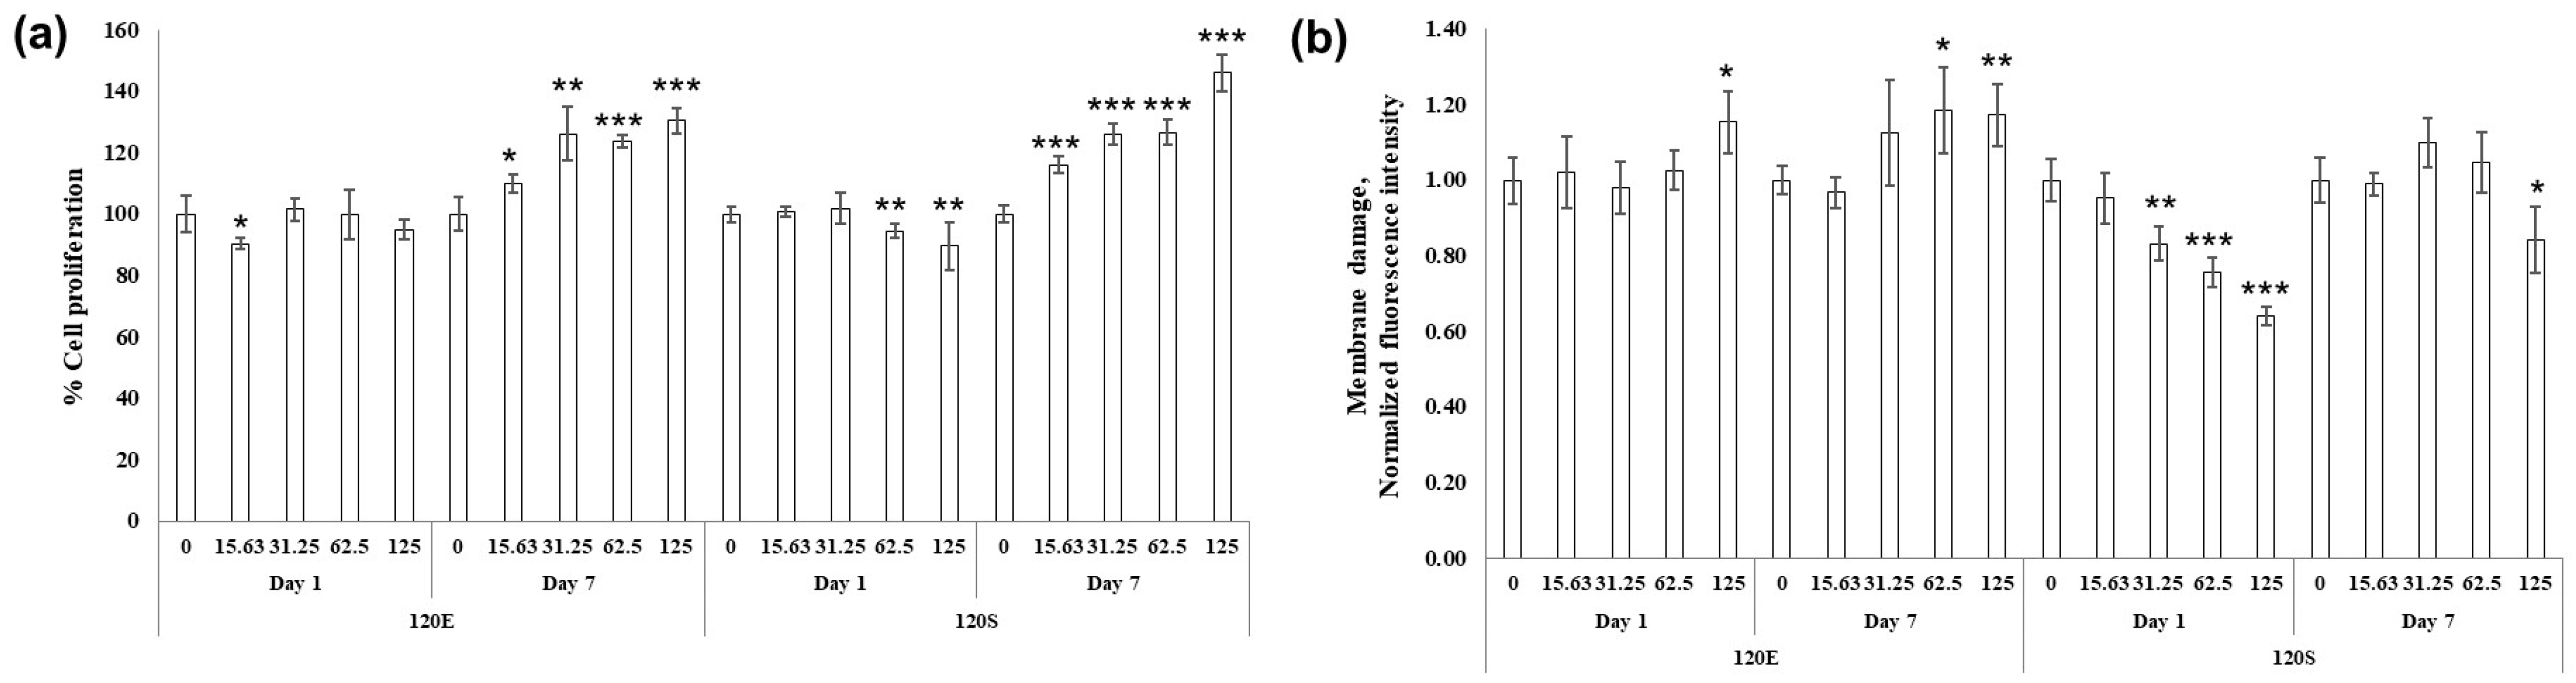
3.4. Chemical Analysis and Biological Activities of Salak Peel Extract and Salak Peel Ethosomes

The chemical and biological activities of plant extracts usually originate from their phenolic and flavonoid contents. Hence, their activities are highly dependent on the extraction process as it dictates the amount of these substances found in the extract [22,36,37]. Focusing on cosmeceutical applications, salak peel extract was reported to have antiradical, anti-tyrosinase, anti-inflammatory, and anti-bacterial activities [2,31,38,39,40]. To investigate whether the process performed in this study also yielded an extract with such abilities and the possible change in these abilities after the encapsulation process, many assays were performed. An in vitro biocompatibility study against fibroblast cells was also performed to ensure the safety of the extract, especially after the encapsulation process. It is of note that only 120S and 120E were tested for these activities. The first was selected for being the formulation with the highest encapsulation efficiency, and the latter was tested to investigate whether the ethosomes also contributed to the chemical and biological activities observed.
The colorimetric assays, i.e., the DPPH and ABTS assays, were employed to assess the antiradical capacity of salak peel extract. The results from the DPPH assay showed that the extract had a slightly higher antiradical capacity than that of the positive control (i.e., L-ascorbic acid) (Table 5). The anti-tyrosinase activity of salak peel extract was assessed using the Dopachrome method. The results (Table 5) revealed salak peel extract to have good anti-tyrosinase activity. These activities of salak peel extract were also tested after the encapsulation process. The results showed a decrease in both activities, potentially due to the ethosome shell shielding the majority of the extract inside. The IC50 value of salak peel ethosomes (120S) obtained from the DPPH assay was lower than that determined using the ABTS assay. This may be attributed to the inherent hydrophobic nature of the extract and shell components, which exhibits greater solubility in ethanol compared to water. Despite this, the encapsulation process provides the extract with an increase in water solubility (Figure S3), making it easier to be incorporated into cosmeceutical formulations. It also increases the stability of the extract, described in more detail in the stability section.
Salak peel extract also exhibits other biological activities. To study its anti-inflammatory activity, the cytotoxicity of the samples against RAW 264e.7 macrophage cells must be first tested to ensure the minimal interference of cell survival to the study. The results (Figure 5a and Figure S4a) showed that % cell viability decreased when the concentration of the samples increased. At concentrations below 250 µg/mL, salak peel extract, 120E, and 120S exhibited > 80% cell viability, demonstrating low toxicity. Interestingly, at the same concentration, 120E and 120S possessed a higher % cell viability compared to non-encapsulated salak peel extract. This indicates that the encapsulation process could reduce the cytotoxicity of the extract. As a positive control, incubating the cells with 2.5% DMSO at the same condition resulted in a cell viability of 46.4 ± 1.3%. Based on the sample concentrations determined in the cytotoxicity study, the anti-inflammatory study was performed. The results (Figure 5b and Figure S4b) showed that the IC50 of NO production was 201.74 and 65.83 µg/mL for salak peel extract and diclofenac, respectively, demonstrating the potential anti-inflammatory activity of the extract. This result is in agreement with the result obtained by other work that used the ELISA assay [40]. The anti-inflammatory activity of salak peel extract can be due to various components including chlorogenic acid [41]. It is worth mentioning that the anti-inflammatory properties of salak peel extract were similar before and after the encapsulation process. The IC50 of NO production was 200.44 µg/mL and was calculated from the extract concentration loaded in 120S as shown in Figure 5. As the ethosome shell did not show any anti-inflammatory activity, it could be concluded that the property observed was the effect of the extract.
Table 6 shows salak peel extract to have anti-microbial activity against E. coli ATCC 25922, S. aureus ATCC 6538, and C. acnes ATCC 6919. Among them, the activity against S. aureus was the most prominent. This is in agreement with the previous work [42]. As the intended application of the current work is cosmeceutical, the effect of salak peel extract on the proliferation of human fibroblasts was also investigated. Figure S5 showed good cell viability up to day 5 of incubation with salak peel extract at every concentration tested (cell viability > 80%). The extract also slightly enhanced cell proliferation, especially on day 1. This indicates the biocompatibility of the extract towards human skin cells.
We further investigated the biocompatibility of the extract after the encapsulation process. Human skin fibroblast cells were treated with 120E and 120S for 7 days without changing the media. On days 1 and 7, the cell viability was measured through (1) the amount of ATP generated by the cell and (2) membrane damage through the increase in fluorescent intensity of the impermeant dye. At concentrations below 125 µg/mL, both 120E and 120S exhibited cell viability more than 80% up to 7 days of incubation, indicating their compatibility toward the skin cells (Figure 6a). Moreover, cell proliferation could be clearly observed on day 7, especially in 120S-treated cells. These results suggest the biocompatibility of ethosomes and salak peel ethosomes [43]. Nevertheless, more studies such as skin irritation tests are necessary to confirm this. Interestingly, membrane damage was decreased only in 120S-treated cells, especially on day 1, as shown in Figure 6b, indicating the beneficial role of salak peel ethosomes in promoting cell proliferation together with strengthening membrane integrity. Nevertheless, further studies are needed to investigate the mechanism of action regarding skin-rejuvenating effects. Overall, salak peel extract was shown to exhibit antiradical, anti-tyrosinase, anti-inflammatory, and anti-bacterial activities (especially against S. aureus). It also showed good biocompatibility both before and after the encapsulation process, at least in vitro. It is worth highlighting that loading salak peel extract in ethosomes also has potential in terms of skin rejuvenation effects. However, more investigation is needed to confirm this observation.

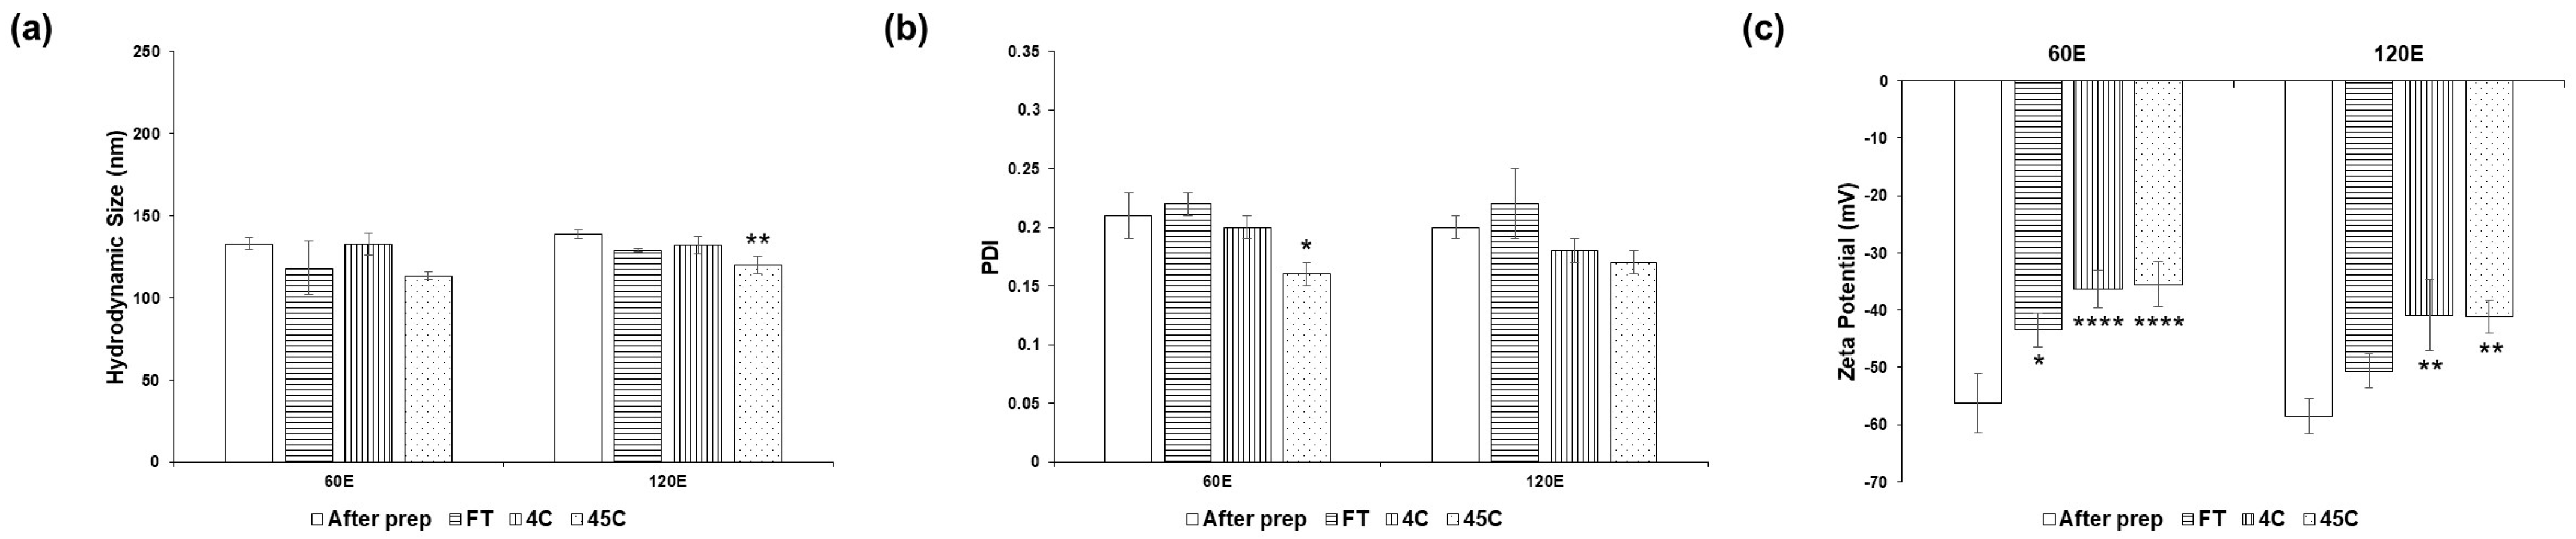
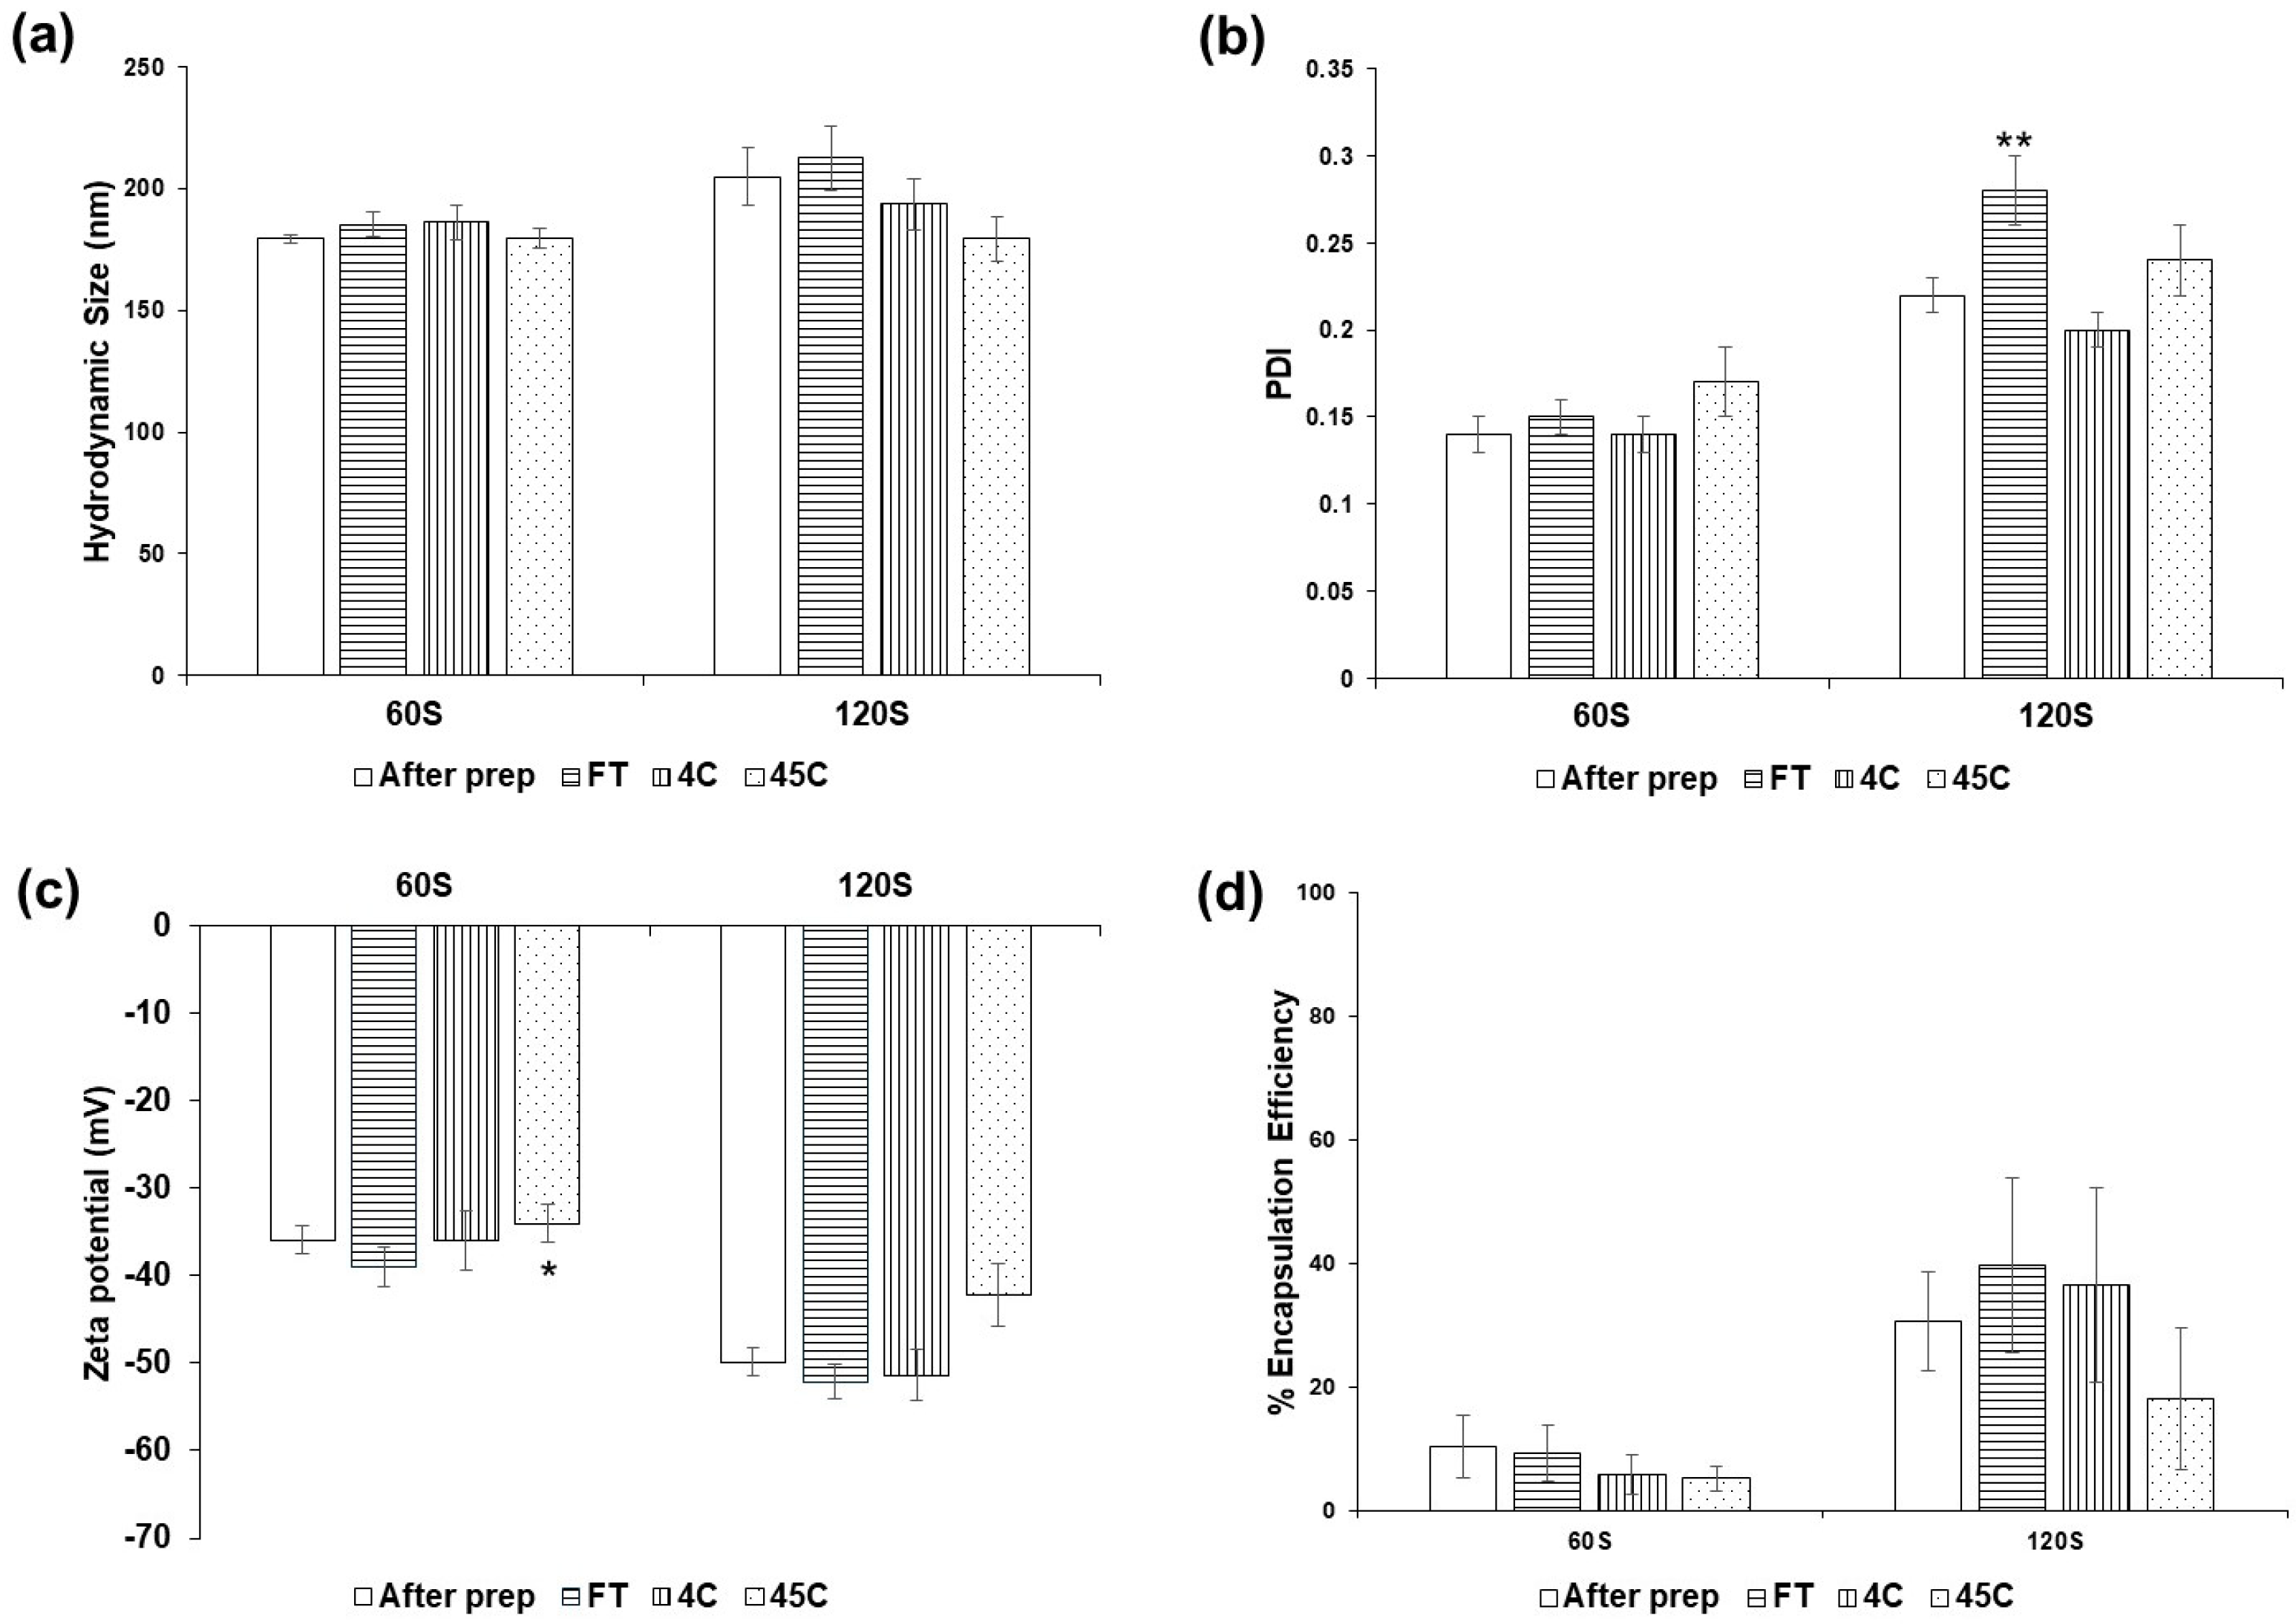
3.5. Stability of Ethosomes and Salak Peel Ethosomes

Salak peel extract has many biological activities mainly due to their polyphenol components; however, their sensitivity to the change in the environment restricts its potential uses. To increase the stability, salak peel extract was encapsulated in liposome and and stored it at different temperatures for 1 and 3 months [2]. Results showed minimal change in the encapsulation efficiency; however, the hydrodynamic size of the liposomes significantly changed in almost all formulations investigated. This was probably due to the liposome’s susceptibility to the change in temperature [44,45]. Here, ethosomes were used in place of liposome as the structure was reported to be more stable due to the presence of ethanol.
In this work, ethosomes with and without salak peel extract were stored at different temperatures (i.e., 4 and 45 °C) for 1 month and passed through six cycles of freeze–thawing (FT) [2]. The latter experiment was performed to assess the ethosomes’ stability during transportation where the temperature can fluctuate. Results are shown in Figure 7 and Figure 8 for ethosomes and salak peel ethosomes, respectively. At the predetermined time, no precipitation was observed in every formulation; however, the color darkened in the samples stored at 45 °C for 1 month. The hydrodynamic size of all the formulations studied demonstrated minimal change when stored at different conditions. A significant decrease in hydrodynamic size was only seen in 120E when kept at 45 °C for 1 month. It was suspected to be due to the degradation of L-α-phosphatidylcholine; however, more studies would be needed to confirm this observation. The same phenomenon was also seen in other studies that used similar shell components [2]. It is worth mentioning that a decrease in the hydrodynamic size was also seen in 120S, but the change was not significant. The PDI also slightly changed in all samples except for 60E (45 °C, 1 month) and 120S (FT). However, the PDI of all the formulations was still less than 0.3, indicating the ethosome population to still be monodispersed. The change in zeta potential was more prominent in samples without salak peel extract. However, the absolute zeta potential was still higher than ǀ±25ǀ mV.
The change in the encapsulation efficiency of salak peel ethosomes was also investigated by measuring the total phenolic content after their storage. The results (Figure 8d) suggested the amount of L-α-phosphatidylcholine potentially affects this factor as the decrease in the encapsulation efficiency seen in 60S was more prominent than in 120S. However, the change seen here was not statistically significant. Overall, the ethosomes prepared via the simple and green method were stable enough to be stored at different temperatures or for transportation. Between the two, salak peel ethosomes were more stable than ethosomes, potentially due to the additional chemical bonds formed between salak peel extract and L-α-phosphatidylcholine [46]. It is also worth mentioning that the change in the characteristics seen was minimal compared to previously reported liposome-encapsulated salak peel extract, potentially due to the use of ethosomes instead of liposomes [2]. From all the results presented here, 120S appeared to be the formulation with the highest potential in terms of use. Further optimization and tests can help in achieving the practical uses of this particle.

4. Conclusions

In this work, we explored a method to increase the use of salak peel, an agricultural waste, through extraction and encapsulation processes. Using 95% ethanol as the solvent, salak peel extract was shown to have antiradical, anti-tyrosinase, anti-inflammatory, and anti-bacterial activities, befitting its potential use in cosmeceutical applications. The method used for encapsulation was simple, used low energy, and required only green solvents (ethanol and water). The results showed the yielded ethosomes (with and without the encapsulation of salak peel extract) have a size in nanometers with high absolute zeta potential. Ethosome-encapsulated salak peel extract also showed good antiradical capacity and anti-inflammatory properties compared to the extract before the encapsulation process. Furthermore, it had the potential to promote cell proliferation and membrane strengthening, which are key factors leading to skin rejuvenation. The ethosomes prepared in this work were also found to be stable and capable of being transported. Between the two, salak peel ethosomes were shown to be more stable, potentially due to the additional chemical interactions between the extract and the ethosome shell. Overall, this work demonstrated the potential use of salak peel extract in cosmeceutical applications and its encapsulation in ethosomes using the green method. With the further optimization of other relevant parameters, such as types of solvents used in the extraction process or the addition of an edge activator in the encapsulation process, salak peel extract can be made suitable for cosmeceutical applications both before and after encapsulation.

Supplementary Materials

The following supporting information can be downloaded at: https://www.mdpi.com/article/10.3390/cosmetics12030122/s1, Figure S1: Maceration of Salak plum peel with ethanol under condition of 0 °C, room temperature and 50 °C; Figue S2: The physical appearance of salak ethosomes after the dialysis process when different amount of lipid was used in the formulations. The arrow indicated the precipitation seen when the total amount of lipid used in the formulation was 7.5 mg.; Figure S3: Water solubility of extract peel extract, ethosomes encapsulated salak peel extract (120S), and ethosomes (120E). The red arrow indicated the precipitation seen when the salak peel extract was directly solubilized in water; Figure S4: Anti-inflammatory activity of diclofenac. (a) % Cell viability and (b) % inhibition of NO production; Figure S5: Effect of salak peel extract at different concentrations on human fibroblast (CRL2522); Table S1: showed the characteristics of ethosomes (E) and salak ethosomes (S) when the amount of lipid used wee 7.5 and 15 mg, respectively; Table S2: Detail of statistical analysis of percent cell viability of salak peel extract, 120E, and 120 S p-value is calculated by comparing to Salak peel extract at each concentration (ns, not significant; *, significant; **, very significant; ***, highly significant); Table S3: Detail of statistical analysis of % Inhibition of NO production salak peel extract, 120E, and 120 S p-value is calculated by comparing to Salak peel extract at each concentration (ns, not significant; *, significant; **, very significant; ***, highly significant); Table S4: Detail of statistical analysis of membrane damage and % cell proliferation of 120E, and 120 S, p-value is calculated by comparing to Salak peel extract at each concentration (ns, not significant; *, significant; **, very significant; ***, highly significant).

Author Contributions

Conceptualization, S.T.; methodology, S.T., R.T., and Y.W.; validation, D.P., S.S., and U.A.; formal analysis, S.T., R.T., and Y.W.; investigation, S.T., R.T., Y.W., P.Y., S.B., and K.S.; data curation, S.T., R.T., and Y.W.; writing—original draft preparation, S.T.; writing—review and editing, S.T., D.P., R.T., and U.A.; visualization, S.T.; supervision, D.P. and S.S.; funding acquisition, U.A. All authors have read and agreed to the published version of the manuscript.

Funding

This research was funded by (i) National Nanotechnology Center, National Science and Technology Development Agency (NSTDA), (ii) Thailand Science Research and Innovation (TSRI), and (iii) National Science, Research and Innovation Fund (NSRF) (P2351442).

Institutional Review Board Statement

Not applicable.

Informed Consent Statement

Not applicable.

Data Availability Statement

The original data presented in this study are included in the article and Supplementary Materials.

Acknowledgments

The authors thank Chaisak Chansriniyom, Department of Pharmacognosy and Pharmaceutical Botany, Faculty of Pharmaceutical Sciences, Chulalongkorn University, for identifying the specimen voucher of the salak used in this work.

Conflicts of Interest

The authors declare no conflicts of interest.

References

  1. Saleh, M.S.; Siddiqui, M.J.; Mediani, A.; Ismail, N.H.; Ahmed, Q.U.; So’ad, S.Z.M.; Saidi-Besbes, S. Salacca zalacca: A short review of the palm botany, pharmacological uses and phytochemistry. Asian Pac. J. Trop. Med. 2018, 11, 645–652. [Google Scholar]
  2. Kanlayavattanakul, M.; Lourith, N.; Ospondpant, D.; Ruktanonchai, U.; Pongpunyayuen, S.; Chansriniyom, C. Salak plum peel extract as a safe and efficient antioxidant appraisal for cosmetics. Biosci. Biotechnol. Biochem. 2013, 77, 1068–1074. [Google Scholar] [CrossRef]
  3. Tan, S.S.; Tan, S.T.; Tan, C.X. Antioxidant, hypoglycemic and anti-hypertensive properties of extracts derived from peel, fruit and kernel of Salak. Br. Food J. 2020, 122, 3029–3038. [Google Scholar] [CrossRef]
  4. Sunandar, A.P.; Aris, A.; Fitri, R.L. Evaluation of inhibitory activity of salak peel extract and lotion formula on Trichophyton mentagrophytes. AIP Conf. Proc. 2023, 2556, 030001. [Google Scholar]
  5. Saleh, M.S.; Siddiqui, M.J.; So’ad, S.Z.M.; Murugesu, S.; Khatib, A.; Rahman, M.M. Antioxidant and α-Glucosidase Inhibitory Activities and Gas Chromatography–Mass Spectrometry Profile of Salak (Salacca zalacca) Fruit Peel Extracts. Pharmacogn. Res. 2018, 10, 385–390. [Google Scholar]
  6. Hcini, K.; Lozano-Pérez, A.A.; Luis Cenis, J.; Quílez, M.; José Jordán, M. Extraction and encapsulation of phenolic compounds of tunisian rosemary (Rosmarinus officinalis L.) extracts in silk fibroin nanoparticles. Plants 2021, 10, 2312. [Google Scholar] [CrossRef] [PubMed]
  7. Soltanzadeh, M.; Peighambardoust, S.H.; Ghanbarzadeh, B.; Mohammadi, M.; Lorenzo, J.M. Chitosan nanoparticles as a promising nanomaterial for encapsulation of pomegranate (Punica granatum L.) peel extract as a natural source of antioxidants. Nanomaterials 2021, 11, 1439. [Google Scholar] [CrossRef]
  8. Bhattacharyya, S.S.; Paul, S.; Khuda-Bukhsh, A.R. Encapsulated plant extract (Gelsemium sempervirens) poly (lactide-co-glycolide) nanoparticles enhance cellular uptake and increase bioactivity in vitro. Exp. Biol. Med. 2010, 235, 678–688. [Google Scholar] [CrossRef]
  9. Gortzi, O.; Lalas, S.; Chinou, I.; Tsaknis, J. Reevaluation of bioactivity and antioxidant activity of Myrtus communis extract before and after encapsulation in liposomes. Eur. Food Res. Technol. 2008, 226, 583–590. [Google Scholar] [CrossRef]
  10. Miere, F.; Vicas, S.I.; Timar, A.V.; Ganea, M.; Zdrinca, M.; Cavalu, S.; Fritea, L.; Vicas, L.; Muresan, M.; Pallag, A. Preparation and characterization of two different liposomal formulations with bioactive natural extract for multiple applications. Processes 2021, 9, 432. [Google Scholar] [CrossRef]
  11. Madhunithya, E.; Venkatesh, G.; Shyamala, G.; Manjari, V.; Ramesh, S.; Karuppaiah, A.; Sankar, V. Development of ethosome comprising combined herbal extracts and its effect on hair growth. Adv. Tradit. Med. 2021, 21, 131–141. [Google Scholar] [CrossRef]
  12. Somwanshi, S.B.; Hiremath, S.N. In-vivo evaluation of the wound healing activity of the Sesamum indicum L. seed extract in novel ethosomal vesicular system. J. Drug Deliv. Ther. 2018, 8, 411–420. [Google Scholar] [CrossRef]
  13. Yücel, Ç.; Şeker Karatoprak, G.; Degim, I.T. Anti-aging formulation of rosmarinic acid-loaded ethosomes and liposomes. J. Microencapsul. 2019, 36, 180–191. [Google Scholar] [CrossRef]
  14. Kusumawati, I.; Kurniawan, K.O.; Rohmania, R.; Pratama, B.A.; Pratama, Y.A.; Rullyansyah, S.; Warsito, M.F.; Widyowati, R.; Hestianah, E.P.; Matsunami, K. Comparative study of liposomal and ethosomal formulations of Curcuma heyneana rhizome extract in a transdermal delivery system. Pharm. Nanotechnol. 2025, 13, 303–312. [Google Scholar] [CrossRef] [PubMed]
  15. Anwar, E.; Farhana, N. Formulation and evaluation of phytosome-loaded maltodextrin-gum Arabic microsphere system for delivery of Camellia sinensis extract. J. Young Pharm. 2018, 10, S56. [Google Scholar] [CrossRef]
  16. Telange, D.R.; Patil, A.T.; Pethe, A.M.; Fegade, H.; Anand, S.; Dave, V.S. Formulation and characterization of an apigenin-phospholipid phytosome (APLC) for improved solubility, in vivo bioavailability, and antioxidant potential. Eur. J. Pharm. Sci. 2017, 108, 36–49. [Google Scholar] [CrossRef]
  17. Kidd, P.; Head, K. A review of the bioavailability and clinical efficacy of milk thistle phytosome: A silybin-phosphatidylcholine complex (Siliphos). Altern. Med. Rev. 2005, 10, 193–203. [Google Scholar]
  18. Bombardelli, E.; Spelta, M.; Loggia, R.; Sosa, S.; Tubaro, A. Aging skin: Protective effect of silymarin-PHYTOSOME. Fitoterapia 1991, 62, 115–122. [Google Scholar]
  19. Sunagar, R.R.; Sreerama, Y.N. Implication of solvent polarities on browntop millet (Urochloa ramosa) phenolic antioxidants and their ability to protect oxidative DNA damage and inhibit α-amylase and α-glucosidase enzymes. Food Chem. 2023, 411, 135474. [Google Scholar] [CrossRef]
  20. AAT Bioquest, Inc. 4 October 2024. Available online: https://www.aatbio.com/tools/ic50-calculator (accessed on 13 December 2024).
  21. Hsu, C.-K.; Chou, S.-T.; Huang, P.-J.; Mong, M.-C.; Wang, C.-K.; Hsueh, Y.-P.; Jhan, J.-K. Crude ethanol extracts from grape seeds and peels exhibit anti-tyrosinase activity. J. Cosmet. Sci. 2012, 63, 225–232. [Google Scholar]
  22. Onyebuchi, C.; Kavaz, D. Effect of extraction temperature and solvent type on the bioactive potential of Ocimum gratissimum L. extracts. Sci. Rep. 2020, 10, 21760. [Google Scholar] [CrossRef] [PubMed]
  23. Spigno, G.; De Faveri, D.M. Antioxidants from grape stalks and marc: Influence of extraction procedure on yield, purity and antioxidant power of the extracts. J. Food Eng. 2007, 78, 793–801. [Google Scholar] [CrossRef]
  24. Nasri, S.; Ebrahimi-Hosseinzadeh, B.; Rahaie, M.; Hatamian-Zarmi, A.; Sahraeian, R. Thymoquinone-loaded ethosome with breast cancer potential: Optimization, in vitro and biological assessment. J. Nanostructure Chem. 2020, 10, 19–31. [Google Scholar] [CrossRef]
  25. Bodade, S.S.; Kamble, M.S.; Shaikh, K.S.; Chaudhari, P.D. A study on ethosomes as mode for transdermal delivery of an antidiabetic drug. Drug Deliv. 2013, 20, 40–46. [Google Scholar] [CrossRef]
  26. Bellefroid, C.; Lechanteur, A.; Evrard, B.; Mottet, D.; Debacq-Chainiaux, F.; Pie, G. In vitro skin penetration enhancement techniques: A combined approach of ethosomes and microneedles. Int. J. Pharm. 2019, 572, 118793. [Google Scholar] [CrossRef]
  27. Sallustio, V.; Farruggia, G.; di Cagno, M.P.; Tzanova, M.M.; Marto, J.; Ribeiro, H.; Goncalves, L.M.; Mandrone, M.; Chiocchio, I.; Cerchiara, T.; et al. Design and characterization of an ethosomal gel encapsulating rosehip extract. Gels 2023, 9, 362. [Google Scholar] [CrossRef]
  28. Arjmandi, N.; Van Roy, W.; Lagae, L.; Borghs, G. Measuring the Electric Charge and Zeta Potential of Nanometer-Sized Objects Using Pyramidal-Shaped Nanopores. Anal. Chem. 2012, 84, 8490–8496. [Google Scholar] [CrossRef]
  29. Limsuwan, T.; Boonme, P.; Khongkow, P.; Amnuaikit, T. Ethosomes of phenylethyl resorcinol as vesicular delivery system for skin lightening applications. Biomed Res. Int. 2017, 2017, 8310979. [Google Scholar] [CrossRef]
  30. Lukić, M.; Pantelić, I.; Savić, S.D. Towards optimal ph of the skin and topical formulations: From the current state of the art to tailored products. Cosmetics 2021, 8, 69. [Google Scholar] [CrossRef]
  31. Saleh, M.S.; Siddiqui, M.J.; Mat So’ad, S.Z.; Roheem, F.O.; Saidi-Besbes, S.; Khatib, A. Correlation of FT-IR fingerprint and α-glucosidase inhibitory activity of salak (Salacca zalacca) fruit extracts utilizing orthogonal partial least square. Molecules 2018, 23, 1434. [Google Scholar] [CrossRef]
  32. Pereira, A.; Mallya, R. Formulation and evaluation of a photoprotectant cream containing Phyllanthus emblica extract-phospholipid complex. J. Pharmacogn. Phytochem. 2015, 4, 232–240. [Google Scholar]
  33. Ong, S.P.; Law, C.L. Drying kinetics and antioxidant phytochemicals retention of salak fruit under different drying and pretreatment conditions. Dry. Technol. 2011, 29, 429–441. [Google Scholar] [CrossRef]
  34. Maryana, W.; Rachmawati, H.; Mudhakir, D. Formation of phytosome containing silymarin using thin layer-hydration technique aimed for oral delivery. Mater. Today Proc. 2016, 3, 855–866. [Google Scholar] [CrossRef]
  35. Xiao, Y.; Song, Y.; Chen, Z.; Ping, Q. The preparation of silybin–phospholipid complex and the study on its pharmacokinetics in rats. Int. J. Pharm. 2006, 307, 77–82. [Google Scholar]
  36. Predescu, N.C.; Papuc, C.; Nicorescu, V.; Gajaila, I.; Goran, G.V.; Petcu, C.D.; Stefan, G. The influence of solid-to-solvent ratio and extraction method on total phenolic content, flavonoid content and antioxidant properties of some ethanolic plant extracts. Rev. Chim 2016, 67, 1922–1927. [Google Scholar]
  37. Do, Q.D.; Angkawijaya, A.E.; Tran-Nguyen, P.L.; Huynh, L.H.; Soetaredjo, F.E.; Ismadji, S.; Ju, Y.-H. Effect of extraction solvent on total phenol content, total flavonoid content, and antioxidant activity of Limnophila aromatica. J. Food Drug Anal. 2014, 22, 296–302. [Google Scholar] [CrossRef]
  38. Adjeng, A.N.T.; Akib, N.I.; Hairah, S.; Herman, S. Formulation and antioxidants evaluation of liquid soap of Salacca zalacca (Gaertn.) Voss. peels ethanol extract 96%. J. Cakrawala Ilm. 2022, 1, 1913–1920. [Google Scholar] [CrossRef]
  39. Girsang, E.; Lister, I.N.E.; Ginting, C.N.; Khu, A.; Samin, B.; Widowati, W.; Wibowo, S.; Rizal, R. Chemical constituents of snake fruit (Salacca zalacca (Gaert.) Voss) peel and in silico anti-aging analysis. Mol. Cell. Biomed. Sci. 2019, 3, 122–128. [Google Scholar] [CrossRef]
  40. Girsang, E.; Lister, I.N.E.; Ginting, C.N.; Nasution, S.L.; Suhartina, S.; Munshy, U.Z.; Rizal, R.; Widowati, W. Antioxidant and Anti-inflammatory Activity of Salacca zalacca (Gaertn.) Voss Peel Ethanolic Extract on Lead Induced Fibroblast Cells. In Proceedings of the International Conference on Advance Molecular Bioscience Biomedical Engineering, Newport Beach, CA, USA, 6–9 January 2019; pp. 68–73. [Google Scholar]
  41. Girsang, E.; Ginting, C.N.; Lister, I.N.E.; yashfa Gunawan, K.; Widowati, W. Anti-inflammatory and antiaging properties of chlorogenic acid on UV-induced fibroblast cell. PeerJ 2021, 9, e11419. [Google Scholar] [CrossRef]
  42. Wahyuni, U.N.; Sihotang, Y.M.; Marpaung, M.P.; Prasetyo, D. Perbandingan Pelarut Etanol Dengan Etil Asetat Terhadap Aktivitas Antibakteri Ekstrak Kulit Buah Salak (Salacca zalacca Reinw) Pada Pertumbuhan Bakteri Staphylococcus Aureus ATCC 25923. Madani J. Ilm. Multidisiplin 2024, 2, 637–643. [Google Scholar]
  43. Li, Y.; Xu, F.; Li, X.; Chen, S.Y.; Huang, L.Y.; Bian, Y.Y.; Wang, J.; Shu, Y.T.; Yan, G.J.; Dong, J.; et al. Development of curcumin-loaded composite phospholipid ethosomes for enhanced skin permeability and vesicle stability. Int. J. Pharm. 2021, 592, 119936. [Google Scholar] [CrossRef] [PubMed]
  44. Ioele, G.; Grande, F.; De Luca, M.; Occhiuzzi, M.A.; Garofalo, A.; Ragno, G. Photodegradation of anti-inflammatory drugs: Stability tests and lipid nanocarriers for their photoprotection. Molecules 2021, 26, 5989. [Google Scholar] [CrossRef] [PubMed]
  45. Sydykov, B.; Oldenhof, H.; Sieme, H.; Wolkers, W.F. Storage stability of liposomes stored at elevated subzero temperatures in DMSO/sucrose mixtures. PLoS ONE 2018, 13, e0199867. [Google Scholar] [CrossRef] [PubMed]
  46. Karpuz, M.; Gunay, M.S.; Ozer, A.Y. Chapter 18—Liposomes and phytosomes for phytoconstituents. In Advances and Avenues in the Development of Novel Carriers for Bioactives and Biological Agents; Singh, M.R., Singh, D., Kanwar, J.R., Chauhan, N.S., Eds.; Academic Press: Cambridge, MA, USA, 2020; pp. 525–553. [Google Scholar]
Figure 1. HPLC chromatograms of seven phenolic standards (a), including gallic acid (GA), catechin (C), chlorogenic acid (C), caffeic acid (CA), epicatechin (EC), ferulic acid (FA), and quercetin (Q), and salak peel extract (b) were shown.
Cosmetics 12 00122 g001
Figure 2. TEM images of (a) 60E, (b) 60S, (c) 120E, and (d) 120S at magnification of 30,000×.
Cosmetics 12 00122 g002
Figure 3. The FTIR spectra of Lα-hosphatidylcholine, salak peel extract, physical mix between L-α-phosphatidylcholine and salak peel extract in a ratio of 1:1 by weight, 60E, 60S, 120E, and 120S.
Cosmetics 12 00122 g003
Figure 4. The DSC thermograms and the detail of each component before and after the ethosome formation and the encapsulation process.
Cosmetics 12 00122 g004
Figure 5. The anti-inflammatory activity of salak peel extract, 120E, and 120S. (a) % cell viability and (b) % inhibition of NO production (n = 3/group). p-value is calculated by comparing to salak peel extract at each concentration (*, significant; **, very significant; ***, highly significant). The exact p-value of different samples is provided in Tables S2 and S3.
Cosmetics 12 00122 g005
Figure 6. Biocompatibility assay on human fibroblast cells. (a) % cell proliferation and (b) membrane damage of cells treated with 120E and 120S. Data are presented as mean ± standard deviation (n = 4). p-value is calculated by comparing with untreated cells (ns, not significant; *, significant; **, very significant; ***, highly significant). Exact p-value of different samples is provided in Table S4.
Cosmetics 12 00122 g006
Figure 7. Ethosomes’ (a) hydrodynamic size (nm), (b) PDI, and (c) zeta potential after 6 freeze–thaw cycles (FT) and storage for 1 month at 4 (4C) and 45 °C (45C) (n = 3/group). p-value is calculated by comparing to ‘after prep’ as the control group (*, significant; **, very significant; ****, very highly significant).
Cosmetics 12 00122 g007
Figure 8. Salak peel ethosomes’ (a) hydrodynamic size (nm), (b) PDI, (c) zeta potential, and (d) percent encapsulation efficiency after 6 freeze–thaw cycles (FT) and storage for 1 month at 4 (4C) and 45 °C (45C). (n = 3/group). p-value is calculated by comparing to ‘after prep’ as the control group (*, significant; **, very significant).
Cosmetics 12 00122 g008
Table 1. Culturing conditions for bacteria used in anti-bacterial assay of salak peel extract.
Escherichia coliStaphylococcus aureusCutibacterium acnes
Media Used for MICMueller–Hinton brothReinforced Clostridial Broth
Media Used for MBCMueller–Hinton AgarBrain Heart Infusion Agar
Incubation Time (hours)2472
Incubation Condition AerobicAnaerobic
Table 2. The detailed compositions of the formulations investigated in this study.
Formulation
Codes
Amount of
L-α-Phosphatidylcholine (mg)
Amount of Salak Peel Extract (mg)Total Amount of Ethanol
(mL)
Total Amount of Type I Water (mL)
Ethosomes
30E30-2.753.5
60E60-2.753.5
120E120-2.753.5
Salak Peel Ethosomes
30S30302.753.5
60S60302.753.5
120S120302.753.5
The number represents the amount of the lipid used in the formulation, while E and S represent ethosomes and salak peel ethosomes, respectively.
Table 3. Phenolic compounds found in salak peel extract and their percent content.
Phenolic ContentConcentration (µg/mL)%Content (g/100 g·Sample)
Catechin0.48 ± 0.050.05 ± 0.00
Chlorogenic acid4.36 ± 0.050.44 ± 0.00
Caffeic acid0.10 ± 0.000.01 ± 0.00
Epicatechin0.48 ± 0.000.05 ± 0.00
Table 4. Characterizations of different formulations of ethosomes and salak peel ethosomes (n = 3).
FormulationspHHydrodynamic Size (nm)PDIZeta Potential (mV)% Encapsulation Efficiency (Total Phenolic Content)
Ethosomes
30E5.2 ± 0.1133.8 ± 2.80.22 ± 0.00−53.5 ± 2.9-
60E5.5 ± 0.2132.8 ± 3.70.21 ± 0.02−56.2 ± 5.1-
120E5.1 ± 0.2138.8 ± 2.80.20 ± 0.01−58.5 ± 3.1-
Salak Peel Ethosomes
30S6.0 ± 0.4124.6 ± 11.20.14 ± 0.02−34.5 ± 1.51.8 ± 0.3
60S5.3 ± 0.1179.4 ± 1.80.14 ± 0.01−35.9 ± 1.610.5 ± 5.1
120S5.1 ± 0.1204.9 ± 11.80.22 ± 0.01−39.9 ± 1.630.6 ± 8
Table 5. Anti-oxidant and anti-tyrosinase activities of salak peel extract before and after encapsulation process (n = 3/group).
Testing SampleAnti-Oxidant Activity (IC50, mg/mL)Anti-Tyrosinase Activity
(IC50, mg/mL)
DPPHABTS
L-Ascorbic Acid0.038 ± 0.0010.007 ± 0.002-
Kojic Acid--0.078 ± 0.005
Salak Peel Extract0.027 ± 0.0010.027 ± 0.0040.193 ± 0.027
Ethosomes (120E)More than 50No activityNo activity
Salak Peel Ethosomes (120S)0.054 ± 0.0080.448 ± 0.069 No activity
Table 6. Anti-microbial activities of salak peel extract against microbes (n = 3/group).
SampleE. coli
ATCC 25922
S. aureus
ATCC 6538
C. acnes
ATCC 6919
MIC (mg/mL)MBC (mg/mL)MIC (mg/mL)MBC (mg/mL)MIC (mg/mL)MBC (mg/mL)
Salak Peel Extract1001001.561.56100100
20% DMSONDND5%10%NDND
70% Ethanol17.5%35%8.75%35%35%35%
ND, not detected.
Disclaimer/Publisher’s Note: The statements, opinions and data contained in all publications are solely those of the individual author(s) and contributor(s) and not of MDPI and/or the editor(s). MDPI and/or the editor(s) disclaim responsibility for any injury to people or property resulting from any ideas, methods, instructions or products referred to in the content.

