Abstract
Given the increasing importance of sustainability aspects in national energy plans, this article deals with the prospective analysis of life-cycle indicators of the power generation sector through the case study of Spain. A technology-rich, optimisation-based model for power generation in Spain is developed and provided with endogenous life-cycle indicators (climate change, resources, and human health) to assess their evolution to 2050. Prospective performance indicators are analysed under two energy scenarios: a business-as-usual one, and an alternative scenario favouring the role of carbon dioxide capture in the electricity production mix by 2050. Life-cycle impacts are found to decrease substantially when existing fossil technologies disappear in the mix (especially coal thermal power plants). In the long term, the relatively high presence of natural gas arises as the main source of impact. When the installation of new fossil options without CO2 capture is forbidden by 2030, both renewable technologies and—to a lesser extent—fossil technologies with CO2 capture are found to increase their contribution to electricity production. The endogenous integration of life-cycle indicators into energy models proves to boost the usefulness of both life cycle assessment and energy systems modelling in order to support decision- and policy-making.
1. Introduction
Within a context of growing global consumption of goods and services, the current level of resource extraction is unsustainable [1,2]. As physical bounds of the planet are finite, the increasing need for resources leads to environmental and social concerns such as climate change, human health, land use, pollution and water scarcity. New policy actions are therefore required to promote a shift in production processes, consumption schemes and supply-chain management [2,3,4]. Most of the expected measures should focus on reducing (non-renewable) energy consumption as well as on the verification of their suitability in terms of sustainability, which is closely linked to the energy transformation processes that take place.
Under these circumstances, the combination of Energy Systems Modelling (ESM) and Life Cycle Assessment (LCA) methodologies arises as a promising research field for both analysts and energy planners. Despite some experiences in dynamic LCA [5,6], there is a lack of comprehensive works assessing the prospective performance of energy systems with a sustainability focus. The endogenous integration of life-cycle indicators into an ESM framework based on robust optimisation procedures is a key step in this direction. First attempts tackled the inclusion of life-cycle emissions—associated with a set of power generation technologies—in optimisation-based energy system models [7]. Pietrapertosa et al. [8] carried out an analysis of the power generation technologies resulting from the long-term optimisation of the Italian mix, considering external costs with a life-cycle perspective. Case studies discussing sustainability concerns on clean transportation [9] and the deployment of new biofuels [10] have recently been published.
The robust endogenous integration of life-cycle indicators to overcome the limitation of techno-economic ESM regarding the projection of impacts from a systemic perspective is still a challenge [11,12,13]. This article deals with the integration of relevant life-cycle indicators calculated for power generation technologies into an energy system model built for the Spanish electricity production mix using LEAP (Long-range Energy Alternatives Planning system) [14].
2. Material and Methods
Environmental modellers can benefit from the experiences in ESM [12] as well as in other non-lifecycle approaches for multi-dimensional analysis [15,16]. In particular, ESM with dynamic optimisation models can be especially relevant for the development of new cleaner-production tools by generating information on future changes of the energy system [17]. Wene [18] discussed the importance of linking macro-economic models (usually top-down) with ESM (mostly bottom-up). There are two main approaches to provide this link. On the one hand, the soft-linking approach involves a transfer of results from one model to another. On the other hand, the hard-linking approach involves a robust combination of the two models in a single methodological framework [19,20]. Böhringer and Rutherford [21] proposed an alternative classification on the hybridisation of top-down and bottom-up modelling approaches, considering additionally the use of “reduced form” representations of a model.
The linkage between ESM and environmental modelling (in particular, LCA) remains hardly explored. The NEEDS project [7] followed a soft-linking approach for the inclusion of the external costs associated with life-cycle emissions of power generation technologies in a TIMES model, an optimisation-based ESM framework. Moreover, Portugal-Pereira et al. [22] recently presented a study on the integration of life-cycle greenhouse gas emissions of power generation technologies in Brazil into MESSAGE, a global ESM framework. In the present article, a soft-linking approach is followed to assess the evolution of a set of life-cycle indicators of the Spanish electricity production mix (beyond the mere inclusion of cumulative emissions). According to Helgesen [19], the advantages of soft-linking include practicality, transparency and learning, thus arising as an appropriate starting point for linking models based on different approaches since initial efforts in computer programming are kept low and modellers can “rapidly” obtain results for evaluation and learning.
Figure 1 represents the procedure followed in this work to merge LCA and ESM. Data acquisition is a key, time-consuming activity affecting both the LCA model (need for complete life cycle inventories, LCIs, of a well-defined list of current and future power generation technologies) and the energy system model (need for techno-economic data). The hybridisation of LCA and ESM is performed through the endogenous integration of selected results from the life cycle impact assessment (LCIA) stage of the study into the energy system model of the Spanish electricity production mix. This allows analysing the evolution of the selected life-cycle indicators under different scenarios (e.g., the business-as-usual scenario, BaU). It is important to stress the need for a sound definition of system boundaries when defining the power generation technologies in the LCA and ESM models. Thus, LCA/ESM hybridisation leads to a sound prospective LCA of national power generation, mitigating concerns on the use of attributional LCA for mid/long-term policy-making [23] through ESM techno-economic optimisation. Nevertheless, a pure consequential LCA is neither pursued nor achieved.
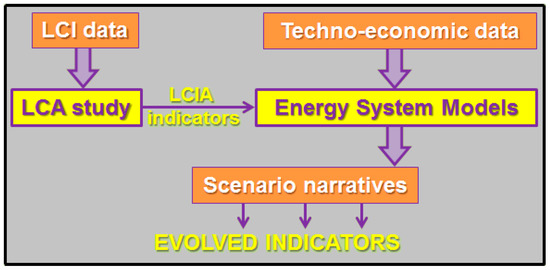
Figure 1.
Methodological approach for merging LCA and ESM.
ESM enables analysts to assess the evolution of the whole energy system according to previously defined scenario narratives. Once the LCIA results (i.e., the life-cycle indicators) are included in the description of the technologies within the energy system model, the optimisation procedure will run as usual in optimisation-based ESM but with additional data reporting the life-cycle performances of the national production mix. This endogenous integration of life-cycle indicators enriches the analysis of the prospective performance of the energy system while making possible the definition of constraints on life-cycle indicators in future studies. Nevertheless, potential concerns on the double counting of emissions must be taken into account. The present work involves an electricity system optimisation model focused on the production side, in which double-counting issues are avoided by considering direct emissions from fossil technologies separately from the corresponding life-cycle indicators.
The Spanish electricity production mix shows interesting features for its selection as an LCA + ESM case study: it is technologically wide-ranging (there are still coal, natural gas and nuclear power plants, but with a continuous growth of renewable production, mostly wind and solar power), and it arises as an example of fossil-renewable transition. The power generation technologies considered in the model are those existing by 2015 in the Spanish mix along with those with potential to emerge in the long term. Table 1 presents the list of existing and potential (“new”) electricity production technologies, as well as key parameters considered in this work [24,25,26]. The distinction between existing and new technologies partly mitigates methodological concerns on the use of constant LCIs for the forecasted period. While the LCIs of the technologies are “static”, the use of techno-economic optimisation leads to “dynamic” solutions for the electricity mix in the long term. In this sense, the consequential approach takes place through ESM, minimising all system costs subject to an extensive set of technologies’ parameters and restrictions such as emission limits. Therefore, the use of ESM facilitates a solution for LCA practitioners concerned about the prospective consideration of marginal changes in capacity and electricity supply [12].

Table 1.
Power generation technologies implemented in the Spanish energy model 2010–2050 (numbers in brackets are values assumed by 2050).
2.1. Optimisation Model of the Spanish Electricity Production Mix
The main objective of the study is to endogenously integrate a set of life-cycle indicators of power generation technologies into an energy system model created ad hoc for the optimisation of the Spanish electricity production mix. The optimisation model focuses only on electricity and it is founded on the development of a robust production side with a detailed list of power generation technologies. On the other hand, the demand side is modelled as a set of black boxes for each sector: industry, services, residential, transport, agriculture, and others. Figure 2 describes the evolution of the electricity demand by economic sector. Demand projections are based on historical data (period 2010–2015) from the Spanish grid operator and the Spanish Ministry of Industry as well as on static econometric models (static double log-linear models considering the historical demands since 1990) [27].
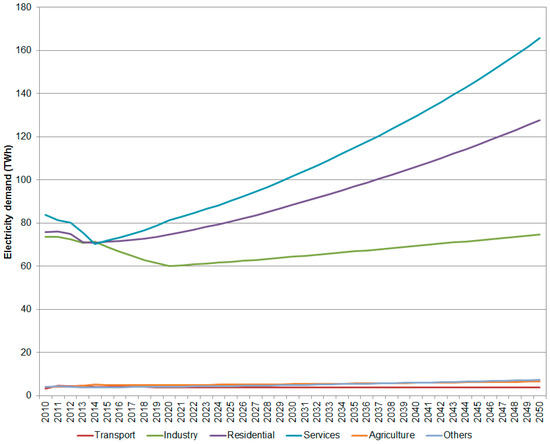
Figure 2.
Electricity demand projections by economic sector in Spain.
The main socio-economic drivers involved in the modelling of the demand projections are: gross domestic product (GDP), population, and electricity prices. Their evolution is assumed exogenously. Real data from the Spanish Statistical Office (INE) are used for the period 2010–2015. Thenceforward, different assumptions are made depending on the driver. The GDP projection is assumed to follow constant 1.6% inter-annual increases until 2020, 2.1% until 2030, and 1.9% until 2050. The population growth, based on INE projections [28], is expected to be negative: −0.14% per year until 2019, −0.15% until 2034, −0.17% until 2039, −0.25% until 2044, and −0.36% until 2050.
According to Figure 2, a relatively high increase in electricity demand is observed for the services and residential sectors. This is mainly due to the assumed influence of GDP on their performance. As a baseline projection, electricity demand for transport does not consider the penetration of electric vehicles in Spain because of the current lack of policy targets in this regard.
Electricity prices are projected following the trends observed in Capros et al. [29] and adapted for Spain (Figure 3). Different electricity prices are considered depending on the type of user (industrial/residential). Transport and services sectors are assumed to pay as industrial users, whereas the agricultural sector is assumed to pay as residential users (based on the average power requirements of each user).
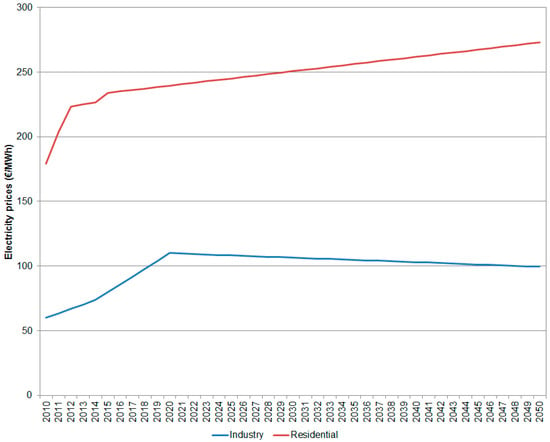
Figure 3.
Projection of the electricity prices in Spain.
Among the different ESM tools available, LEAP—a scenario-based modelling tool for energy analysis developed by the Stockholm Environment Institute [14]—is used. It supports a varied range of modelling methodologies. On the demand side, these range from bottom-up, end-use accounting methods to top-down macro-economic modelling. On the supply side, LEAP offers a range of accounting, simulation and optimisation procedures that enable modelling the entire energy system in depth. The rationale is founded on a tree structure where all entities (technologies, fuels, emissions, etc.) are connected at different levels. It is necessary to detail the key assumptions (socio-economic drivers), the demands, the transformation branch (transmission and distribution, imports/exports, and supply) and primary/secondary resources. Within this structure, LCIA values of the power generation technologies are introduced through the “environmental loadings” menu by creating new “effects” in the LEAP-based model. Moreover, the OSeMOSYS model [30]—a separated open source modelling framework that can be used from LEAP—is used to perform the optimisation of the energy system. The optimisation procedure follows the rationale of minimising the total system’s costs associated with the technologies involved (existing and new) subject to a list of constraints regarding the inherent behaviour of the technologies, policy requirements, environmental restrictions, etc.
In this article, two scenarios are designed to assess the performance of the electricity production mix, including the evolution of the life-cycle indicators implemented. The first scenario is a BaU case, referred to as “reference scenario”, which involves the demand projections and the portfolio of power generation technologies besides the target of reducing CO2 emissions by 40% with respect to 1990 levels by 2030 (from then on, the constraint is kept constant, meaning 39 Mt CO2 per year). This target takes into consideration the recent conclusions of the European Union concerning greenhouse gas emission reductions and energy policies by 2030 [31]. It should be noted that currently undefined, forthcoming national reduction targets—such as those linked to the 21st session of the Conference of the Parties [32]—are not considered.
The second scenario includes an additional restriction to the BaU scenario inspired by current recommendations suggesting the potential of carbon capture and storage (CCS) [32]. Thus, the “CCS scenario” considers that no new fossil capacity installation is allowed beyond 2030 unless CCS systems are implemented. Among the technologies presented in Table 1, NGCC and coal thermal plants with post-combustion CO2 capture (90% capture efficiency) are the CCS options considered.
A 5% social discount rate is assumed and the operational time-slice regime is annual (from 2010 as the reference year to 2050 as the end of the time horizon). Calibrations up to 2015 are implemented based on real statistical data in order to improve and update the model as much as possible.
2.2. LCA Framework
Apart from the energy optimisation model, it is necessary to carry out the LCA of each power generation technology involved in the current/future Spanish electricity production mix. LCA is a standardised methodology to evaluate the environmental impacts associated with a product system through its life cycle [33,34]. The functional unit of the present study is 1 MWh of electricity produced. A cradle-to-gate approach is followed, covering from raw material extraction to electricity production. The system’s boundaries also include capital goods associated with the infrastructure of the power plants, end-of-life flows (virtually proportional to the operation of the plant), and transportation of raw materials. Figure 4 shows a simplified diagram of the system’s boundaries for the different types of power generation technologies.
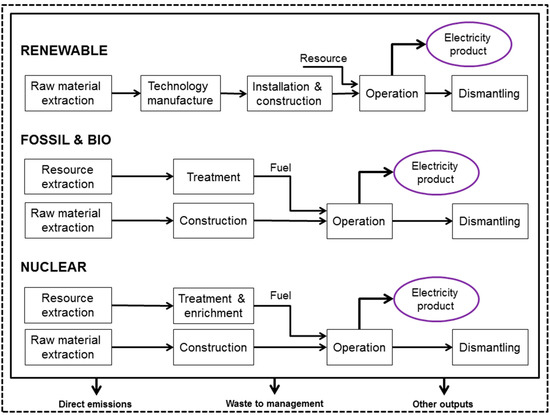
Figure 4.
Simplified life-cycle diagram of the power generation technologies involved.
Regarding the choice of life-cycle indicators, García-Gusano et al. [35] presented a prospective assessment of the Norwegian electricity production mix in terms of climate change, human health and ecosystem quality, using the IMPACT 2002+ method [36]. Similarly, the present article uses the IMPACT 2002+ method to evaluate three life-cycle indicators of the Spanish electricity production mix: climate change, human health, and resources. These indicators correspond to damage categories that represent quality changes of the environment affecting ecosystem and/or human beings. They embed one or more midpoint categories according to the IMPACT 2002+ method [36] and are typically closer to the sustainability concept.
Data acquisition is required to quantify the input and output flows associated with the power generation technologies listed in Table 1. Inventory data for the new technologies, i.e., those potentially participating in the electricity production mix according to the optimisation of each scenario, are based on specific literature: coal thermal power plants with/without capture [37,38,39], NGCC with/without capture [40,41], nuclear fission (III and IV generation) [42,43], nuclear fusion [44], cogeneration [45], hydropower dam and run-of-river plants [46], wind farms [47,48], tidal power [49], wave power [50], photovoltaics (open-ground and rooftop systems) [51], concentrated solar power plant with/without storage [52,53], geothermal (binary cycle) power plants [54], bioresource technology (biomass integrated gasification combined cycle, biogas and waste-to-energy plants) [55,56,57], PEMFC [58], and SOFC [59]. Finally, data for both existing technologies and background processes are retrieved from the ecoinvent database [60].
3. Results and Discussion
3.1. Electricity Production
The optimisation procedure performed through the electricity model provides the evolution of the electricity production mix for Spain. The entrance of new capacity is implicitly included in the mathematical optimisation while the evolution of the Spanish electricity production is explicitly shown as a key result. Given the currently low interconnection capacity in Spain, and in order to avoid trade imbalances, the net import/export electricity balances are assumed to be zero.
Figure 5 shows the resulting electricity production mix in the reference scenario. A progressive disappearance of the existing technologies is observed. From 2010 to 2015, all values are statistical, thus showing the effect of the financial crisis on the real electricity production and demand. As a result of the decoupling effect between GDP and electricity consumption, a decreasing trend in the electricity production is found in the period 2013–2015 (taking into consideration that the Spanish net power import/export balance means less than 4% of the total gross electricity production). Then, techno-economic optimisation begins and new technologies emerge in order to satisfy the increasing electricity demand. Coal thermal plants are assumed to disappear based on a national plan for the removal of subsidies to the Spanish coal by 2018. After 2015, NGCC plants start being relevant, accounting for 50–60 TWh per year until the end of their lifetimes by 2035. Besides, the nuclear withdrawal takes place progressively, with the last nuclear plant closed down by 2028 (further licence extensions are not considered). Hydropower facilities provide a continuing amount of electricity (20–40 TWh) and, due to their long lifetime, they are assumed to last until the end of the time horizon. Finally, existing wind onshore facilities account for up to 50 TWh per year, showing a decreasing trend until they are upgraded around 2030.
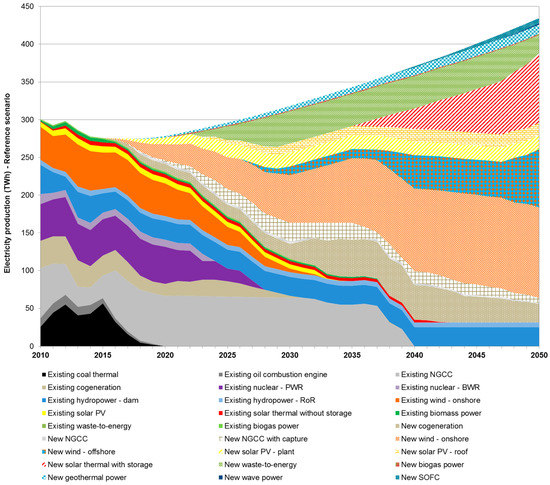
Figure 5.
Evolution of the Spanish electricity production mix: Reference scenario.
In addition to the behaviour of the existing power generation technologies within the Spanish mix, Figure 5 shows how electricity production starts growing prominently after 2020. In this respect, the emersion of new power generation technologies is dominated by renewable technologies, which is especially evident in the long term. In particular, new wind farms (both onshore—which involves mainly upscaling and repowering—and offshore) and solar thermal power plants (parabolic troughs with storage) play a leading role.
Figure 6 shows the evolution of the Spanish electricity production mix in the CCS scenario. This scenario includes the restriction of not installing new fossil capacity after 2030 unless CCS systems are implemented. This helps to observe the competition between renewable energy technologies and the deployment of CCS options.
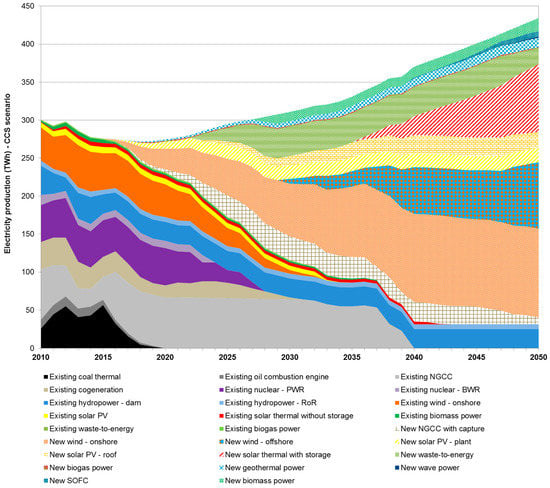
Figure 6.
Evolution of the Spanish electricity production mix: CCS scenario.
The results presented in Figure 6 suggest small sensitivity to restrictions in the use of fossil fuels. As it can be observed, constraining fossil-based technologies does not change significantly the electricity production mix since the high investment costs of fossil options with CCS lead to a preference for the entrance of renewable energy technologies. In this sense, even though the formulation of the scenario gives an a priori advantage to CCS systems, the contribution of NGCC with capture to the total electricity production hardly increases from 8% in the reference scenario to 10% in the CCS scenario in 2030. Regarding the substitution of natural gas cogeneration after 2030, it is faced by increasing wind (both onshore and offshore), solar PV and biomass-based power.
3.2. Long-Term Evolution of Life-Cycle Indicators
The LCIs of the list of technologies presented in Table 1 are implemented in SimaPro 8 [61]. Climate change (in kg CO2 eq), human health (in DALY, i.e., disability-adjusted life years) and resources (in MJ) are the damage categories evaluated using the IMPACT 2002+ method [36]. Table 2 presents the results calculated for the technologies involved in the current and future Spanish electricity production mix. It should be noted that Table 2 does not include all the technologies listed in Table 1 but only those that are found to contribute to the electricity production mix in the proposed energy scenarios (“reference” and “CCS”).

Table 2.
Life-cycle indicators of the power generation technologies involved in the energy system.
Technologies whose operation is based on the use of fossil fuels, especially coal and oil, generally show the highest values per functional unit in the three damage categories evaluated. On the other hand, both existing and new waste-to-energy power plants are free of any burdens since they involve a multifunctional system with 0% allocation to the energy production function and 100% allocation to the waste incineration service [62].
It should be noted that the performance of multiple LCAs (one per technology) involves multiple data and methodological choices that can differ significantly from alternative studies [63]. In this study, emphasis is laid on the harmonisation of methodological assumptions for the set of technologies rather than on the use of guidelines for general and/or specific power generation systems targeted mainly at non-scientific actors [64,65]. This can result in significant methodological differences e.g., when addressing CCS systems according to available product category rules (especially in terms of system boundaries and environmental indicators) [64]. Nevertheless, a relatively high degree of similarity is found in the case of product category rules for power generation technologies [65].
The integration of the life-cycle indicators into the power generation model enables the prospective analysis of the energy system’s sustainability performance. This section discusses the “evolved” profile of the life-cycle indicators for the two scenarios under study. Figure 7 shows the evolution of the selected damage categories per unit of electricity for the reference scenario according to the corresponding contribution of the existing and new technologies to the Spanish electricity production mix. Most of the climate change associated with the existing technologies is due to direct emissions that come mainly from the operation of coal thermal power plants in the initial years and then from the operation of NGCC plants. Concerning new technologies, overall, the main contributions to climate change are associated with the operation of new cogeneration plants and NGCC plants with capture, which are both characterised by the use of natural gas. The operation of the existing coal thermal power plants also dominates initially the human health category, reaching a peak value of ca. 250 DALY·TWh−1 in 2015. A marked decrease in this damage category is observed in the period 2015–2020. In the long term, new cogeneration and solar thermal power plants play a leading role in this category, which is linked to the burning of natural gas (main or auxiliary fuel). Finally, the resources category evolves similarly to climate change but with an important additional contribution from the existing nuclear power plants due to the need for uranium.
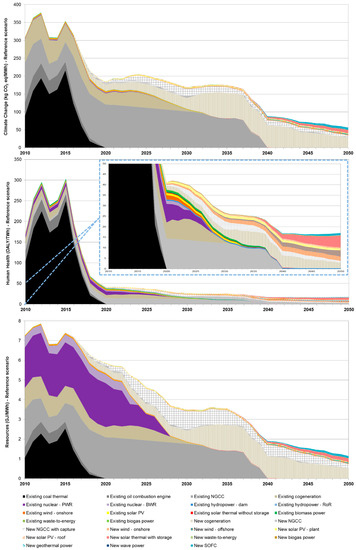
Figure 7.
Evolution of life-cycle indicators of the Spanish electricity production mix: Reference scenario.
Figure 8 shows the evolved profile of the life-cycle indicators in the CCS scenario. Regarding the existing technologies, the evolution of the three damage categories shows the same trend as in the reference scenario. On the other hand, regarding new technologies, the assumed restriction—no new fossil technologies beyond 2030 unless CCS is deployed—leads to rule out (among others) new cogeneration plants and thus to an increased contribution of the new NGCC plants with capture to all damage categories, especially to the resources category due to the energy penalty of the CO2 capture technology. Nevertheless, despite the higher presence of new NGCC plants with capture, the restriction on fossil-based technologies makes the model install more renewable power plants, enhancing the damage profile of this scenario (especially beyond 2040) and suggesting the preference for renewables over fossil technologies with CO2 capture under sustainability aspects.
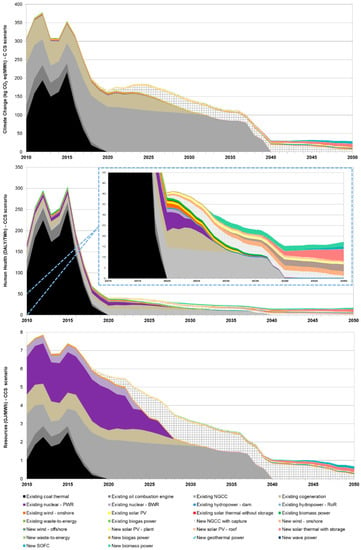
Figure 8.
Evolution of life-cycle indicators of the Spanish electricity production mix: CCS scenario.
Finally, it should be noted that the proposed methodological improvement—the endogenous integration of life-cycle indicators into ESM—shows technical limitations in terms of potential double counting of emissions and electricity import/export imbalances [35]. In this sense, the harmonisation of the processes regarding system boundaries is critical due to the different nature of LCA and ESM entities (flows, technologies, parameters, variables, etc.). Nevertheless, while the improvement of technologies is considered via ESM (changes in efficiencies, costs and capacity factors according to learning curves), the LCA profile remains unchanged because of the use of static LCI data. Consequently, it is not accurate to claim for consequential LCA but for the prospective analysis of the life-cycle consequences of future electricity production mixes. This soft-linking strategy constitutes a further step in the search for robust ESM/LCA integration.
4. Conclusions
A novel optimisation-based model for the Spanish electricity production mix was built on LEAP-OSeMOSYS architecture. Furthermore, this energy model was hybridised with the LCA methodology through the endogenous integration of a set of relevant life-cycle indicators of the existing and new power generation technologies involved in the current and future Spanish electricity production mix. The key strength of this approach is the facilitation of decision-making processes by directly obtaining prospective techno-economic and life-cycle results. In this sense, the usefulness of ESM and LCA for decision-making support is improved in both directions (ESM ↔ LCA). Nevertheless, further efforts are still required to strengthen this synergistic effect, especially regarding hard-linking strategies focused on LCI integration into ESM frameworks thereby mitigating the consequences of uncertainty propagation.
The hybridisation of ESM and LCA enabled a sound prospective analysis of the holistic performance of the Spanish electricity production mix. The two energy scenarios projected to 2050 showed the leading role of renewables (mainly wind and solar power) in terms of electricity production in the mid/long-term. Regarding the short term, a soft transition from coal and nuclear power plants to natural gas-based plants was found. Despite the high presence of renewable power generation technologies, non-renewable technologies were identified as the main contributors to the life-cycle damage categories. Finally, when forbidding the use of new fossil technologies without CO2 capture beyond 2030, a minor increase in the presence of fossil technologies with capture was predicted, in contrast to the high installation of renewable technologies leading to an enhanced life-cycle profile of the Spanish electricity production mix. This indicates a preference for renewables over fossil technologies with CO2 capture under sustainability aspects. In this sense, the endogenous integration of life-cycle indicators into energy models is useful to facilitate sensible decision- and policy-making processes in the field of energy planning.
Acknowledgments
The authors would like to thank the Regional Government of Madrid (S2013/MAE-2882) for financial support regarding the initial development of the model. The authors would also like to thank Ignacio Encinas and Jasson Suárez for valuable scientific exchange.
Author Contributions
Both Diego García-Gusano and Mario Martín-Gamboa contributed equally to (i) the development of the national power generation model; (ii) the calculation of the life-cycle profiles of the power generation technologies involved; (iii) the hybridisation of energy systems modelling and life cycle assessment; and (iv) the analysis of the results. Diego Iribarren contributed mainly to (ii), (iii), and (iv). Javier Dufour supervised the research activity and contributed significantly to (iii).
Conflicts of Interest
The authors declare no conflict of interest.
References
- Bliesner, A.; Liedtke, C.; Welfens, M.J.; Baedeker, C.; Hasselkuß, M.; Rohn, H. “Norm-oriented interpretation learning” and resource use: The concept of “open-didactic exploration” as a contribution to raising awareness of a responsible resource use. Resources 2014, 3, 1–30. [Google Scholar] [CrossRef]
- Liedtke, C.; Bienge, K.; Wiesen, K.; Teubler, J.; Greiff, K.; Lettenmeier, M.; Rohn, H. Resource use in the production and consumption system—The MIPS approach. Resources 2014, 3, 544–574. [Google Scholar] [CrossRef]
- Bahn-Walkowiak, B.; Steger, S. Resource targets in Europe and worldwide: An overview. Resources 2015, 4, 597–620. [Google Scholar] [CrossRef]
- Huysman, S.; Sala, S.; Mancini, L.; Ardente, F.; Alvarenga, R.A.F.; De Meester, S.; Mathieux, F.; Dewulf, J. Toward a systematized framework for resource efficiency indicators. Resour. Conserv. Recycl. 2015, 95, 68–76. [Google Scholar] [CrossRef]
- Pehnt, M. Dynamic life cycle assessment (LCA) of renewable energy technologies. Renew. Energy 2006, 31, 55–71. [Google Scholar] [CrossRef]
- Collinge, W.O.; Landis, A.E.; Jones, A.K.; Schaefer, L.A.; Bilec, M.M. Dynamic life cycle assessment: Framework and application to an institutional building. Int. J. Life Cycle Assess. 2013, 18, 538–552. [Google Scholar] [CrossRef]
- Loulou, R.; Van Regemorter, D. Deliverable n° 4.2—RS. In Final Report on the Harmonization of Methodologies; European Commission: Brussels, Belgium, 2008. [Google Scholar]
- Pietrapertosa, F.; Cosmi, C.; Macchiato, M.; Salvia, M.; Cuomo, V. Life cycle assessment, ExternE and comprehensive analysis for an integrated evaluation of the environmental impact of anthropogenic activities. Renew. Sustain. Energy Rev. 2009, 13, 1039–1048. [Google Scholar] [CrossRef]
- Preiss, P.; Bachmann, T.M. External costs of electrification of road transport: Approach and setting-dependency. In Proceedings of the SETAC Europe 26th Annual Meeting, Nantes, France, 22–26 May 2016.
- Menten, F.; Tchung-Ming, S.; Lorne, D.; Bouvart, F. Lessons from the use of a long-term energy model for consequential life cycle assessment: The BTL case. Renew. Sustain. Energy Rev. 2015, 43, 942–960. [Google Scholar] [CrossRef]
- Herbst, A.; Toro, F.; Reitze, F.; Jochem, E. Introduction to energy systems modelling. Swiss J. Econ. Stat. 2012, 148, 111–135. [Google Scholar]
- Lund, H.; Mathiesen, B.V.; Christensen, P.; Schmidt, J.H. Energy system analysis of marginal electricity supply in consequential LCA. Int. J. Life Cycle Assess. 2010, 15, 260–271. [Google Scholar] [CrossRef]
- Gibon, T.; Wood, R.; Arvesen, A.; Bergesen, J.D.; Suh, S.; Hertwich, E.G. A methodology for integrated, multiregional life cycle assessment scenarios under large-scale technological change. Environ. Sci. Technol. 2015, 49, 11218–11226. [Google Scholar] [CrossRef] [PubMed]
- Heaps, C.G. Long-range Energy Alternatives Planning (LEAP) System (Software Version 2015.0.27). Available online: https://www.energycommunity.org (accessed on 13 September 2016).
- Colombo, E.; Rocco, M.V.; Toro, C.; Sciubba, E. An exergy-based approach to the joint economic and environmental impact assessment of possible photovoltaic scenarios: A case study at a regional level in Italy. Ecol. Model. 2015, 318, 64–74. [Google Scholar] [CrossRef]
- Orsi, F.; Muratori, M.; Rocco, M.; Colombo, E.; Rizzoni, G. A multi-dimensional well-to-wheels analysis of passenger vehicles in different regions: Primary energy consumption, CO2 emissions, and economic cost. Appl. Energy 2016, 169, 197–209. [Google Scholar] [CrossRef]
- Ekvall, T. Cleaner production tools: LCA and beyond. J. Clean. Prod. 2002, 10, 403–406. [Google Scholar] [CrossRef]
- Wene, C.O. Energy-economy analysis: Linking the macroeconomic and systems engineering approaches. Energy 1996, 21, 809–824. [Google Scholar] [CrossRef]
- Helgesen, P.I. Top-Down and Bottom-up: Combining Energy System Models and Macroeconomic General Equilibrium Models; CenSES: Trondheim, Norway, 2013. [Google Scholar]
- Manne, A.S.; Wene, C.O. MARKAL-MACRO: A Linked Model for Energy-Economy Analysis; Brookhaven National Laboratory: Upton, NY, USA, 1992. [Google Scholar]
- Böhringer, C.; Rutherford, T.F. Combining bottom-up and top-down. Energy Econ. 2008, 30, 574–596. [Google Scholar] [CrossRef]
- Portugal-Pereira, J.; Köberle, A.C.; Soria, R.; Lucena, A.F.P.; Szklo, A.; Schaeffer, R. Overlooked impacts of electricity expansion optimisation modelling: The life cycle side of the story. Energy 2016. [Google Scholar] [CrossRef]
- Plevin, R.J.; Delucchi, M.A.; Creutzig, F. Using attributional life cycle assessment to estimate climate-change mitigation benefits misleads policy makers. J. Ind. Ecol. 2014, 18, 73–83. [Google Scholar] [CrossRef]
- EURELECTRIC. Efficiency in Electricity Generation; Union of the Electricity Industry—EURELECTRIC: Brussels, Belgium, 2003. [Google Scholar]
- Carlsson, J. ETRI 2014—Energy Technology Reference Indicator Projections for 2010–2050; European Commission: Luxembourg, 2014. [Google Scholar]
- ETSAP. International Energy Agency—Energy Technology Systems Analysis Program. Available online: http://www.iea-etsap.org (accessed on 13 September 2016).
- Ajanovic, A.; Dahl, C.; Schipper, L. Modelling transport (energy) demand and policies—An introduction. Energy Policy 2012, 41, 3–16. [Google Scholar]
- INE. Proyección de la Población de España 2014–2064. Available online: http://www.ine.es/prensa/np870.pdf (accessed on 13 September 2016).
- Capros, P.; De Vita, A.; Tasios, N.; Papadopoulos, D.; Siskos, P.; Apostolaki, E.; Zampara, M.; Paroussos, L.; Fragiadakis, K.; Kouvaritakis, N.; et al. EU Energy, Transport and GHG Emissions—Trends to 2050—Reference Scenario 2013; European Commission: Luxembourg, 2013. [Google Scholar]
- Howells, M.; Rogner, H.; Strachan, N.; Heaps, C.; Huntington, H.; Kypreos, S.; Hughes, A.; Silveira, S.; DeCarolis, J.; Bazillian, M.; et al. OSeMOSYS: The Open Source Energy Modeling System—An introduction to its ethos, structure and development. Energy Policy 2011, 39, 5850–5870. [Google Scholar] [CrossRef]
- European Council. EUCO 169/14 Conclusions—23/24 October 2014; European Council: Brussels, Belgium, 2014. [Google Scholar]
- United Nations Framework Convention on Climate Change. Adoption of the Paris Agreement; UNFCC: Paris, France, 2015. [Google Scholar]
- International Organization for Standardization. ISO 14040:2006 Environmental Management—Life Cycle Assessment—Principles and Framework; ISO: Geneva, Switzerland, 2006. [Google Scholar]
- International Organization for Standardization. ISO 14044:2006 Environmental Management—Life Cycle Assessment—Requirements and Guidelines; ISO: Geneva, Switzerland, 2006. [Google Scholar]
- García-Gusano, D.; Iribarren, D.; Martín-Gamboa, M.; Dufour, J.; Espegren, K.; Lind, A. Integration of life-cycle indicators into energy optimisation models: The case study of power generation in Norway. J. Clean. Prod. 2016, 112, 2693–2696. [Google Scholar] [CrossRef]
- Jolliet, O.; Margni, M.; Charles, R.; Humbert, S.; Payet, J.; Rebitzer, G.; Rosenbaum, R. IMPACT 2002+: A new life cycle impact assessment methodology. Int. J. Life Cycle Assess. 2003, 8, 324–330. [Google Scholar] [CrossRef]
- Troy, S.; Schreiber, A.; Zapp, P. Life cycle assessment of membrane-based carbon capture and storage. Clean Technol. Environ. Policy 2016, 18, 1641–1654. [Google Scholar] [CrossRef]
- Bauer, C. Life Cycle Assessment of Fossil and Biomass Power Generation Chains; PSI: Villigen, Switzerland, 2008. [Google Scholar]
- Cormos, C.C. Integrated assessment of IGCC power generation technology with carbon capture and storage (CCS). Energy 2012, 42, 434–445. [Google Scholar] [CrossRef]
- Fadeyi, S.; Arafat, H.A.; Abu-Zahra, M.R.M. Life cycle assessment of natural gas combined cycle integrated with CO2 post combustion capture using chemical solvent. Int. J. Greenh. Gas Control 2013, 19, 441–452. [Google Scholar] [CrossRef]
- Science Applications International Corporation; Research and Development Solutions. Life Cycle Analysis: Natural Gas Combined Cycle (NGCC) Power Plant; National Energy Technology Laboratory: Pittsburgh, PA, USA, 2012. [Google Scholar]
- Kunakemakorn, J.; Wongsuchoto, P.; Pavasant, P.; Laosiripojana, N. Greenhouse gas emission of European pressurized reactor (EPR) nuclear power plant technology: A life cycle approach. J. Sustain. Energy Environ. 2011, 2, 45–50. [Google Scholar]
- Ashley, S.F.; Fenner, R.A.; Nuttall, W.J.; Parks, G.T. Life-cycle impacts from novel thorium–uranium-fuelled nuclear energy systems. Energy Convers. Manag. 2015, 101, 136–150. [Google Scholar] [CrossRef]
- Tokimatsu, K.; Hondo, H.; Ogawa, Y.; Okano, K.; Yamaji, K.; Katsurai, M. Energy analysis and carbon dioxide emission of Tokamak fusion power reactors. Fusion Eng. Des. 2000, 48, 483–498. [Google Scholar] [CrossRef]
- Kelly, K.A.; McManus, M.C.; Hammond, G.P. An energy and carbon life cycle assessment of industrial CHP (combined heat and power) in the context of a low carbon UK. Energy 2014, 77, 812–821. [Google Scholar] [CrossRef]
- Flury, K.; Frischknecht, R. Life Cycle Inventories of Hydroelectric Power Generation; ESU-Services: Uster, Switzerland, 2012. [Google Scholar]
- Ghandehariun, S.; Kumar, A. Life cycle assessment of wind-based hydrogen production in Western Canada. Int. J. Hydrog. Energy 2016, 41, 9696–9704. [Google Scholar] [CrossRef]
- Raadal, H.L.; Vold, B.I.; Myhr, A.; Nygaard, T.A. GHG emissions and energy performance of offshore wind power. Renew. Energy 2014, 66, 314–324. [Google Scholar] [CrossRef]
- Uihlein, A. Life cycle assessment of ocean energy technologies. Int. J. Life Cycle Assess. 2016, 21, 1425–1437. [Google Scholar] [CrossRef]
- Dahlsten, H. Life Cycle Assessment of Electricity from Wave Power; Swedish University of Agricultural Sciences: Uppsala, Sweden, 2009. [Google Scholar]
- Frischknecht, R.; Itten, R.; Sinha, P.; de Wild-Scholten, M.; Zhang, J.; Fthenakis, V.; Kim, H.C.; Raugei, M.; Stucki, M. Life Cycle Inventories and Life Cycle Assessments of Photovoltaic Systems—Report IEA-PVPS T12–04:2015; International Energy Agency: Paris, France, 2015. [Google Scholar]
- Corona, B.; San Miguel, G.; Cerrajero, E. Life cycle assessment of concentrated solar power (CSP) and the influence of hybridising with natural gas. Int. J. Life Cycle Assess. 2014, 19, 1264–1275. [Google Scholar] [CrossRef]
- Kuenlin, A.; Augsburger, G.; Gerber, L.; Maréchal, F. Life cycle assessment and environomic optimization of concentrating solar thermal power plants. In Proceedings of the 26th International Conference on Efficiency, Costs, Optimization, Simulation and Environmental Impact of Energy Systems, Guilin, China, 15–19 July 2013.
- Martín-Gamboa, M.; Iribarren, D.; Dufour, J. On the environmental suitability of high-and low-enthalpy geothermal systems. Geothermics 2015, 53, 27–37. [Google Scholar]
- González-García, S.; Iribarren, D.; Susmozas, A.; Dufour, J.; Murphy, R.J. Life cycle assessment of two alternative bioenergy systems involving Salix spp. biomass: Bioethanol production and power generation. Appl. Energy 2012, 95, 111–122. [Google Scholar] [CrossRef]
- Cherubini, F.; Bargigli, S.; Ulgiati, S. Life cycle assessment (LCA) of waste management strategies: Landfilling, sorting plant and incineration. Energy 2009, 34, 2116–2123. [Google Scholar] [CrossRef]
- Quirós, R.; Gabarrell, X.; Villalba, G.; Barrena, R.; García, A.; Torrente, J.; Font, X. The application of LCA to alternative methods for treating the organic fiber produced from autoclaving unsorted municipal solid waste: Case study of Catalonia. J. Clean. Prod. 2015, 107, 516–528. [Google Scholar] [CrossRef]
- Joos, N.; Hydrogenics, San Diego, CA, USA. Personal communication, 2014.
- Strazza, C.; Del Borghi, A.; Costamagna, P.; Gallo, M.; Brignole, E.; Girdinio, P. Life Cycle Assessment and Life Cycle Costing of a SOFC system for distributed power generation. Energy Convers. Manag. 2015, 100, 64–77. [Google Scholar] [CrossRef]
- Frischknecht, R.; Jungbluth, N.; Althaus, H.J.; Doka, G.; Heck, T.; Hellweg, S.; Hischier, R.; Nemecek, T.; Rebitzer, G.; Spielmann, M.; et al. Overview and Methodology—Ecoinvent Report No. 1; Swiss Centre for Life Cycle Inventories: Dübendorf, Switzerland, 2007. [Google Scholar]
- Goedkoop, M.; Oele, M.; Leijting, J.; Ponsioen, T.; Meijer, E. Introduction to LCA with SimaPro; PRé Consultants: Amersfoort, The Netherlands, 2013. [Google Scholar]
- Doka, G. Life Cycle Inventories of Waste Treatment Services—Ecoinvent Report No. 13; Swiss Centre for Life Cycle Inventories: Dübendorf, Switzerland, 2003. [Google Scholar]
- Strazza, C.; Del Borghi, A.; Gallo, M. Development of specific rules for the application of life cycle assessment to carbon capture and storage. Energies 2013, 6, 1250–1265. [Google Scholar] [CrossRef]
- The International EPD® System. PCR 2014:06 Carbon Capture and Storage (CCS) Systems; EPD: Stockholm, Sweden, 2014. [Google Scholar]
- The International EPD® System. PCR 2007:08 Electricity, Steam and Hot/Cold Water Generation and Distribution; EPD: Stockholm, Sweden, 2015. [Google Scholar]
© 2016 by the authors; licensee MDPI, Basel, Switzerland. This article is an open access article distributed under the terms and conditions of the Creative Commons Attribution (CC-BY) license (http://creativecommons.org/licenses/by/4.0/).