Article

Forward-Flyback Resonant Topology with Edge AI for MPPT Control in Solar Power Generation

1
Department of Electronics and Computer Technology, Faculty of Sciences, University of Granada, 18071 Granada, Spain
2
HTEC GmbH, Leipziger Str. 16, 82008 Unterhaching, Germany
3
Infineon Technologies AG, Am Campeon, 85579 Neubiberg, Germany
*
Author to whom correspondence should be addressed.
J. Low Power Electron. Appl. 2026, 16(2), 13; https://doi.org/10.3390/jlpea16020013
Submission received: 18 February 2026 / Revised: 5 April 2026 / Accepted: 10 April 2026 / Published: 12 April 2026
(This article belongs to the Special Issue 15th Anniversary of Journal of Low Power Electronics and Applications)

Abstract

Distributed energy systems open up a vast field of research in power electronics. Local solar power generation requires DC-DC converters that adapt the energy generated by the panels to on-site distribution buses. In addition, the control of the power converter to obtain the maximum possible energy from the solar source is crucial for the correct deployment of these distributed grids. In this work, system-level solutions are proposed for this application as follows: On the one hand, the use of novel resonant forward-flyback converters allows for a higher energy density than that of a conventional flyback and more relaxed withstand voltages on the switching elements. On the other hand, the implementation of maximum power point tracking algorithms for solar energy using Edge AI enables the deployment of algorithms that maximize the energy obtained locally. These improvements are shown by means of a prototype demonstrator, using cutting-edge microcontrollers and the implementation of a DC-DC power converter based on the proposed topology.

1. Introduction

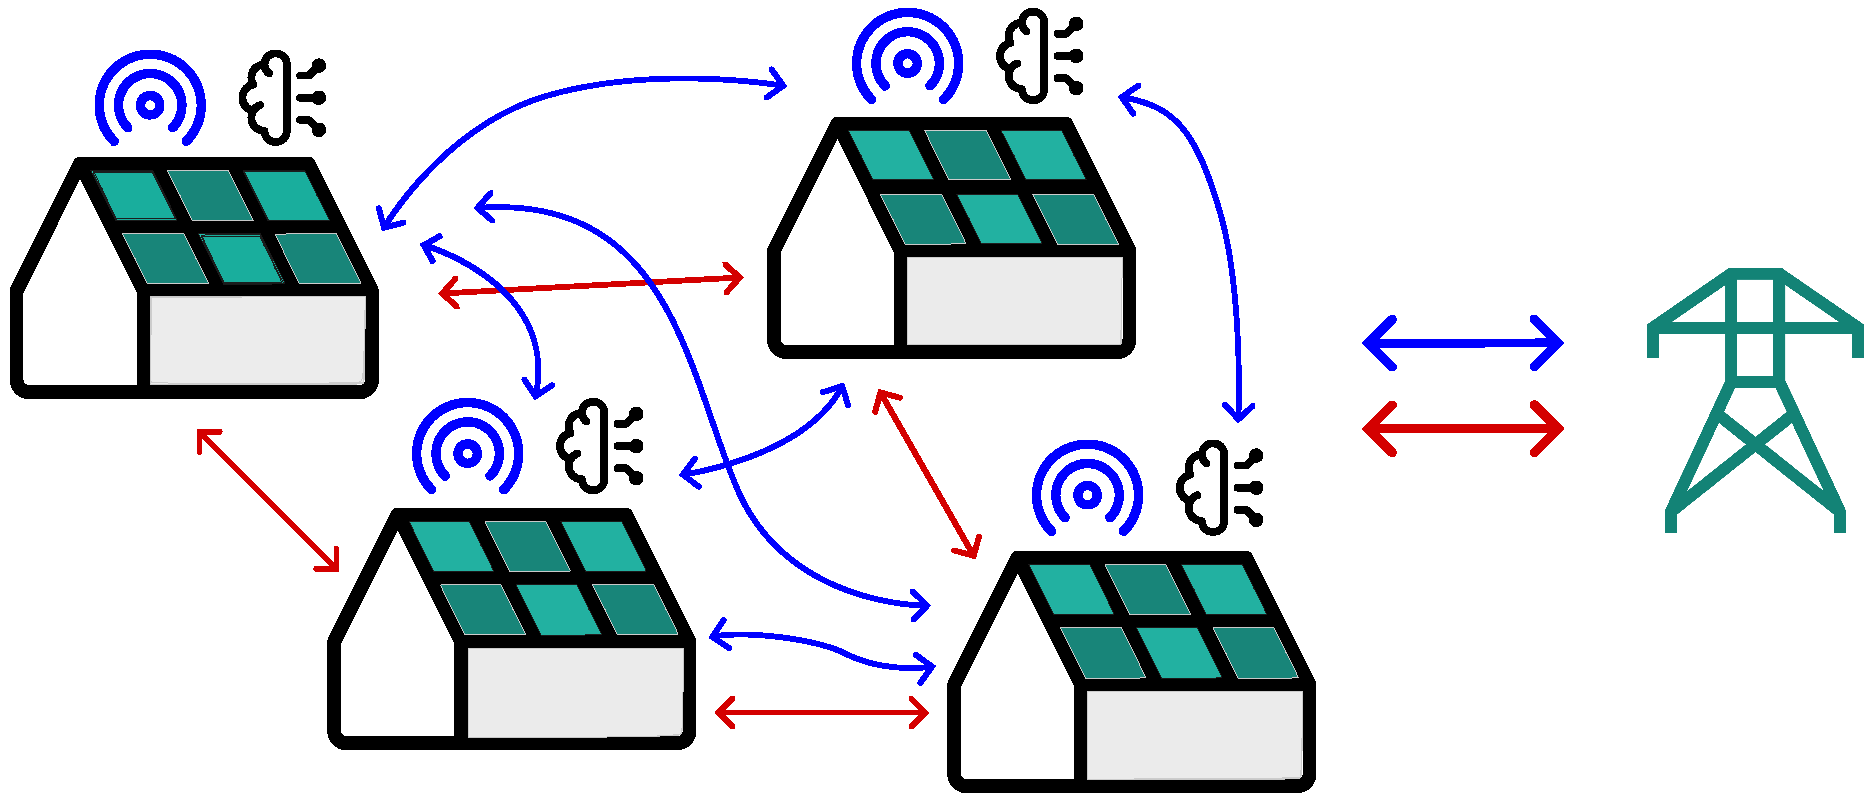
The use of renewable energies is continuously increasing, motivated by their technological improvement over time, their independence from fossil sources, and their reduced environmental impact, which has led to the creation of new electricity distribution paradigms [1]. This is the case of Distributed Renewable Energy Systems (DRESs), which, compared to classic centralized structures, allow for better energy management, which is more resistant to the changes in production inherent in green energies [2,3,4]. In particular, solar energy plays a major role thanks to its reduced cost, simplicity, modularity, and mass-scale replicability (Figure 1) [5,6].
Another typical use case for decentralized solar energy is vehicles that incorporate solar panels to increase their driving range. Despite the technological challenge they pose, there are technical motivations for its development, as follows: the constant introduction of electric vehicles in the market, improvements in the energy efficiency and design of photovoltaic (PV) solar cells, and advances in lighter materials in automobiles [7,8]. This has led to these vehicles becoming a reality, either through Vehicle-Added PV (VAPV)—which involves adding solar panels to existing vehicle designs, usually on the roof—or Vehicle-Integrated PV (VIPV)—which involves directly integrating solar cells into the vehicle body during manufacturing—[9]. Finally, solar energy allows remote systems to be connected to the standard grid, facilitating access to energy for aerospace applications [10], agricultural use [11,12], remote electric vehicle charging systems [13], and small isolated population areas [14].
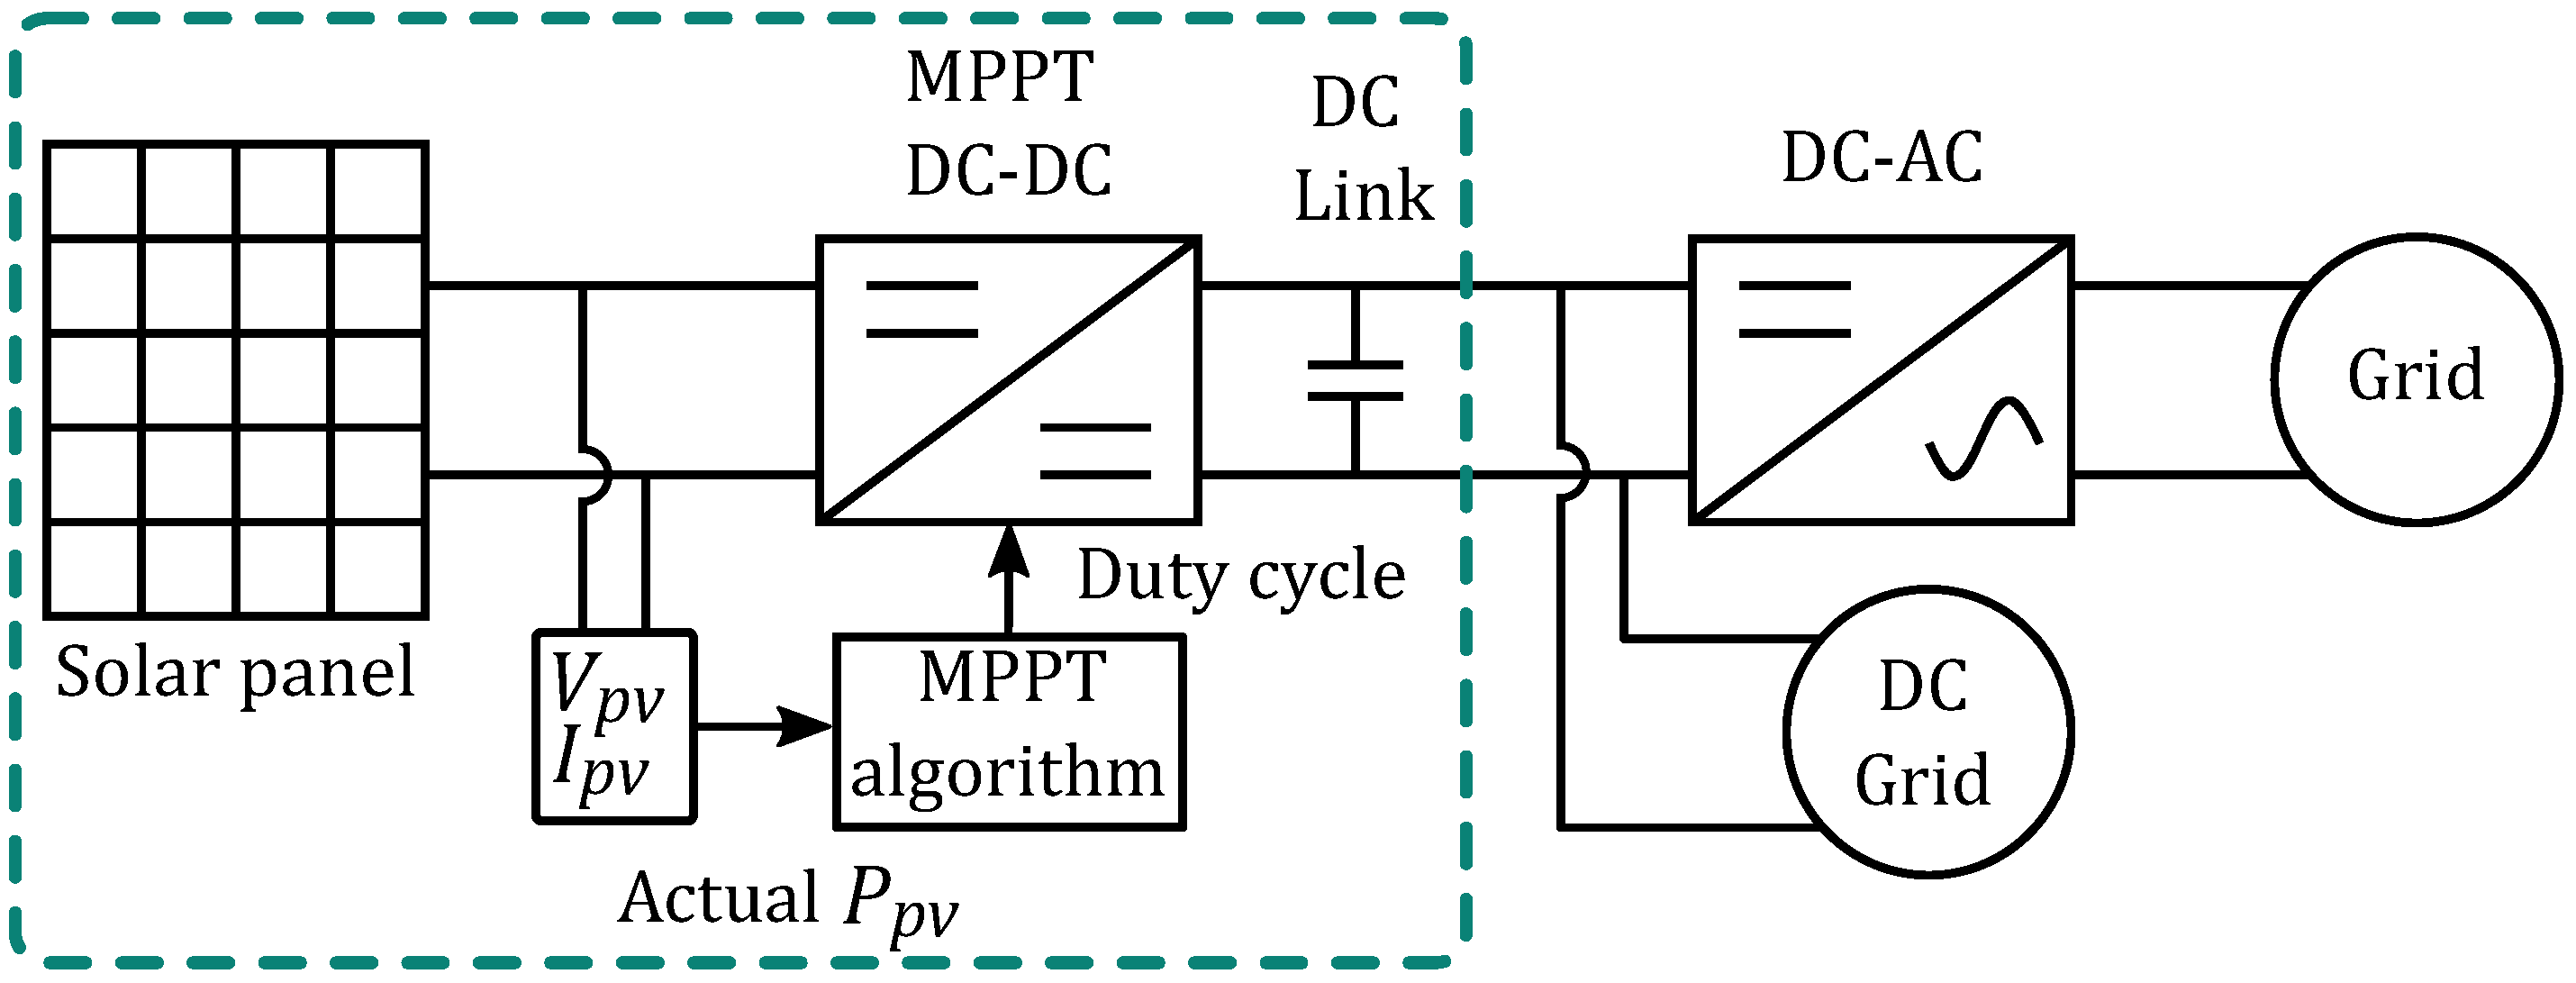
A common diagram for the implementation of the electronics necessary for solar generation is shown in Figure 2. The objective of this work is to improve the deployment of these distributed networks by focusing on the development of power converters for solar panels, solar energy forecasting, and predictive control of Maximum Power Point Tracking (MPPT) and its implementation via low consumption Edge AI, making local solar energy generation more viable and optimal.
In the following manuscript, the proposed state-of-the-art solutions will be presented from both a power and MPPT control perspective. Subsequently, the proposed topology and the Edge AI-based algorithm will be explained in order to achieve low-consumption control that allows for the maximum amount of solar energy to be obtained. The design of the proposed system will then be presented, and finally, the experimental results will be shown.

1.1. DC-DC Converters Used in Micro-Optimizers

Depending on the power system in place, different converter solutions will offer more advantages than others, as follows: big central inverter systems for several solar panels, string inverter systems, and more distributed solutions, such as small microinverters or DC optimizers built into individual panels [15]. This paper will focus on the last two, which represent the so-called module-level power electronics (MLPE). Specifically, they are divided into microinverters, with AC output, and solar power optimizers (SPOs) [16,17]. This distributed approach is highly effective because, in the event of shading circumstances, the energy obtained from each panel is maximized, without other panels having an effect, as occurs in more centralized solutions. In addition, the reliability of the system is increased because if one panel or converter fails, the rest can continue to operate without any problems. However, it requires voltage and current measurements at each panel, resulting in a massive dataset, and it increases the number of converters in the system [18].
There are plenty of topologies used for boost DC-DC conversion as a micro-optimizer in a DC grid, or as the DC-DC stage upstream of a microinverter, that are present in the state of the art [19]. Regarding the topologies based on non-isolated topologies, they have the problem of current leakage from solar panels and safety issues due to the non-presence of galvanic isolation [15].
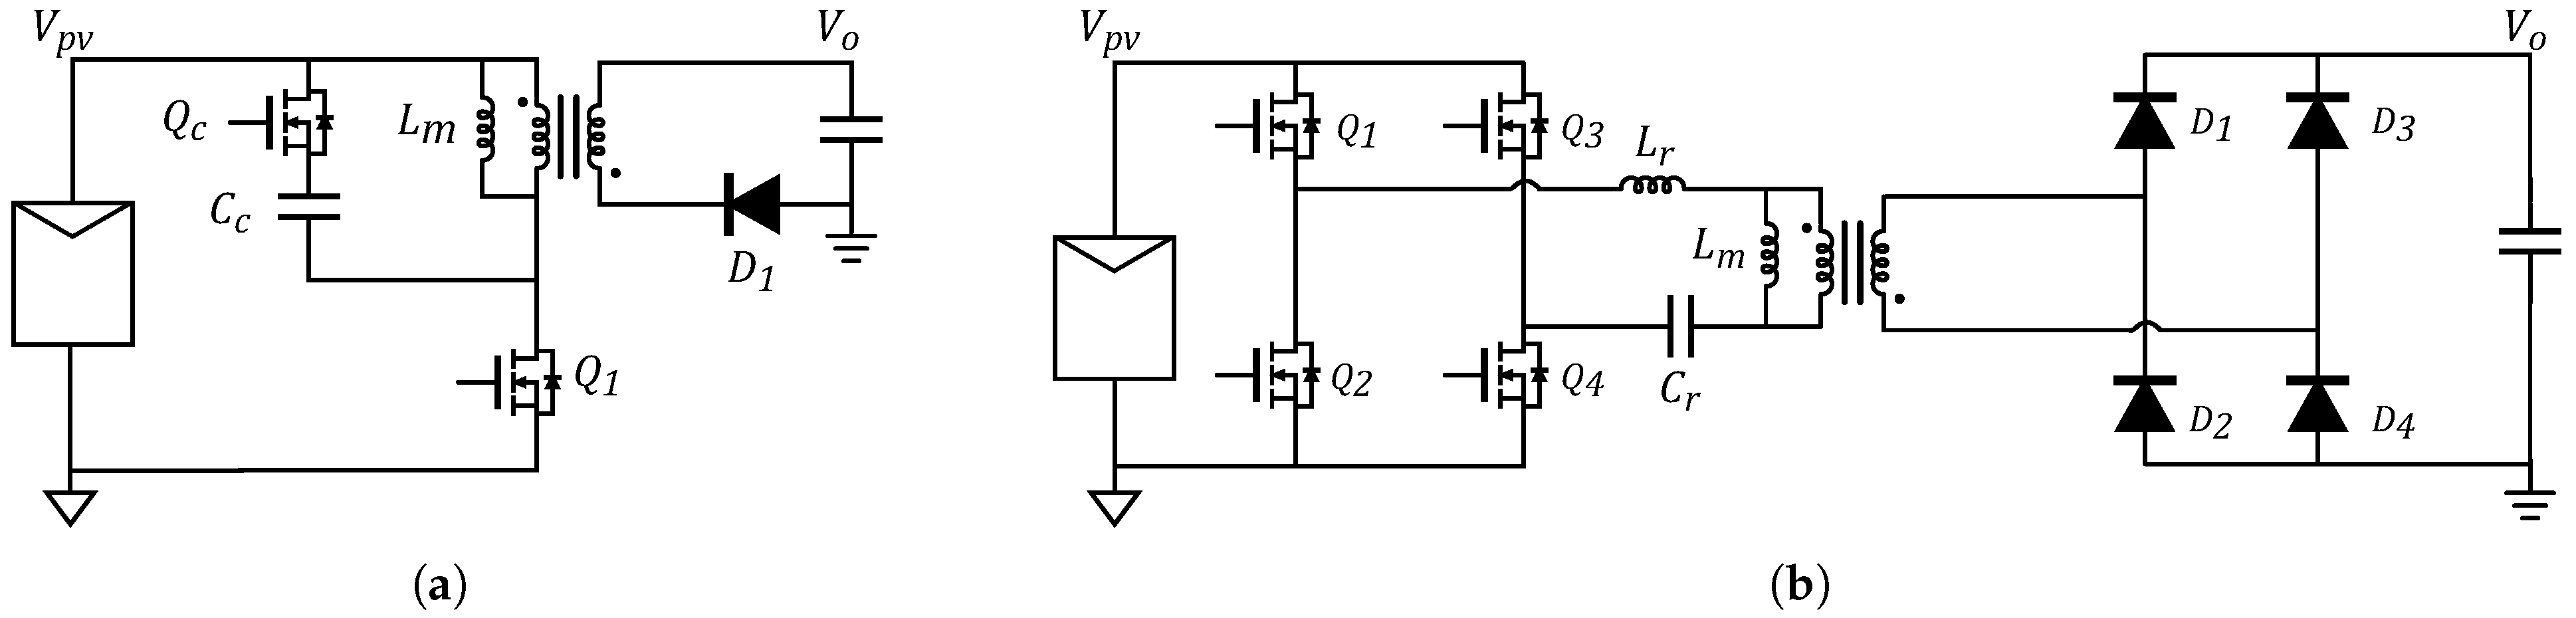
Regarding the isolated topologies, those that stand out most in industrial use are the ones based on the flyback converter because of its simple structure, low component count, high step-up ratio, simple control due to the existence of one active switch, and reliability [20,21]. However, to increase the efficiency of the flyback, there are resonant topologies that allow soft switching [22,23,24]. With these, high power densities can be achieved but at the cost of greater control complexity, especially in order to cover the operating range of a variable solar source under optimal converter operation, and a greater number of components. Examples of these topologies can be seen in Figure 3. In this paper, a type of hybrid topology will be studied, which takes advantage of resonant behavior to transmit energy more efficiently but also makes use of a flyback transformer for storage, which provides greater control versatility [25,26,27].

1.2. AI for MPPT

A key element of solar optimization is the control of the MPPT algorithm. There are many approaches to the MPPT algorithm for solar panel energy production using AI in the state of the art due to AI capabilities such as Artificial Neural Networks (ANN) to learn hidden patters and predict information based on them [28,29,30,31]. However, even as this technique has been studied by numerous authors, different input features for these AI models can be found in the literature. Most of the authors include in these variables the irradiance and temperature due to their high correlation with the energy production of solar panels [28,30]. Nevertheless, measured irradiance values add challenges and limitations to the system such as the cost of this sensor as well as the fact that, due to external factors such as dust in the air, the measurement may differ between the solar panel and the sensor. Due to this, other authors estimate the irradiance values to later use it for the MPPT algorithm [29,31]. Lastly, approaches based only on voltage and current can also be found in the literature to avoid the previously mentioned challenges [32,33,34].
In this paper, we focused on developing an AI technique for MPPT tracking to control the duty cycle of the previously mentioned hybrid flyback-based converter using measurements that can be extracted directly from the solar panel (voltage and current) and from the temperature of the environment. These features, different from the irradiance, can be easily measured and are not greatly affected by external factors that would lead to a difference between the solar panel data and the collected data. The proposed tool uses an initial ANN model for the prediction of an initial estimate that is later used as the starting point for a traditional Perturbate and Observate (P&O) algorithm [35] to speed up the optimal duty cycle calculation.

2. Derivation and Operation Principle of the Proposed Converter

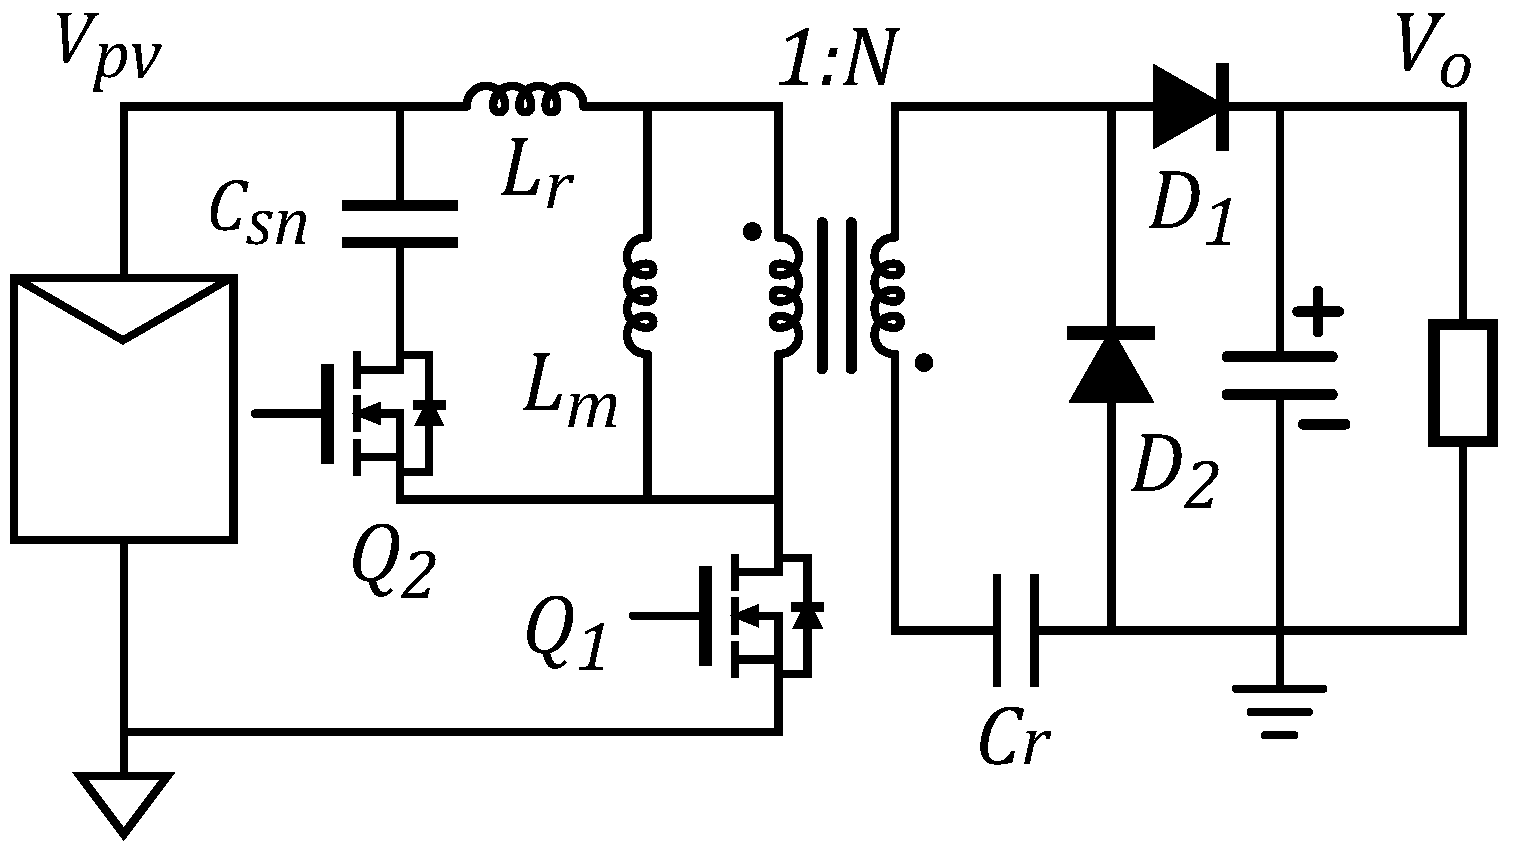
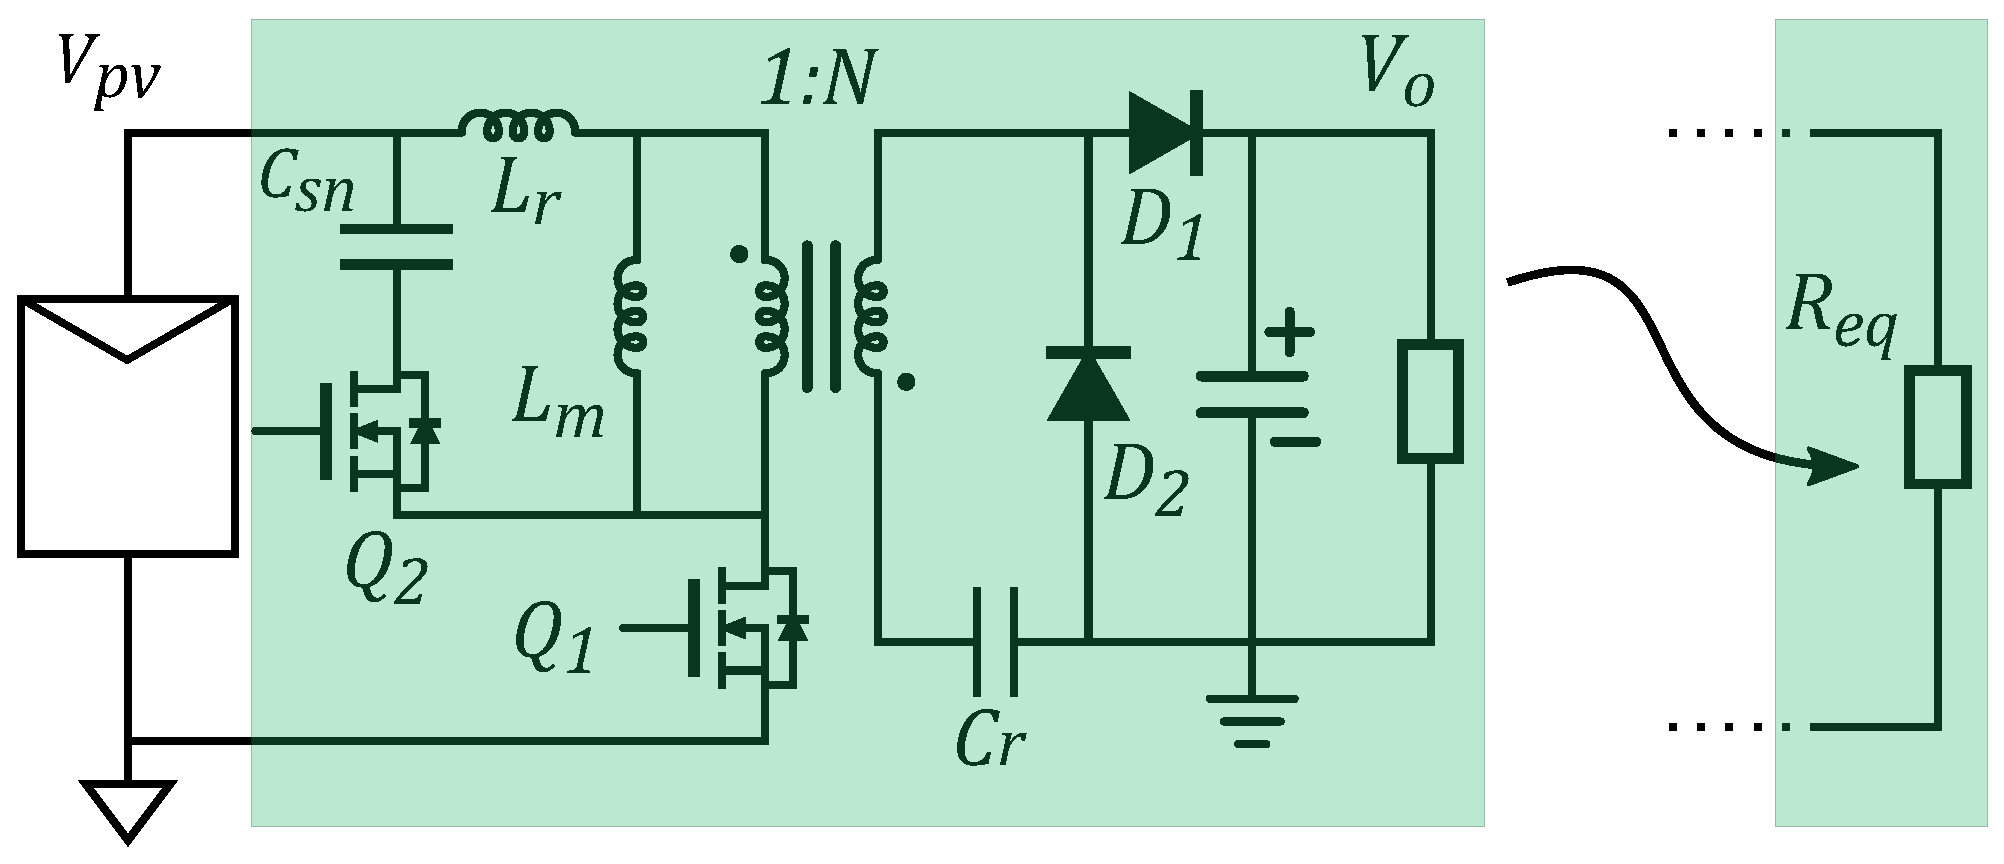
The converter topology chosen for the proposed system is an Active Clamp Forward-Flyback (ACFF) as shown in Figure 4. The circuit consists of a flyback converter structure to which diode D 2 and capacitor C r are added. Thanks to this addition, this topology offers advantages over a normal flyback, allowing energy to be transferred in a resonant manner, thus helping to recycle the energy from the leakage inductance of the transformer (which acts as L r ), as well as providing soft switching behavior [36]. In addition, this works proposes the addition of an active clamp ( Q 2 + C s n ) [37]; this prevents voltage spikes when switching off Q 1 and uses this energy to transfer it to the converter output, allowing switching at higher frequencies than with a passive snubber and, therefore, increasing efficiency and power density.
A series of approximations are made to facilitate the theoretical analysis of the topology as follows [25,26]:
  • Components are considered ideal and their parasitic elements are neglected, except for the calculation of the losses.
  • Dead times to achieve ZVS, as will be explained, are considered to be much shorter than the switching period and is not taken into account when calculating the operating frequency.
  • The voltage ripple across resonant capacitors C r and C s n is disregarded, and a constant DC value is assumed.
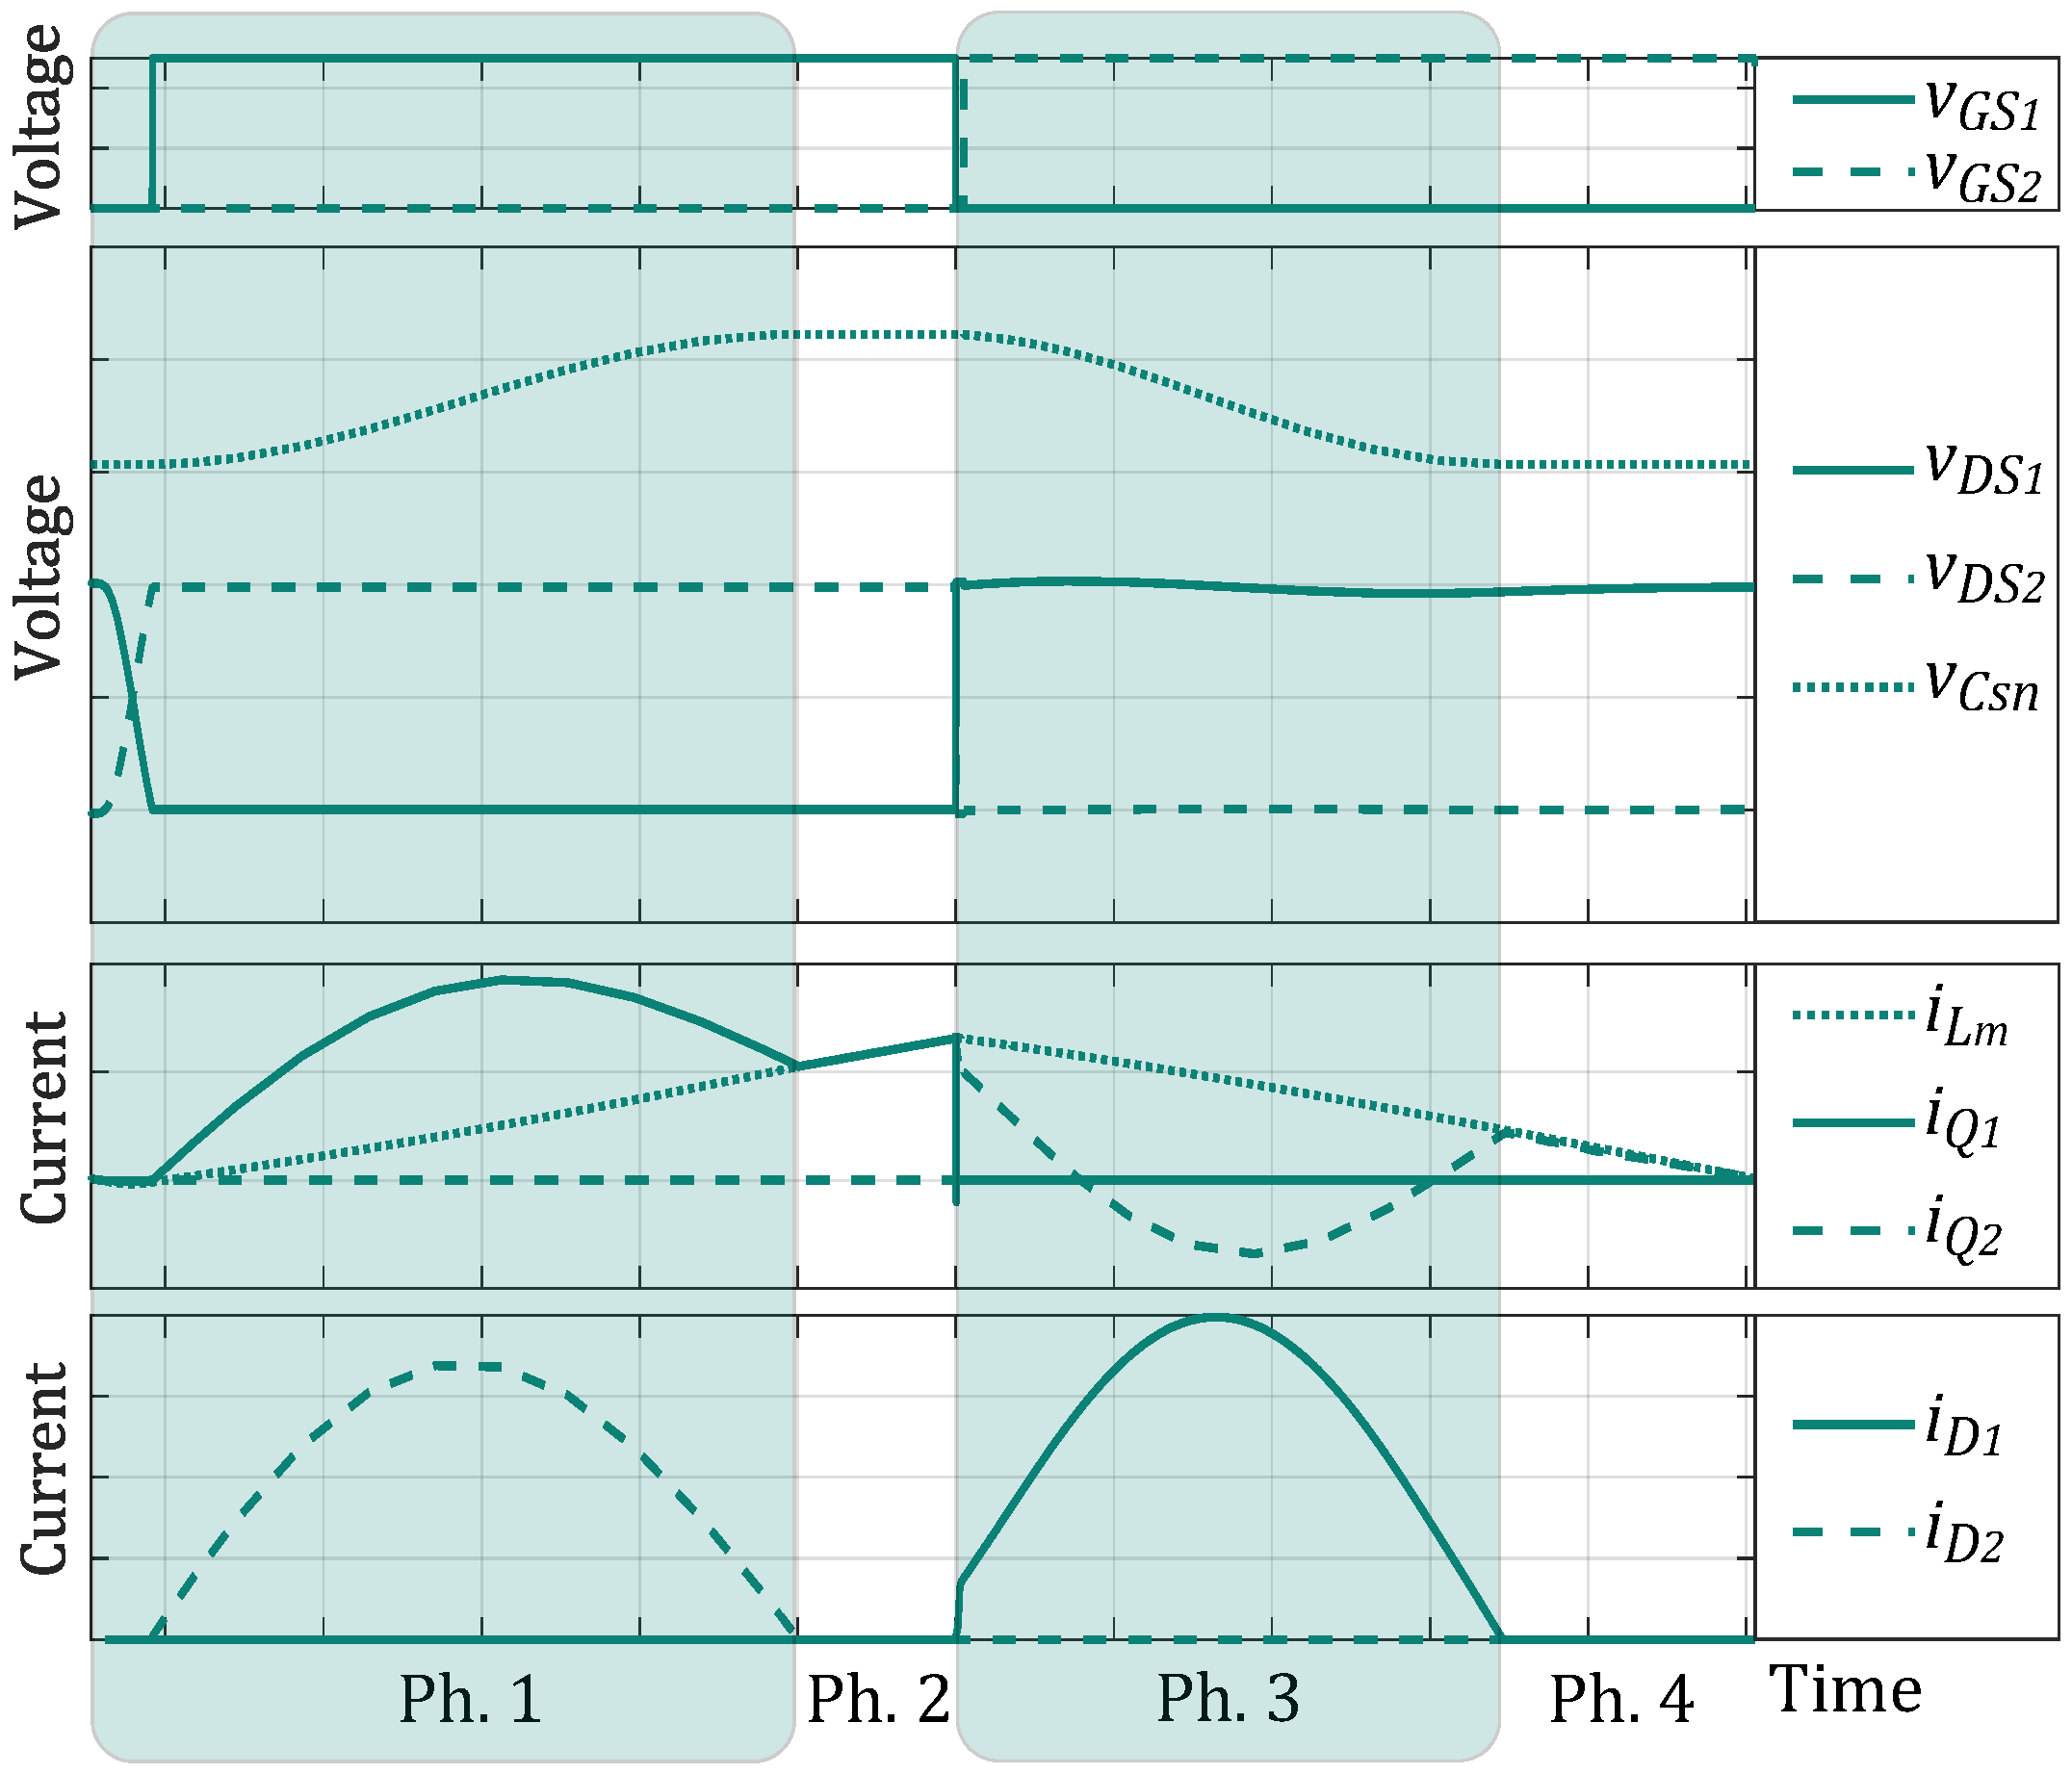
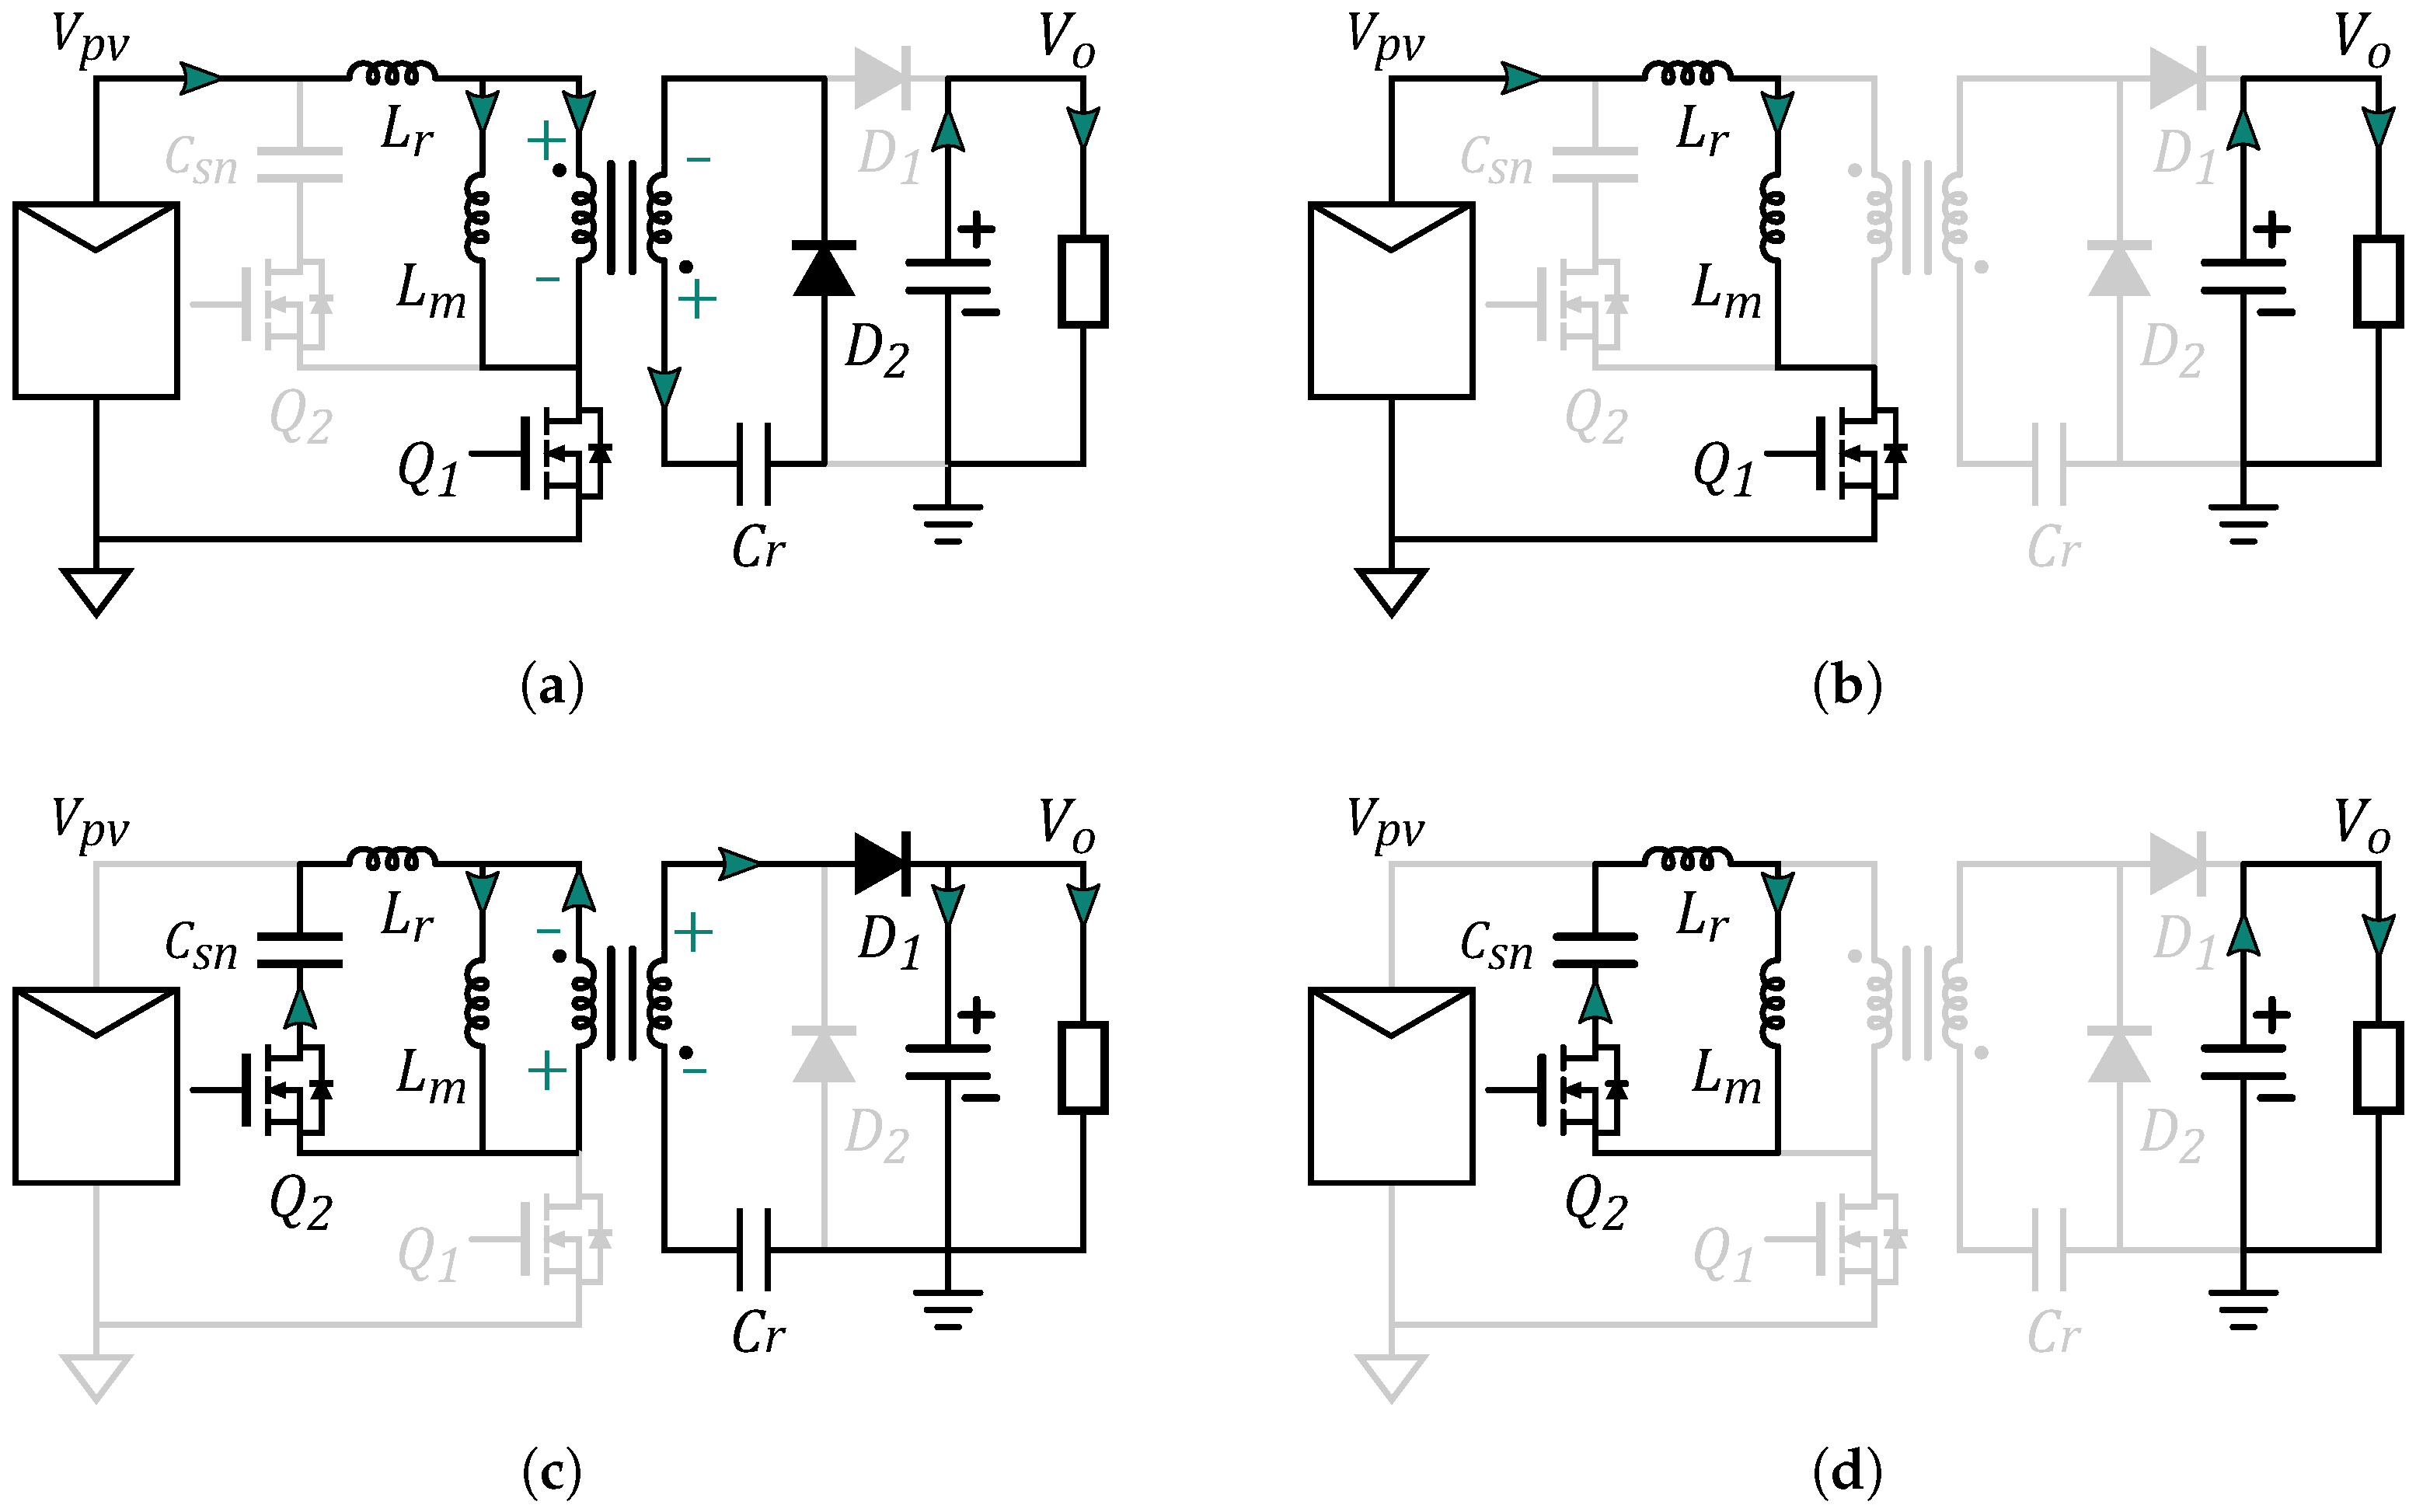
The stages of operation of the topology, whose voltage and current waveforms are found in Figure 5, can be summarized in the following four main phases of energy flow:
  • Phase 1: Figure 6a—During this phase, Q 1 is turned on. Due to the polarity of D 2 , which is forward-biased, resonance occurs between the L r inductance and resonant capacitor C r , which is charged. This resonance frequency is given by Equation (1). Since V p v is applied to the magnetizing inductance of the transformer L m , it is also energized. On the other hand, D 1 is reverse-biased, so there is no transfer of energy to the output.
    f r = 1 2 π L r C r · N 2
  • Phase 2: Figure 6b—The current through D 2 naturally becomes 0 due to its resonant behavior, resulting in Zero Current Switching (ZCS). Q 1 remains turned on for a period of time that allows L m to continue charging according to the needs of the converter, as occurs in a normal flyback. In this way, the total energy charging time ( t c ) will be given by Equation (2), depending on the peak-to-peak current across L m ( I p p ) needed to transfer the required energy to the output.
    t c = I p p L m V p v
  • Phase 3: Figure 6c—Now the energy transfer takes place. After turning off Q 1 , and after a brief period of time to reach Zero Voltage Switching (ZVS) in Q 2 before turning it on [38], the polarity of the voltage applied to D 1 changes, biasing it in forward mode and thus allowing energy transfer to the output. Due to the presence of the active clamp, this occurs resonantly following Equation (3), causing ZCS in diode D 1 .
    f r = 1 2 π L r C e , C e = C s n C r · N 2 C s n + C r · N 2
  • Phase 4: Figure 6d—Finally, there is a period of energy circulation when D 1 is reverse-polarized again. This period will be extended so that the converter operates in boundary mode, adapting the frequency for this purpose, thus allowing ZVS in Q 1 when it is switched on again. The total discharge period is given by Equation (4).
t d = I p p L m · N V p v V o · N
Applying volt-second balance to L m , it can be obtained that the gain of the voltage is given Equation (5).
V o = N V p v ( 1 D )

3. AI-Based MPPT Solution

In this paper, an approach based on ANN and traditional techniques has been developed to optimize MPPT tracking. This process has been divided into two sub-scenarios where a different algorithm has been used for each one. Due to the necessity of reference data for the training process of the AI algorithm, the public dataset provided by the University of Humboldt, located in a coastal area of the United States and called HSU [39], has been used. This dataset contains information of the temperature and irradiance in the area for every minute. This dataset includes data over multiple years to ensure that it captures possible differences among time and challenging scenarios. The timestamp of the first data sample is 5 September 2020 and the last one is 1 September 2023. Consequently, approximately 3 years of real data has been used for the development of the proposed solution.
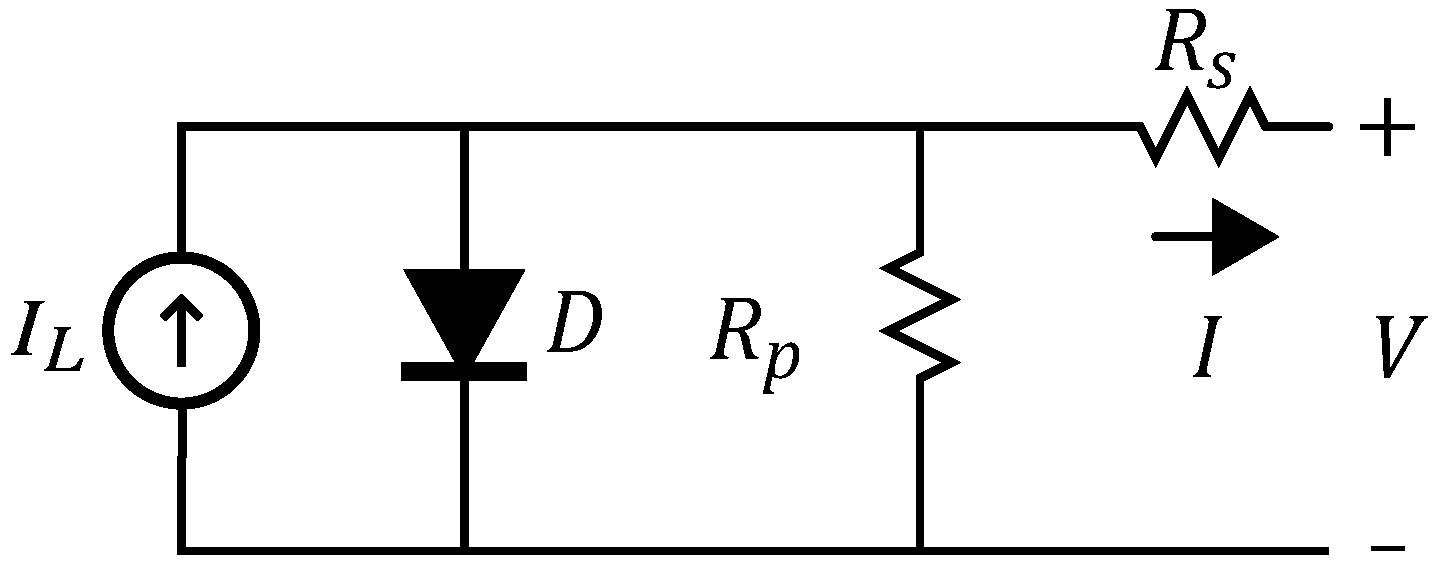
Based on sensor data from this dataset, the expected voltage (V) and current (I) generated by the solar panel depending on irradiance (G) and temperature (T) can be calculated using the steps shown in Algorithm 1 [29,40,41], defined by the PV cell in Figure 7. Depending on the solar power generation system used, including the number of cells in series ( N s ) and in parallel ( N p ), the parameters of Algorithm 1 can be modified to generate the training data required for the target application.
Because it contains real-world data, this dataset already includes intrinsic artifacts such as different levels of noise in comparison with synthetic datasets. Thus, no extra noise was added to the data during the training–testing of the algorithms since it could lead to scenarios that highly differ from real-world conditions.
Algorithm 1. PV curve generation
  1:
Initialization of reference values
  2:
V t , r e f = γ · k · T r e f · N s / q                     //γ: ideality factor, k: Boltzman constant (J/K), q: electron’s elementary charge (C)
  3:
for each T, G do
  4:
     R p = R p , r e f · G / G r e f                                                                                                                    // R p : PV shunt resistor (Ω)
  5:
     V t = V t , r e f · T / T r e f                                                                                                                         // V t : thermal voltage (V)
  6:
     E g = E g , r e f α · T 2 T + β                              // E g : band gap energy (eV), α: short-circuit current temperature coefficient
  7:
     I L = I L , r e f + ( T T r e f ) · G / G r e f                                                                                            // I L : short circuit current (A)
  8:
     I s = I s , r e f · ( T / T r e f ) 3 · e x p E g , r e f k · T r e f E g k · T                                                                  // I L : diode saturation current (A)
  9:
     V o c = V o c , r e f · d V o c / 100                                                                                                           // V o c : open circuit voltage (V)
10:
    for V = 0 to V = V o c  do
11:
         I = N p · I L N p · I s · e x p V + I R s V t 1 V + I R s R p                                                            // R s : PV series resistor (Ω)
12:
    end for
13:
end for
14:
return V, I

3.1. Equivalent Circuit of the Converter Used for the Model

In order to obtain the maximum energy from the solar panel, the converter has to polarize it at every moment [29]. For this purpose, the resistance seen by the panel is modified depending on the control element of the converter (the duty cycle D) by analyzing the equivalent circuit in Figure 8 [42].
R e q = V i n I i n R o = V o I o R e q = ( 1 D ) 2 R o / N 2
The extreme cases of equivalent resistance that can be seen by the panel, and which therefore define the range of polarization against different cases of irradiance and temperature of the solar cell, are given by the following equation:
D = 0 R e q m a x = R o / N 2 D = 1 R e q m i n = 0
D = 1 R e q · N 2 R o

3.2. AI Algorithm

As previously mentioned, the proposed AI approach can be split into two different stages based on the nature of the problem, as well as the technique used in each of these steps, as follows:
  • The first sub-scenario contemplates the initial estimation of the duty cycle when the external parameters such as temperature and irradiance change. For this, a Multi-Layer Perceptron (MLP) ANN model is used to predict a new set of values for the optimal current and voltage. These parameters are later used to calculate the duty cycle of the system using Equation (5). The data that this model takes as input for the prediction are the environment temperature, new voltage ( V 0 ), and current ( I 0 ) production based on the previous duty cycle, as well as the variation of these measurements with respect to the previous iteration ( δ V and δ I). In this way, the system only needs direct measurements from the system, except for the environment temperature, which can be easily measured.
  • The second sub-scenario refers to the internal optimization under the same environmental conditions. This way, the system will be further optimized to improve its performance regarding the optimal duty cycle estimation using a P&O algorithm. This algorithm has the advantages of low cost and easy implementation. On the other hand, it also has disadvantages related to its low adaptation speed, leading to a large number of iterations each time it is used. However, since in this approach it uses the MLP model prediction as starting point, the number of needed iterations to achieve an accuracy over 99% is highly reduced as it will be explained in Section 5.
Therefore, the proposed approach can be summarized in the following steps, where steps from 1 to 5 represent the first sub-scenario, based on the commented MLP algorithm, and steps 6 and 7 represent the second one, using the P&O algorithm, as follows:
  • Generating V-I values based on a new sample of irradiance and temperature using the steps commented in Algorithm 1. The same approach is used to calculate the optimal value of the duty cycle that will be used as reference for the training of the AI algorithm.
  • Extract voltage ( V 0 ) and current ( I 0 ) generation based on the estimation of the duty cycle of the previous iteration.
  • Calculate the variation of voltage ( δ V) and current ( δ I) between the previous iteration and the current one based on the previous duty cycle.
  • Normalization of V 0 , I 0 , and the environment temperature into the range from 0 to 1 and the ( δ V) and ( δ I) parameters into the range from −1 to 1 to maintain the information of the direction of the variation of the voltage and current.
  • Duty cycle estimation ( D 0 ) from the V 1 and I 1 output from the trained MLP model using the normalized V 0 , I 0 , ( δ V), ( δ I), and the environment temperature as inputs.
  • P&O execution using as input the D 0 extracted from the estimation resulting from the MLP as initial estimation and a maximal deviation of 1% based on the MLP error during the training sessions.
  • Step 5 is repeated until the model achieves a change under a 0.1%, when it is considered that the algorithm converged.
These steps are repeated for every minute, when new temperature and irradiance values are collected. This way, the model will be able to calculate a first accurate estimation with a low latency and later the P&O algorithm ensures the further optimization and convergence of the approach. Information about the performance of this approach will be discussed in Section 5.

AI Algorithm Training

During the development of the previously discussed neural network, multiple topologies and hyperparameter configurations were evaluated using GridSearch. This technique iterates over all possible combinations of provided values for all relevant hyperparameters needed during the training process of a neural network to select the one that reaches the best performance based on a metric selected by the user (in this case accuracy). During the execution of this technique, as shown in Table 1, multiple numbers of layers, neurons per layer, batch sizes, and learning rates were studied. Each of the values from each column where combined with all other possible candidates from other hyperparameters to ensure all possible combinations (48) from those hyperparameters were evaluated.
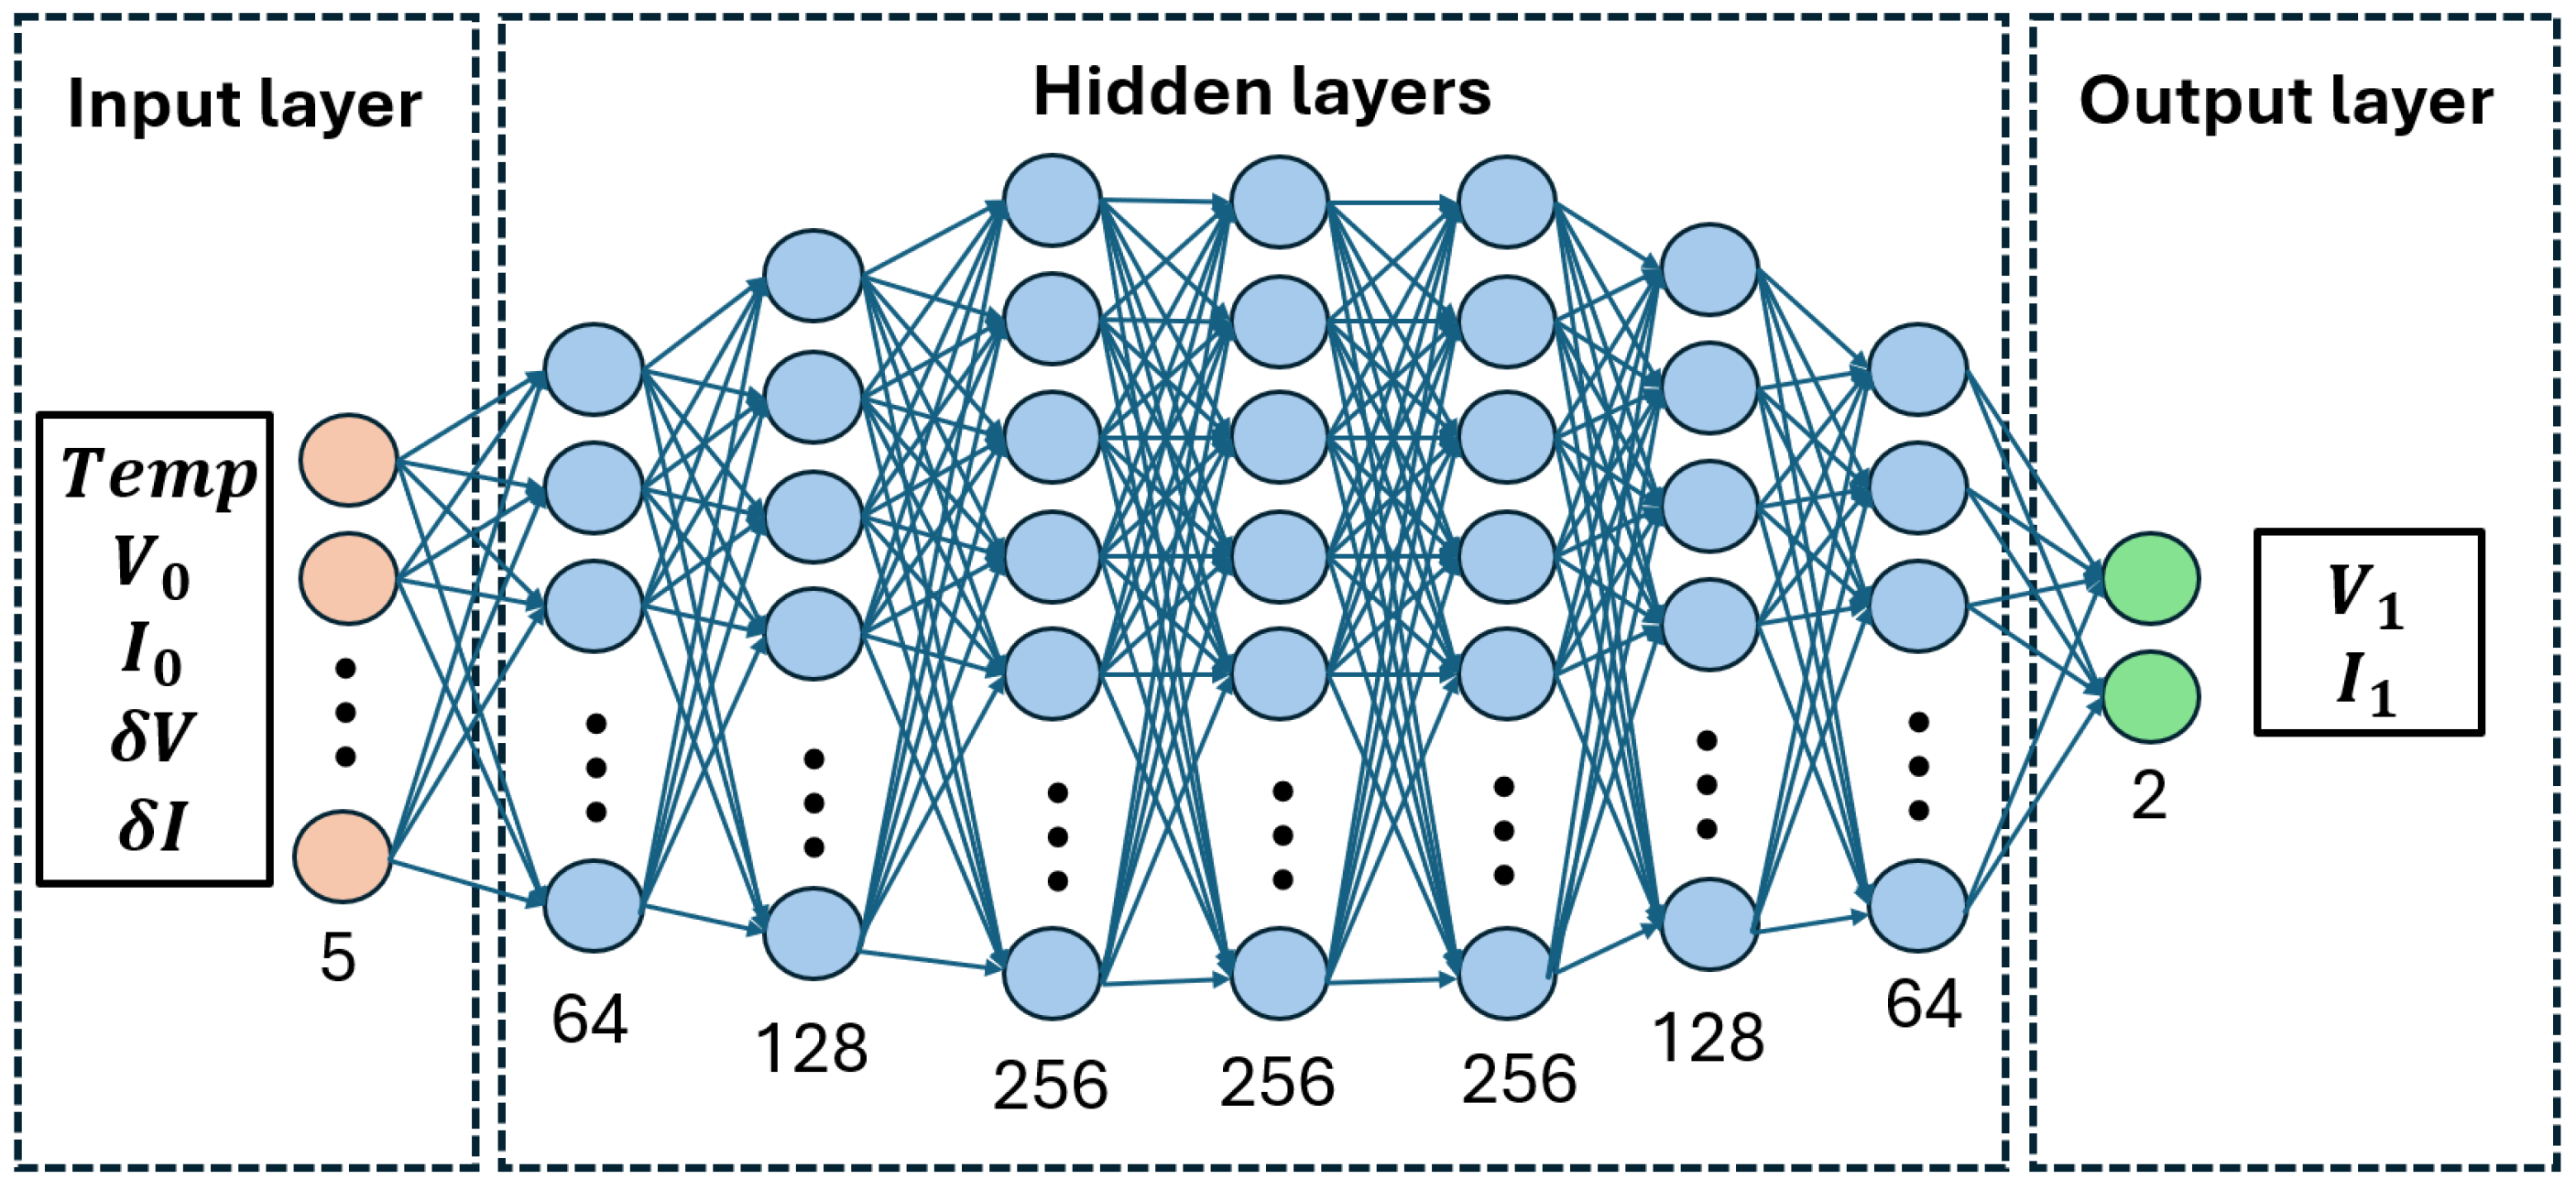
After that, the resulting best configuration was a MLP with the topology shown in Figure 9. In this figure it is possible to observe how the developed MLP has nine layers with 5, 64, 128, 256, 256, 256, 128, 64, and 2 neurons respectively. All layers include a ReLu activation layer after every dense layer except for the first layer, which uses sigmoid to consider the possible positive and negative input values as well as the last layer that maintains a linear activation.
The rest of the hyperparameters selected with GridSearch as well as other parameters relevant for the training such as the number of training–testing samples are shown in Table 2.

4. System Design Considerations

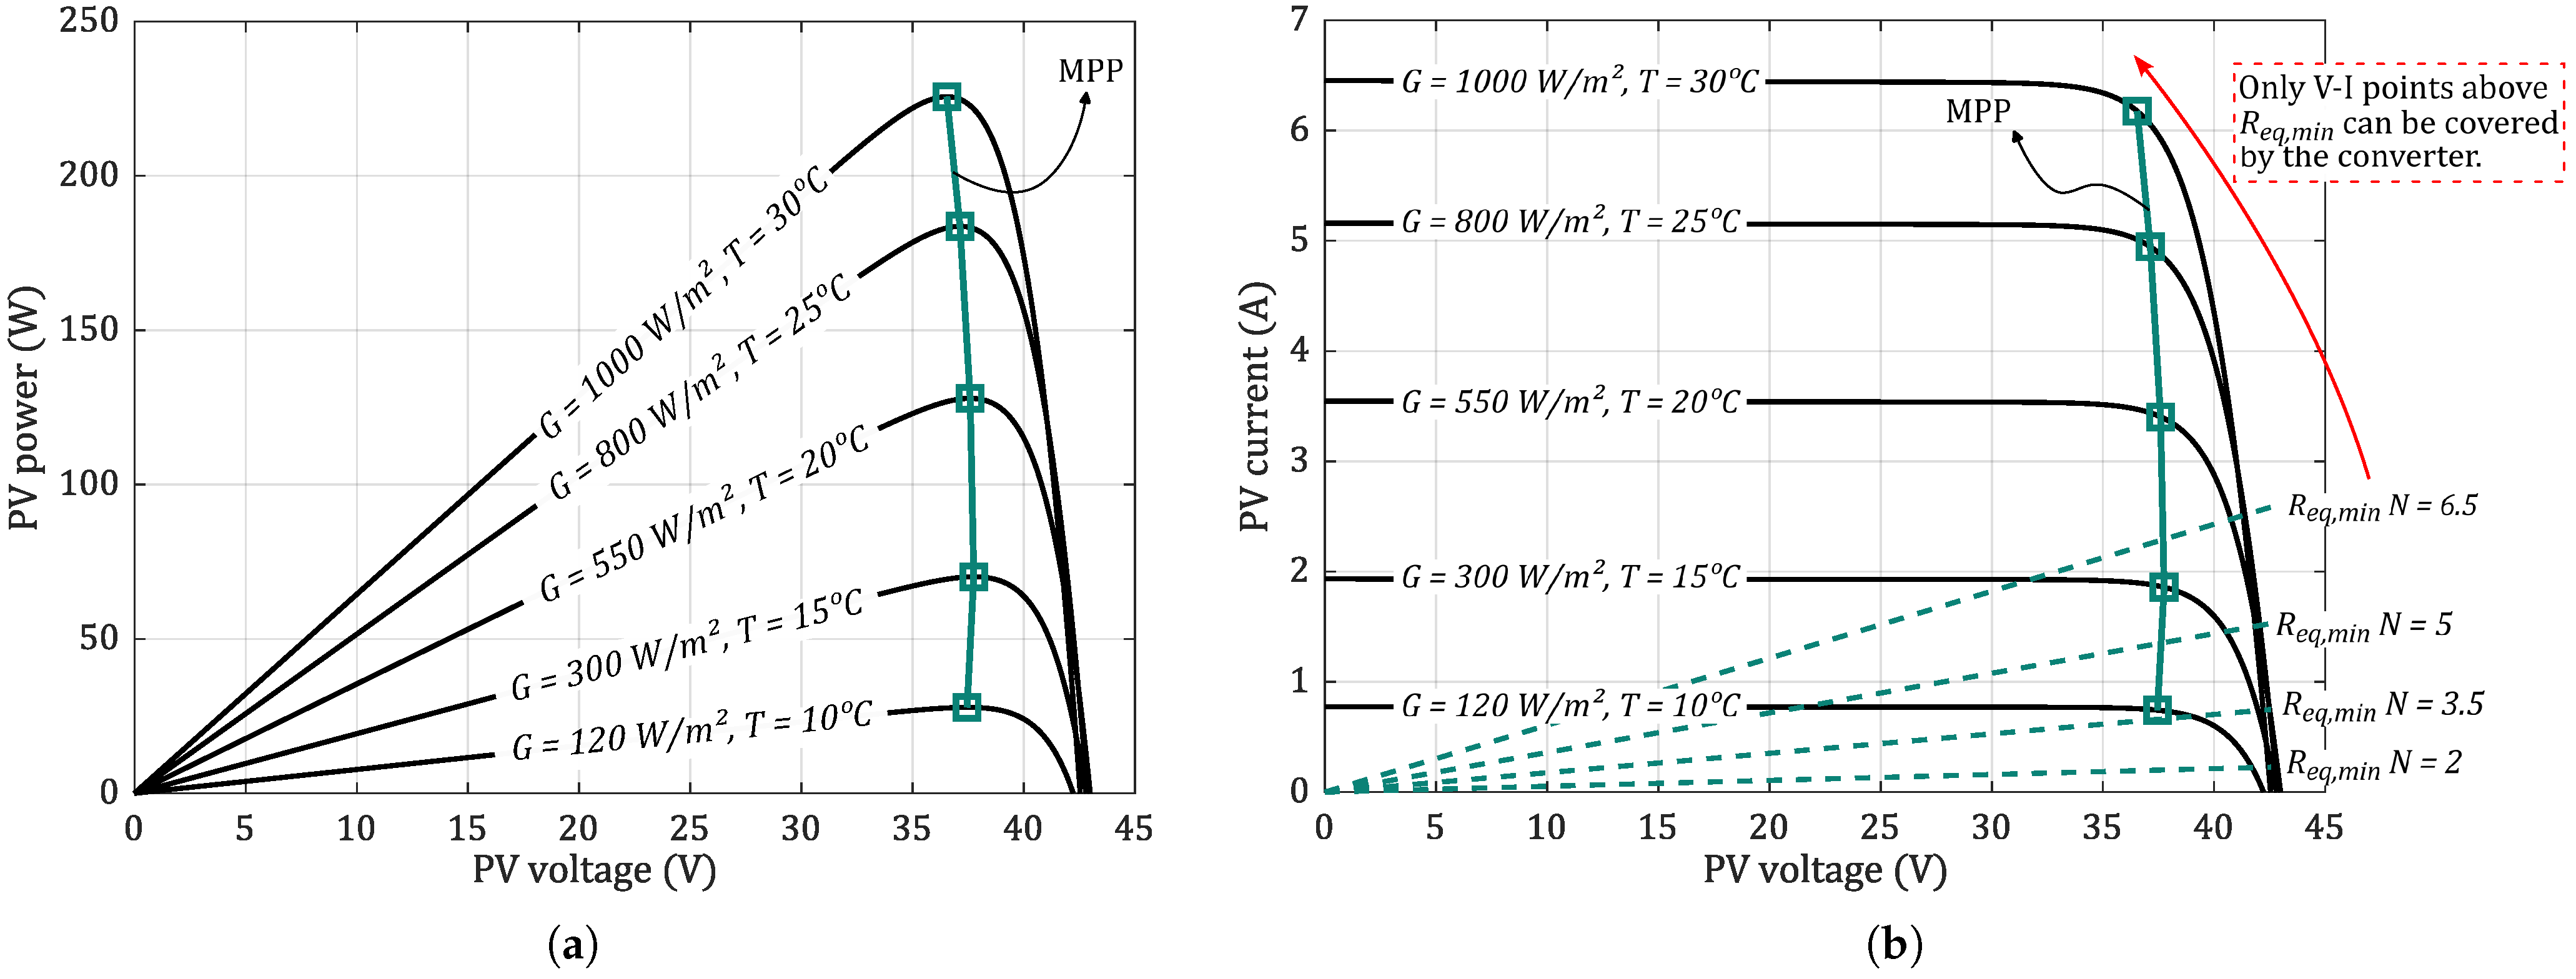
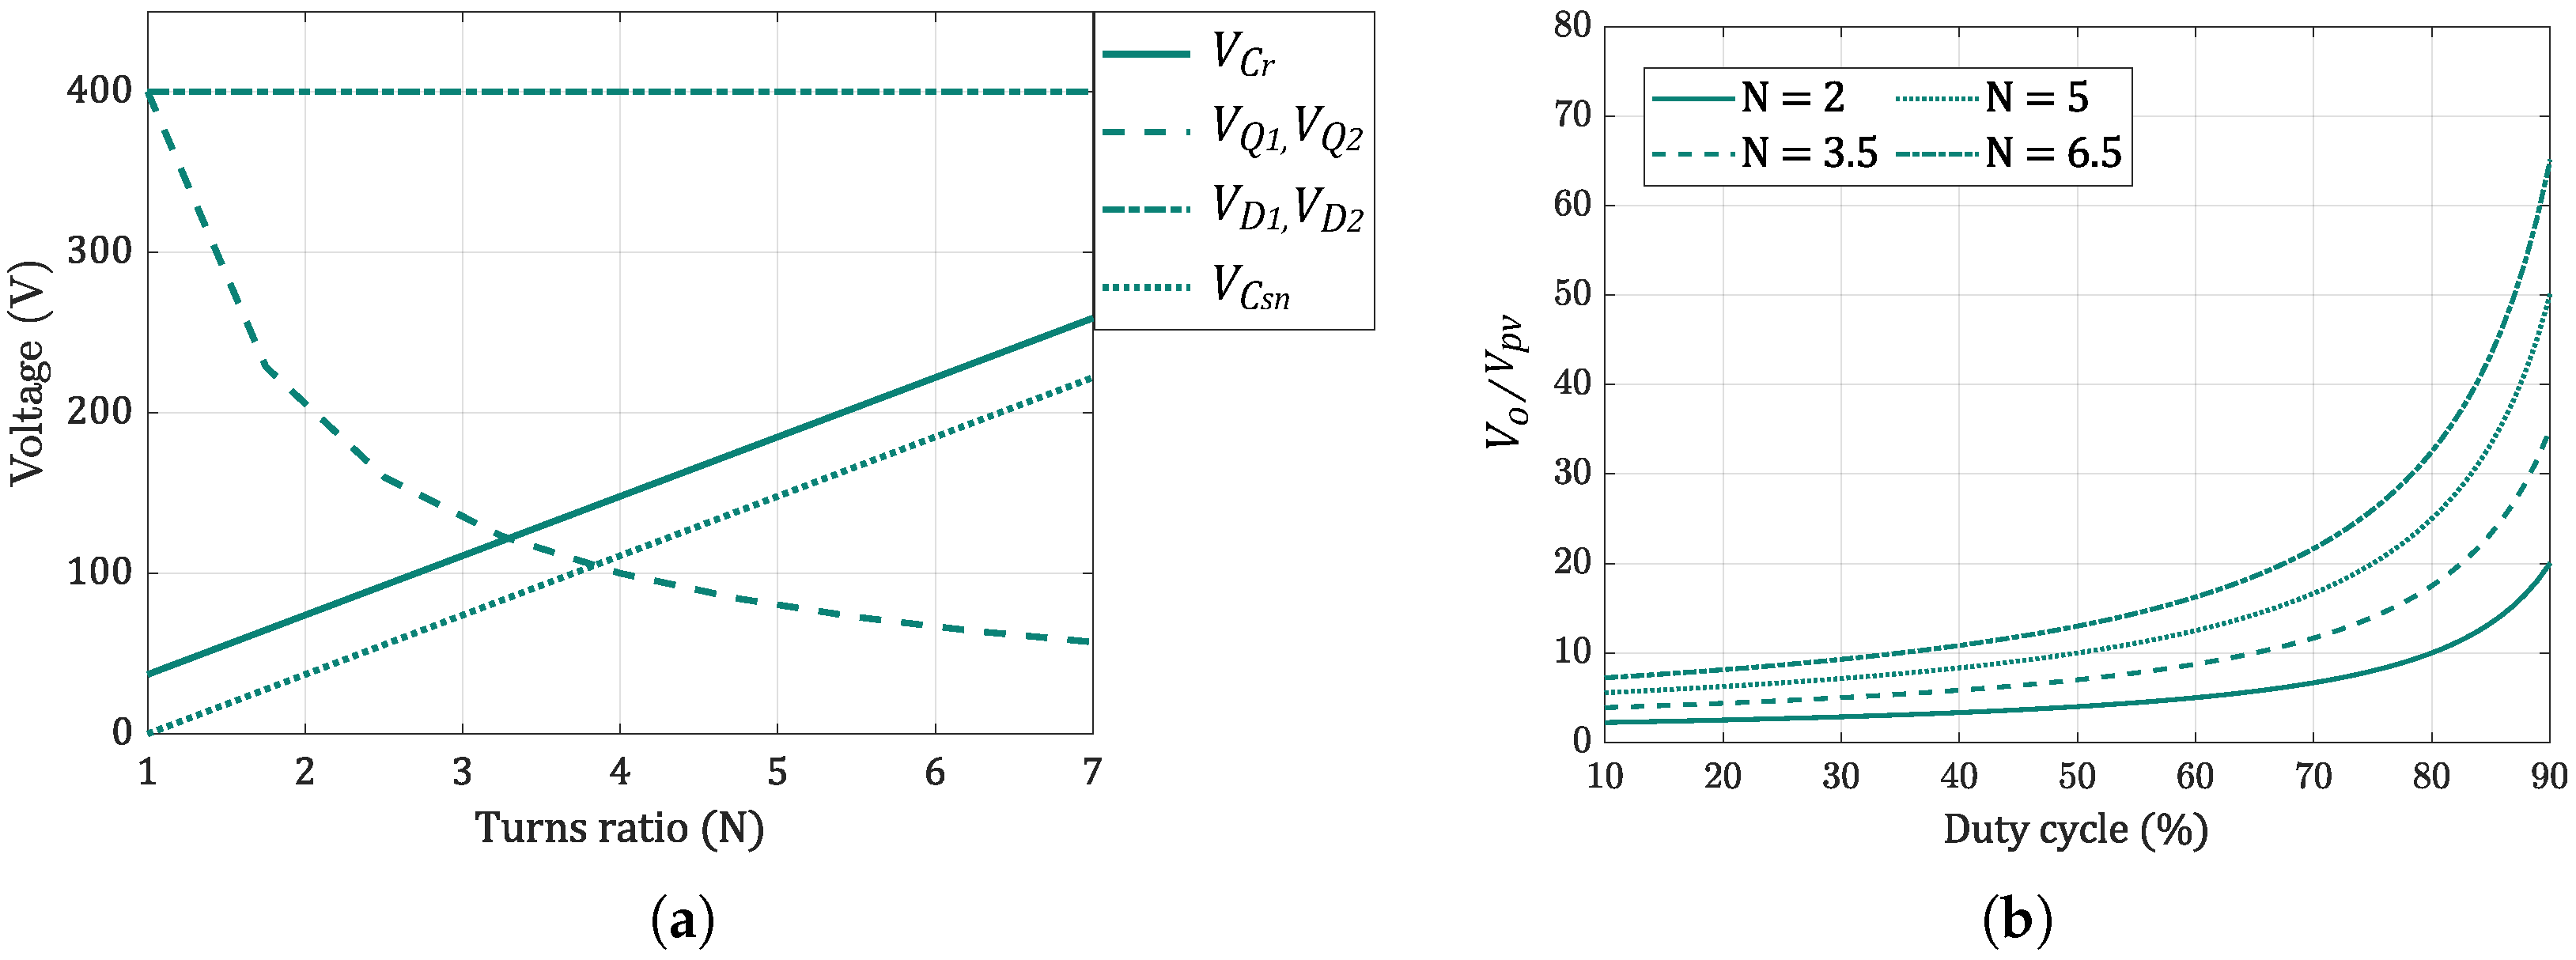
Selecting the ACFF converter turn ratio (N) is one of the key elements for sizing the power stage. As can be seen in Equations (5) and (6), this will be decisive for the points where the converter will be able to polarize in the MPPT and for it to be able to act on the desired voltage range. Figure 10a,b shows the different polarization points (output power vs. voltage and output current vs. voltage, respectively) of a solar panel according to the model in Figure 7 and the Algorithm 1 for a sweep of different cases of irradiance and temperature. The solar panel model used is a 72-cell, 230 W commercial one. In Figure 10b, Equation (7) is applied to the value of the V-I curve, which determines the minimum R e q m i n that the converter can achieve by dimensioning. Any polarization point below that curve cannot be covered in any way by varying the duty cycle, which prevents maximum power extraction from the panel for low irradiance values, which is not desirable.
On the other hand, the turn ratio N will determine the maximum voltage at which the converter components must operate according to the equations in Table 3. And finally, as Equation (5) indicates, the turn ratio will also determine the voltage range between input and output. Figure 11 visually shows the trade-off that must be taken into account for the correct selection of components, which, together with Figure 10, will determine the value of N that meets an acceptable MPP range, low-voltage components that allow for lower parasitic resistances and therefore greater efficiency, and an output voltage range suitable for operating with a downstream DC-AC stage or a DC grid without the duty cycle D not going to extreme values.
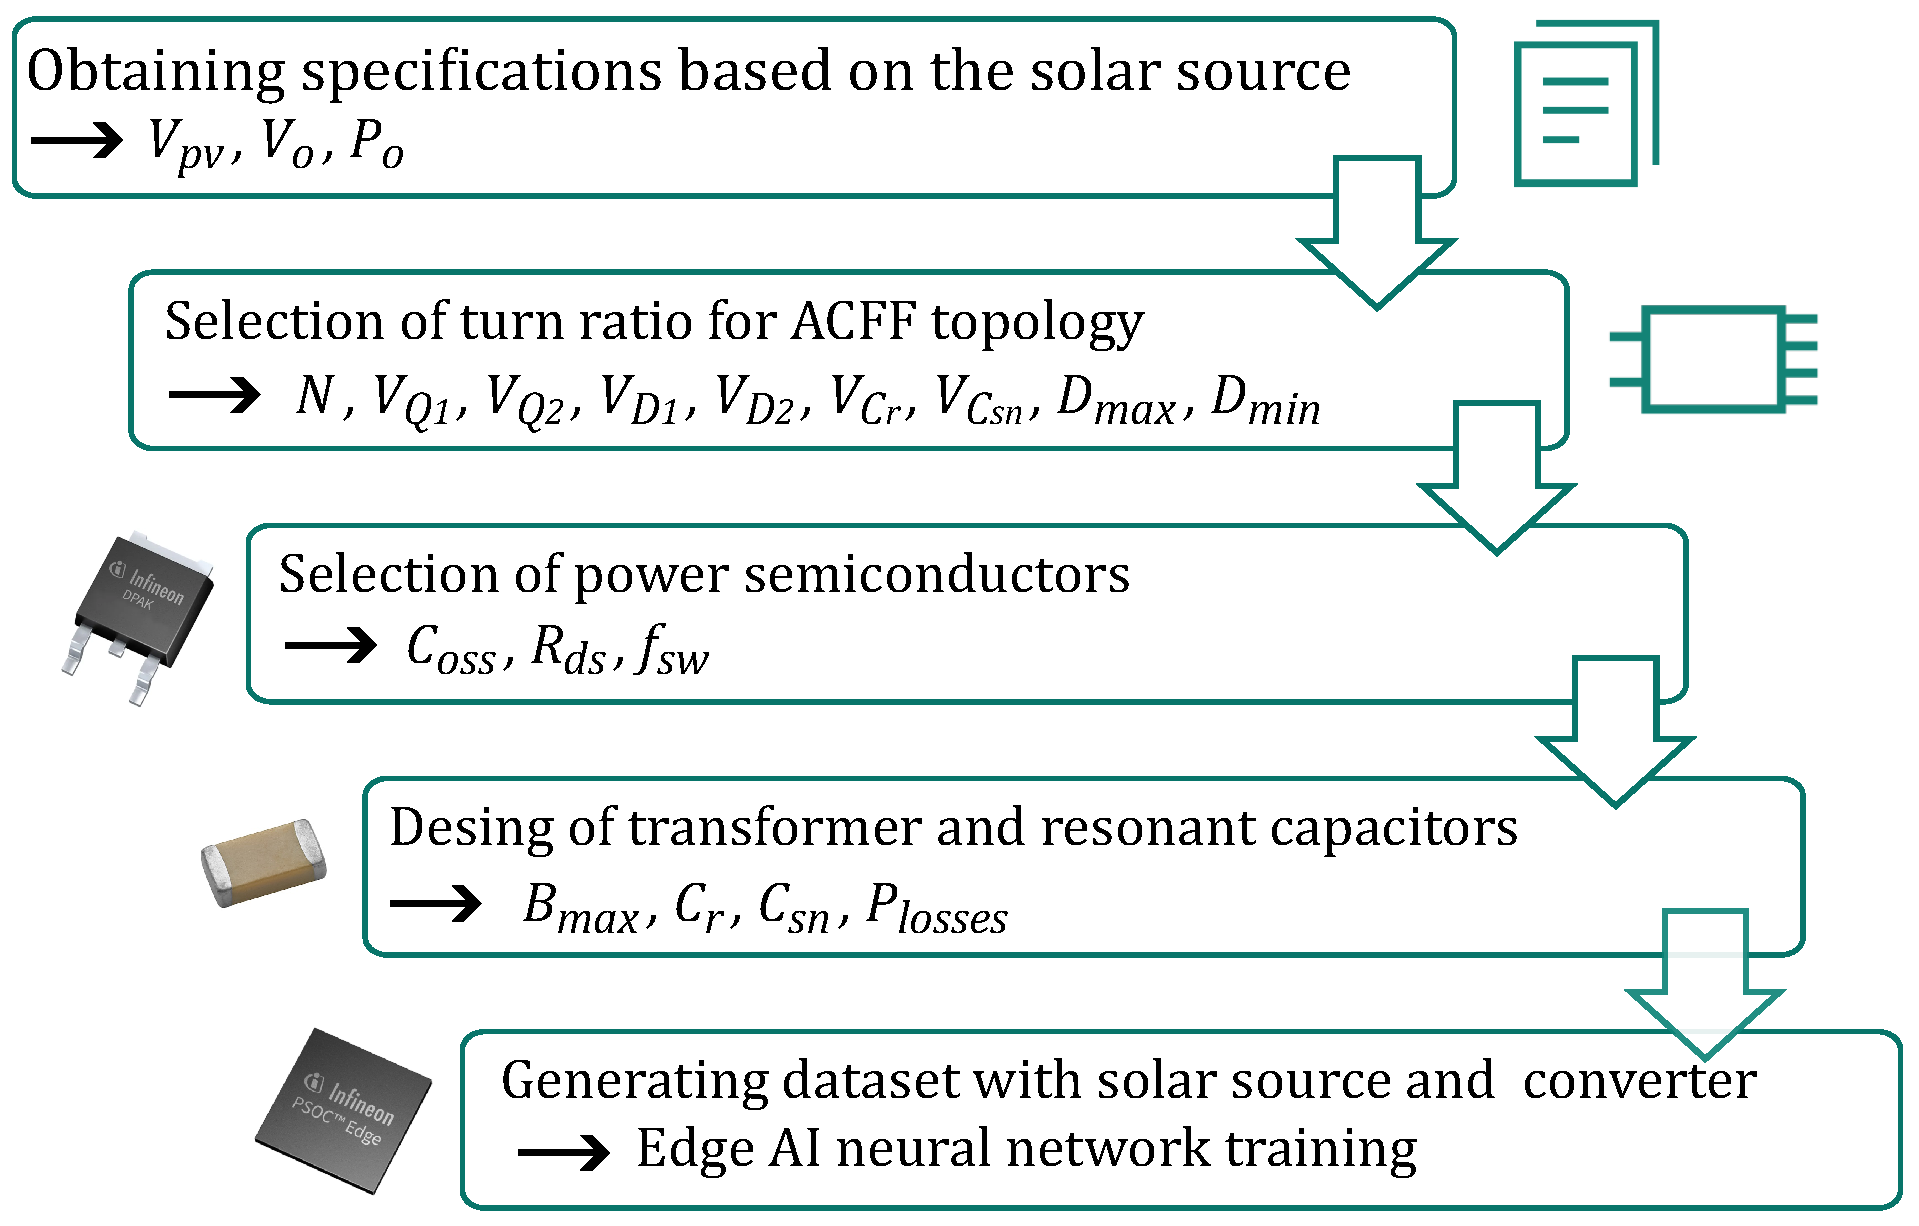
Figure 12 summarizes the steps for designing the proposed system. It starts with the specifications of the solar panel to be used. With this data, the range of operating voltage and power is obtained. Knowing this, and using the previous discussion, the most appropriate turn ratio (N) for the application can be selected. This will determine the selection of devices based on their withstand voltage ( V C r , V Q 1 , V Q 2 , V D 1 , V D 2 , and V C s n ). The parasitic capacitance of the switching devices can be used to obtain an approximation of the operating frequency range ( f s w ) needed to achieve ZVS as explained in [38,43,44]. Using Equations (2) and (4), and knowing that the magnetic flux depends on the peak-to-peak current I p p , B p p = ( L m · I p p ) / ( N t · A e ) , where A e is the core effective area and N t is the number of turns, it is possible to design the transformer seeking non-saturation and low volume [25]. Once the magnetizing inductance L m and the leakage inductance of the transformer L l k have been characterized, the resonant capacitors ( C r and C s n ) are selected so that the frequencies given by Equations (1) and (3) meet the ZCS condition (i.e., they complete half resonance during the half-cycle of operation). Finally, when the power stage is known, the necessary dataset is generated for training the proposed neural network.
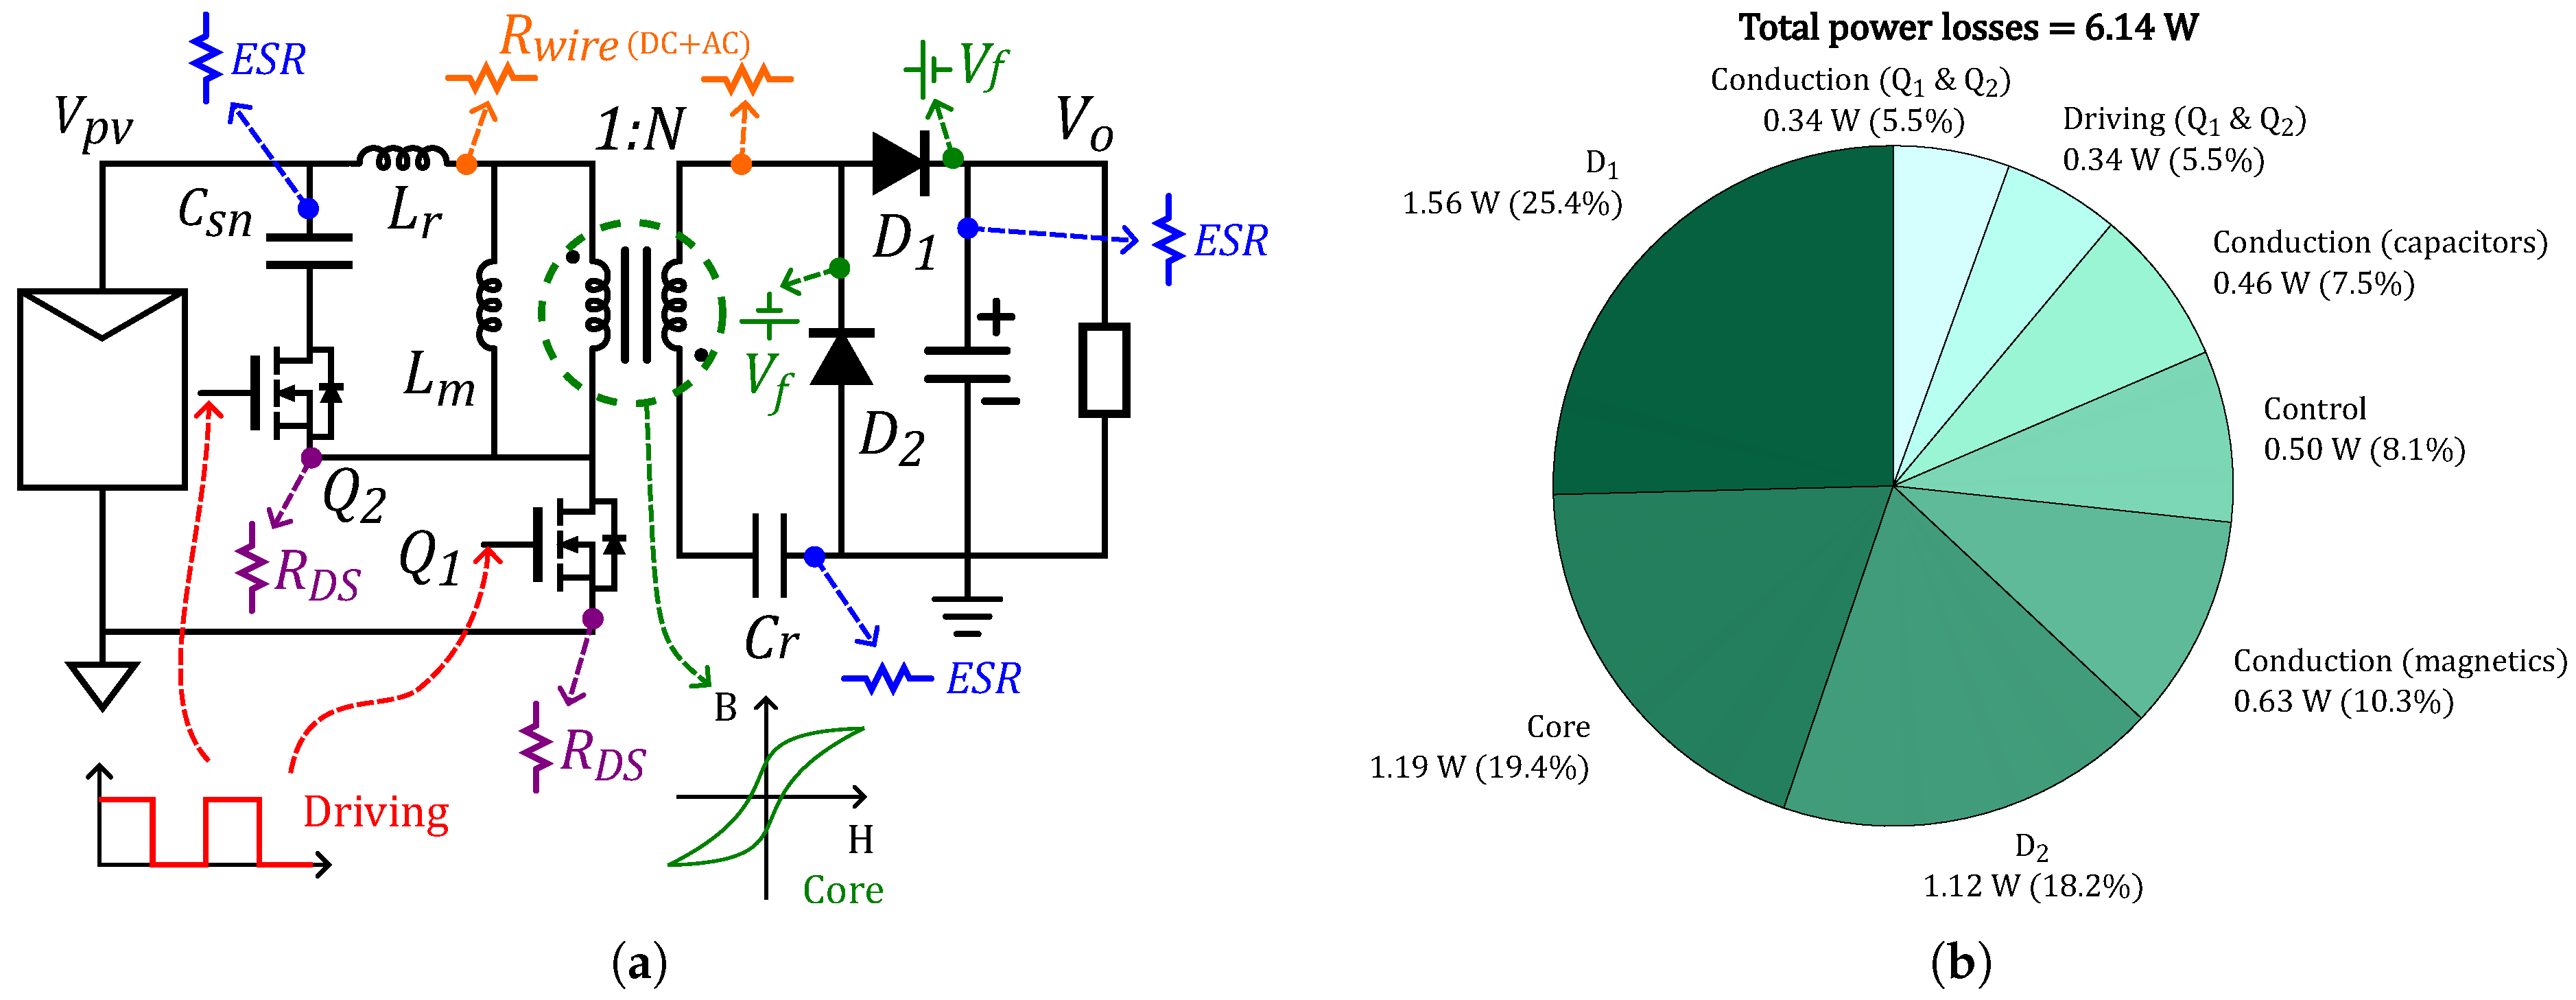
To calculate the theoretical estimate of losses in the converter, the same approach is followed as that described in [25]. Thus, the following loss mechanisms are taken into account: switching losses, which are assumed to be zero due to the implementation of soft switching; losses due to MOSFETs driving; magnetic losses in the core; and conduction losses due to RMS current in the switches, diodes, capacitors, and magnetic components. Figure 13a shows the non-ideal components that cause these losses. In order to perform this analysis, and unlike the approach followed in Section 2, the parasitic elements of the components are taken into account as follows: the drain-source resistance ( R D S ) of Q 1 and Q 2 , the forward voltage ( V f ) drop across diodes D 1 and D 2 , the DC and AC resistance in the transformer wires, and the Equivalent Series Resistance (ESR) of the capacitors. Simulation tools are used to calculate the RMS currents. The result of this estimation for the final design in Section 5.1 can be seen in Figure 13b. Differences are observed compared with the experimental study, due to the absence of certain parasitic resistances in the model (such as those present in the Printed Circuit Board -PCB- and in the solder joints) and to variations in the estimates, such as the AC losses in the transformer.

5. Experimental Results

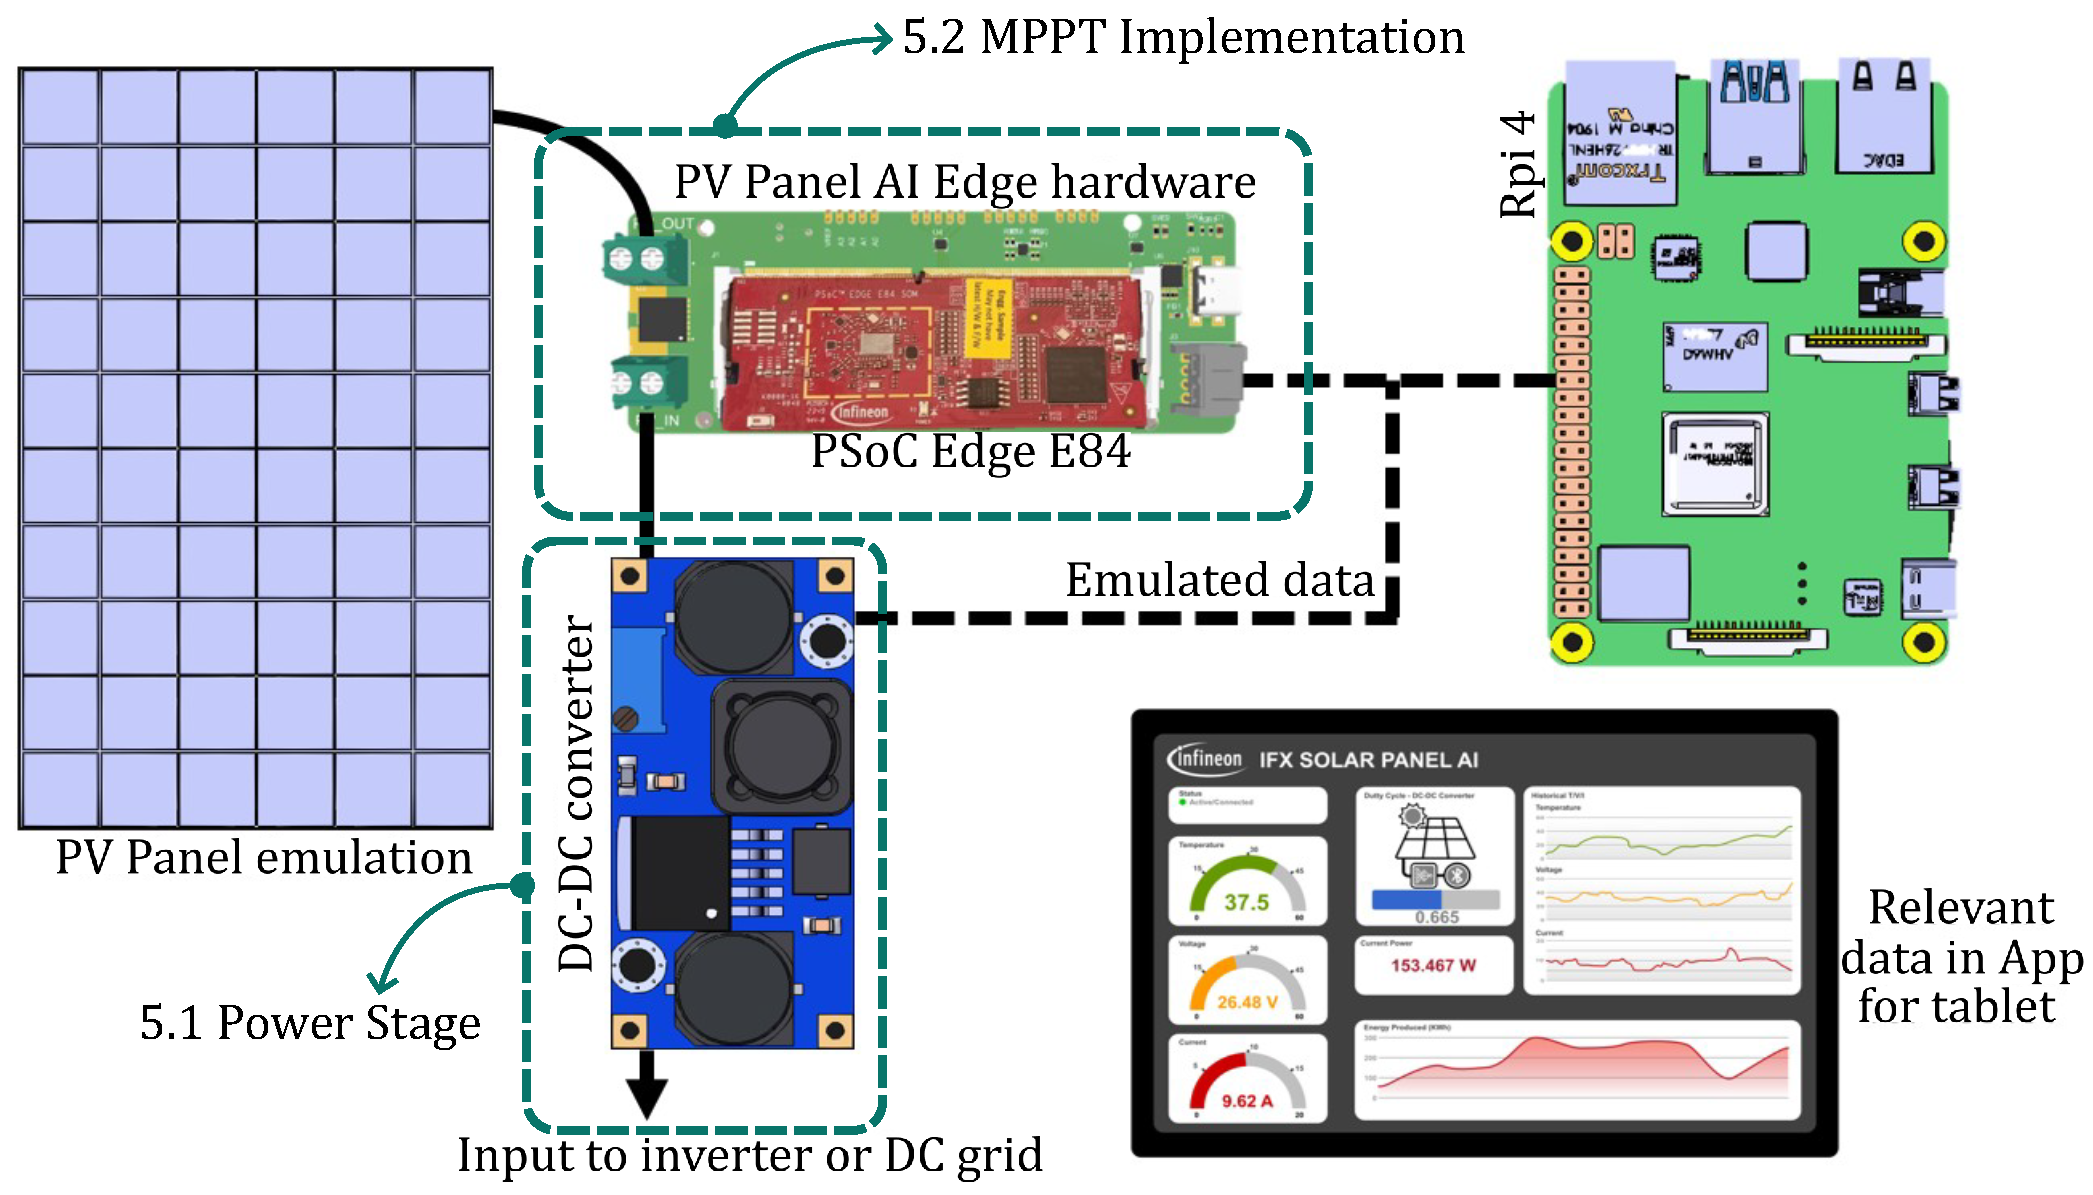
The demonstrator in Figure 14 is carried out to show the system proposed. It consists of a DC-DC converter built in-house at Infineon Technology’s laboratories in Munich, Germany, which is powered by an external source. To emulate the solar panel and apply the Edge AI-based algorithm for MPPT, a simulator has been set up on a Raspberry Pi 4 to facilitate the validation of the converter and the neural network on which this work focuses and enable the demonstrator to be showcased at trade fairs, exhibitions and other events. Additionally, there is a graphical interface connected via Bluetooth to display results in real time. The power stages and neural network focused on in this manuscript are explained in detail below.

5.1. Power Stage

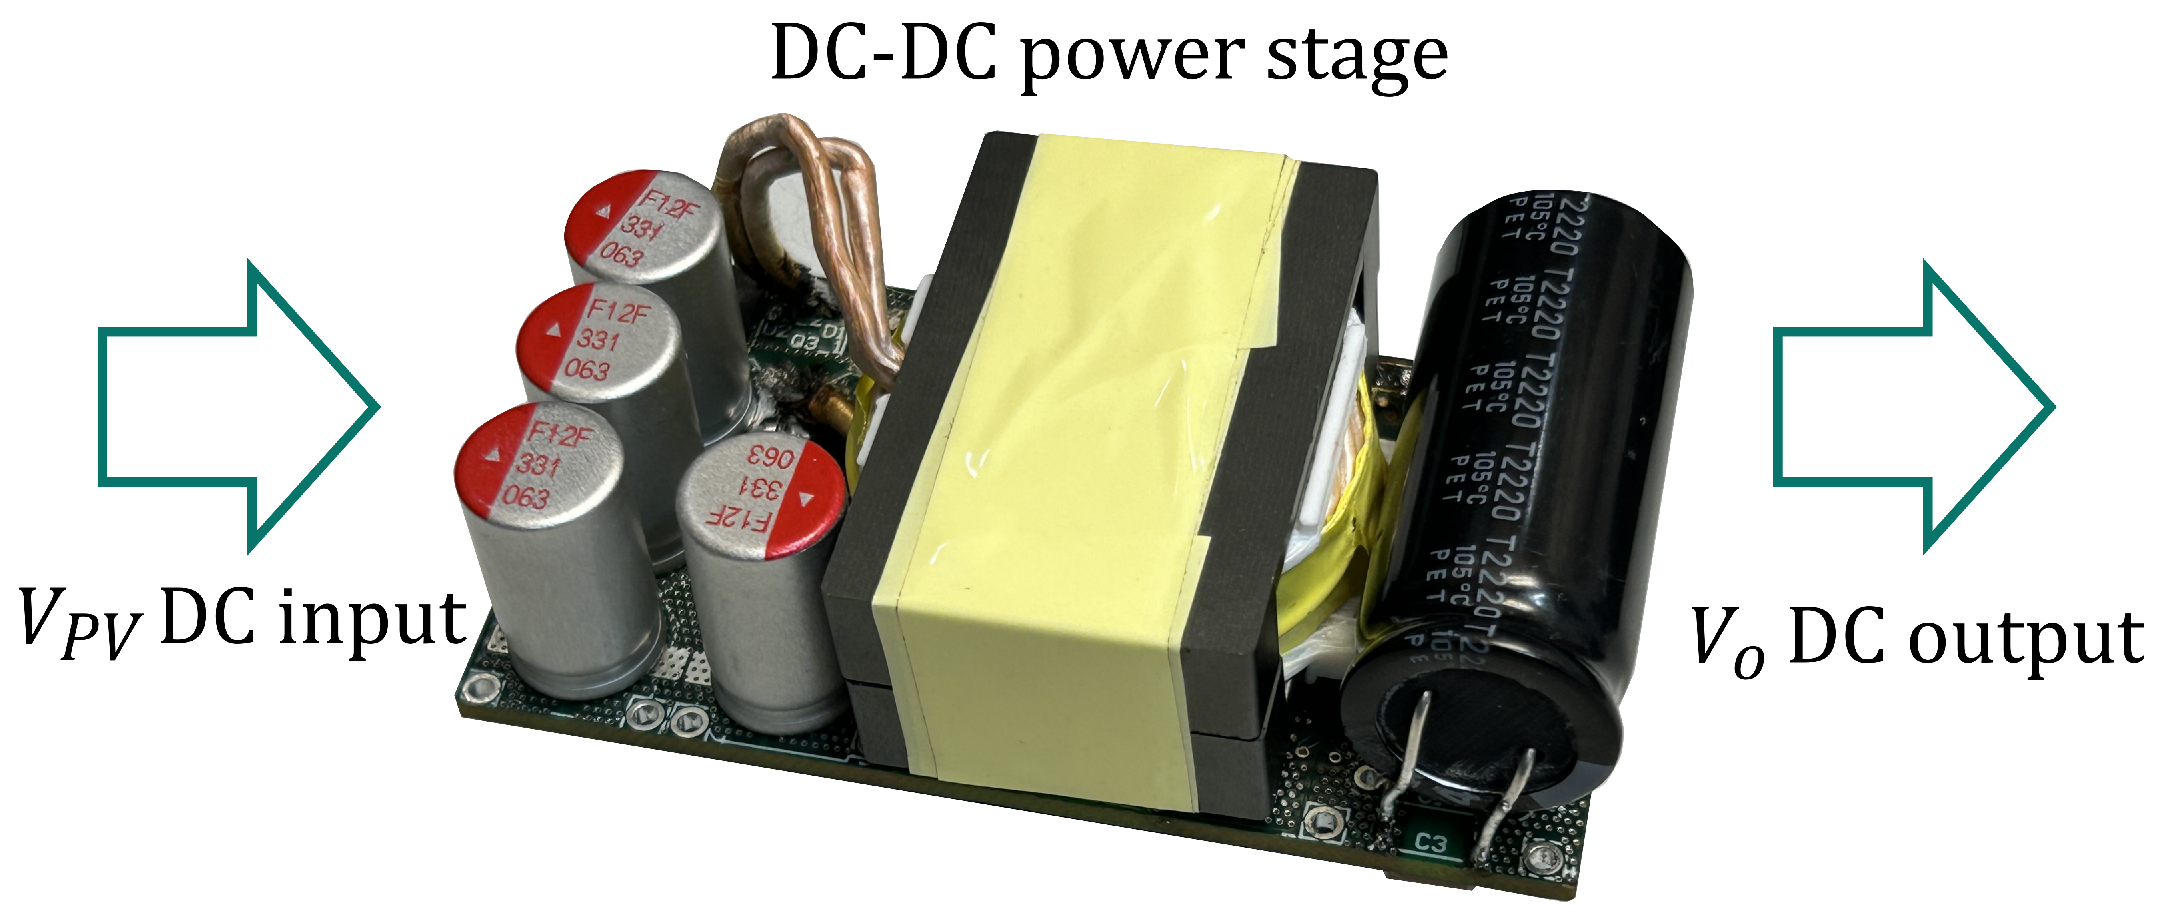
Figure 15 shows the prototype to operate on the described 72-cell, 230 W solar panel used for the experimental validation. The key components for this validation are shown in Table 4. The power components are supplied by Infineon, while the transformer is custom-built at Infineon’s laboratories in Munich alongside the rest of the power converter, using Ferroxcube’s 3C95 core material. Following Figure 10 and Figure 11, the final selected turn ratio is N = 3.5. This value allows a wide range of V-I curves covered, allowing the MPPT algorithm to work even with low irradiance values, while enabling the use of devices with relatively low primary voltage and achieving an optimal voltage gain.
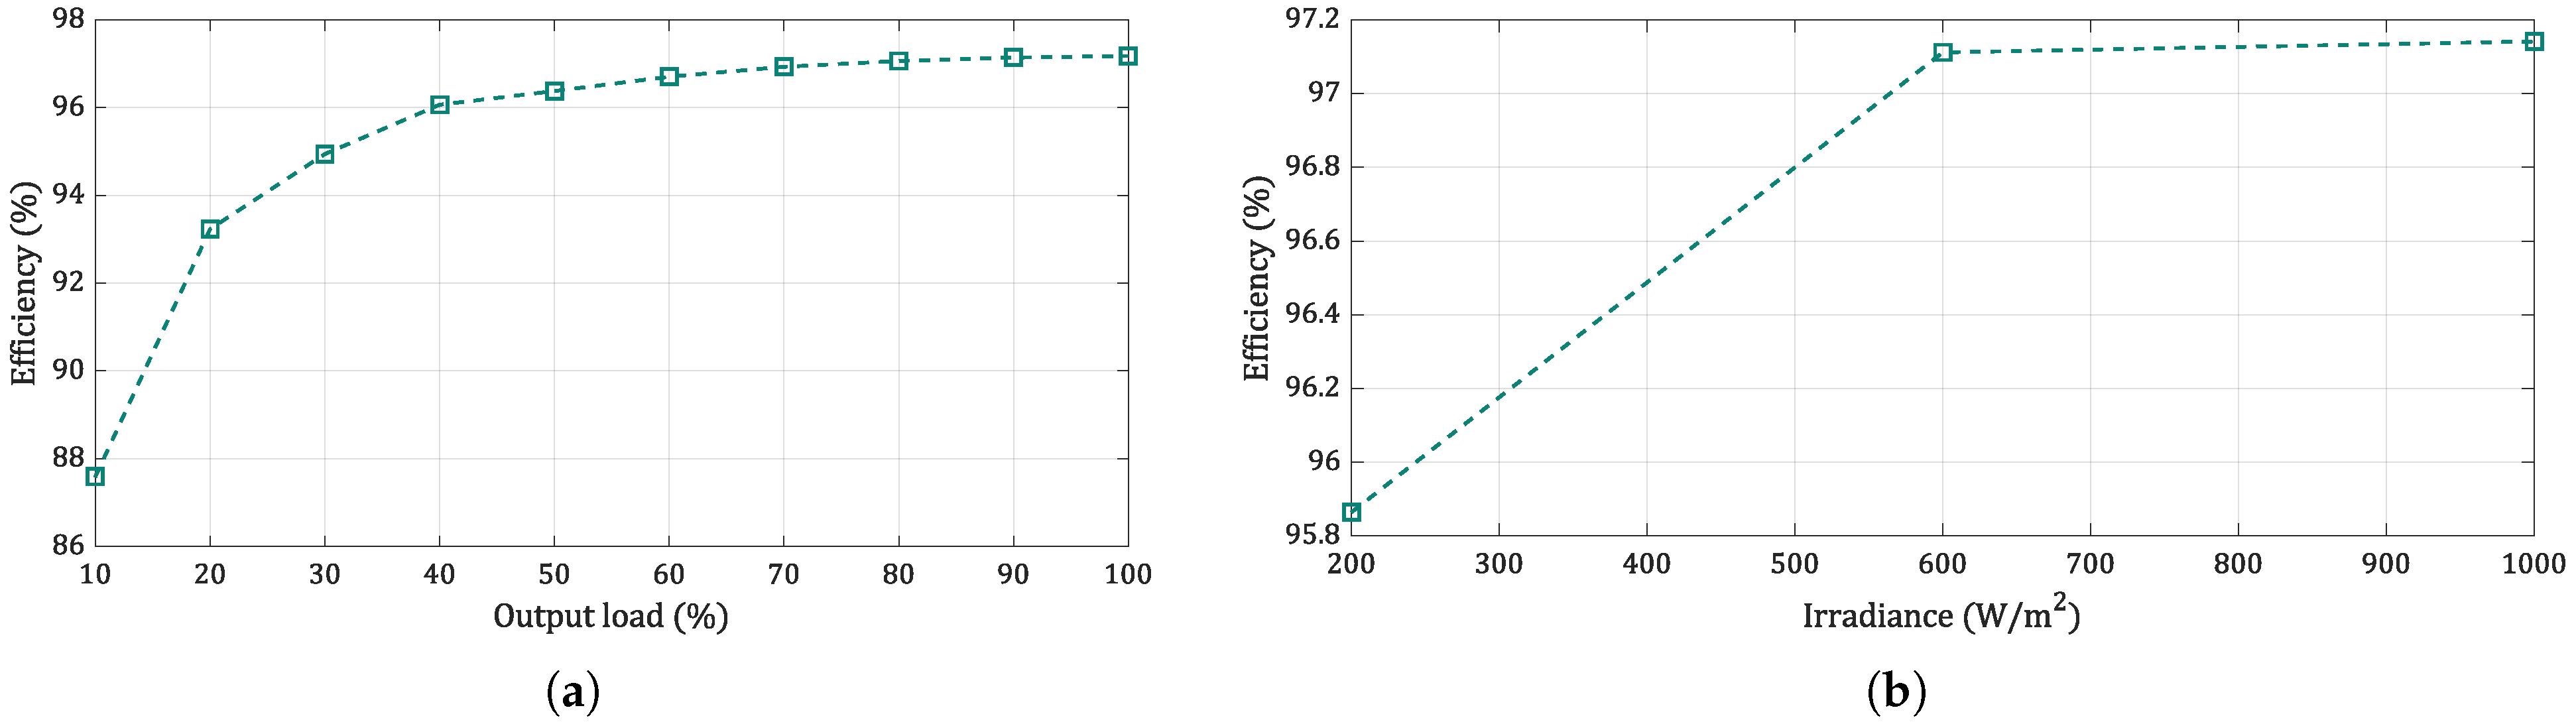
Efficiency results for a sweep of loads at nominal weather conditions (G = 1000 W/m2) and irradiances at nominal power are shown in Figure 16. The maximum level of efficiency (97.18%) is achieved at maximum load and nominal irradiance.
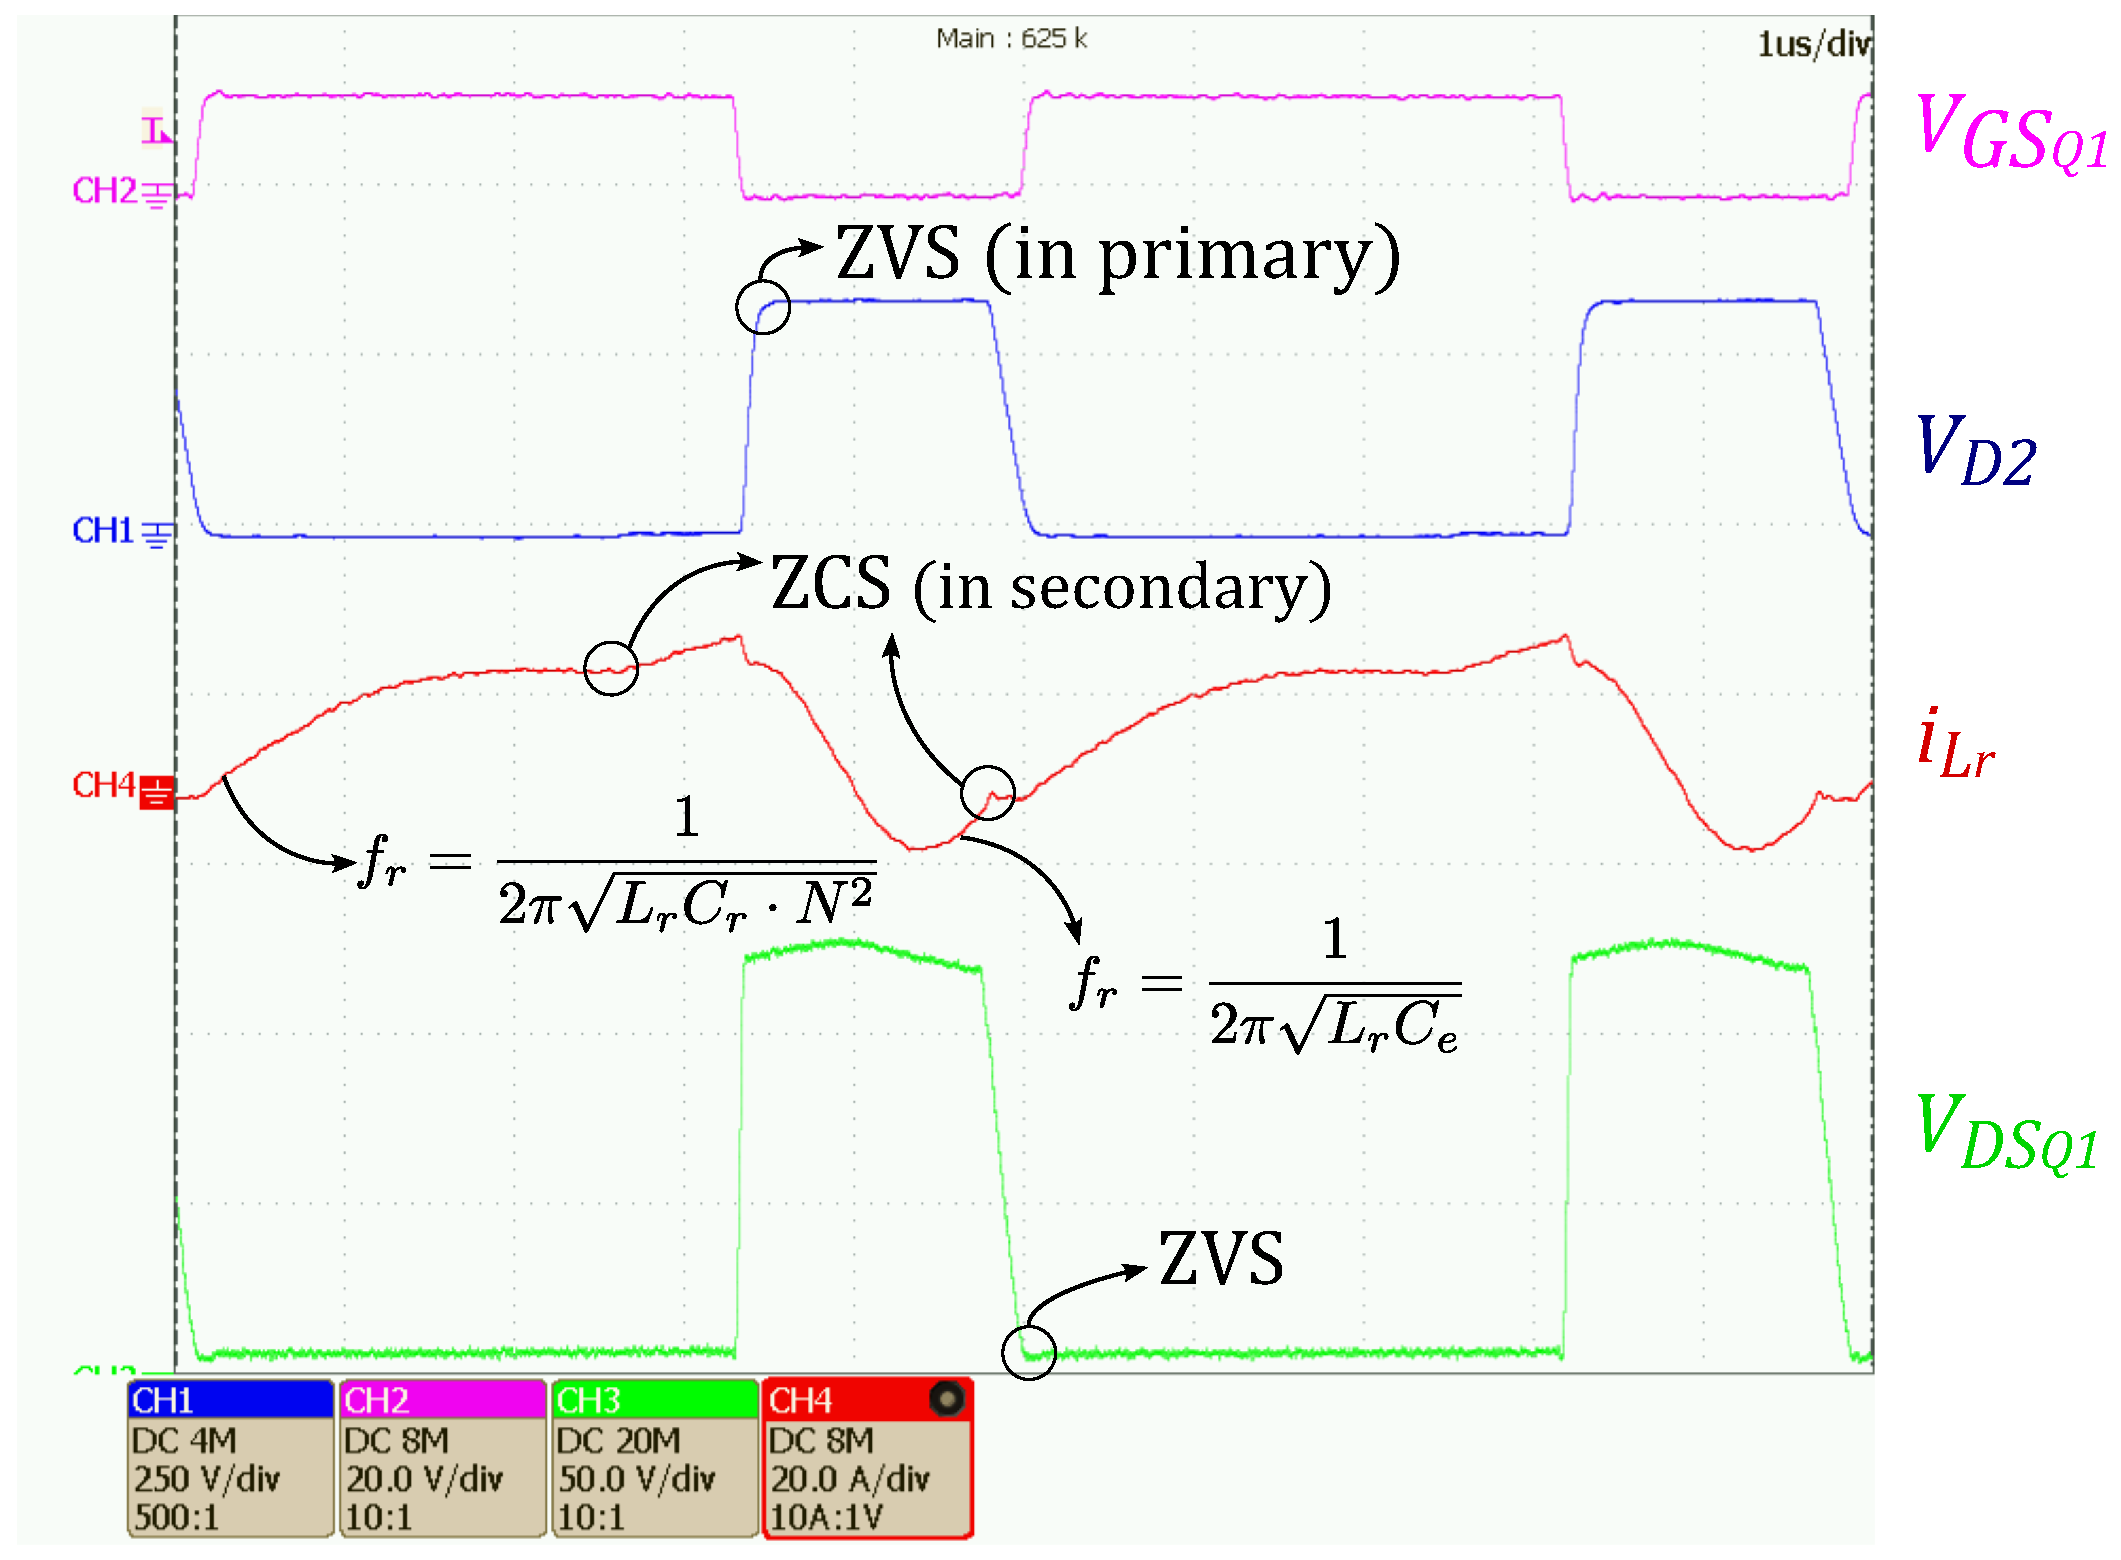
Finally, the experimental waveforms obtained using an oscilloscope in the converter laboratory are shown (Figure 17). The experimental behavior of the theoretical analysis carried out in Section 2 can be observed. Soft switching helps to improve the converter’s efficiency. Furthermore, it also helps to reduce the electromagnetic interference (EMI) emitted, in addition to a layout design aimed at reducing current loops in the power stage [45]. In addition, switches based on Si technology, such as this case, exhibit lower rising and falling slopes when commutating than those based on gallium nitride (GaN) [46]. This will help ensure compliance with electromagnetic compatibility standards when integrating the system with solar panels.

Comparison to Related Power Converters

To put the work carried out into context, a comparison is made with other state-of-the-art approaches. In terms of size and cost, the power converter will be the main component of the proposed system. In order to compare different solutions, several factors must be taken into account, namely, rated power, input and output voltage ranges, number of components, operating frequency, and the maximum voltage that the components must be able to withstand. Table 5 summarizes several state-of-the-art step-up converters operating in a comparable power range (200–300 W) to the proposed converter [19,47,48,49,50].
As can be seen in Table 5, high efficiency can be achieved with a significantly lower bill of materials for the power components (switches, diodes, capacitors, and magnetics). This enhances the economic and operational viability of the proposed converter, as these are the most costly elements. Furthermore, as the MOSFETs used are silicon-based, they offer good performance at a lower cost; however, the use of GaN semiconductors will enable an increase in output power while maintaining high power density [43]. These power ratings, which apply to a 72-cell solar panel, could be scaled up using converter with the same nominal power rating connected in parallel or in an interleaved configuration, as described in the literature [57,58].

5.2. MPPT Implementation

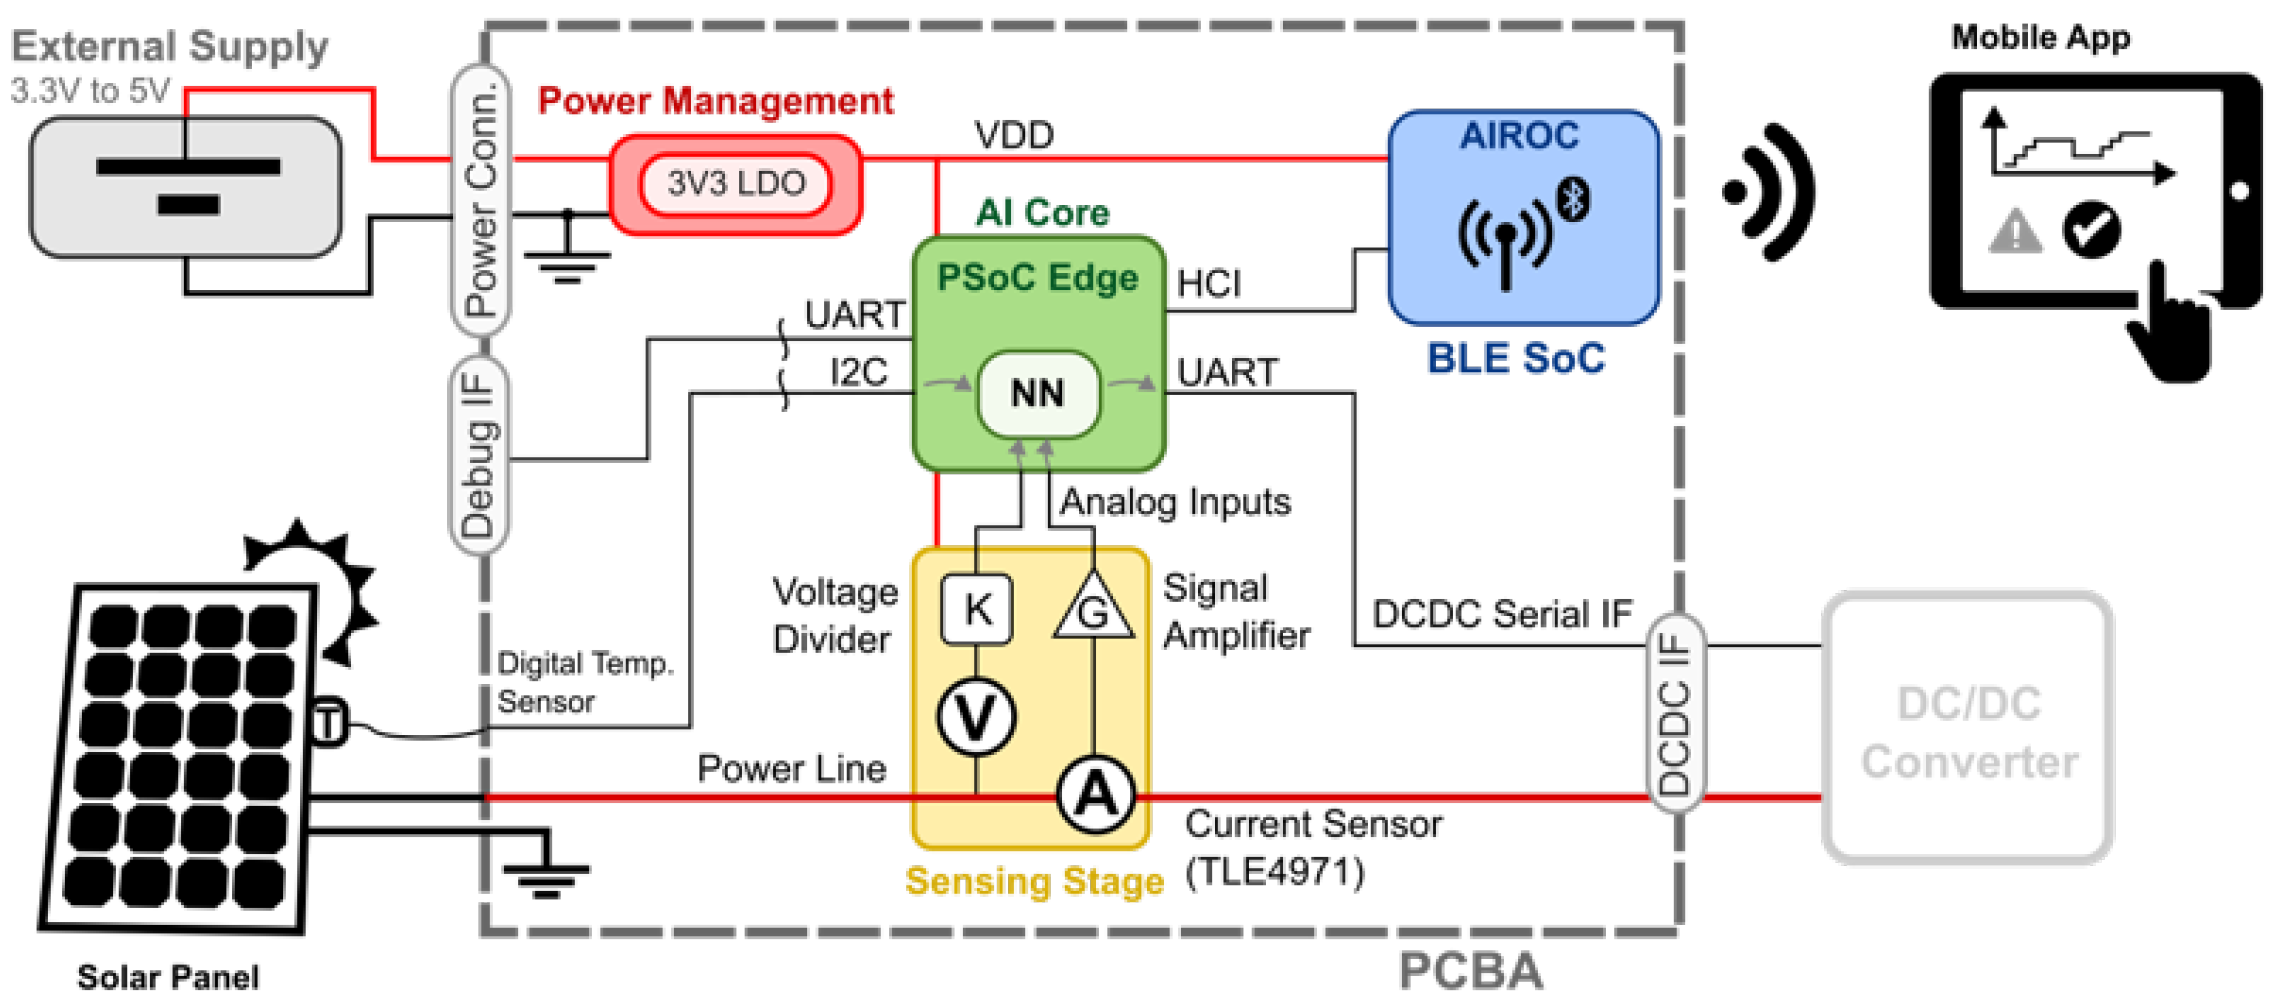
The HW design proposed for the integration of PSoC Edge with the DC-DC converter is the one shown in Figure 18.
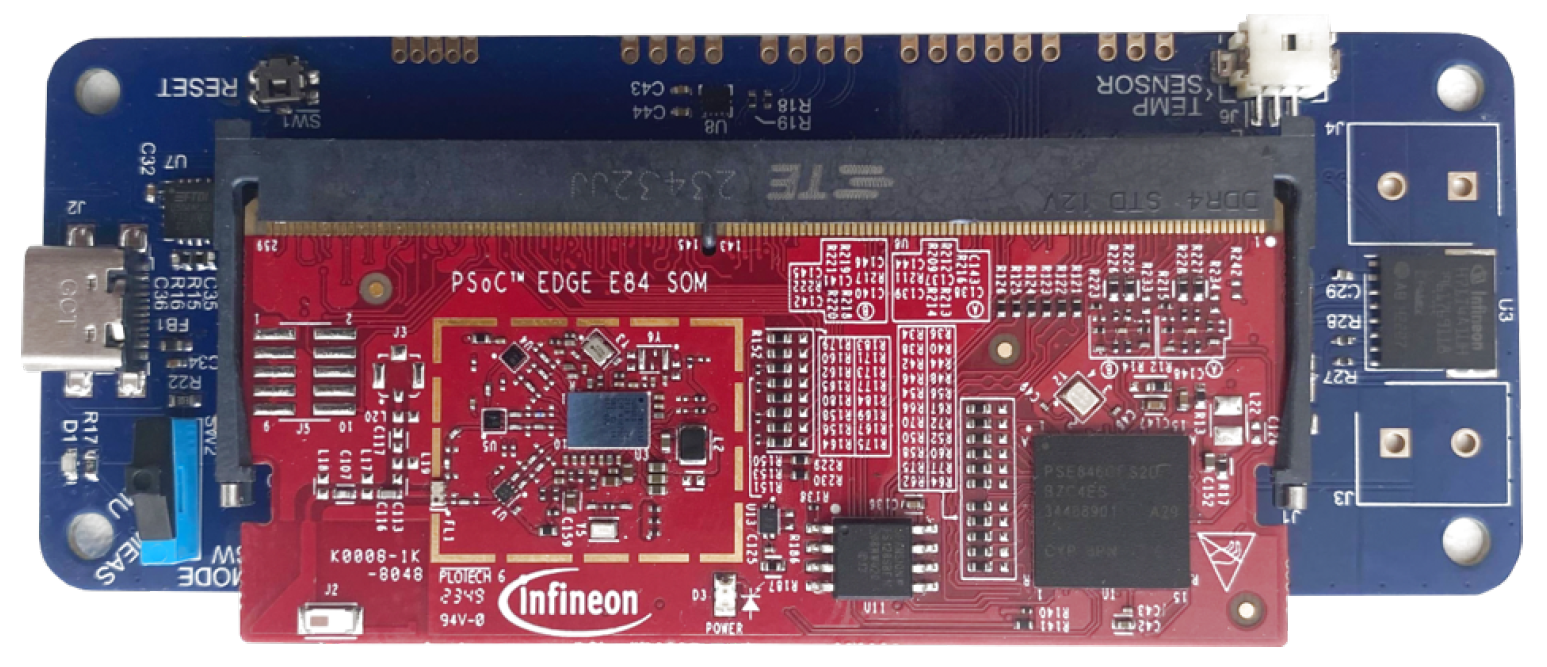
It will use a novel low-power PSoC Edge E84 SOM [59] as the core of the solution. It will enable the neural network to be deployed in harsh outdoor environments where the solar energy system is to be installed, with an operating temperature range from −20 to 70 °C for the consumer version and from −40 to 105 °C for the industrial version [60]. In parallel of the HW development, firmware (FW) development is being carried out using PSoC Edge as core where AI models would be integrated, as well as all necessary code to measure variables and communicate with other modules as a DC-DC converter based on FPGA. This custom HW as well as the PSOC Edge board are shown in Figure 19, where the custom HW is the blue board under the red board (PSOC Edge).
Apart from the required FW for the data acquisition, this system also includes a Bluetooth communication protocol integrated in the developed custom HW for the transmission of the system information, such as the AI model prediction, to an external device that the user could access for monitorization purposes. This module, as well as the previously mentioned module for the ANN model execution, the power management, and the sensing stage modules can be found in Figure 18, where the developed HW architecture is shown.
The AI algorithms, as shown in Figure 18 are executed at the network edge in the PSOC Edge device. This platform does not only include a Cortex M processing unit but also a dedicated AI accelerated unit, which improves the energy consumption and latency of the system. For the better deployment in this system, the ANN model is quantized. This process converts the parameters and mathematical operations in this algorithm from float values into integer values using eight bits. As a result of this, the memory footprint as well as the time required to execute this algorithm are highly reduced. However, due to the reduction in the precision of the parameters, the accuracy of the model may also drop. To try to mitigate this issue, this technique has been implemented during the training of the model, also known as quantization-aware training [61]. This way, the model can learn during the training process that its parameters will use eight bits, and it is able to take this into account during the training process.

5.3. AI Approach Results

In this subsection, the performance result of the proposed AI technique will be discussed. For this, Table 6 shows not only the performance results of the developed approach but also the performance of traditional techniques as well as the performance of the developed ANN model before its quantization for benchmarking purposes.
As shown in Table 6, it can be observed how the quantization process led to an accuracy reduction of the trained MLP model even when using the quantization-aware training. On the other hand, as previously mentioned, it can be observed how the same process also led to a latency reduction from 7 ms to 0.3 ms. To tackle the issue of the model accuracy drop, some of its latency has been sacrificed by integrating a P&O algorithm to further increase its accuracy to 99.73% at the cost of 0.0125 ms additionally consumed for the duty cycle estimation. These extra P&O iteration is, on average, five steps due to the close initial approximation of the MLP model. Due to this combination of our quantized MLP model as well as the P&O, it achieves higher performance than state-of-the-art P&O technique.
It is possible to observe how the P&O algorithm consumes 0.15 ms in comparison with the proposed method Quantized MLP (Int8) + P&O which requires 0.3125 ms even when this last method only needs seven iterations in comparison with the P&O, which requires sixty iterations. The traditional P&O method is still faster since, even when it needs a larger number of iterations, each iteration requires less calculations. This leads to a final faster execution even when the proposed method Quantized MLP (Int8) + P&O requires less iterations. Apart from the fact that the proposed method reduces the number of required iterations, it also has the benefit that, in highly changing scenarios, since the MLP model will provide a first estimation in a single iteration, it will converge faster than the traditional P&O algorithm which requires evaluating the whole space of the possible MPPT.
These algorithm’s accuracy can be later converted into the average energy production per year based on the information from the used dataset [39]. This information is also added in Table 6 where it is shown how the largest energy production is achieved with the float model due to its high accuracy, followed by the combination of the quantizied model and the P&O approach, which produces a 0.05% less energy per year on average.
Therefore, the use of this low-power microcontroller with Edge AI—which costs around $12 for small-scale purchases according to the manufacturer’s website [59]—represents a significant improvement in terms of the energy the system can achieve over time, especially in countries where energy costs are high and dependent on fluctuations in the price of fossil fuels. Furthermore, this concept could be scaled up to higher-power configurations, making its cost-effective implementation even more feasible.

6. Conclusions

Throughout this manuscript, the combined use of a topology that is currently unexploited in the state of the art, together with Edge AI for MPPT control in solar energy, is proposed. On the one hand, the active clamp forward-flyback resonant topology provides soft switching and forward energy transfer through capacitors, enabling high conversion efficiency while allowing a wide voltage range. On the other hand, the application of an Edge AI-based MPPT algorithm allows the energy obtained from the solar source to be maximized through smart prediction of weather fluctuations. To show these concepts, an experimental demonstrator is proposed with a DC-DC converter based on the topology that achieves an efficiency of up to 97.18% with silicon switches. Furthermore, MPPT control is implemented using Edge AI in a novel low-power microcontroller that enables intelligent local forecasting with few resources, achieving high accuracy of up to 99.98% in a non-quantized, single-iteration model and up to 99.73% in the quantized model tuned with seven iterations.

Author Contributions

Conceptualization, J.C.-C., J.M., M.M., N.R. and D.P.M.; methodology, J.C.-C., J.M. and M.M.; software, J.C.-C., J.M., M.M., J.P.-M. and A.M.-M.; validation, J.C.-C., J.M., J.P.-M. and A.M.-M.; formal analysis, J.C.-C. and J.M.; investigation, J.C.-C., J.M., M.M., J.P.-M. and A.M.-M.; resources, J.C.-C., J.M. and M.M.; data curation, J.M., M.M. and A.M.-M.; writing—original draft preparation, J.C.-C. and J.M.; writing—review and editing, J.C.-C., J.M., M.M., J.P.-M., A.M.-M., N.R. and D.P.M.; visualization, J.C.-C. and J.M.; supervision, N.R. and D.P.M.; project administration, J.C.-C., J.M., N.R. and D.P.M.; funding acquisition, J.C.-C., N.R. and D.P.M. All authors have read and agreed to the published version of the manuscript.

Funding

Research leading to these results has received funding from the Chips Joint Undertaking under grant agreement number 101139790 (ECS4DRES project) and its members, including the top-up funding by Germany, Italy, Slovakia, Spain, and The Netherlands. Infineon Technologies AG has sponsored this work.

Data Availability Statement

The original data presented in the study are openly available at https://data.nrel.gov/submissions/20, accessed on 28 March 2026.

Acknowledgments

We would like to thank the eesy-innovation GmbH team for their help with building the the demonstrator.

Conflicts of Interest

Javier Mendez and Alberto Martin-Martin are employees of Company HTEC GmbH Munich. Jorge Perez-Martinez is an employee of Company Infineon Technologies AG. The remaining authors have no conflicts of interest to declare. The funding sponsors had no role in the design of the study; in the collection, analyses, or interpretation of data; in the writing of the manuscript; or in the decision to publish the results.

Abbreviations

The following abbreviations are used in this manuscript:
ACAlternating current
ACFFActive clamp forward-flyback
AIArtificial intelligence
ANNArtificial neural network
DCDirect current
DRESDistributed renewable energy system
ESREquivalent series resistance
FWFirmware
GaNGallium nitride
HWHardware
MLPEModule-level power electronics
MOSFETMetal oxide semiconductor field effect transistor
MPPTMaximum power point tracker
PCBPrinted circuit board
PVPhotovoltaic
SiSilicon
RMSRoot mean square
SPOSolar power optimizer
VAPVVehicle-Added PV
VIPVVehicle-Integrated PV
ZCSZero current switching
ZVSZero voltage switching

References

  1. Guchhait, R.; Sarkar, B. Increasing growth of renewable energy: A state of art. Energies 2023, 16, 2665. [Google Scholar] [CrossRef] [Scilit]
  2. Shi, M.; Wang, H.; Xie, P.; Lyu, C.; Jian, L.; Jia, Y. Distributed energy scheduling for integrated energy system clusters with peer-to-peer energy transaction. IEEE Trans. Smart Grid 2023, 14, 142–156. [Google Scholar] [CrossRef] [Scilit]
  3. Razmi, D.; Lu, T.; Papari, B.; Akbari, E.; Fathi, G.; Ghadamyari, M. An overview on power quality issues and control strategies for distribution networks with the presence of distributed generation resources. IEEE Access 2023, 11, 10308–10325. [Google Scholar] [CrossRef] [Scilit]
  4. Jin, B. Impact of renewable energy penetration in power systems on the optimization and operation of regional distributed energy systems. Energy 2023, 273, 127201. [Google Scholar] [CrossRef] [Scilit]
  5. Nijsse, F.J.M.M.; Mercure, J.F.; Ameli, N.; Larosa, F.; Kothari, S.; Rickman, J.; Vercoulen, P.; Pollitt, H. The momentum of the solar energy transition. Nat. Commun. 2023, 14, 6542. [Google Scholar] [CrossRef] [Scilit] [PubMed]
  6. Rahdan, P.; Zeyen, E.; Gallego-Castillo, C.; Victoria, M. Distributed photovoltaics provides key benefits for a highly renewable European energy system. Appl. Energy 2024, 360, 122721. [Google Scholar] [CrossRef] [Scilit]
  7. Reddy, V.J.; Hariram, N.P.; Maity, R.; Ghazali, M.F.; Kumarasamy, S. Sustainable Vehicles for Decarbonizing the Transport Sector: A Comparison of Biofuel, Electric, Fuel Cell and Solar-Powered Vehicles. World Electr. Veh. J. 2024, 15, 93. [Google Scholar] [CrossRef] [Scilit]
  8. Ku, J.; Kim, S.M.; Park, H.D. Energy-saving path planning navigation for solar-powered vehicles considering shadows. Renew. Energy 2024, 236, 121424. [Google Scholar] [CrossRef] [Scilit]
  9. Oluwalana, O.J.; Grzesik, K. Solar-powered electric vehicles: Comprehensive review of technology advancements, challenges, and future prospects. Energies 2025, 18, 3650. [Google Scholar] [CrossRef] [Scilit]
  10. Yaqoob, M.; Lashab, A.; Vasquez, J.C.; Guerrero, J.M.; Orchard, M.E.; Bintoudi, A.D. A Comprehensive Review on Small Satellite Microgrids. IEEE Trans. Power Electron. 2022, 37, 12741–12762. [Google Scholar] [CrossRef] [Scilit]
  11. Sarr, A.; Soro, Y.M.; Tossa, A.K.; Diop, L. Agrivoltaic, a synergistic co-location of agricultural and energy production in perpetual mutation: A comprehensive review. Processes 2023, 11, 948. [Google Scholar] [CrossRef] [Scilit]
  12. Singh, D.B.; Mahajan, A.; Devli, D.; Bharti, K.; Kandari, S.; Mittal, G. A mini review on solar energy based pumping system for irrigation. Mater. Today Proc. 2021, 43, 417–425. [Google Scholar] [CrossRef] [Scilit]
  13. Wilson, J.O.N.; Lie, T.T. Off-grid EV charging stations to reduce the impact of charging demand on the electricity grid. In Proceedings of the 2022 7th IEEE Workshop on the Electronic Grid (eGRID), Auckland, New Zealand, 29 November–2 December 2022; pp. 1–5. [Google Scholar] [CrossRef] [Scilit]
  14. Pratheeba, C.; Muthuvinayagam, M.; Siva Ramkumar, M.; Rohith Bhat, C.; Maniraj, P.; Kumar, N.S. A review of an off grid solar DC system for rural houses. In Proceedings of the 2023 7th International Conference on Intelligent Computing and Control Systems (ICICCS), Madurai, India, 17–19 May 2023; pp. 1837–1843. [Google Scholar] [CrossRef] [Scilit]
  15. Alluhaybi, K.; Batarseh, I.; Hu, H. Comprehensive Review and Comparison of Single-Phase Grid-Tied Photovoltaic Microinverters. IEEE J. Emerg. Sel. Top. Power Electron. 2020, 8, 1310–1329. [Google Scholar] [CrossRef] [Scilit]
  16. Allahverdinejad, B.; Ajami, A.; Banaei, M.R. Design and implementation of a solar power optimizer for module level power electronics application. IET Power Electron. 2024, 17, 2531–2548. [Google Scholar] [CrossRef] [Scilit]
  17. Khanal, S.; Disfani, V. Modular multilevel converter design for grid integration of solar photovoltaic systems. In Proceedings of the 2020 IEEE Power & Energy Society General Meeting (PESGM), Montreal, QC, Canada, 2–6 August 2020; pp. 1–5. [Google Scholar] [CrossRef] [Scilit]
  18. Sarwar, S.; Javed, M.Y.; Jaffery, M.H.; Ashraf, M.S.; Naveed, M.T.; Hafeez, M.A. Modular Level Power Electronics (MLPE) based distributed PV system for partial shaded conditions. Energies 2022, 15, 4797. [Google Scholar] [CrossRef] [Scilit]
  19. Jagadeesh, I.; Indragandhi, V. Comparative Study of DC-DC Converters for Solar PV with Microgrid Applications. Energies 2022, 15, 7569. [Google Scholar] [CrossRef] [Scilit]
  20. Lin, Y.; Liu, Q.; Lin, L. An improved control strategy for quasi-resonant synchronous rectification flyback microinverter. In Proceedings of the 2025 IEEE 8th International Electrical and Energy Conference (CIEEC), Changsha, China, 16–18 May 2025; pp. 1942–1947. [Google Scholar] [CrossRef] [Scilit]
  21. Afshari, H.; Husev, O.; Matiushkin, O.; Pourjafar, S.; Kurdkandi, N.V.; Vinnikov, D. Comprehensive comparison of grid-connected flyback-based microinverter with primary and secondary side decoupling Approach. IEEE Trans. Ind. Appl. 2024, 60, 9080–9089. [Google Scholar] [CrossRef] [Scilit]
  22. Lin, Z.; Pan, S.; Chen, Y.; Lin, W.; Gong, J.; Zha, X. A dual-input mismatch power processing LLC converter for microinverter application. IEEE Trans. Ind. Electron. 2024, 71, 12487–12498. [Google Scholar] [CrossRef] [Scilit]
  23. Chen, Y.; Xu, D. Review of soft-switching topologies for single-phase photovoltaic inverters. IEEE Trans. Power Electron. 2022, 37, 1926–1944. [Google Scholar] [CrossRef] [Scilit]
  24. Ghosh, S.; Alhatlani, A.; Safayatullah, M.; Batarseh, I. Review of MPPT methods for LLC converters in photovoltaic applications. In Proceedings of the 2022 IEEE Energy Conversion Congress and Exposition (ECCE), Detroit, MI, USA, 9–13 October 2022; pp. 1–6. [Google Scholar] [CrossRef] [Scilit]
  25. Cruz-Cozar, J.; Medina-Garcia, A.; Morales, D.P.; Rodriguez, N. Resonant hybrid flyback: A novel topology with wide voltage range for DC microgrid applications. Energy Rep. 2023, 9, 3222–3234. [Google Scholar] [CrossRef] [Scilit]
  26. Medina-Garcia, A.; Schlenk, M.; Morales, D.P.; Rodriguez, N. Resonant hybrid flyback, a new topology for high density power adaptors. Electronics 2018, 7, 363. [Google Scholar] [CrossRef] [Scilit]
  27. Lin, J.Y.; Chen, C.T.; Lin, Y.F. Design and analysis of a high-efficiency dual-module asymmetrical half-bridge flyback converter with wide-output voltage range. Int. J. Circuit Theory Appl. 2025, 1–10. [Google Scholar] [CrossRef] [Scilit]
  28. Kallio, S.; Siroux, M. Photovoltaic power prediction for solar micro-grid optimal control. Energy Rep. 2023, 9, 594–601. [Google Scholar] [CrossRef] [Scilit]
  29. Zecevic, Z.; Rolevski, M. Neural network approach to MPPT control and irradiance estimation. Appl. Sci. 2020, 10, 5051. [Google Scholar] [CrossRef] [Scilit]
  30. Yan, K.; Du, Y.; Ren, Z. MPPT perturbation optimization of photovoltaic power systems based on solar irradiance data classification. IEEE Trans. Sustain. Energy 2019, 10, 514–521. [Google Scholar] [CrossRef] [Scilit]
  31. Muralikrishna, A.; dos Santos, R.D.C.; Vieira, L.E.A. Exploring possibilities for solar irradiance prediction from solar photosphere images using recurrent neural networks. J. Space Weather Space Clim. 2022, 12, 19. [Google Scholar] [CrossRef] [Scilit]
  32. Lopez-Guede, J.M.; Ramos-Hernanz, J.; Altın, N.; Ozdemir, S.; Kurt, E.; Azkune, G. Neural modeling of fuzzy controllers for maximum power point tracking in photovoltaic energy systems. J. Electron. Mater. 2018, 47, 4519–4532. [Google Scholar] [CrossRef] [Scilit]
  33. Khanam, J.J.; Foo, S.Y. Modeling of a photovoltaic array in MATLAB simulink and maximum power point tracking using neural network. Electr. Electron. Technol. Open Access J. 2018, 2, 40–46. [Google Scholar] [CrossRef] [Scilit]
  34. Chen, L.; Wang, X. Enhanced MPPT method based on ANN-assisted sequential Monte–Carlo and quickest change detection. IET Smart Grid 2019, 2, 635–644. [Google Scholar] [CrossRef] [Scilit]
  35. Rao, C.; Hajjiah, A.; El-Meligy, M.A.; Sharaf, M.; Soliman, A.T.; Mohamed, M.A. A novel high-gain soft-switching DC-DC converter with improved P&O MPPT for photovoltaic applications. IEEE Access 2021, 9, 58790–58806. [Google Scholar] [CrossRef] [Scilit]
  36. Cruz-Cozar, J.; Medina-Garcia, A.; Perez-Martinez, J.; Martos-Contreras, C.; Rodriguez, N.; Morales, D.P. Improvements through forward power transfer in an isolated flyback boost converter for solar applications. In Proceedings of the 2024 19th Conference on Ph.D Research in Microelectronics and Electronics (PRIME), Larnaca, Cyprus, 9–12 June 2024; pp. 1–4. [Google Scholar] [CrossRef] [Scilit]
  37. Alou, P.; Garcia, O.; Cobos, J.; Uceda, J.; Rascon, M. Flyback with active clamp: A suitable topology for low power and very wide input voltage range applications. In Proceedings of the APEC. Seventeenth Annual IEEE Applied Power Electronics Conference and Exposition (Cat. No.02CH37335), Dallas, TX, USA, 10–14 March 2002; Volume 1, pp. 242–248. [Google Scholar] [CrossRef] [Scilit]
  38. Kasper, M.; Burkat, R.; Deboy, F.; Kolar, J. ZVS of power MOSFETs revisited. IEEE Trans. Power Electron. 2016, 31, 8063–8067. [Google Scholar] [CrossRef] [Scilit]
  39. Wilcox, S.; Andreas, A. Solar Radiation Monitoring Station (SoRMS): Humboldt State University, Arcata, California (Data); Technical Report; National Renewable Energy Lab. (NREL): Golden, CO, USA, 2007. [Google Scholar]
  40. Mancilla-David, F.; Riganti-Fulginei, F.; Laudani, A.; Salvini, A. A neural network-based low-cost solar irradiance sensor. IEEE Trans. Instrum. Meas. 2014, 63, 583–591. [Google Scholar] [CrossRef] [Scilit]
  41. Masters, G.M. Photovoltaic materials and electrical characteristics. In Renewable and Efficient Electric Power Systems; John Wiley & Sons Ltd.: Hoboken, NJ, USA, 2004; Chapter 9; pp. 505–604. Available online: https://onlinelibrary.wiley.com/doi/pdf/10.1002/0471668826.ch9 (accessed on 28 March 2026).
  42. Housheng, Z. Research on MPPT for solar cells based on flyback converter. In Proceedings of the 2010 International Conference on Intelligent Computation Technology and Automation, Changsha, China, 11–12 May 2010; Volume 3, pp. 36–39. [Google Scholar] [CrossRef] [Scilit]
  43. Medina-Garcia, A.; Schlenk, M.; Cruz-Cozar, J.; Morales, D.P.; Rodriguez, N. Study of WBG Switches Benefits on Asymmetrical Half-bridge Flyback Converter. In Proceedings of the PCIM Europe Digital Days 2021; International Exhibition and Conference for Power Electronics, Intelligent Motion, Renewable Energy and Energy Management, Online, 3–7 May 2021; pp. 1–6. [Google Scholar]
  44. Martos-Contreras, C.; Medina-Garcia, A.; Perez-Martinez, J.; Rodriguez, N.; Morales-Santos, D.P. Achieving ZVS in Asymmetrical Half-Bridge Structures: A Thorough Analysis. IEEE Trans. Power Electron. 2026, 41, 3259–3269. [Google Scholar] [CrossRef] [Scilit]
  45. Kane, M.M.; Taylor, N.; Månsson, D. Electromagnetic Interference from Solar Photovoltaic Systems: A Review. Electronics 2025, 14, 31. [Google Scholar] [CrossRef] [Scilit]
  46. Zhang, Y.; Wang, S.; Chu, Y. Analysis and Comparison of the Radiated Electromagnetic Interference Generated by Power Converters With Si MOSFETs and GaN HEMTs. IEEE Trans. Power Electron. 2020, 35, 8050–8062. [Google Scholar] [CrossRef] [Scilit]
  47. Shahsevani, J.; Beiranvand, R. Application-Oriented Review of the LLC-Based Resonant Converters. IEEE Access 2024, 12, 52687–52726. [Google Scholar] [CrossRef] [Scilit]
  48. Amir, A.; Amir, A.; Che, H.S.; Elkhateb, A.; Rahim, N.A. Comparative analysis of high voltage gain DC-DC converter topologies for photovoltaic systems. Renew. Energy 2019, 136, 1147–1163. [Google Scholar] [CrossRef] [Scilit]
  49. Meshael, H.; Elkhateb, A.; Best, R. Topologies and Design Characteristics of Isolated High Step-Up DC–DC Converters for Photovoltaic Systems. Electronics 2023, 12, 3913. [Google Scholar] [CrossRef] [Scilit]
  50. Sutikno, T.; Purnama, H.S.; Widodo, N.S.; Padmanaban, S.; Sahid, M.R. A review on non-isolated low-power DC–DC converter topologies with high output gain for solar photovoltaic system applications. Clean Energy 2022, 6, 557–572. [Google Scholar] [CrossRef] [Scilit]
  51. Shang, M.; Wang, H.; Cao, Q. Reconfigurable LLC Topology With Squeezed Frequency Span for High-Voltage Bus-Based Photovoltaic Systems. IEEE Trans. Power Electron. 2018, 33, 3688–3692. [Google Scholar] [CrossRef] [Scilit]
  52. Wu, B.; Li, S.; Liu, Y.; Ma Smedley, K. A New Hybrid Boosting Converter for Renewable Energy Applications. IEEE Trans. Power Electron. 2016, 31, 1203–1215. [Google Scholar] [CrossRef] [Scilit]
  53. Hu, X.; Gong, C. A High Gain Input-Parallel Output-Series DC/DC Converter With Dual Coupled Inductors. IEEE Trans. Power Electron. 2015, 30, 1306–1317. [Google Scholar] [CrossRef] [Scilit]
  54. Paul, P.; Jose, B.R.; Shahana, T.K.; Abraham, C.; Mathew, J. High Gain Isolated Quasi-Switched Boost Converter Embedded with Switched Capacitor Cell. Electr. Power Components Syst. 2021, 49, 333–344. [Google Scholar] [CrossRef] [Scilit]
  55. Mirzaei, A.; Rezvanyvardom, M. High voltage gain soft switching full bridge interleaved Flyback DC-DC converter for PV applications. Sol. Energy 2020, 196, 217–227. [Google Scholar] [CrossRef] [Scilit]
  56. Chen, Y.T.; Tsai, M.H.; Liang, R.H. DC–DC converter with high voltage gain and reduced switch stress. IET Power Electron. 2014, 7, 2564–2571. [Google Scholar] [CrossRef] [Scilit]
  57. Pirashanthiyah, L.; Edirisinghe, H.N.; De Silva, W.M.P.; Bolonne, S.R.A.; Logeeshan, V.; Wanigasekara, C. Design and Analysis of a Three-Phase Interleaved DC-DC Boost Converter with an Energy Storage System for a PV System. Energies 2024, 17, 250. [Google Scholar] [CrossRef] [Scilit]
  58. Laxmi, N.; Kumar, V.V.; SV, S.T. Design and Assessment of DC-DC Interleaved Flyback Stage for Module-Integrated PV Microinverters. In Proceedings of the 2025 IEEE 1st International Conference on Smart and Sustainable Developments in Electrical Engineering (SSDEE), Dhanbad, India, 28 February–2 March 2025; pp. 1–6. [Google Scholar] [CrossRef] [Scilit]
  59. Next Generation MCU: Infineon Technologies. 2025. Available online: https://www.infineon.com/promo/next-generation-mcu (accessed on 15 January 2026).
  60. PSOC™ Edge | PSOC™ Edge Documentation. 2025. Available online: https://documentation.infineon.com/psocedge/docs/huf1750399463231 (accessed on 28 March 2026).
  61. Zhao, X.; Xu, R.; Guo, X. Post-training quantization or quantization-aware training? That is the question. In Proceedings of the 2023 China Semiconductor Technology International Conference (CSTIC), Shanghai, China, 26–27 June 2023; pp. 1–3. [Google Scholar] [CrossRef] [Scilit]
Figure 1. Simplified diagram of distributed PV energy electrically connected (in red) and communicated (in blue). The presence of edge AI in the distributed network allows nodes to make accurate, local decisions while interacting with the other components and with the electrical grid.
Jlpea 16 00013 g001
Figure 2. Architecture of the system studied in this work. The focus is on the highlighted box, which can act as a micro-optimizer for a DC grid, or as the first DC-DC stage upstream of a microinverter. Here, the MPPT algorithm is implemented to optimize the system’s energy harvesting for which the voltage and current of the solar panel ( V p v , I p v ) will be measured. They provide the actual power output of the solar panel ( P p v ).
Jlpea 16 00013 g002
Figure 3. Examples of topologies used as DC-DC converters in solar MLPE from the solar panel voltage ( V p v ) to the output voltage ( V o ): (a) Flyback converter, where Q 1 is the main switch, Q c and C c are the switch and the capacitor of the active clamp, L m is the magnetizing inductance of the transformer and D 1 is the rectifier diode. (b) Full bridge LLC, where Q 1 , Q 2 , Q 3 and Q 4 are the switches in the full bridge, L m is the magnetizing inductance, L r and C r are the resonant inductance and capacitance, and D 1 , D 2 , D 3 and D 4 are the rectifier diodes.
Jlpea 16 00013 g003
Figure 4. Basic diagram of the active clamp forward-flyback topology. V p v represents the voltage provided by the PV panel and V o the output voltage of the converter.
Jlpea 16 00013 g004
Figure 5. Basic waveforms of the active clamp forward-flyback topology. The figure contains four graphs (top to bottom) as follows: gate-source voltage of Q 1 and Q 2 ( v G S 1 and v G S 2 ); drain-source voltage of Q 1 and Q 2 and C s n ( v D S 1 , v D S 2 and v C s n ); currents through L m , Q 1 and Q 2 ( i L m , i Q 1 and i Q 2 ); current through D 1 and D 2 ( i D 1 and i D 2 ).
Jlpea 16 00013 g005
Figure 6. Operating stages of the proposed converter. The direction of the current is indicated by the arrows: (a) L m and C r charge. (b) L m charge. (c) Energy transfer. (d) Circulating energy.
Jlpea 16 00013 g006
Figure 7. Equivalent electrical circuit diagram of a PV module.
Jlpea 16 00013 g007
Figure 8. Equivalent converter resistance for solar panel polarization.
Jlpea 16 00013 g008
Figure 9. Diagram of developed neural network structure. First layer (in orange) has sigmoid activation, output layer (in green) has a linear activation, and the rest of the network (hidden layers marked in blue) includes ReLu activation.
Jlpea 16 00013 g009
Figure 10. Different electrical performance curves of a 72-cell, 230 W commercial PV panel under different temperature (T) and irradiance (G) circumstances: (a) Power vs. voltage. (b) Current vs. voltage, where R e q , m i n [Equation (7)] is shown for different values of turn ratio N. The red arrow indicates the direction of the V-I range that the converter is able to achieve with its R e q .
Jlpea 16 00013 g010
Figure 11. Effect of turn ratio N over: (a) Withstand voltage of the components. (b) Input to output voltage gain. A nominal working voltage of V p v = 37 V and V o = 400 V is considered.
Jlpea 16 00013 g011
Figure 12. Diagram summarizing the system design.
Jlpea 16 00013 g012
Figure 13. Estimation of losses in the converter based on parasitic components: (a) Non-idealities to consider in the ACFF topology. (b) Theoretical results for the chosen design at nominal condition (G = 1000 W/m2, T = 25 °C, V p v = 37 V, V o = 400 V, P = 230 W).
Jlpea 16 00013 g013
Figure 14. Demonstrator of the proposed hardware (HW) solution. The diagram highlights the two blocks on which the experimental section focuses: on the one hand, the power stage, developed in Section 5.1, and on the other hand, the implementation stage of MPPT control using Edge AI, explained in Section 5.2.
Jlpea 16 00013 g014
Figure 15. DC-DC converter prototype based on active clamp forward-flyback resonant topology built for the experimental tests.
Jlpea 16 00013 g015
Figure 16. Experimental measurements of power stage efficiency for different cases. (a) Efficiency vs. load at nominal weather conditions (G = 1000 W/m2, T = 25 °C). (b) Efficiency at nominal conditions for different irradiances.
Jlpea 16 00013 g016
Figure 17. Waveforms of the DC-DC converter for the nominal case (G = 1000 W/m2, T = 25 °C, V p v = 37 V, V o = 400 V, P = 230 W.).
Jlpea 16 00013 g017
Figure 18. Diagram of the proposed HW solution for the MPPT implementation. It shows the various components that make up the PCB designed for the interface of the microcontroller with the system: voltage (V) and current (A) sensors, communication modules (UART, I2C, and BLE), and power supply V D D .
Jlpea 16 00013 g018
Figure 19. Prototype of the proposed HW solution for the MPPT implementation.
Jlpea 16 00013 g019
Table 1. Possible configurations for neural network’s hyperparameters evaluated with GridSearch technique, where 4 possible values for the layer/neurons, 3 possible learning rates, and 4 values for the batch size were evaluated.
Candidate Hyperparameters
StructureLearning RateBatch Size
[5, 64, 128, 64, 2]0.018
[5, 64, 128, 128, 64, 2]0.00116
[5, 64, 128, 256, 128, 64, 2]0.000132
[5, 64, 128, 256, 256, 256, 128, 64, 2]64
Table 2. Additional parameters used for the training of the developed MLP.
ParametersValue
Training samples336,077
Test samples172,259
Epochs50
Learning rate0.001
Batch size32
Table 3. Withstand voltage of the different converter components.
ComponentWithstand Voltage
Resonant capacitor V C r = N · V p v
Switches V Q 1 , V Q 2 = V o / N
Diodes V D 1 , V D 2 = V o
Snubber capacitor V C s n = N · V p v V p v
Table 4. List of relevant components.
ComponentDeviceValues
Q 1 & Q 2 ISC044N15NM6
Infineon OptiMOSTM 6
150 V, 4.4 mΩ, 1200 pF
D 1 IDD05SG60C Infineon
SiC Schottky Diode
600 V, 5 A, 6 nC
D 2 IDD03SG60C Infineon
SiC Schottky Diode
600 V, 3 A, 3.2 nC
C r x6 MLCC-SMD 1206-X7R200 V, 0.156 μF
C s n x5 MLCC-SMD 1206-X7R100 V, 470 nF
TransformerCore: EQ38/25-3C95
N p = 4, x2 TIW Litz (180 × 0.1 mm)
N s = 14, Litz (80 × 0.1 mm)
L m = 5.6 μH
L r = 220 nH
Table 5. Comprehensive comparison of power converters used as step-up DC/DC converters in solar applications.
Proposed
Converter
Converter
in [51]
Converter
in [52]
Converter
in [53]
Converter
in [54]
Converter
in [55]
Converter
in [56]
Maximum
efficiency
97.18%96.10%94.44%94.37%95.80%92.00%96.84%
Output
power
230 W300 W240 W200 W250 W300 W300 W
Tested input
voltage V p v
35–40 V25–50 V35 V18–36 V20–40 V25–35 V26 V
Tested output
voltage V o
300–400 V760 V380 V200 V400 V400 V400 V
Working
frequency
200 kHz75–110 kHz40 kHz40 kHz10–20 kHz100 kHz50 kHz
Voltage
gain
N ( 1 D ) [51] 3 D ( 1 D ) 2 ( N + 1 ) ( 1 D ) 4 N ( 1 2 D ) D 2 N ( 1 D ) [56]
Switches
stress
V o N V p v 1 ( 1 D ) V o 2 ( N + 1 ) 4 V p v ( 1 2 D ) V p v V p v ( 1 D ) 2
N° of
switches
2612341
N° of
diodes
28445107
N° of
magnetics
1124244
N° of
capacitors
2544426
Total
components
7201114142018
IsolatedYesYesNoNoYesYesNo
Table 6. Performance result benchmark including the proposed algorithm (with and without the quantization process) as well as other reference techniques. The results correspond to an average value computed over the entire dataset.
ModelNumber of
Iterations
LatencyAccuracy (%)Generated Energy (kWh)
Proposed MLP (Float32)17ms99.98321.83
Quantized proposed MLP (Int8)10.3 ms95.83308.47
Quantized proposed MLP (Int8) + P&O70.3 ms + 0.0125 ms99.73321.02
P&O600.15 ms99.13319.09
Disclaimer/Publisher’s Note: The statements, opinions and data contained in all publications are solely those of the individual author(s) and contributor(s) and not of MDPI and/or the editor(s). MDPI and/or the editor(s) disclaim responsibility for any injury to people or property resulting from any ideas, methods, instructions or products referred to in the content.