Abstract
As power electronics continue to advance, the demand for highly efficient and low-loss DC/DC converters has grown significantly. This article comprehensively analyses ZCS quasi-resonant switch cell losses and efficiency in buck L-type zero-current switching (ZCS) quasi-resonant DC/DC converters. The main part of the study includes a comparative analysis of conduction losses in semiconductor switches of conventional PWM buck converters and zero-current switching (ZCS) quasi-resonant buck converters (L-type), utilizing both specific and generalized design equations. Novel coefficients are introduced that enable the evaluation of static power losses in the classical buck converter compared to those in L-type ZCS buck quasi-resonant converters under identical conditions. The article also discusses design considerations aimed at minimizing static losses. An L-type half-mode zero-current switching (ZCS) buck quasi-resonant DC/DC converter (QRC) is implemented to verify the analytical results. Various simulations were conducted using PSpice in the Texas Instruments simulation environment, along with experimental studies at different switching frequencies and load conditions. The proposed methodology integrates both analytical and simulation approaches to analyze energy losses and key parameters influencing the converter’s efficiency. The obtained results show that the relative error between the analytical, simulation, and experimental results is below 5%.
1. Introduction
The enhancement of secondary power sources, based on high-frequency voltage pulse converters, is intended to optimize their energy characteristics and ensure their performance, thereby meeting the outlined requirements of the design specification. In modern power electronics, the efficiency of power DC/DC converters is crucial for minimizing losses and enhancing reliability, which is significantly influenced by the operating temperature [1,2]. A methodology that has been employed to mitigate the switching losses of semiconductor switches involves the utilization of resonant circuits to achieve soft switching in current and/or voltage. This class of DC/DC converters is designated as quasi-resonant in the existing literature [3,4,5,6,7,8,9,10,11].
Without a detailed discussion of the advantages and disadvantages of these converters, since these issues have been comprehensively reviewed in numerous publications [9,10,11,12,13,14], the focus here is on analyzing the quasi-resonant converter (QRC) with power switching at zero current. The integration of resonant circuits within the power transistor circuit, where switching at zero current can be achieved, represents a promising area for the advancement of power conversion equipment, thereby reducing the dynamic losses in power semiconductor switches to a negligible level. The current and voltage shapes become close to sinusoidal, which contributes to the reduction in losses in the magnetic circuits of the inductances of the output filters and power transformers in the circuits.
The main applications benefiting from quasi-resonant converters with zerocurrent switching (ZCS) are in the following industrial applications: consumer electronics (e.g., laptops, tablets, and smartphones) [15], server application [16]; LED lighting systems [17]; battery management systems for electric vehicles (EVs) and storage [18,19,20]; renewable energy applications [21]; medical devices requiring low EMI and high reliability [22,23,24]. Buck ZCS (zero-current switching) quasi-resonant converters are particularly well suited to low to medium power applications.
Despite the aforementioned advantages over classical pulse converters with rectangular current and voltage waveforms, the maximum current and voltage values during the resonant process in QRC circuits can significantly exceed the analogous values in classical circuits. Furthermore, the inherent complexity of QRCs necessitates a comprehensive investigation of the various parameters inherent to the power part of the converter, where the switching devices are turned off/on at zero-current values within a designated control range. This necessity gives rise to the investigation of electromagnetic processes within QRC circuits.
Despite the availability of numerous studies related to the analysis, modeling, and design of quasi-resonant ZCS DC/DC converters [25,26,27,28,29,30,31], there is a paucity of research regarding the estimation of static power losses in classical buck converters and ZCS buck QRC circuits. The objective is to determine the selection of such parameters that will result in minimal static losses for a given output power control range.
The objective of this paper is to establish a theoretical framework and to provide practical recommendations for the performance evaluation of this converter. This is achieved by addressing the fundamental principles of operation, loss modeling, and optimization options. This analysis is of critical importance for electronic system designers pursuing efficient and reliable energy management solutions in a range of applications, including industrial systems and consumer electronics.
This article presents a comparative analysis of the conduction losses in semiconductor switches of conventional PWM buck converters and zero-current switching (ZCS) quasi-resonant buck converters (L-type). Novel coefficients are introduced that allow for evaluating the static power losses in the classical buck converter circuits vs. static power losses in L-type ZCS buck QRCs (under identical conditions). These coefficients can be used as a methodology of predicting the static losses in the switching devices of the classical PWM and ZCS QRCs buck circuits. The study also examines resonant tank losses. While they are generally smaller than switching losses, they have the potential to significantly affect the overall efficiency of ZCS buck QRCs, especially at high frequencies or light loads. Proper design and component selection are essential to minimize these losses and ensure optimum converter performance.
The work is organized as follows: In Section 2, the approximate analysis of the electromagnetic processes in quasi-resonant L-type ZCS buck QRCs are presented. The converter’s main characteristics are analytically and graphically received. The obtained dependencies are in a general form, i.e., without including the internal parameters of the investigated converters, which allows for some generalized estimates to be made for the static losses of the switching devices for any conditions and parameters within the realization conditions of the corresponding ZSC buck QRC mode. Design considerations to receive minimum static losses are discussed. In Section 3, the efficiency for the L-type ZCS buck QRC due to the resistive resonant tank losses are studied. A discussion on choosing the circuit’s parameters is presented. In Section 4, a simulation and experimental study of half-mode L-type ZCS QRC are presented.
2. Approximate Analysis and DC Voltage Conversion Ratio for the L-Type ZCS QRC
The circuits of the quasi-resonant L-type ZCS buck QRCs (half-mode and full-mode) are shown in Figure 1.

Figure 1.
L-type ZCS buck QR converter: (a) half-wave mode; (b) full-wave mode.
The L-type configuration entails the connection of the resonant capacitor in parallel with diode D2, and the resonant inductor in series with the transistor Q1. In the converter depicted in Figure 1a (half-mode), the diode D1 is connected in series with transistor Q1. Consequently, the switch Q1–D1 is closed when the current of the inductor first passes through zero.
To achieve full-wave mode operation of the ZCS buck QRC from the half-wave mode, an antiparallel diode (DS) is added across the switch Q1–D1 (Figure 1b). In the full-wave mode, the transistor must be turned off during the interval when the resonant inductor current is negative. A MOSFET can facilitate full-wave mode without external diodes D1 and DS, as it contains an internal drain-source body diode. However, this approach is less effective at high frequencies due to the slow reverse recovery of the MOSFET’s body diode. Furthermore, the efficiency of the circuit can be improved by using a Schottky diode as an antiparallel diode or using MOSFET with a monolithic Schottky diode. A further method of enhancing the efficiency in the half-mode of the circuit would be to substitute the diode D1 with a synchronous rectifier.
In both circuit configurations, the values of the resonant capacitor and resonant inductor are relatively small. Furthermore, the resonant frequency is higher than the switching frequency of the transistor (). The following equation determines the resonant frequency:
During this study, the static losses in the switching devices in an L-type ZCS buck QRC are evaluated, and a comparison is made with similar losses in a classical PWM buck converter with the same topology under other identical conditions, including input and output voltage, load current, and using semiconductors devices.
In this case of ZCS buck QRC, it is assumed that the main part of the power losses are the conduction losses in the switching devices, which are found to be significantly influenced by the operation mode (half-mode or full-mode), the resonant tank parameters, and the types of semiconductor switches. Consequently, the objective of the analysis can be narrowed down to ascertaining the ratio of the static power dissipated on the switching devices in a classical buck converter and the static power dissipated on the switching devices in an L-type ZCS buck QRC.
2.1. Half-Wave L-Type ZCS Buck QR Converter
The analysis of electromagnetic processes is based on the studies presented in [10]. Semiconductor switches are considered ideal. Thus, they have no forward voltage drop during on-state, no off-state leakage current, and instantaneous switching without delays. The impact of the output current ripple is negligible. Thus, the operation of the output filter and load are considered to be equivalent to a constant current sink with a value equivalent to the steady-state output current (Figure 2).

Figure 2.
Simplified circuit of half-wave L-type ZCS buck QRC.
Figure 3 shows typical circuit waveforms of transistor’s Q1 control pulse , current through the inductor and voltage across the capacitor for one half-period of the converter operation in a half-wave mode.
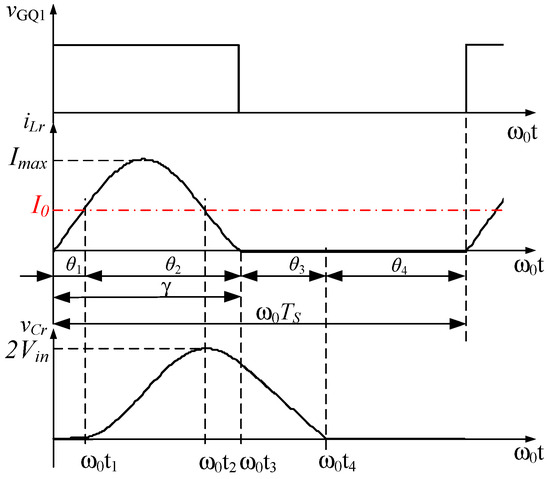
Figure 3.
Half-wave L-type ZCS buck QRC waveforms.
Each switching interval is divided into four subintervals, denoted by the interval lengths , , , and . The switching interval is considered to start when transistor Q1 is turned on. The initial conditions for the inductor current and the voltage across the capacitor are zero.
The following quantities are introduced:
- Resonant inductor charging interval
In the first subinterval , all switching devices are turned on (Q1, D1, D2). Diode D2 is forward-biased since the current is smaller than the output current .
This mode is valid for 0 ÷ , where current is given by
with an initial condition . In this subinterval, the inductor current rises linearly. The solution of (5) is given by
This mode ends at when or
Thus, the subinterval can be expressed as
The voltage across the resonant capacitor at the end of is .
- Resonant interval
This mode is valid for ÷ . During the second subinterval , transistor Q1 and the diode D1 remain on, while the diode D2 is reverse-biased.
The resonant circuit – is excited by constant sources and . The system gives the circuit equations in this interval:
with initial conditions
Solutions to (9) are written as follows:
The second subinterval ends when the current reaches the first zero value. The duration of the second subinterval can be determined by [10]
where
To achieve zero-current switching conditions, the current through the resonant inductor must naturally reach zero. To achieve this condition, it is necessary to provide [10]
If the load current is too high and Equation (14) is not satisfied, the inductor current will not reach zero, and the transistor will not turn off.
Therefore, for the normalized values of the output current , the following relationship applies:
For the normalized value of the output current , the following expressions are also valid:
Based on (14)–(16) for the normalized value of the load, it is necessary to satisfy the inequality
At the end of the second subinterval, diode D1 is switched off as a reverse voltage is applied, causing transistor Q1 to turn off at zero current.
In half-mode, transistor Q1 is turned off naturally when the resonant current reaches zero.
- Resonant capacitor discharging interval
This mode is valid for ÷ . During the third subinterval , transistor Q1 and diode D1 are off. The tank capacitor is discharged by the current through the filter inductor , causing the voltage across the tank capacitor to decrease linearly to zero. The equation for the circuit follows:
Solving (18) is performed as follows:
Subinterval concludes when the voltage across the tank capacitor drops to zero. Diode D2 becomes forward-biased. Therefore,
The angular duration of the switching period is
Substituting (8), (12), and (20) into (21), we can obtain the equation for the output characteristics of L-type half-wave ZCS buck QRC. The output characteristics for this half-wave mode can be expressed through the dependence
It should be noted that the DC voltage conversion ratio in Equation (22) is also referred to as for the half-wave operation. The dependencies at different values of the frequency ratio ν are plotted in Figure 4.
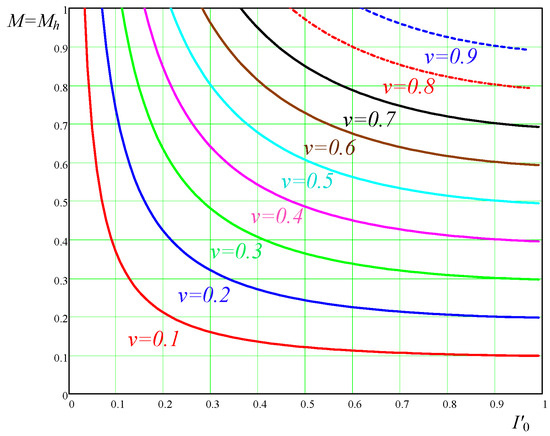
Figure 4.
L-type half-wave ZCS buck QRC output characteristics.
The DC voltage gain in the half-wave mode is highly responsive to changes in the load.
Taking into account (16), expression (22) for the DC voltage conversion ratio can also be expressed as follows:
Taking into account (23), in [31] the functions and square-root terms can be approximated as follows:
However, it should be noted that this simplification reduces the accuracy of (24). For example, in the range of , the relative error of substituting by is below 3%; in the range of , the relative error is from 4.8% to 10.7%, and in the range of , the relative error is from 15.9% to 24.4%.
This reduction in complexity, however, permits an explicit solution for M, as demonstrated by the following expression:
Three-dimensional plots showing dependencies in the DC voltage conversion ratio as a function of frequency ratio ν and normalized load resistance are illustrated in Figure 5.
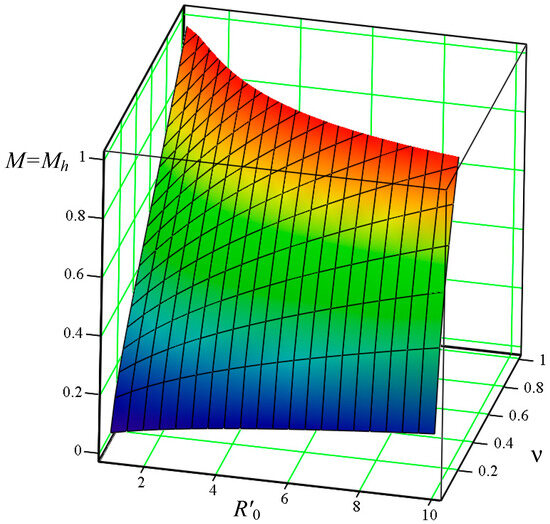
Figure 5.
Three-dimensional plots for dependencies in the DC voltage conversion ratio .
Based on (24), the dependence of the frequency ratio ν from the normalized load resistance and DC voltage conversion ratio is given by
The approximate results of the characteristics (26) are plotted in Figure 6a at the different values of the DC voltage conversion ratio . Three-dimensional plots showing dependencies for frequency ratio ν as a function of normalized load resistance and DC voltage conversion ratio are illustrated in Figure 6b.
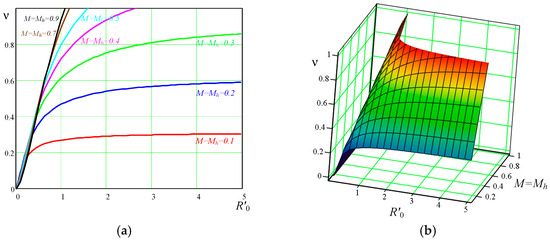
Figure 6.
(a) Two-dimensional plots showing dependencies for frequency ratio ν from the normalized output load. (b) Three-dimensional plots showing dependencies for frequency ratio .
The results in Figure 5 demonstrate the output voltage regulation range in the half-mode depending on the load variation.
- Freewheeling interval
During this fourth subinterval , the output current flows through diode D2.
2.2. Full-Wave L-Type ZCS Buck Quasi-Resonant Converter
The circuit of the full-mode L-type ZCS buck QRC is presented in Figure 1b. The resonant inductor current can reverse direction, as shown in the waveforms in Figure 7.
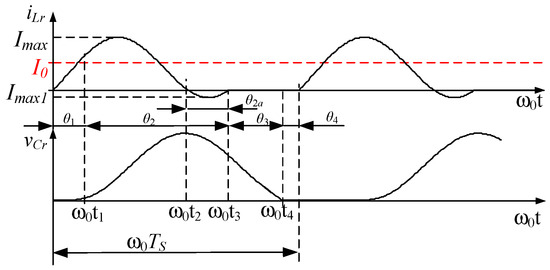
Figure 7.
Full-wave L-type ZCS buck QRC waveforms.
For the full-mode L-type ZCS buck QRC, approximate equations for estimating DC voltage gain are given in Table 1 [10]. It has been established that in contrast to the behavior exhibited by a half-wave mode in a full-mode, the resonant current , upon reaching a state of zero (), continues to oscillate as stored energy is fed back into the power source through diode D1 until .

Table 1.
L-type ZCS buck QRC full-mode dependencies.
It should be noted that the DC voltage conversion ratio in Equation (34) is also referred to as for the full-wave operation. It was evident from (34) that in a full-wave mode, the circuit’s ability to regulate output voltage is relatively insensitive to load variations because the energy dynamics of the tank circuit self-adjust with changing loads, or the full-wave mode naturally balances energy transfer between the source and load.
2.3. Estimation of Static Power Losses in an L-Type Quasi-Resonant Buck ZCS Converter
Despite the numerous advantages of resonant and quasi-resonant converters over traditional pulse width modulation (PWM) converters with rectangular waveforms in the power circuit, the peak current and voltage values during the resonant cycle can significantly exceed those seen in conventional DC/DC converters. Moreover, these values may also greatly exceed those of conventional converters, which increase the demands on the performance limits of the semiconductor power components.
To draw a comparison between the static power losses in the switching transistor of a conventional step-down converter with pulse-width modulation (PWM) and an L-type quasi-resonant buck converter with zero-current switching, it is necessary to analyze the root-mean square (RMS) current values. This is because the RMS current through the transistor is directly proportional to the losses.
Based on (34), the following expression is introduced [10]:
The transistor’s RMS current of the L-type half-mode ZCS buck QRC is given by
where
The following analysis assumes that the switching ripple in the converter’s filter elements, L0 and C0, is negligible. Then, the RMS current value of an ideal PWM buck converter is given by
In this study, the parameter is introduced to indicate the ratio of the RMS current value of the transistor operating in PWM mode to that of the L-type ZCS buck QRC under identical conditions, thus allowing for a more in-depth analysis of the static losses in the switching transistor. This parameter is defined as a function of the normalized load current, as follows:
The graphical representation of (39) is given in Figure 8.
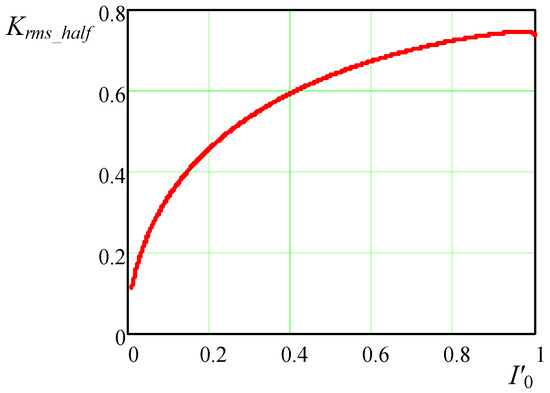
Figure 8.
Dependence of parameter on normalized output current .
Based on the obtained results, it is evident that the static losses in the switching device of the quasi-resonant converter in half-mode are more significant than in the traditional buck PWM, as at , .
Following the analysis performed, dependency (36) can be simplified as follows:
To estimate the static losses in the half-wave ZCS buck QRC circuit, it is also necessary to consider the static losses on diode D1. The following relationship is valid for the static losses on the Q1–D1 switch:
where is on-resistance of the MOSFET; is a forward voltage drop of the diode; and is an average current through the diode.
For the average current through diode D1 is received:
Thus, make a comparison between the power losses in the conventional buck PWM converter and the half-mode ZSC buck QRC, it is necessary to ascertain the ratio:
Substituting (36), (38), and (42) into (43) for the power losses ratio between the two circuits yields:
Expression (44) depends on the parameters of the semiconductor devices used and the load. The graphical representation of (44) at is given in Figure 9.
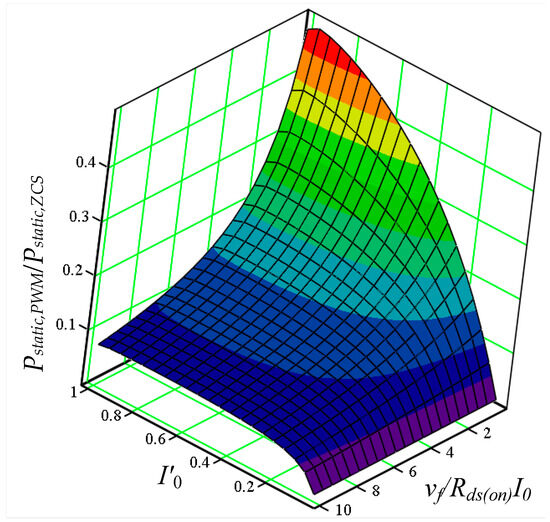
Figure 9.
Dependence of the power loss ratio in the conventional buck PWM converter and half-mode ZSC buck QRC as a function of normalized output current and the circuit’s parameters .
To minimize the static losses in the ZCS buck QRC in half-mode, it can be seen that it is necessary to choose parameter close to unity (), and the circuit’s parameters are necessarily smaller.
The same approach is also applied to estimate the ratio of the RMS transistor current value in the PWM buck converter to the RMS current value of a full-wave ZCS buck QRC under other identical conditions. For the full-mode, parameter is introduced as follows:
The coefficient is sketched in Figure 10.
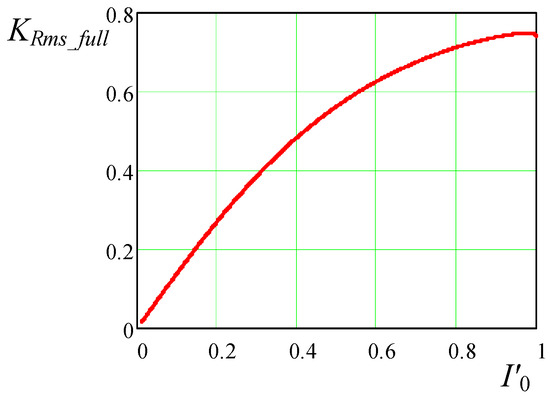
Figure 10.
Dependencies of parameters on normalized output current .
The results demonstrate that the static losses in the transistor of the quasi-resonant converter in full-mode are more significant than in traditional buck PWM (,), which is analogous to the results in half-mode.
If the input, output voltage, and load current are stable or change insignificantly, the parameters of the resonant tank should be selected so that the parameter is close to unity (), which minimizes the static losses. In other words, an L-type quasi-resonant buck ZCS converter operating in half-wave and full-wave modes can be more efficient compared to a conventional buck PWM, provided that the dynamic losses in the buck PWM switching exceed the static losses in the QRC buck ZCS.
The obtained dependencies are in a general form, i.e., without including the internal parameters of the investigated converters, which allows for some generalized estimates for the static losses in the switching devices for any conditions and parameters within the realization conditions of the corresponding ZSC buck QRC mode.
It also should be noted that subinterval 4, characterized by an angular length of , corresponds to the diode conduction phase in the conventional PWM switch network. During this subinterval, diode D2 carries the filter inductor current , while the tank capacitor voltage remains zero. Transistor is in the off state, resulting in an input current of zero.
3. Efficiency for the L-Type ZCS QRC with Resonant Tank Losses
3.1. Resistive Losses in the Circuit with the Resonant Inductance
To ascertain the resistive losses in the circuit of the resonant inductance, the approach proposed in [31] is employed. denotes the resistive losses in the resonant inductance circuit and denotes the resistive losses in the resonant capacitor circuit. The converter efficiency due to each of these losses is calculated separately to gain insight into the impact of each. The efficiency of the two types of losses is determined by the superposition of the individual losses, which is a valid approximation.
The present analysis operates under the assumption that the addition of parasitic resistances remains sufficiently negligible to induce a change in the shape of the current through the resonant inductance or the current through the resonant capacitor. This is a valid assumption since the objective of any design is to maximize the efficiency of the circuit.
- The efficiency is given by the following relationships
Considering (36), (16) (46), and (49), the efficiency of the half-wave L-type ZCS buck QRC circuit due to can be written as
It should be noted that the efficiency in Equation (50) is also referred to as for the half-wave operation. Using (50), to evaluate the impact of on efficiency at different values of , the characteristics at ν = const are plotted.
Figure 11a presents the results at . Figure 11b presents 3D dependencies of efficiency due to resistive losses related to and frequency ratio at .
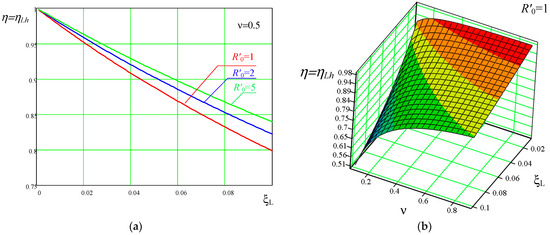
Figure 11.
Efficiency due to resistive losses related to in half-mode: (a) efficiency at for different normalized loads; (b) efficiency at frequency ratio and .
The results shown in Figure 11 highlight the importance of carefully selecting the components in the resonant circuit, as they significantly impact the overall efficiency of ZCS buck QRCs.
The next step in the analysis is to define the efficiency of the full-mode circuit. The transistor’s RMS current of the L-type full-mode ZCS buck QRC is given by:
Then, equating the ratio
Considering (46), (51), and (52), the efficiency of the full-wave L-type ZCS buck QRC circuit due to the presence of can be written as
The graphical representation of (53) taking into account (34) at is given in Figure 12.
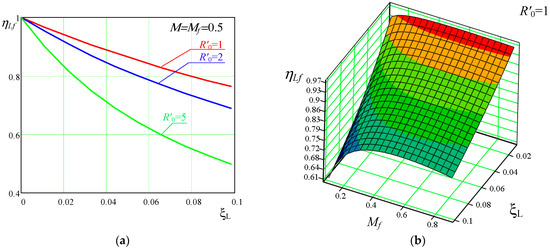
Figure 12.
Full-mode efficiency due to resistive losses related to : (a) efficiency at for different normalized loads; (b) 3D plot of efficiency at .
3.2. Resistive Losses in the Resonant Capacitor Circuit
To determine these losses under [31], we have in the half-mode ZCS buck QRC
Solving (54) yields:
where is a damping factor related to .
The efficiency due to is given by [31]:
In Figure 13a, (56) is plotted as a function of damping factor at . Figure 13b presents the 3D plot of efficiency due to resistive losses related to and frequency ratio at .
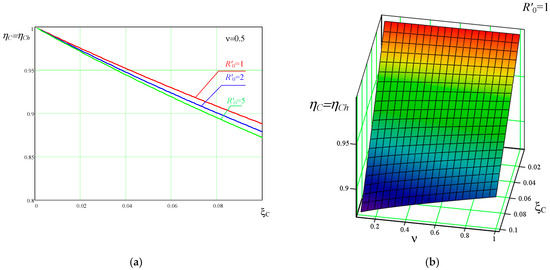
Figure 13.
Efficiency due to resistive losses related to in half-mode: (a) efficiency at for different normalized loads; (b) efficiency —frequency ratio and .
To determine the overall efficiency of the half-mode ZCS buck QRC due to resistive losses related to and , (49) and (56) can be combined as follows:
The 3D plots of (57) at and different normalized load resistances are illustrated in Figure 14.
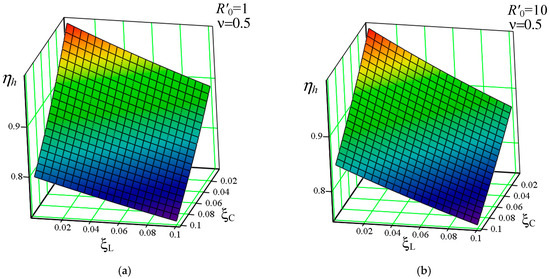
Figure 14.
Efficiency due to resistive losses related to and at in the half-mode: (a) normalized load resistance ; (b) normalized load resistance .
To determine the resistive losses in the resonant capacitor circuit in the full-mode according to [31], we have
Considering (46), the efficiency due to is given by [31]:
The graphical representation of (59) taking into account (34) at is given in Figure 15.
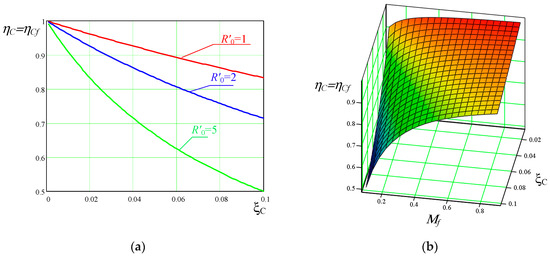
Figure 15.
Efficiency due to resistive losses related to : (a) efficiency at for different normalized loads; (b) 3D plot of efficiency at .
To determine the overall efficiency of the full-mode ZCS buck QRC due to resistive losses related to and , (52) and (59) can be combined as follows:
The 3D plots of (60) at and different normalized load resistances are illustrated in Figure 16.
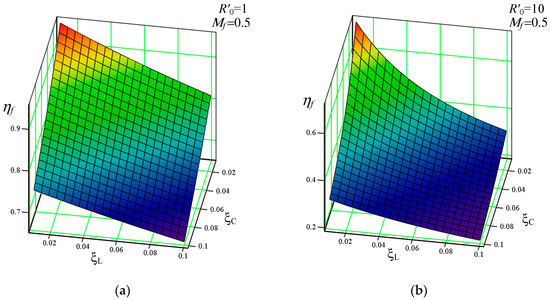
Figure 16.
Efficiency due to resistive losses related to and at in full-mode: (a) normalized load resistance ; (b) normalized load resistance .
An important design consideration for quasi-resonant converters (QRCs) is to select the normalized load resistor equal to the maximum voltage conversion ratio M. This minimizes peak current stress in the transistor and maximizes efficiency, as both are linked to lower RMS current and reduced losses. In ideal conditions, full-wave and half-wave mode resonant waveforms are identical when , requiring precise transistor turn-off timing for zero-current switching. However, practical designs are often set to , which allows a margin for transistor on-time. Proper timing for turning off the transistor depends on the mode: in half-wave mode, it occurs after the resonant-inductor current returns to zero but before the resonant-capacitor voltage falls below the input voltage, whereas in full-wave mode, it occurs during the negative resonant-inductor current interval.
4. Simulation and Experimental Results
A 25 W, L-type half-mode ZCS buck QRC DC/DC is implemented to verify the results of the analysis. The resonant circuit elements are set at 660 kHz and evaluated as follows [3,4,5,9,10]: and ; input voltage = 24 V and the switching frequency fS: 200 kHz ÷ 300 kHz. For the simulation study we also added resistor in series with to analyze resistive losses in the resonant capacitor circuit. Furthermore, the direct current resistance (DCR) is added in series with . The MOSFET used is SQJA96EP (VDS = 80 V; Id = 30 A (Tc = 25 °C); Rds(on) = 17.9 mΩ (Tj = 25 °C)) and the diodes are V15KM100C (Vrrm = 100 V, If = 15 A, Vf = 0.59 V). For the semiconductor devices used, manufacturers offer PSpice models. Output filter inductance and output filter capacitance .
The measured and simulation data of the circuit under investigation are presented in Figure 17, Figure 18 and Figure 19, respectively. These figures illustrate the operation of the circuit under 25–30% load and different switching frequencies (200 kHz, 230 kHz, and 300 kHz). Simulation waveforms include the average input current, the output current, the output voltage, the voltage across the resonant capacitor , and the Q1 drain to source voltage (). Experimental waveforms include Q1 control pulse , the resonant current, Q1 drain to source voltage (), and the voltage across the resonant capacitor . A summary of these data is provided in Table 2.
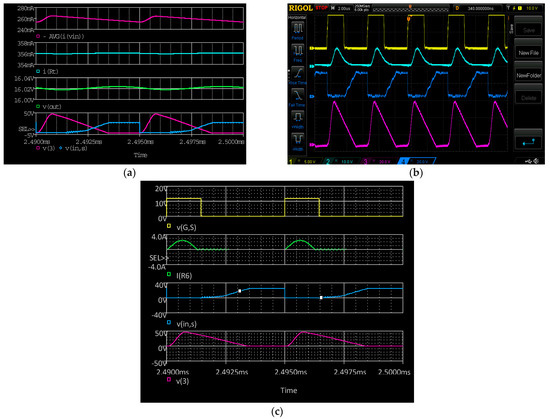
Figure 17.
L-type ZCS buck QR converter waveforms at 200 kHz: (a) Simulation waveforms: from top to bottom—average input current (lilac); output current (i(Rt) petroleum blue); output voltage (v(out) light green); voltage across the resonant capacitor v(3) (lilac); voltage (v(in,s) blue). (b) Experimental waveforms: from top to bottom—Q1 control pulse (yellow); resonant current (2 A/div.; petroleum blue); voltage (blue); voltage across the resonant capacitor (lilac). (c) Simulation waveforms: from top to bottom—Q1 control pulse (v(G,S) yellow); resonant current (I(R6) bright green); voltage (v(in,s) blue); voltage across the resonant capacitor (v(3) lilac).
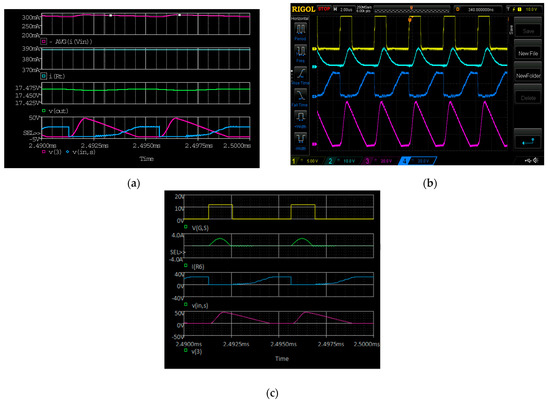
Figure 18.
L-type ZCS buck QR converter waveforms at 230 kHz: (a) Simulation waveforms: from top to bottom—average input current (lilac); output current (i(Rt) petroleum blue); output voltage (v(out) light green); voltage across the resonant capacitor v(3) (lilac); voltage (v(in,s) blue). (b) Experimental waveforms: from top to bottom—Q1 control pulse (yellow); resonant current (2 A/div.; petroleum blue); voltage (blue); voltage across the resonant capacitor (lilac). (c) Simulation waveforms: from top to bottom—Q1 control pulse (v(G,S) yellow); resonant current (I(R6) bright green); voltage (v(in,s) blue); voltage across the resonant capacitor (v(3) lilac).
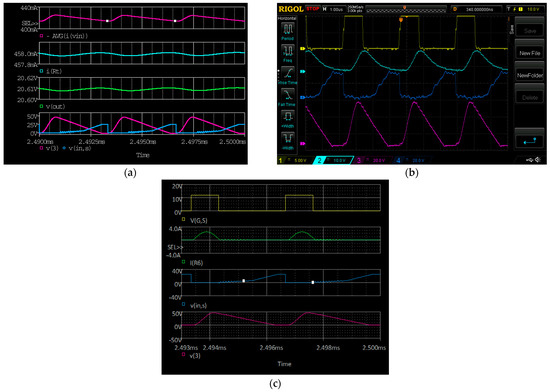
Figure 19.
L-type ZCS buck QR converter waveforms at 300 kHz: (a) Simulation waveforms: from top to bottom—average input current (lilac); output current (i(Rt); petroleum blue); output voltage (v(out) light green); voltage across the resonant capacitor v(3) (lilac); voltage (v(in,s) blue). (b) Experimental waveforms: from top to bottom—Q1 control pulse (yellow); resonant current (2 A/div.; petroleum blue); voltage (blue); voltage across the resonant capacitor (lilac). (c) Simulation waveforms: from top to bottom—Q1 control pulse (v(G,S) yellow); resonant current (I(R6) bright green); voltage (v(in,s) blue); voltage across the resonant capacitor (v(3) lilac).

Table 2.
The measured circuits parameters under different frequencies and load conditions.
As illustrated in Table 2, the data relating to the calculated, simulated, and measured efficiency of the circuit are also presented, along with the relative error |δη| between them. The obtained results show that the relative error |δη| between the analytical, simulation, and experimental results is below 5%. The utilization of the aforementioned method has been demonstrated to yield results that are considered to be satisfactory for engineering calculations. The analyzed zero-current switching (ZCS) buck quasi-resonant converter (QRC) demonstrates a high efficiency, approximately 95%, which highlights its superior performance.
5. Conclusions
Reducing switching losses in power transistors is essential for minimizing power converter losses and enhancing reliability. This work discusses zero-current switching (ZCS) in L-type buck quasi-resonant converters (QRCs). While commutation at zero current offers several advantages, it has been shown that the maximum current and voltage values during the resonant process in QRC circuits can significantly exceed those in traditional circuits.
The paper presents a comparative analysis of the static losses in the semiconductor switches of conventional pulse-width modulation (PWM) buck converters versus L-type ZCS quasi-resonant buck converters. The findings indicate the following results:
- The transistor’s static losses in ZCS buck QRCs are greater than in traditional PWM buck converters, and their ratio has a limit independent of the resonant tank parameters.
- When the input and output voltages and the load current of the designed ZCS buck QRCs are stable or change only slightly, the resonant tank parameters should be selected to ensure that the normalized output current is close to unity. This condition helps achieve minimal static losses in the switching elements.
Additionally, this study highlights that although resonant tank losses are generally lower than switching losses, they can still significantly affect the overall efficiency of ZCS buck QRCs. The analytical study conducted emphasizes that effective design and careful selection of components are crucial for minimizing these losses and optimizing converter performance.
To verify the analytical results, an L-type half-mode zero-current switching (ZCS) buck quasi-resonant (QRC) DC/DC converter was implemented. Various simulations were conducted using PSpice for TI simulation environment, along with experimental studies at different switching frequencies (200 kHz, 230 kHz, and 300 kHz) and load conditions. The analyzed zero-current switching (ZCS) buck quasi-resonant converter (QRC) demonstrates a high efficiency of approximately 95%, which highlights its superior performance.
The relative error between the analytical, simulation, and experimental results is below 5%. This indicates that the method utilized yields satisfactory results for engineering calculations. Therefore, the discussed a comprehensive methodology described for estimating the efficiency of a buck zero-current switching (ZCS) quasi-resonant DC/DC converter can find applications both in engineering practice and in the education of students in power electronics.
Author Contributions
N.H. and T.G. were involved in the full process of producing this paper, including conceptualization, methodology, modeling, validation, visualization, and preparation of the manuscript. All authors have read and agreed to the published version of the manuscript.
Funding
This research was funded by the European Union—NextGenerationEU through the National Recovery and Resilience Plan of the Republic of Bulgaria, project № BG-RRP-2.004-0005.
Institutional Review Board Statement
Not applicable.
Informed Consent Statement
Not applicable.
Data Availability Statement
The original contributions presented in this study are included in the article. Further inquiries can be directed to the corresponding author(s).
Acknowledgments
This research was funded by the European Union—NextGenerationEU through the National Recovery and Resilience Plan of the Republic of Bulgaria, project № BG-RRP-2.004-0005.
Conflicts of Interest
The authors declare no conflicts of interest.
References
- Wang, H.; Blaabjerg, F. Power Electronics Reliability: State of the Art and Outlook. IEEE J. Emerg. Sel. Top. Power Electron. 2021, 9, 6476–6493. [Google Scholar] [CrossRef]
- Gao, X.; Jia, Q.; Wang, Y.; Zhang, H.; Ma, L.; Zou, G.; Guo, F. Review on Power Cycling Reliability of SiC Power Device. Electron. Mater. 2024, 5, 80–100. [Google Scholar] [CrossRef]
- Lee, F. High-frequency quasi-resonant converter technologies. Proc. IEEE 1988, 76, 377–390. [Google Scholar] [CrossRef]
- Batarseh, I.; Harb, A. Soft-Switching dc-dc Converters. In Power Electronics; Springer: Cham, Switzerland, 2018. [Google Scholar]
- Rashid, M.H. Power Electronics Handbook; Elsevier Inc.: Amsterdam, The Netherlands, 2023. [Google Scholar]
- Kassakian, J.G.; Perreault, D.J.; Verghese, G.C.; Schlecht, M.F. Principles of Power Electronics; Cambridge University Press: Cambridge, UK, 2023. [Google Scholar]
- Pollefliet, J. Power Electronics: Switches and Converters; Elsevier Inc.: Amsterdam, The Netherlands, 2017. [Google Scholar]
- Mohan, W.P.R.N.; Undeland, T.M. Power Electronics: Converters, Applications, and Design, 3rd ed.; Wiley: Hoboken, NJ, USA, 2007. [Google Scholar]
- Kazimierczuk, M.K.; Czarkowski, D. Resonant Power Converters; John Wiley & Sons: Hoboken, NJ, USA, 2012. [Google Scholar]
- Erickson, R.W.; Maksimović, D. Fundamentals of Power Electronics, 3rd ed.; Springer: Cham, Switzerland, 2020. [Google Scholar]
- Liu, K.-H.; Lee, F.C.Y. Zero-voltage switching technique in DC/DC converters. IEEE Trans. Power Electron. 1990, 5, 293–304. [Google Scholar] [CrossRef]
- Lopusina, I.; Stanojevic, A.; Bouvier, Y.E.; Grbovic, P.J. Comparison Between ZVS and ZCS Series Resonant Balancing Converters. In Proceedings of the 22nd International Symposium on Power Electronics, Ee 2023, Novi Sad, Serbia, 25–28 October 2023. [Google Scholar]
- Hinov, N.; Gilev, B. Neural Network-Based Design of a Buck Zero-Voltage-Switching Quasi-Resonant DC–DC Converter. Mathematics 2024, 12, 3305. [Google Scholar] [CrossRef]
- Hinov, N.; Gilev, B. Comparison of Different Optimization Techniques for Model-Based Design of a Buck Zero Voltage Switching Quasi-Resonant Direct Current to Direct Current Converter. Mathematics 2023, 11, 4990. [Google Scholar] [CrossRef]
- Strelkov, V.; Dar’enkov, A.; Sosnina, E.; Shalukho, A.; Lipuzhin, I. Quasi resonant converter for autonomous power supply. J. Power Electron. 2021, 21, 517–528. [Google Scholar] [CrossRef]
- Mandru, N.; Nithyadas, P.V.; Kundu, U.; John, V. Bootstrap Operation in eGaN-Based Full-Wave ZCS Quasi-Resonant Synchronous Buck Converter for Server Application. In Proceedings of the 38th Annual IEEE Applied Power Electronics Conference and Exposition, APEC 2023, Orlando, FL, USA, 19–23 March 2023; pp. 2239–2244. [Google Scholar]
- Castro, I.D.G.; Lamar, S.; Lopez, K.; Martin, M.A.; Sebastian, J. A Family of High Frequency AC-LED Drivers Based on ZCS-QRCs. IEEE Trans. Power Electron. 2018, 33, 8728–8740. [Google Scholar] [CrossRef]
- Lee, Y.-S.; Chen, G.T. ZCS bi-directional DC-to-DC converter application in battery equalization for electric vehicles. In Proceedings of the 2004 IEEE 35th Annual Power Electronics Specialists Conference (IEEE Cat. No.04CH37551), Aachen, Germany, 20–25 June 2004; 2004; Volume 4, pp. 2766–2772. [Google Scholar] [CrossRef]
- Lee, Y.-S.; Cheng, G.-T. Quasi-Resonant Zero-Current-Switching Bidirectional Converter for Battery Equalization Applications. IEEE Trans. Power Electron. 2006, 21, 1213–1224. [Google Scholar] [CrossRef]
- Chen, K.-K. A Novel Application of Zero-Current-Switching Quasi-resonant Buck Converter for Battery Chargers. Math. Probl. Eng. 2011, 2011, 481208. [Google Scholar] [CrossRef]
- Chuang, Y.; Ke, Y.; Chuang, H.; Wang, Y. A Novel Single-Switch Resonant Power Converter for Renewable Energy Generation Applications. IEEE Trans. Ind. Appl. 2013, 50, 1322–1330. [Google Scholar] [CrossRef]
- Freitas, T.; Menegáz, P.; Simonetti, D. A New Application of the Multi-Resonant Zero-Current Switching Buck Converter: Analysis and Simulation in a PMSG Based WECS. Energies 2015, 8, 10219–10238. [Google Scholar] [CrossRef]
- Harasimczuk, M. A QR-ZCS Boost Converter With Tapped Inductor and Active Edge-Resonant Cell. IEEE Trans. Power Electron. 2020, 35, 13085–13095. [Google Scholar] [CrossRef]
- Mohammad, P.; Mohammad, R.Y. Single-switch boost DC-DC converter with zero-current-switching, high power density and low electromagnetic interference. AEU—Int. J. Electron. Commun. 2020, 121, 153229. [Google Scholar] [CrossRef]
- Yanik, G.; Isen, E. Quasi-Resonant Full-Wave Zero-Current Switching Buck Converter Design, Simulation and Application. Balk. J. Electr. Comput. Eng. 2013, 1, 71–77. [Google Scholar]
- Hasanisadi, M.; Tarzamni, H.; Tahami, F. Comprehensive Reliability Assessment of Buck Quasi-Resonant Converter. In Proceedings of the 2022 IEEE 20th International Power Electronics and Motion Control Conference (PEMC), Brasov, Romania, 25–28 September 2022; pp. 614–620. [Google Scholar] [CrossRef]
- Jamil, I.; Zhao, J.; Jamil, R. Analysis, Design and Implementation of Zero-Current-Switching Resonant Converter DC-DC Buck Converter. Int. J. Electr. Electron. Eng. (IJEEE) 2013, 2, 1–12. [Google Scholar]
- Özdemir, İ.; Yildiz, A.B. Time-domain analysis of full-wave quasi-resonant zero-current switching buck converter by modified nodal analysis. In Proceedings of the 2018 5th International Conference on Electrical and Electronic Engineering (ICEEE), Istanbul, Turkey, 3–5 May 2018; 2018; pp. 23–26. [Google Scholar] [CrossRef]
- Batarseh, I.; Harb, A. Power Electronics: Circuit Analysis and Design; Springer: Cham, Switzerland, 2017. [Google Scholar]
- Dymerets, A.V.; Yershov, R.D.; Gorodny, A.N.; Denisov, Y.O.; Boiko, S.; Kuznetsov, V. Dynamic Characteristics of Zero-Current-Switching Quasi-Resonant Buck Converter under Variation of Resonant Circuit and Load Parameters. In Proceedings of the 2020 IEEE 40th International Conference on Electronics and Nanotechnology (ELNANO), Kyiv, Ukraine, 22–24 April 2020; pp. 848–853. [Google Scholar] [CrossRef]
- Roufberg, L. DC Analysis of Quasi-Resonant Buck and Forward Converters Including the Effects of Parasitic Elements; Virginia Tech: Blacksburg, VA, USA, 1987. [Google Scholar]
Disclaimer/Publisher’s Note: The statements, opinions and data contained in all publications are solely those of the individual author(s) and contributor(s) and not of MDPI and/or the editor(s). MDPI and/or the editor(s) disclaim responsibility for any injury to people or property resulting from any ideas, methods, instructions or products referred to in the content. |
© 2025 by the authors. Licensee MDPI, Basel, Switzerland. This article is an open access article distributed under the terms and conditions of the Creative Commons Attribution (CC BY) license (https://creativecommons.org/licenses/by/4.0/).