Article

Does the Digital Economy Promote Urban Energy Transition? Evidence from China

1
School of Business and Tourism Management, Yunnan University, Kunming 650091, China
2
School of Economics and Trade, Yunnan Light and Textile Industry Vocational College, Kunming 650300, China
*
Author to whom correspondence should be addressed.
Systems 2026, 14(7), 775; https://doi.org/10.3390/systems14070775
Submission received: 26 April 2026 / Revised: 1 July 2026 / Accepted: 1 July 2026 / Published: 3 July 2026
(This article belongs to the Special Issue Technological Innovation Systems and Energy Transitions)

Abstract

Although the digital economy (DE) and sustainable urban systems have drawn growing attention, how DE drives urban energy transition (UET) remains insufficiently understood. Employing panel data from 266 Chinese cities spanning 2011–2021, this study applies fixed-effects, mediation, moderation, and spatial Durbin models to examine the impact of DE on UET. UET is measured by a composite index that captures energy system performance and transition readiness. The results show that DE is positively associated with UET, with a one-unit increase in DE corresponding to a 0.1566-unit increase in UET. This finding remains robust after employing an instrumental-variable approach and a battery of robustness checks, including an exogenous policy shock. This positive effect is partially mediated by reduced resource misallocation and industrial structure upgrading. When electricity intensity is treated as a moderating factor, cities with higher electricity intensity exhibit a more pronounced positive effect of DE on UET. Further evidence indicates that DE advances UET in the eastern, central, and western regions, but has a limited impact in the northeastern region. Additionally, DE exerts positive spillover effects, thereby advancing energy transition in neighboring cities.

1. Introduction

Greenhouse gas emissions from fossil fuel use are the main contributors to climate change, representing a critical global concern [1]. While the shift toward renewable energy is a viable strategy for mitigating this threat, its practical implementation frequently encounters significant policy, technological, and economic barriers [2,3].
Cities are at the center of this energy dilemma, as they consume over two-thirds of worldwide energy and generate upwards of 70% of carbon emissions [4]. Rapid urbanization further intensifies pressures on energy resources and environmental quality [5]. Consequently, global attention toward urban energy transition (UET) has been increasing [6]. UET involves systematically replacing fossil-fuel-based systems with renewables and deploying smart grids that enable real-time energy management, renewable energy integration, and efficient energy distribution [7,8]. Digitalization and data governance are vital for managing urban energy systems and provide the technological backbone for this transition [9]. Moreover, promoting UET is essential for reducing environmental pollution associated with urban energy use [10]. As the world’s largest consumer of fossil fuels, China faces formidable challenges [11]. The heavy dependence of Chinese cities on fossil-fuel-based energy systems further compounds these challenges [12], rendering it increasingly urgent to identify pathways that can effectively accelerate UET.
As information technology has advanced rapidly, a digital economy (DE) distinguished by high efficiency, affordability, and convenience has gradually emerged and contributed to sustainable urban development [13,14]. Currently, the integration of DE into China’s urban energy management is exhibiting a positive trend [15]. However, an important question arises: can DE promote the energy transition in Chinese cities? Existing studies have primarily focused on how DE enhances urban energy efficiency and alleviates energy poverty [16,17], leaving UET largely unexamined. This gap is evident in four respects. First, the causal effect of DE on UET has not been rigorously identified. Second, the underlying mechanisms remain unclear. Although DE has been shown to optimize resource allocation and promote industrial structure upgrading [18,19], whether this optimization translates into broader UET remains to be empirically tested. Moreover, the electricity-intensive nature of DE drives clean energy substitution [11]. While a stable and adequate electricity supply facilitates DE, higher electricity intensity underscores the need for UET. Thus, whether electricity intensity moderates the relationship between DE and UET remains to be empirically verified. Third, the spatial effects of DE have received little attention, as DE transcends geographical limitations [20] and may also influence energy transition in surrounding cities. Finally, possible regional heterogeneity in the effect of DE on UET has rarely been investigated. Accordingly, we investigate the relationship between DE and UET using data for 266 Chinese cities over the period 2011–2021.
Accordingly, this study makes the following innovative contributions. First, this study constructs a multidimensional energy transition assessment framework at the city level and offers systematic evidence regarding the nexus between DE and UET. Cities are spearheading the low-carbon transition, providing feasible solutions to address urgent energy challenges [21,22]. However, existing literature provides insufficient insight into effective pathways for promoting UET. Given that cities serve as the primary carriers of digital economic development [23], this study analyzes how DE influences UET, thereby addressing this gap. Second, by empirically testing the mediating effects of resource allocation efficiency and industrial structure upgrading, as well as the moderating effect of electricity intensity, it elucidates the mechanisms through which DE promotes UET. Finally, it extends the analytical lens to incorporate spatial effects and regional heterogeneity. By examining whether DE generates spatial spillovers in energy transition and whether its impact differs across regions, this study provides a foundation for formulating regionally differentiated policies.
The subsequent sections of this article are structured as follows: Section 2 reviews the literature and develops research hypotheses. Section 3 details the methods, including data collection and the econometric models employed. Section 4 reports the findings and offers a detailed discussion. Finally, Section 5 provides a summary and outlines specific policy implications.

2. Literature Review and Hypothesis Development

2.1. Energy Transition

Current studies on energy transition primarily cover two major areas. The first area investigates the driving factors of energy transition. Specifically, Kalair et al. [24] attributed this shift chiefly to diminishing fossil fuel reserves and worsening environmental contamination. In addition to these supply- and environment-related pressures, technological progress has emerged as another pivotal determinant; using regional data, Ramzan et al. [3] demonstrated that advances in green technologies significantly accelerate the transition process. Furthermore, the influence of policy cannot be overlooked, as Wang et al. [25] found that a diversified combination of renewable energy policies also helps promote energy transition by creating favorable market conditions. Similarly, Hu et al. [26] showed that market-based instruments, such as energy quota trading schemes, play an increasingly prominent role in incentivizing energy conservation and supporting regional energy structural transition.
The second research area examines the impacts of energy transition. A key focus is its transformative impact across sectors. Kost et al. [27] found that ongoing energy transition processes have substantially expanded renewable generation, thereby fundamentally reshaping operations in the electricity, heating, and transportation sectors. With regard to environmental sustainability, existing studies indicate that energy transition mitigates carbon emissions and alleviates environmental pressures [28,29]. Beyond its environmental benefits, the energy transition also yields socioeconomic impacts; Liu et al. [30] revealed that it fosters regional economic expansion through industrial upgrading and environmental regulation.
In summary, although the literature explores factors driving energy transition and its consequences, the role of emerging digital forces, especially digital economic development, in reshaping urban energy systems remains insufficiently explored. This gap motivates our investigation into how DE influences UET.

2.2. Digital Economy and Urban Energy Transition

The emergence of DE has reshaped urban dynamics, facilitated the expansion of distributed energy resources, and triggered a structural shift in resource dependence [31]. Furthermore, DE helps create a more favorable energy market environment by lowering energy trading expenses and enhancing how energy resources are allocated and used [16]. DE also promotes the growth of green finance, which subsequently provides financial backing for investments in renewable energy [32]. In modern energy systems, DE enhances operational efficiency, making it smarter in operation, more scientific in decision-making, and more precise in service. This leads to enhanced energy efficiency and better management [33], ultimately driving energy transition.
DE exerts a substantial influence on how energy is produced and consumed. In the production domain, it accelerates the adoption and advancement of clean energy by fostering technological innovation [11]. On the consumption front, the growth of DE has heightened public environmental awareness, prompting shifts in energy use behavior [34]. This, in turn, has contributed to reducing urban coal consumption while increasing the uptake of clean energy [35]. Such optimization of the energy structure is expected to accelerate UET. Accordingly, a hypothesis is proposed.
H1. 
The digital economy promotes urban energy transition.
Various digital technologies are driving digital economic development through their widespread application, changing how resources are allocated [36]. Specifically, by improving precision and reducing information imbalances, technologies such as large-scale data analytics and AI significantly increase resource allocation efficiency, thereby optimizing energy use [37]. These technology-driven optimizations in resource allocation further enable traditional production factors to flow to low-energy-consuming industries, stimulating new dynamics within traditional urban factors [38].
Enhancing resource allocation efficiency drives energy transition. At the energy-system level, tackling resource misallocation is essential to raising energy-use efficiency [39]. Furthermore, the streamlining of capital deployment effectively curtails resource dissipation, enhances holistic efficiency spanning energy generation and end-use, and thereby accelerates the clean transition of energy systems [40]. As DE advances, production factors are increasingly channeled into the renewable energy sector, substantially fueling its growth [28]. As a result, optimized resource allocation enables regional energy systems to utilize renewable energy more efficiently while diminishing dependence on conventional fossil fuels [41]. Accordingly, a hypothesis is proposed.
H2. 
The digital economy positively affects urban energy transition by improving resource allocation efficiency.
Upgrading the industrial structure constitutes a crucial mediating pathway linking DE to UET. Specifically, DE accelerates the clustering of sophisticated manufacturing together with contemporary service sectors, steering the industrial system toward technology-intensive, high-value-added activities [42]. Furthermore, the deep penetration of digital technologies enables the intelligent and digital transformation of conventional industries and stimulates the rapid expansion of strategic emerging sectors [43,44]. In this process, the proportional presence of energy-intensive heavy and chemical industries tends to contract, while low-energy-consumption, high-value-added sectors continuously expand, steering overall industrial upgrading toward a green direction [19].
The intersectoral shift of productive resources can reduce the economic system’s dependence on fossil fuels. Since services exhibit markedly lower energy intensity per unit of output than manufacturing, total energy consumption and carbon emission intensity naturally decline for equivalent economic output as the industrial structure evolves toward greater servitization and sophistication [45]. Moreover, industrial structure upgrading is typically accompanied by concurrent improvements in clean production technologies and energy management efficiency, thereby facilitating the energy transition. Accordingly, a hypothesis is proposed.
H3. 
The digital economy positively affects urban energy transition by boosting industrial structure upgrading.
Electricity intensity reflects the degree to which urban economic activities depend on electric power. Cities with high electricity intensity tend to possess more advanced electricity infrastructure, which lays a robust basis for accelerated digital economic expansion. In these settings, a reliable power supply ensures the smooth operation of data centers, smart grids, and other digital infrastructure, thereby accelerating the integration of DE into energy systems [46,47]. On the other hand, high-electricity-intensity cities are predominantly industry-oriented and characterized by a high share of fossil fuel consumption, signaling substantial potential for energy structure optimization. Under these conditions, DE can yield greater marginal benefits in terms of expanding renewable energy use [11,48]. Simultaneously, higher electricity intensity tends to be accompanied by more stringent carbon emission reduction constraints, which strengthen the motivation for governments and enterprises to deploy digital infrastructures and integrate renewable energy sources [49]. Moreover, cities with high electricity intensity generate greater demand for fine-grained energy management, offering broader application scenarios for digital technologies, including intelligent monitoring and automated dispatching, thereby further amplifying the role of DE in UET. Accordingly, the following hypothesis is proposed:
H4. 
The electricity intensity moderates the effect of the digital economy on urban energy transition.
The DE expands economic activity across regions by shortening temporal and spatial distances via convenient information transmission. The growth of DE has reshaped urban spatial patterns and profoundly transformed production modes, giving rise to a more diversified, complex, and highly interconnected urban system [50]. Moreover, interregional energy connectivity exhibits spatial correlation due to the influence of energy factor flows [51].
First, DE stimulates the advancement of green technologies in local cities and promotes collaborative innovation in green technologies across neighboring regions [20]. Cross-regional co-innovation enables green energy technologies to be efficiently replicated and scaled up, driving the energy transition in neighboring regions [52]. Second, improved energy efficiency [16] and urban green transition [53] are not only confined to individual cities but can be realized in the broader region as a result of DE development. This further demonstrates the important role of DE in regional energy sustainability.
Therefore, through energy factor flows and digital information exchange, cities and their neighbors can facilitate efficient inter-city energy connectivity and energy management via enhanced regional coordination based on geographical proximity [54]. Such collaboration facilitates a synergistic energy transition across cities. Accordingly, a hypothesis is proposed.
H5. 
The digital economy promotes energy transition in nearby cities through positive spillover effects.
The theoretical framework derived from the above analysis is presented in Figure 1.

3. Methodology

3.1. Econometric Model

Following Lin and Zhang [55], we construct the econometric model in Equation (1) to assess how DE influences UET.
U E T i t = α 0 + α 1 D E i t + α 2 C o n t r o l s i t + μ i + λ t + ε i t
where i and t denote city and time, respectively; U E T i t denotes the level of urban energy transition; D E i t denotes the digital economic development level; C o n t r o l s i t represents the control variables; and ε i t represents the random perturbation term. The city ( μ i ) and time ( λ t ) fixed effects are controlled for in this analysis.
In this study, we examine the mediating mechanisms through which DE drives UET. Conventional stepwise regression-based mediation analysis is subject to endogeneity concerns and often yields ambiguous identification of transmission channels. Therefore, we follow Hou et al. [56] to identify these mechanisms by estimating the effect of the core explanatory variable (DE) on the mediating variables.
M i t = ν 0 + ν 1 D E i t + ν 2 C o n t r o l s i t + μ i + λ t + ϵ i t
where M i t denotes the mediating variables, namely resource allocation efficiency ( R A E i t ) and industrial structure upgrading ( I S U i t ).
To investigate whether electricity intensity moderates DE’s impact on UET, we construct a moderating effect model, following Feng et al. [57]:
U E T i t = δ 0 + δ 1 D E i t + δ 2 E L I i t + δ 3 D E i t × E L I i t + δ 4 C o n t r o l s i t + μ i + λ t + ϵ i t
where E L I i t is the electricity intensity.
The spatial Durbin model serves as the primary method for investigating DE’s spatial effects on UET, following Wang and Cen [58]:
U E T i t = β 0 + ρ W i j U E T i t + β 1 D E i t + θ 1 W i j D E i t + β 2 C o n t r o l s i t + θ 2 W i j C o n t r o l s i t + μ i + λ t + ε i t
where W i j is the spatial weight matrix (adjacency matrix); if cities i and j share a common border, then W i j = 1 ; otherwise, W i j = 0 . The matrix is row-standardized so that each row sums to unity. This specification is adopted because it can directly capture spatial spillovers and is widely used in regional studies. ρ denotes the spatial autoregressive coefficient.

3.2. Variables Measurement

3.2.1. Explained Variable

Following Shen et al. [4], UET is measured using a composite energy transition index. The index framework integrates two dimensions, with energy system performance capturing the present condition of urban energy infrastructures and transition readiness reflecting the socioeconomic potential to support the ongoing transition. This index has been widely applied in studies measuring energy transition levels [26,59]. The complete indicator framework, including all components, units, and directional signs, is presented in Table A1 of Appendix A. After standardizing all relevant indicators, we employ an equal weighting method to aggregate them, assigning identical weights to each sub-indicator to avoid subjective bias in weight determination. Table A1 also lists the weights for each indicator. The overall UET score is subsequently computed by summing these equally weighted standardized indicators.

3.2.2. Core Explanatory Variable

Following Chen [11] and Li and Zhou [14], we measure DE along two dimensions: Internet development and digital financial inclusion. Internet development is assessed using four indicators: (1) broadband access per 100 people, (2) mobile phone subscriptions per 100 people, (3) the share of employees in information transmission, computer services, and software, and (4) per capita telecommunications service volume. Digital financial inclusion, the fifth indicator, is captured by the Digital Financial Inclusion Index. All five indicators are positively oriented, meaning that higher values indicate a more advanced DE.
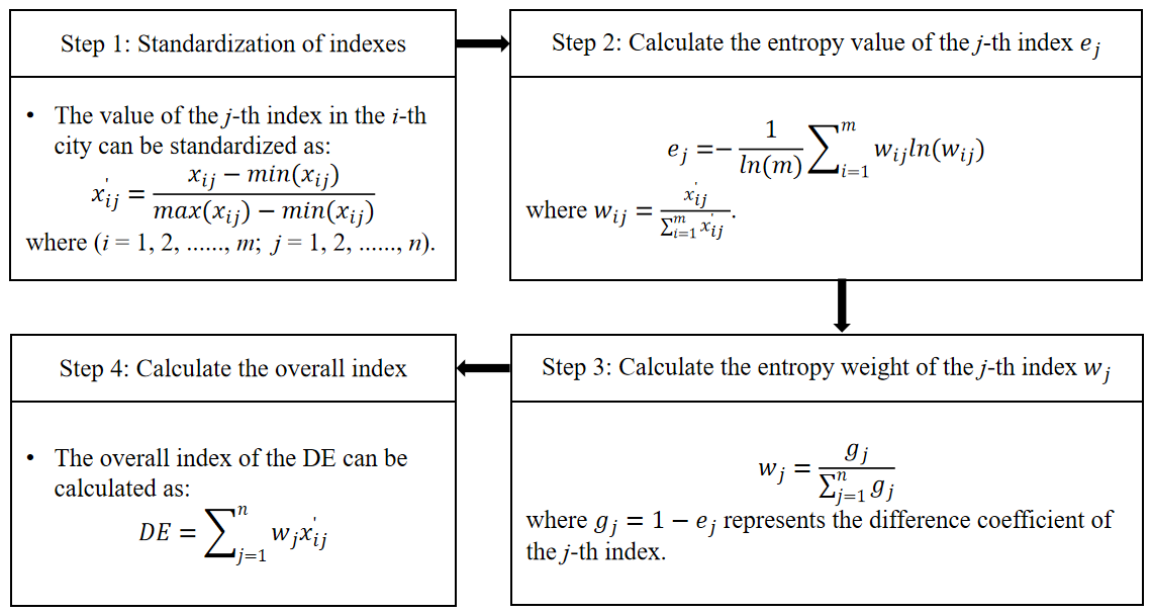
Objective weights for each indicator are generated via the entropy weighting method, with the detailed procedure illustrated in Figure 2. The resulting weights for indicators (1) through (5) are 0.2226, 0.1324, 0.2009, 0.3443, and 0.0998, respectively. Finally, the DE composite index is formulated by aggregating the normalized indicators through a weighted summation.

3.2.3. Mechanism Variables

Following Bai and Liu [60], we measure resource allocation efficiency (RAE) using resource misallocation as an inverse proxy, such that lower misallocation indicates higher RAE, a common practice in the literature [18,61]. In urban contexts, resource mismatch manifests primarily in the misallocation of capital and labor. First, we specify a Cobb–Douglas production function and divide both sides by labor input before taking logarithms:
ln ( Y i t L i t ) = ln A + β k i ln ( K i t L i t ) + μ i + λ t + ϵ i t
Output ( Y i t ) is captured by each city’s GDP, converted to constant 2011 prices employing the GDP deflator with 2011 as the base year. Labor input ( L i t ) is proxied by the annual mean employment count within each city. Capital input ( K i t ) is captured by the stock of fixed capital for each city, which is estimated via the perpetual inventory approach detailed below:
K t = I t P t + ( 1 θ t ) K t 1
where K t denotes the current fixed capital stock; I t denotes the nominal gross fixed capital formation; P t denotes the price index for fixed-asset investment; and θ denotes the depreciation rate, set at 9.6% following Bai and Liu [60].
We introduce interaction terms between city dummies and the per capita capital stock ln ( K i t L i t ) into the model, and estimate city-specific capital-output elasticities ( β k i ) using the least squares dummy variable (LSDV) approach. These elasticities are then substituted into the following equations:
γ K i = ( K i K ) / ( s i β k i β k ) ,   γ L i = ( L i L ) / ( s i β L i β L )
where γ K i and γ L i denote the distortion coefficients for capital and labor prices, respectively; K i K and L i L denote city i’s shares of the total capital stock and labor input, respectively; and s i β k i β k and s i β L i β L represent the capital and labor shares that city i would command under efficient allocation, respectively.
Furthermore, the capital and labor misallocation indices can be derived as:
τ K i = 1 γ K i 1 ,   τ L i = 1 γ L i 1
Because the signs of τ K i and τ L i only indicate the direction of misallocation, we take absolute values to measure the severity of misallocation, yielding separate mismatch indicators for capital and labor inputs. Finally, we take the arithmetic mean of the two to obtain the aggregate resource misallocation index, which serves as an inverse proxy for RAE.
Following Wang et al. [62], we measure industrial structure upgrading (ISU) using the value added of the tertiary sector divided by that of the secondary sector.
Following Lin and Huang [46], we use electricity consumption per unit of GDP for the entire society as a proxy for electricity intensity (ELI).

3.2.4. Control Variables

To avoid bias from external influences on UET, we incorporate several control variables. Industrialization (IND) is quantified by the share of secondary sector value added in urban GDP [55]. Openness (OPEN) is captured by the ratio of utilized foreign capital to urban GDP [63]. Population density (POPU) is calculated as the count of residents per square kilometer within urban land area [64]. Financial agglomeration (FINA) is defined as financial sector employment in a city divided by the corresponding national average [65]. Infrastructure (INFR) is quantified by urban road area per capita [33].
Our sample covers 266 Chinese cities over the period 2011–2021. We exclude cities that experienced administrative mergers during the sample period (for instance, Laiwu was incorporated into Jinan in 2019) as well as those with extensive missingness on main variables. Where only a few values are absent, linear interpolation is used to impute them. After these steps, the final dataset is a balanced panel comprising 2926 observations. The data sources in this study include energy and electricity consumption from the China Energy Statistical Yearbook and the China Industrial Electricity Yearbook, urban carbon dioxide emissions from the China Environmental Statistics Yearbook, PM2.5 concentrations from the Atmospheric Composition Analysis Group of Canada, the China innovation and entrepreneurship index from the Peking University Open Research Data Platform, digital financial inclusion data from the Peking University Digital Financial Inclusion Index, and green patent data from the Chinese Research Data Services Platform (CNRDS); all other data are derived from city-specific statistical yearbooks, the China City Statistical Yearbook, and the China Statistical Yearbook unless otherwise noted. Table 1 provides a summary of the variables’ descriptive statistics.

4. Results and Discussion

4.1. Benchmark Estimates

We first employ the variance inflation factor (VIF) to test for multicollinearity. The mean VIF is 1.11, with a maximum of 1.23, indicating no multicollinearity concerns among the variables. Table 2 presents the benchmark estimates on the effect of DE on UET. Column (1) presents the estimates excluding controls, while Columns (2) through (6) progressively incorporate additional controls. In every specification, the DE coefficients are significantly positive. Specifically, Column (6) yields an estimated DE coefficient of 0.1566, indicating that a one-unit increment in DE corresponds to a 0.1566-unit increase in UET. These results confirm that DE promotes UET, thereby validating Hypothesis 1.
Indeed, cities with a more advanced DE tend to exhibit greater openness and informational transparency. Under heightened scrutiny from the public and social organizations, governments and enterprises tend to give higher priority to environmental targets, proactively seeking alternatives to fossil fuels and promoting clean energy development [11]. Furthermore, the expansion of DE is frequently accompanied by the development of fintech or digital finance, providing diverse and accessible financing channels for clean energy projects [52], which significantly accelerates the adoption and diffusion of clean energy technologies. Moreover, digital economic growth typically fosters more vigorous green technology R&D and cross-industry collaboration [14], thereby playing a pivotal role in upgrading urban energy structures and fostering green industries, which substantially advances the overall process of energy transition.
While our findings align with Shahbaz et al. [48] and Xu et al. [66], which conclude that DE facilitates energy transition, there are significant differences between the studies. In contrast to the sample level, our study offers new city-level empirical evidence. Their measure captures the energy transition using only the renewable energy share, a one-dimensional representation that fails to capture the complexity and multidimensional character of UET [67]. In contrast, our measurement follows Shen et al. [4], using an energy transition index that is modified from the World Economic Forum’s national-level index and customized for Chinese cities. This measurement offers a comprehensive reflection of the current energy systems’ state and the socio-economic capacity for future UET [59].
Turning to the control variables, the IND coefficient is significantly positive, implying that accelerated industrialization raises energy demand, which in turn diversifies the energy mix and drives clean energy uptake [68]. The OPEN coefficient is likewise significantly positive, implying that foreign direct investment acts as a catalyst for energy efficiency and facilitates clean energy development [69] and that greater openness benefits UET. The FINA coefficient is significantly negative, consistent with Li and Ma [70]. The effect of financial agglomeration on energy transition is theoretically multifaceted. The clustering of financial intermediaries and instruments can improve credit allocation efficiency, thereby facilitating capital flows into clean energy. At the same time, the accommodative financing conditions that accompany such agglomeration may entrench the expansion paths of energy-intensive, high-polluting enterprises, allowing them to scale up production. Sustained expansion, in turn, raises fossil fuel demand [71,72] and thus hinders energy transition. In practice, however, the latter mechanism generally dominates. Environmental protection and new energy industries are typically characterized by long investment horizons and slow returns; as a result, profit-oriented financial institutions tend to favor traditional sectors with lower capital requirements and quicker payoffs over clean energy. This tendency is reinforced by an underdeveloped green finance regulatory framework, which prevents capital from effectively reaching clean energy and channels substantial funds into conventional energy-intensive industries instead. Consequently, the spatial concentration of financial resources deepens fossil-fuel dependence and suppresses UET. The INFR coefficient is also significantly negative, indicating that infrastructure expansion, proxied by per capita road area, markedly raises energy demand in the transportation, building, and service sectors. Since these sectors remain heavily fossil-fuel dependent in Chinese cities, such expansion reinforces rather than reduces reliance on conventional energy. Moreover, infrastructure expansion fuels transportation energy consumption and urban sprawl. Given that the transport sector is the fastest-growing contributor to greenhouse gas emissions, newly built transportation facilities further increase emissions [73], thereby impeding UET. The effect of POPU is insignificant, possibly because agglomeration effects improve energy efficiency while dense economic activity simultaneously raises energy consumption, with the two mechanisms offsetting each other.

4.2. Robustness Tests

4.2.1. Removing the Impact of Municipalities

Given that Beijing, Tianjin, Shanghai, and Chongqing, as municipalities, enjoy policy and economic conditions that differ markedly from those of ordinary prefecture-level cities, we therefore exclude these four cities from the sample. As reported in Column (1) of Table 3, the DE coefficient remains positive and significant, reinforcing the benchmark results.

4.2.2. Changing the Evaluation Method for UET

Following Yang et al. [59], we re-evaluate the energy transition index using the entropy weight method. Column (2) presents the corresponding estimates, where the DE coefficient continues to be significantly positive, thereby reinforcing the benchmark results.

4.2.3. Representing DE Development with an Exogenous Shock

Following Wang and Gao [74], we further exploit the “Broadband China” pilot policy as an exogenous shock to identify the effect of DE. Launched in 2013, the policy aimed to accelerate broadband speed, expand coverage, and upgrade networks, and three cohorts of pilot cities were designated in 2014, 2015, and 2016, respectively. Since the selection of pilot cities was largely exogenous and broadband infrastructure improvement is a key enabler of regional DE development, this policy offers an ideal quasi-natural experimental context for assessing the impact of DE. Accordingly, we construct a staggered difference-in-differences (DID) model to investigate whether the policy has promoted UET. The model is formulated as:
U E T i t = α 0 + α 1 P O L I C Y i t + α 2 C o n t r o l s i t + μ i + λ t + ε i t
where P O L I C Y i t is a dummy variable equal to 1 for the year when city i is first included in the pilot list and all subsequent years, and 0 otherwise.
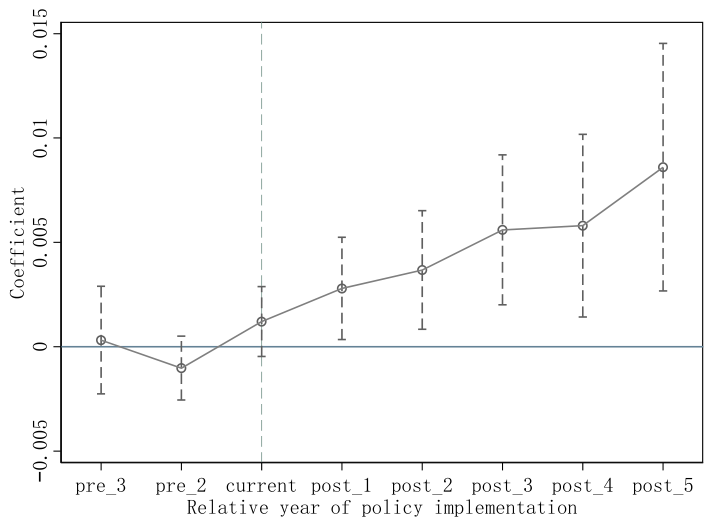
As displayed in Column (3), the POLICY coefficient is significantly positive, suggesting that the policy fosters UET in demonstration cities. The credibility of a DID design is contingent upon the parallel trends condition. We examine this assumption through an event study analysis, the results of which are illustrated in Figure 3. Before the policy was introduced, the UET levels between pilot and non-pilot cities displayed no statistically discernible differences, indicating that the parallel trends condition is satisfied. Collectively, these results further corroborate DE’s favorable effect on UET.

4.2.4. Endogeneity Test

To mitigate endogeneity issues, an instrumental variable (IV) strategy is additionally implemented. Following Liu et al. [75], the spherical distance from each city to Hangzhou is selected as the instrumental variable. As the core birthplace of China’s DE development, Hangzhou generates technology spillovers and factor diffusion that attenuate with geographic distance; therefore, this distance is closely related to local digital economic development, satisfying the relevance condition. Meanwhile, geographic distance is determined by natural locational conditions and is arguably exogenous to UET.
Since the cross-sectional nature of the distance measure prevents its direct use in panel regressions, we interact it with the one-period-lagged national Internet penetration rate, following Lyu et al. [34], to form a time-varying panel instrument. Columns (4) and (5) present the estimation findings. The Kleibergen–Paap rk LM test significantly rejects the under-identification null hypothesis, and the Kleibergen–Paap rk Wald F statistic exceeds the critical value, indicating no weak-instrument problem. After accounting for endogeneity, the DE coefficient remains significantly positive, thus corroborating the benchmark results.

4.3. Mechanism Test

4.3.1. Mediating Effect Analysis

As reported in Column (1) of Table 4, DE exerts a negative and statistically significant effect on RAE, indicating that DE markedly reduces resource misallocation and improves resource allocation efficiency. This finding suggests that the advancement of DE has transformed information production models, enhanced information transparency, and reshaped traditional transaction modes, thereby effectively alleviating resource misallocation stemming from information asymmetry [61], a result consistent with Jiang and Li [18]. Theoretically, the mitigation of resource misallocation allows market price signals to more accurately reflect energy scarcity and environmental externalities, thereby incentivizing market participants to adopt energy-saving technologies and clean energy [76,77]. Moreover, when efficient resource allocation is achieved, governments tend to channel fiscal funds toward clean energy development [78], which further promotes UET. These results thus verify Hypothesis 2.
The estimates in Column (2) show a significant positive effect of DE on ISU, indicating that DE accelerates the shift from traditional resource-intensive industries toward more advanced, technology-driven sectors and thereby fosters industrial structure upgrading [79]. Theoretically, upgrading the industrial structure typically involves curtailing the prevalence of pollution-intensive and energy-heavy sectors. Such restructuring diminishes reliance on fossil fuels, simultaneously stimulating the expansion of renewable energy industries and enlarging their proportion within aggregate energy use [19,80], which further optimizes the urban energy structure. These results thus verify Hypothesis 3.
In summary, DE can promote UET through two mediating pathways: enhancing resource allocation efficiency and advancing industrial structure upgrading.

4.3.2. Moderating Effect Analysis

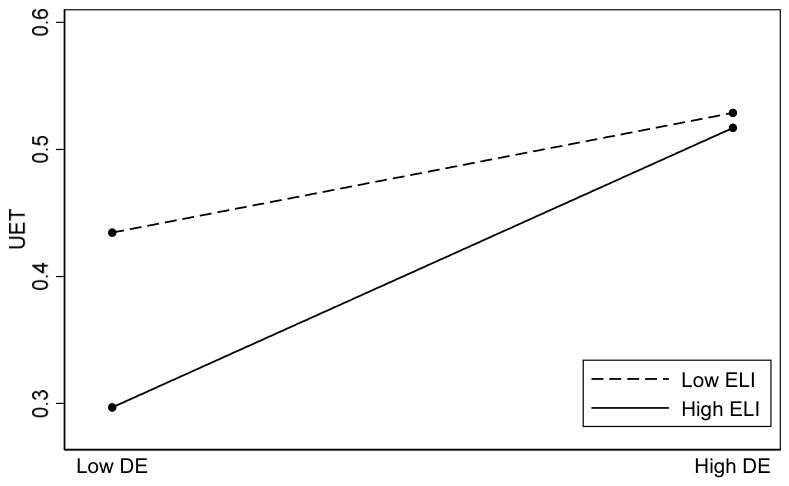
Column (3) reports the estimates with ELI as the moderating variable. The interaction term (DE × ELI) is significantly positive, indicating that the favorable impact of DE on UET intensifies as electricity intensity rises. Therefore, Hypothesis 4 is supported. Furthermore, we plot Figure 4 to illustrate the moderating effect of ELI. The evidence reveals that the slope of DE on UET in the high-ELI subsample is markedly steeper than that in the low-ELI subsample. This further corroborates Hypothesis 4.
The underlying logic of this effect is as follows: regions with higher electricity intensity typically exhibit greater total energy consumption and lower energy efficiency, thereby facing more urgent needs for energy transition [81,82]. Through real-time monitoring, dynamic analytics, and precision control, DE permits fine-grained management of energy use [83], and its technological potential in promoting energy structure optimization and clean energy substitution is more fully unleashed in environments with strong transition demands. Consequently, the higher the electricity intensity, the more pronounced the marginal contribution of DE to energy transition. Moreover, cities with high electricity intensity generally confront stricter energy consumption control and emission reduction pressures, which compel enterprises and government departments to accelerate the adoption of digital technologies, thereby further amplifying the favorable influence of DE on UET.

4.4. Heterogeneity Analysis

Adopting the regional classification of Zhou et al. [64], we divide the 266 cities into eastern, central, western, and northeastern regions. Subsample estimates in Table 5, Columns 1 through 4, show that DE significantly advances UET in all regions except the northeastern region, where the effect is statistically insignificant.
The regional difference mainly stems from the distinctive development conditions of the northeastern region. Empirical evidence confirms that the region’s DE development lags behind the other three major regions in China, having fallen into a “DE development trap” characterized by the slowest growth rate and the weakest digital infrastructure endowment [84]. Compounding this digital deficit, the region faces systemic challenges such as sluggish economic structural adjustment, severe brain drain, and slow technological upgrading [85]. The scarcity of technology-intensive and service-oriented sectors, coupled with an industrial structure anchored in traditional heavy industries, means that the northeastern DE lacks the complete industrial chain and ecosystem necessary for digital technologies to effectively penetrate and reshape urban energy systems [86]. These structural impediments collectively prevent DE from effectively advancing UET in the northeastern region at the present stage.

4.5. Spatial Effect Analysis

Before examining the spatial effects, we first perform a spatial autocorrelation test using Moran’s I index to verify whether spatial correlation exists among the variables; Table 6 reports the resulting statistics. The Moran’s I statistics for DE and UET are significantly positive across all sample years, which effectively demonstrates that both variables exhibit spatial correlation.
To identify the most suitable spatial econometric specification, we conduct LR and Wald tests. The LR statistics for the spatial lag and spatial error models equal 46.64 and 78.03, respectively, while the corresponding Wald statistics are 44.73 and 84.86; all four tests reach significance at the 1% level. Furthermore, Hausman tests indicate that the fixed-effects SDM represents the preferred specification.
Therefore, turning to the spatial effect estimates in Column (1) of Table 7, the significantly positive spatial rho indicates that UET exhibits positive spatial spillovers—improvements in one city’s energy transition motivate neighboring cities. To gain deeper insight, we follow Pace and LeSage [87] and decompose the marginal impact of DE into direct, indirect (spillover), and total effects, with values of 0.1438, 0.1340, and 0.2778, respectively, all statistically significant. These results indicate that DE has a strong positive externality, with its energy transition effects spreading to surrounding cities via spatial spillover. Hypothesis 5 is thus confirmed.
Based on the new economic geography theory, interactions between the center and surrounding areas are formed through spatial spillover effects (e.g., demonstration and synergy effects) [88]. Therefore, the energy transition of one city positively impacts the surrounding areas. Furthermore, information networks and data resources, as key components of DE, help overcome geographical constraints and stimulate green development in neighboring cities [63]. As DE diffuses across regions, cities can share and learn from successful experiences in energy transition, thereby accelerating the overall process.
To assess the robustness of these findings, we re-estimate the spatial effects using an economic distance matrix and a composite economic-geographic weight matrix, with corresponding estimates presented in Columns (2)–(3). The resulting coefficients and significance levels under these alternative spatial matrices are similar to those obtained with the adjacency matrix, confirming that the spatial effect results are robust.

5. Conclusions and Policy Implications

China is pressing ahead with its energy transition yet continues to face considerable practical challenges. In the digital era, DE is fundamentally reshaping the urban energy sector. Drawing on data for 266 Chinese cities covering 2011–2021, this study provides a systematic examination of how DE influences UET. The findings demonstrate that DE significantly promotes UET and generates a positive spatial spillover effect. Furthermore, resource allocation efficiency and industrial structure upgrading emerge as mediating pathways through which DE fosters UET. Electricity intensity amplifies the positive effect of DE on UET, while pronounced regional heterogeneity leads to differentiated impacts across regions.
Therefore, specific policy implications can be drawn from the research findings. First, given the direct promotional effect of DE on UET, cities should prioritize strengthening the enabling role of digital technologies by accelerating the deployment and continuous upgrading of digital infrastructure. Through digital retrofitting and intelligent management, cities can achieve real-time monitoring, dynamic optimization, and end-to-end control of energy utilization, thereby enhancing energy efficiency and expanding the share of clean energy. This approach translates the direct catalytic effect of DE into sustained optimization of the urban energy structure. Furthermore, given the significant positive spatial spillovers of this effect, regional policies must transcend administrative boundaries and foster intercity digital energy collaboration networks. Such networks facilitate the diffusion of green technology standards, energy-saving management models, and low-carbon solutions to neighboring areas. By leveraging core cities as nodal anchors to drive coordinated transition across surrounding hinterlands, policy can translate localized transition gains into the coordinated optimization and low-carbon upgrading of the entire urban agglomeration’s energy system.
Second, to fully harness the potential of DE in advancing UET through improved resource allocation and industrial upgrading, policy efforts should proceed along two mutually reinforcing fronts. First, market-oriented mechanisms for factor allocation need to be strengthened by lowering industrial entry barriers and employing digital technologies to accurately detect and correct resource misallocation, thereby channeling capital, labor, and other factors more effectively into low-energy-consuming sectors and accelerating the energy structure’s upgrading. Second, industrial digitalization and digital industrialization should be treated as strategic priorities. This means transforming traditional energy-intensive sectors into intelligent, service-oriented models while nurturing emerging industries with lower energy intensity and elevated value creation. Only by embedding digital empowerment into factor reallocation and industrial structure upgrading can the structural driving force of DE on UET be fully unleashed.
Third, given that electricity intensity significantly and positively moderates the impact of DE on UET, policy should prioritize high-electricity-intensity cities as focal points for digital energy integration. This involves strategically directing the deployment of energy IoT infrastructure and intelligent dispatching systems toward these areas while strengthening the synergy between carbon emission constraints and digital retrofitting. By harnessing intensified transition imperatives to fully unleash the amplifying effects of DE on refined energy management, clean energy substitution, and efficiency improvement, policymakers can avoid a uniform strategy and thereby maximize the marginal contribution to UET.
Finally, policies for DE development should be tailored to the resource endowments of different regions. Across the eastern, central, and western regions, sustained investment in digital transformation is needed to unlock the potential of DE. In the northeastern region, it is crucial to address deficits in digital infrastructure and industrial upgrading, expand fiscal support, and adopt incentive policies to attract capital, talent, and resources for digital technology innovation, thereby advancing UET.
However, this study has several limitations. First, it lacks enterprise-level data on DE, which makes it difficult to examine how enterprise digitalization behaviors affect UET. Future research could explore the underlying mechanisms from a micro perspective using enterprise-level data. Second, regarding measurement, both DE and UET are inherently multidimensional constructs. Although the composite indices we construct are grounded in the literature, they may still omit certain relevant dimensions, introducing measurement error that could affect the precision of the estimates. Third, because complete city-level data on energy and DE are unavailable for more recent years, the sample is limited to the 2011–2021 period. Future research could extend the sample as more recent data become available to test the robustness of the findings.

Author Contributions

Conceptualization, Z.W.; methodology, Y.H. and Y.L.; software, Y.H.; validation, Y.L. and Z.W.; formal analysis, Y.H.; investigation, Y.L.; resources, Y.L. and Z.W.; data curation, Y.H.; writing—original draft preparation, Y.H.; writing—review and editing, Y.H., Y.L. and Z.W.; visualization, Y.L.; supervision, Z.W.; project administration, Z.W.; funding acquisition, Z.W. All authors have read and agreed to the published version of the manuscript.

Funding

This research was funded by the National Natural Science Foundation of China (72264040), the Yunnan Talent Support Program (C6213002019), and the Yunnan Provincial Department of Education Scientific Research Fund Project (2024Y076).

Institutional Review Board Statement

Not applicable.

Informed Consent Statement

Not applicable.

Data Availability Statement

The raw data supporting the conclusions of this article will be made available by the authors on request.

Acknowledgments

In conducting this study, Stata/MP 17.0 was employed for data analysis. The authors have reviewed and edited the output and take full responsibility for the content of this publication.

Conflicts of Interest

The authors declare no conflicts of interest.

Abbreviations

The following abbreviations are used in this manuscript:
UETUrban energy transition
DEDigital economy
RAEResource allocation efficiency
ISUIndustrial structure upgrading
ELIElectricity intensity
INDIndustrialization
OPENOpenness
POPUPopulation density
FINAFinancial agglomeration
INFRInfrastructure

Appendix A

Table A1. The conceptual framework of the energy transition index.
Sub-IndexesDimensionsComponentsIndicators UnitDirection
Energy system performance (50%)Energy system structure (50%)Energy mix (25%)Coal consumption share (100%)%
Electricity structure (25%)Local coal consumption for power generation vs. total electricity consumption (100%)kg standard coal equivalent/kWh
Energy intensity (25%)Energy consumption per unit of GDP (100%)standard coal equivalent/104 yuan
Energy consumption (25%)Energy consumption per capita (50%)standard coal equivalent per capita
Electricity consumption per capita (50%)kWh per capita +
Environmental sustainability (50%)Carbon intensity (33%)Carbon emissions per unit of GDP (100%)t/104 yuan
Carbon emissions per capita (33%)Carbon emissions per capita within urban territory (100%)t/per capita
Air pollution (33%)PM2.5 concentration (100%)μg/m3
Transition readiness (50%)Economic development (25%)Economic growth (50%)Per capita GDP (50%)yuan per capita +
GDP growth rate (50%)% +
Economic structure (50%)Share of employees in mining (50%)%
Tertiary industry share in GDP (50%)% +
Capital & investment (25%)Capital stock (33%)Annual average net value of fixed assets per capita (33%)yuan per capita +
Urban construction land share in municipal districts (33%)% +
Per capita deposits of the national banking system at year-end (33%)yuan per capita +
Investment (33%)Per capita total social fixed asset investment (50%)yuan per capita +
Amount of foreign capital per capita (50%)US dollars per capita +
Fiscal capacity (33%)Per capita fiscal revenue (100%) yuan per capita +
Technology capacity (25%)Innovation capacity (33%)China innovation and entrepreneurship index (33%) 0–100 +
Internet service user share (33%)% +
Number of green patent applications per capita (33%)number per 104 capita +
Technology expenditure (33%)Per capita science and technology expenditure (100%) yuan per capita +
Adaptive technology (33%)Ratio of industrial SO2 removed (25%)% +
Ratio of wastewater centralized treated (25%)% +
Ratio of consumption waste treated (25%)% +
Ratio of industrial solid waste treated (25%)% +
Human capital (25%)R&D and new economy (33%)Number of employees in scientific research and technical services (50%)104 persons +
Number of employees in information technology (50%)104 persons +
Education and training capacity (33%)Proportion of employees in the education industry (33%)per 104 capita +
Number of full-time teachers in vocational secondary schools (33%)per 104 capita +
Number of full-time teachers in regular institutions of higher education (33%)per 104 capita +
Quality of education (33%)Per capita education expenditure (50%)yuan per capita +
Number of students enrolled in regular institutions of higher education (50%)per 104 capita +

References

  1. Johnsson, F.; Kjärstad, J.; Rootzén, J. The threat to climate change mitigation posed by the abundance of fossil fuels. Clim. Policy 2019, 19, 258–274. [Google Scholar]
  2. Niu, X.; Zhan, Z.; Li, B.; Chen, Z. Environmental governance and cleaner energy transition: Evaluating the role of environment friendly technologies. Sustain. Energy Technol. Assess. 2022, 53, 102669. [Google Scholar] [CrossRef] [Scilit]
  3. Ramzan, M.; Razi, U.; Quddoos, M.U.; Adebayo, T.S. Do green innovation and financial globalization contribute to the ecological sustainability and energy transition in the United Kingdom? Policy insights from a bootstrap rolling window approach. Sustain. Dev. 2023, 31, 393–414. [Google Scholar]
  4. Shen, Y.; Shi, X.; Zhao, Z.; Xu, J.; Sun, Y.; Liao, Z.; Li, Y.; Shan, Y. A dataset of low-carbon energy transition index for Chinese cities 2003–2019. Sci. Data 2023, 10, 906. [Google Scholar] [CrossRef] [Scilit] [PubMed]
  5. Adams, S.; Kaffo Fotio, H. Economic integration and environmental quality: Accounting for the roles of financial development, industrialization, urbanization and renewable energy. J. Environ. Plan. Manag. 2024, 67, 688–713. [Google Scholar]
  6. Cheung, T.T.T.; Fuller, S.; Oßenbrügge, J. Mobilising change in cities: A capacity framework for understanding urban energy transition pathways. Environ. Policy Gov. 2023, 33, 531–545. [Google Scholar] [CrossRef] [Scilit]
  7. Lampropoulos, I.; Alskaif, T.; Schram, W.; Bontekoe, E.; Coccato, S.; Van Sark, W. Review of energy in the built environment. Smart Cities 2020, 3, 248–288. [Google Scholar] [CrossRef] [Scilit]
  8. Bompard, E.F.; Conti, S.; Masera, M.J.; Soma, G.G. A New Electricity Infrastructure for Fostering Urban Sustainability: Challenges and Emerging Trends. Energies 2024, 17, 5573. [Google Scholar] [CrossRef] [Scilit]
  9. Song, H.; Chen, W. Data-driven smart governance for dual-dimensional optimization of urban renewable energy systems: Enhancing transition depth and breadth. Energy Strateg. Rev. 2026, 64, 102087. [Google Scholar]
  10. Derkenbaeva, E.; Vega, S.H.; Hofstede, G.J.; Van Leeuwen, E. Positive energy districts: Mainstreaming energy transition in urban areas. Renew. Sustain. Energy Rev. 2022, 153, 111782. [Google Scholar] [CrossRef] [Scilit]
  11. Chen, P. Is the digital economy driving clean energy development?-New evidence from 276 cities in China. J. Clean. Prod. 2022, 372, 133783. [Google Scholar]
  12. Zhou, Y. Low-carbon urban-rural modern energy systems with energy resilience under climate change and extreme events in China-A state-of-the-art review. Energy Build. 2024, 321, 114661. [Google Scholar]
  13. Wu, R.; Su, S.; Hou, J.; Wang, X. Digital Economy, Green Technology Innovation and Urban Carbon Emissions: Evidence from Chinese Cities. Systems 2026, 14, 291. [Google Scholar] [CrossRef] [Scilit]
  14. Li, C.; Zhou, W. Can digital economy development contribute to urban carbon emission reduction?-Empirical evidence from China. J. Environ. Manag. 2024, 357, 120680. [Google Scholar]
  15. Zeng, P.; Wang, Y.; Tian, Z. Regional differences, source decomposition and formation mechanism of urban digital economy and energy market integration in China. J. Clean. Prod. 2024, 451, 141960. [Google Scholar] [CrossRef] [Scilit]
  16. Wu, J.; Lin, K.; Sun, J. Improving urban energy efficiency: What role does the digital economy play? J. Clean. Prod. 2023, 418, 138104. [Google Scholar] [CrossRef] [Scilit]
  17. Guo, Q.; You, W. How can the digital economy alleviate multidimensional energy poverty?—Empirical evidence of 21 prefecture-level cities in Guangdong Province. Energy 2024, 301, 131692. [Google Scholar]
  18. Jiang, W.; Li, J. Digital transformation and its effect on resource allocation efficiency and productivity in Chinese corporations. Technol. Soc. 2024, 78, 102638. [Google Scholar] [CrossRef] [Scilit]
  19. Guo, L.; Du, F.; Tang, M. Will the Development of the Digital Economy Impact the Clean Energy Transition? An Intermediary Utility Analysis Based on Technological Innovation and Industrial Structure. Sustainability 2025, 17, 4917. [Google Scholar] [CrossRef] [Scilit]
  20. Dian, J.; Song, T.; Li, S. Facilitating or inhibiting? Spatial effects of the digital economy affecting urban green technology innovation. Energy Econ. 2024, 129, 107223. [Google Scholar]
  21. Bhatt, V.; Friley, P.; Lee, J. Integrated energy and environmental systems analysis methodology for achieving low carbon cities. J. Renew. Sustain. Energy 2010, 2, 121–147. [Google Scholar] [CrossRef] [Scilit]
  22. Liu, L.; Zhou, R.; Wang, F. What Roles Do Local Governments Play in Chinese Urban Energy Transition? Systems 2025, 13, 1092. [Google Scholar] [CrossRef] [Scilit]
  23. Lu, Y.X.; Fang, X.M.; Zhang, A.Q. Digital economy, spatial spillover and high-quality development of urban economy. Econ. Surv. 2021, 38, 21–31. [Google Scholar]
  24. Kalair, A.; Abas, N.; Saleem, M.S.; Kalair, A.R.; Khan, N. Role of energy storage systems in energy transition from fossil fuels to renewables. Energy Storage 2021, 3, e135. [Google Scholar]
  25. Wang, B.; Liu, G.; Zhou, S.; Tang, Z.; Liu, Z.; Deng, N.; Wang, Z. Can China’s renewable energy policy synergies help clean energy transition? Environ. Impact Assess. Rev. 2025, 113, 107878. [Google Scholar]
  26. Hu, Y.; Liu, Y.; Wang, Z. How does China’s energy quota trading policy affect regional energy transition? Util. Policy 2026, 100, 102171. [Google Scholar]
  27. Kost, C.; Palzer, A.; Sterchele, P.; Stephanos, C.; Hartmann, N.; Henning, H.M. Coal phase out, energy efficiency, and electricity imports: Key elements to realize the energy transformation. Appl. Phys. Rev. 2019, 6, 011308. [Google Scholar] [CrossRef] [Scilit]
  28. Zhang, D.; Kong, Q. Green energy transition and sustainable development of energy firms: An assessment of renewable energy policy. Energy Econ. 2022, 111, 106060. [Google Scholar] [CrossRef] [Scilit]
  29. Bashir, M.F.; Pan, Y.; Shahbaz, M.; Ghosh, S. How energy transition and environmental innovation ensure environmental sustainability? Contextual evidence from Top-10 manufacturing countries. Renew. Energy 2023, 204, 697–709. [Google Scholar] [CrossRef] [Scilit]
  30. Liu, G.; Xu, W.; Nguyen, Q.M. Can the energy transition drive economic development? Empirical analysis of China’s provincial panel data. Technol. Forecast. Soc. Change 2024, 206, 123541. [Google Scholar]
  31. Bie, F.; Yang, Y.; Shen, H.; Zhao, Q. Inclusive digital economy, resource dependence and changes in the urban energy mix: City level analysis from China. Resour. Policy 2024, 92, 105027. [Google Scholar] [CrossRef] [Scilit]
  32. Wang, Q.; Fan, Z. Green finance and investment behavior of renewable energy enterprises: A case study of China. Int. Rev. Financ. Anal. 2023, 87, 102564. [Google Scholar] [CrossRef] [Scilit]
  33. Wang, W.; Yang, X.; Cao, J.; Bu, W.; Adebayo, T.S.; Dilanchiev, A.; Ren, S. Energy internet, digital economy, and green economic growth: Evidence from China. Innov. Green Dev. 2022, 1, 100011. [Google Scholar] [CrossRef] [Scilit]
  34. Lyu, Y.; Wu, Y.; Wu, G.; Wang, W.; Zhang, J. Digitalization and energy: How could digital economy eliminate energy poverty in China? Environ. Impact Assess. Rev. 2023, 103, 107243. [Google Scholar] [CrossRef] [Scilit]
  35. Xue, Y.; Tang, C.; Wu, H.; Liu, J.; Hao, Y. The emerging driving force of energy consumption in China: Does digital economy development matter? Energy Policy 2022, 165, 112997. [Google Scholar] [CrossRef] [Scilit]
  36. Ma, Q.; Tariq, M.; Mahmood, H.; Khan, Z. The nexus between digital economy and carbon dioxide emissions in China: The moderating role of investments in research and development. Technol. Soc. 2022, 68, 101910. [Google Scholar] [CrossRef] [Scilit]
  37. Xin, Y.; Chang, X.; Zhu, J. How does the digital economy affect energy efficiency? Empirical research on Chinese cities. Energy Environ. 2024, 35, 1703–1728. [Google Scholar]
  38. Wang, L.; Chen, L. Resource dependence and air pollution in China: Do the digital economy, income inequality, and industrial upgrading matter? Environ. Dev. Sustain. 2024, 26, 2069–2109. [Google Scholar]
  39. He, W.; Li, W.; Wang, C.; Wang, S.; Yang, Y. Does energy resource misallocation affect energy utilization efficiency? Evidence from Chinese provincial panel data. Energy 2024, 288, 129544. [Google Scholar] [CrossRef] [Scilit]
  40. Qi, S.; Wang, X.; Li, K. Smarter and cleaner energy transition: Exploring how digitalization affects energy efficiency with greening as a moderator. Energy 2025, 342, 139617. [Google Scholar] [CrossRef] [Scilit]
  41. Mohseni, S.; Brent, A.C. Long-term planning optimisation of sustainable energy systems: A systematic review and meta-analysis of trends, drivers, barriers, and prospects. Energy Strateg. Rev. 2025, 57, 101640. [Google Scholar]
  42. Zhao, S.; Peng, D.; Wen, H.; Song, H. Does the digital economy promote upgrading the industrial structure of Chinese cities? Sustainability 2022, 14, 10235. [Google Scholar] [CrossRef] [Scilit]
  43. Song, M.; Pan, H.; Vardanyan, M.; Shen, Z. Evaluating the energy efficiency-enhancing potential of the digital economy: Evidence from China. J. Environ. Manag. 2023, 344, 118408. [Google Scholar] [CrossRef] [Scilit]
  44. Javaid, M.; Haleem, A.; Singh, R.P.; Sinha, A.K. Digital economy to improve the culture of industry 4.0: A study on features, implementation and challenges. Green Technol. Sustain. 2024, 2, 100083. [Google Scholar] [CrossRef] [Scilit]
  45. Yang, F.; Li, C.; Zhang, S. Digital economy and carbon emission intensity: Evidence from ASEAN. Sustainability 2025, 17, 10266. [Google Scholar] [CrossRef] [Scilit]
  46. Lin, B.; Huang, C. How will promoting the digital economy affect electricity intensity? Energy Policy 2023, 173, 113341. [Google Scholar]
  47. Wang, L.; Shao, J. Digital economy, entrepreneurship and energy efficiency. Energy 2023, 269, 126801. [Google Scholar] [CrossRef] [Scilit]
  48. Shahbaz, M.; Wang, J.; Dong, K.; Zhao, J. The impact of digital economy on energy transition across the globe: The mediating role of government governance. Renew. Sustain. Energy Rev. 2022, 166, 112620. [Google Scholar] [CrossRef] [Scilit]
  49. Liu, L.; Liu, J.; Zhang, J.; Zhao, Y. Does the Digital Economy Promote Renewable Energy?—Evidence From a Cross-National Sample. Asia Pac. Policy Stud. 2025, 12, e70015. [Google Scholar]
  50. Gao, J.; Hua, G.; Randhawa, A.; Huo, B.; Li, Z. Towards a Green Digital City: Digital Economy, Digital Innovation, and Urban Haze Pollution. J. Urban Technol. 2024, 31, 157–189. [Google Scholar] [CrossRef] [Scilit]
  51. Hong, J.; Gu, J.; He, R.; Wang, X.; Shen, Q. Unfolding the spatial spillover effects of urbanization on interregional energy connectivity: Evidence from province-level data. Energy 2020, 196, 116990. [Google Scholar] [CrossRef] [Scilit]
  52. Wang, Z.; Cao, X.; Ren, X.; Gozgor, G. Digital finance and the energy transition: Evidence from Chinese prefecture-level cities. Glob. Financ. J. 2024, 61, 100987. [Google Scholar] [CrossRef] [Scilit]
  53. Xiao, Y.; Wu, S.; Liu, Z.Q.; Lin, H.J. Digital economy and green development: Empirical evidence from China’s cities. Front. Environ. Sci. 2023, 11, 1124680. [Google Scholar] [CrossRef] [Scilit]
  54. Zhou, Y.; Liu, J. Advances in emerging digital technologies for energy efficiency and energy integration in smart cities. Energy Build. 2024, 315, 114289. [Google Scholar] [CrossRef] [Scilit]
  55. Lin, B.; Zhang, A. Digital finance, regional innovation environment and renewable energy technology innovation: Threshold effects. Renew. Energy 2024, 223, 120036. [Google Scholar] [CrossRef] [Scilit]
  56. Hou, M.; Xie, Y.; Lu, W.; Cui, X.; Xi, Z.; Han, Y. Green finance drives the synergy of pollution control and carbon reduction in China: Dual perspective of effect and efficiency. Energy 2025, 330, 136873. [Google Scholar] [CrossRef] [Scilit]
  57. Feng, J.; Hu, W.; Liu, L.; Duan, J. How Carbon Emissions Trading Improves Corporate Carbon Performance: Evidence from China with a Moderated Chain Mediation Analysis. Systems 2026, 14, 62. [Google Scholar] [CrossRef] [Scilit]
  58. Wang, P.; Cen, C. Does digital economy development promote innovation efficiency? A spatial econometric approach for Chinese regions. Technol. Anal. Strateg. Manag. 2024, 36, 931–945. [Google Scholar]
  59. Yang, J.; Wang, J.; Wang, W.; Wu, H. Exploring the path to promote energy revolution: Assessing the impact of new energy demonstration city construction on urban energy transition in China. Renew. Energy 2024, 236, 121437. [Google Scholar] [CrossRef] [Scilit]
  60. Bai, J.H.; Liu, Y.Y. Can outward foreign direct investment improve the resource misallocation of China. China Ind. Econ. 2018, 1, 60–78. [Google Scholar] [CrossRef]
  61. Wang, C.; Liu, Y.; Wan, Y.; Hu, S.; Xia, H. How does the digital economy impact the green upgrading of manufacturing? Perspectives on technological innovation and resource allocation. Appl. Econ. 2024, 57, 5049–5064. [Google Scholar] [CrossRef] [Scilit]
  62. Wang, Z.; Fu, H.; Liu, H.; Liao, C. Urban development sustainability, industrial structure adjustment, and land use efficiency in China. Sust. Cities Soc. 2023, 89, 104338. [Google Scholar]
  63. Ma, D.; Zhu, Q. Innovation in emerging economies: Research on the digital economy driving high-quality green development. J. Bus. Res. 2022, 145, 801–813. [Google Scholar] [CrossRef] [Scilit]
  64. Zhou, Q.; Cheng, C.; Fang, Z.; Zhang, H.; Xu, Y. How does the development of the digital economy affect innovation output? Exploring mechanisms from the perspective of regional innovation systems. Struct. Change Econ. Dyn. 2024, 70, 1–17. [Google Scholar] [CrossRef] [Scilit]
  65. Xie, R.; Fu, W.; Yao, S.; Zhang, Q. Effects of financial agglomeration on green total factor productivity in Chinese cities: Insights from an empirical spatial Durbin model. Energy Econ. 2021, 101, 105449. [Google Scholar] [CrossRef] [Scilit]
  66. Xu, Y.; Tiwari, S.; Kazemzadeh, E.; Ghosh, S.; Doğan, B. How does smart cities and digital economy facilitate energy security and energy transition? Empirical evidence from China. Energy Build. 2025, 351, 116639. [Google Scholar] [CrossRef] [Scilit]
  67. Ding, W.; Du, J.; Kazancoglu, Y.; Mangla, S.K.; Song, M. Financial development and the energy net-zero transformation potential. Energy Econ. 2023, 125, 106863. [Google Scholar] [CrossRef] [Scilit]
  68. Andal, E.G.T. Industrialisation, state-related institutions, and the speed of energy substitution: The case in Europe. Energy 2022, 239, 122274. [Google Scholar] [CrossRef] [Scilit]
  69. Balsalobre-Lorente, D.; Driha, O.M.; Halkos, G.; Mishra, S. Influence of growth and urbanization on CO2 emissions: The moderating effect of foreign direct investment on energy use in BRICS. Sustain. Dev. 2022, 30, 227–240. [Google Scholar]
  70. Li, X.; Ma, D. Financial agglomeration, technological innovation, and green total factor energy efficiency. Alex. Eng. J. 2021, 60, 4085–4095. [Google Scholar] [CrossRef] [Scilit]
  71. Sadorsky, P. The impact of financial development on energy consumption in emerging economies. Energy Policy 2010, 38, 2528–2535. [Google Scholar] [CrossRef] [Scilit]
  72. Qu, C.; Shao, J.; Shi, Z. Does financial agglomeration promote the increase of energy efficiency in China? Energy Policy 2020, 146, 111810. [Google Scholar] [CrossRef] [Scilit]
  73. Liu, Y.; Tang, C.; Zhou, A.; Yang, K. A novel ensemble approach for road traffic carbon emission prediction: A case in Canada. Environ. Dev. Sustain. 2025, 27, 15977–16013. [Google Scholar]
  74. Wang, Q.; Gao, G. Impact of digital economy on carbon emission efficiency: Evidence from a quasi-natural experiment in “Broadband China” pilot cities. Sustain. Futures 2025, 10, 101025. [Google Scholar] [CrossRef] [Scilit]
  75. Liu, Y.; Xie, Y.; Zhong, K. Impact of digital economy on urban sustainable development: Evidence from Chinese cities. Sustain. Dev. 2024, 32, 307–324. [Google Scholar]
  76. Choi, B. Productivity and misallocation of energy resources: Evidence from Korea’s manufacturing Sector. Resour. Energy Econ. 2020, 61, 101184. [Google Scholar] [CrossRef] [Scilit]
  77. Li, X.; Huang, S.; Hamaguchi, Y.; Bhuiyan, M.A. Does Land Resource Misallocation Reduce Energy Efficiency? Empirical Evidence from 243 Prefecture Level Cities in China. Rev. Dev. Econ. 2026, 30, 716–729. [Google Scholar]
  78. Du, W.; Liu, X.; Liu, Y.; Xie, J. Digital Economy and carbon emission efficiency in three major urban agglomerations of China: A U-shaped journey towards green development. J. Environ. Manag. 2025, 373, 123571. [Google Scholar]
  79. Chang, H.; Ding, Q.; Zhao, W.; Hou, N.; Liu, W. The digital economy, industrial structure upgrading, and carbon emission intensity—Empirical evidence from China’s provinces. Energy Strateg. Rev. 2023, 50, 101218. [Google Scholar]
  80. Wu, B.; Wang, Z.; Tian, Y.; Zheng, S. The impact of industrial transformation and upgrading on fossil energy elasticity in China. J. Clean. Prod. 2024, 434, 140287. [Google Scholar]
  81. Batinge, B.; Musango, J.K.; Brent, A.C. Sustainable energy transition framework for unmet electricity markets. Energy Policy 2019, 129, 1090–1099. [Google Scholar] [CrossRef] [Scilit]
  82. Lin, B.; Raza, M.Y. Analysis of electricity consumption in Pakistan using index decomposition and decoupling approach. Energy 2021, 214, 118888. [Google Scholar] [CrossRef] [Scilit]
  83. Ren, H.; Zhang, Z. Digital Transformation and Energy Consumption: Efficiency Gains or Cost Pressures? Polit. Ekon. 2026. [Google Scholar] [CrossRef] [Scilit]
  84. Zhang, X.; Ding, R.; Yang, W. Study on spatial differentiation of digital economy and it’s driving factors in China: Based on geodetector. Sustainability 2024, 16, 10472. [Google Scholar] [CrossRef] [Scilit]
  85. Guo, D.; Li, L.; Pang, G. Does the integration of digital and real economies promote urban green total factor productivity? Evidence from China. J. Environ. Manag. 2024, 370, 122934. [Google Scholar] [CrossRef] [Scilit]
  86. Wang, S.; Song, Y.; Du, A.M.; Liang, J. The digital economy and entrepreneurial dynamics: An empirical analysis of urban regions in China. Res. Int. Bus. Finance 2024, 71, 102459. [Google Scholar] [CrossRef] [Scilit]
  87. Pace, R.K.; LeSage, J.P. A sampling approach to estimate the log determinant used in spatial likelihood problems. J. Geogr. Syst. 2009, 11, 209–225. [Google Scholar] [CrossRef] [Scilit]
  88. Lv, W.; Fan, W.; Wang, Z. How to enhance the resilience of domestic tourism? J. Hosp. Tour. Manag. 2024, 61, 165–177. [Google Scholar] [CrossRef] [Scilit]
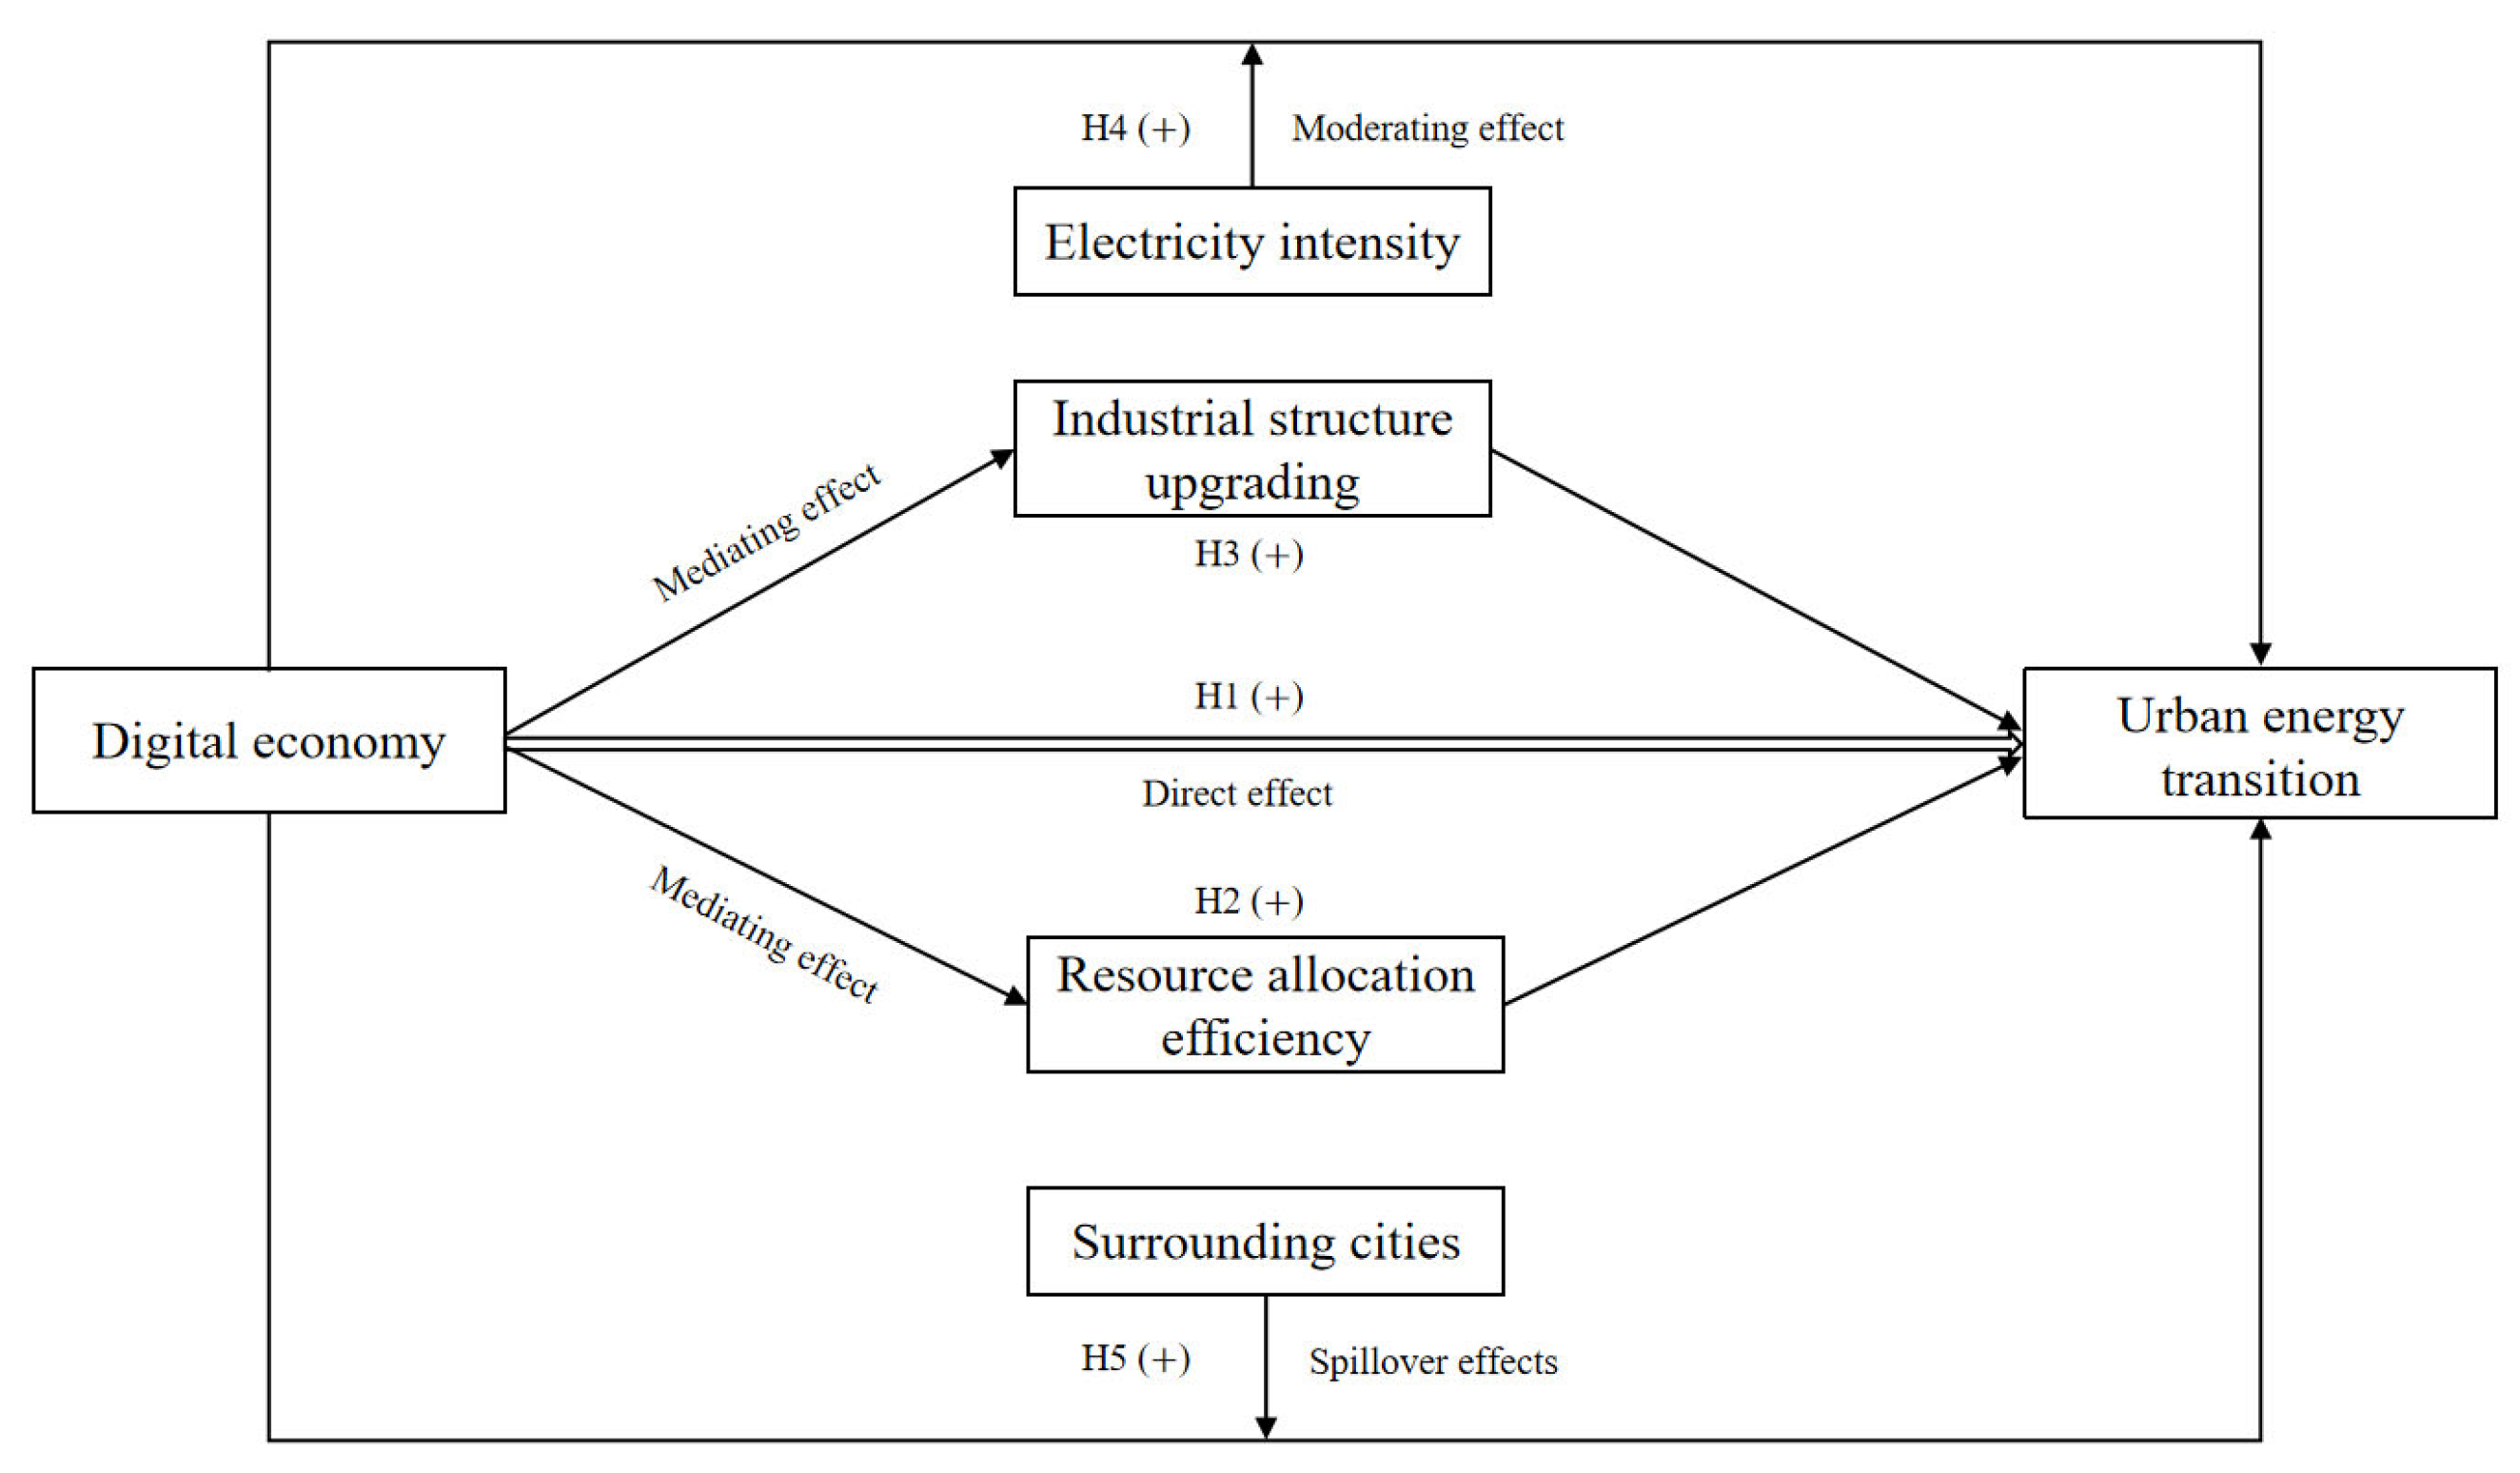
Figure 1. Theoretical framework.
Systems 14 00775 g001
Figure 2. Construction of the DE index via the entropy weight method.
Systems 14 00775 g002
Figure 3. Parallel trend test results.
Systems 14 00775 g003
Figure 4. The moderating effect of electricity intensity on the relationship between DE and UET.
Systems 14 00775 g004
Table 1. Descriptive statistics.
VariablesNMeanStd. Dev.MinMax
UET29260.46650.04660.33110.7344
DE29260.14500.07500.02170.6876
RAE29260.38770.31480.00532.6767
ISU29261.04990.58210.20445.3482
ELI29260.08250.09920.00381.7634
IND29260.45500.10490.11700.8193
OPEN29260.01700.01840.00000.2287
POPU29260.37800.54770.00586.5017
FINA29261.03840.47370.07436.2325
INFR292617.96777.34661.370060.0700
Table 2. Benchmark regression results.
Variables(1)(2)(3)(4)(5)(6)
UETUETUETUETUETUET
DE0.1576 ***0.1573 ***0.1580 ***0.1579 ***0.1575 ***0.1566 ***
(0.0091)(0.0091)(0.0090)(0.0090)(0.0090)(0.0090)
IND 0.0219 ***0.0228 ***0.0226 ***0.0222 ***0.0217 ***
(0.0054)(0.0054)(0.0054)(0.0054)(0.0053)
OPEN 0.1049 ***0.1054 ***0.1052 ***0.1051 ***
(0.0180)(0.0180)(0.0180)(0.0179)
POPU 0.00060.00060.0006
(0.0008)(0.0008)(0.0008)
FINA −0.0015 **−0.0016 **
(0.0007)(0.0007)
INFR −0.0003 ***
(0.0001)
Constant0.4295 ***0.4182 ***0.4157 ***0.4155 ***0.4172 ***0.4220 ***
(0.0009)(0.0030)(0.0030)(0.0030)(0.0031)(0.0032)
City_FEYesYesYesYesYesYes
Year_FEYesYesYesYesYesYes
N292629262926292629262926
R-squared0.73220.73390.73720.73730.73770.7400
Notes: Robust standard error is in parentheses; *** and ** denote statistical significance at the 1% and 5% levels, respectively.
Table 3. Robustness test results.
Variables(1)(2)(3)(4)(5)
UETUETUETDEUET
DE0.1471 ***0.3052 *** 0.2602 ***
(0.0090)(0.0119) (0.0273)
POLICY 0.0048 ***
(0.0018)
IV 0.0306 ***
(0.0023)
Constant0.4219 ***0.0239 ***0.4326 ***0.0973 ***0.4764 ***
(0.0032)(0.0043)(0.0065)(0.0127)(0.0077)
ControlsYesYes YesYes
City_FEYesYes YesYes
Year_FEYesYes YesYes
Kleibergen–Paap rk LM statistic 210.643
[0.0000]
Kleibergen–Paap rk Wald F statistic 180.150
{16.38}
N28822926292629262926
R-squared0.74160.57060.7135 0.5602
Notes: Robust standard error is in parentheses; *** denotes statistical significance at the 1% level.
Table 4. Mechanism analysis results.
Variables(1)(2)(3)
RAEISUUET
DE−0.3361 ***0.2481 **0.1411 ***
(0.1181)(0.1247)(0.0095)
ELI −0.0805 ***
(0.0072)
DE × ELI 0.1073 ***
(0.0337)
Constant0.4425 ***2.9896 ***0.4317 ***
(0.0427)(0.0451)(0.0031)
ControlsYesYesYes
City_FEYesYesYes
Year_FEYesYesYes
N292629262926
R-squared0.13960.82620.7718
Notes: Robust standard error is in parentheses; *** and ** denote statistical significance at the 1% and 5% levels, respectively.
Table 5. Heterogeneity test results.
Variables(1)(2)(3)(4)
UETUETUETUET
DE0.1931 ***0.2035 ***0.0672 ***0.0428
(0.0133)(0.0162)(0.0162)(0.0319)
Constant0.4620 ***0.4475 ***0.4246 ***0.4245 ***
(0.0080)(0.0056)(0.0055)(0.0057)
ControlsYesYesYesYes
City_FEYesYesYesYes
Year_FEYesYesYesYes
N913858814341
R-squared0.81680.86780.65560.6154
Notes: Robust standard error is in parentheses; *** denotes statistical significance at the 1% level.
Table 6. Spatial autocorrelation test results.
YearDEUET
Moran’s IZMoran’s IZ
20110.29067.13970.22555.5027
20120.30497.48840.22175.4116
20130.28346.9709 0.21725.3102
20140.29387.21660.18354.5034
20150.29777.33320.20615.0514
20160.30707.57920.20615.0565
20170.29077.17440.20264.9831
20180.23735.86330.19784.8655
20190.18964.73250.21195.2082
20200.21455.28480.22745.5817
20210.21645.32390.23305.7139
Table 7. Spatial effects results.
Variables(1)(2)(3)
Adjacency MatrixEconomic Distance MatrixEconomic-Geographic Weighting Matrix
DE0.1340 ***0.1320 ***0.1254 ***
(0.0077)(0.0084)(0.0081)
Wx0.0274 *0.1520 ***0.1450 ***
(0.0148)(0.0270)(0.0255)
Rho0.4260 ***0.2043 ***0.3552 ***
(0.0206)(0.0372)(0.0325)
Direct effect0.1438 ***0.1366 ***0.1352 ***
(0.0085)(0.0087)(0.0085)
Indirect effect0.1340 ***0.2208 ***0.2847 ***
(0.0238)(0.0336)(0.0380)
Total effect0.2778 ***0.3575 ***0.4199 ***
(0.0285)(0.0359)(0.0409)
ControlsYesYesYes
City_FEYesYesYes
Year_FEYesYesYes
N292629262926
Notes: Robust standard error is in parentheses; *** and * denote statistical significance at the 1% and 10% levels, respectively.
Disclaimer/Publisher’s Note: The statements, opinions and data contained in all publications are solely those of the individual author(s) and contributor(s) and not of MDPI and/or the editor(s). MDPI and/or the editor(s) disclaim responsibility for any injury to people or property resulting from any ideas, methods, instructions or products referred to in the content.