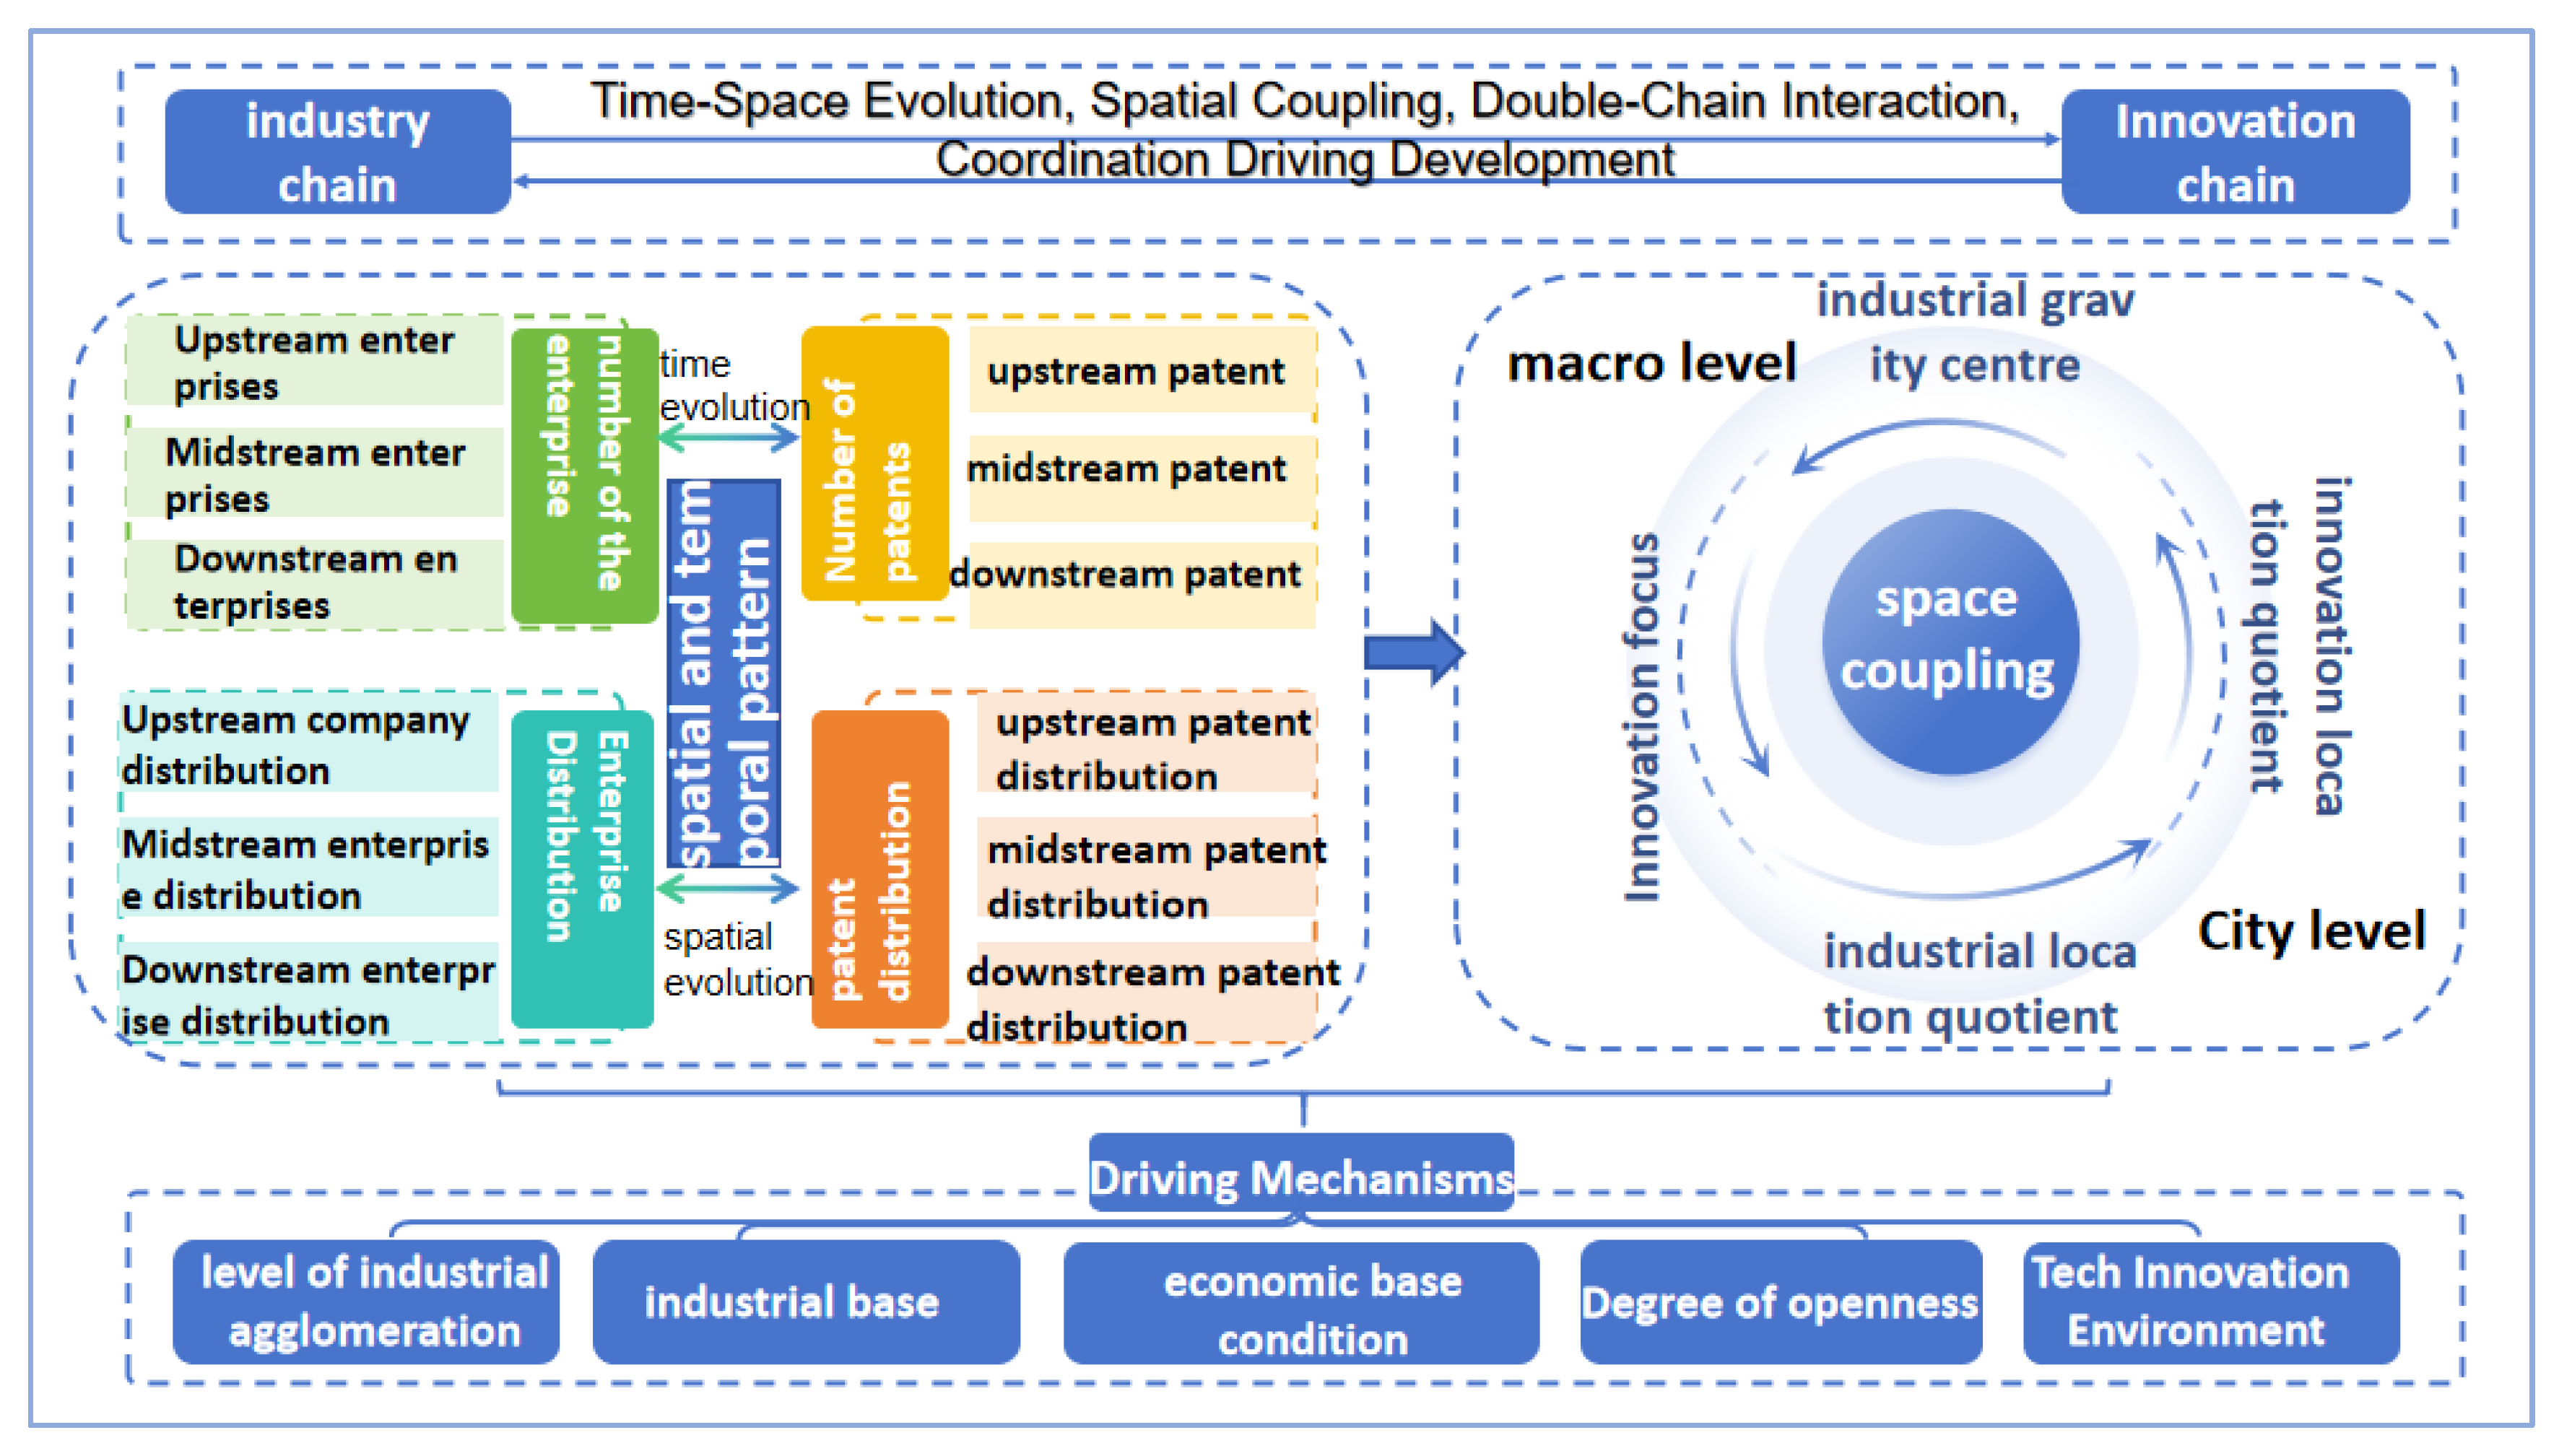
The Co-Evolution and Spatial Spillover Effects of the Relationship Between the Industry Chain and Innovation Chain of China’s Photovoltaic Cell: From the Patent Intelligence Perspective



Abstract
1. Introduction
1.1. Research Background
1.2. Literature Review
1.3. Research Gap and Goals
2. Materials and Methods
2.1. Data Sources
2.2. Research Methods
2.2.1. Spatial Gravity Center Model
2.2.2. Location Quotient
2.2.3. Spatial Econometric Model
2.2.4. Construction and Row Standardization of Spatial Weight Matrices
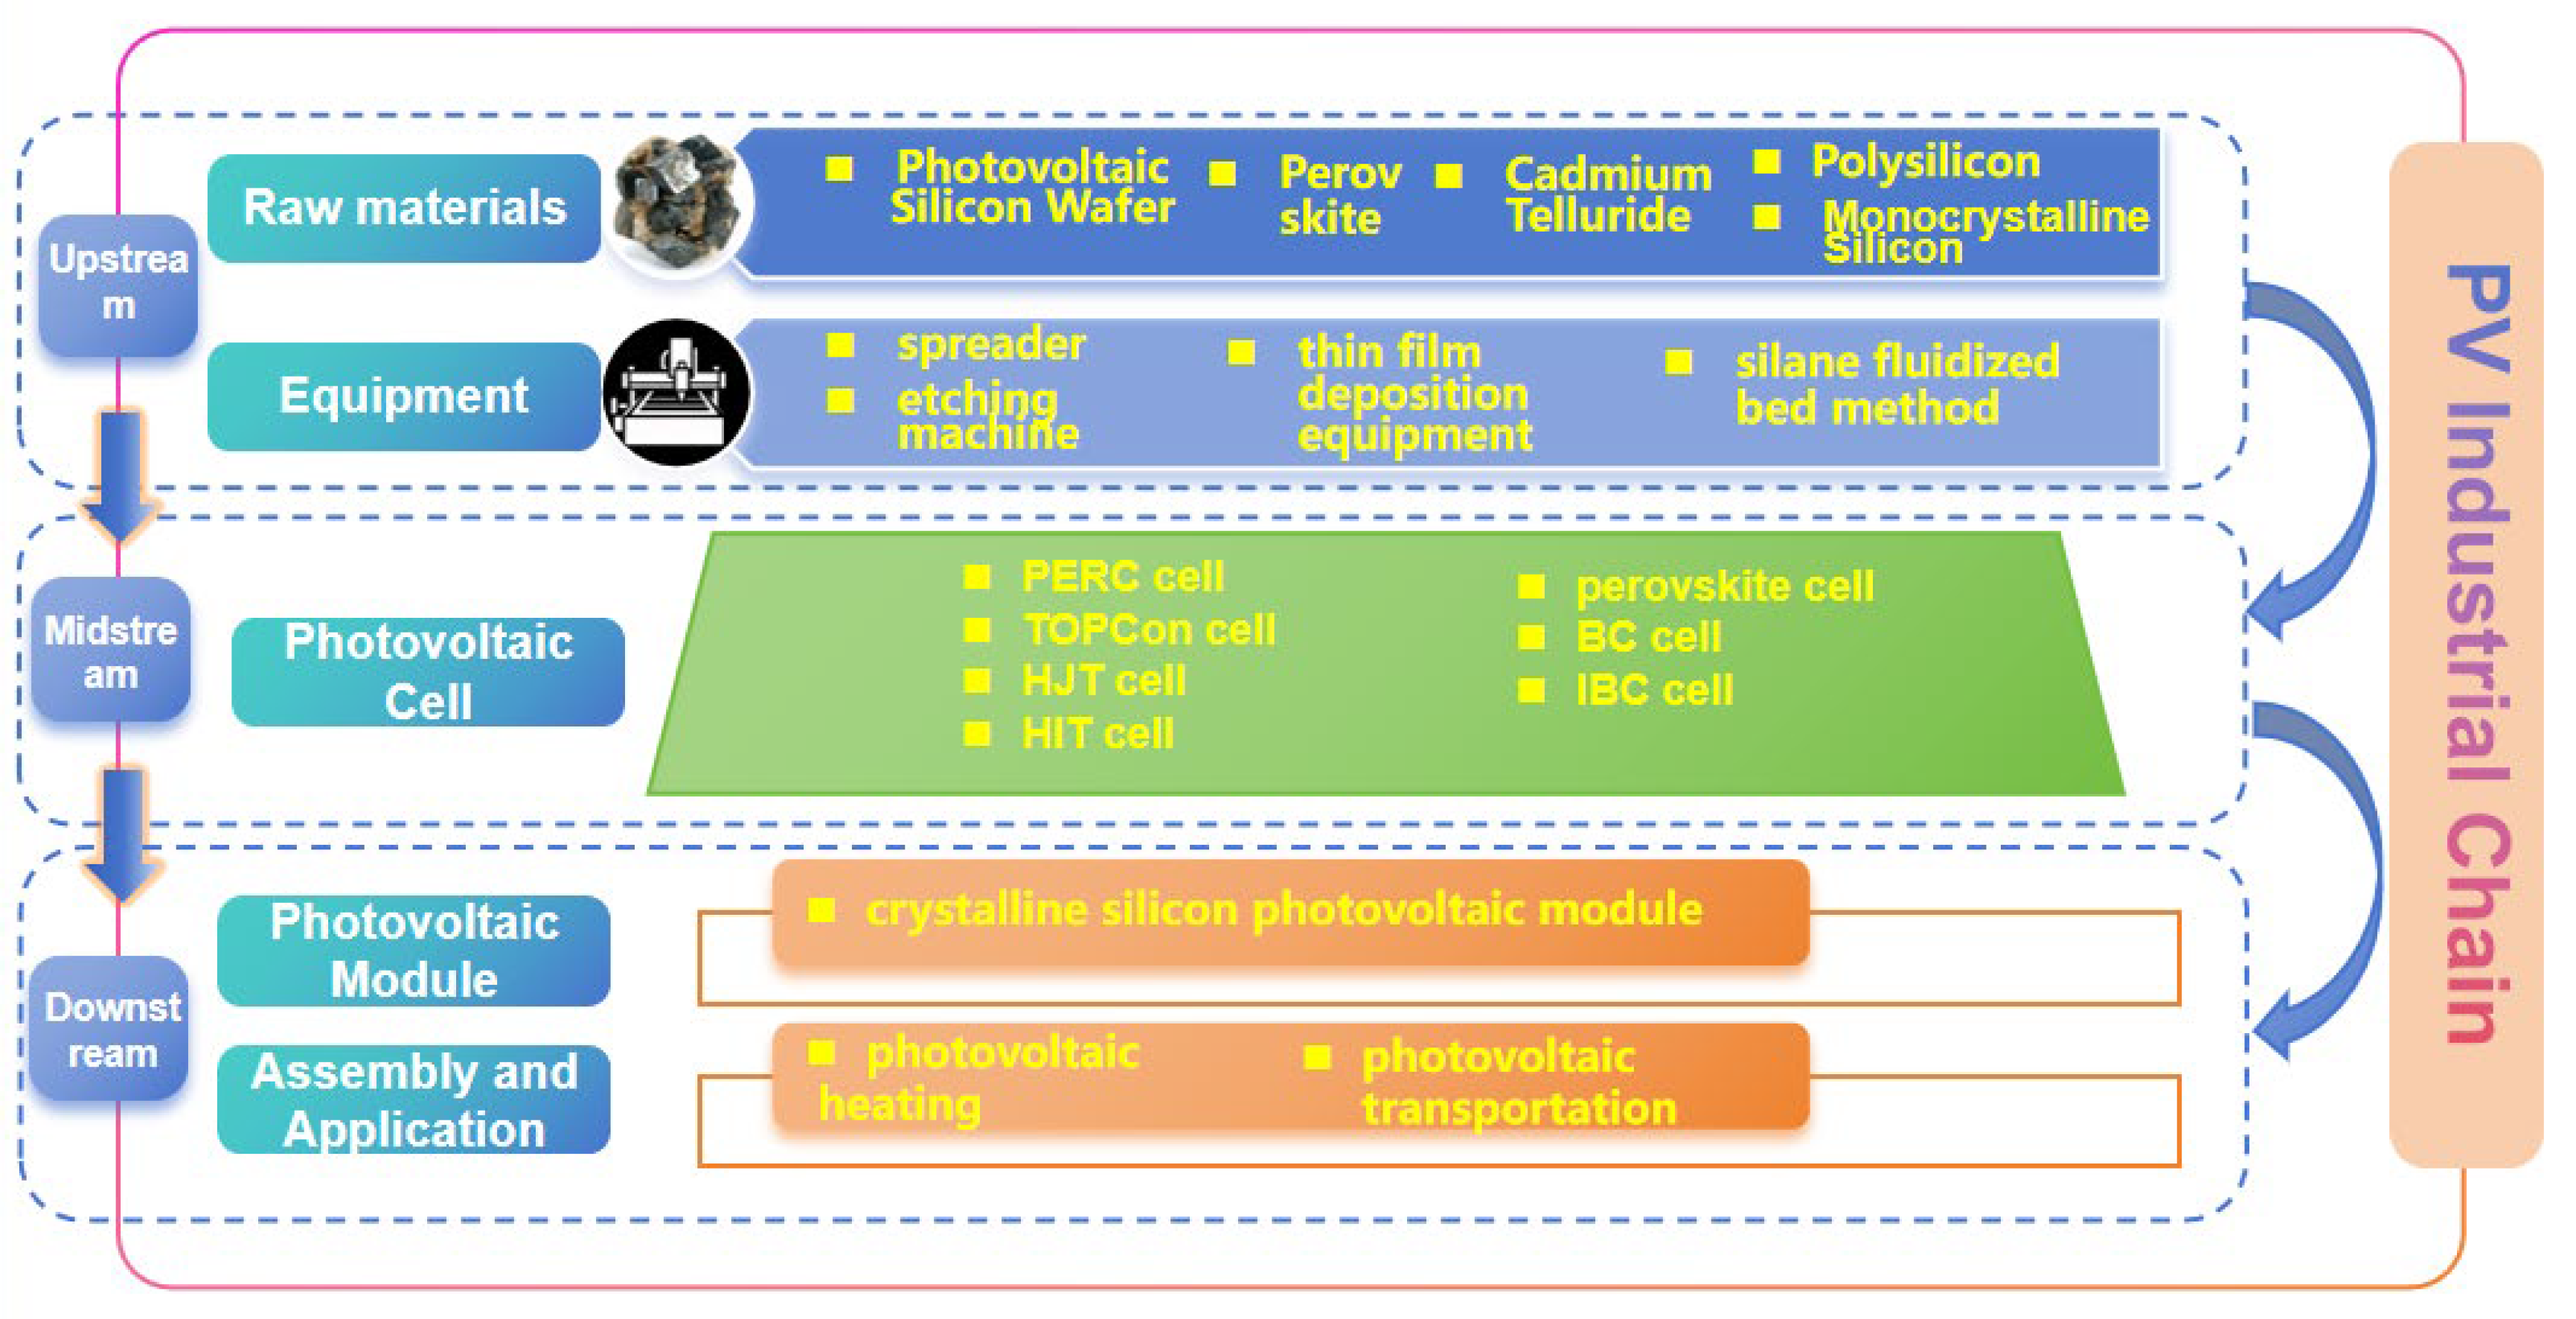
2.3. Industrial Chain Division
3. Results
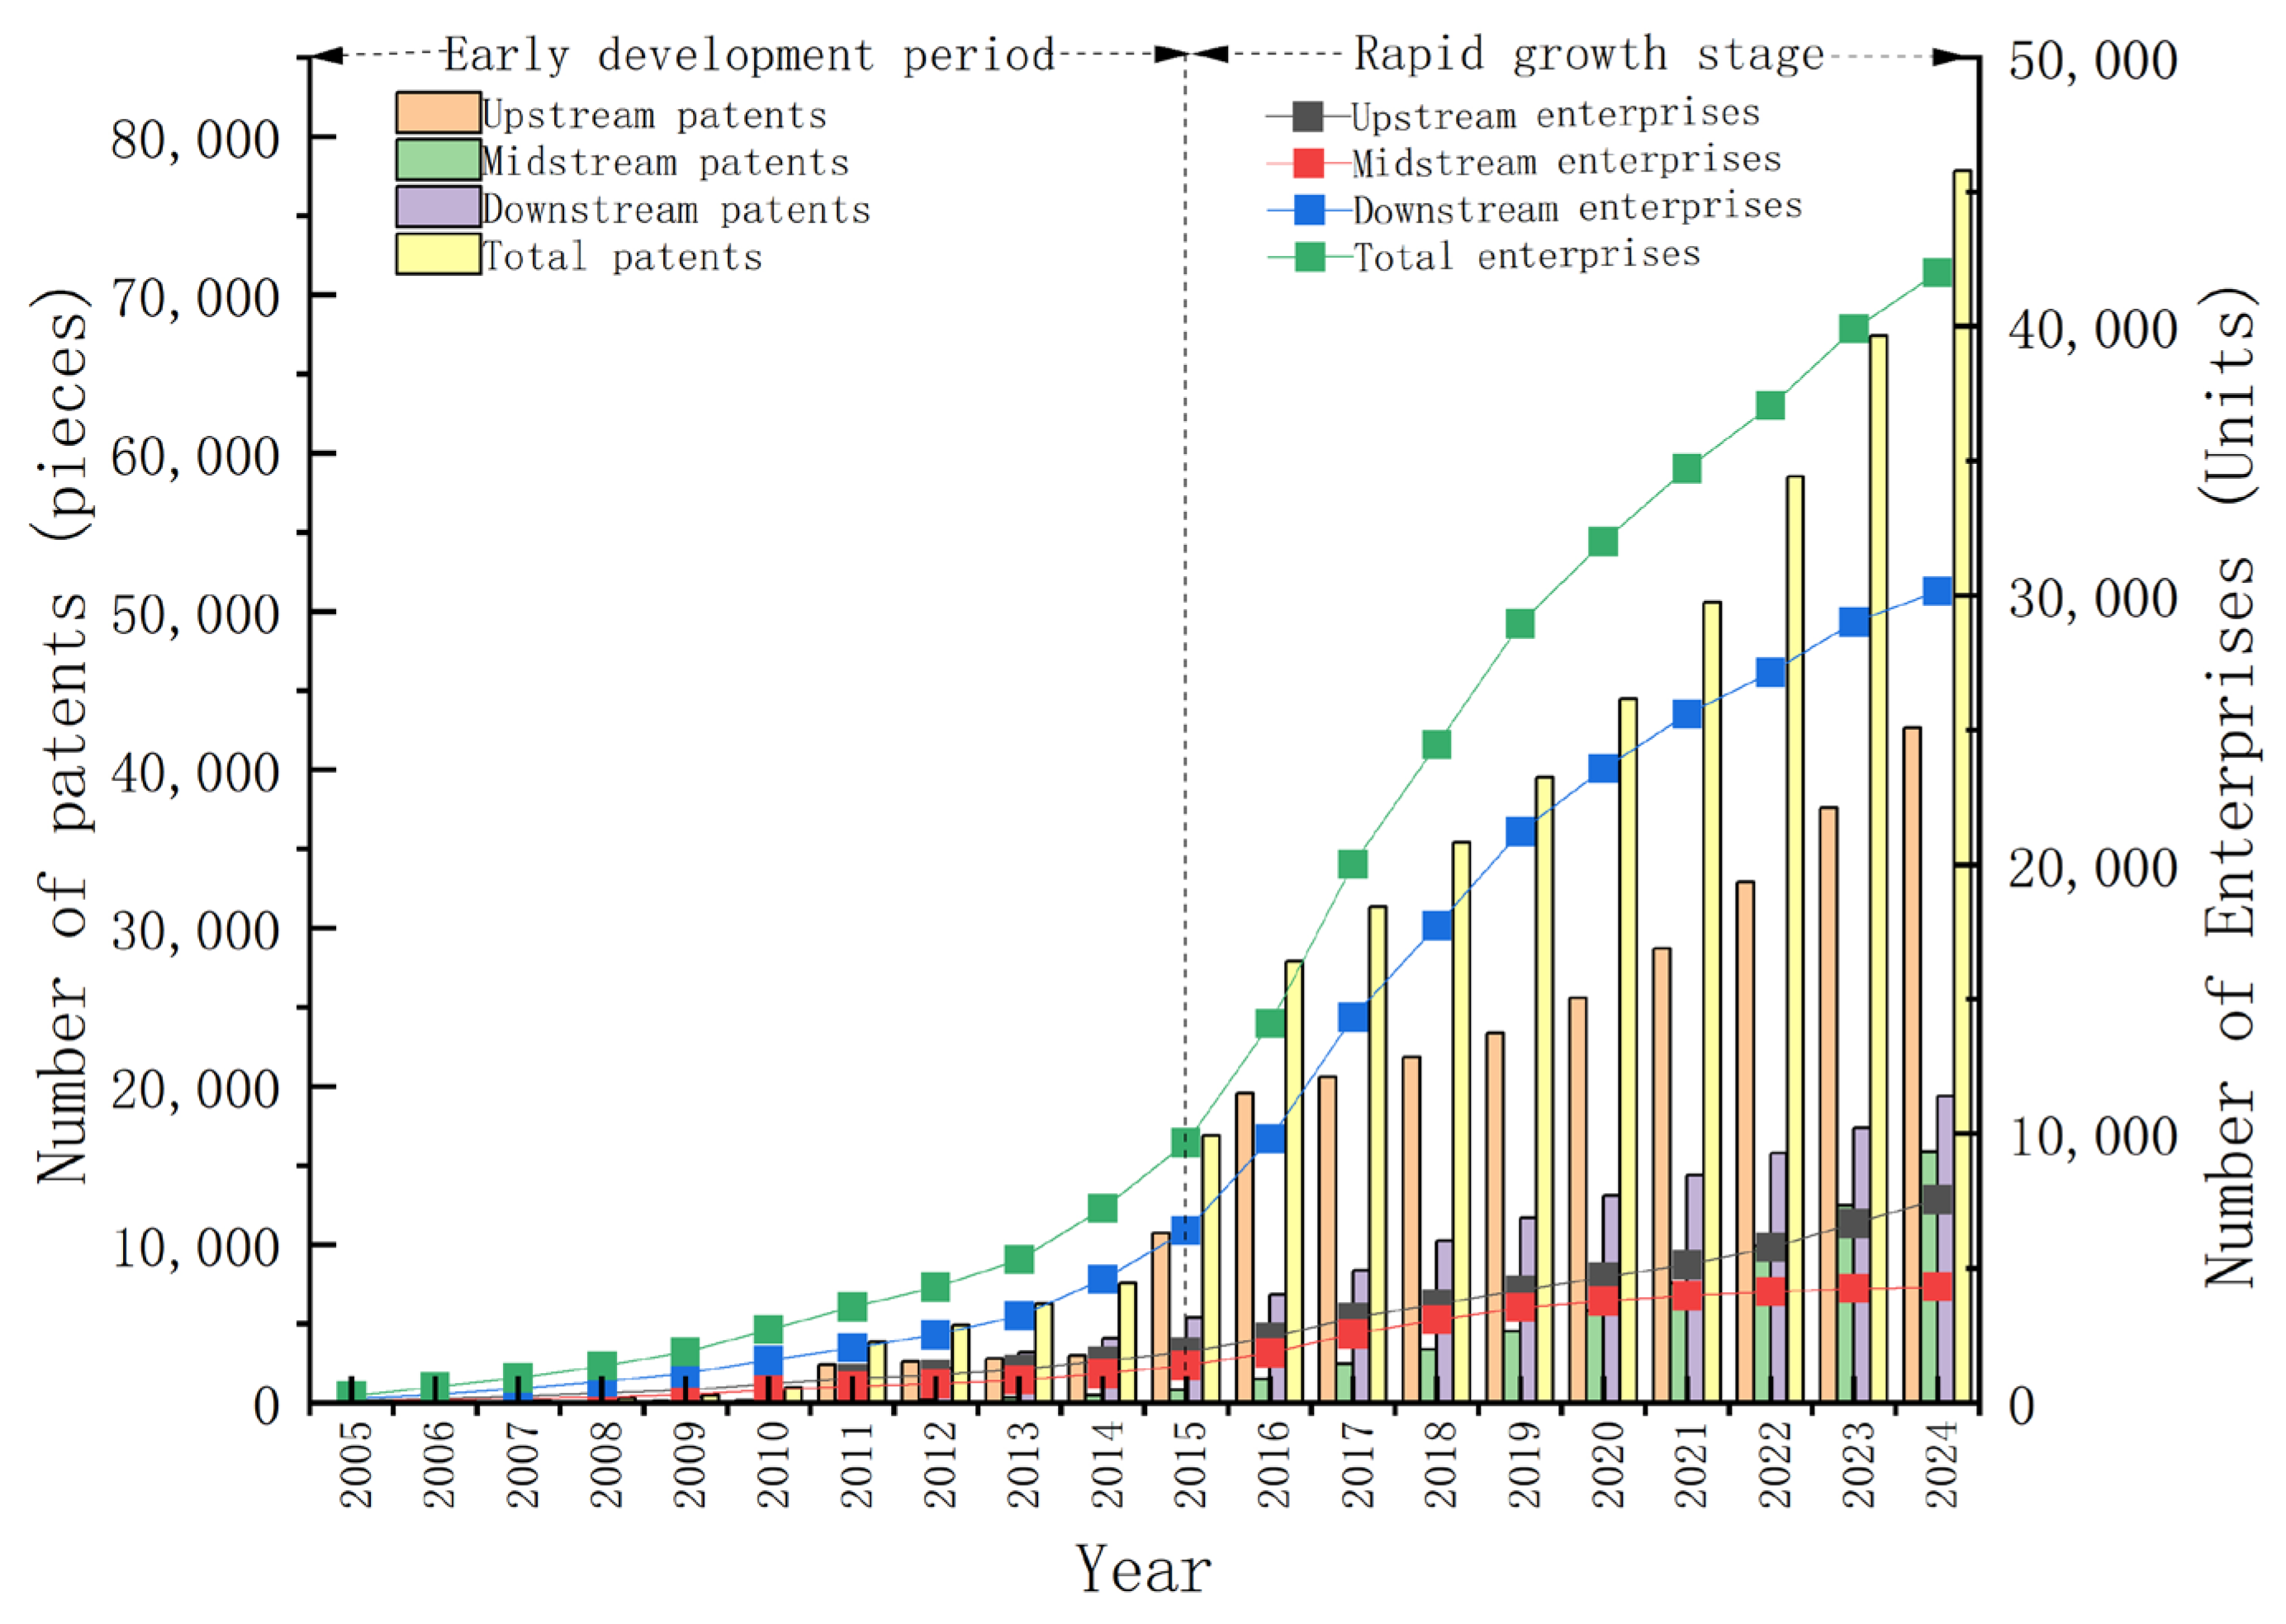
3.1. Temporal Evolution Analysis of Photovoltaic Cell Enterprises and Patents
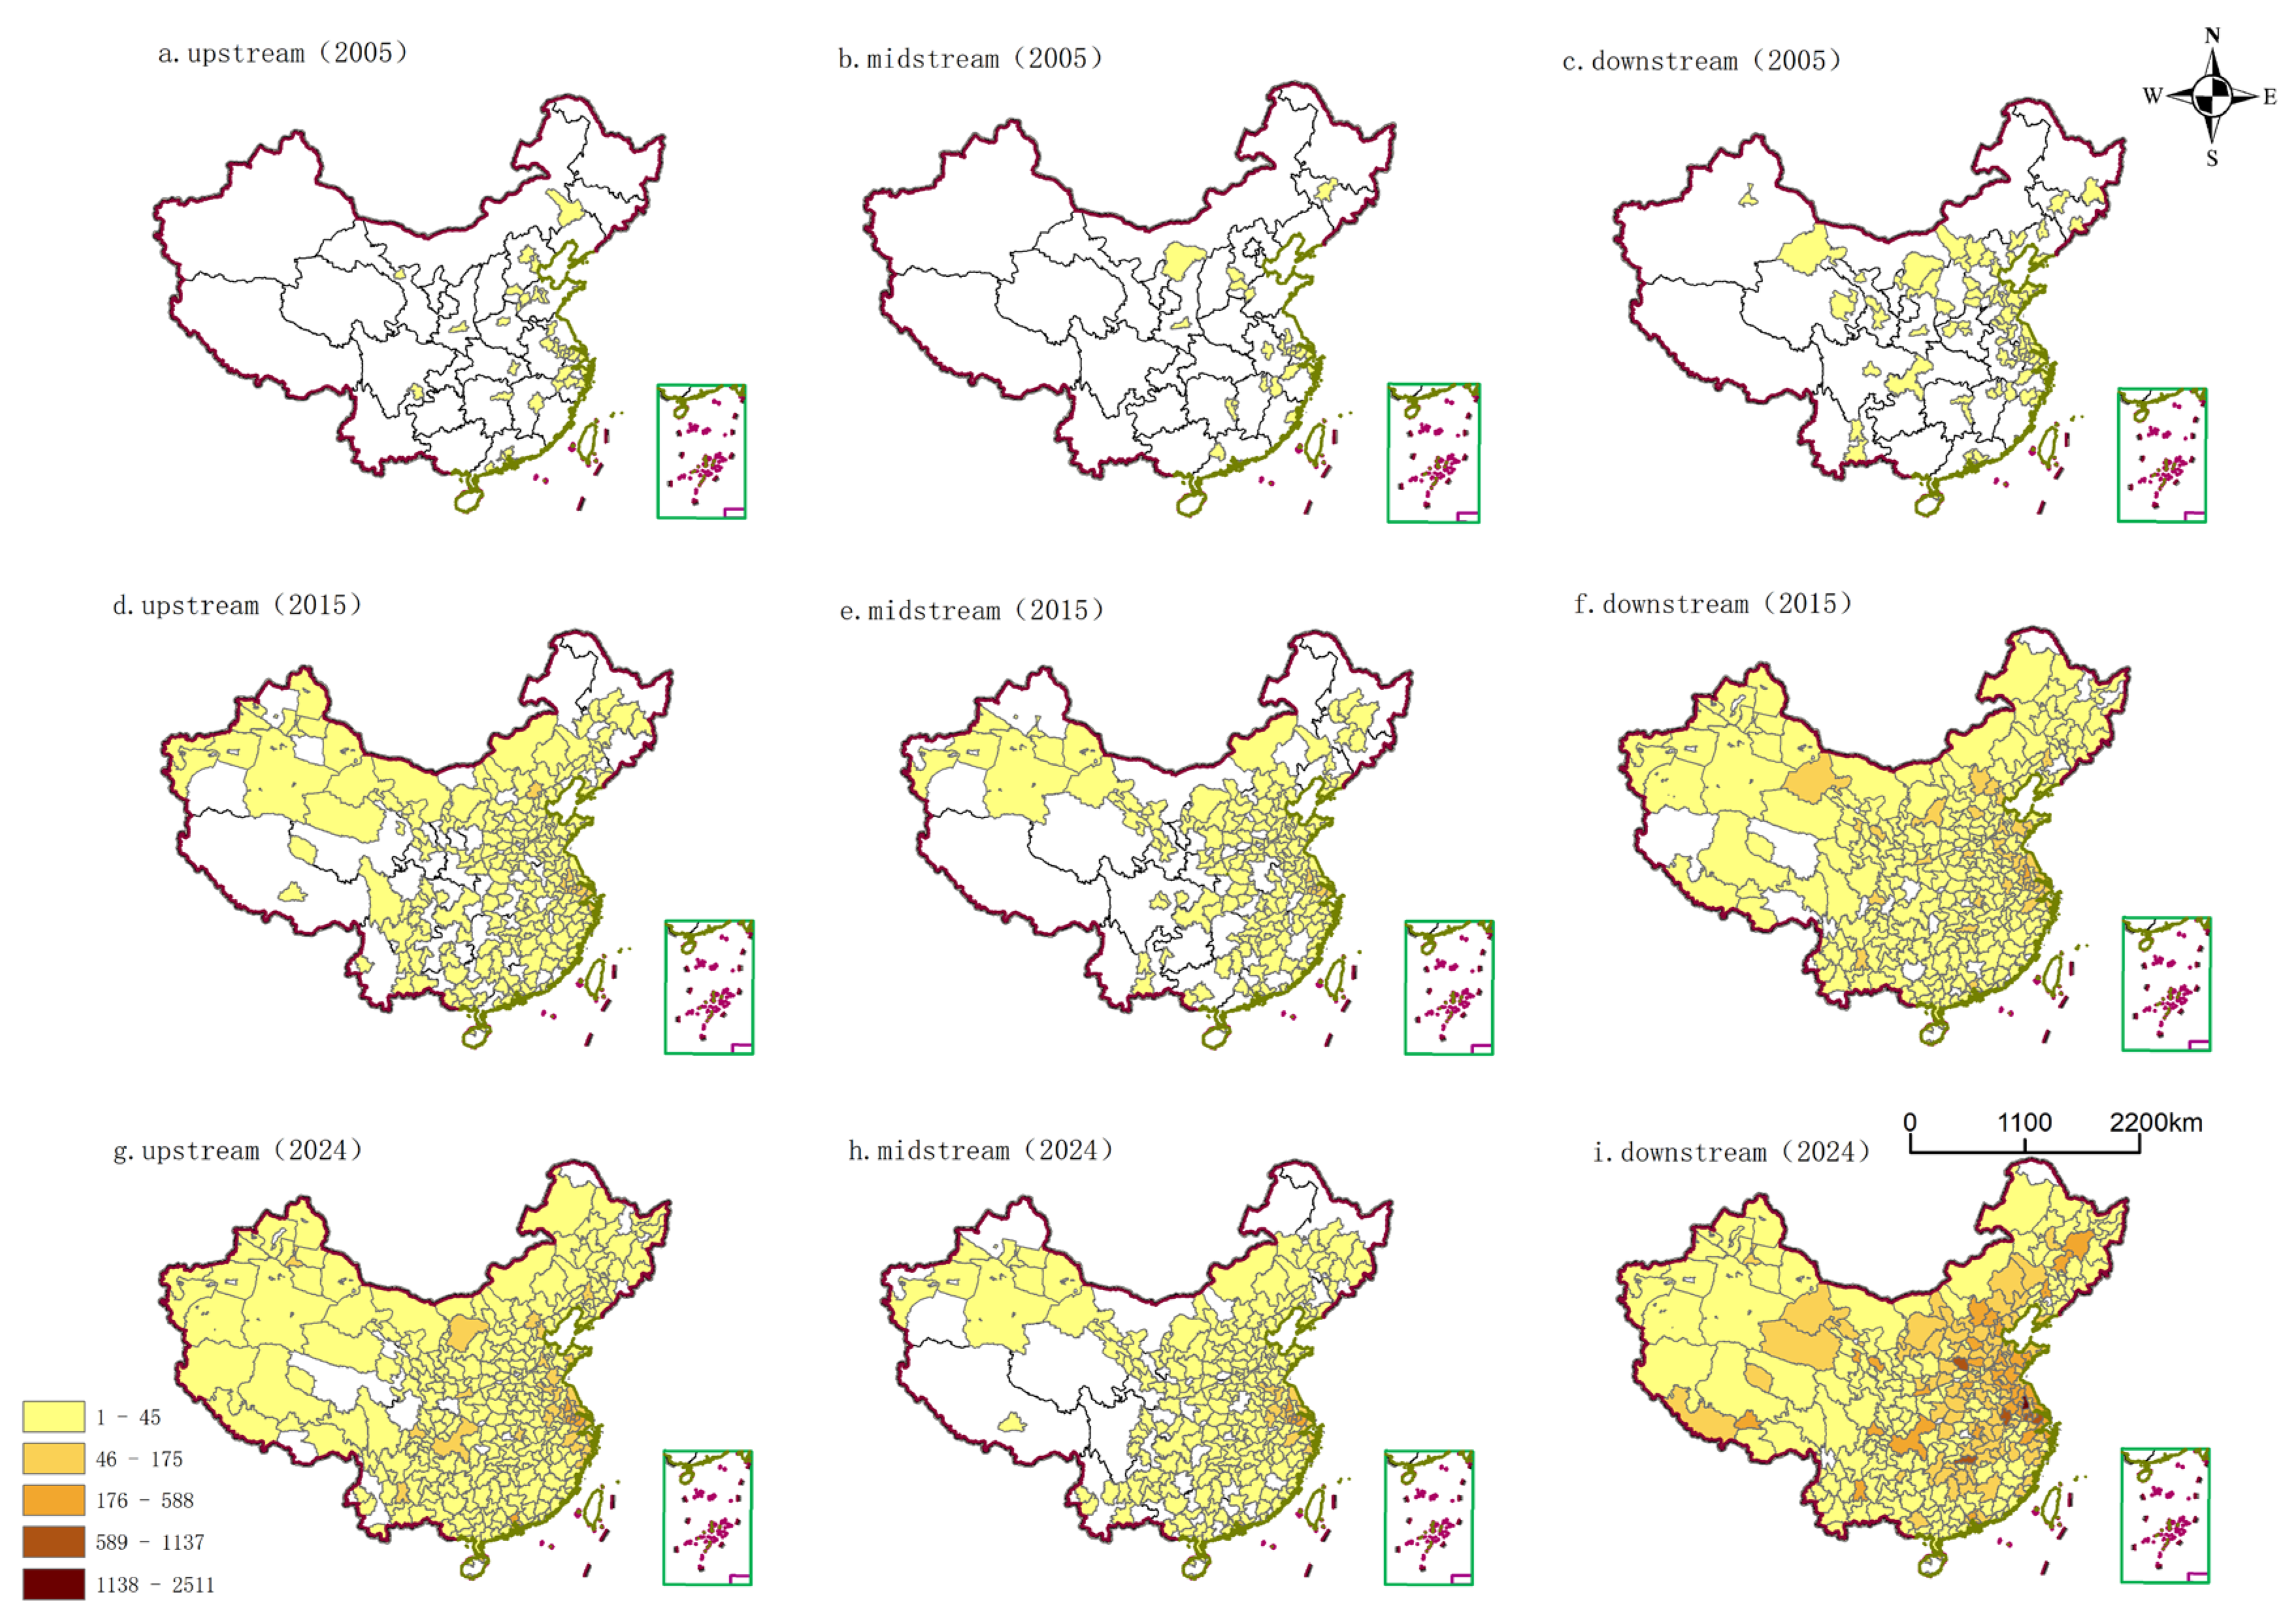
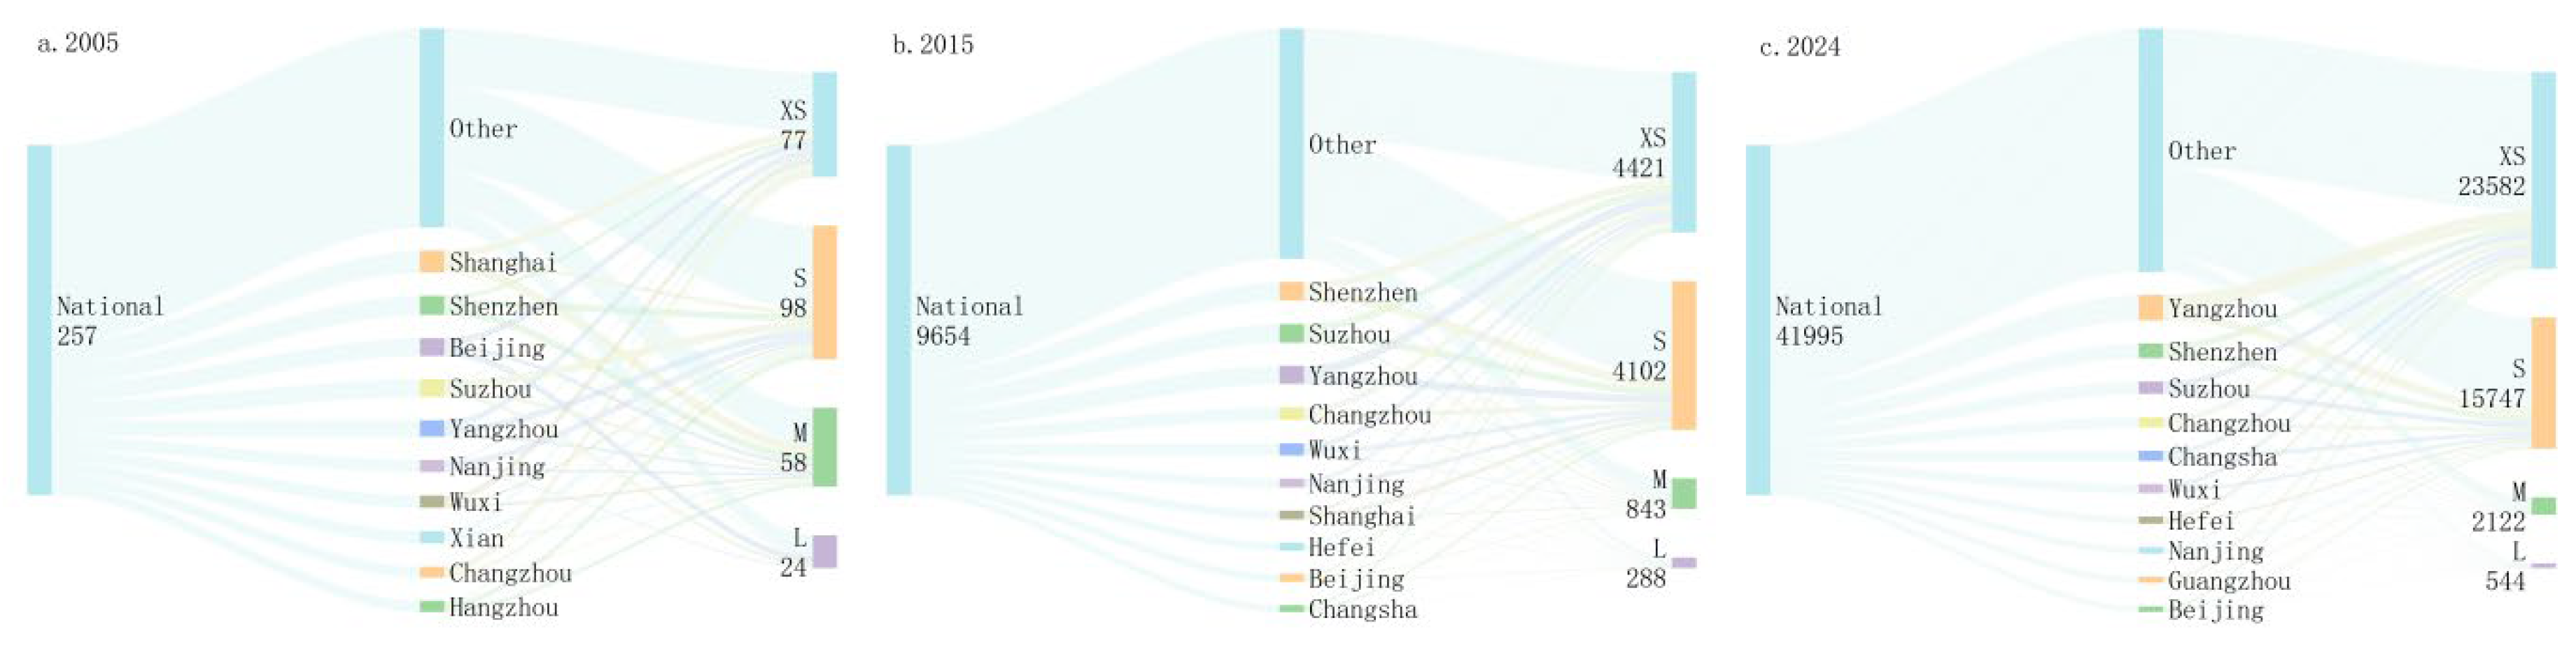
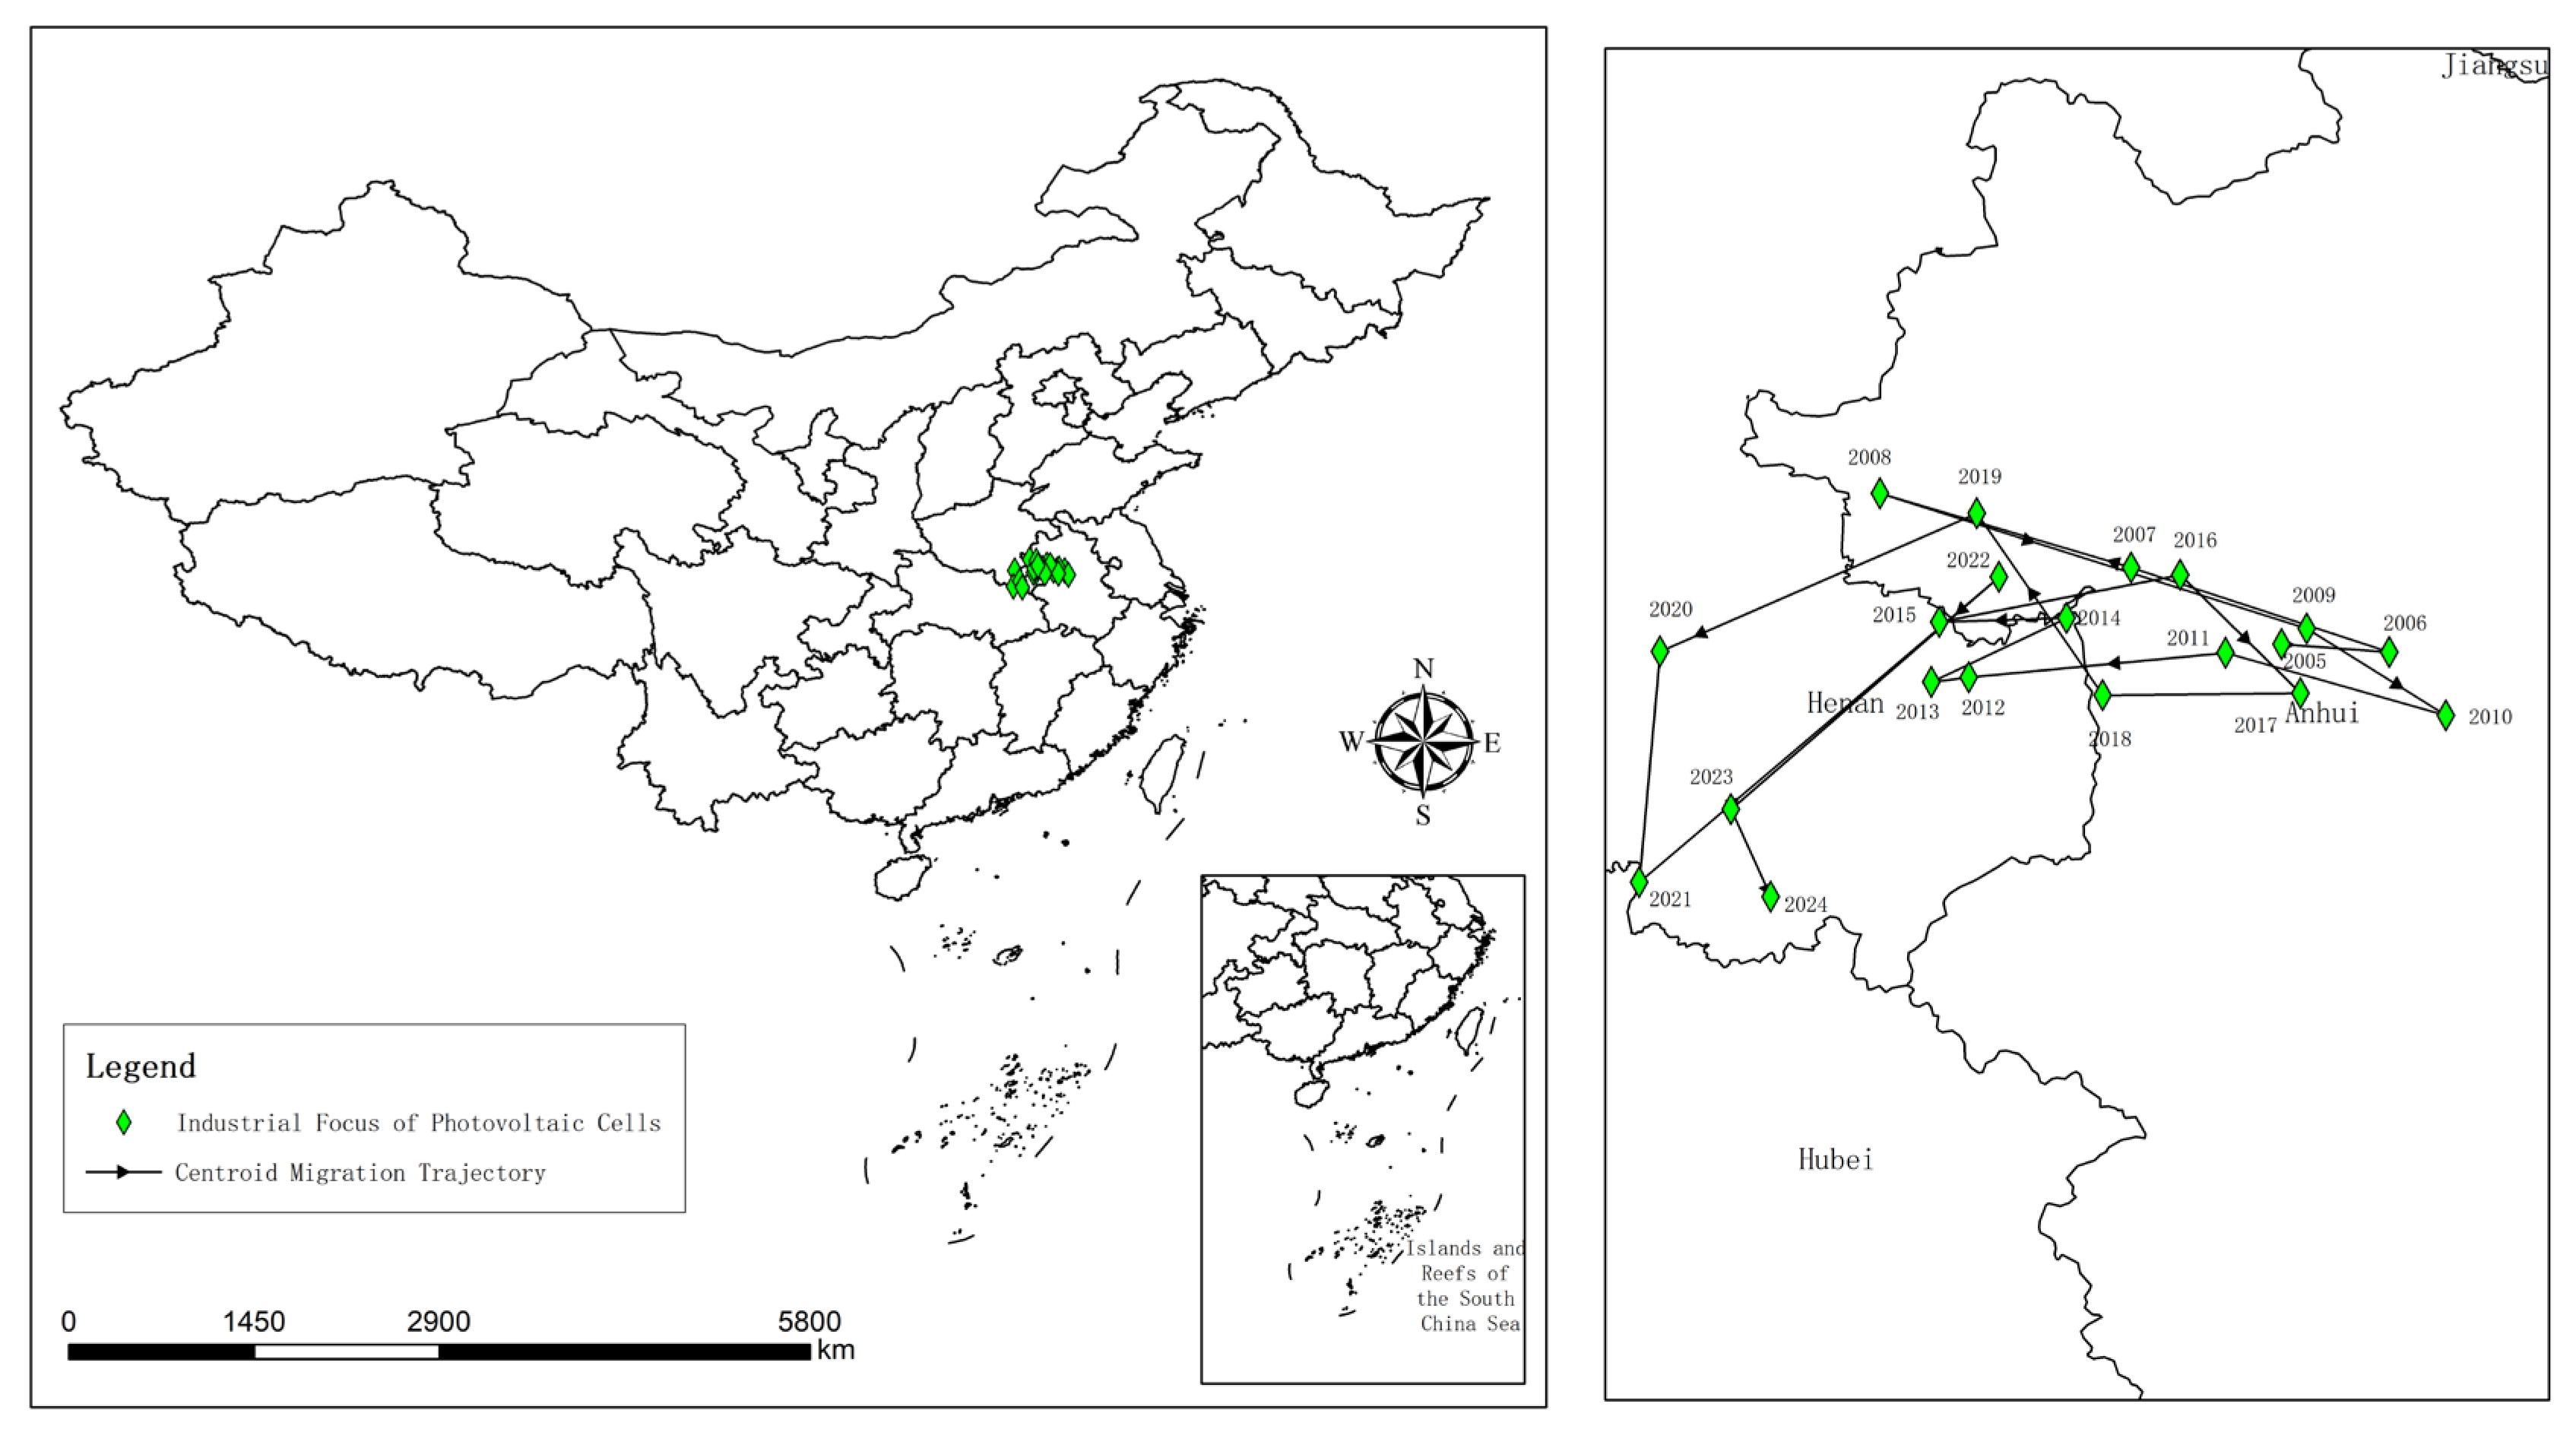
3.2. Spatial Evolution Analysis of the Photovoltaic Cell Industrial Chain
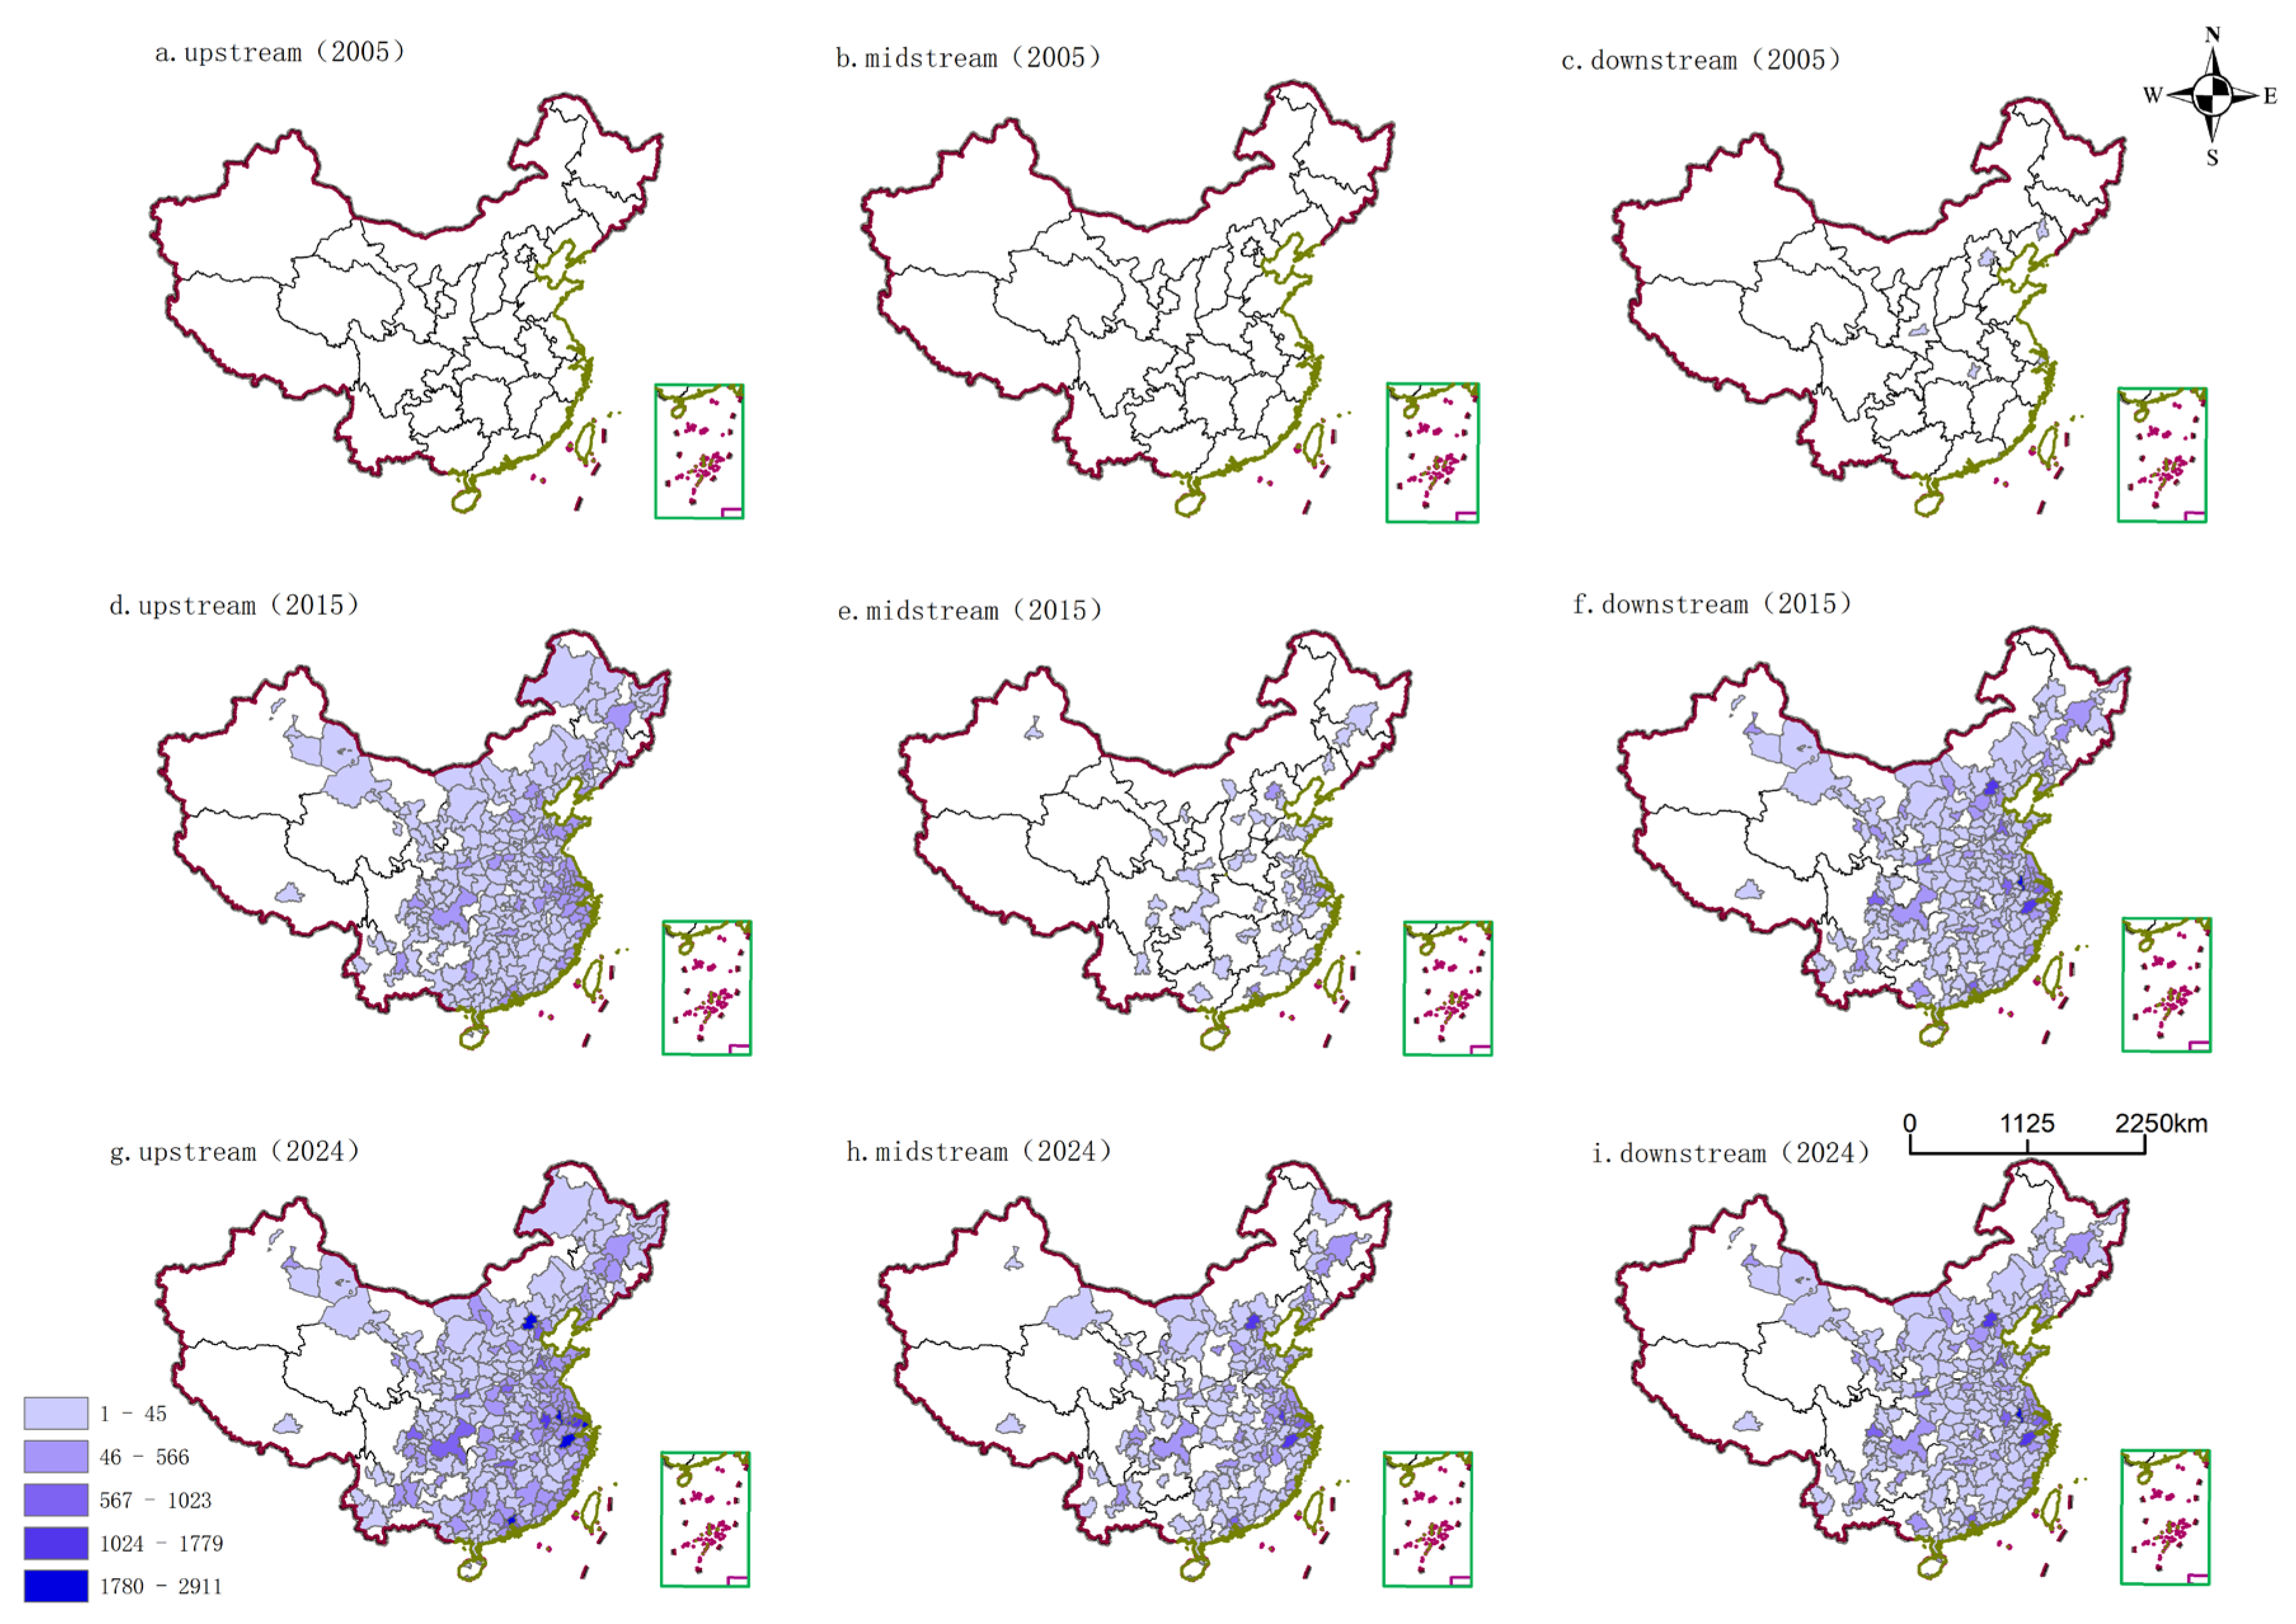
3.3. Spatiotemporal Evolution Analysis of the Photovoltaic Cell Innovation Chain
3.4. Coupling Analysis of the Photovoltaic Cell Industrial Chain and Innovation Chain
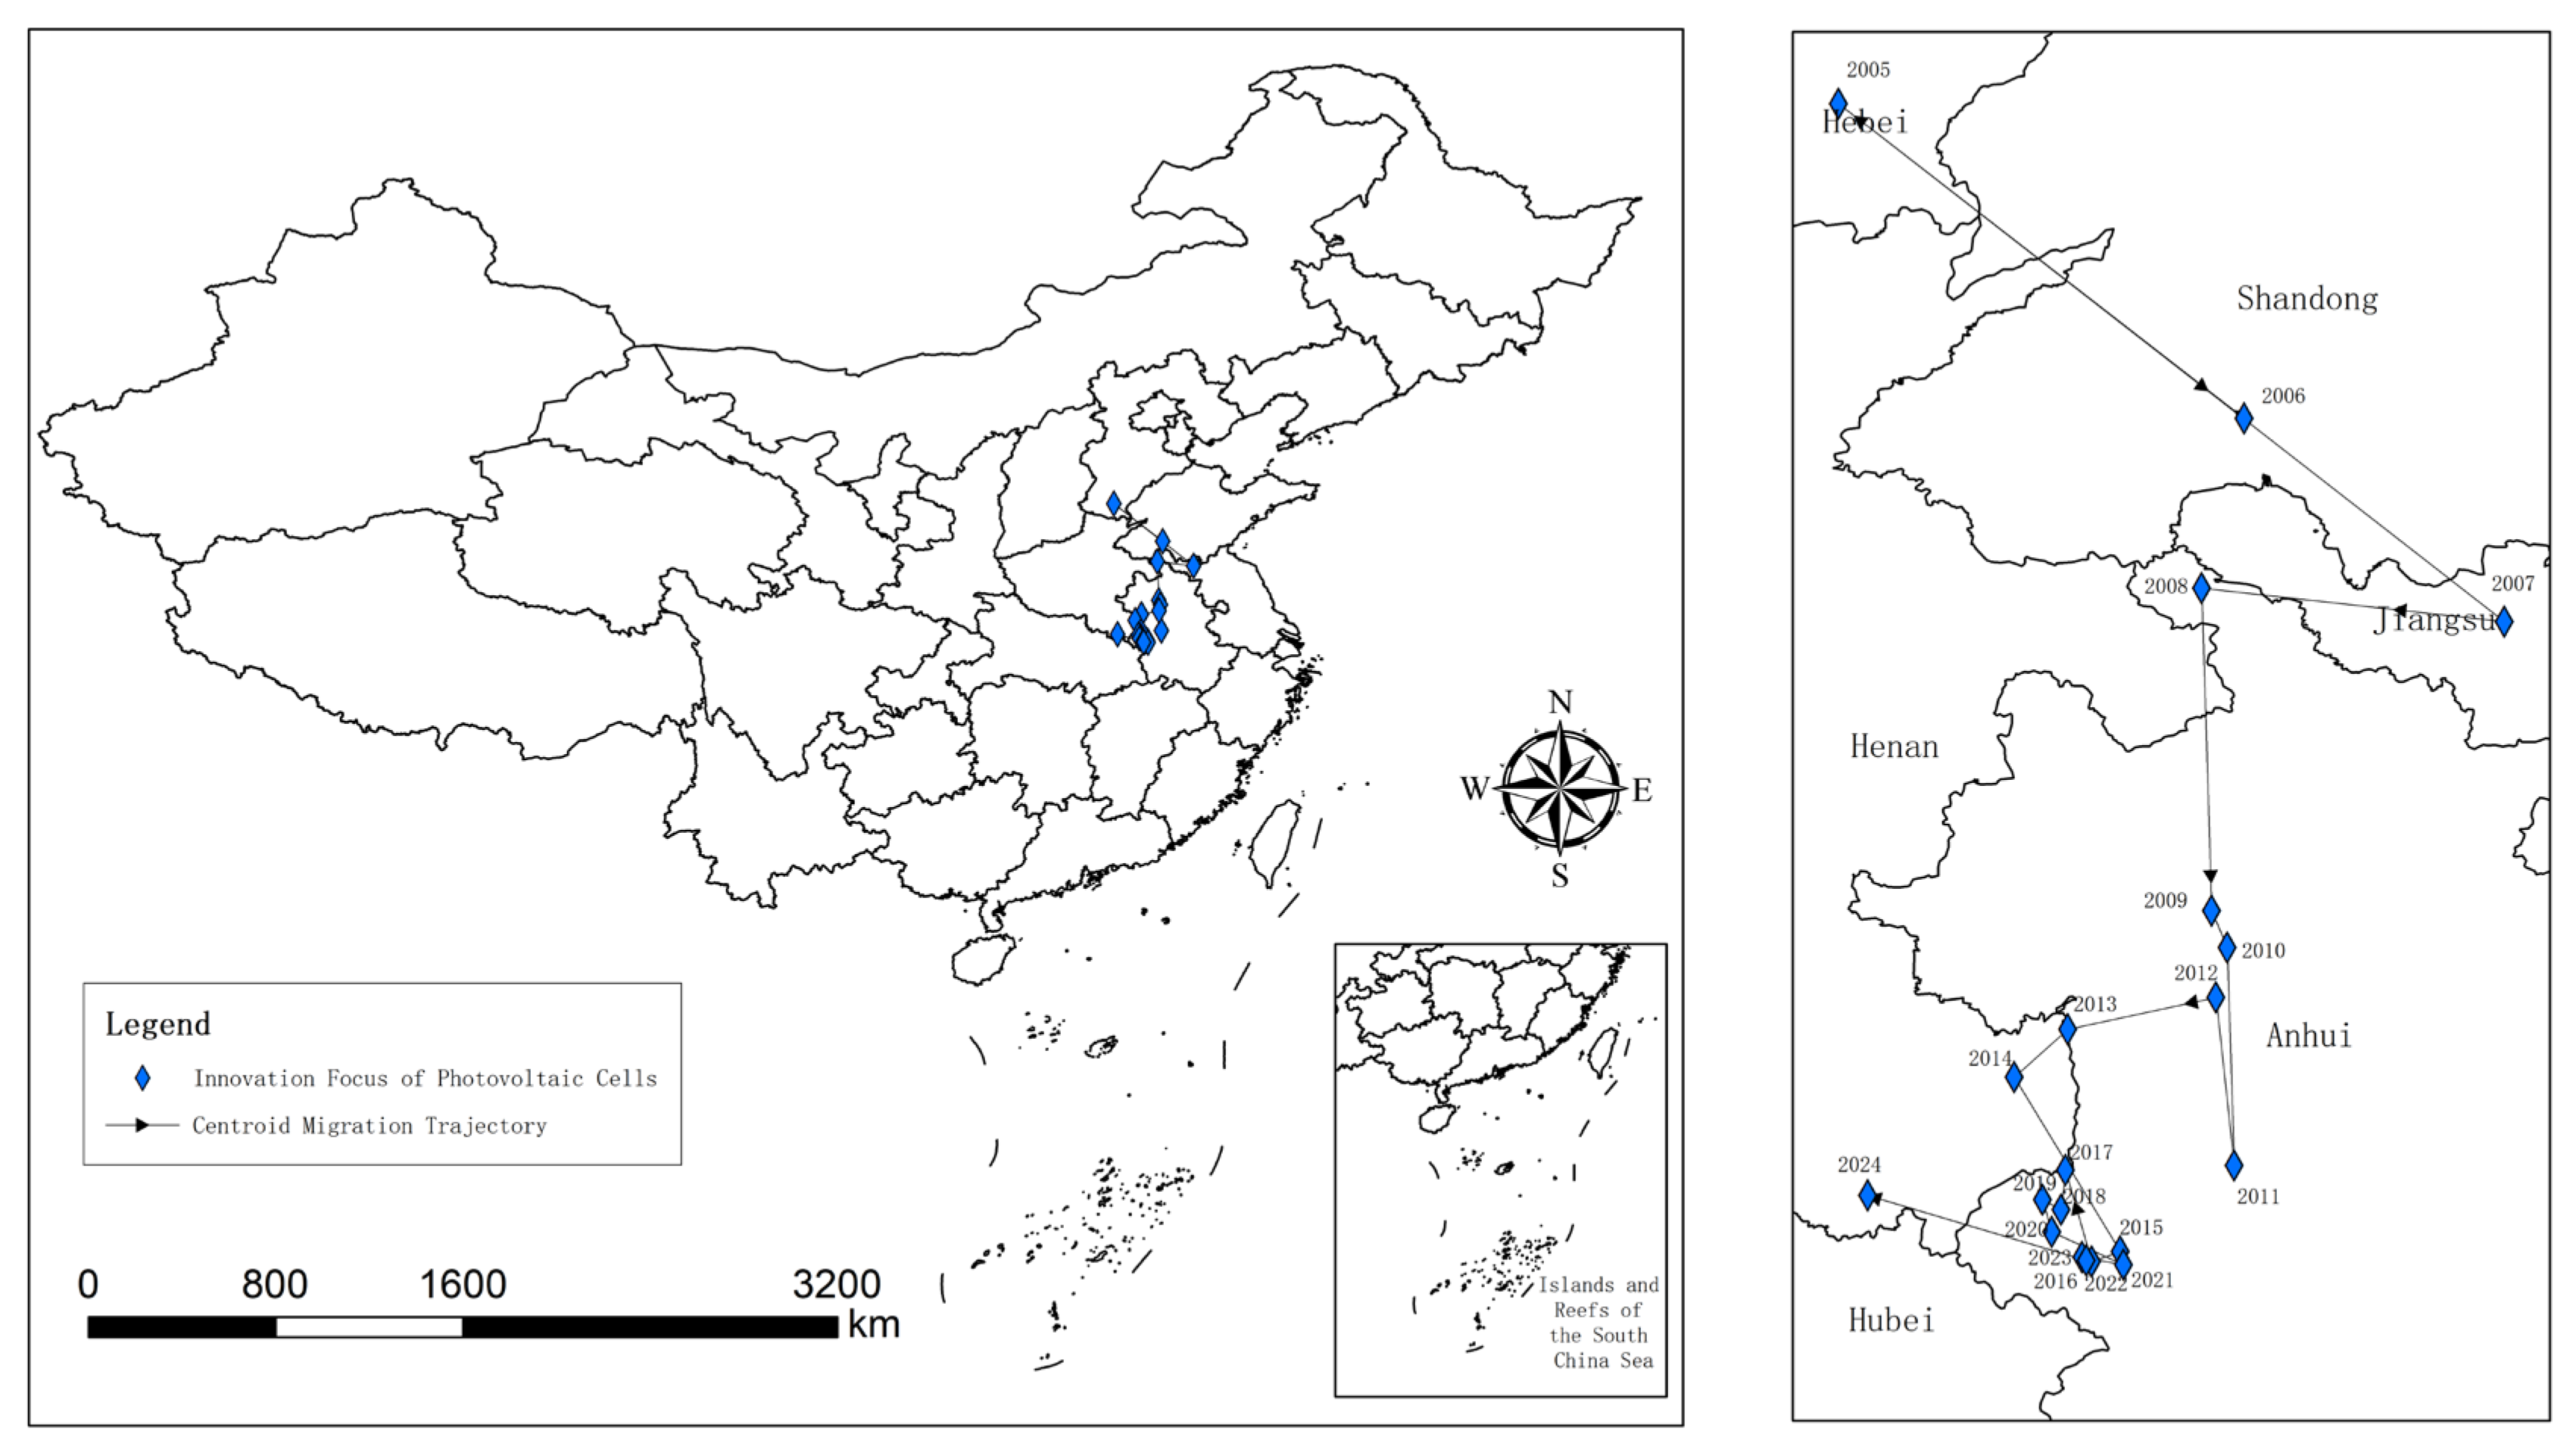
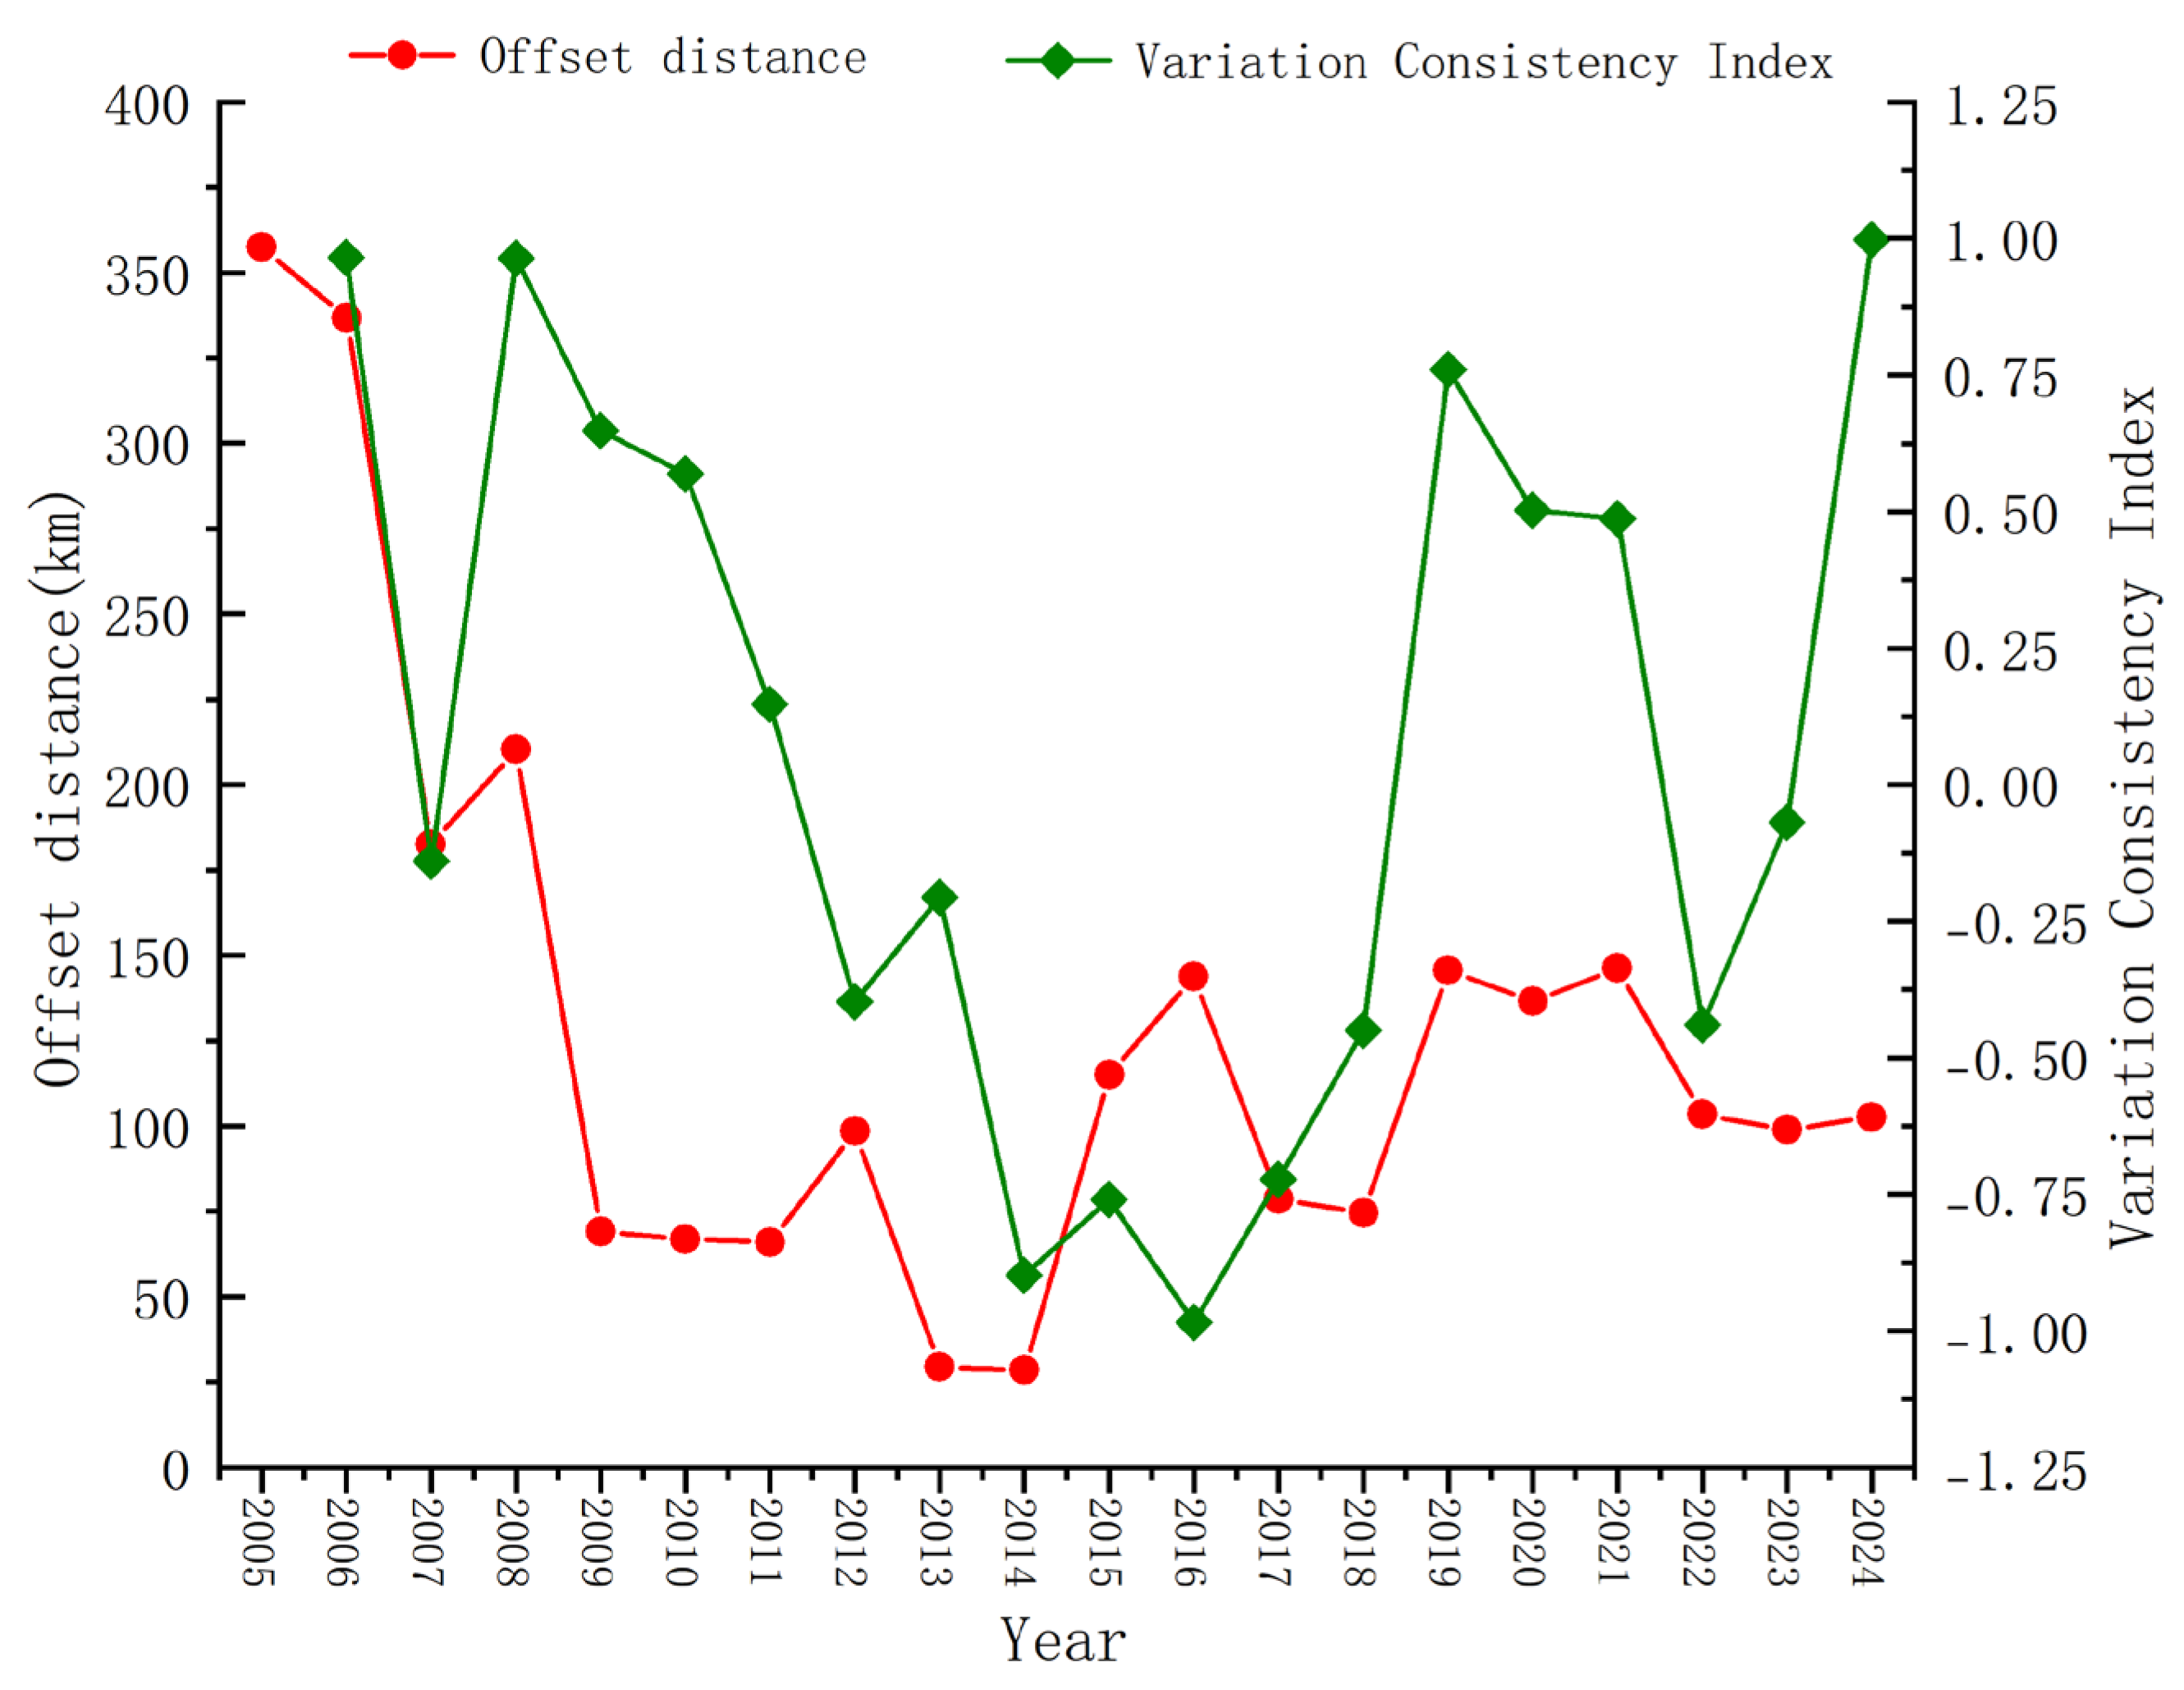
3.4.1. The Macrospatial Coupling Process Between the Industrial Centroid and the Innovation Centroid
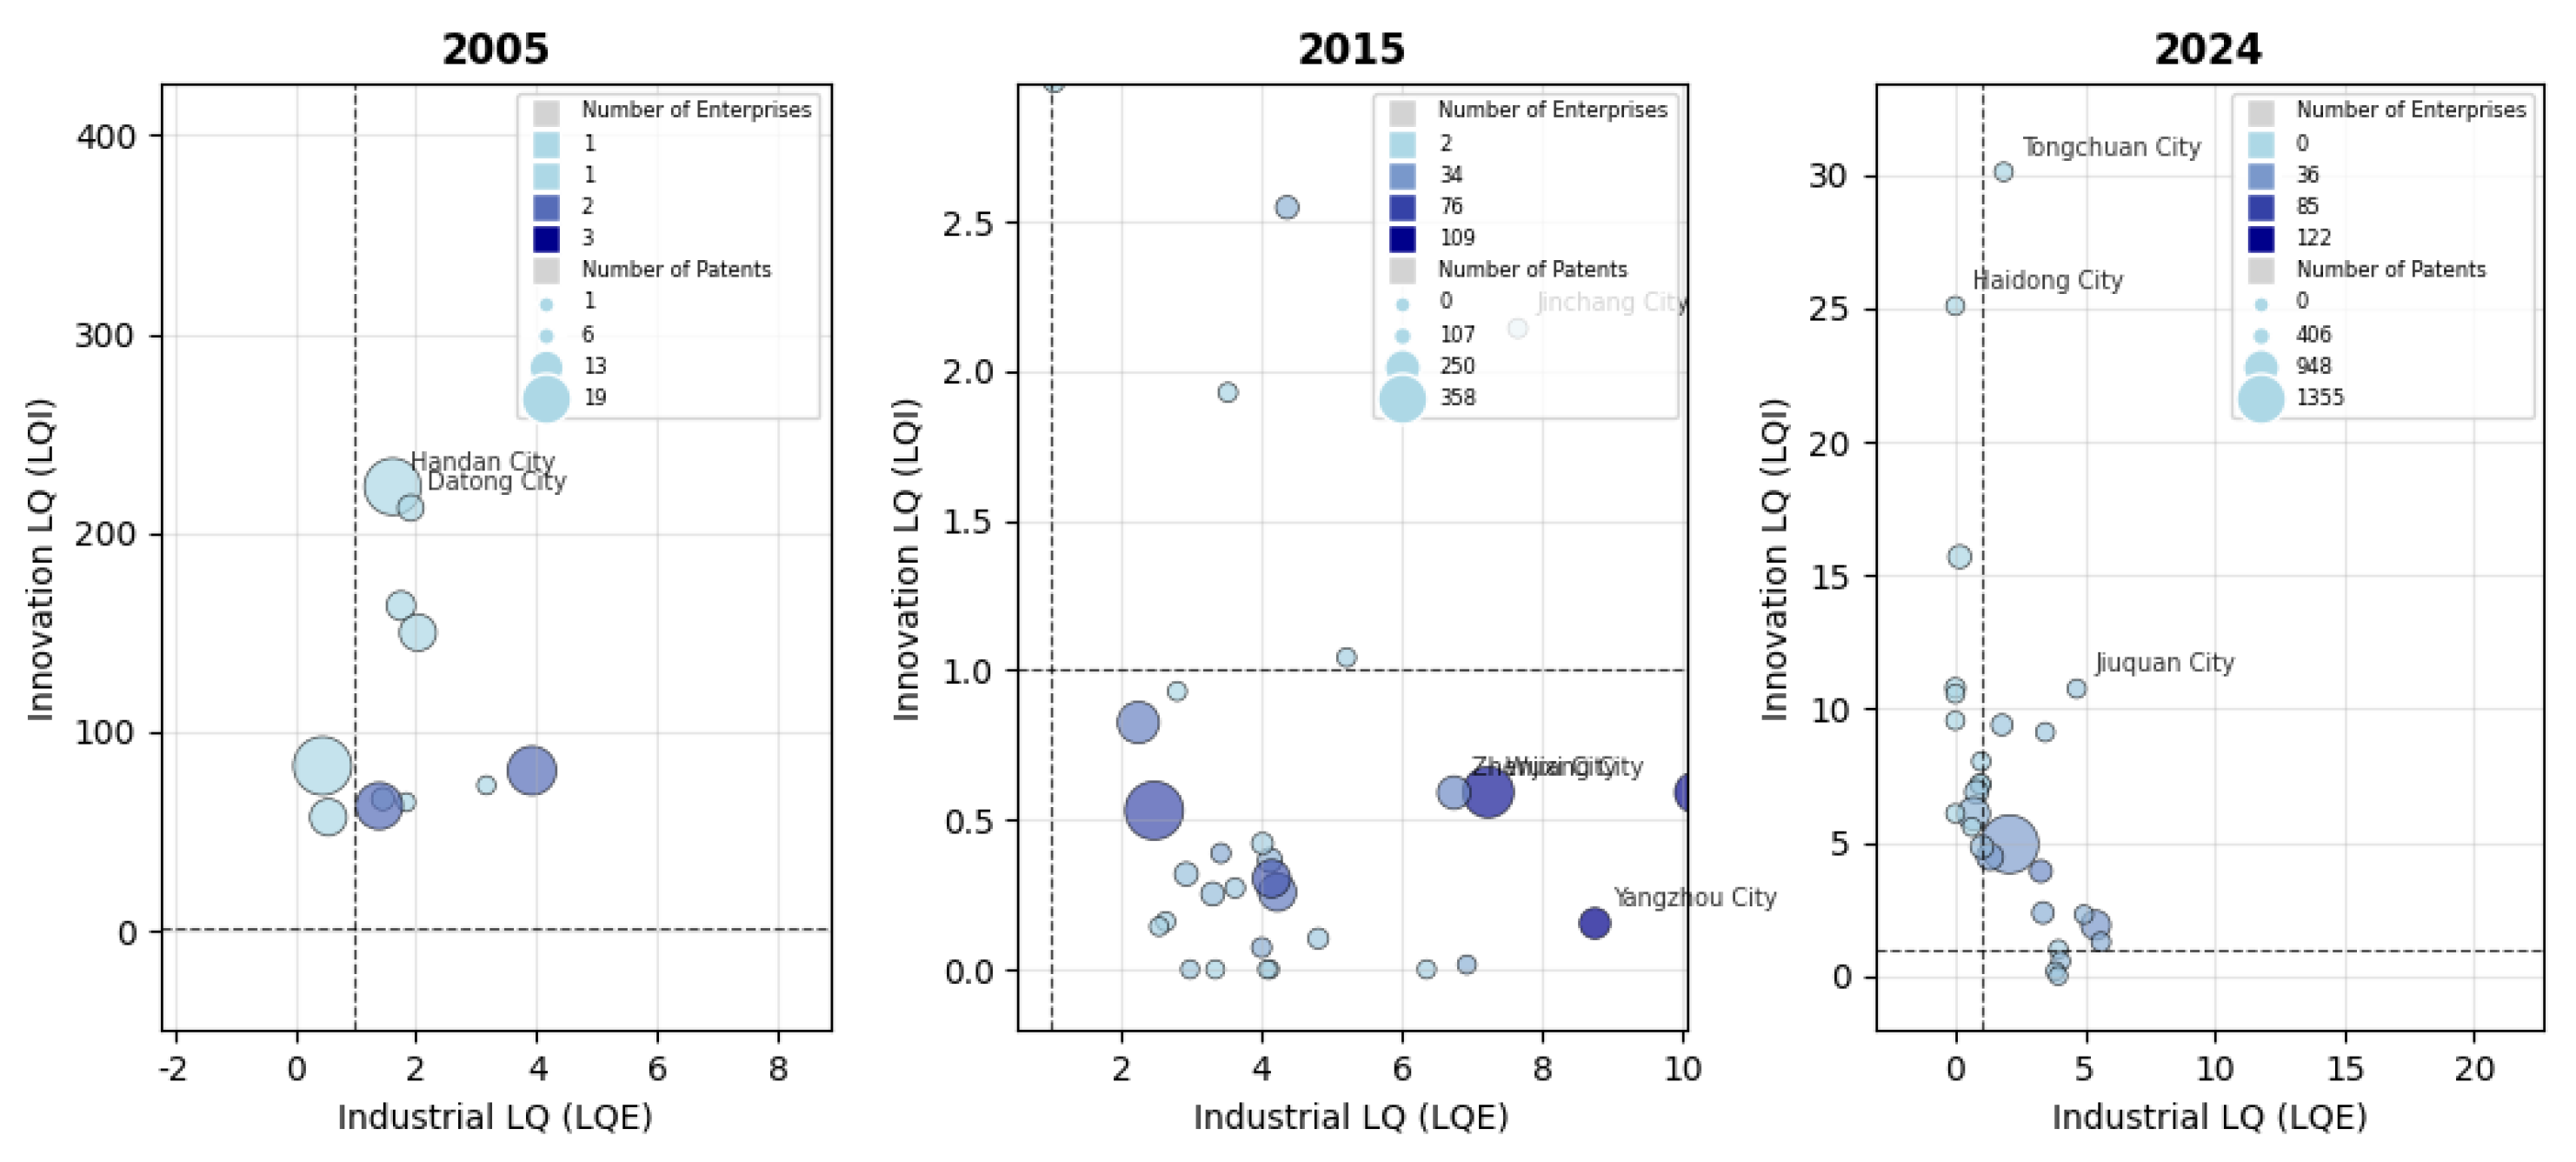
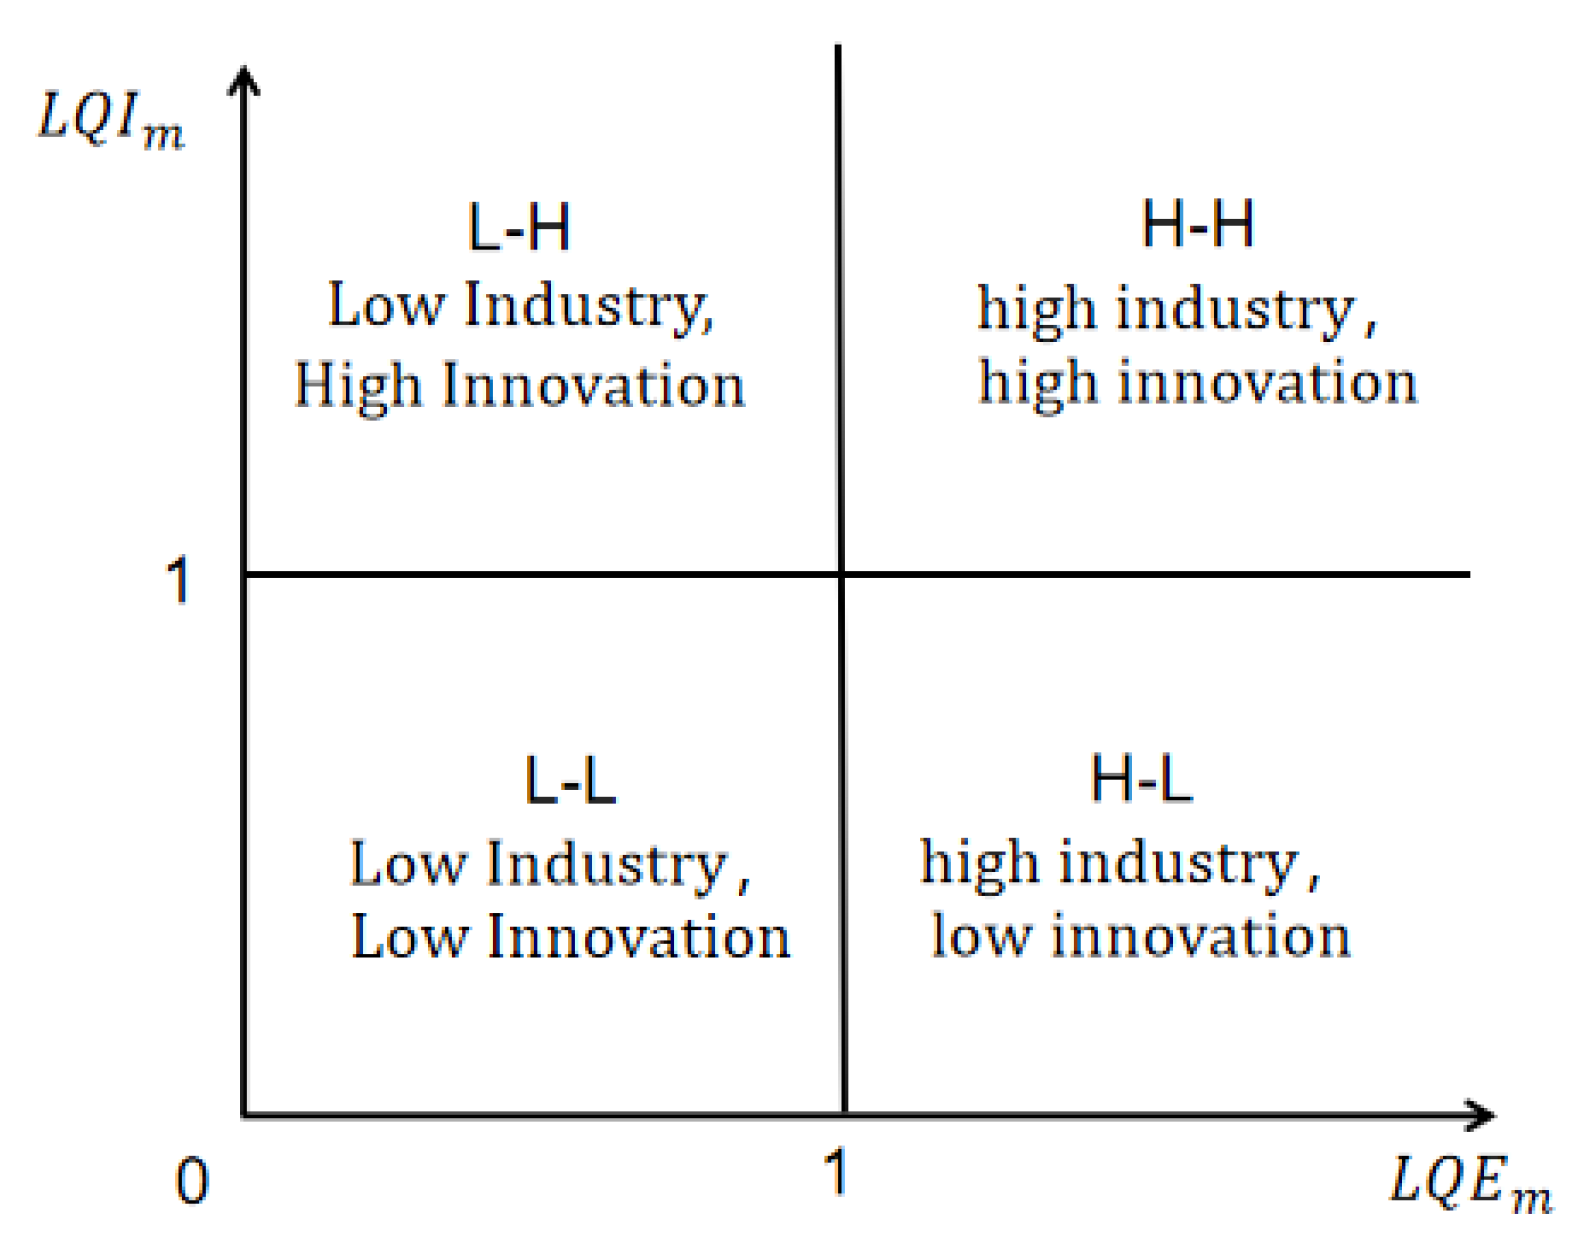
3.4.2. Location Quotient Patterns of Industrial and Innovation Activities in Major Cities
3.5. An Analysis of the Driving Mechanisms of China’s Photovoltaic Cell Innovation Development
3.5.1. Selection of Variables
- (1)
- Dependent Variable: Innovation development level, specifically measured by photovoltaic cell innovation output. This indicator is typically represented by the number of patents granted in the field of photovoltaic cell technology within a region.
- (2)
- Core Explanatory Variable: Industrial agglomeration levels, specifically represented by photovoltaic cell industrial agglomeration and its squared term. The degree of industrial agglomeration is typically used to measure the geographic concentration and specialization level of photovoltaic cell enterprises. The squared term of industrial agglomeration is incorporated into the model to test whether an inverted U-shaped relationship exists between agglomeration effects and innovation.
- (3)
- Control Variables: In accordance with the methods in the literature [35], this study considers the factors influencing the innovation development level of the photovoltaic cell from the perspectives of the related industrial base, economic foundation conditions, degree of openness to the outside world, and technological innovation environment. Based on the augmented Dickey–Fuller unit root test for stationarity and collinearity diagnostics, in addition to the expected high correlation between industrial agglomeration and its squared term due to model specification, no severe multicollinearity issues were detected among the other control variables (VIF < 8).
3.5.2. Spatial Econometric Model Specification and Testing
3.5.3. Analysis of Spatial Spillover Effects
4. Key Findings and Discussion
4.1. Key Findings
4.2. Discussion
- (1)
- Spatial configuration of the dual chains.
- (2)
- Factor synergy and the agglomeration trap.
- (3)
- Regionally differentiated policies.
Author Contributions
Funding
Institutional Review Board Statement
Informed Consent Statement
Data Availability Statement
Conflicts of Interest
References
- Zhang, P.; Li, Z.; Ghardallou, W.; Xin, Y.; Cao, J. Nexus of institutional quality and technological innovation on renewable energy development: Moderating role of green finance. Renew. Energy 2023, 214, 233–241. [Google Scholar] [CrossRef] [Scilit]
- Akhter, M.; Al Mansur, A.; Islam, I.; Lipu, M.S.H.; Karim, T.F.; Abdolrasol, M.G.M.; Alghamdi, T.A.H. Sustainable strategies for crystalline solar cell recycling: A review on recycling techniques, companies, and environmental impact analysis. Sustainability 2024, 16, 5785. [Google Scholar] [CrossRef] [Scilit]
- Zhu, S.; Xiang, N.; Xu, F. Unveiling regional disparities in China’s photovoltaic development capability through a multidimensional assessment framework. Energy Sustain. Dev. 2026, 92, 101976. [Google Scholar] [CrossRef] [Scilit]
- Kurtoğlu, M.; Eroğlu, F. Current trends and challenges in solar PV-integrated battery energy storage technology: Key components, methods, and future prospects. Appl. Energy 2026, 409, 127461. [Google Scholar] [CrossRef] [Scilit]
- Lin, M.; Wu, Y.; Qin, B.; Cao, W.; Liu, J.; Xu, Z.; Ruan, J. Response to the upcoming emerging waste: Necessity and feasibility analysis of photovoltaic waste recovery in China. Environ. Sci. Technol. 2022, 56, 17396–17409. [Google Scholar] [CrossRef] [Scilit]
- Yang, Y.; Zha, D.; Wu, Y. City-level photovoltaic deployment roadmap in China. Renew. Energy 2026, 262, 125334. [Google Scholar] [CrossRef] [Scilit]
- Teng, Y.; Lin, B. The energy-saving effect of industrial chain synergistic division: Evidence from China’s industrial chain. Energy Policy 2024, 185, 113925. [Google Scholar] [CrossRef] [Scilit]
- Zhang, R.; Ji, C.; Tan, L.; Sun, Y. Evaluation and construction of the capacities of urban innovation chains based on efficiency improvement. PLoS ONE 2022, 17, e0274092. [Google Scholar] [CrossRef] [Scilit] [PubMed]
- Xu, Y.; Hunjra, A.I.; Mishra, T.; Zhao, S. Carbon neutrality and synergy between industrial and innovation chains: Green finance perspective. Int. J. Prod. Res. 2025, 63, 8295–8319. [Google Scholar] [CrossRef] [Scilit]
- Ivanov, D. The Industry 5.0 framework: Viability-based integration of the resilience, sustainability, and human-centricity perspectives. Int. J. Prod. Res. 2023, 61, 1683–1695. [Google Scholar] [CrossRef] [Scilit]
- Ghobakhloo, M.; Mahdiraji, H.A.; Iranmanesh, M.; Jafari-Sadeghi, V. From Industry 4.0 digital manufacturing to Industry 5.0 digital society: A roadmap toward human-centric, sustainable, and resilient production. Inf. Syst. Front. 2024. Epub ahead of print. [Google Scholar] [CrossRef] [Scilit]
- Yang, Q.; Su, Q.; Qiao, J.; Zhang, Z. Realizing supply chain benefits through technological-development-oriented supply chain innovation: The mediating role of supply chain transparency and supply chain embeddedness. IEEE Trans. Eng. Manag. 2025, 72, 3215–3235. [Google Scholar] [CrossRef] [Scilit]
- Javed, A.; Basit, A.; Shahzad, M.A.; Khan, M.K. Green supply chain integration and knowledge dynamics: A pathway to incremental and radical green innovation. J. Knowl. Manag. 2026, 30, 1843–1864. [Google Scholar] [CrossRef] [Scilit]
- Vu, T.N.Q.; Nguyen, N.A.; Nguyen, K.H.; Pham, V.K. Navigating the Green Transition: Drivers, Barriers, and Policy Implications for Circular Economy Adoption Among Logistics SMEs in an Emerging Economy. Sustainability 2025, 18, 55. [Google Scholar] [CrossRef] [Scilit]
- Sun, F.; Guo, J.; Huang, X.; Shang, Z.; Jin, B. Spatio-temporal characteristics and coupling coordination relationship between industrial green water efficiency and science and technology innovation: A case study in China. Ecol. Indic. 2024, 159, 111651. [Google Scholar] [CrossRef] [Scilit]
- Mu, X.; Zou, T. Policy mechanisms and spatial dynamics of low-carbon city construction in promoting inclusive green growth in China. Front. Environ. Sci. 2025, 13, 1559528. [Google Scholar] [CrossRef] [Scilit]
- Chang, X.; Wu, Z.; Wang, J.; Zhang, X.; Zhou, M.; Yu, T.; Wang, Y. The coupling effect of carbon emission trading and tradable green certificates under electricity marketization in China. Renew. Sustain. Energy Rev. 2023, 187, 113719. [Google Scholar] [CrossRef] [Scilit]
- Marimuthu, V.; Sebi, M.J.; Sankaran, M. Development of spatial econometric models for estimating bicycle sharing trip activity. Sustain. Cities Soc. 2023, 98, 104845. [Google Scholar] [CrossRef] [Scilit]
- Chen, Y.; Zhuang, G.; Yang, Y. Be a model for neighbour provinces: Research on the spatiotemporal differences and influencing factors of energy intensity in China. Energy 2025, 320, 134601. [Google Scholar] [CrossRef] [Scilit]
- Zhang, C.; Lv, W.; Zhang, P.; Song, J. Multidimensional spatial autocorrelation analysis and it’s application based on improved Moran’s I. Earth Sci. Inform. 2023, 16, 3355–3368. [Google Scholar] [CrossRef] [Scilit]
- Salgueiro, G.P.; Perobelli, F.S.; Domingues, E.P.; Valério, V.E.d.M. Spatial and socioeconomic factors of distributed photovoltaic generation in Minas Gerais. Energy Econ. 2026, 154, 109121. [Google Scholar] [CrossRef] [Scilit]
- Radmehr, R.; Shayanmehr, S.; Baba, E.A.; Samour, A.; Adebayo, T.S. Spatial spillover effects of green technology innovation and renewable energy on ecological sustainability: New evidence and analysis. Sustain. Dev. 2024, 32, 1743–1761. [Google Scholar] [CrossRef] [Scilit]
- Li, D.; Heimeriks, G.; Alkemade, F. Knowledge flows in global renewable energy innovation systems: The role of technological and geographical distance. Technol. Anal. Strateg. Manag. 2022, 34, 418–432. [Google Scholar] [CrossRef] [Scilit]
- Hou, C.; Ma, Y. An empirical analysis of spatial effects and their driving factors in urban green development using spatial econometric models. Front. Environ. Sci. 2025, 13, 124501. [Google Scholar] [CrossRef] [Scilit]
- Zhang, X.; Zhu, S.; Qiu, X.; Huang, B.; Geng, Y.; Shao, S.; Ge, Y. Spatial distribution characteristics and driving factors of volatile organic compounds emissions changes in China: A sectoral and gravity movement analysis. Environ. Dev. Sustain. 2026. Epub ahead of print. [Google Scholar] [CrossRef] [Scilit]
- Grether, J.-M.; Mathys, N.A. Is the World’s Economic Centre of Gravity Already in Asia? Area 2010, 42, 47–50. [Google Scholar] [CrossRef] [Scilit]
- Powers, S.L.; Pitas, N.A.; Rice, W.L. Applying location quotient methodology to urban park settings with mobile location data: Implications for equity and park planning. Urban For. Urban Green. 2024, 98, 128418. [Google Scholar] [CrossRef] [Scilit]
- Haggett, P. Locational Analysis in Human Geography; Edward Arnold: London, UK, 1962. [Google Scholar]
- Jiang, X.; Liu, Q. Spatial agglomeration identification and agglomeration zoning of semiconductor industry in China. Econ. Geogr. 2024, 44, 108–117. [Google Scholar]
- Yan, M.; Yan, M.; Zhao, J. Manufacturing agglomeration and high-quality economic development: Unveiling nonlinear dynamics and spatial spillovers in China. Appl. Geogr. 2026, 186, 103833. [Google Scholar] [CrossRef] [Scilit]
- LeSage, J.P.; Pace, R.K. Introduction to Spatial Econometrics; CRC Press Taylor & Francis Group: Boca Raton, FL, USA, 2009. [Google Scholar]
- Quah, D.T. Regional convergence clusters across Europe. Eur. Econ. Rev. 1996, 40, 951–958. [Google Scholar] [CrossRef] [Scilit]
- GB/T 2260-2007; Codes for Administrative Divisions of the People’s Republic of China. China Standards Press: Beijing, China, 2007.
- Zhang, L.; Wang, J.; Wen, H.; Fu, Z.; Li, X. Operating performance, industry agglomeration and its spatial characteristics of Chinese photovoltaic industry. Renew. Sustain. Energy Rev. 2016, 65, 373–386. [Google Scholar] [CrossRef] [Scilit]
- Feng, Z.; Li, Y.; Tang, S.; Hao, P.; Jun, N.; Liu, G.; Shi, L. Spatiotemporal evolution and driving factors of carbon emissions in China’s photovoltaic industry. ACS Omega 2026, 11, 4521–4535. [Google Scholar] [CrossRef] [Scilit] [PubMed]
- Zhu, C.; Lee, C.C. Big city, big innovation? Evidence from city-county consolidation in China. Cities 2026, 172, 106825. [Google Scholar] [CrossRef] [Scilit]






| Nature | Variable Type | Variable Name | Symbol | Min | Max | Transformation |
|---|---|---|---|---|---|---|
| Dependent Variable | Innovation Development Level | Photovoltaic Cell Innovation Output (count) | 0 | 973 | ln (y + 1) | |
| Core Explanatory Variable | Industrial Agglomeration Level | Photovoltaic Cell Industrial Agglomeration | 0 | 9.94 | ln (x1 + 1) | |
| Square of Photovoltaic Cell Industrial Agglomeration | 0 | 98.82 | ln (x2 + 1) | |||
| Control Variable | Related Industrial Base | Number of Photovoltaic Cell Enterprises | 0 | 554 | ln (x3 + 1) | |
| Economic Foundation Conditions | Number of Manufacturing Employees (in 10,000 persons) | 0.01 | 259 | ln (x4) | ||
| Total Fixed Asset Investment (10,000 yuan) | 2770 | 1.72 × 10⁸ | ln (x5) | |||
| Proportion of Secondary Industry Value Added in GDP (%) | 5.25 | 91.614 | ln (x6) | |||
| Degree of Openness | Total Value of Imports and Exports of Goods (10,000 yuan) | 34 | 4.21 × 10⁸ | ln (x7) | ||
| Actual Utilized Foreign Capital (10,000 USD) | 0 | 3.08 × 10⁶ | ln (x8 + 1) | |||
| Technological Innovation Environment | Proportion of Science and Education Expenditure (%) | 2.08 | 85.3 | ln (x9) | ||
| Internal R&D Expenditure (10,000 yuan) | 5 | 2.23 × 10⁷ | ln (x10) | |||
| Number of Higher Education Institutions (number) | 1 | 93 | ln (x11) |
| Year | I | E (I) | Sd (I) | Z | p-Value |
|---|---|---|---|---|---|
| 2015 | 0.392 | −0.004 | 0.040 | 9.839 | 0.000 |
| 2016 | 0.404 | −0.004 | 0.040 | 10.124 | 0.000 |
| 2017 | 0.142 | −0.004 | 0.040 | 3.626 | 0.000 |
| 2018 | 0.208 | −0.004 | 0.040 | 5.262 | 0.000 |
| 2019 | 0.169 | −0.004 | 0.040 | 4.294 | 0.000 |
| 2020 | 0.175 | −0.004 | 0.040 | 4.440 | 0.000 |
| 2021 | 0.226 | −0.004 | 0.040 | 5.705 | 0.000 |
| 2022 | 0.202 | −0.004 | 0.040 | 5.116 | 0.000 |
| 2023 | 0.247 | −0.004 | 0.040 | 6.244 | 0.000 |
| Test Statistic | Statistic Value | p-Value | Test Statistic | Statistic Value | p-Value |
|---|---|---|---|---|---|
| LM–Error | 22,000.000 *** | 0.000 | LR-test (time nested) | 2004.58 *** | 0.000 |
| LM–Lag | 19,000.000 *** | 0.000 | LR Lag | 40.90 *** | 0.000 |
| Robust LM–Error | 3221.884 *** | 0.000 | LR Error | 40.52 *** | 0.000 |
| Robust LM–Lag | 266.464 *** | 0.000 | Wald Lag | 27.10 *** | 0.004 |
| Hausman | 198.67 *** | 0.000 | Wald Error | 24.17 *** | 0.012 |
| LR-test (individual nested) | 20.28 *** | 0.009 |
| Variable | Coefficient (β) | Std. Err. | p-Value | Wx (θ) | Std. Err. | p-Value |
|---|---|---|---|---|---|---|
| 0.206 | 0.196 | 0.293 | 1.343 ** | 0.557 | 0.016 | |
| −0.044 | 0.077 | 0.568 | −0.623 ** | 0.270 | 0.021 | |
| −0.061 | 0.050 | 0.222 | −0.287 *** | 0.079 | 0.000 | |
| −0.037 | 0.074 | 0.617 | 0.812 *** | 0.229 | 0.000 | |
| −0.046 | 0.135 | 0.733 | −0.110 | 0.563 | 0.845 | |
| 0.120 | 0.116 | 0.301 | 0.056 | 0.329 | 0.865 | |
| −0.003 | 0.005 | 0.548 | 0.039 ** | 0.018 | 0.030 | |
| −0.007 | 0.013 | 0.590 | −0.192 *** | 0.052 | 0.000 | |
| 1.742 ** | 0.791 | 0.028 | −0.826 | 2.360 | 0.726 | |
| −0.004 | 0.015 | 0.788 | −0.142 ** | 0.069 | 0.040 | |
| 0.083 | 0.079 | 0.293 | −0.394 | 0.260 | 0.130 | |
| Spatial () | 0.737 *** | 0.023 | 0.000 | |||
| N | 2565 | |||||
| R2 | 0.379 | |||||
| Economic Distance Matrix | Sequence Contiguity Matrix | Inverse Square Sequence-Distance Matrix | Sequence-Based 5-Nearest Neighbor Matrix | |||||
|---|---|---|---|---|---|---|---|---|
| Direct Effect | Indirect Effect | Direct Effect | Indirect Effect | Direct Effect | Indirect Effect | Direct Effect | Indirect Effect | |
| 0.339 | 5.729 *** | 0.694 *** | 2.160 *** | 0.401 * | 3.302 *** | 0.574 *** | 2.136 *** | |
| −0.104 | −2.541 ** | −0.208 ** | −0.717 *** | −0.123 | −1.150 *** | −0.165 * | −0.659 ** | |
| −0.086 * | −1.230 *** | −0.192 *** | −0.563 *** | −0.093 * | −0.809 *** | −0.150 *** | −0.662 *** | |
| 0.025 | 2.853 *** | 0.488 *** | 0.940 *** | 0.237 *** | 1.413 *** | 0.328 *** | 1.176 *** | |
| −0.057 | −0.563 | −0.150 | −0.132 | −0.025 | −0.166 | −0.164 | −0.011 | |
| 0.142 | 0.678 | 0.308 ** | 1.234 *** | 0.013 | 1.901 *** | 0.058 | 1.627 *** | |
| −0.001 | 0.133 * | −0.008 | 0.005 | −0.008 | 0.006 | −0.006 | −0.007 | |
| −0.024 * | −0.751 *** | −0.015 | −0.081 *** | −0.012 | −0.160 *** | −0.015 | −0.101 ** | |
| 1.856 ** | 1.816 | 4.183 *** | 0.504 | 4.212 *** | 1.159 | 4.097 *** | 1.402 | |
| −0.016 | −0.551 ** | −0.024 | −0.026 | −0.021 | −0.052 | −0.021 | −0.064 | |
| 0.054 | −1.185 | −0.061 | −0.496 *** | 0.050 | −0.787 ** | 0.002 | −0.925 *** | |
| N | 2565 | 2565 | 2565 | 2565 | ||||
| R2 | 0.379 | 0.240 | 0.302 | 0.272 | ||||
| East | Central | West | |
|---|---|---|---|
| 1.358 *** | 0.771 *** | 0.939 *** | |
| −0.624 *** | −0.707 *** | −0.221 | |
| −0.632 *** | −0.179 ** | −0.601 *** | |
| 1.568 *** | 0.570 *** | −0.019 | |
| −0.143 | −4.280 *** | 0.019 | |
| 0.239 ** | 0.236 *** | 0.221 *** | |
| −0.006 | 0.029 | −0.039 | |
| −0.018 | −0.195 ** | 0.126 *** | |
| 0.250 *** | 0.214 *** | 0.135 ** | |
| 0.014 | 0.017 | −0.101 | |
| −0.077 | −0.076 | 0.043 | |
| _cons | −0.555 *** | 2.066 *** | 26.054 *** |
| N | 900 | 900 | 765 |
| R-sq | 0.280 | 0.192 | 0.207 |
| F | 27.830 | 17.098 | 14.500 |
Disclaimer/Publisher’s Note: The statements, opinions and data contained in all publications are solely those of the individual author(s) and contributor(s) and not of MDPI and/or the editor(s). MDPI and/or the editor(s) disclaim responsibility for any injury to people or property resulting from any ideas, methods, instructions or products referred to in the content. |
© 2026 by the authors. Licensee MDPI, Basel, Switzerland. This article is an open access article distributed under the terms and conditions of the Creative Commons Attribution (CC BY) license.
Share and Cite
Liang, Y.; Liu, M.; Diao, Q.; Wang, X. The Co-Evolution and Spatial Spillover Effects of the Relationship Between the Industry Chain and Innovation Chain of China’s Photovoltaic Cell: From the Patent Intelligence Perspective. Systems 2026, 14, 605. https://doi.org/10.3390/systems14060605
Liang Y, Liu M, Diao Q, Wang X. The Co-Evolution and Spatial Spillover Effects of the Relationship Between the Industry Chain and Innovation Chain of China’s Photovoltaic Cell: From the Patent Intelligence Perspective. Systems. 2026; 14(6):605. https://doi.org/10.3390/systems14060605
Chicago/Turabian StyleLiang, Yi, Mengting Liu, Qingzhe Diao, and Xiaoduo Wang. 2026. "The Co-Evolution and Spatial Spillover Effects of the Relationship Between the Industry Chain and Innovation Chain of China’s Photovoltaic Cell: From the Patent Intelligence Perspective" Systems 14, no. 6: 605. https://doi.org/10.3390/systems14060605
APA StyleLiang, Y., Liu, M., Diao, Q., & Wang, X. (2026). The Co-Evolution and Spatial Spillover Effects of the Relationship Between the Industry Chain and Innovation Chain of China’s Photovoltaic Cell: From the Patent Intelligence Perspective. Systems, 14(6), 605. https://doi.org/10.3390/systems14060605