


Abstract
As manufacturing organisations work to align their operations with global sustainability expectations, the integration of the United Nations (UN) Sustainable Development Goals (SDGs) into production systems has become increasingly important and a critical pathway toward Industry 5.0. Sustainable Value Stream Mapping (Sus-VSM) provides a structured approach for assessing economic, environmental, and social performance, but its practical adoption remains limited, and it has not been systematically aligned with SDG Targets. These limitations are particularly evident among small and medium-sized enterprises (SMEs) which often lack the resources needed to implement extensive sustainability indicator sets. This study combines a systematic literature review with industrial evidence to identify Sus-VSM indicators and examine their use in practice. A consolidated set of 18 economic, 22 environmental, and 18 social indicators is derived and mapped to 16 SDG Targets relevant to manufacturing by means of a Delphi-based expert assessment. The mapping results are analysed to evaluate indicator usefulness and expert agreement and are complemented by an industrial verification from 30 companies across different sectors that rates each indicator in terms of relevance to SDGs and applicability in real factory contexts. The results show that economic indicators are most aligned with SDG 8, environmental indicators with SDG 9, SDG 12, and SDG 13, and social indicators with SDG 3 and SDG 8, while gaps persist for water, energy transition, and some climate-related Targets. A prioritised indicator set is proposed that maintains coverage of the selected SDG Targets and remains feasible for SMEs, providing a practically oriented basis for embedding SDG-aligned sustainability assessment within Sus-VSM.
1. Introduction
In response to growing societal expectations and regulatory pressures, the manufacturing sector is increasingly expected to embed sustainability within its operational systems. The United Nations Sustainable Development Goals offer a comprehensive reference for responsible industrial development and have become central to the formulation of sustainability strategies across the sector [1]. Their relevance is reinforced by the progression toward Industry 5.0, which promotes human centred, resilient, and environmentally conscious modes of production [2]. Recent studies demonstrate that Industry 4.0 technologies can support the achievement of the SDGs when applied within well-structured operational frameworks [2,3]. Within this context, improving the performance of manufacturing value streams has become an important means of advancing both productivity and sustainability.
Value Stream Mapping (VSM) is an established lean management method that visualises material and information flows in order to identify inefficiencies and opportunities for improvement [4,5]. Its traditional formulation concentrates on economic performance measures. Sustainable VSM (Sus-VSM) extends the method by incorporating indicators that reflect economic, environmental, and social aspects of production [6]. Economic indicators include the number of workers, cycle time, changeover time, uptime, lead time, and value-added time. Environmental indicators encompass raw material use, water consumption, and energy consumption. Social indicators capture conditions related to physical workload, noise exposure, and risks associated with electrical systems, hazardous substances, pressurised equipment, or high-speed components.
Although the concept of Sustainable Value Stream Mapping (Sus-VSM) was introduced in 2014, it has not yet achieved widespread adoption in industrial practice. The main objective of this study is to analyse the reasons for this situation, particularly in the context of implementing Sus-VSM in small and medium-sized enterprises, and to propose directions for increasing the applicability of the method. In particular, the study focuses on the indicator set associated with Sus-VSM, which supports the assessment of organisational performance across economic, environmental, and social dimensions.
The remainder of the paper is structured as follows. Section 2 summarises recent research on Sustainable Value Stream Mapping and positions the present study relative to existing approaches by highlighting differences in indicator selection, SDG alignment, and applicability in SMEs. Section 3 presents the research questions and the methodological approach, including the SLR and the expert-based mapping procedure. Section 4 reports the results of the literature review, addressing the indicators used in Sus-VSM and their application in industrial case studies. Section 5 introduces the SDGs and targets relevant for manufacturing and presents the results of mapping the indicators to the selected SDG Targets. Section 6 complements this analysis by incorporating industrial verification and consolidates the proposed indicator set based on both expert evaluation and practical applicability. Section 7 presents the conclusions and outlines opportunities for future work.
2. Frontier Research Comparison
Although Sus-VSM represents an important broadening of the Value Stream Mapping method, further expansions have introduced additional indicators, digital technologies, and elements of circularity to support more multidimensional assessments of manufacturing systems [7,8,9,10]. For example, Silva et al. (2024) [11] propose a holistic Value Stream Mapping for Sustainability (VSM4S) model that embeds economic, environmental, and social indicators into the mapping process to support strategic decision-making in manufacturing companies. Furthermore, Horsthofer-Rauch (2024) [12] provides an overview of process mining and sustainability-integrated VSM approaches, underlining the growing role of digital analytics in sustainability assessments. Additionally, decision models for selecting lean and green tools, including references to Sus-VSM, have been proposed to support more informed tool adoption in practice (Hegedić et al., 2024) [13].
Recent systematic literature reviews confirm the growing integration of sustainability considerations into lean manufacturing tools, including Value Stream Mapping, across the economic, environmental, and social pillars of sustainability [14,15].
Despite the presented evolution, significant gaps remain in the conceptual and practical application of Sus-VSM [16]. The first gap concerns the absence of systematic alignment with the SDGs. The method predates the SDGs and therefore lacks a structured link between its indicators and specific SDG Targets. Some indicators overlap conceptually with sustainability themes, yet no formal mapping framework exists [17,18]. As a result, organisations cannot interpret their value stream performance in relation to recognised sustainability outcomes. The lack of this alignment limits the usefulness of Sus-VSM for organisations that aim to monitor or communicate their contribution to global sustainability goals [19,20]. Prior attempts to consolidate indicators have identified economic, environmental, and social dimensions but have not established their specific relevance to SDG Targets [19]. This constrains the potential of Sus-VSM to support improvement activities within an SDG-oriented perspective. The existing studies typically propose comprehensive or conceptually driven sets of sustainability indicators for value stream analysis [11,12], whereas the present study applies a structured selection and prioritisation logic based on a systematic literature review and expert assessment, explicitly accounting for the operational constraints of SMEs. While existing research often refers to the SDGs at a strategic or reporting level [16,17], it generally lacks a systematic mapping between operational performance indicators and specific SDG Targets, which is explicitly addressed in this study.
A second gap relates to the limited adoption of Sus-VSM in industrial practice and is particularly evident among small and medium-sized enterprises (SMEs). Although SMEs represent a substantial share of industrial activity, accounting for about half of employment in the European manufacturing sector [21], they face barriers such as difficulties in accessing reliable sustainability data, limited clarity on methodological steps, and restricted financial or human resources [22]. These constraints reduce their ability to implement existing Sus-VSM indicator sets which are often extensive and demanding. Although recent approaches integrate digital technologies, circular economy concepts, or advanced analytics into sustainability assessment [12,18], they frequently require extensive data availability or technological infrastructure, whereas the proposed framework is designed for incremental and scalable implementation within resource-constrained SME environments. The absence of clear guidance tailored to SME conditions further complicates the adoption of the method and restricts its practical value [23]. The variability in SME processes and their resource profiles also creates difficulties in applying indicator sets developed primarily for larger organisations.
To address these gaps, this paper proposes the following contributions:
- Identify and synthesise indicators used in Sus-VSM through a systematic literature review (SLR) and case study analysis, with specific attention to their use within SME contexts, categorising these indicators into economic, environmental, and social categories.
- Map the identified indicators to industry-related SDG Targets through a quantitative Delphi-based expert assessment to determine their usefulness and relevance in the context of the SDGs.
- Develop a refined and practically oriented indicator set that integrates the economic, environmental, and social dimensions of Sus-VSM while remaining feasible for application in industrial settings.
By systematically linking Sus-VSM indicators to SDG Targets and introducing a prioritised, SME-oriented indicator framework grounded in expert assessment, this study bridges the gap between sustainability-oriented value stream analysis and the practical operationalisation of the SDGs at the shop-floor level. The following section describes the approach adopted to achieve the proposed contributions.
3. Research Methodology
To ensure that the study responds to the limitations identified above, the research questions (RQs) were formulated to address both the conceptual gap concerning the absence of explicit SDG alignment and the practical gap concerning the limited adoption of Sus-VSM in industrial environments. The following RQs have been formulated to identify existing indicators, understand their application in real cases, evaluate their relevance to recognised SDG Targets, and define a set of indicators that can be feasibly applied by organisations, including SMEs:
- RQ1:
- Indicator Identification: Which indicators are adopted in Sus-VSM-related literature for measuring sustainability?
- RQ2:
- Practical Applications, Case Evidence: What is the practical implementation of Sus-VSM indicators for SME?
- RQ3:
- Alignment with SDGs: To what extent do the existing VSM indicators reflect the principles and targets of the UN SDGs?
- RQ4:
- Proposed Indicator Set: Which indicators can be effectively applied in industrial practice alongside Sus-VSM to support the transition toward more sustainable manufacturing?
To answer these questions, a two-part methodology was adopted. The first part consisted of an SLR to identify indicators used in Sus-VSM and to examine their practical application in reported case studies. This addressed RQ1 and RQ2 by classifying the indicators into economic, environmental, and social categories and by analysing how they have been used in real manufacturing settings, including those of SMEs. The second part consisted of mapping the identified indicators to the SDG Targets that are relevant for industrial activities. A Delphi-based expert assessment was used to evaluate the extent to which each indicator relates to specific SDG Targets, which addressed RQ3. The results of this mapping informed the development of a refined set of indicators that represent the sustainability dimensions while remaining feasible for industrial application. The proposed indicators were evaluated by industrial experts to determine their relevance and practicality in real manufacturing environments, which addressed RQ4.
3.1. Systematic Literature Review Method
The SLR was designed to identify indicators used in Sus-VSM and to understand how they have been applied in manufacturing contexts. An overview of the adopted procedure and the associated document counts is presented in Figure 1.
Figure 1.
Flowchart of the systematic literature review methodology. Solid lines represent the activity flow; dash lines represent the information flow.
The starting point was the seminal paper by Faulkner and Badurdeen [6], which first introduced the Sus-VSM methodology by incorporating economic, environmental, and social aspects into traditional Value Stream Mapping. A second key reference was the paper by Brown, Amundson, and Badurdeen [23], which presented a practical implementation of Sus-VSM in an industrial setting. Both papers were treated as seed publications.
A forward citation chain analysis was then conducted in the Scopus database, which was selected for its broad coverage of engineering and manufacturing journals and conferences. All publications citing Faulkner and Badurdeen [6] were retrieved, resulting in 290 records. The same procedure was applied to Brown et al. [23], which added a further 140 records. After merging the two sets and removing duplicates, 334 unique publications related to Sus-VSM were obtained. These publications formed the initial body of literature for further screening.
Initial screening of subject area filters was then applied to exclude works outside the scope of manufacturing and industrial sustainability. Publications classified under Physics and Astronomy, Agricultural and Biological Sciences, Biochemistry, Genetics and Molecular Biology, Medicine, Psychology, Earth and Planetary Sciences, Neuroscience, Pharmacology, Toxicology and Pharmaceutics were removed. This reduced the set to 309 publications that were considered relevant in terms of field and context. The authors recognise that extending the search with additional techniques, such as backward citation analysis, could identify further publications. However, repeated occurrence of similar indicators in the screened material indicated that the adopted procedure provided sufficient coverage for the purpose of this study.
For these 309 publications, a keyword analysis was carried out to focus the review on works that addressed indicators related to sustainability assessment in value streams. A list of related keyword terms was used, including Sustainability assessment, Sustainability indicators, Sustainability performance, Sustainability Index, Sustainable values, Environmental impact, Environmental indicator, Performance evaluation, Costs, Costs Effectiveness, Environmental assessment, Key Performance Indicators, Lead time, Operational Performance, Performance assessment, Performance measurements, Environmental performance, Efficiency, Productivity improvements, Assessment method, Sustainability metrics, Performance, Resource efficiency, Cycle time. Applying this set of terms yielded 144 publications that explicitly referred to indicators relevant for Sus-VSM.
The abstracts of these 144 publications were then reviewed. 29 papers were excluded because they did not address the research questions of this study, and for 12 papers the full text was not accessible. This resulted in a final set of 105 publications, including the original work by Faulkner and Badurdeen [6]. The full texts of these publications were examined to extract the indicators used in relation to Sustainable Value Stream Mapping. The indicators were then classified into economic, environmental, and social categories. In parallel, publications that reported industrial case studies were identified within the same set, which resulted in 7 case study publications that provided additional insight into the practical application of Sus-VSM in manufacturing.
3.2. Mapping Method
The mapping of Sustainable Value Stream indicators to the SDGs was carried out using an expert-based Delphi approach. The Delphi technique is well established for structuring expert judgement and has been widely applied in sustainability studies to support priority setting and indicator evaluation [24,25,26,27]. The procedure adopted in this study followed six structured steps, which are illustrated in Figure 2.
Figure 2.
Overview of the mapping methodology.
- Step-1:
- The SDGs and associated targets relevant to manufacturing were identified. This step ensured that the mapping focused only on targets that can be meaningfully influenced by value stream activities. It avoided the inclusion of SDGs unrelated to operational processes and established a clear boundary for the analysis.
- Step-2:
- Three separate matrices were prepared for economic, environmental, and social indicators to link the selected SDG Targets with the indicators identified in the literature review. This structure allowed a direct comparison between indicator categories and SDG Targets and ensured that relationships were evaluated within consistent sustainability dimensions.
- Step-3:
- Five academic experts independently evaluated the usefulness of each indicator for each SDG Target. A five-point Likert scale was applied, where the categories were defined as follows: (i) very little useful indicator, (ii) not very useful indicator, (iii) moderately useful indicator, (iv) useful indicator, and (v) very useful indicator. Each expert completed all three matrices during this first round of evaluation. The use of expert judgement allowed the assessment of indicator relevance in contexts where empirical SDG measurements are not yet standardised. The Likert scale provided a structured and quantifiable way to capture expert views across all indicator–target combinations.
- Step-4:
- The expert scores were aggregated and analysed using descriptive statistics, including minimum, maximum, average, standard deviation, median, and range. This analysis quantified both the level of usefulness and the level of agreement among experts. It provided an evidence-based basis for comparing indicators and identifying areas of convergence or divergence in expert opinion.
- Step-5:
- The statistical summaries were returned to the experts for a second round of assessment. Each expert reviewed the aggregated results and refined their previous judgements. This step enhanced the reliability of the evaluation by allowing reconsideration and reducing the effect of individual bias, while still preserving diversity of informed perspectives.
- Step-6:
- The revised scores were analysed to identify indicators with strong relevance to specific SDG Targets. Variability in expert scoring was used to derive confidence levels. Visual analyses, including box plots and radar charts, were used to illustrate indicator usefulness and target coverage. This step translated the statistical output into an interpretable basis for defining a prioritised indicator set that aligns with SDG requirements.
As can be observed, the expert assessment using the Delphi method was conducted in two iterative rounds, combining independent expert evaluations with controlled feedback based on aggregated statistical results, in order to enhance the robustness and transparency of the indicator evaluation process.
3.3. Industrial Verification
To assess the practical applicability of the proposed Sus-VSM indicator set, an industrial verification stage was conducted following the literature review and expert-based indicator mapping. This phase aimed to evaluate the relevance and feasibility of the identified economic, environmental, and social indicators from the perspective of manufacturing practitioners operating under real industrial conditions, with particular attention to small and medium-sized enterprises (SMEs).
A total of 30 experts representing SMEs were invited to participate in the industrial verification. The experts were drawn from a diverse range of manufacturing sectors, including aerospace (8 companies), automotive (7 companies), metal processing (4 companies), foundry industry (3 companies), food processing (2 companies), chemical industry (1 company), agricultural machinery manufacturing, and other manufacturing sectors (6 companies). Some experts indicated that their organisations operate across more than one industrial sector, reflecting the heterogeneous and cross-sectoral nature of SME activities.
The verification was conducted using a structured questionnaire distributed to all participating experts. The questionnaire focused on the applicability of individual indicators at the production line level and asked respondents to evaluate the importance and monitoring feasibility of each indicator within their organisation. Specifically, experts were asked to respond to the questions related accordingly to economic, environmental, and social indicators: “Please indicate which types of information are considered important to monitor in relation to production lines in your company.”
Each indicator was assessed using a four-point ordinal scale, defined as follows:
- The information is important and currently monitored (4);
- The information is important and could be monitored in the future (3);
- The information is important but is not monitored and is unlikely to be monitored (2);
- The information is not important (1).
The company could also indicate that a given indicator is not applicable to the enterprise or its activities.
For each indicator, the responses from the 30 experts were aggregated, and the mean score was calculated to reflect its perceived applicability in industrial practice. These mean values were subsequently used to evaluate the overall feasibility of the proposed indicator set and to support the prioritisation of indicators according to their relevance and practicality in SME contexts.
It should be noted that this industrial verification constitutes an expert-based, qualitative–quantitative assessment of applicability, rather than a full empirical validation based on large-scale operational data. The results provide insight into the perceived feasibility and relevance of the indicators across different manufacturing sectors, while large-scale implementation studies and quantitative validation are identified as important directions for future research.
4. Results of the Systematic Literature Review
This section presents the results of the SLR conducted to address the first two research questions. The review examines the descriptive characteristics of the publications identified through the screening process and provides an overview of their thematic structure, which supports the interpretation of research activity relevant to RQ1 and RQ2 (cf. Section 4.1). Section 4.2 reports the indicators used in Sus-VSM across the literature and responds directly to RQ1 by identifying economic, environmental, and social measures applicable at the value stream level. Section 4.3 examines the publications that include empirical case studies, providing insights into how these indicators have been applied in industrial practice and contributing to the answer to RQ2.
4.1. Descriptive Characteristics of the Reviewed Publications
The SLR produced 309 publications that were within the scope of manufacturing sustainability and value stream analysis. These publications represent a multidisciplinary body of work spanning engineering, industrial management, environmental science, and operations research. Most publications were classified under engineering fields, reflecting the strong technical and operational orientation of research in Sustainable Value Stream assessment. Figure 3 presents the subject area distribution of the reviewed publications. This thematic distribution supports the need for a structured synthesis of indicators and confirms the relevance of examining how these indicators relate to the SDGs.
Figure 3.
Distribution of papers by subject area.
A keyword co-occurrence analysis was conducted to explore the thematic structure of the reviewed publications. Bibliographic data exported from Scopus was processed in VOSviewer version 1.6.20 using the full counting method with a minimum occurrence threshold of five [28]. The resulting network visualisation, presented in Figure 4, shows clusters of related terms that appear frequently across the literature. Seven clusters were identified that together contain 102 recurring keywords. The complete list of cluster contents is provided in Appendix A. The visualisation shows that studies often combine operational performance, environmental assessment, and strategic sustainability frameworks within a single analytical approach.
Figure 4.
Network visualisation of keywords.
The visualisation reveals a central concentration of terms related to sustainability, sustainable development, and Value Stream Mapping, which reflects the shared conceptual foundation of the reviewed publications. A prominent cluster emphasises energy efficiency, emissions, and environmental impact, indicating strong interest in resource-related aspects of Sustainable Value Stream assessment. Another cluster highlights the relationship between lean and agile manufacturing systems, productivity improvement, and waste reduction, which suggests continued integration of lean principles in sustainability-oriented studies.
Further clusters connect value stream analysis with broader sustainability methodologies, such as life cycle assessment and environmental management, indicating an interest in multi-level assessments of performance. Several terms within the network, including Industry 4.0, digitalisation, and decision making, reflect the growing influence of digital technologies and data-driven approaches in sustainable manufacturing. Other clusters relate to operational performance, cost effectiveness, and the development of decision support systems, demonstrating the multidisciplinary scope of work in this field. The clusters illustrate that research on Sustainable Value Stream assessment spans multiple conceptual domains.
4.2. Indicators Reported in the Literature
The publications identified in the review report a wide range of indicators that are used to assess sustainability within value stream-oriented studies. To address the first research question (RQ1), these indicators were systematically extracted and organised into three main categories corresponding to the economic, environmental, and social dimensions of sustainability. Within each category, indicators were grouped according to their core concept, while alternative names, abbreviations, and related formulations were recorded to capture the diversity of terminology used across different studies. The detailed lists of indicators are provided in Appendix B, where categorised indicators are presented with their alternative definitions and associated references. This consolidation shows that many publications refer to similar underlying concepts using different terms, for example cycle time, lead time, and process time, or energy consumption, power usage, and electricity demand. Recording these variations made it possible to recognise conceptual overlaps and to distinguish distinct indicators from simple variations in nomenclature.
The analysis revealed substantial redundancy among indicators and highlighted a smaller group of measures that appear frequently across multiple studies and industrial contexts. These recurrent indicators typically describe fundamental aspects of value stream performance such as time-based efficiency, defect rates, inventory levels, energy use, material consumption, and worker-related conditions. Alongside these widely used indicators, the review also identified more specialised measures tailored to particular processes, sectors, or methodological approaches, such as advanced environmental performance metrics or context-specific social indicators.
From the complete set of indicators identified in the literature, a subset that is directly applicable at the value stream level was selected for further analysis. This subset comprised 18 economic indicators, 22 environmental indicators, and 18 social indicators that reflect activities occurring within a specific product value stream. The selection was guided by the need to focus on indicators that can be measured with information typically available in manufacturing companies and that are conceptually compatible with Sus-VSM. These indicators formed the basis for the subsequent mapping to SDGs targets (cf. Section 5) and for the evaluation of their practical relevance in industrial settings in the next section.
4.3. Evidence from Industrial Case Studies
To address the second research question (RQ2), the publications that reported empirical applications of Sus-VSM were analysed. This review identified only 7 case studies, indicating a clear gap in the practical implementation of Sus-VSM, particularly in industrial environments where sustainability assessment at the value stream level could provide valuable insights. Table 1 summarises the characteristics of these case studies, including the methodological approach adopted, the type of industrial processes examined, and the indicators applied.
Table 1.
Summary of case studies applying Sus-VSM.
The case studies demonstrate a diverse range of applications across sectors such as furniture manufacturing, automotive component production, computer desk assembly, and plastics processing. Despite these differences, several common themes emerge regarding the indicators used. Many studies rely on time-based and productivity-related measures such as production time, process cycle efficiency, lead time, value-added time, non-value-added time, and work-in-progress time. Other studies incorporate product life cycle measures such as beginning of life and end of life data, reflecting attempts to integrate circularity considerations into value stream analysis. A smaller set of studies adopts broader sustainability indicators that encompass economic, environmental, and social dimensions, including metrics for overall sustainability performance.
The analysis of these case studies reveals three recurrent groups of indicators. Productivity and efficiency indicators reflect the economic aspect of value stream assessment and include measures that capture operational performance such as worker utilisation, bottlenecks, throughput yields, and overtime. Product life cycle indicators address both economic and environmental aspects and include measures related to material flows and end-of-life recovery. Sustainability indicators in production integrate economic, environmental, and social dimensions through composite measures of manufacturing sustainability performance. These findings show that, in practice, Sus-VSM has been implemented with relatively compact indicator sets that concentrate on the most accessible and operationally relevant measures. This is particularly important for SMEs, which frequently face constraints in data collection and analytical resources. The case studies indicate that SMEs can still benefit from Sus-VSM by using a reduced set of carefully selected indicators. This insight informed the subsequent stages of the study, where the indicators identified through the SLR and case analysis were mapped to SDG Targets and evaluated for their suitability in industrial applications in the next section.
5. Mapping of Sus-VSM Indicators to SDGs
This section presents the results of the mapping process designed to address the third research question. The analysis evaluates the alignment between the indicators identified in the literature and the sustainability priorities expressed in the SDG Targets, providing an assessment of their usefulness for supporting Sus-VSM in industrial settings. Section 5.1 outlines the SDGs and targets considered relevant for manufacturing value streams and establishes the basis for the subsequent mapping activities. Section 5.2 reports the outcomes of the expert-based evaluation, presenting the aggregated scores and examining the strength of alignment between indicators and SDG Targets, answering RQ3.
5.1. Relevant SDGs and Targets
The identification of SDGs and targets relevant to manufacturing processes formed an essential step in addressing the third research question, which evaluates how well existing Sus-VSM indicators reflect recognised sustainability objectives. Since Sus-VSM focuses on operational activities within industrial environments, only SDGs with a clear connection to production systems were considered. The selection was guided by five criteria: (i) alignment with industrial impact areas, (ii) relevance to manufacturing processes, (iii) contribution to economic, environmental and social sustainability, (iv) consistency with global and sectoral priorities, and (v) feasibility of measurement at the value stream level. Based on these criteria, eight SDGs were selected for further analysis and listed in the following:
 SDG3: Good Health and Well-being: Ensure healthy lives for all people of all ages and promote well-being
- T3.4 reduce premature mortality from non-communicable diseases through prevention and treatment and promote mental health and well-being
- T3.9 reduce deaths and diseases caused by hazardous chemicals and air, water and soil pollution
 SDG5: Gender Equality. Achieve gender equality and empower women and girls
- T5.1 Eliminate discrimination against women
 SDG6: Clean Water and Sanitation. Ensure access to water and sanitation for all people through sustainable water management
- T6.3 reduce the amount of untreated wastewater and significantly increase the level of reuse
- T6.4 increase the efficiency of water use in all sectors and ensure sustainable abstraction
 SDG7: Affordable and Clean Energy: Provide everyone with access to sources of stable, sustainable and modern energy at an affordable price
- T7.2 increasing renewable energy sources
- T7.3 doubling the global energy efficiency growth rate
 SDG8: Decent Work and Economic Growth: Promote stable, sustainable and inclusive economic growth, full and productive employment and decent work for all
- T8.2 achieve higher levels of economic performance through technological modernization and innovation, invest in modern technologies
- T8.3 promote the creation of decent jobs
- T8.4 increasing resource efficiency and promote sustainable practices and stable economic growth
 SDG9: Industry, Innovation, and Infrastructure: Build stable infrastructure, promote sustainable industrialisation and support innovation
- T9.4 modernising industry to increase resource efficiency and use of clean technologies
 SDG12: Responsible Consumption and Production: Ensure sustainable consumption and production patterns
- T12.2 efficient use of natural resources by industry
- T12.4 managing chemicals and waste throughout the product lifecycle
- T12.5 reducing waste generation through prevention, reduction, recycling and reuse
- T12.6 encourage companies to implement sustainable development practices and include information on this subject in their regular reports
 SDG13: Climate Action: Take urgent action to combat climate change and its impacts
- T13.2 involve measures related to industry activities, e.g., greenhouse gas emissions
SDG3 was included due to its emphasis on mitigating industrial impacts on human health through the management of hazardous chemicals and pollution, with relevant targets concerning the reduction in work-related exposure risks and the prevention of health conditions linked to industrial emissions. SDG5 was considered because equitable and inclusive workplace practices form an important dimension of social sustainability within manufacturing environments. SDG6 was included due to the central role of water usage and wastewater management in many industrial processes, with targets that address both efficiency and sustainable abstraction. SDG7 was selected for its focus on energy efficiency and the uptake of renewable energy sources, which are critical for advancing sustainable production. SDG8 is strongly linked to operational improvement and stable economic growth through technological modernisation, decent work, and resource-efficient production. SDG9 emphasises clean technologies and the modernisation of industrial systems, which align with the operational improvements assessed within Value Stream Mapping. SDG12 was selected because it addresses responsible production practices, including resource efficiency, waste reduction, and the management of chemicals throughout the product lifecycle. Lastly, SDG13 was included in recognition of the need for manufacturing organisations to address greenhouse gas emissions and other climate-related impacts that arise from production activities.
These eight goals contain 16 specific targets that can be influenced by value stream activities and evaluated through measurable indicators in the mapping process. The selected targets relate to health and safety protection, gender inclusivity, water and energy efficiency, productivity and resource efficiency, clean industrial technologies, responsible material flows, waste reduction, and climate-related performance. These targets provided the basis for constructing the indicator–target matrices used in the expert assessment and supported the evaluation of relationships between existing indicators and the broader sustainability objectives recognised by the UN.
5.2. Results of the Mapping
The indicators selected from the literature review were mapped to the SDG Targets to address the third research question (RQ3). The expert assessment was conducted in two rounds, and the resulting scores underwent statistical analysis as detailed in Figure 2. Figures 5, 8, and 11 present the mean expert scores for economic, environmental, and social indicators respectively. The grey shading reflects the average expert score on a five-point Likert scale, where darker tones indicate higher usefulness (1 = very little useful, 2 = not very useful, 3 = moderately useful, 4 = useful, 5 = very useful). The red, yellow, and green classes represent low (1.00–2.32), medium (2.33–3.65), and high (3.66–5.00) usefulness ranges. Figures 6, 9, and 12 present the corresponding standard deviation values, reflecting the level of expert agreement. In these figures, darker grey tones indicate lower standard deviation and therefore stronger agreement, while lighter tones indicate higher variability. The agreement classes are defined as low (0.00–0.60), medium (0.61–1.21), and high (1.22–1.82) dispersion.
Figure 5 shows that the economic indicators align most strongly with SDG8, particularly targets T8.2, T8.3 and T8.4, where multiple indicators achieve mean scores above the mid-usefulness threshold. Defects and OEE stand out with the highest values, reflecting their central role in describing productivity and operational performance. In contrast, targets such as T3.9, T5.1 and T7.2 receive consistently low scores, indicating that economic indicators contribute little to health-related, gender-related or renewable-energy-related dimensions. The pattern across SDG12 and SDG13 is more mixed, with several indicators offering moderate contributions but with no consistently high values across the target set. Figure 6 complements these findings by showing that agreement among experts is highest for targets with low mean usefulness, where standard deviation values remain close to zero. This suggests a shared view that SDG areas linked to health, gender equality or renewable energy are not meaningfully supported by economic indicators. Higher variability appears for targets with stronger relevance, particularly T8.2 and T8.4, where experts diverge on the extent of indicator usefulness. Defects and OEE again illustrate this behaviour, showing both high mean values and noticeably higher dispersion, indicating a broader range of expert interpretation.
Figure 5.
Mean expert scores for economic indicators mapped to SDG Targets.
Figure 6.
Standard deviation of expert scores for economic indicators mapped to SDG Targets.
Figure 7 provides an aggregated view of economic indicator usefulness across SDG Targets and shows the same concentration of higher values around SDG8. The boxplots for T8.2 and T8.4 display elevated medians and interquartile ranges that reflect both greater usefulness and modest variability across indicators. Targets associated with SDG3, SDG5 and SDG7 remain clustered at the low end of the scale, confirming that economic indicators offer limited measurement capability for these objectives. SDG12 and SDG13 appear in the mid-range, with wider boxplots indicating mixed relevance depending on the specific target and indicator combination. The results show that economic indicators are most effective for evaluating productivity, process efficiency, and resource utilisation within manufacturing value streams, while gaps remain in capturing health-related, gender-related, and clean-energy targets within the Sus-VSM framework.
Figure 7.
Boxplots of the mean for indicators related to aspects (averaged per SDG Target) from economic aspect. Yellow, and green colours refer to the experts’ agreement level from Figure 6. Interquartile range is reported in the coloured box; line in the box represents the median; x represents the mean. SDGs Targets are grouped per SDG and highlighted with respective icons.
The environmental indicators exhibit a distinct concentration of usefulness around the resource- and emissions-related SDGs, as shown in Figure 8. The strongest alignment appears for SDG9, SDG12 and SDG13, where indicators such as emissions, waste generation and energy consumption achieve consistently high mean values. These indicators capture the environmental implications of manufacturing activities, which explains their strong mapping to targets concerning clean technologies, responsible production and climate-related impacts. By contrast, the mapping to SDG3, SDG5, SDG6 and SDG7 remains limited, reflecting the fact that environmental indicators in Sus-VSM do not typically address health, gender, water or renewable-energy concerns. Target T5.1 is particularly notable for its uniformly low scores, demonstrating the absence of meaningful environmental measures linked to this dimension.
Figure 8.
Mean expert scores for environmental indicators mapped to SDG Targets.
The variation in expert agreement provides further insight into these patterns. As shown in Figure 9, targets with low mean usefulness such as T5.1 and T7.2 also show low standard deviation, indicating a shared view that environmental indicators offer little value for assessing progress in these areas. Higher variability is observed for targets associated with SDG9 and SDG12, where indicators span a broader range of environmental aspects and where expert judgement differs on the extent of their usefulness. Indicators related to emissions, energy consumption and waste management illustrate this behaviour through combinations of higher mean scores and greater dispersion, reflecting the diversity of environmental practices across industrial settings.
Figure 9.
Standard deviation of expert scores for environmental indicators mapped to SDG Targets.
Figure 10 further clarifies the distribution of environmental indicator usefulness across targets. The boxplots for SDG9 and SDG12 show elevated medians and broader interquartile ranges, indicating both stronger relevance and moderate variability in indicator behaviour. A similar pattern appears for T8.2 and T8.4, where environmental indicators support assessments of resource efficiency within production systems. In contrast, the boxplots for SDG3, SDG5, SDG6 and SDG7 remain clustered at low levels, consistent with the limited mapping seen earlier. Some targets within SDG12 show wider distributions and higher central values, particularly T12.4, which aligns with indicators related to waste and chemical management. The results show that environmental indicators are most effective for evaluating emissions, resource consumption, and waste-related impacts, while gaps remain in addressing gender-related, water-management, and selected energy-transition targets within the Sus-VSM framework.
Figure 10.
Boxplots of the mean for indicators related to aspects (averaged per SDG Target) from environmental aspect.
The mapping of social indicators to the SDG Targets (Figure 11) shows that the strongest alignment occurs for T3.4, T3.9, and T8.3, where several indicators reach mean scores above 3, indicating moderate to high usefulness for assessing social performance. Indicators associated with workplace risks, especially those linked to hazardous chemicals and materials (Risk H), present the highest mean values across all social indicators. By contrast, T6.3, T6.4, T7.2, and T13.2 consistently receive low average and maximum scores, demonstrating that existing social indicators offer limited support for assessing these dimensions in the value-stream context.
Figure 11.
Mean expert scores for social indicators mapped to SDG Targets. Abbreviations are as follows: Risk related to Hazardous Chemicals/Materials Used (H), Risk related to Electrical Systems (E), Risk related to Pressure Sys-tems (P), Risk related to High-Speed Components (S).
The patterns of expert agreement shown in Figure 12 reinforce these observations. Targets with low average scores such as T6.3, T6.4, and T7.2 also show low standard deviations, reflecting strong consensus among experts regarding their limited relevance for social indicators. Conversely, targets with higher mean values, including T3.4, T3.9, and T8.3, present higher variance, indicating a broader range of expert viewpoints. This is consistent with the tendency observed in the economic and environmental aspects, where higher perceived usefulness is often accompanied by more heterogeneous expert assessments.
Figure 12.
Standard deviation of expert scores for social indicators mapped to SDG Targets.
The distributional patterns illustrated in Figure 13 provide further detail on these mappings. The boxplots confirm the relatively elevated mean and median values for T3.4, T3.9, and T8.3, with interquartile ranges showing moderate variability. Target T12.6 also displays mid-range usefulness with a comparatively narrow distribution, suggesting stable but moderate agreement among the experts. Meanwhile, T6.3, T6.4, T7.2, and T13.2 cluster around the lowest end of the scale, confirming the limited suitability of current social indicators for assessing these SDG components. The results show that social indicators are most effective for evaluating well-being, occupational health, and employment-related aspects of sustainability, while gaps remain in capturing water, energy, and climate-related targets within the Sus-VSM framework.
Figure 13.
Boxplots of the mean for indicators related to aspects (averaged per SDG Target) from social aspect.
Beyond the results presented for the individual sustainability dimensions, the mapping process reveals several cross-cutting patterns that further clarify the alignment between Sus-VSM indicators and the SDG Targets. The mapped scores show noticeable variation in the level of expert agreement, reflecting different interpretations of how specific indicators contribute to particular sustainability objectives. This variation highlights the conceptual complexity involved in connecting value stream measures to SDG Targets, particularly when indicators capture multidimensional aspects of performance. Indicators associated with established operational measures such as defects and OEE exhibit high agreement and consistently strong alignment with targets related to economic performance, especially T8.2, T8.3, and T8.4. In contrast, indicators with broader or less direct sustainability implications, such as takt time or several social and environmental measures, attract more divergent views. This divergence is visible in the variation in score distributions across Figure 5, Figure 6, Figure 8, Figure 9, Figure 11 and Figure 12 and indicates areas where methodological guidance or further refinement may be necessary. The boxplots in Figure 7, Figure 10 and Figure 13 reinforce this observation by showing that agreement among experts is more easily achieved at lower usefulness scores, whereas higher usefulness classifications are associated with wider variability.
The analysis of mean scores and agreement levels provides an overall understanding of how indicators contribute to SDG Targets. However, the aggregated view can obscure differences in relevance and consensus for individual targets. To address this, additional detail is introduced through the radar-type visualisation provided in Figure 14. This graphical format allows for the examination of one SDG Target at a time, offering a clearer picture of how indicators from the economic, environmental, and social dimensions collectively support or fail to support a specific target.
Figure 14.
Indicators mapping for the T8.2, average score values from Figure 5 for economic aspect (a), from Figure 8 for environmental aspect (b), and from Figure 11 for social aspect (c). Red, yellow, green colours refer to the standard deviation classes on the expert score agreement level from Figure 6 for (a), Figure 9 for (b), and from Figure 12 for (c) using the colormap adopted previously (red = low agreement, yellow = medium agreement, green = strong agreement).
Target T8.2, associated with productivity and technological upgrading, was selected for illustration because it consistently showed high relevance across the indicator set. Figure 14 presents the average expert scores for each indicator mapped to T8.2 across the economic, environmental, and social dimensions. The coloured sectors correspond to agreement levels derived from the standard deviation classes in Figure 6. This representation enables a more refined interpretation of the mapping results by highlighting where consensus is strong, where divergence occurs, and where the indicator set provides robust coverage for the target. High-scoring indicators with strong agreement appear prominently, indicating well-established and widely recognised contributions to T8.2. In contrast, lower-scoring indicators with medium agreement point to areas where expert views are less uniform, suggesting the need for further methodological refinement or clearer definition of the sustainability contribution.
The radar plots reveal distinct patterns across the three sustainability dimensions for T8.2. Within the economic dimension, most indicators form a compact cluster in the upper scoring range, confirming their established role in supporting productivity and operational performance. This reflects both the maturity of these indicators and the stability of expert judgement. The environmental dimension presents a more uneven distribution, where only a small number of indicators reach the higher score ranges, suggesting that environmental contributions to T8.2 are more selective and context-dependent. The social dimension shows the most dispersed pattern, with many indicators concentrated in low or mid ranges. This demonstrates that social aspects are less consistently addressed when assessing productivity-related targets. These patterns further illustrate in detail how the strength and distribution of indicator relevance differ by sustainability dimension, complementing the broader trends shown in the heatmaps and boxplots.
6. Industrial Verification and Consolidation of the Indicator Set
This section complements the expert-based mapping presented in Section 5 by incorporating industrial perspectives to confirm the practical relevance and feasibility of the indicators. The industrial verification supports the transition from analytical mapping results to a final, applicable set of indicators that can be meaningfully integrated into Sus-VSM practice. This step contributes to answering RQ4.
6.1. Industrial Verification Results
The industrial verification exercise enabled a systematic prioritisation of the indicators by comparing their relevance to the SDG Targets with their applicability in real industrial settings. Figure 15 summarises this comparison for the economic (Figure 15a), environmental (Figure 15b), and social (Figure 15c) aspects using a normalised five-point scale. This visualisation highlights areas of alignment between sustainability relevance (yellow component of the bars) and industrial practice (blue component of the bars), as well as those where discrepancies exist. It also reports the SDG Targets most closely linked to each indicator, supporting a more transparent selection process for the recommended indicator set. For the economic dimension, defects, machine failures, OEE, throughput yield, cycle time, and processing time show consistently high industrial applicability, confirming their established position in lean and operations management. These indicators also map strongly to multiple SDG Targets, particularly within SDG 8. In contrast, indicators such as travel distance and service level are rated proportionally higher for their contribution to SDG relevance than for direct industrial use, reflecting areas where sustainability-oriented assessment extends beyond traditional operational metrics.
Figure 15.
Prioritisation of the indicators according to relevance to SDGs and industrial applicability.
Regarding the environmental dimension, waste of raw material, energy consumption, pollution, hazardous wastes, hazardous material consumption, and energy waste emerge as the most influential indicators in both sustainability relevance and industrial applicability. Indicators such as wastewater and steam consumption show the opposite pattern—ranked relatively high for SDG relevance but lower for industrial applicability—suggesting that environmental stewardship priorities are not yet fully embedded in operational decision-making across sectors. Within the social dimension, trained employees, accidents, and the risk-related indicators (Risk E, Risk H) display high scores in both relevance to SDGs and industrial applicability. These results reflect the strong operational and regulatory drivers surrounding occupational health, safety, and competence development. A different pattern is observed for diversity ratio and employee turnover ratio, which show proportionally higher applicability for companies than relevance to SDG Targets. This suggests that while these indicators are important for internal workforce management, their contribution to SDG monitoring remains more limited.
6.2. Proposed Set of Indicators
The evaluation of the mapping results and the industrial verification provides the basis for defining a recommended set of indicators that can support the assessment of sustainability performance at the value stream level in alignment with specific SDG Targets. The selection process combines two sources of evidence. The first source is the structured expert evaluation of the indicators’ usefulness for each SDG Target (cf. Section 5). The second source is the assessment of industrial applicability collected during the verification stage (cf. Section 6.1). Indicators were prioritised when they demonstrated both a consistent contribution to SDG monitoring and a practical relevance for industrial deployment.
Table 2 summarises the proposed indicators for each SDG Target, organised by sustainability dimension and covering the economic, environmental, and social indicators identified as most relevant in the analysis. For each target, the indicators are structured into three levels to support practical implementation, particularly in small and medium-sized enterprises: Level I (1st option) includes the preferred indicators, selected for their strong alignment with the respective SDG Target, high industrial applicability, and data availability, and is recommended as the primary choice; Level II (2nd option) provides alternative indicators to address potential measurement constraints; and Level III (3rd option) comprises complementary indicators intended for extended analyses or more advanced applications. This tiered structure ensures flexibility and scalability while maintaining consistency with the SDG Targets.
Table 2.
Indicators proposed in relation to the goals and targets; I—1st option, II—2nd option, III—3rd option.
A cross-target comparison of the results shows that several indicators appear repeatedly across SDG Targets. Within the economic dimension, Defects is the most recurrent indicator and is linked to eleven targets. This reflects its central role in capturing efficiency losses, waste generation, and quality performance, which collectively influence multiple areas of sustainable development. Indicators such as OEE and Machine failures also exhibit broad relevance, each appearing in six targets. These indicators align strongly with operational stability, productivity, and resource utilisation, which remain important in manufacturing and service sectors. Within the environmental dimension, the indicators Pollution and Emissions show the widest coverage across SDG Targets, being linked to five and four targets respectively. Their prevalence reflects the cross-cutting influence of emissions and pollution control on environmental sustainability. Other indicators such as energy consumption, wastewater, and hazardous material consumption complement these high-level measures with more targeted insights into resource use and environmental risk.
Within the social dimension, the indicator Risk H has the highest relevance and appears in nine targets. This highlights the importance of occupational exposure to hazardous substances as a critical sustainability concern within industrial environments. Indicators such as Trained employees and Risk E also show broad applicability and appear in seven targets each. These indicators reflect the strong alignment between workforce competence, workplace safety, and the social dimension of the SDGs.
Several indicators such as Scrap recycled, Reuse of water, and Waste segregation are directly aligned with principles of the circular economy. Their presence across multiple SDG Targets indicates an increasing integration of circularity within the broader sustainability agenda. At the same time, the variation observed in the expert scores for these indicators suggests that the adoption of circular economy practices within Sus-VSM is still at an early stage in many industrial contexts. This highlights opportunities for further development of methods and tools that can support more consistent integration of circularity considerations. The range and scope of the proposed indicators show that they collectively provide structured coverage of the SDG Targets that are relevant to value stream performance. They form a minimum set that enables assessment across the economic, environmental, and social dimensions while retaining applicability within typical industrial operations.
7. Conclusions and Future Work
This study examined how Sustainable Value Stream Mapping can be systematically aligned with the Sustainable Development Goals in order to strengthen its conceptual foundations and practical relevance for manufacturing organisations. The work addressed both the absence of explicit links between Sus-VSM indicators and SDG Targets and the challenges faced by companies, particularly SMEs, in applying existing sustainability indicator sets in operational environments. The research followed a structured methodology that combined a systematic literature review, expert-based mapping, and industrial verification.
The review identified a consolidated set of economic, environmental, and social indicators used across Sus-VSM studies and industrial case applications. These indicators were mapped to sixteen SDG Targets that are directly influenced by value stream activities. The expert-based evaluation revealed patterns of alignment that differ across sustainability dimensions. Economic indicators showed the strongest and most consistent relevance for SDG 8, while environmental indicators were most closely related to SDG 9, SDG 12, and SDG 13. Social indicators contributed primarily to SDG 3 and SDG 8. The analysis also highlighted areas in which existing indicators provide limited coverage, particularly for water-related and renewable energy related Targets. These findings clarify the extent to which current Sus-VSM practice reflects the priorities of the SDGs and where adjustments may be required.
Industrial verification complemented the expert-based analysis by assessing the practical feasibility of applying the indicators in manufacturing settings. Indicators such as defects, machine failures, OEE, waste of raw materials, energy consumption, trained employees, and risk-related measures demonstrated consistent relevance across both sustainability and operational perspectives. Other indicators, such as wastewater and steam consumption, showed higher relevance for SDG monitoring than for current industrial practice, indicating areas in which sustainability requirements are evolving faster than operational routines. The combined evidence supported the definition of a minimum set of indicators that can be feasibly implemented while maintaining broad coverage of the SDG Targets relevant to manufacturing.
The proposed indicator set provides a structured basis for integrating SDG-aligned sustainability assessment within Value Stream Mapping. It enables organisations, including SMEs, to monitor economic, environmental, and social performance using a compact and operationally realistic set of measures. This is particularly relevant because SMEs typically face limited financial and human resources, difficulties in accessing data, and a lack of dedicated sustainability assessment tools. In this context, Sus-VSM builds on the well-established lean tool of Value Stream Mapping, relies primarily on operational data already collected at the shop floor level, does not require advanced IT infrastructure, and is supported by industrial expert evaluations confirming the applicability of the proposed indicators. Moreover, the framework allows for a progressive implementation, as not all indicators need to be applied simultaneously and companies may select indicators based on the recommended 1st, 2nd, and 3rd option structure.
It also offers a foundation for more transparent communication of value stream improvements in terms of recognised global sustainability objectives. The structured mapping further clarifies the contribution of each indicator to specific SDG Targets, supporting more informed use of Sus-VSM in decision making.
It is recommended that, in the initial stage of implementing the Sus-VSM method, companies focus on 1st option indicators and subsequently expand the scope of monitored indicators in line with their needs, data availability, and organisational resources. This phased approach supports the practical applicability of the method, particularly in small and medium-sized enterprises. At the same time, it should be emphasised that, based on the survey conducted with 30 industry experts, it is not possible to unequivocally determine which indicators are most suitable for specific manufacturing sectors, such as the aerospace or automotive industries. The limited sample size and the heterogeneous nature of the participating companies do not allow for the formulation of sector-specific recommendations. Further, more extensive research involving a larger number of companies from individual sectors is therefore required to develop more precise, sector-oriented guidelines.
Future work can extend this research in several directions. Further development of social and environmental indicators is needed to improve their definitional clarity and reduce variability in expert assessments. Additional studies should investigate how circular economy indicators, such as material recovery and resource regeneration measures, can be systematically incorporated into Sus-VSM. The integration of digital data sources provides another research opportunity, since Industry 4.0 technologies can support automated data capture for several indicators identified in this study. Finally, broader industrial validation across multiple sectors and geographical contexts would strengthen understanding of how organisations apply the refined indicator set and how it supports progress towards SDG-aligned manufacturing systems.
Author Contributions
Conceptualization, D.S., F.L., M.M.M., P.F., N.L. and M.L.; methodology, D.S., F.L., M.M.M., P.F. and M.L.; software, D.S. and F.L.; validation, D.S., F.L., M.M.M., P.F., M.L. and N.L.; formal analysis, D.S., F.L., M.M.M., P.F., M.L. and N.L.; investigation, D.S., F.L. and M.M.M.; resources, D.S., P.F., M.L., P.F. and N.L.; data curation, D.S., F.L. and M.M.M.; writing—original draft preparation, D.S., F.L., M.M.M. and P.F.; writing—review and editing, D.S., F.L., M.M.M., P.F., M.L. and N.L.; visualization, D.S., F.L. and M.M.M.; supervision, D.S., M.L., P.F. and N.L.; project administration, D.S.; funding acquisition, D.S., P.F., M.L. and N.L. All authors have read and agreed to the published version of the manuscript.
Funding
This research was partially supported by EU funds from “MAESTRO—Manufacturing Education for a Sustainable fourth Industrial Revolution” project No. 2019-1-SE01-KA203-060572 co-funded by the ERASMUS+ Programme of the European Union under the Key Action 2—Cooperation for Innovation and the Exchange of Good Practices.
Data Availability Statement
The raw data is not publicly available. Data can be requested from the authors.
Conflicts of Interest
The authors declare no conflict of interest.
Appendix A. Keyword Clusters Identified from the Co-Occurrence Analysis
| Cluster 1 (19 Items) | Cluster 2 (19 Items) | Cluster 3 (17 Items) | Cluster 4 (16 Items) |
| Carbon footprint Cleaner production Conservation Costs Discrete event simulation Emission control Energy Energy conservation Energy efficiency Energy management Energy utilisation Green manufacturing Information management Mapping method Optimisation Production control Productivity improvement Sustainable values Value stream maps | Agile manufacturing systems Case-studies Circular economy Cost reduction Lead time Lean manufacturing Lean production Lean tools Manufacturing process Mapping Performance Production process productivity Sustainability index Sustainability indicators Value Stream Mapping (VSM) Value Stream Mapping (Value Streams Mapping) Waste | Benchmarking Climate change Commerce Environmental assessment environmental protection Industrial ecology Lean management Life cycle analysis Literature review Manufacturing Planning Sustainability Sustainability assessment Sustainable development Sustainable manufacturing Sustainable performance Triple bottom line | Competition Environmental manager Environmental performance Environmental sustainability Green Industry 4.0 Lean Lean and green Lean thinking Manufacturing company Operational performance Simulation Supply chain management Systematic literature review VSM Waste management |
| Cluster 5 (15 Items) | Cluster 6 (12 Items) | Cluster 7 (4 Items) | |
| Environmental impact Framework Industrial research Lean six sigma Life cycle Life cycle assessment Life cycle assessment (lca) Literature reviews manufacturing industries Process engineering Process monitoring Six sigma Supply chains Sustainability performance Work simplification | Cost effectiveness Decision making Decision support system Efficiency Manufacture Manufacturing is Manufacturing operations Performance assessment Production system Resource efficiencies Resource efficiency Sustainable production | Hierarchical systems Manufacturing organisations Performance evaluation Sensitivity analysis | |
Appendix B. Reported Indicators from Literature
| ||
| Indicator | Alternative Definitions, Abbreviations | References |
| Cycle time (C/T) | CT; Operations frequency; | [6,7,23,31,32,33,34,35,36,37,38,39,40,41,42,43,44,45,46,47,48] |
| Throughput Yield | Throughput of process; Overall Throughput Effectiveness; Throughput time; TPY; Rolled Throughput Yield RTPY; | [35,40,42,43,46,49] |
| Uptime | Availability [%]; Uptime; Available time; Full Time Equivalent; Working time; Run Time; Working hours per day (hour/day); | [6,23,31,33,38,39,40,41,42,43,45,49,50] |
| Operation time | Operation cost; | [35,47,51] |
| Lead time | Lead cost; | [1,6,23,32,34,35,37,39,40,41,42,43,45,51,52,53,54,55] |
| Value added time/cost/percentage | Value-added cost; Value time; Value-added ratio; VAT ratio; Value added time ratio; VAT; | [6,7,20,23,37,39,40,43,44,45,52,56,57] |
| Inventory/Inventory cost | Work-in-process; Inventory waiting; Inventory location and size; Work-in-process inventories; WIP; Inventory and Stock; Stock cost; Inventory buffer; Inventory Total (units); Holding Cost (EUR/unit);/Inventory cost; | [7,10,32,33,35,36,37,40,41,43,45,46,48,51,52,58] |
| Processing time/cost | Production times; Process time; Time; Processing cost; | [6,23,35,38,43,47,55,59,60] |
| Number of workers/Cost of workers | No of operators/Operators; Workforce utilisation; Human resources; Labour cost; Labour time; Skilled labour; Labour availability; | [1,6,7,23,31,32,33,34,35,38,39,40,41,43,45,47,49,50,51,55] |
| Defects [%] | Quality [pcs]; Quality [%]; Defective Rate; Number of defects; Defect (Passed, Defect); Scrap rates; Total Scrap per shift (min) per operator; Cumulated scrap rates [%]; Waste due to cumulated scrap rate [kg]; Waste due to material input difference [kg]; Scrap ratio; Scrap ratio for process; First-Pass Yield; Repair; Rework cost; Inspection cost; Acceptance rate of product; Defective units and impurities (% on total production); Reworking; Increased net demand per process = (net demand of customer/(1—cumulated scrap rate [%]); Quality control activity time; | [1,7,10,31,33,34,35,40,43,44,46,48,49,50,52,53,59,60,61,62,63,64] |
| Waste cost | Expenses accounted for negative product (waste); Cost of waste treatment; Waste management cost; | [35,43] |
| Changeover time (C/O) | Setup time; Waste due to set-ups [kg]; CO; | [6,7,23,31,32,34,35,36,38,39,40,41,42,43,44,45,48,64,65,66,67] |
| Machine failures [%] | MTTR; Time-to-failure (hour); Time-to-repair (hour); | [44,50] |
| Over time | (no alternative definitions found) | [1] |
| Waiting time cost | Delay time; Idle time; Stoppage time; Holding time; Holding cost; Down Time; Down Time cost; Planned down time [min]; Unplanned down time [min]; | [1,31,43,48,60,68,69,70] |
| Production cost | NA | [42,71,72] |
| Transportation | Transportation lead time; Transportation time; Transportation overall Vehicle Effectiveness; Transportation distance and quantity; Travel distance; Transport time/type; Transportation (from supplier); Transportation (to customer); Transportation cost; | [33,35,43,52,55] |
| OEE | Overall Equipment Effectiveness (OEE); | [7,31,36,43,51,60,73] |
| OEEE | Overall Environmental Equipment Effectiveness (OEEE); | [43] |
| Water bill cost | NA | |
| Natural gas cost | ||
| Cost of chemicals | ||
| Material cost | Material quantity and cost; Material efficiency consumption cost; | [7,35,42] |
| Energy cost | Energy efficiency consumption cost; Energy consumed by the work unit over time; | [1,25,35,42,43,51] |
| Cost of system | Cost of labour and capital; Manual work time; | [35] |
| Material (value added) | NA | [51,55,66] |
| Material (non-value added) | Non-value added cost; Non-value added time [s]; | [20,31,43,51,55,56,66] |
| Machinery | No of machines; Number of tools, units; Technical resource (machines, tools, etc.); Machine hour rate; Machinery cost; Machinery time; Maintenance cost; Equipment cost; Total productive maintenance ratio; Machine time; Machinery working time; Machine availability; Machine performance; | [1,7,35,38,42,43,48,50] |
| Number of shifts | NA | [33,37,40,42] |
| Flexibility | [32,43] | |
| Takt time | Takt cost; | [7,31,40,43,52] |
| Efficiency | Cost efficiency (cost added, cost lost); Process cycle efficiency; Cost cycle efficiency; Unitary Efficiency Ratio; Process Parameter Efficiency; Processing Unit Efficiency; System Total Efficiency; Overall production system performance; Global Production System Performance (based on the fraction that adds value and does not add value); Resource efficiency; Efficiency [%]; | [7,34,37,60,61] |
| Performance [%] | NA | [31,42] |
| Productivity | [32,35,37,52] | |
| Bottlenecks | [54,60,74] | |
| Capacity | Process capacity; Maximum capacities and process times (kg/hour); | [51] |
| Batch size | Lot size; Volume; | [38,39,40,47] |
| Service Level | Service Level Quantity Factor (SLQF); Service Level Time Factor (SLTF); | [32,51,53] |
| ||
| Indicator | Alternative Definitions, Abbreviations | References |
| Energy consumption | Power consumption; Energy consumption (Process); Energy consumption (Transport); Electricity/Electrical energy [kWh]; Energy use (KWh); Total energy consumption [mPt]; Total amount of energy used; Energy efficiency; Energy intensity; Lights facilities; Lightening [W/m2]; Energy consumption during inventory storage; Electricity consumption rates of the material handling vehicles; Power spent for heating or cooling at process; Heating energy required per square metre for the output storage area of process; Lighting energy requirement per square metre for the output storage area of process; Power consumption for lighting of the area between the processes; Standard energy consumption; Value added (VA) energy consumption per product; Value stream total energy consumption per period; Non-value added (NVA) energy consumption per period; Primary energy; Effective Energy; Independent Energy; Overall energy consumption; Energy consumption on maintaining facility; Power demand of machine tools; | [1,6,7,20,23,25,27,31,32,33,34,35,36,39,40,42,43,44,45,48,49,50,51,52,54,55,56,58,59,61,62,63,66,75] |
| Renewable energy | Renewable energy used; Green Energy Consumption; Ratio of use of renewable energy [%] for process; Ratio of use of renewable energy [%] for transportation; Sustainable Energy (SE); Renewable and Non—Renewable Energy Consumption (EN2); | [33,43,51,52] |
| Energy waste | Overproduction waste (energy); Transportation and handling waste (energy); Waiting and inventory waste (energy); Rework waste (energy); | [40,43,52] |
| Waste of raw material [kg] | Waste intensity of process; | [76] |
| Process materials usage (cost) | Sandpaper utilisation [m2]; Sandpaper; Packing material; Wooden packaging; PET materials; Redundant and unnecessary materials; Material consumption; Auxiliary material; | [7,20,25,29,33,39,49,50,52,56,58,60,62,63,73,76] |
| Raw materials usage (Added) (cost) | Raw materials; Material consumption; Raw materials usage (Added, Removed); Raw material (plastic, water, etc.); Raw material usage for process; Non-renewable material; Renewable material; | [1,6,20,23,25,31,43,48,50,52,55,58,59,64] |
| Hazardous material consumption | Chemical consumption; Chemicals usage; Coolant consumption [l]; Solvents; Use of hazardous substances; Toxic/Hazardous chemicals use; Consumption of hazardous/harmful/toxic materials; Oil and grease usage; Chemical additives (e/kg); Usage of hazardous materials/components/products; Hazardous raw material used per kg of product; | [6,20,25,29,31,33,43,52,56,60,73] |
| Waste of process materials [kg] | Appropriate referral of waste [kg]; Waste material; | [42,60] |
| Waste | Solid waste generation; Wastes [%]; Solid Waste; Solid waste disposal; Net Solid Waste Generation; Waste factor; Waste disposal; Waste generation; | [7,20,25,33,51,52,58,63] |
| Hazardous wastes | Mass of restricted disposals; Chemicals waste; | [25,48,52] |
| Pollution [μg/m3] | Employee’s air pollution; | [52] |
| Process water (Used) quantity/cost | Process water consumption; Water consumption; | [7,25,43,45,50,52,56,63,64] |
| Wastewater | Effluent generation; Effluent discharge; Toxic discharge; Wastewater generation; Water Pollution; | [7,20,25,48,50,52,63] |
| Emissions | Emission of toxic substances into the air; CO2 emission [kg CO2/GJ]; Air acidification; Total Air Emissions; Emission of CO2, NOx, CO, HC, SO2; Emissions such VOC and Ammonia; Dust and fume emission; Dust exposure; Value-added carbon emission; Non-value-added carbon emission; Total carbon emission; Carbon efficiency; Chemical emission; Carbon footprint [kg CO2e]; Carbon-Value Efficiency = Value added time/The total carbon footprint [s/kg CO2e]; GhG (Greenhouse gases) intensity; Harmful Gases Release; Value-added carbon footprint; Total carbon footprint; Carbon emission; Gas emission; Net Energy Footprint; Net CO2 Emission Impact; Greenhouse Gas Emissions; | [7,20,25,31,32,33,36,41,42,43,48,50,51,52,53,56,57,59,62,63,66,76] |
| Fuel consumption [l] | Diesel [l]; Fossil fuels consumption; Forklift speed; Fuel consumption rates of the material handling vehicles; Machinery fuel cost; Fuel oil cost; | [20,40,42,43,50,52,60,62] |
| Natural gas consumption [m3] | Natural gas consumption for process; Natural gas consumption for transportation; | [1,43,52,56,62,64] |
| Degree of waste segregation | Waste Segregation; Waste with Traceable Treatment; Recyclability of wastes; Recycled Raw Material Ratio; Number of recycled materials; Waste segregation; | [7,10,25,29,36,49,76] |
| Process water | Water consumption; Process water (Needed, Used, Lost); Water eutrophication [mPt]; Water footprint; Water use; Net Water Footprint; Use of fresh water; | [6,20,23,25,32,36,43,45,48,57,59,62] |
| Recycling and reuse of water | NA | [33] |
| Scrap recycled | ||
| Compressed air | [56,62] | |
| Heat | District heating; Heat loss; Dissipated heat (kWh); | [43,50] |
| Steam consumption | Steam usage; | [20] |
| Land Use | NA | [25] |
| Circularity, Longevity | [45] | |
| Noise level in the environment | Noise level outside the factory; | [43] |
References
- Bait, S.; Di Pietro, A.; Schiraldi, M.M. Waste reduction in production processes through simulation and VSM. Sustainability 2020, 12, 3291. [Google Scholar] [CrossRef] [Scilit]
- Stadnicka, D. Systemy Produkcyjne Zorientowane na Człowieka. Human-Centric Manufacturing Systems; Publishing House of the Rzeszów University of Technology: Rzeszów, Poland, 2023. [Google Scholar]
- Mabkhot, M.M.; Ferreira, P.; Maffei, A.; Podržaj, P.; Mądziel, M.; Antonelli, D.; Lanzetta, M.; Barata, J.; Boffa, E.; Finžgar, M.; et al. Mapping Industry 4.0 enabling technologies into United Nations Sustainability Development Goals. Sustainability 2021, 13, 2560. [Google Scholar] [CrossRef] [Scilit]
- Rother, M.; Shook, J. Learning to See: Value Stream Mapping to Add Value and Eliminate Muda; Lean Enterprise Institute: Boston, MA, USA, 2003. [Google Scholar]
- Forno, A.J.D.; Pereira, F.A.; Forcellini, F.A.; Kipper, L.M. Value stream mapping: A study about the problems and challenges found in the literature from the past 15 years about application of lean tools. Int. J. Adv. Manuf. Technol. 2014, 72, 779–790. [Google Scholar] [CrossRef] [Scilit]
- Faulkner, W.; Badurdeen, F. Sustainable value stream mapping (Sus-VSM): Methodology to visualize and assess manufacturing sustainability performance. J. Clean. Prod. 2014, 85, 8–18. [Google Scholar] [CrossRef] [Scilit]
- Swarnakar, V.; Singh, A.R.; Antony, J.; Tiwari, A.K.; Cudney, E. Development of a conceptual method for sustainability assessment in manufacturing. Comput. Ind. Eng. 2021, 158, 107403. [Google Scholar] [CrossRef] [Scilit]
- Tripathi, V.; Saraswat, S.; Gautam, G.D. Improvement in shop floor management using ANN coupled with VSM: A case study. Proc. Inst. Mech. Eng. Part C J. Mech. Eng. Sci. 2022, 236, 5651–5662. [Google Scholar] [CrossRef] [Scilit]
- Mangers, J.; Elahi, M.A.; Plapper, P. Digital twin of end-of-life process-chains for a circular economy adapted product design: A case study on PET bottles. J. Clean. Prod. 2023, 382, 135287. [Google Scholar] [CrossRef] [Scilit]
- Utama, D.M.; Ardiyanti, N.; Putri, A.A. A new hybrid method for manufacturing sustainability performance assessment: A case study in furniture industry. Prod. Manuf. Res. 2022, 10, 760–783. [Google Scholar] [CrossRef] [Scilit]
- Silva, E.S.; Agostinho, F.; Almeida, C.M.V.B.; Liu, G.; Giannetti, B.F. Value stream mapping for sustainability: A management tool proposal for more sustainable companies. Sustain. Prod. Consum. 2024, 47, 329–342. [Google Scholar] [CrossRef] [Scilit]
- Horsthofer-Rauch, J.; Guesken, S.R.; Weich, J.; Rauch, A.; Bittner, M.; Schulz, J.; Zaeh, M.F. Sustainability-integrated value stream mapping with process mining. Prod. Manuf. Res. 2024, 12, 2334294. [Google Scholar] [CrossRef] [Scilit]
- Hegedić, M.; Gudlin, M.; Golec, M.; Tošanović, N. Lean and green decision model for lean tools selection. Sustainability 2024, 16, 1173. [Google Scholar] [CrossRef] [Scilit]
- Vilaça, D.M.; de Sá, J.C.; Antony, J.; Sony, M.; McDermott, O. Lean, Green, and Sustainability 4.0—A systematic literature review. Bus. Strategy Environ. 2025, 35, 1219–1238. [Google Scholar] [CrossRef] [Scilit]
- Pierli, G.; Murmura, F.; Bravi, L. Lean manufacturing and sustainability pillars: A systematic literature review. Int. J. Lean Six Sigma 2026, 17, 1–26. [Google Scholar] [CrossRef] [Scilit]
- D’Adamo, I.; Della Sciucca, M.; Gastaldi, M.; Lupi, B. Indicator Assessment of Sustainable Development Goals: A Global Perspective. Sustainability 2025, 17, 8259. [Google Scholar] [CrossRef] [Scilit]
- Sreenivasan, A.; Suresh, M.; Nedungadi, P. Mapping analytical hierarchy process research to sustainable development goals: Bibliometric and social network analysis. Heliyon 2023, 9, e19077. [Google Scholar] [CrossRef] [Scilit]
- Reslan, M.; Triebe, M.J.; Venketesh, R.; Hartwell, A.J. Automation of Value Stream Mapping: A Case Study on Enhancing Lean Manufacturing Tools Through Digital Twins. Procedia CIRP 2025, 134, 455–460. [Google Scholar] [CrossRef] [Scilit]
- Wyczewska, E.; Stadnicka, D. Value stream mapping and process indicators supporting sustainable development in organizations: A systematic literature review. In Intelligent Systems in Production Engineering and Maintenance III; Springer: Cham, Switzerland, 2024. [Google Scholar]
- Vinodh, S.; Ben Ruben, R.; Asokan, P. Life cycle assessment integrated value stream mapping framework to ensure sustainable manufacturing: A case study. Clean Technol. Environ. Policy 2016, 18, 279–295. [Google Scholar] [CrossRef] [Scilit]
- Eurostat. Businesses in the manufacturing sector. In Statistics Explained; Publications Office of the European Union: Luxembourg, 2023. [Google Scholar]
- Bonfante, M.C.; Ferreira, J.C.E.; Fernandes, S.; Back, H. Lessons learned from sustainable value stream mapping (Sus-VSM) application in a small enterprise. In Operations Management for Social Good; Springer International Publishing: Berlin/Heidelberg, Germany, 2020; pp. 1045–1053. [Google Scholar]
- Brown, A.; Amundson, J.; Badurdeen, F. Sustainable value stream mapping (Sus-VSM) in different manufacturing system configurations: Application case studies. J. Clean. Prod. 2014, 85, 164–179. [Google Scholar] [CrossRef] [Scilit]
- Dalkey, N.; Helmer, O. An experimental application of the Delphi method to the use of experts. Manag. Sci. 1963, 9, 458–467. [Google Scholar] [CrossRef] [Scilit]
- Suárez-Serrano, E.; González-Torre, P.L.; Covián-Regales, E. A business prioritisation of the sustainable development goals indicators: Building bridges between academics and practitioners in the Spanish case. Environ. Dev. 2023, 46, 100827. [Google Scholar] [CrossRef] [Scilit]
- Zhao, P.; Ali, Z.M.; Ahmad, Y. Developing indicators for sustainable urban regeneration in historic urban areas: Delphi method and analytic hierarchy process (AHP). Sustain. Cities Soc. 2023, 99, 104990. [Google Scholar] [CrossRef] [Scilit]
- Dahal, B.; Avellán, T.; Haghighi, A.T.; Kløve, B. Defining sustainability in agricultural water management using a Delphi survey technique. Water Policy 2023, 25, 597–621. [Google Scholar] [CrossRef] [Scilit]
- Van Eck, N.J.; Waltman, L. Manual for VOSviewer Version 1.6.16; Universiteit Leiden: Leiden, The Netherlands, 2020. [Google Scholar]
- Nguyen, N.T.; Vo, T.T.B.C.; Le, P.H.; Wang, C.N. Improving inventory time in production line through value stream mapping: A case study. J. Eng. Sci. Technol. Rev. 2023, 16, 33–34. [Google Scholar] [CrossRef] [Scilit]
- Tiamaz, Y.; Souissi, N. Meta-analysis of lean case studies for the business process improvement. In 2016 4th IEEE International Colloquium on Information Science and Technology (CiSt); IEEE: Piscataway, NJ, USA, 2016; pp. 175–181. [Google Scholar]
- Ng, R.; Low, J.S.C.; Song, B. Integrating and implementing lean and green practices based on proposition of Carbon-Value Efficiency metric. J. Clean. Prod. 2015, 95, 242–255. [Google Scholar] [CrossRef] [Scilit]
- Hartini, S.; Ciptomulyono, U. The relationship between lean and sustainable manufacturing on performance: Literature review. Procedia Manuf. 2015, 4, 38–45. [Google Scholar] [CrossRef] [Scilit]
- Huang, Y.; Tomizuka, M. Production flow analysis through environmental value stream mapping: A case study of cover glass manufacturing facility. Procedia CIRP 2017, 61, 446–450. [Google Scholar] [CrossRef] [Scilit]
- Hartini, S.; Ciptomulyono, U.; Anityasari, M.; Pudjotomo, D. Sustainable-value stream mapping to evaluate sustainability performance: Case study in an Indonesian furniture company. MATEC Web Conf. 2018, 154, 01055. [Google Scholar] [CrossRef] [Scilit]
- Thanki, S.J.; Thakkar, J.J. Value–value load diagram: A graphical tool for lean–green performance assessment. Prod. Plan. Control 2016, 27, 1280–1297. [Google Scholar] [CrossRef] [Scilit]
- Helleno, A.L.; de Moraes, A.J.I.; Simon, A.T. Integrating sustainability indicators and lean manufacturing to assess manufacturing processes: Application case studies in Brazilian industry. J. Clean. Prod. 2017, 153, 405–416. [Google Scholar] [CrossRef] [Scilit]
- Antomarioni, S.; Bevilacqua, M.; Ciarapica, F.E. More sustainable performances through lean practices: A case study. In 2018 IEEE International Conference on Engineering, Technology and Innovation (ICE/ITMC); IEEE: Piscataway, NJ, USA, 2018; pp. 1–8. [Google Scholar]
- Gholami, H.; Jamil, N.; Zakuan, N.; Saman, M.Z.M.; Sharif, S.; Awang, S.R.; Sulaiman, Z. Social value stream mapping (Socio-VSM): Methodology to societal sustainability visualization and assessment in the manufacturing system. IEEE Access 2019, 7, 131638–131648. [Google Scholar] [CrossRef] [Scilit]
- Muñoz-Villamizar, A.; Santos, J.; Garcia-Sabater, J.J.; Lleo, A.; Grau, P. Green value stream mapping approach to improving productivity and environmental performance. Int. J. Product. Perform. Manag. 2019, 68, 608–625. [Google Scholar] [CrossRef] [Scilit]
- Baysan, S.; Kabadurmus, O.; Cevikcan, E.; Satoglu, S.I.; Durmusoglu, M.B. A simulation-based methodology for the analysis of the effect of lean tools on energy efficiency: An application in power distribution industry. J. Clean. Prod. 2019, 211, 895–908. [Google Scholar] [CrossRef] [Scilit]
- Choudhary, S.; Nayak, R.; Dora, M.; Mishra, N.; Ghadge, A. An integrated lean and green approach for improving sustainability performance: A case study of a packaging manufacturing SME in the UK. Prod. Plan. Control 2019, 30, 353–368. [Google Scholar] [CrossRef] [Scilit]
- Baumer-Cardoso, M.I.; Campos, L.M.; Santos, P.P.P.; Frazzon, E.M. Simulation-based analysis of catalyzers and trade-offs in Lean & Green manufacturing. J. Clean. Prod. 2020, 242, 118411. [Google Scholar] [CrossRef] [Scilit]
- Lee, J.K.Y.; Gholami, H.; Saman, M.Z.M.; Ngadiman, N.H.A.B.; Zakuan, N.; Mahmood, S.; Omain, S.Z. Sustainability-oriented application of value stream mapping: A review and classification. IEEE Access 2021, 9, 68414–68434. [Google Scholar] [CrossRef] [Scilit]
- Wen, X.; Cao, H.; Hon, B.; Chen, E.; Li, H. Energy value mapping: A novel lean method to integrate energy efficiency into production management. Energy 2021, 217, 119353. [Google Scholar] [CrossRef] [Scilit]
- Marquina, M.V.H.; Zwolinski, P.; Mangione, F. Application of value stream mapping tool to improve circular systems. Clean. Eng. Technol. 2021, 5, 100270. [Google Scholar] [CrossRef] [Scilit]
- Rathore, B.; Pundir, A.K.; Iqbal, R.; Gupta, R. Development of fuzzy-based ergonomic-value stream mapping (E-VSM) tool: A case study in Indian glass artware industry. Prod. Plan. Control 2022, 34, 1618–1638. [Google Scholar] [CrossRef] [Scilit]
- Wiese, M.; Rogall, C.; Henningsen, N.; Herrmann, C.; Thiede, S. Environmental and technical evaluation of additive manufacturing: Enabling process chain perspective by energy value stream mapping. Procedia CIRP 2022, 105, 440–445. [Google Scholar] [CrossRef] [Scilit]
- Abobakr, M.A.; Abdel-Kader, M.; Elbayoumi, A.F. Integrating S-ERP systems and lean manufacturing practices to improve sustainability performance: An institutional theory perspective. J. Account. Emerg. Econ. 2022, 13, 870–897. [Google Scholar] [CrossRef] [Scilit]
- Marie, I.A.; Sari, E.; Hutagalung, A.Y. Enhancing sustainable performance using lean competitive manufacturing strategy: A case study at motor vehicle battery company. In Proceedings of the 2022 International Conference on Engineering and Information Technology for Sustainable Industry, Kuala Lumpur, Malaysia, 24–25 August 2022; pp. 1–5. [Google Scholar]
- Castiglione, C.; Pastore, E.; Alfieri, A. Technical, economic, and environmental performance assessment of manufacturing systems: The multi-layer enterprise input–output formalization method. Prod. Plan. Control 2024, 35, 133–150. [Google Scholar] [CrossRef] [Scilit]
- Bhattacharya, A.; Nand, A.; Castka, P. Lean–green integration and its impact on sustainability performance: A critical review. J. Clean. Prod. 2019, 236, 117697. [Google Scholar] [CrossRef] [Scilit]
- Gargalo, C.L.; Pereda Pons, E.; Barbosa-Povoa, A.P.; Carvalho, A. A lean approach to developing sustainable supply chains. Sustainability 2021, 13, 3714. [Google Scholar] [CrossRef] [Scilit]
- Hariyani, D.; Mishra, S.; Sharma, M.K. A descriptive statistical analysis of barriers to the adoption of integrated sustainable–green–lean–six sigma–agile manufacturing system (ISGLSAMS) in Indian manufacturing industries. Benchmarking Int. J. 2023, 30, 2705–2733. [Google Scholar] [CrossRef] [Scilit]
- Litos, L.; Borzillo, F.; Patsavellas, J.; Cockhead, D.; Salonitis, K. Management tool design for eco-efficiency improvements in manufacturing: A case study. Procedia CIRP 2017, 60, 500–505. [Google Scholar] [CrossRef] [Scilit]
- Cheung, W.M.; Leong, J.T.; Vichare, P. Incorporating lean thinking and life cycle assessment to reduce environmental impacts of plastic injection moulded products. J. Clean. Prod. 2017, 167, 759–775. [Google Scholar] [CrossRef] [Scilit]
- Zhu, X.Y.; Zhang, H.; Jiang, Z.G. Application of green-modified value stream mapping to integrate and implement lean and green practices: A case study. Int. J. Comput. Integr. Manuf. 2020, 33, 716–731. [Google Scholar] [CrossRef] [Scilit]
- Tasdemir, C.; Gazo, R.; Quesada, H.J. Sustainability benchmarking tool (SBT): Theoretical and conceptual model proposition of a composite framework. Environ. Dev. Sustain. 2020, 22, 6755–6797. [Google Scholar] [CrossRef] [Scilit]
- Song, Z.; Moon, Y. Sustainability metrics for assessing manufacturing systems: A distance-to-target methodology. Environ. Dev. Sustain. 2019, 21, 2811–2834. [Google Scholar] [CrossRef] [Scilit]
- Mubin, A.; Utama, D.M.; Nusantara, R.C. Manufacturing sustainability assessment comprising physical and mental workload: An integrated modified SVSM and AHP approach. Process Integr. Optim. Sustain. 2023, 7, 407–417. [Google Scholar] [CrossRef] [Scilit]
- Lourenço, E.J.; Pereira, J.P.; Barbosa, R.; Baptista, A.J. Using multi-layer stream mapping to assess the overall efficiency and waste of a production system: A case study from the plywood industry. Procedia CIRP 2016, 48, 128–133. [Google Scholar] [CrossRef] [Scilit]
- Cherrafi, A.; Elfezazi, S.; Govindan, K.; Garza-Reyes, J.A.; Benhida, K.; Mokhlis, A. A framework for the integration of Green and Lean Six Sigma for superior sustainability performance. Int. J. Prod. Res. 2017, 55, 4481–4515. [Google Scholar] [CrossRef] [Scilit]
- Edtmayr, T.; Sunk, A.; Sihn, W. An approach to integrate parameters and indicators of sustainability management into value stream mapping. Procedia CIRP 2016, 41, 289–294. [Google Scholar] [CrossRef] [Scilit]
- Naeemah, A.J.; Wong, K.Y. Positive impacts of lean manufacturing tools on sustainability aspects: A systematic review. J. Ind. Prod. Eng. 2022, 39, 552–571. [Google Scholar] [CrossRef] [Scilit]
- Soltani, M.; Aouag, H.; Anass, C.; Mouss, M.D. Development of an advanced application process of lean manufacturing approach based on a new integrated MCDM method under Pythagorean fuzzy environment. J. Clean. Prod. 2023, 386, 135731. [Google Scholar] [CrossRef] [Scilit]
- Dieste, M.; Panizzolo, R.; Garza-Reyes, J.A. Evaluating the impact of lean practices on environmental performance: Evidences from five manufacturing companies. Prod. Plan. Control 2020, 31, 739–756. [Google Scholar] [CrossRef] [Scilit]
- Sun, J.; Na, H.; Yan, T.; Che, Z.; Qiu, Z.; Yuan, Y.; Li, Y.; Du, T.; Song, Y.; Fang, X. Cost–benefit assessment of manufacturing system using comprehensive value flow analysis. Appl. Energy 2022, 310, 118604. [Google Scholar] [CrossRef] [Scilit]
- Dieste, M.; Panizzolo, R.; Garza-Reyes, J.A.; Anosike, A. The relationship between lean and environmental performance: Practices and measures. J. Clean. Prod. 2019, 224, 120–131. [Google Scholar] [CrossRef] [Scilit]
- Papetti, A.; Menghi, R.; Di Domizio, G.; Germani, M.; Marconi, M. Resources value mapping: A method to assess the resource efficiency of manufacturing systems. Appl. Energy 2019, 249, 326–342. [Google Scholar] [CrossRef] [Scilit]
- Bhakar, V.; Digalwar, A.K.; Sangwan, K.S. Sustainability assessment framework for manufacturing sector: A conceptual model. Procedia CIRP 2018, 69, 248–253. [Google Scholar] [CrossRef] [Scilit]
- Vimal, K.E.K.; Vinodh, S.; Raja, A. Modelling, assessment and deployment of strategies for ensuring sustainable shielded metal arc welding process: A case study. J. Clean. Prod. 2015, 93, 364–377. [Google Scholar] [CrossRef] [Scilit]
- Digalwar, A.K.; Dambhare, S.; Saraswat, S. Social sustainability assessment framework for Indian manufacturing industry. Mater. Today Proc. 2020, 28, 591–598. [Google Scholar] [CrossRef] [Scilit]
- Gani, A.; James, A.T.; Asjad, M.; Talib, F. Development of a manufacturing sustainability index for MSMEs using a structural approach. J. Clean. Prod. 2022, 353, 131687. [Google Scholar] [CrossRef] [Scilit]
- Kumar, N.; Kaliyan, M.; Thilak, M.; Acevedo-Duque, Á. Identification of specific metrics for sustainable lean manufacturing in the automobile industries. Benchmarking Int. J. 2021, 29, 1957–1978. [Google Scholar] [CrossRef] [Scilit]
- Santos, J.; Muñoz-Villamizar, A.; Ormazábal, M.; Viles, E. Using problem-oriented monitoring to simultaneously improve productivity and environmental performance in manufacturing companies. Int. J. Comput. Integr. Manuf. 2019, 32, 183–193. [Google Scholar] [CrossRef] [Scilit]
- Brundage, M.P.; Bernstein, W.Z.; Hoffenson, S.; Chang, Q.; Nishi, H.; Kliks, T.; Morris, K.C. Analyzing environmental sustainability methods for use earlier in the product lifecycle. J. Clean. Prod. 2018, 187, 877–892. [Google Scholar] [CrossRef] [Scilit]
- Eskandari, M.; Hamid, M.; Masoudian, M.; Rabbani, M. An integrated lean production–sustainability framework for evaluation and improvement of the performance of pharmaceutical factory. J. Clean. Prod. 2022, 376, 134132. [Google Scholar] [CrossRef] [Scilit]
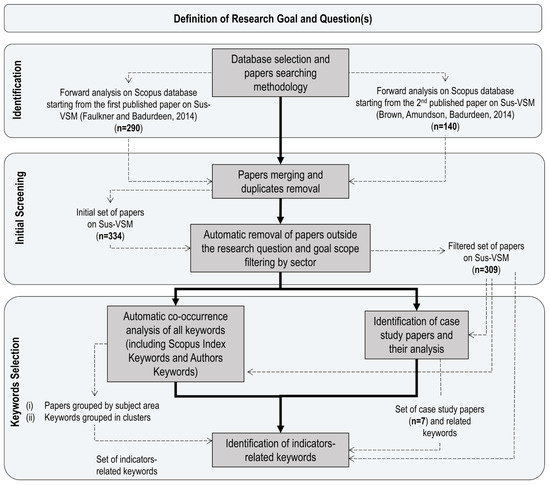
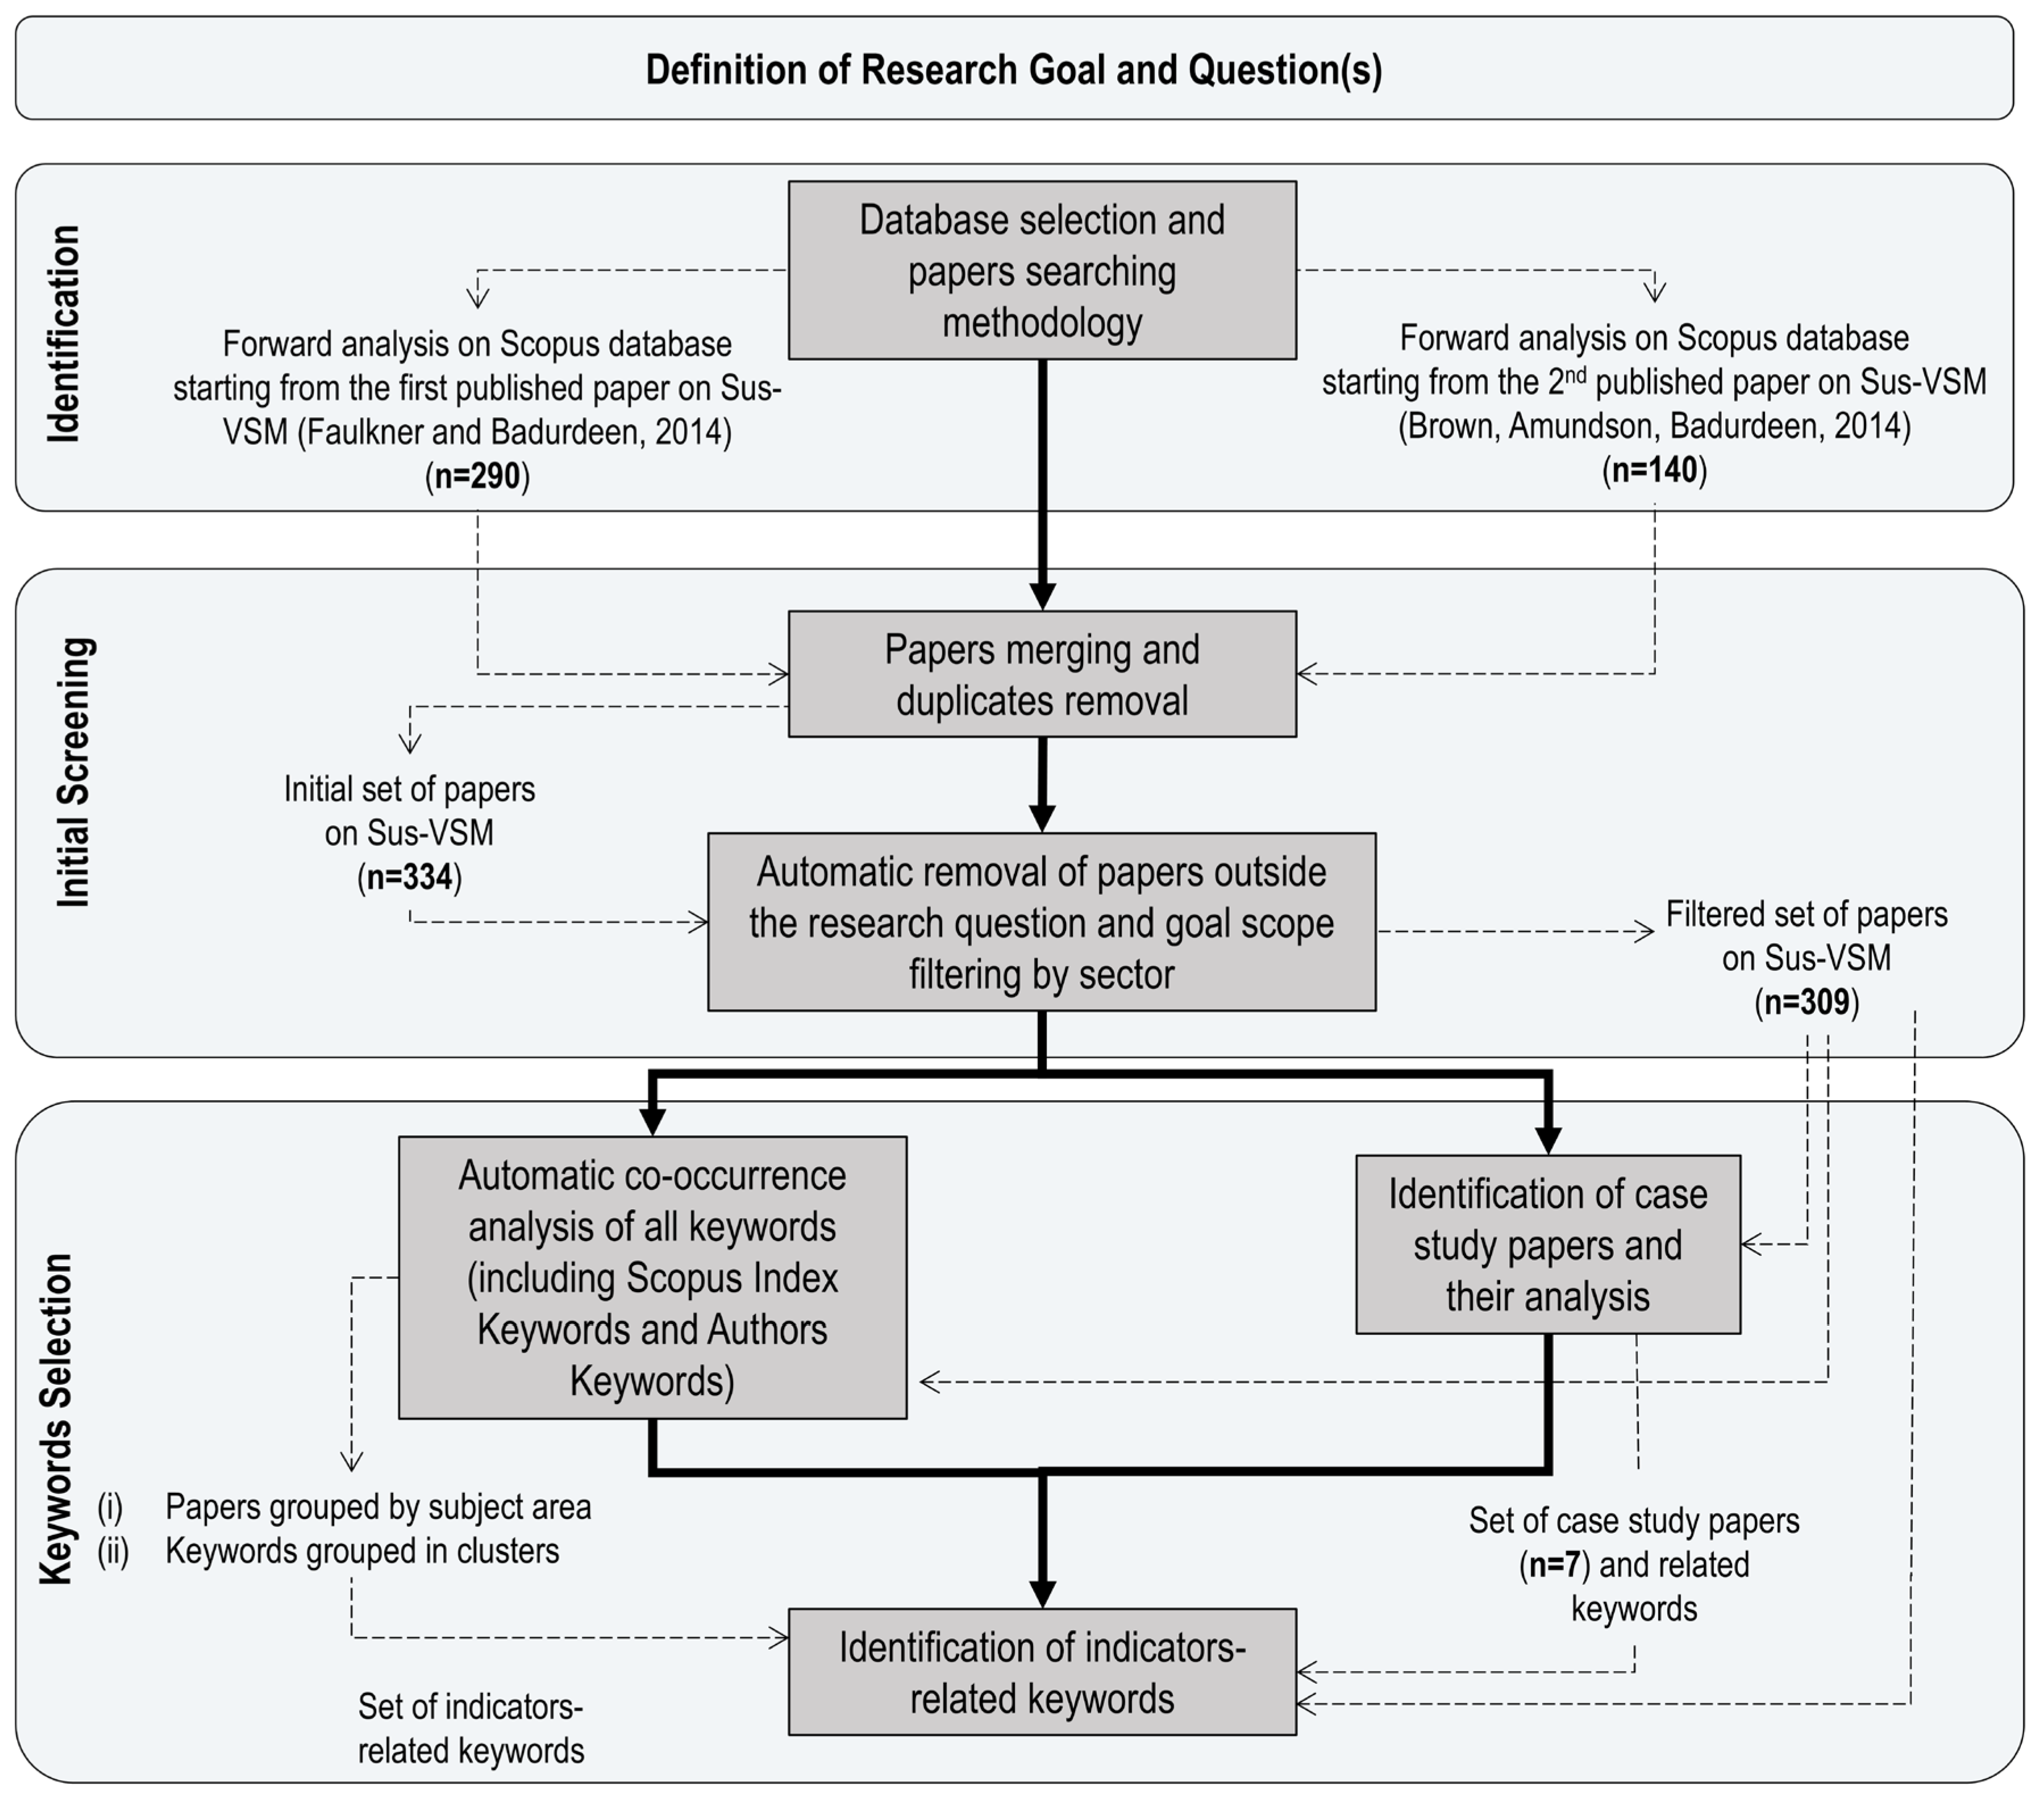
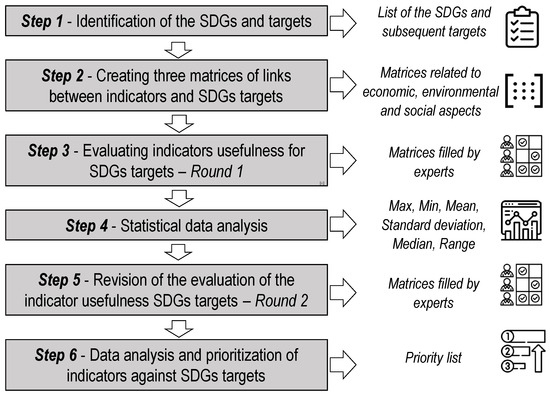
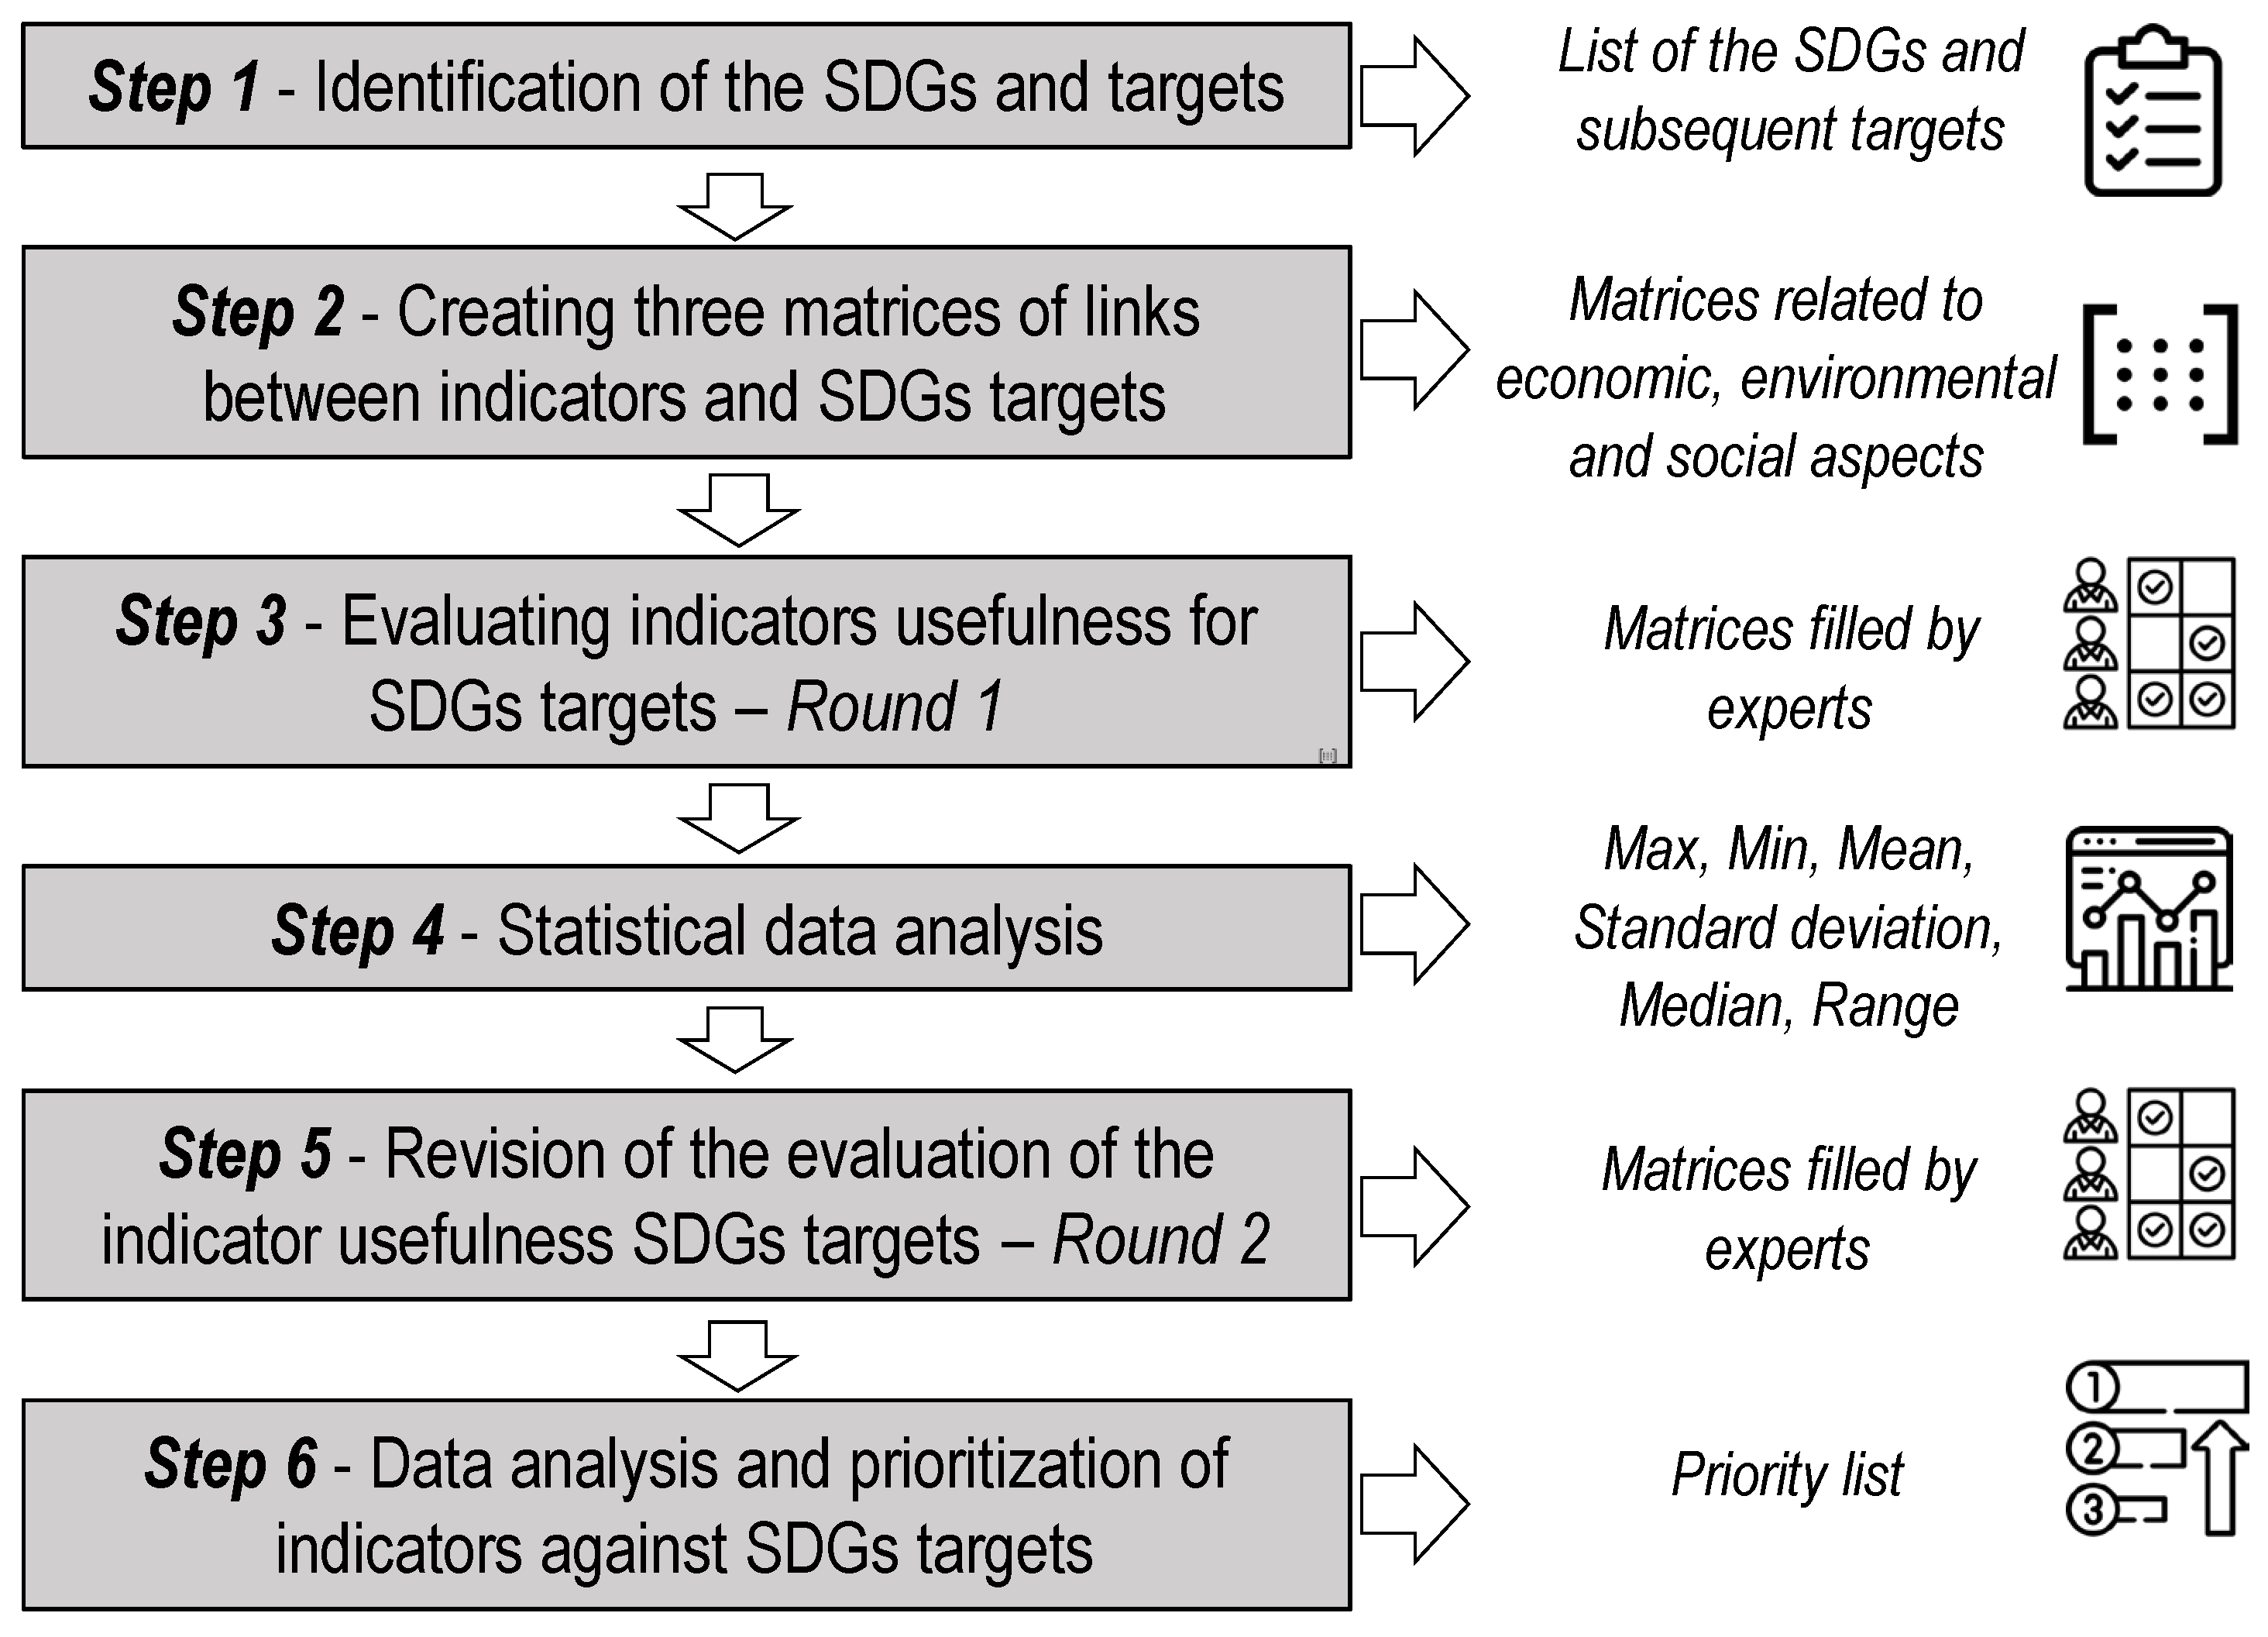
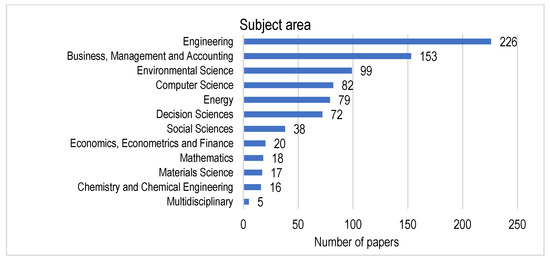
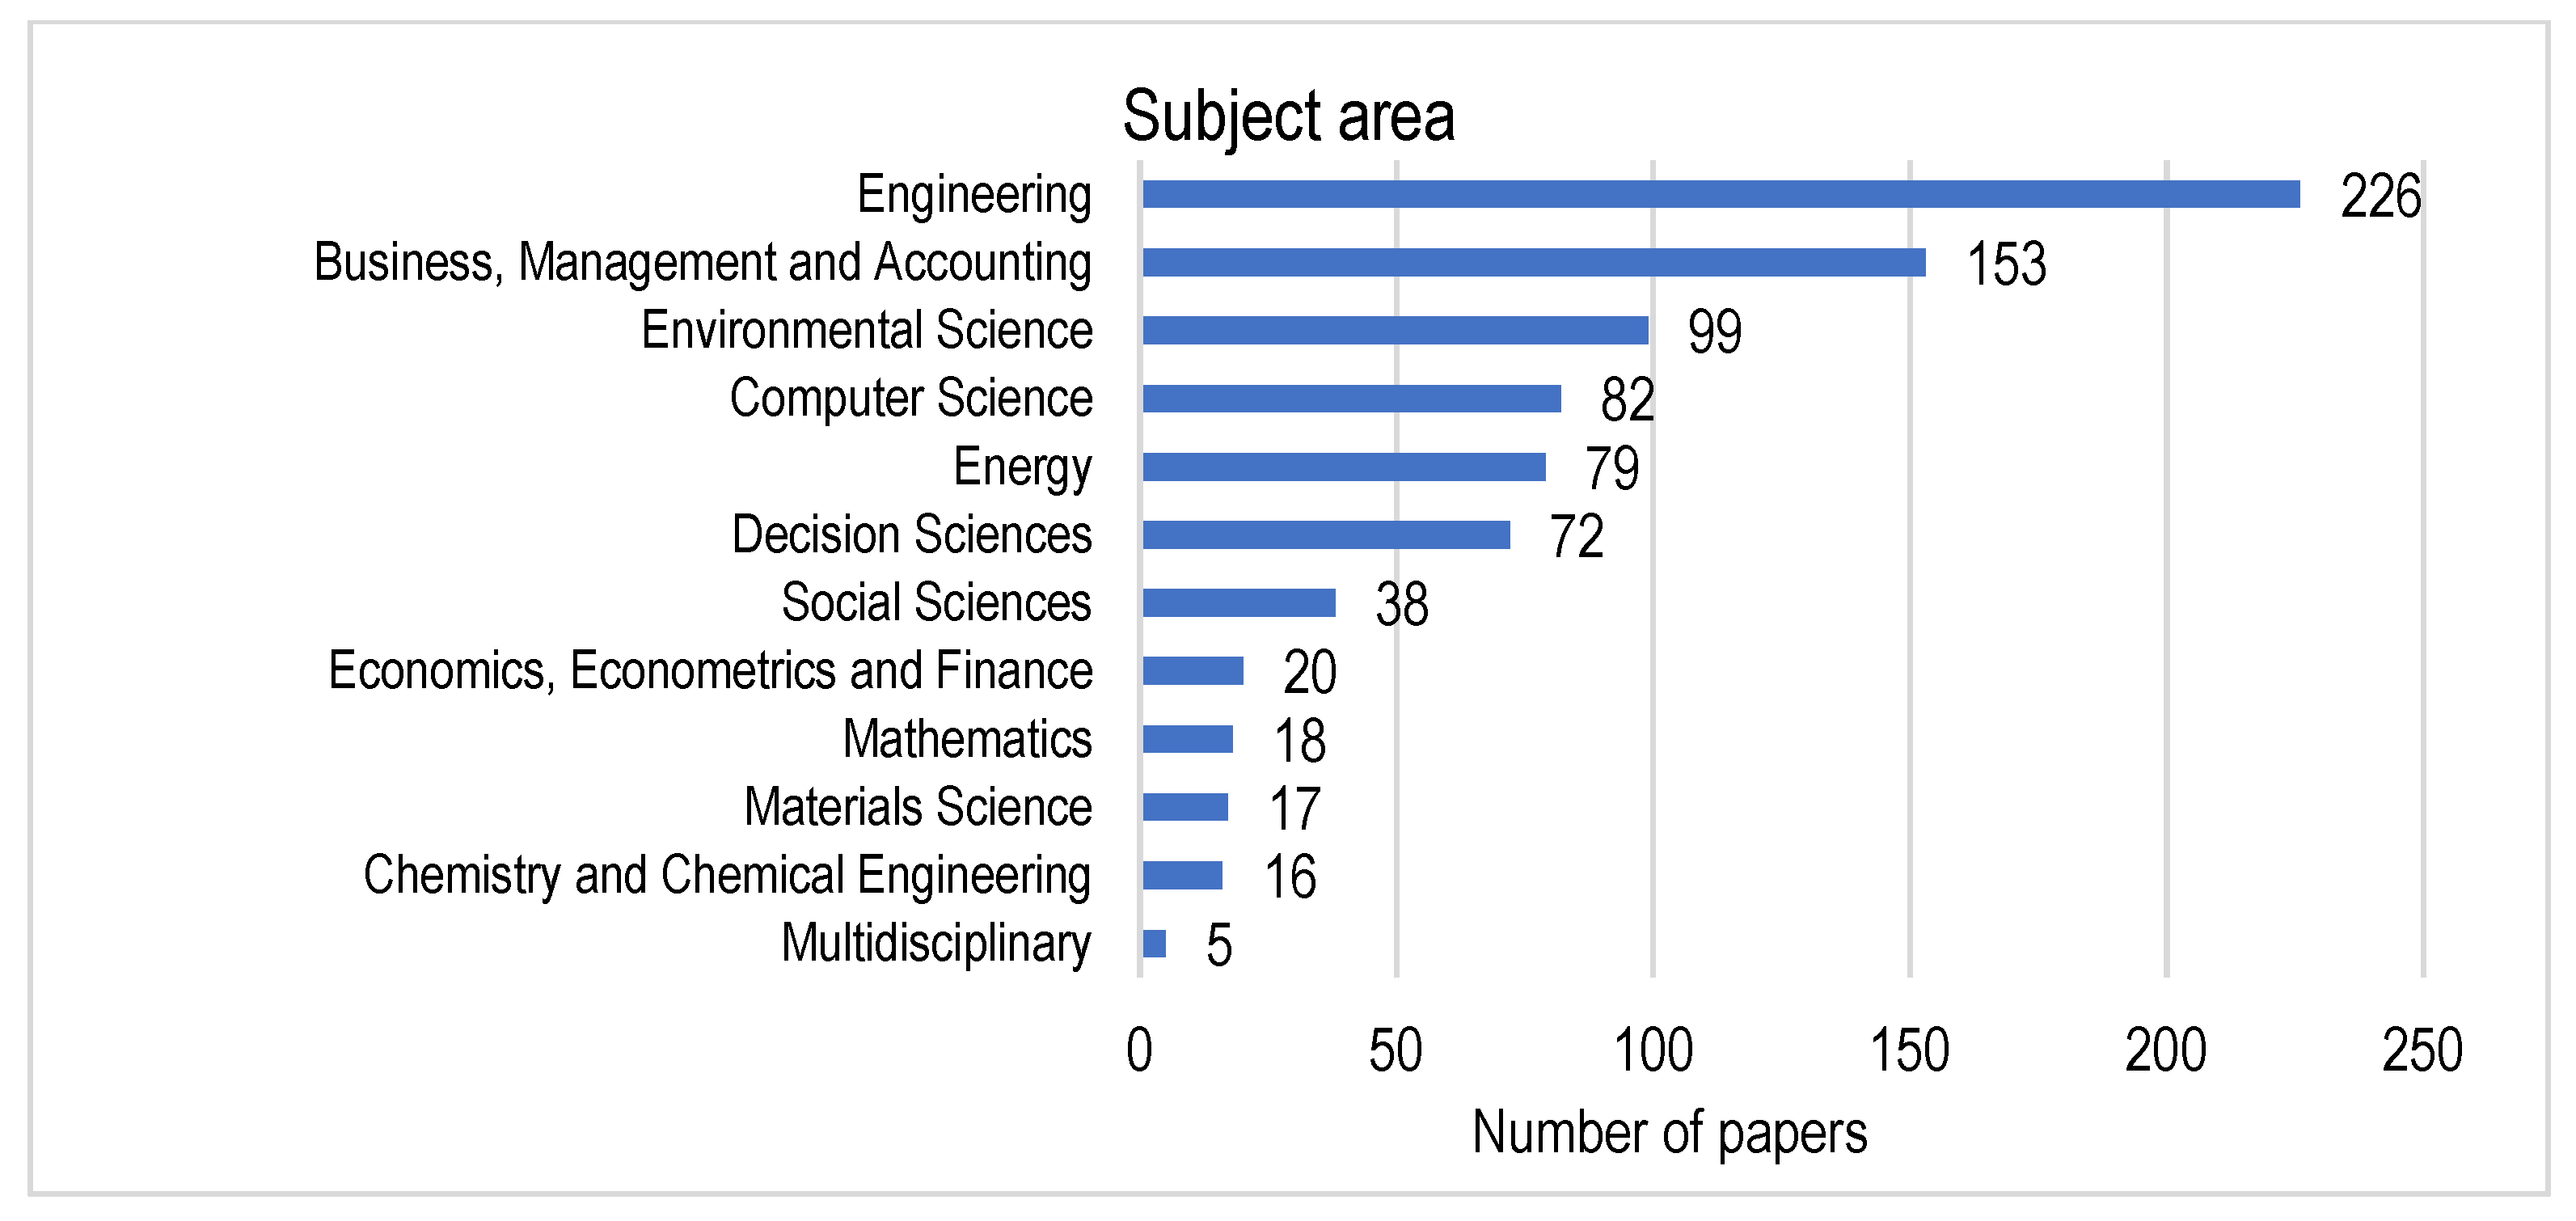
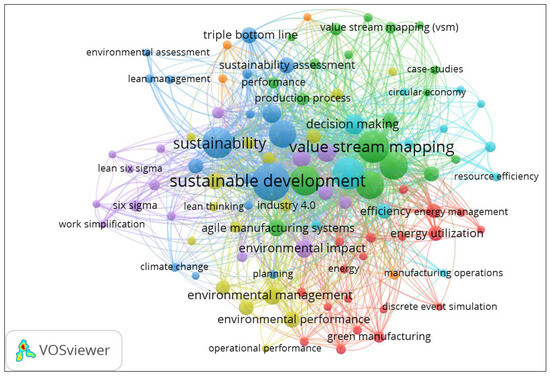
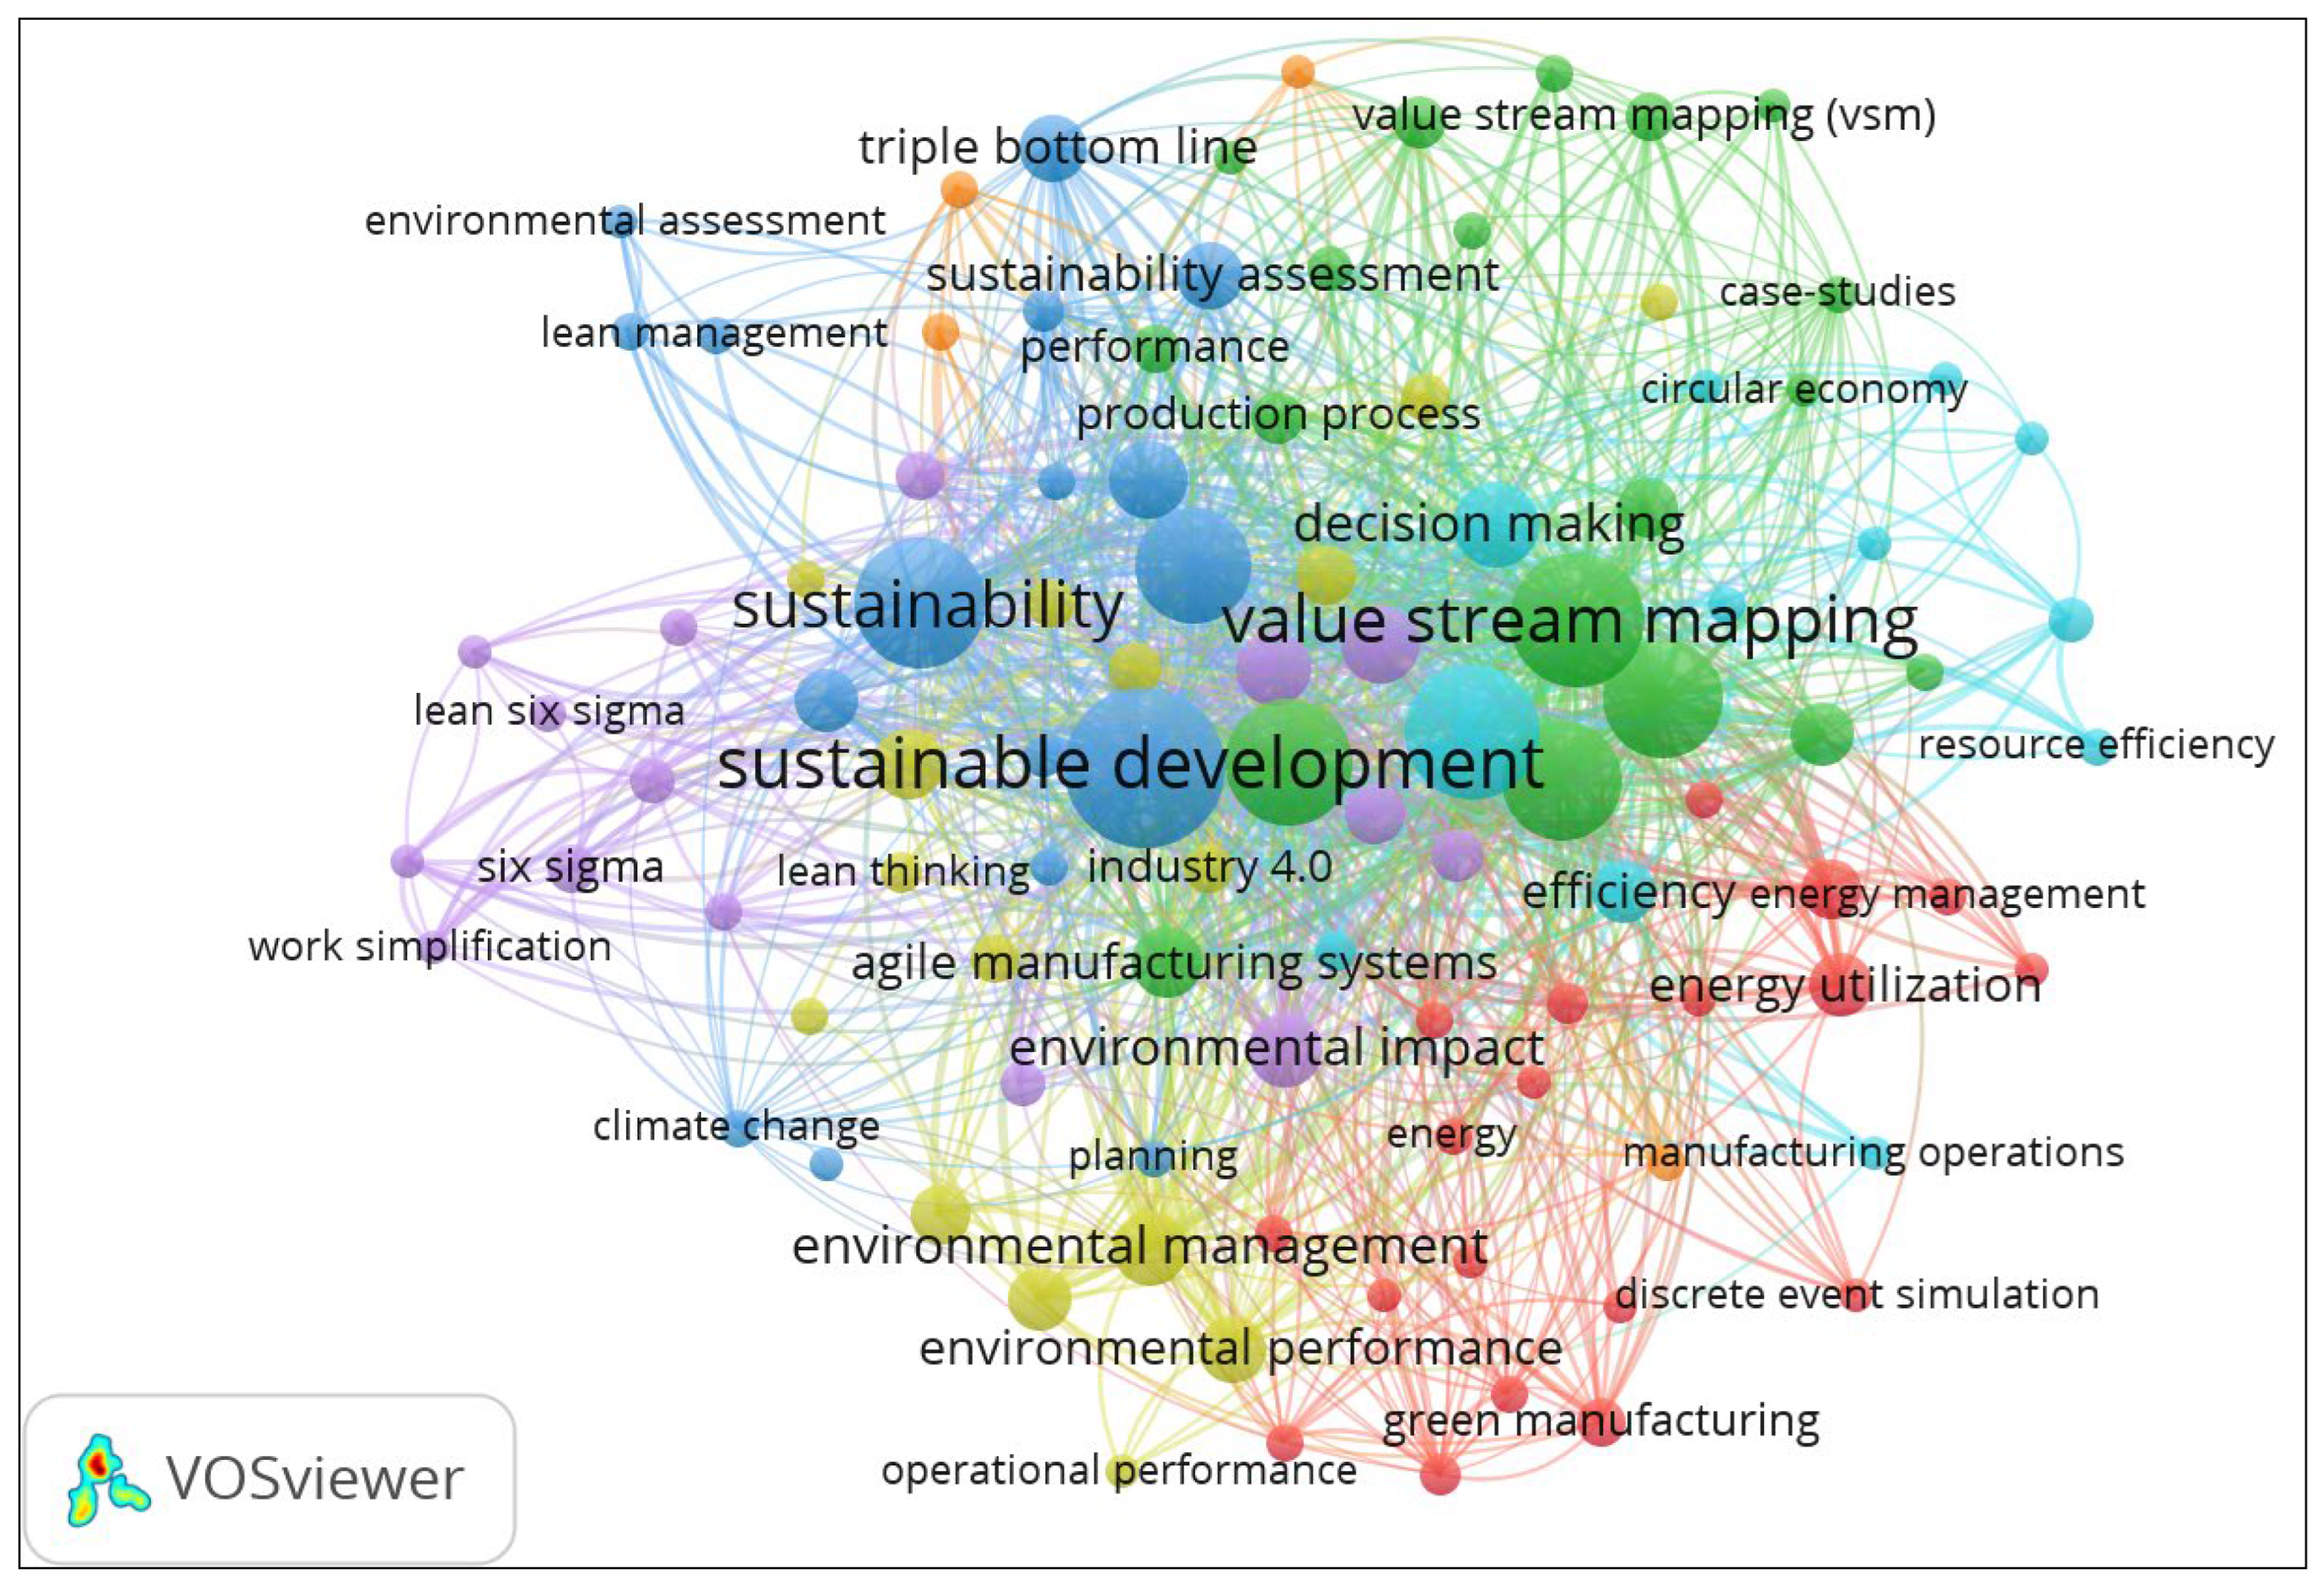
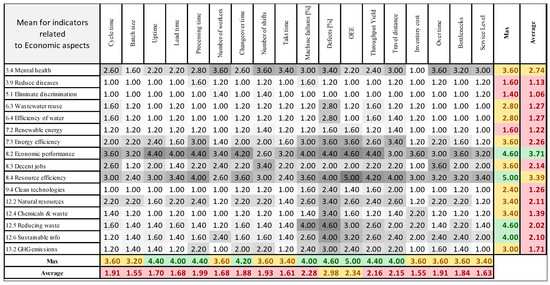
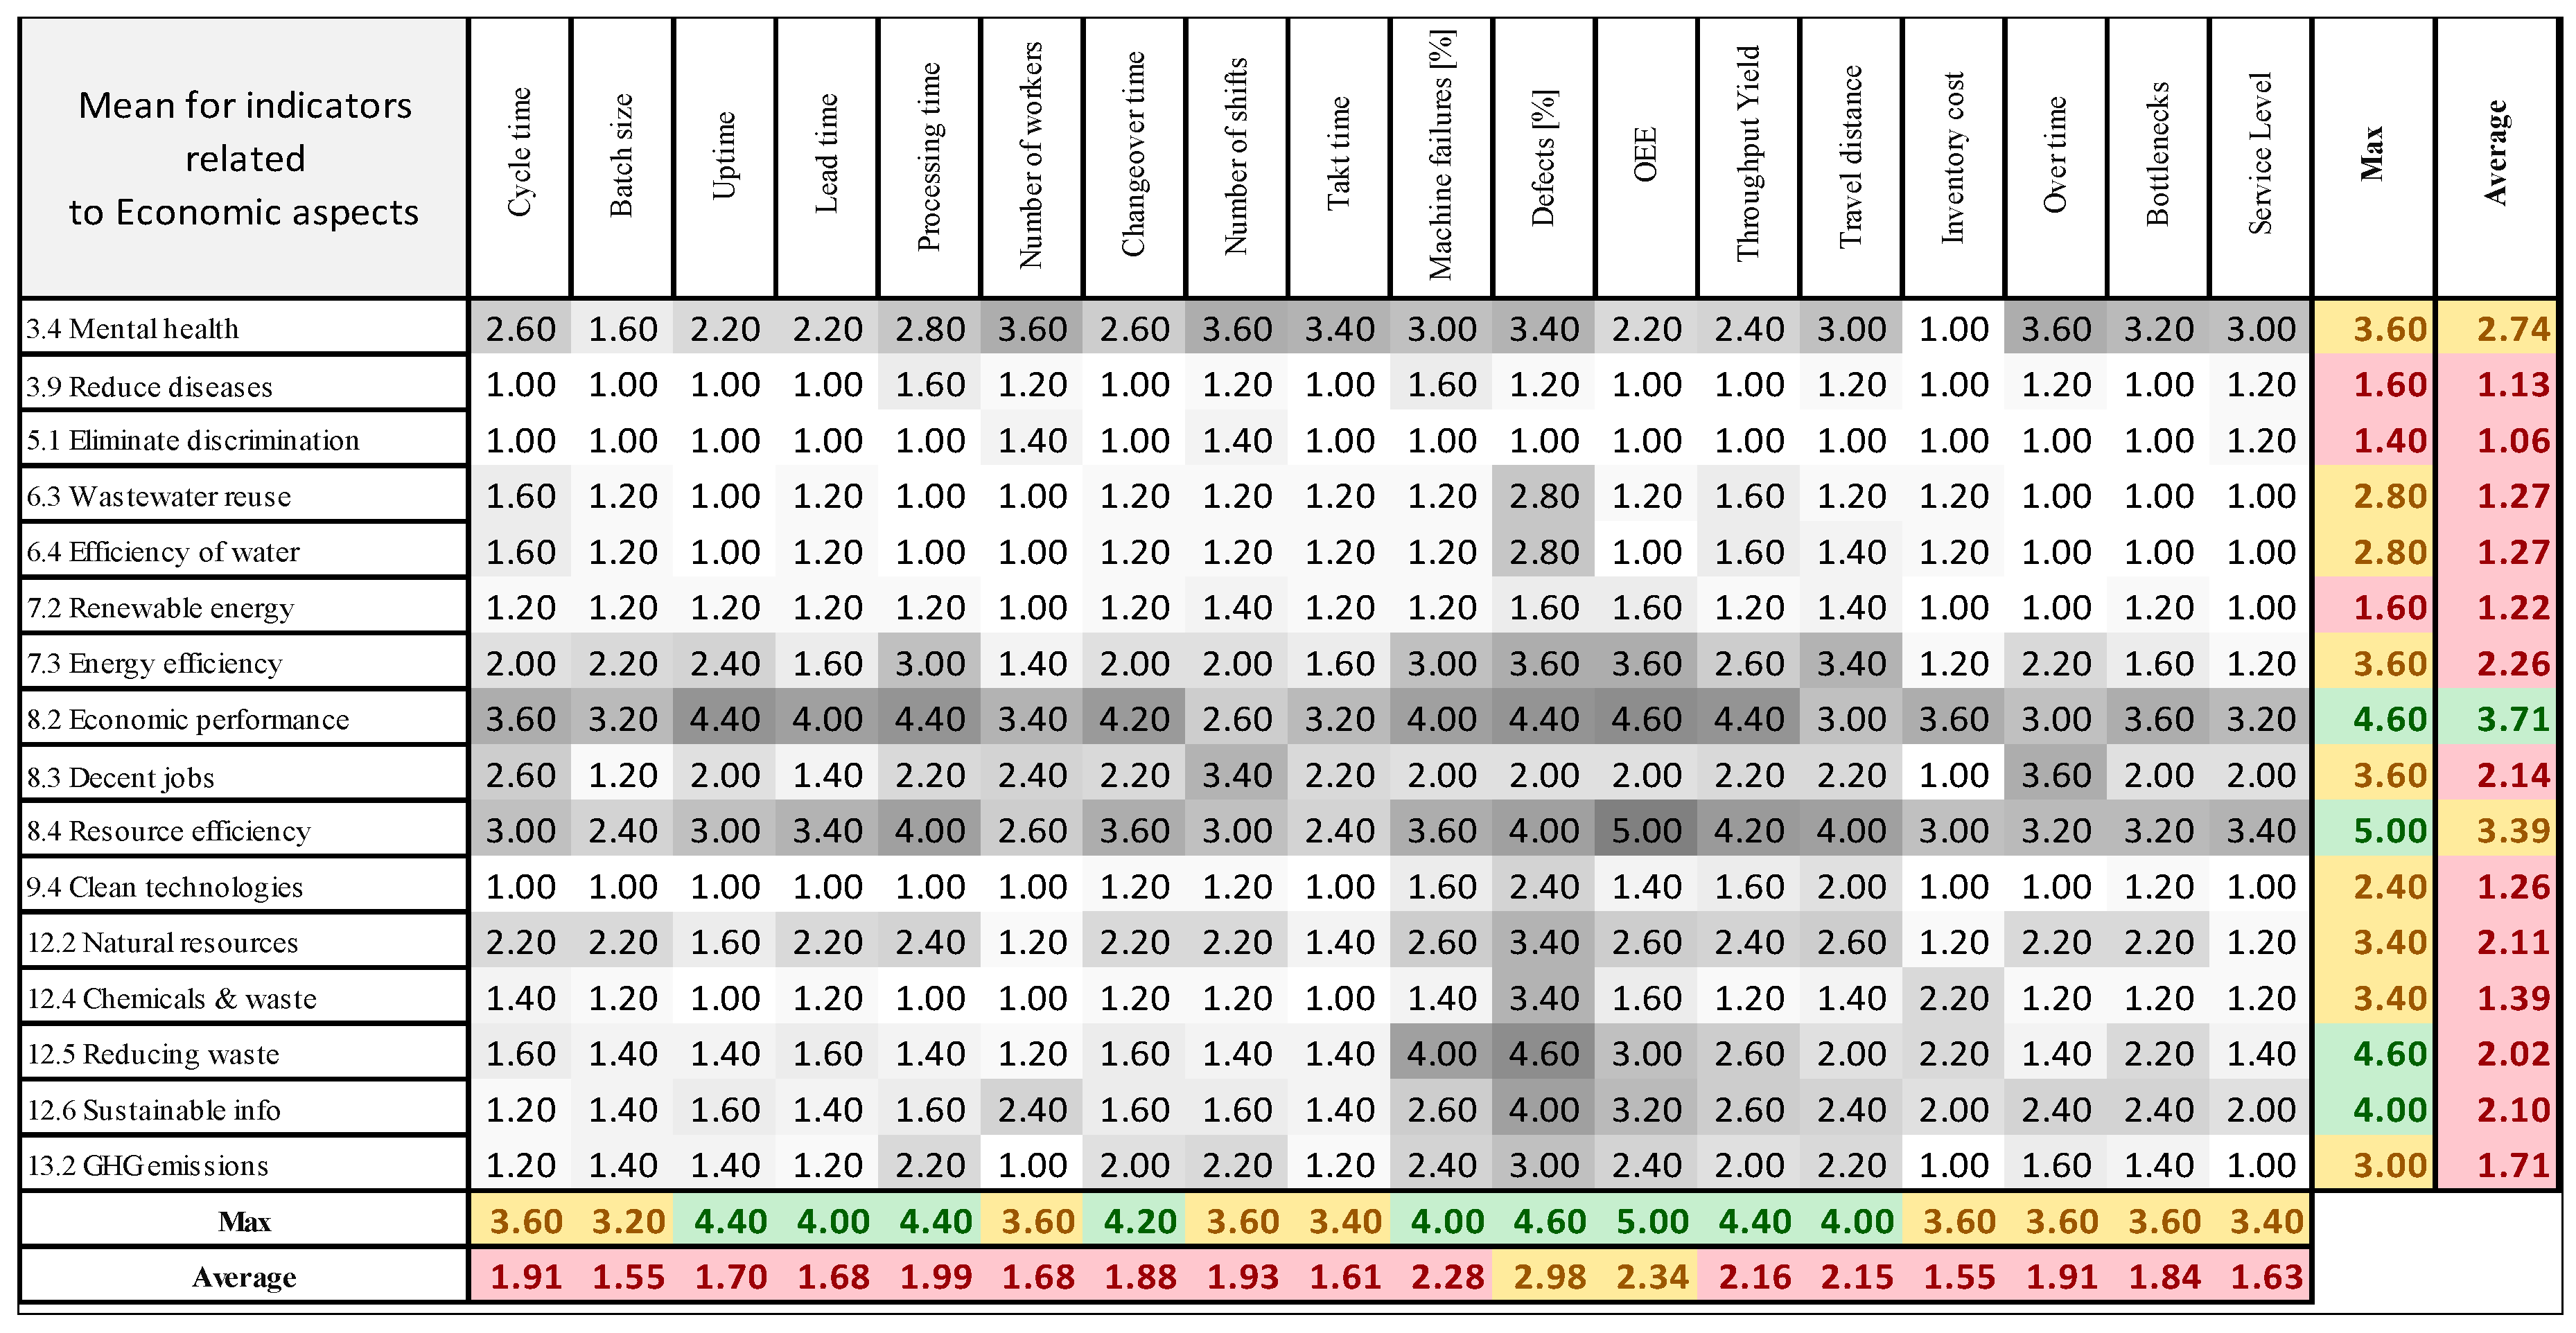
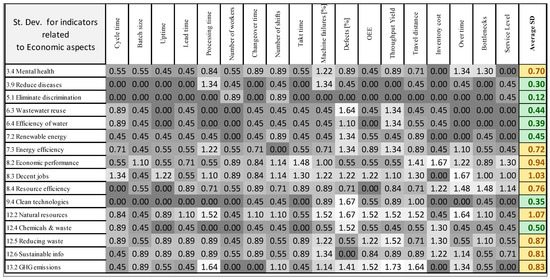
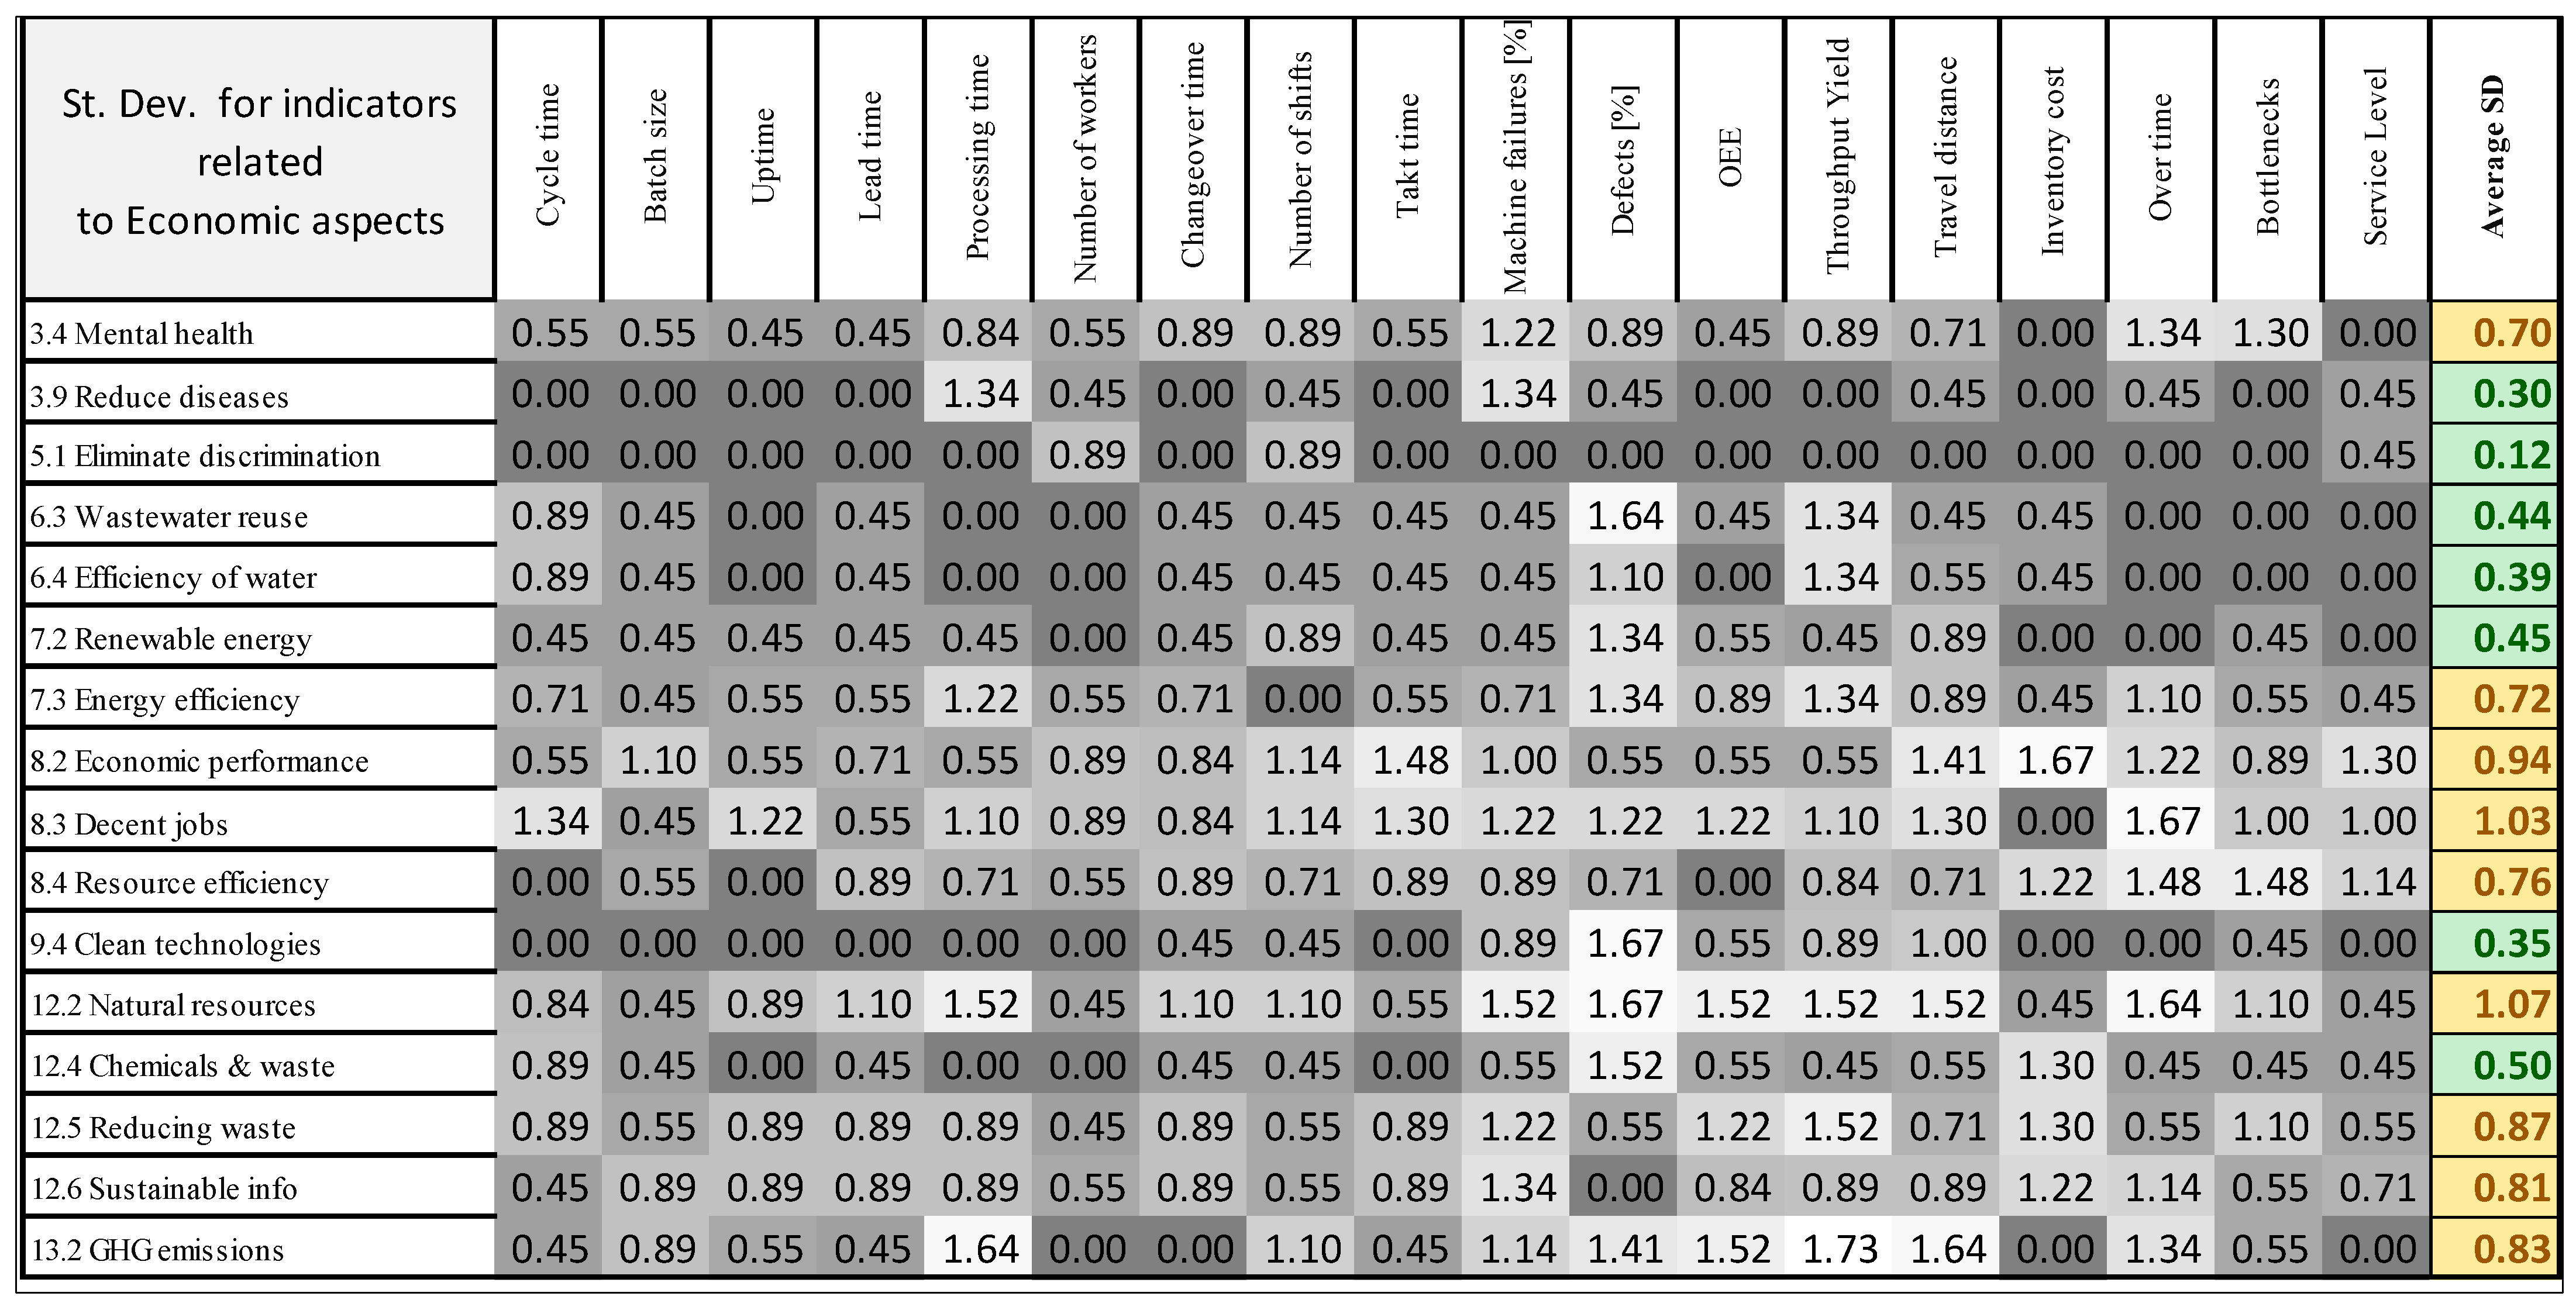
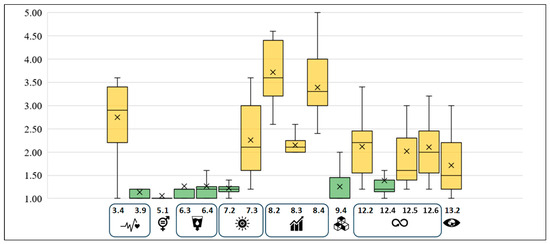
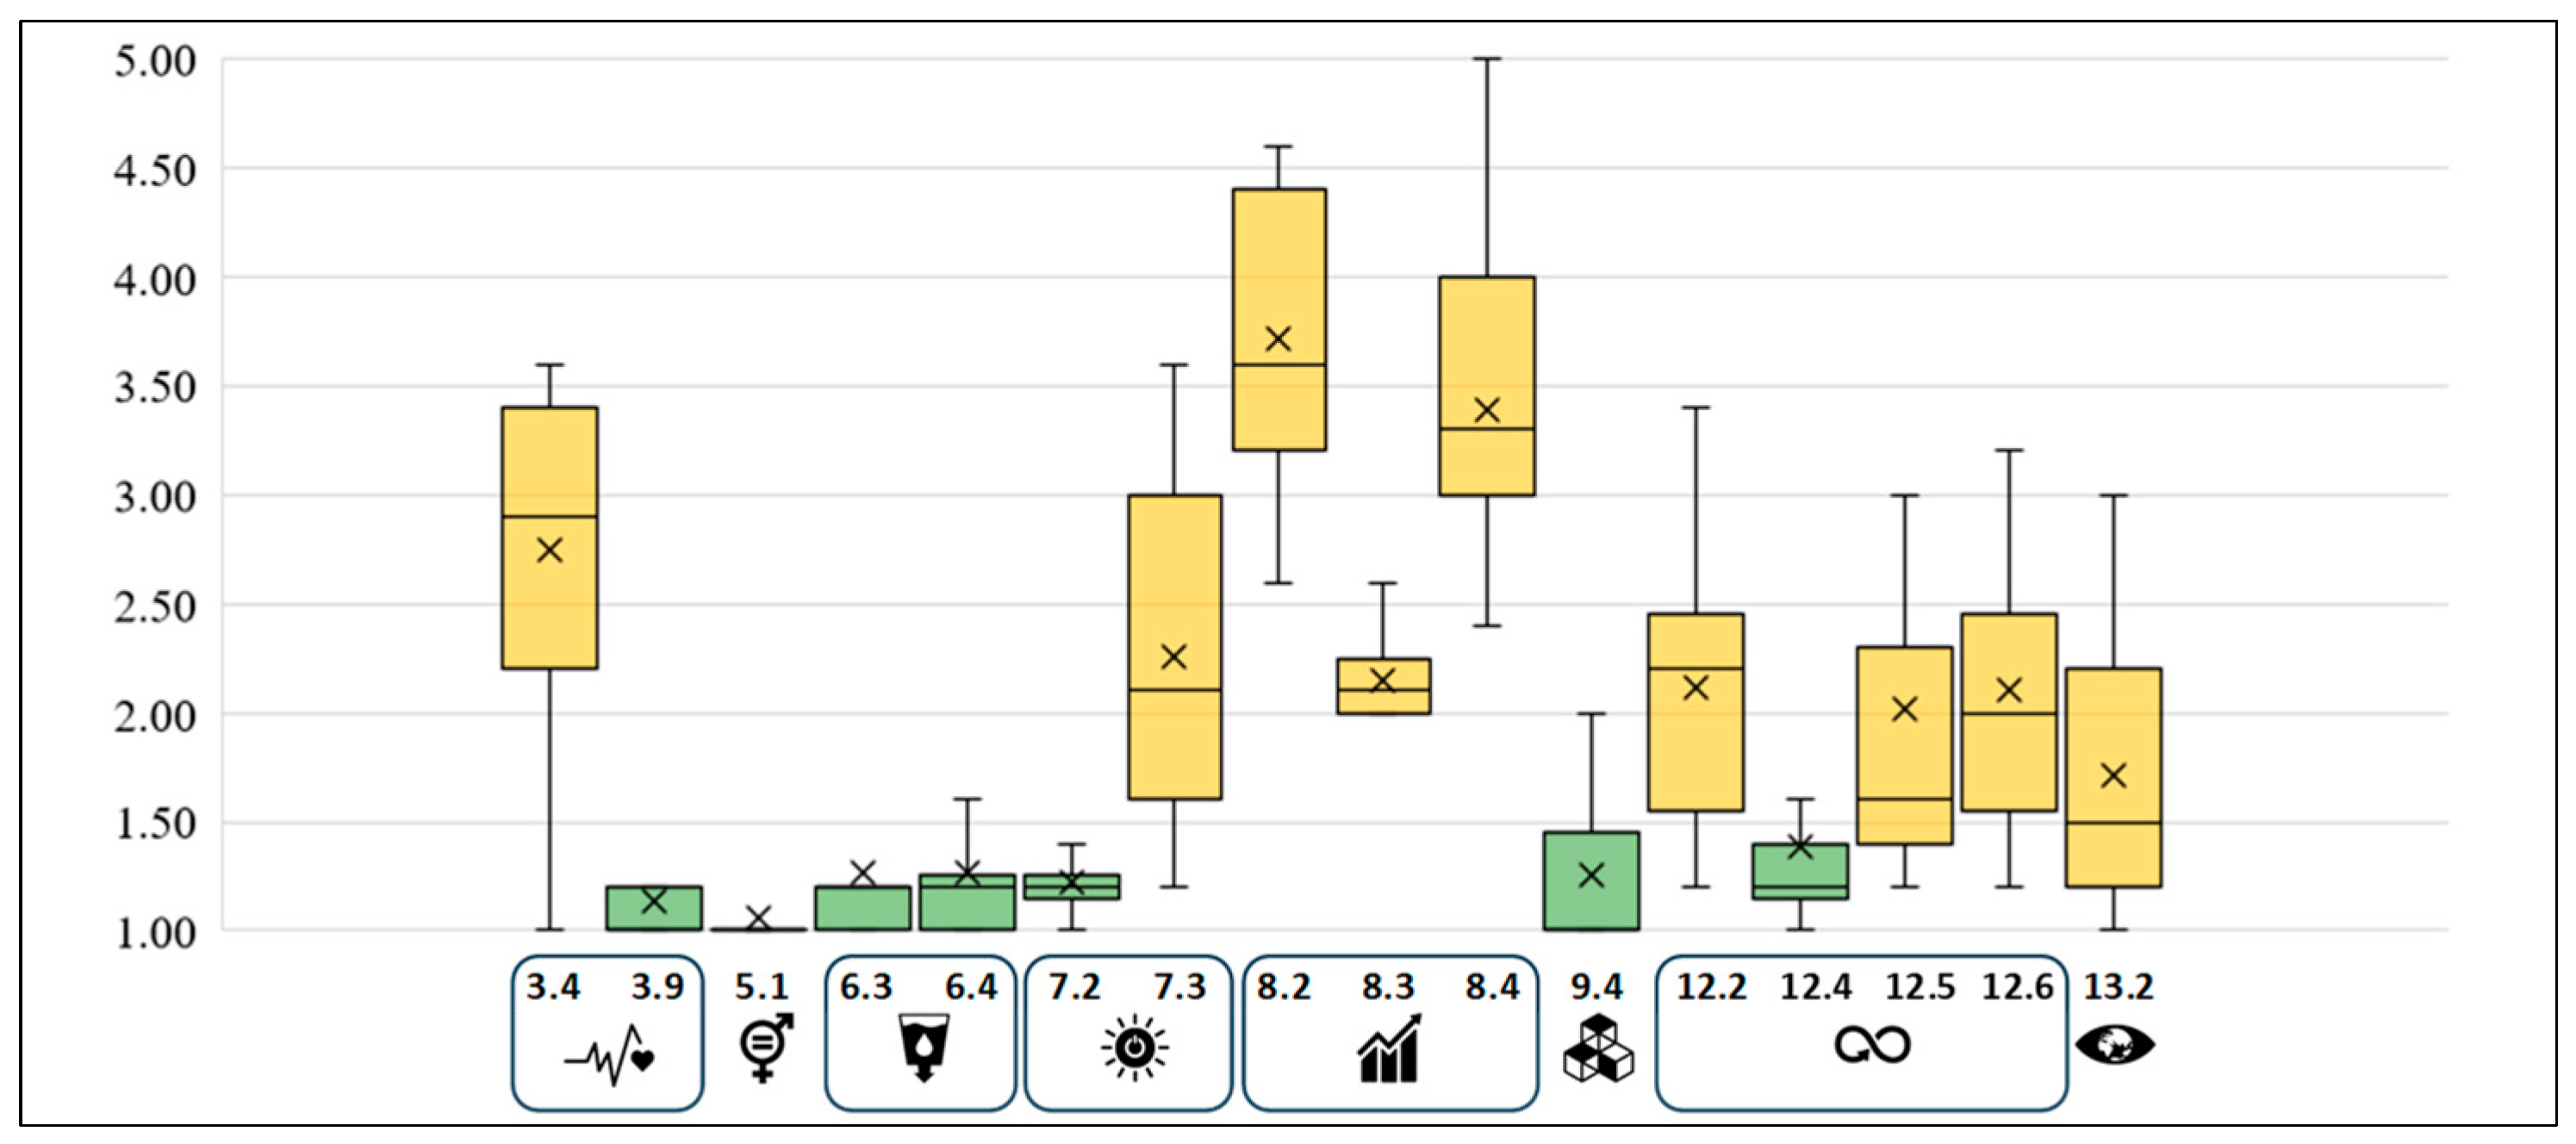
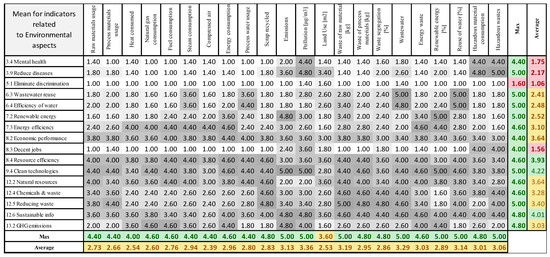
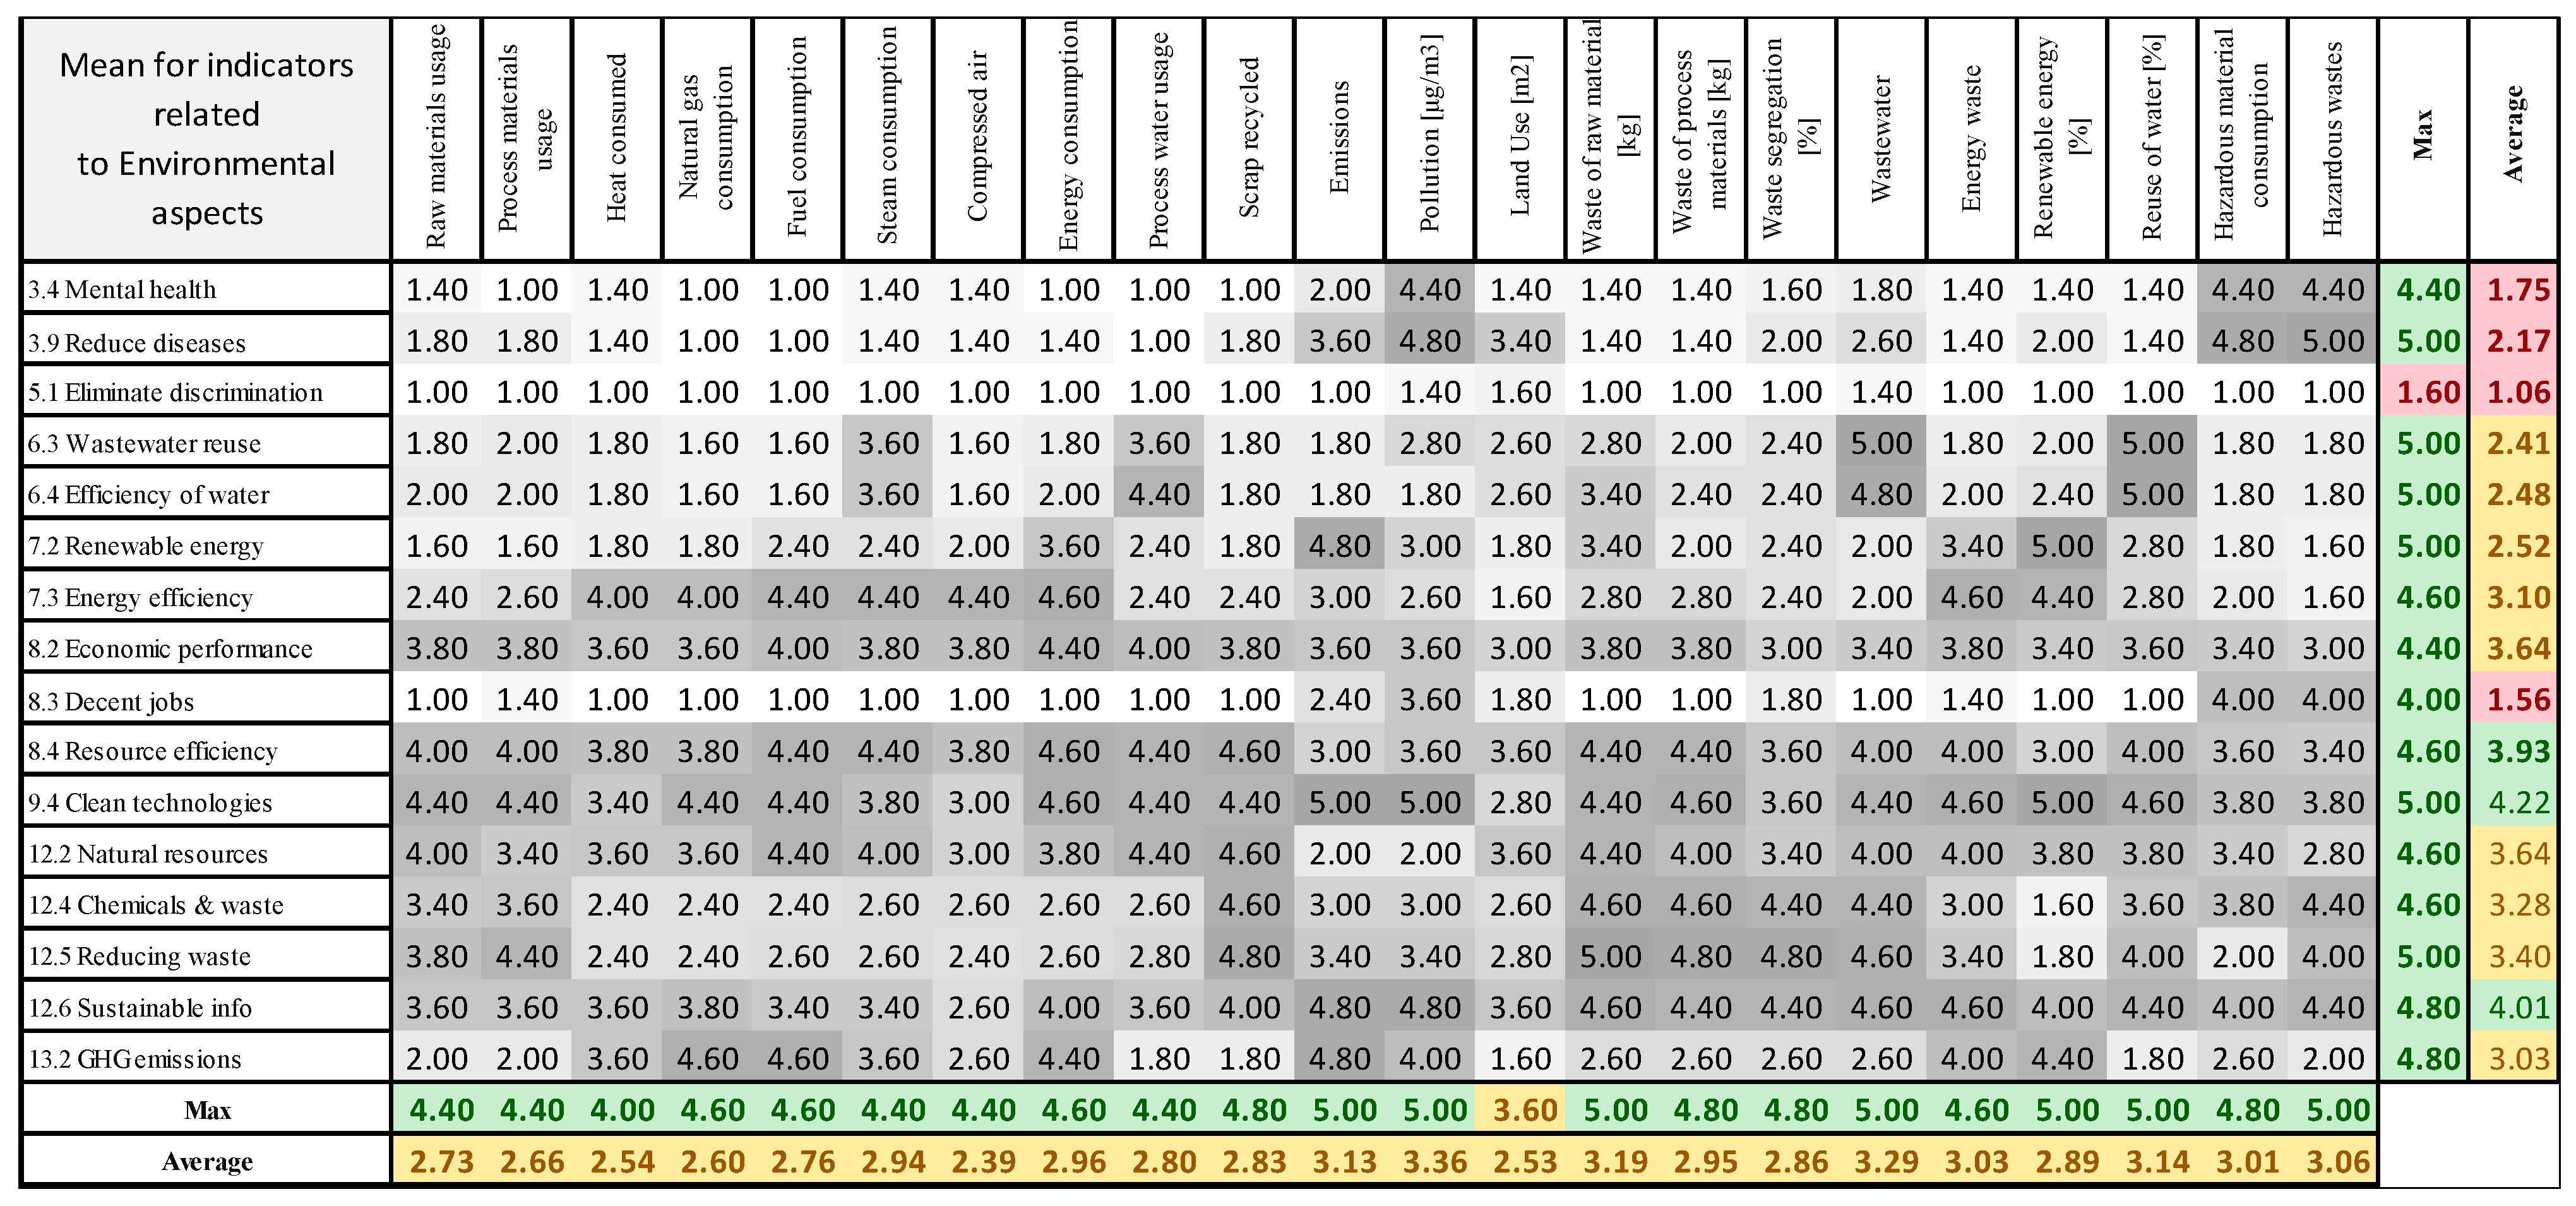
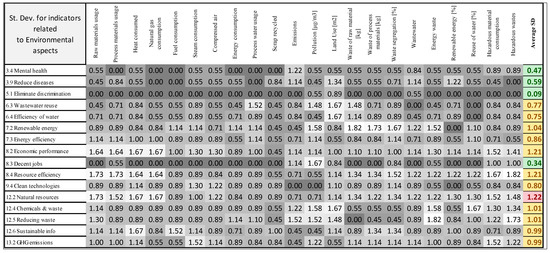
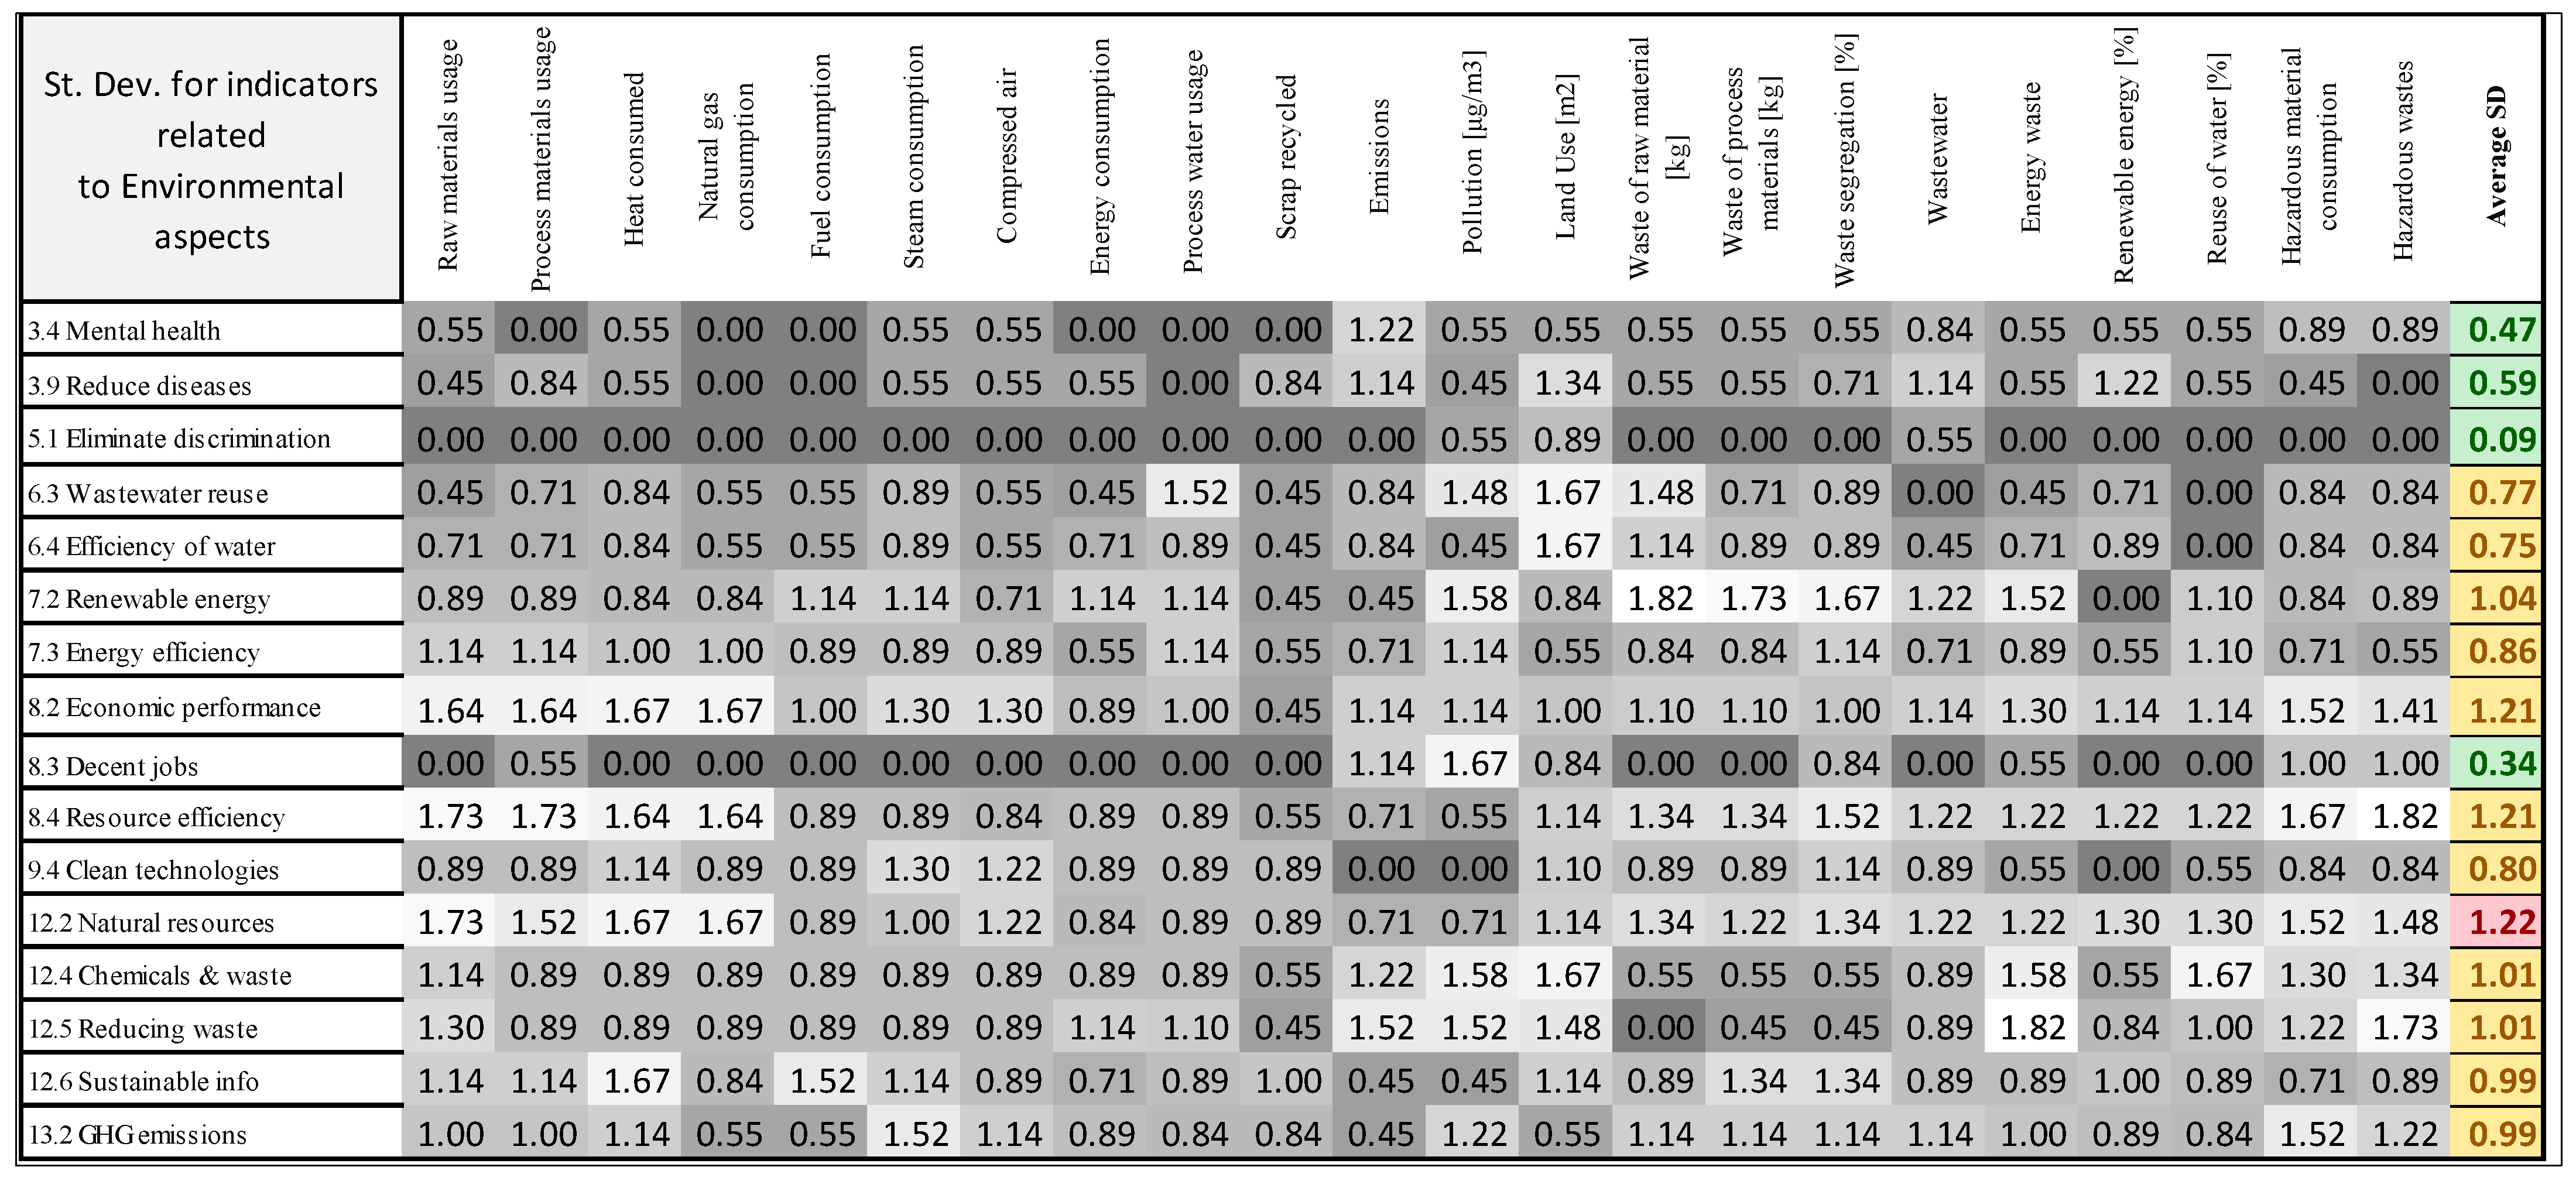
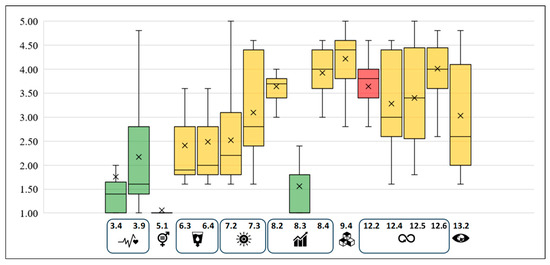
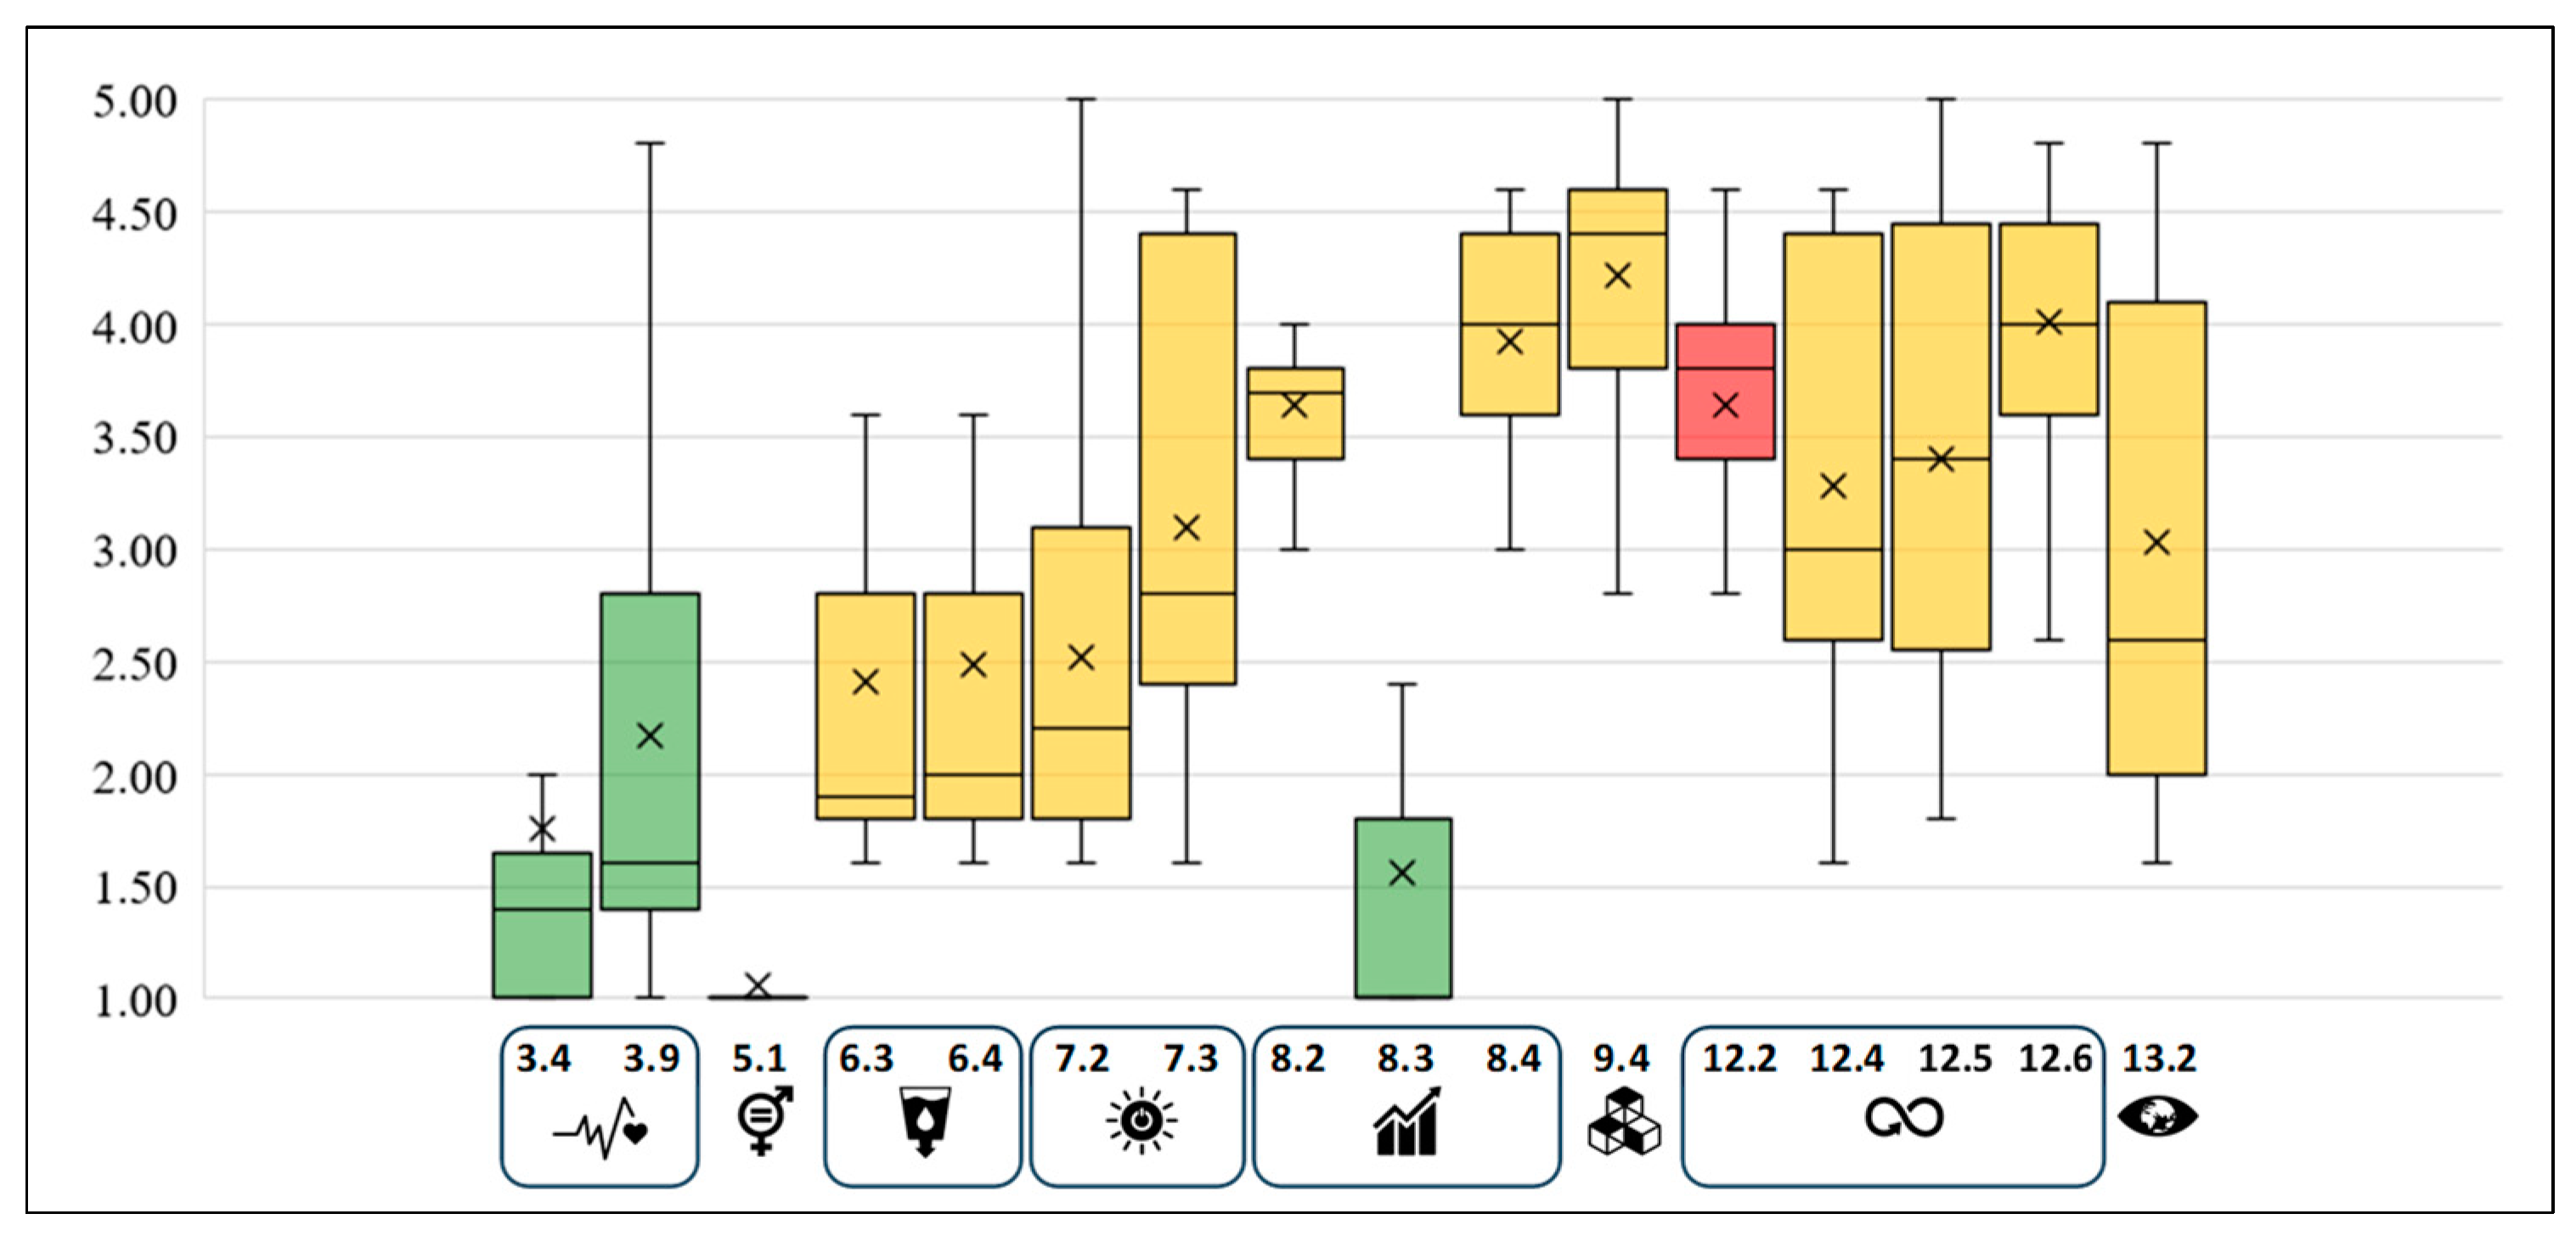
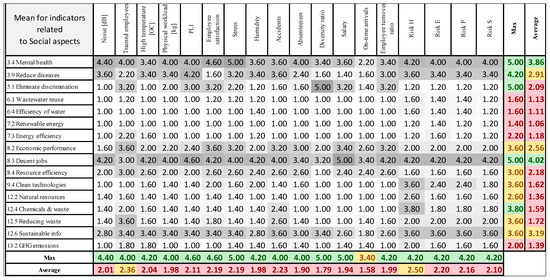
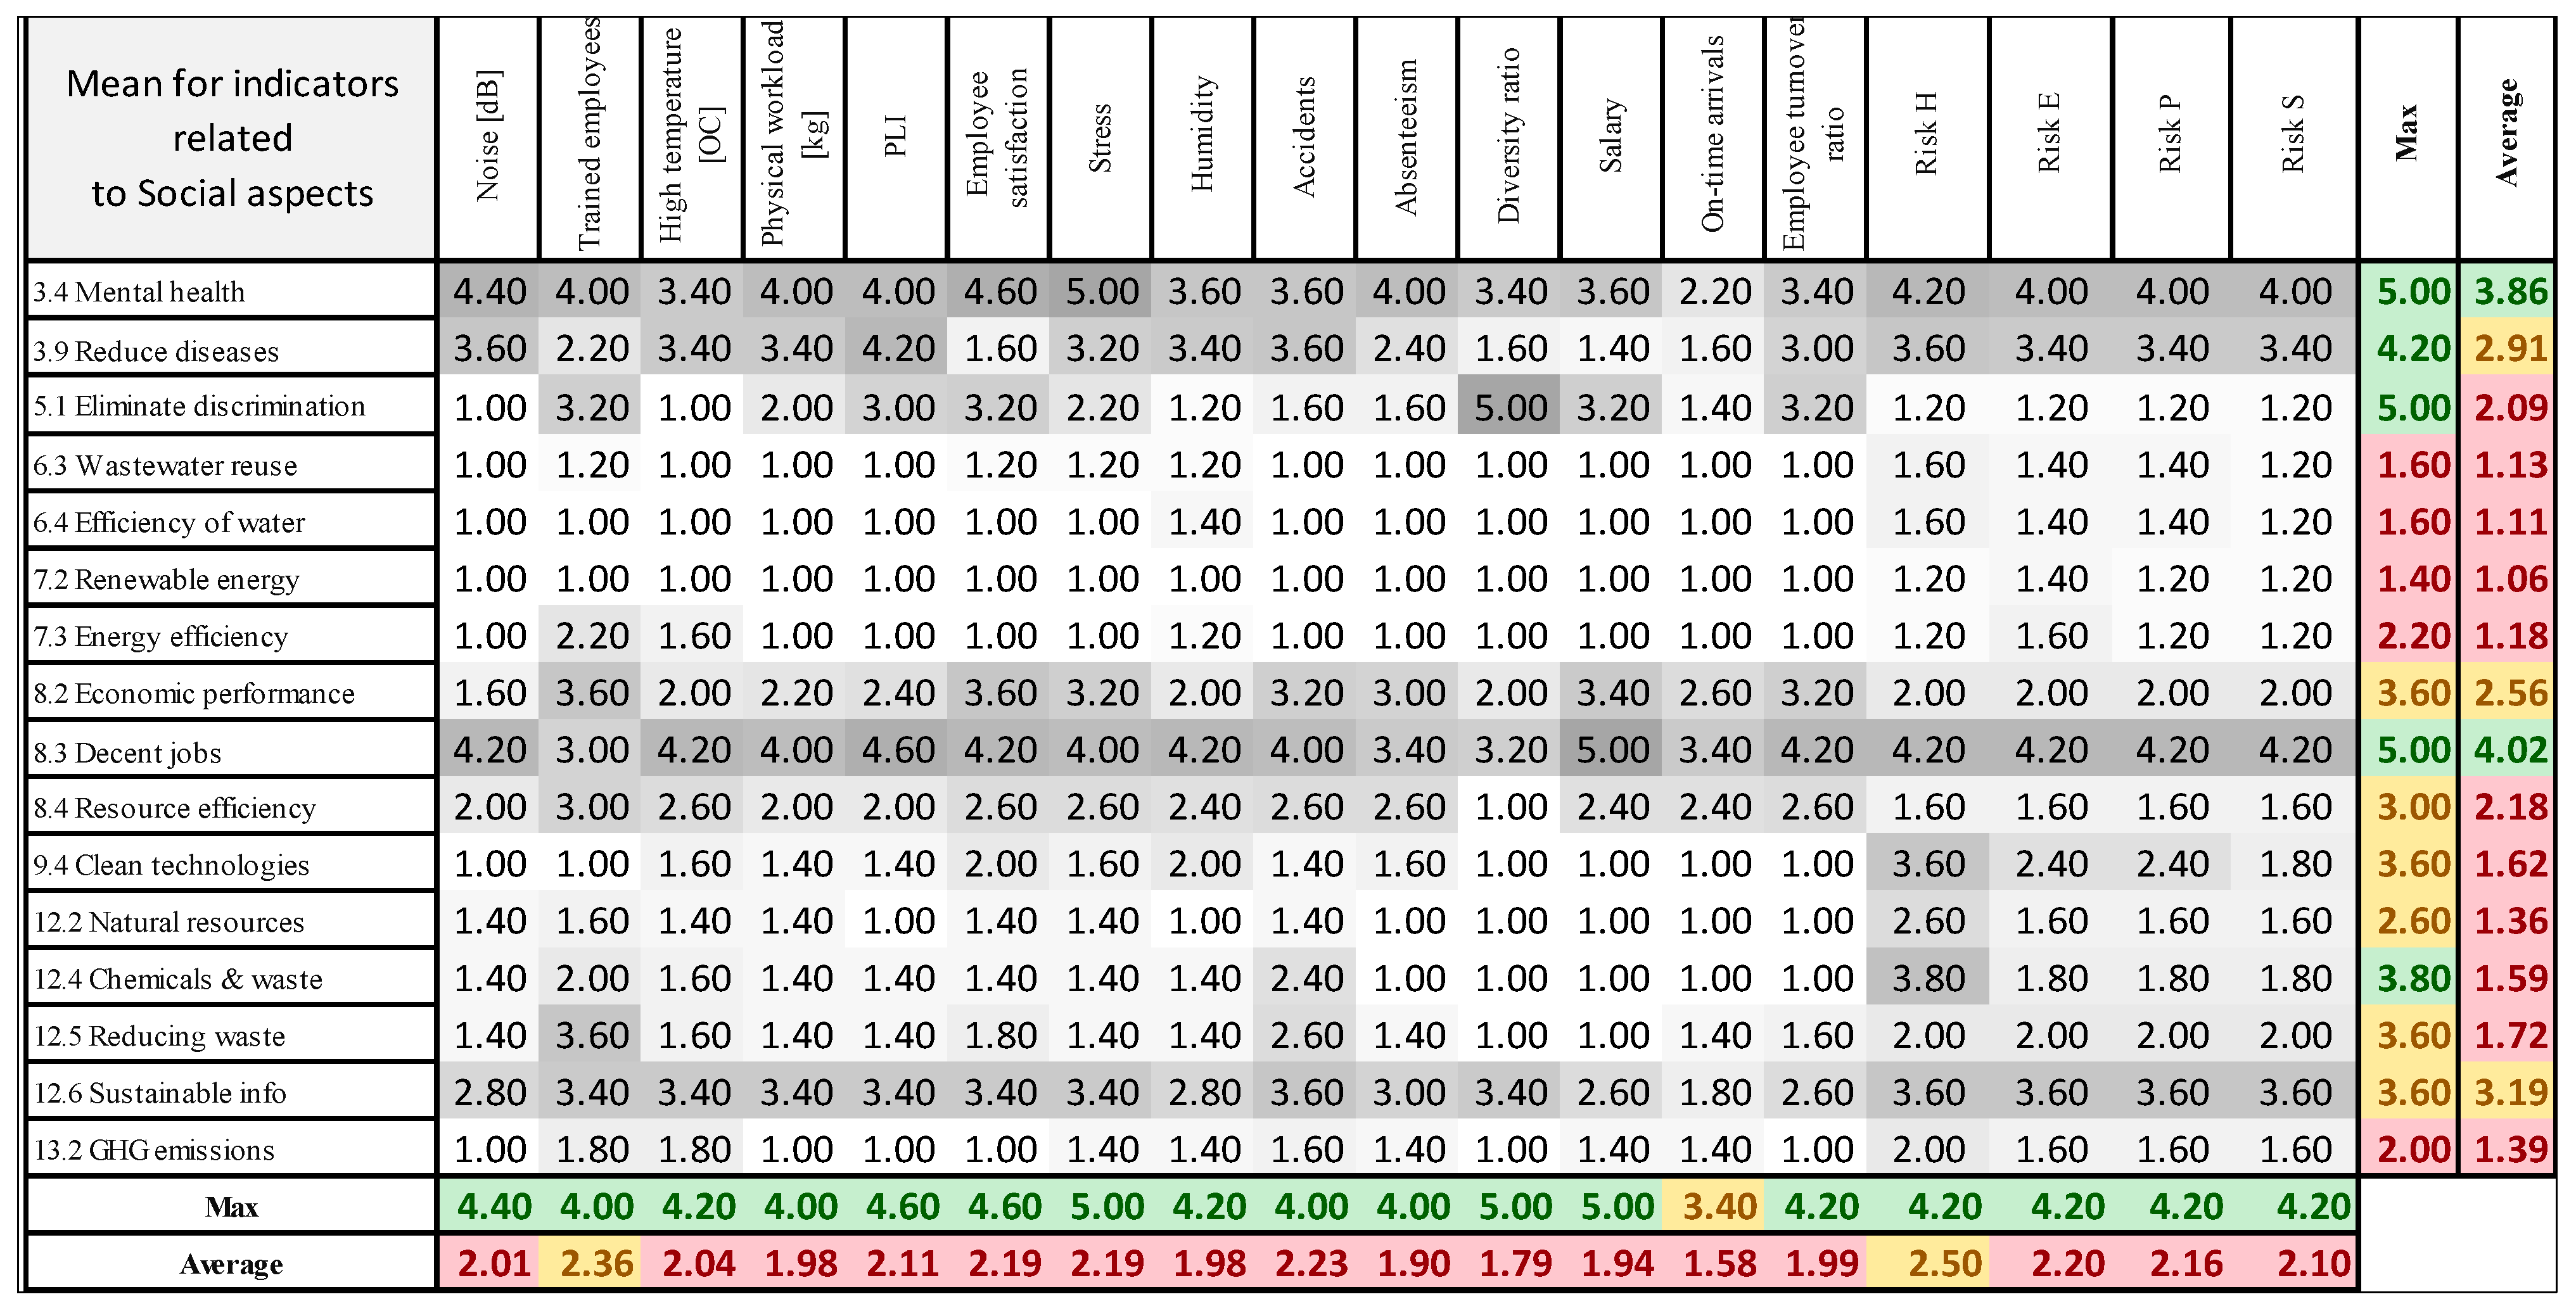
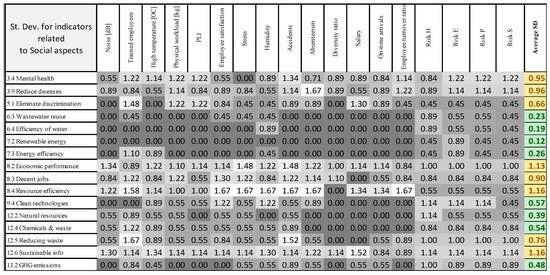
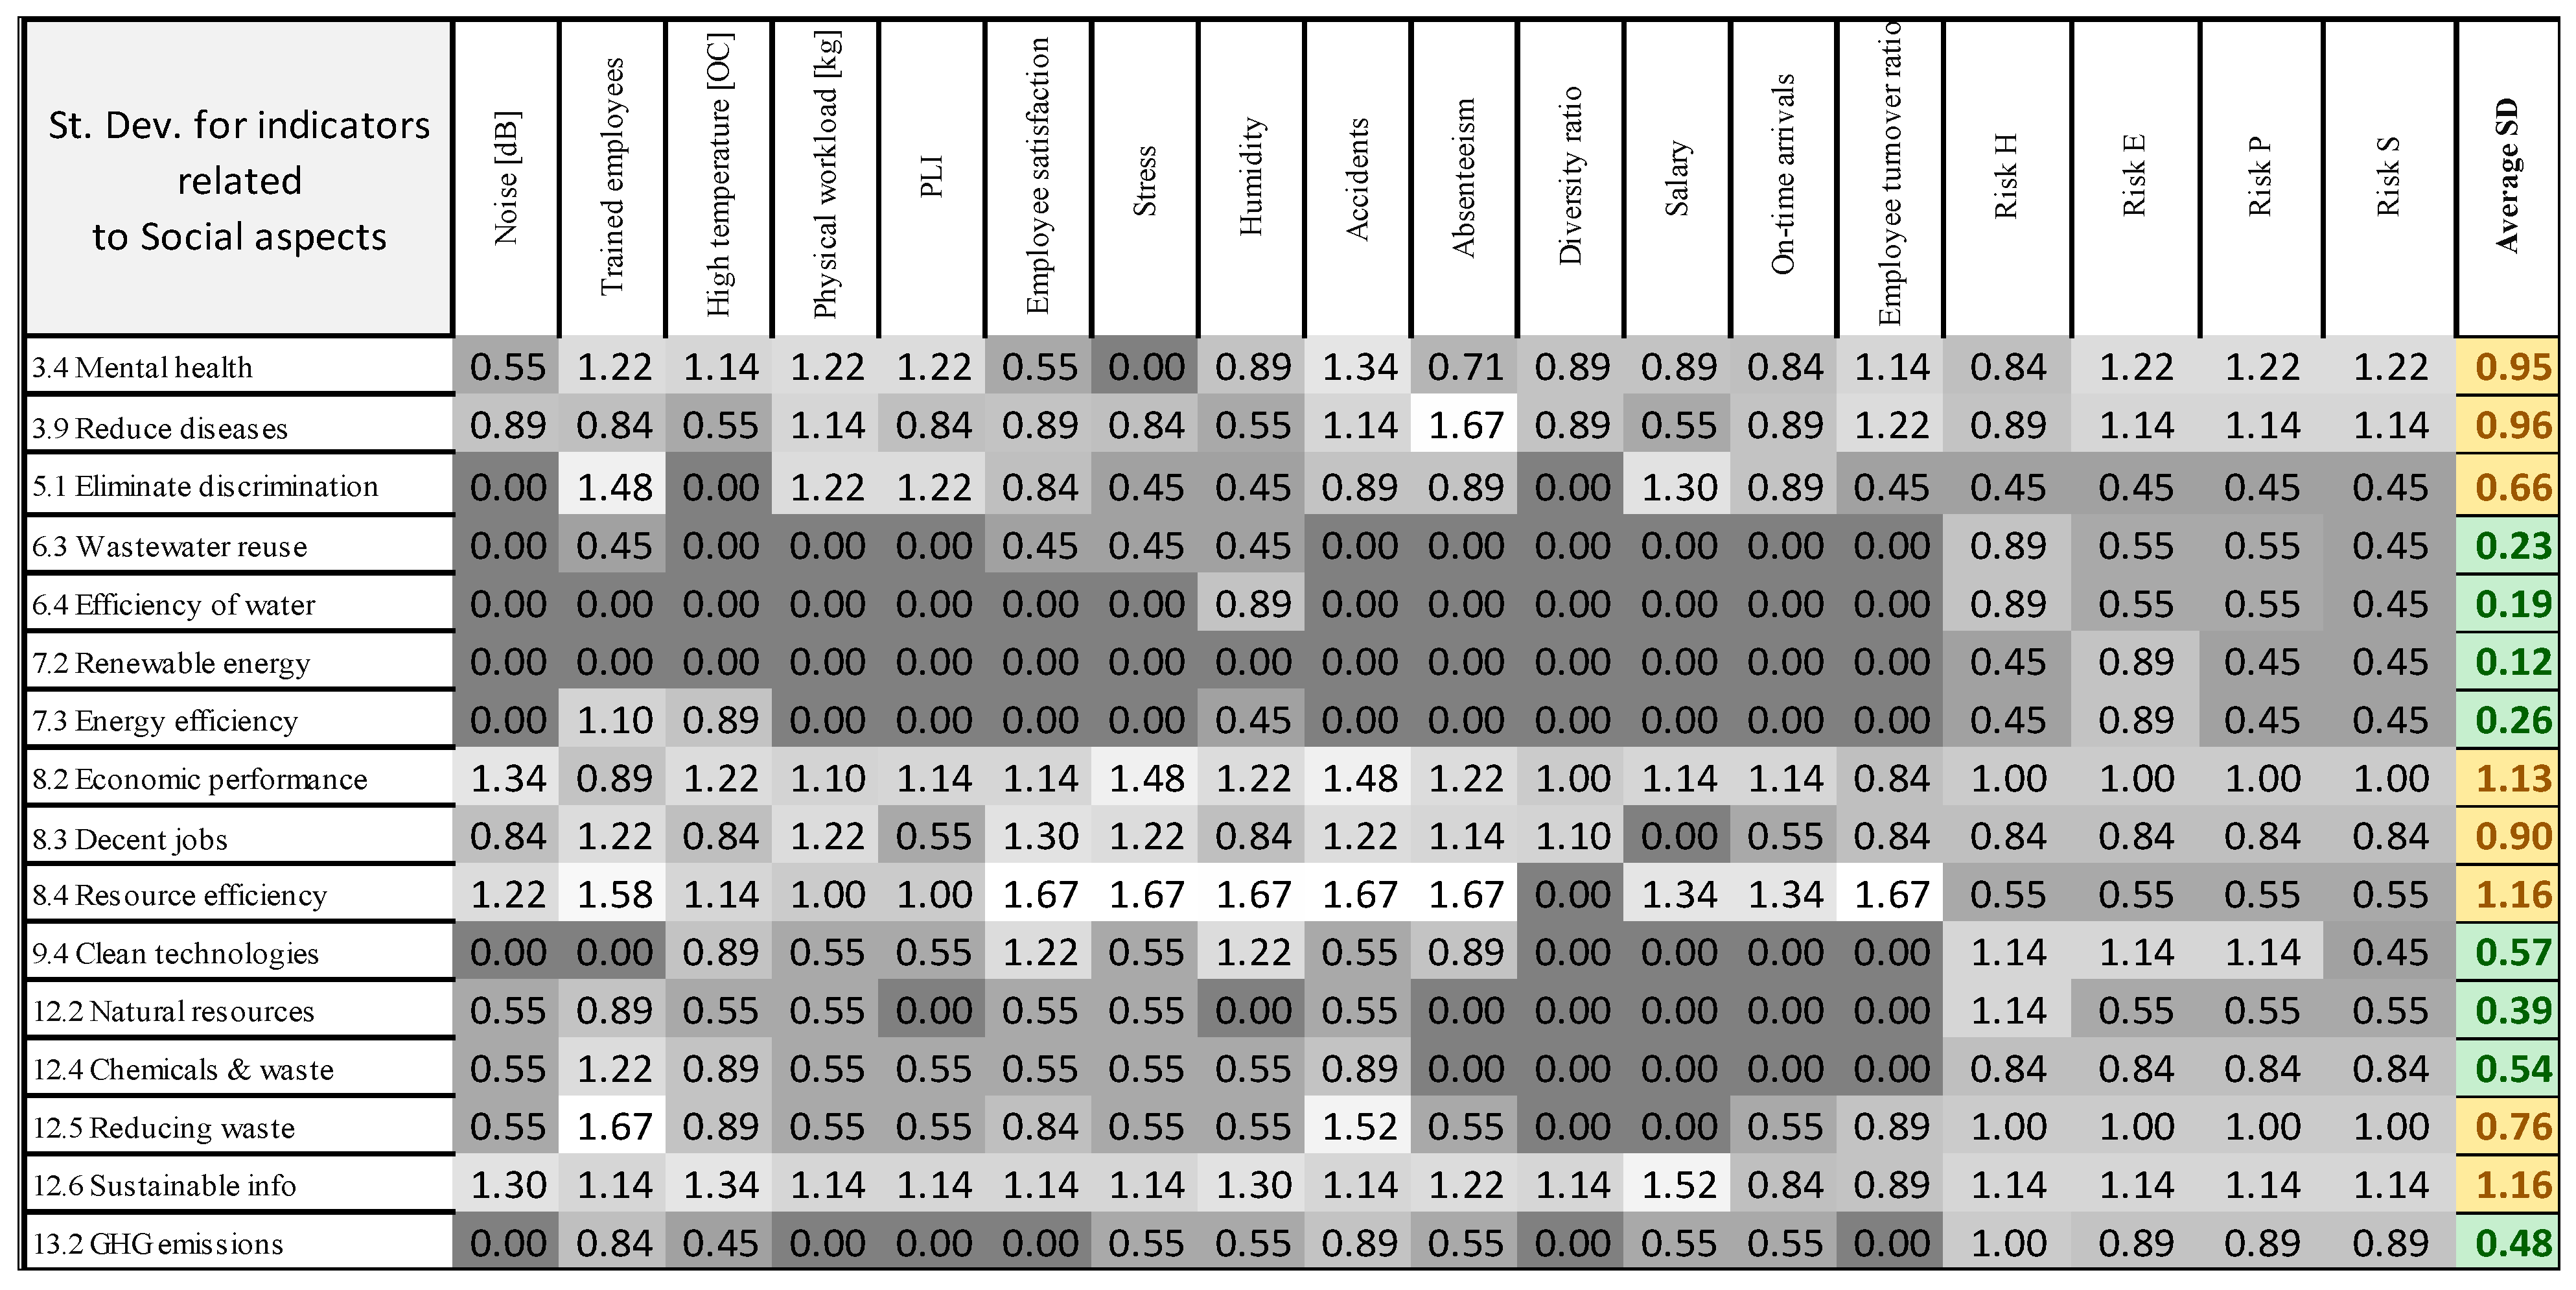
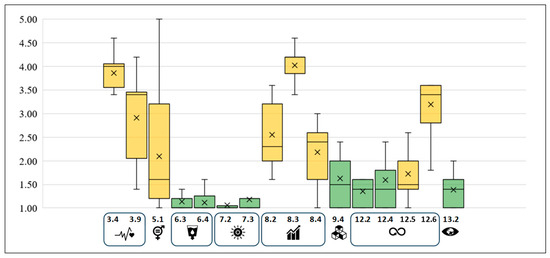
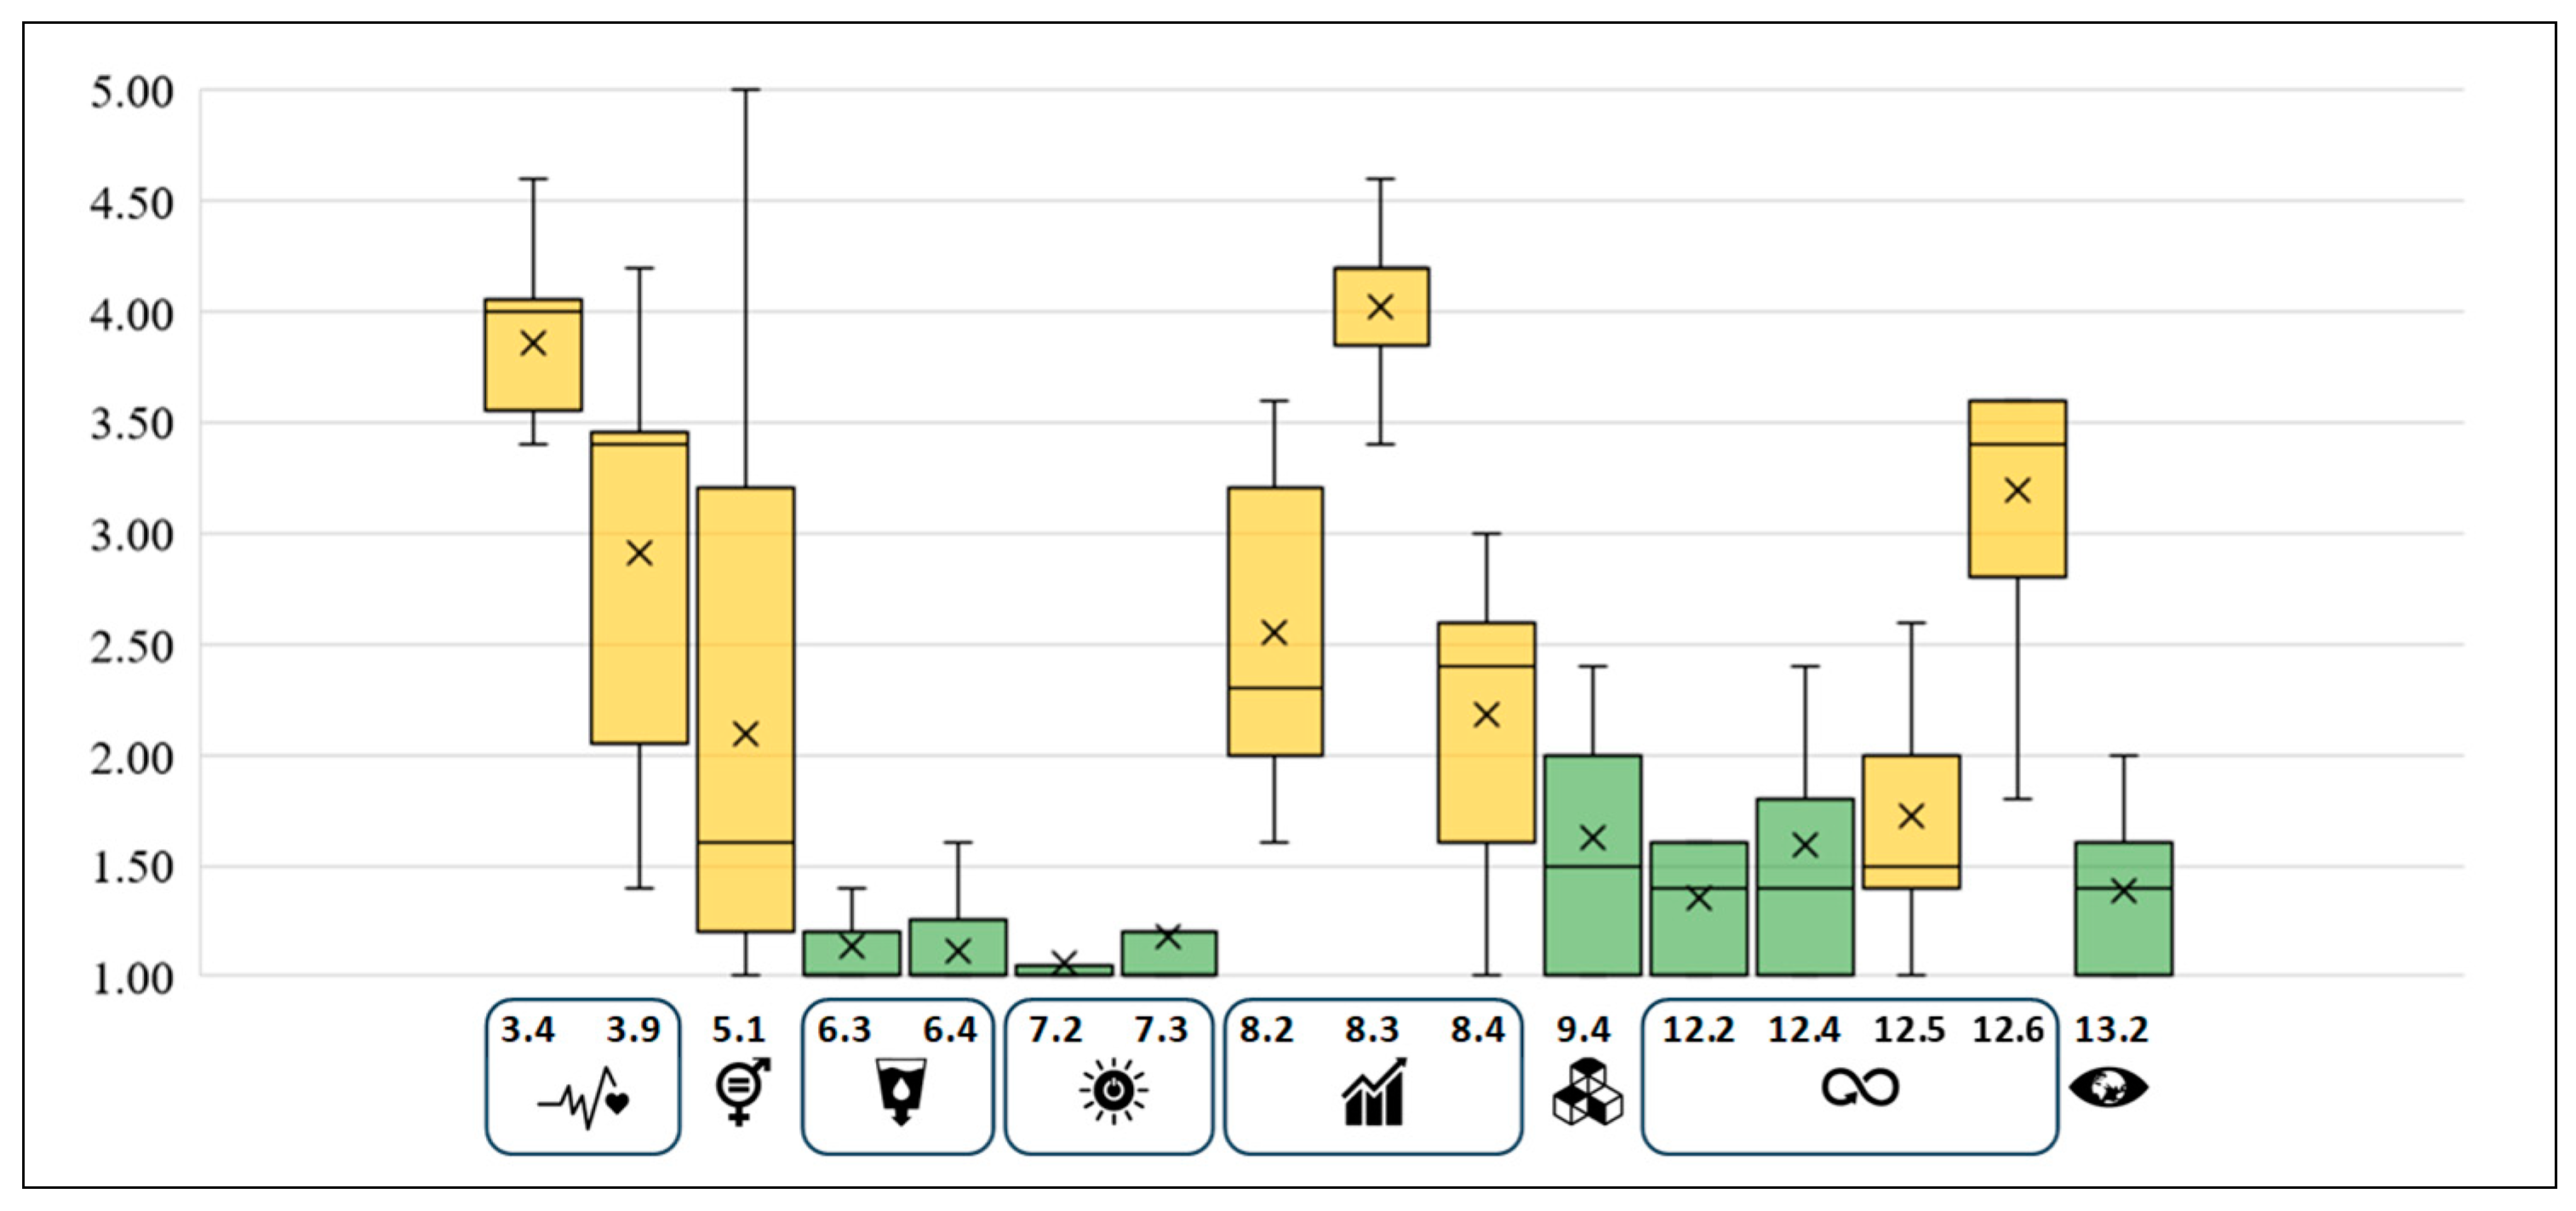
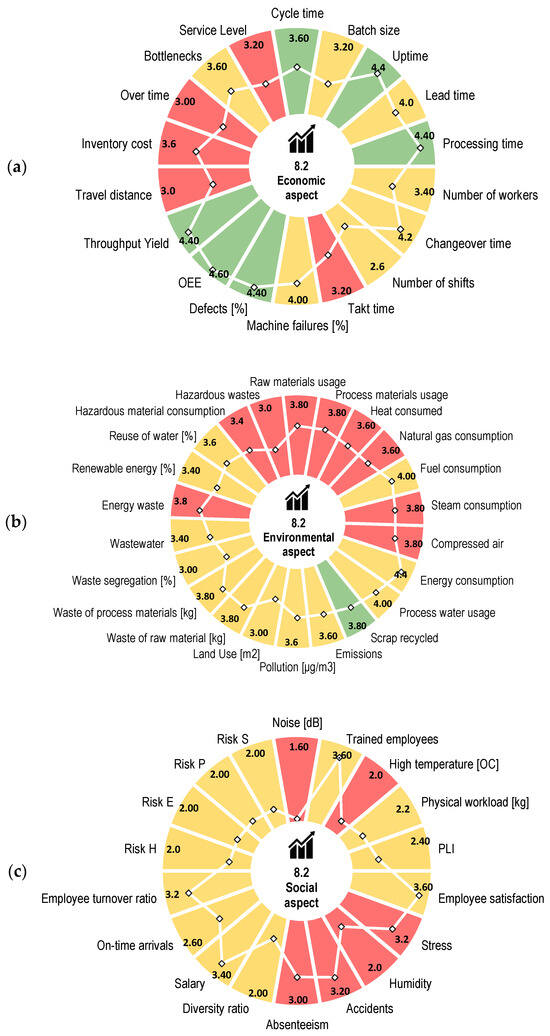
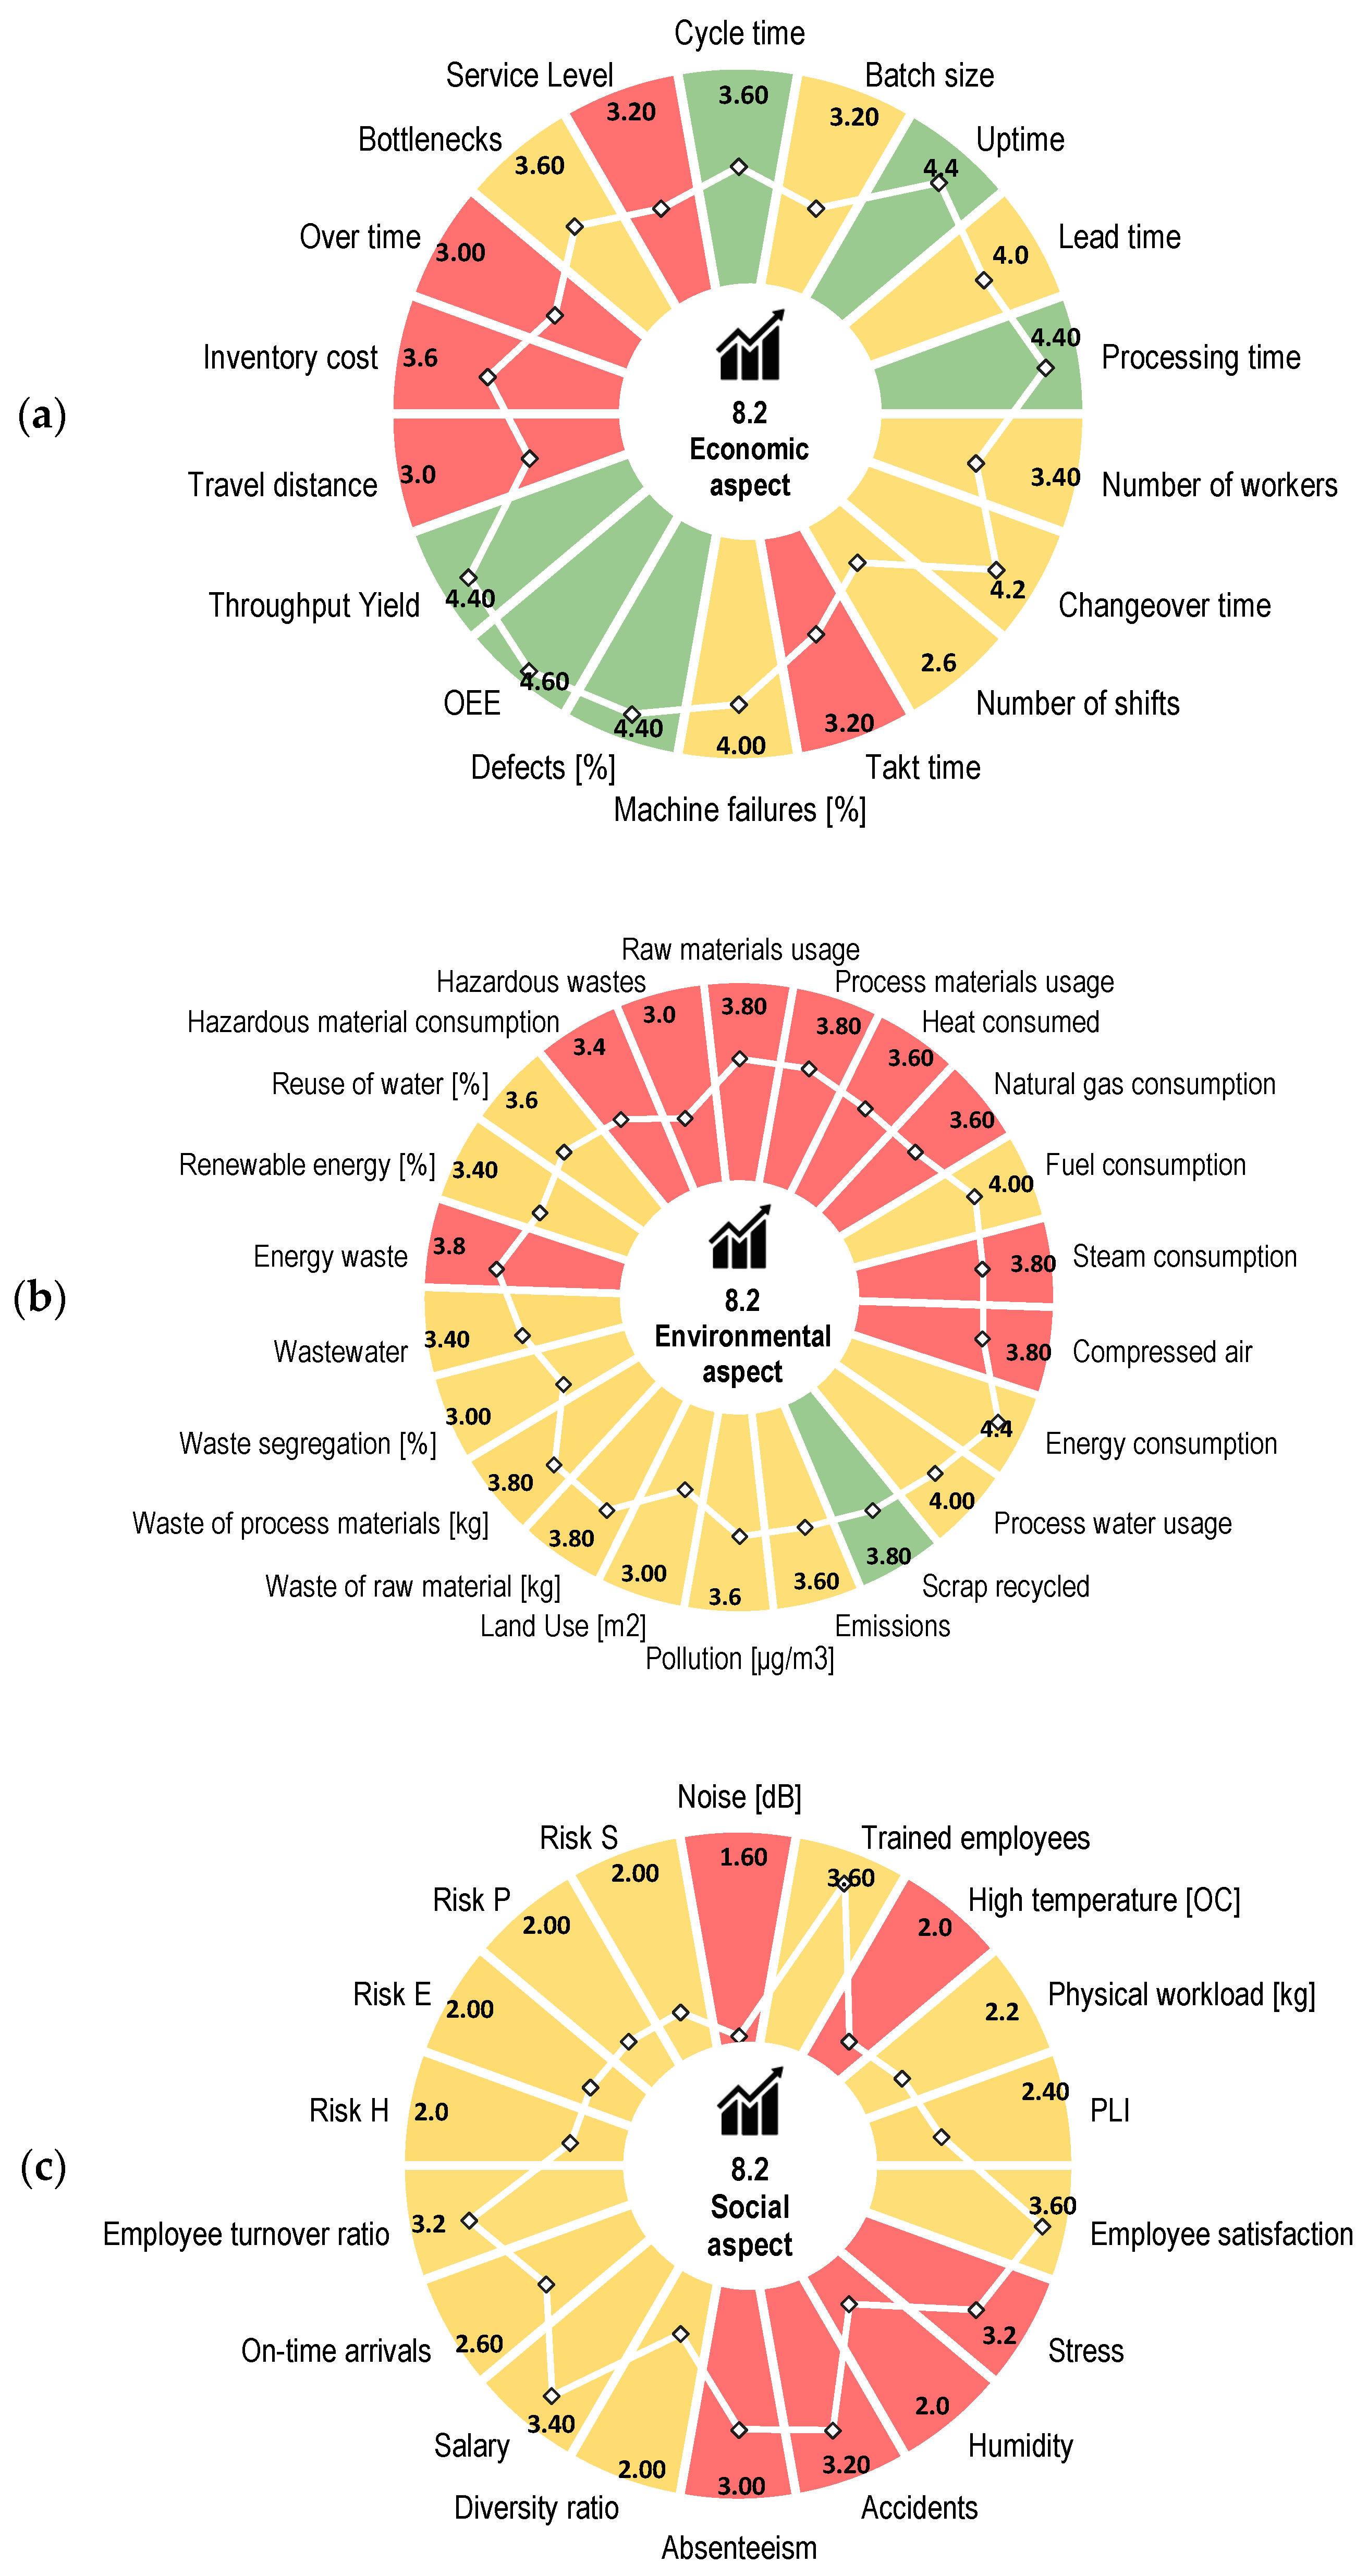
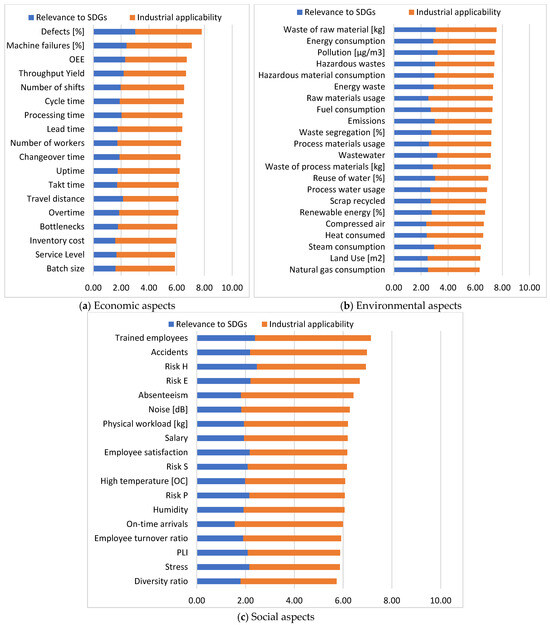
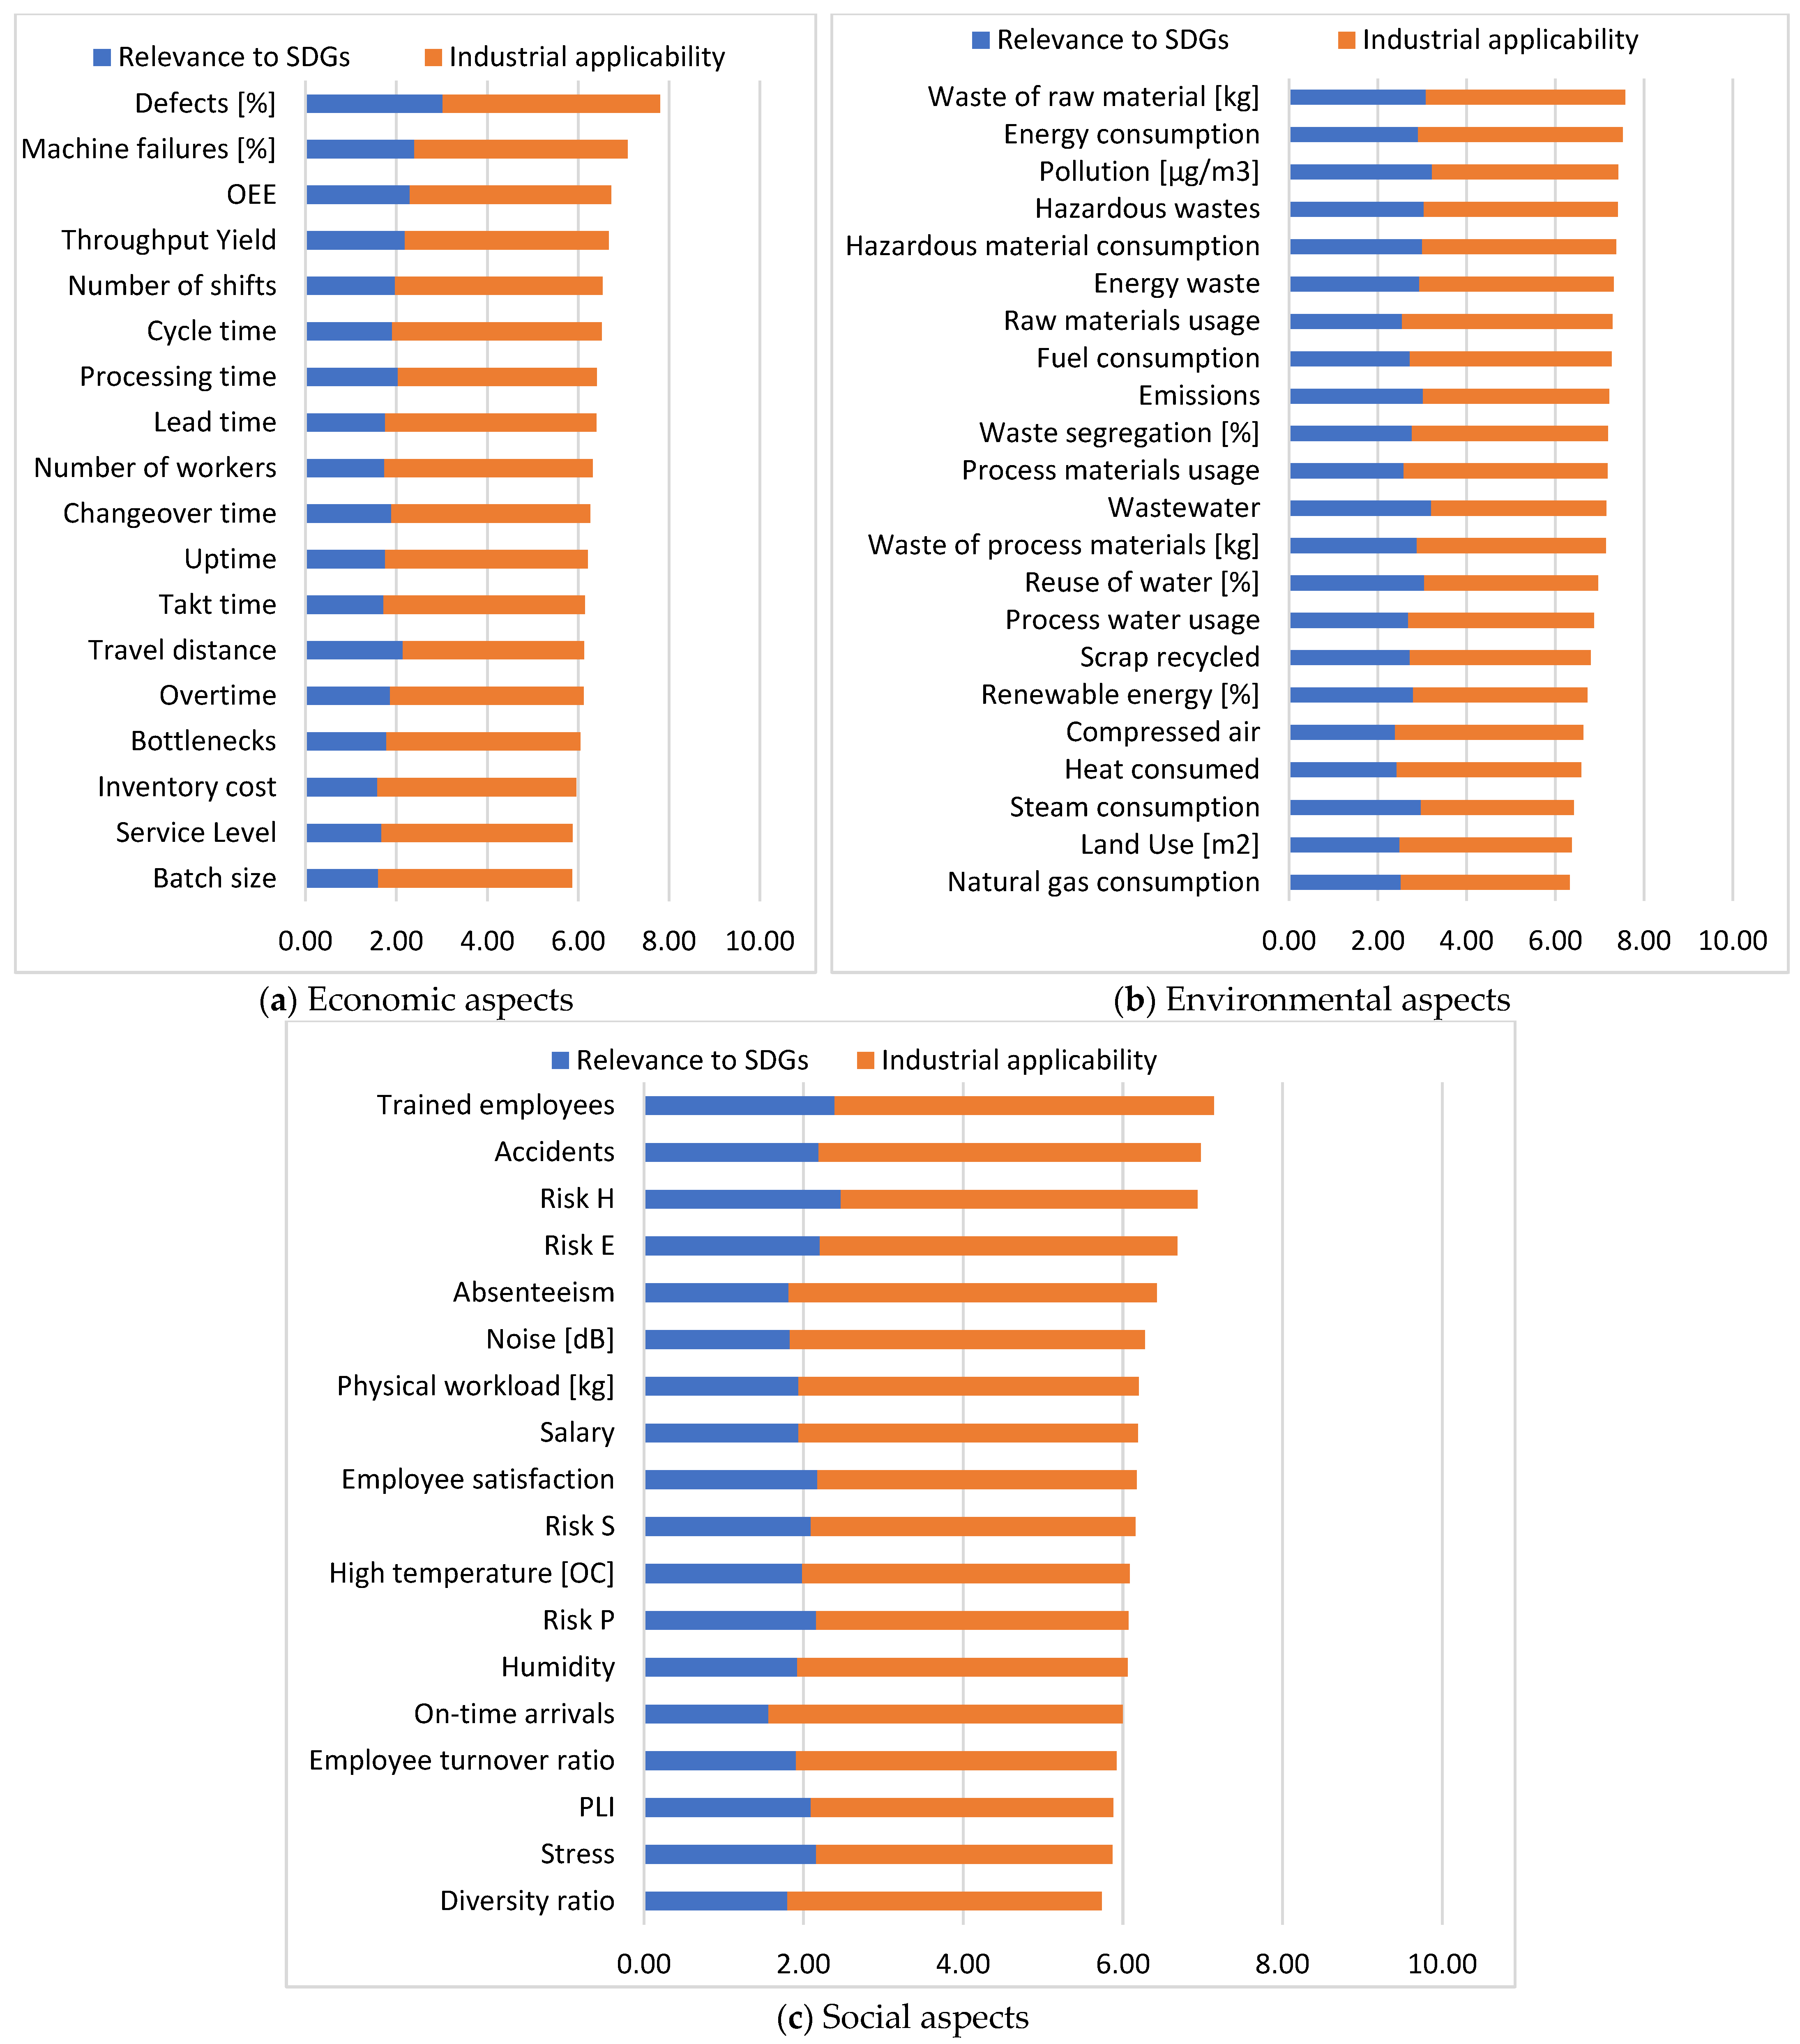



Disclaimer/Publisher’s Note: The statements, opinions and data contained in all publications are solely those of the individual author(s) and contributor(s) and not of MDPI and/or the editor(s). MDPI and/or the editor(s) disclaim responsibility for any injury to people or property resulting from any ideas, methods, instructions or products referred to in the content. |
© 2026 by the authors. Licensee MDPI, Basel, Switzerland. This article is an open access article distributed under the terms and conditions of the Creative Commons Attribution (CC BY) license.