Article

Repairing the Urban Metabolism: A Dynamic Life-Cycle and HJB Optimization Model for Resolving Spatio-Temporal Conflicts in Shared Parking Systems


1
School of Architecture and Transportation Engineering, Guilin University of Electronic Technology, Guilin 541004, China
2
School of Artificial Intelligence, Guilin University of Electronic Technology, Guilin 541004, China
3
School of Computer Science and Information Security, Guilin University of Electronic Technology, Guilin 541004, China
*
Author to whom correspondence should be addressed.
Systems 2026, 14(1), 91; https://doi.org/10.3390/systems14010091
Submission received: 19 November 2025 / Revised: 28 December 2025 / Accepted: 11 January 2026 / Published: 14 January 2026
(This article belongs to the Section Complex Systems and Cybernetics)

Abstract

Urban shared parking systems represent a complex socio-technical challenge. Despite vast potential, utilization remains persistently low (<15%), revealing a critical policy failure. To address this, this study develops a dynamic system framework based on Life-Cycle Cost (LCC) and Hamilton-Jacobi-Bellman (HJB) optimization to analyze and calibrate the key policy levers influencing owner participation timing (T*). The model, resolved using finite difference methods, captures the system’s non-linear threshold effects by simulating critical system parameters, including system instability (price volatility, σ p ), internal friction (management fee, w g g t ), and demand signals (transaction ratio, Q). Simulations reveal extreme non-linear system responses: a 100% increase in system instability ( σ p ) delays participation by 325.5%. More critically, a 100% surge in internal friction (management fees) delays T* by 492% and triggers a 95% revenue collapse—demonstrating the risk of systemic collapse. Conversely, a 20% rise in the demand signal (Q) advances T* by 100% (immediate participation), indicating the system can be rapidly shifted to a new equilibrium by activating positive feedback loops. These findings support a sequenced calibration strategy: regulators must first manage instability via price stabilization, then counteract high friction with subsidies (e.g., 60%), and amplify demand loops. The LCC framework provides a novel dynamic decision support system for calibrating complex urban transportation systems, offering policymakers a tool for scenario testing to accelerate policy adoption and alleviate urban congestion.

1. Introduction

Urban parking scarcity in China has escalated into a critical policy failure, manifesting as severe traffic congestion and environmental degradation. Empirical data reveals that in Beijing’s central districts, vehicles spend up to 30% of travel time cruising for parking, directly reducing road capacity by 18–22% during peak hours [1]. From the perspective of Urban Metabolism, this phenomenon represents a metabolic lesion: vast material stocks (private garages) consume land resources but fail to generate service flows [2,3]. We adopt the “Stock-Flow” framework to analyze this failure [4]. Currently, private parking operates as a static hard infrastructure with zero turnover. Shared parking acts as a metabolic repair mechanism, functioning analogously to Urban Eco-zones (constructed wetlands) in hydrological systems. Just as wetlands regulate stormwater runoff to prevent flooding, shared parking systems regulate vehicle runoff to prevent congestion. This transformation shifts the urban logic from stock accumulation (building more spaces) to flow optimization (circulating existing ones), effectively linking the static private asset cycle with the dynamic public mobility cycle.
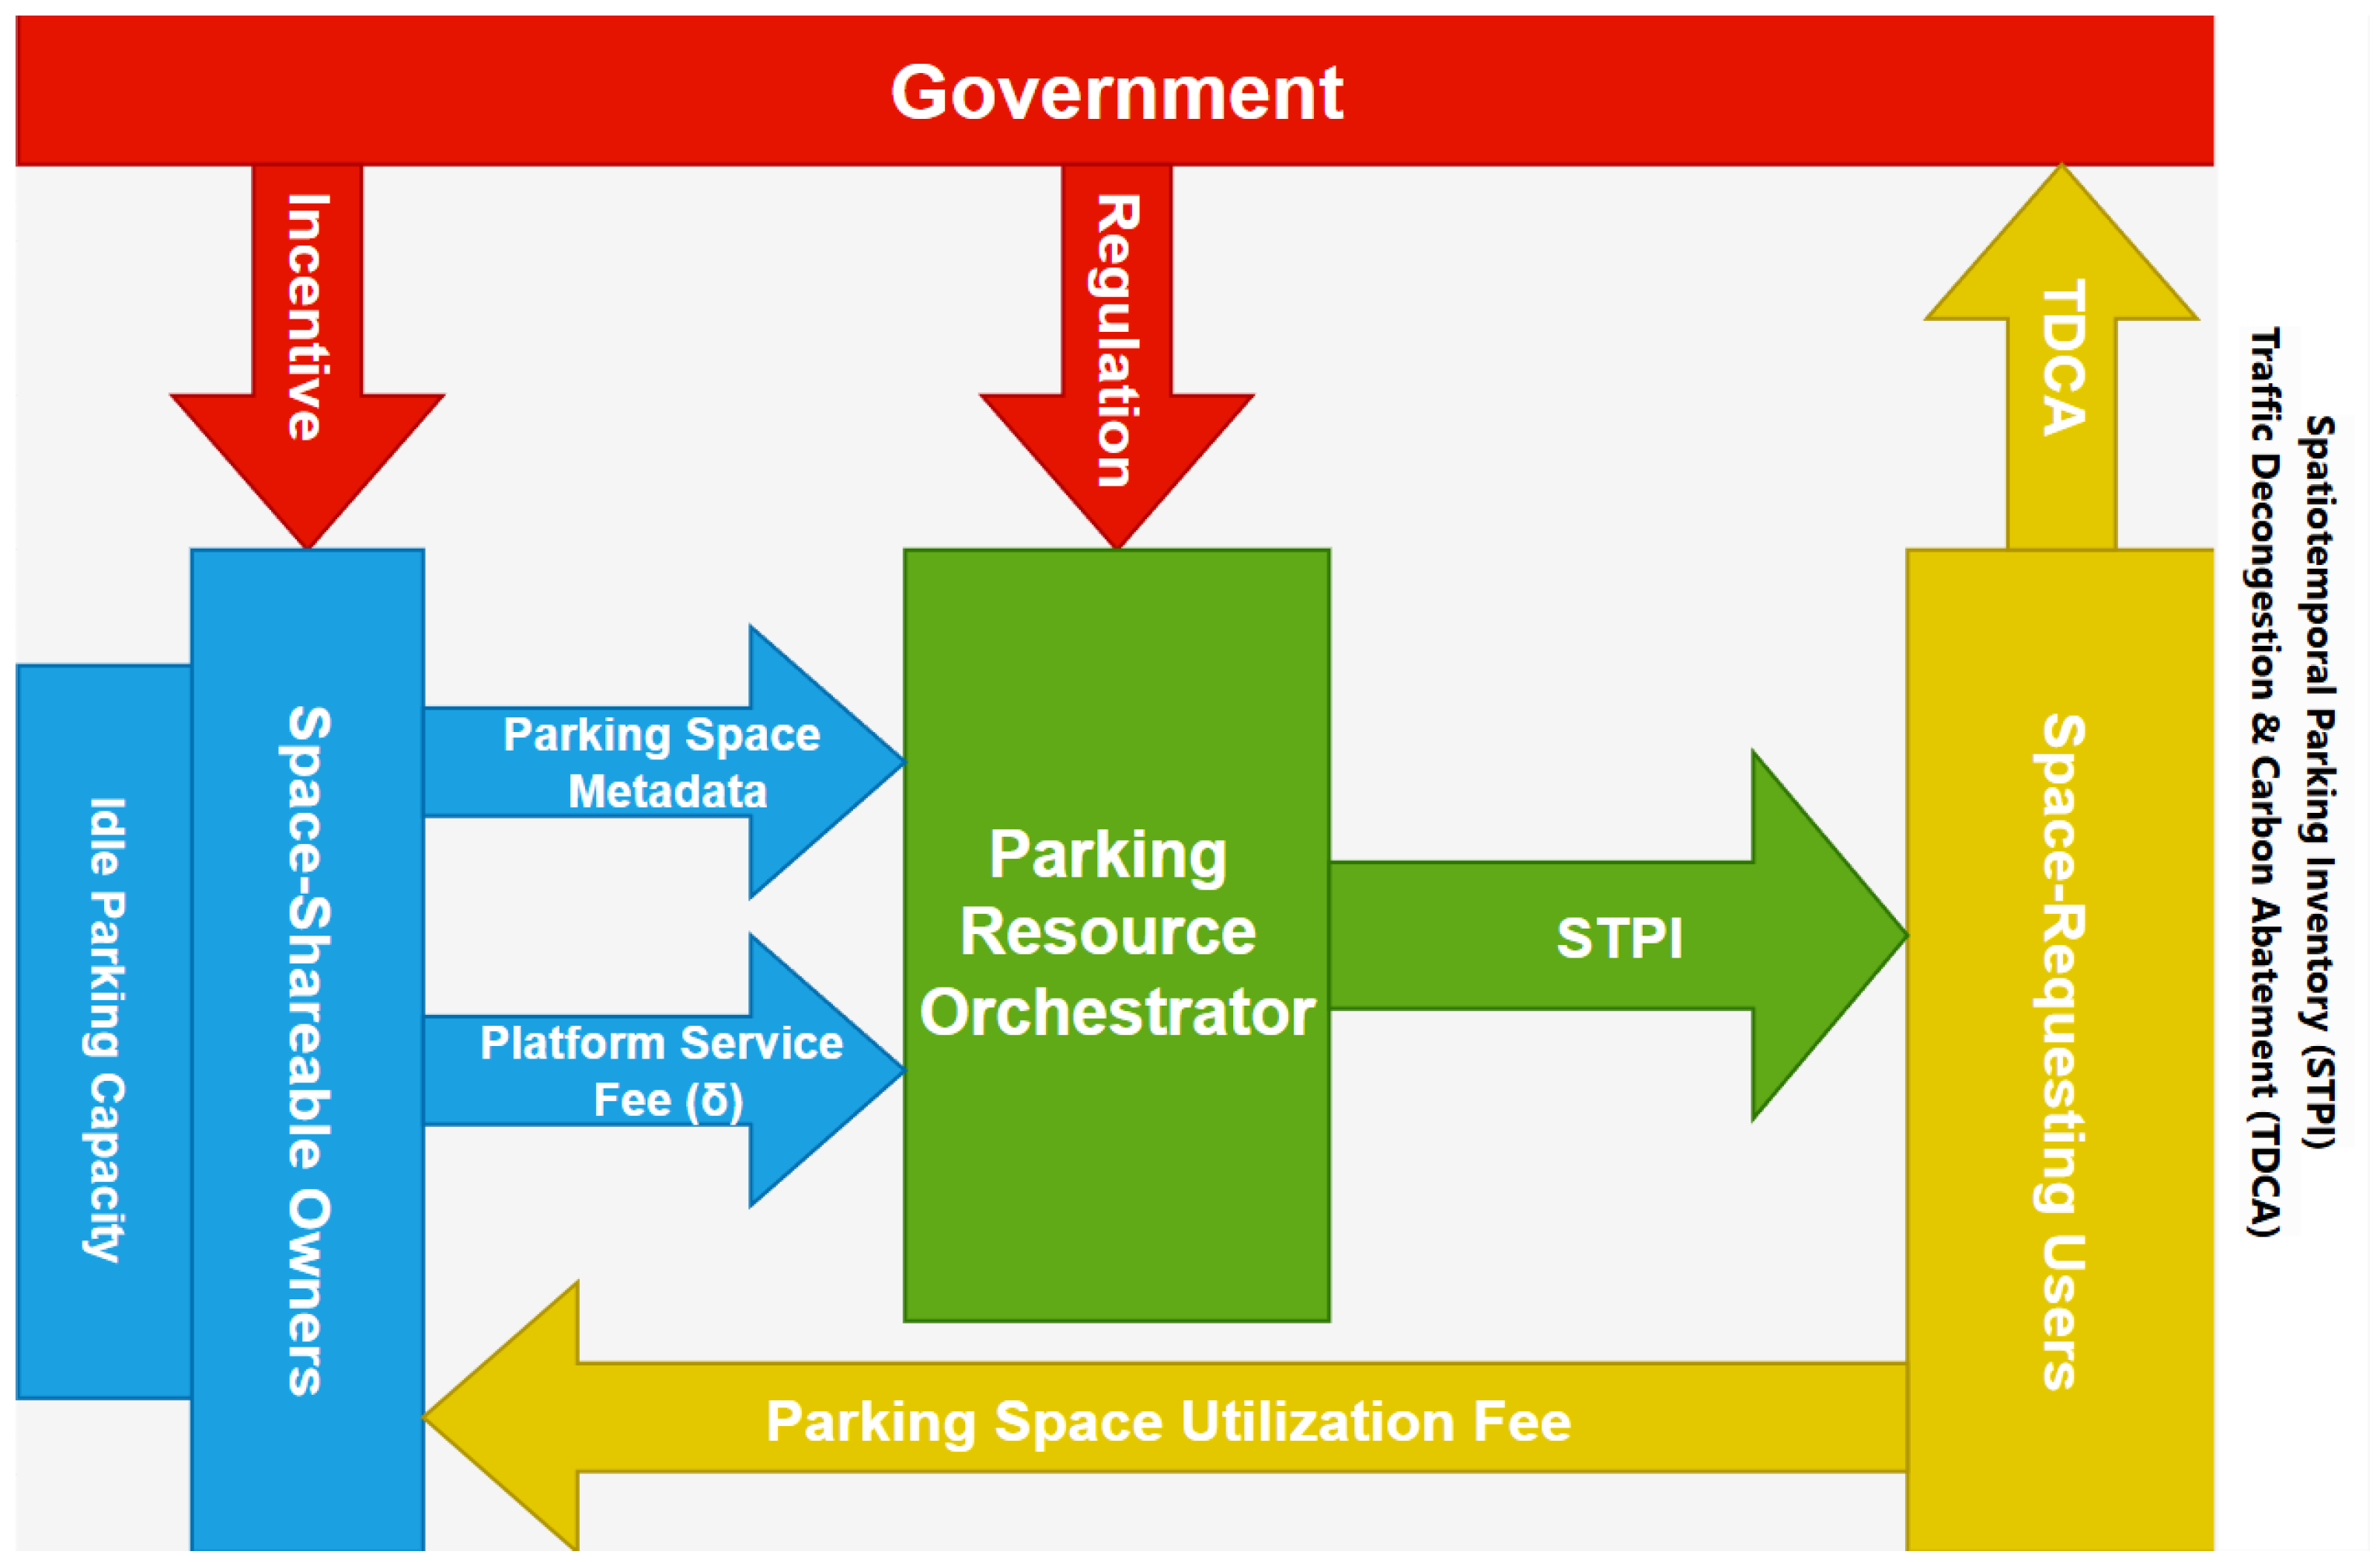
This impasse reveals more than a market friction; it exposes the structural failure of a complex Socio-Technical System (STS) [5]. As illustrated in Figure 1, this system comprises interacting components: human agents, technological infrastructure, and regulatory superstructures. The system’s goal is to unlock vast latent capacity—over 60 million private spaces in China—to achieve 40–65% efficiency gains. However, the system’s actual performance is failing, with platform utilization stagnating below 15% [6]. The root of this failure is a fundamental Spatio-Temporal Conflict: the rigid spatial boundaries of private asset ownership clash with the stochastic temporal fluidity of public travel demand.
While autonomous driving (AD) promises future solutions, its real-world implementation faces prohibitive barriers (e.g., smart-road investment, unresolved liability frameworks), relegating it to long-term futures [7,8]. In contrast, shared parking leverages immediate opportunities through existing assets at near-zero public cost. Yet, despite 72% of Chinese cities launching shared parking programs, adoption remains sluggish [9]. A review of existing research (Table 1) reveals that previous studies—which we classify as Generation 1.0 (static matching) and Generation 2.0 (market mechanisms)—have failed to account for the dynamic nature of this stagnation. These approaches often assume frictionless entry, ignoring the Option Value of Waiting that rational owners exercise when facing uncertainty.
We posit that the field must now advance to Generation 3.0 (Socio-Technical Dynamics), which integrates economic optimization with the behavioral realities of systemic entropy. A critical gap remains in current research: the lack of a dynamic framework to quantify how macro-level policy levers (e.g., volatility suppression, friction removal) non-linearly affect the micro-level Optimal Stopping Time (T*) of asset owners. Without measuring this “participation threshold,” policy interventions remain blind trial-and-error.
To ensure clarity regarding the model’s scope, we define three key operational boundaries:
(1)
Agent Scope (Private Individuals): This study exclusively models individual private parking owners in residential communities, distinct from corporate garage operators. These agents are characterized by high risk aversion and lack of professional market data.
(2)
Time Frame (Long-term Commitment): Unlike daily spot-market trading (e.g., Airbnb), shared parking in this context requires hardware installation (smart locks) and administrative approval. Therefore, we model the participation decision not as a daily switch, but as a long-term asset commitment (analyzed over a 20-year lifecycle) bonded by contract.
(3)
Concept Definitions: Rigid Spatial Boundaries: Refers to the physical immobility of the parking asset, which cannot move to chase demand, creating a spatial mismatch with mobile vehicles.
Optimal Stopping Time (T*): In plain English, this is the strategic decision of ‘when to enter’ the market. It represents the specific moment an owner stops ‘waiting for better conditions’ and commits their asset to the platform.
Volatility Suppression: Policy interventions (like insurance or price floors) designed to artificially reduce the fluctuation of market prices perceived by the owner.
To address this gap, this paper reframes the participation decision not as a static calculation, but as an optimal stopping problem within a stochastic system. We develop a dynamic system framework integrating Life-Cycle Cost (LCC) analysis with Hamilton-Jacobi-Bellman (HJB) optimizing uncertainty. We adopt the concept of “Institutional Entropy,” derived from Haken’s synergetics [22,23,24], to quantify the disorder within the socio-technical system. Mathematically defined as H = p j ln p j , it measures the “vagueness of norms” and the unpredictability of market outcomes. In the context of shared parking, high entropy manifests not just as price volatility, but as the erosion of agent trust due to ambiguous liability frameworks and unstable platform governance. When entropy is high, the probability of a successful transaction becomes uncertain, causing risk-averse owners to retreat. This HJB-based approach is uniquely suited to model the non-linear decision thresholds of agents (owners) operating under Institutional Entropy (modeled by Geometric Brownian Motion). The model provides a “wind tunnel” to test how policy interventions propagate through the system.
Therefore, this study aims to move beyond static analysis to provide a tool for dynamic calibration. We address the following objectives:
(1)
To model the shared parking ecosystem as a complex socio-technical system constrained by Spatio-Temporal Conflicts and driven by agent-based (owner) decisions under uncertainty.
(2)
To utilize the LCC-HJB framework to identify the non-linear dynamics and critical thresholds (tipping points) of key system parameters: specifically, Institutional Entropy (represented by price volatility, σ p ) and Internal System Friction (represented by management costs, w g g t ).
(3)
To propose a synergistic ‘system calibration’ strategy—sequenced as stabilization, friction removal, and activation—to minimize entropy, reduce internal friction, and accelerate the optimal participation timing (T*).

2. System Framework and LCC Model

To analyze the “critical policy failure” defined in Section 1, we must model the decision-making process of the system’s primary agent: the private parking space owner. This agent’s behavior is rational, aimed at minimizing costs and maximizing benefits over the asset’s lifecycle. We, therefore, adopt the Life-Cycle Cost (LCC) framework as the core analytical tool to quantify the agent’s economic state [25].

2.1. System Definition and Agent-Based LCC Framework

Here, we construct a model to analyze the life cycle cost (LCC) for a parking space owner participating in shared parking.
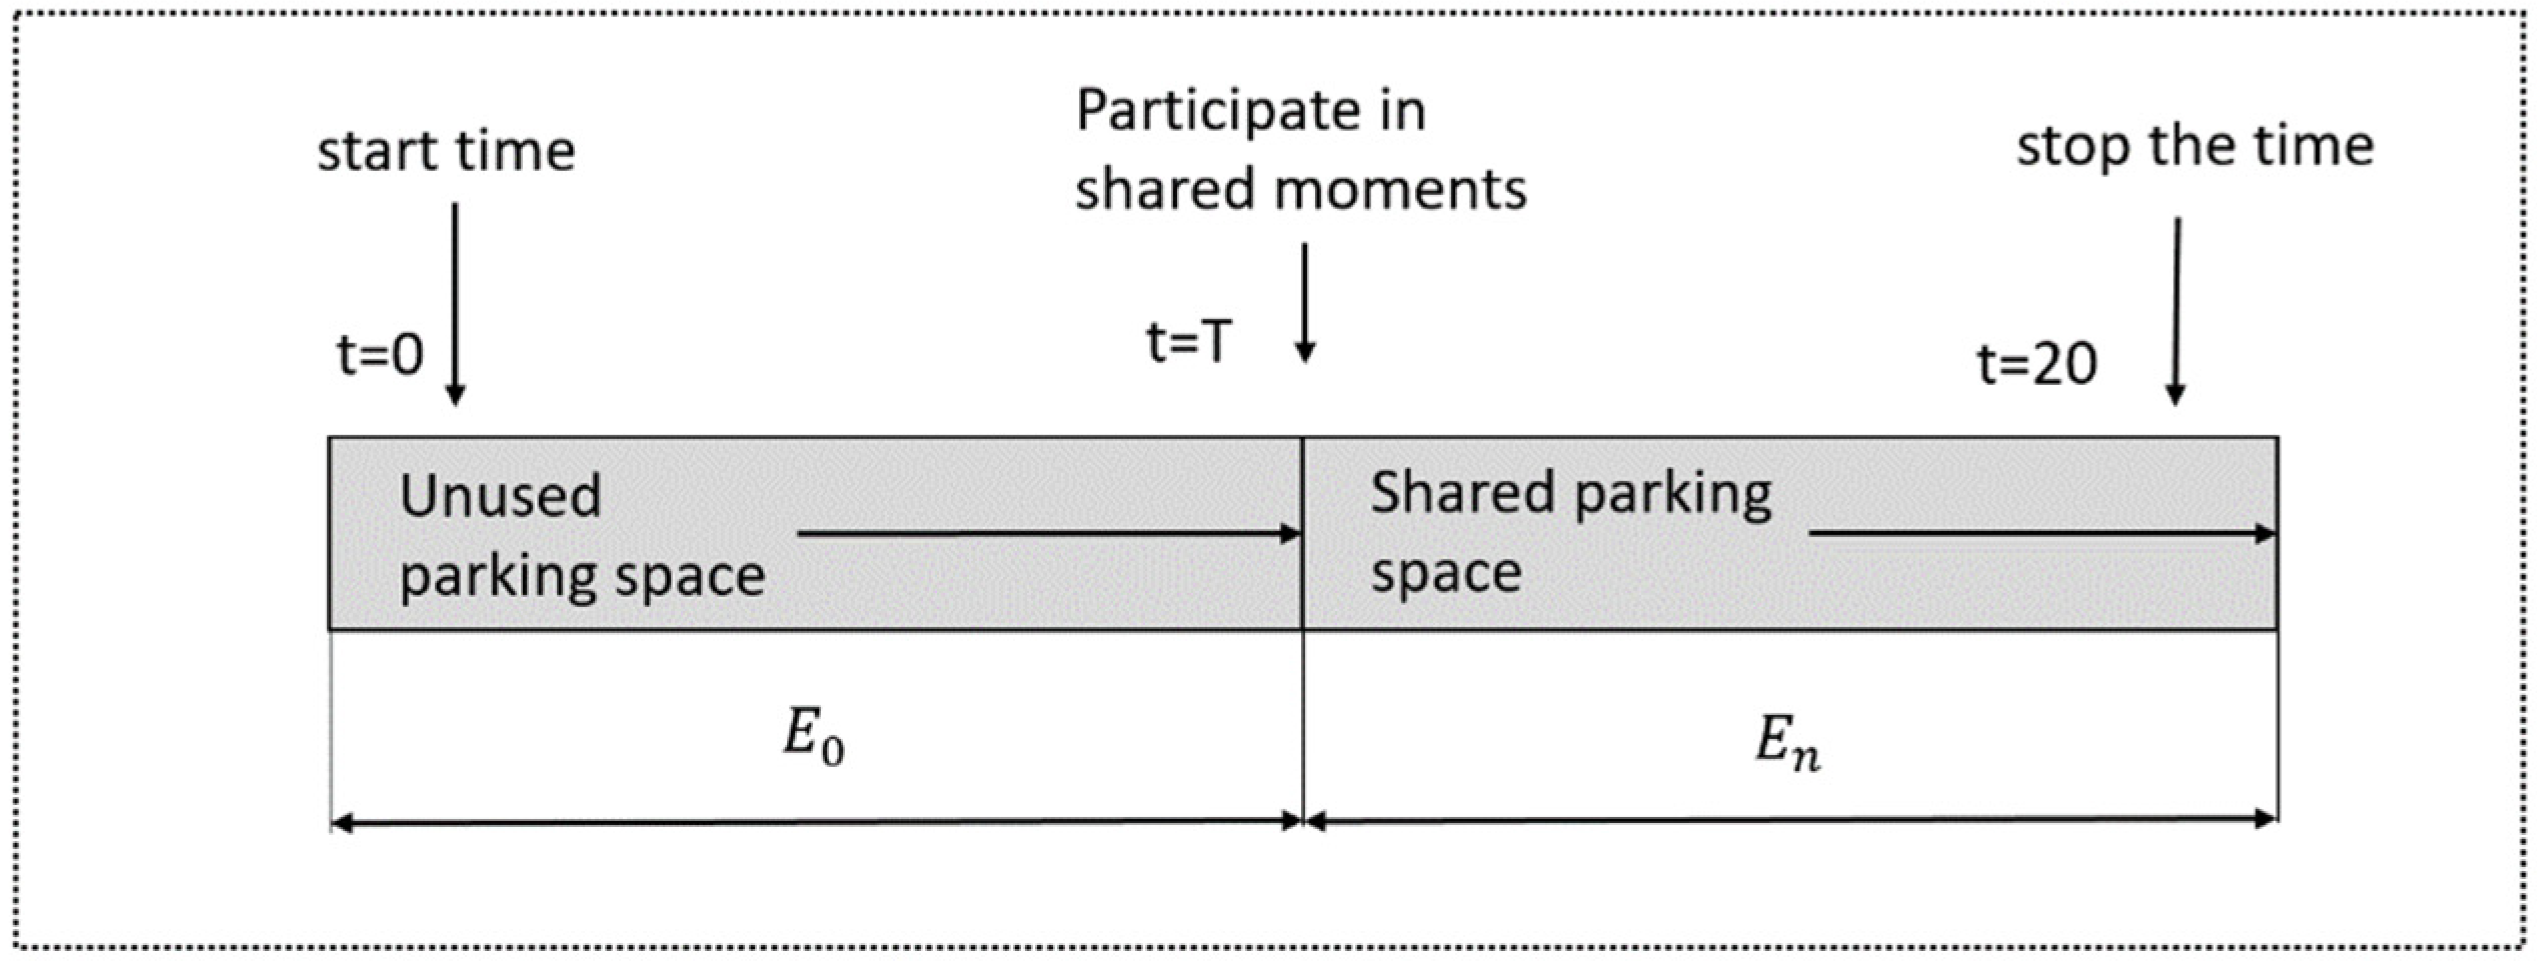
As shown in Figure 2, the total analysis period is assumed to be from t = 0 to t = 20. The owner makes the decision to participate in sharing at the moment t = T. Therefore, the time period [0, T] is the period when the owner holds but does not share the parking space, while [T, 20] is the period after the space enters the shared platform.
The LCC decision for this model includes the following key variables:
E 0 : The total operation and maintenance cost of holding and using the parking space before participating in sharing (i.e., the period [0, T]).
E n : The total operation and maintenance cost of using and sharing the parking space after participating in sharing (i.e., the period [T, 20]).
C n ( T ) : The franchise fee for participating in shared parking. This cost is modeled as a function of the decision time T, meaning that joining the shared system at different times may result in different costs.
S : The subsidy provided by the government to owners to promote the shared parking system, or other monetized benefits brought by participating in sharing. If no subsidy exists, then S = 0.
C T S : The total life cycle cost (LCC) of the owner’s decision to participate in shared parking.
The objective model representing the owner’s LCC decision is expressed as follows:
C T S = C o s t s R e v e n u e s = E 0 + E n + C n ( T ) S ,
Among them, the entire LCC consists of two parts, namely the operation and maintenance cost and the cost of participating in shared parking. The former includes the income, taxes, and fees of the shared parking space over time, as well as the operation and maintenance costs of the parking space, while the latter includes the franchise fee for participating in the shared parking space at all times and the subsidies given by the government. To clarify the economic incentive, C T S represents the Net Life Cycle Cost. A negative C T S implies profitability. Specifically, the term   E n (defined later in Equation (8)) contains the income component ( 1 δ )   Q   P p . Therefore, minimizing the total cost C T S is mathematically equivalent to maximizing the owner’s net profit. A negative value for C T S indicates overall profitability.
In the next section, each part cost is described mathematically and functionally. In addition, the model is further solved to obtain the optimal decision point for owners to participate in shared parking. The main mathematical symbols and their meanings used in the mathematical model of this study are summarized as Table 2:
Parameter Interpretation Note: While σ p , w g g t , and Q are operationalized as financial metrics for the HJB solution, they serve as proxies for broader socio-technical dynamics in this study. σ p represents Institutional Entropy, quantifying the disorder and unpredictability that erodes agent trust. w g g t captures Internal Friction, encompassing not just labor costs but the aggregated transaction costs (coordination, privacy risks) that impede system flow. Q serves as a Social Proof signal, triggering positive feedback loops essential for overcoming the system’s initial inertia (T*).

2.2. Derivation of System Components

The LCC function in Equation (1) is static. To make it dynamic and policy-testable, we must define its components as functions of the socio-technical system’s key parameters [26].

2.2.1. Defining System Instability (Price Dynamics)

The primary source of uncertainty for the agent (owner) is the external market, which we define as system instability. This is modeled by the stochastic price of shared parking. In the parking space sharing market, when owners participate in the decision-making process of shared parking spaces, the price of using shared parking spaces is an important price signal for owners. In the future, as the urban population continues to increase, travelers’ parking needs will also increase on a large scale, and the land available for parking will only become less and less. Based on this supply and demand relationship, the price of using shared parking spaces will rise sharply and continue to fluctuate [27]. We model the uncertainty of the shared parking market using Geometric Brownian Motion (GBM) as follows:
d P p = u p P p d t + σ p P p d z c ,
where P p price of using a shared parking space, u p is the drift rate, representing the expected annual growth trend of parking fees due to urbanization and inflation, σ p is the volatility rate of the price of using a shared parking space. Within our STS framework, we reinterpret the volatility parameter ( σ p ) as the quantitative proxy for Institutional Entropy. Following the synergetic definition introduced in Section 1, high volatility ( σ p ) reflects a high degree of “normative vagueness”. It indicates a market state where the rules of the game—such as liability for damage or payment enforcement—are unstable. This creates a stochastic environment where the owner’s probability of stable return becomes indistinguishable from noise, effectively freezing the decision-making process; z c is the standard Brownian motion process, is the incremental continuous random process of the normal distribution, and obeys the standard normal distribution N(0, 1).

2.2.2. Defining System Friction and Revenue Streams

In the equation, operational costs are composed of E 0   and E n . Considering the time cost, E ( E 0 + E n ) is the net present value function of the operation and maintenance costs before and after participating in parking space sharing (NPV) is as follows.
E = 0 T F 0 ( t ) e r t d t + T T 2 F n ( P p ( t ) ) e r t d t ,
Among them, F 0 ( t ) is the expenditure function of owners participating in shared parking spaces; r is the larger the value, the lower the current discounted value of operation and maintenance costs. T 2   represents the physical lifecycle of the asset (20 years), can be infinite. For the optimization, the Equation (4) can be expressed as follows:
E = 0 T F 0 ( t ) e r t d t + T F n ( P p ( t ) ) e r t d t ,
Note that while F n is explicitly a function of price P p , since price evolves stochastically over time, T F n ( P p ( t ) ) is implicitly time-dependent. We standardize the notation to F n ( P p ) in the HJB derivation to reflect state-dependency.
Among them, the integrals of these two components are represented by E 0   and respectively E n .
E 0 = 0 T F 0 ( t ) e r t d t ,
E n = T F n ( P p ( t ) ) e r t d t ,
The expenditure function sum F 0 ( t ) is F n ( P p ( t ) ) defined as the sum of the operation and maintenance costs of the shared parking space at time t, which has the same form before and after replacement, and then the following function is used to further process the expenditure function.
F 0 = M 0 ( t ) ,
F n ( P p ( t ) ) = M n ( t ) + w g g t ( 1 δ )   Q   P p ,
where F 0 and F n ( P p ( t ) ) respectively represent the maintenance and security costs of the parking space per unit of time before and after participating in the shared parking space. w g g t quantifies the operational costs borne by the owner. In our socio-technical analysis, we reframe this not merely as a labor fee, but as Internal System Friction. This encompasses the total Coasean transaction costs—including coordination effort, privacy enforcement, and administrative barriers—that the agent must overcome to participate in the system. The platform fee δ means that the platform draws a certain proportion of the parking fees paid by shared parking users as the platform’s profit source, and the value is (0, 1) [13]. Q is the sales volume of shared parking spaces within one year, ( 1 δ )   Q P p indicating the income generated from participating in shared parking spaces.

2.2.3. Participation Costs and Final Model Formulation

According to the definition in the previous section, the cost of participating in sharing D is C n ( T ) S . In addition, considering the discount rate, when the replacement cost is measured multiplied by the discount factor e r t , the participation cost function of the owner’s shared parking space can be expressed as:
D = ( C n ( T ) S ) e r t ,
According to the Equation (5), the full LCC life cycle function used by the parking space is expressed as follows:
C T S = 0 T F 0 ( t ) e r t d t + T F n ( P p ( t ) ) e r t d t + ( C n ( T ) S ) e r t ,
By Equation (10) performing an integral change, the Equation (11) can be obtained as follows:
( C n ( T ) S ) e r t = T r ( C n ( t ) S ) C n ( t ) e r t d t ,
According to the Equation (11), C T S can be rewritten as the following equation:
C T S = 0 T F 0 ( t ) e r t d t + T ( F n ( P p ( t ) + r ( ( C n ( t ) S ) C n ( t ) ) e r t d t ,
Arrange the Equation (12) to get the following equation:
C T S = 0 T f 0 ( t ) e r t d t + T f n ( P p ( t ) ) e r t d t ,
C T S 1 = 0 T f 0 e r t d t ,
C T S 2 = T f n ( P p ( t ) ) e r t d t ,
While the LCC framework considers a 20-year asset life, the HJB optimization employs an infinite horizon approximation. This is mathematically justified because the discount factor e r t renders the present value of tail costs ( t > 20) negligible, allowing the infinite-horizon solution to serve as a robust proxy for the finite-horizon decision boundary.
In the formula:
f 0 = F 0 = M 0 ( t ) ,
f n = M n ( t ) + w g g t ( 1 δ ) Q P p + r ( C n ( t ) S ) C n ( t ) ,
With the LCC function fully defined in Equation (13) and its systemic components specified in Equations (16) and (17), the problem is now formulated. The next section will detail the dynamic programming method used to solve for the optimal decision threshold T*.

3. Methodology: HJB Optimization and Model Solution

The owner’s decision-making process represents a classic optimal stopping problem. This framing is essential because the shared parking ecosystem is inherently a combination of a stochastic process (the price volatility, σ p , defined by GBM) and non-linear, agent-based decision-making (the owner’s participation timing, T*). Traditional linear or static models cannot capture this dynamic complexity.
The Hamilton-Jacobi-Bellman (HJB) equation is the standard dynamic programming framework used in continuous time to solve such optimal stopping problems. We, therefore, adopt it as the core methodology, not merely to find a single optimal solution, but to map the system’s decision boundaries and state thresholds under uncertainty [28].
By applying the Hamilton-Jacobi-Bellman equation [29], the following stochastic differential equation can be derived which represents the cost of participating in a shared parking space:
r ( C T S 2 ) = min { f n ( P p ) + 1 d t E [ d C T S 2 ( P p ) ] } ,
The formula f n ( P p ) represents within the time interval dt the expenditure function f n ( P p ( t ) ) following participating in the shared parking space within the time interval f n ( P p ( t ) ) . According to Itô’s lemma, the Equation (19) can be written as:
E [ d ( C T S ) ] d t = u p P p C T S 2 P p + σ p 2 P p 2 2 2 C T S 2 P p 2 ,
Further solution:
r ( C T S 2 ) = f n ( P p ) + u p P p C T S 2 P p + σ p 2 P p 2 2 2 C T S 2 P p 2 ,
The costs for owners not participating in shared parking spaces are as follows:
C T S 1 = 0 T M 0 ( t ) e r t d t ,
According to consumer choice theory, when the cost of participating in shared parking is lower than that of non-participation, owners will engage in sharing. The optimal decision price P p * therefore satisfies:
0 T M 0 t e r t d t = 1 r ( ( M n ( t ) + w g g t ( 1 δ ) Q P p + r ( C n ( t ) S ) C n ( t ) ) + u p P p C T S 2 P p + σ p 2 P p 2 2 2 C T S 2 P p 2 ) ,
Since P p no analytical solution exists, the finite difference method is used to obtain P p * an approximate numerical solution for the optimal decision price.
According to the Equation (22), there are the following governing equations:
C T S 2 = 1 r ( f n ( t , P p ) + u p P p C T S 2 P p + σ p 2 P p 2 2 2 C T S 2 P p 2 ) ,
There are initial conditions:
C T S 2 ( P p ( T ) , T ) = 0 T M 0 t e r t d t ,
C T S 2 ( P p ( T Δ t ) , T Δ t ) = 0 T Δ t M 0 ( t Δ t ) e r ( t Δ t ) d t ,
To solve the PDE numerically, we discretize the state space, where i denotes the index of the price step Δ P p , and n denotes the index of the time step. For C T S 2 P p the difference, the first-order forward difference quotient difference method is used:
( C T S 2 P p ) i n ( C T S 2 ) i + 1 n + 1 ( C T S 2 ) i n Δ P p ,
For 2 C T S 2 P p 2 the difference, the second-order central difference method is used:
( 2 C T S 2 P p 2 ) i n ( C T S 2 ) i + 1 n + 1 2 ( C T S 2 ) i n + ( C T S 2 ) i 1 n 1 Δ P p 2 ,
Then there is a differential format:
( C T S 2 ) i + 1 n + 1 = 2 Δ P p 2 r 2 Δ P p u p P p σ p 2 P p 2 ( ( C T S 2 ) i n f n ( t , P p ) i n r u p P p ( C T S 2 ) i n Δ P p r   σ p 2 P p 2 ( C T S 2 ) i n Δ P p 2 r + σ p 2 P p 2 ( C T S 2 ) i 1 n 1 2 Δ P p 2 r ) ,
The optimal decision time T satisfies the equation:
C T S 1 ( P p ( T ) , T ) = C T S 2 ( P p ( T ) , T ) ,
Then the optimal decision time T and the total cost C T S can be obtained.

4. Results and Discussion

4.1. Numerical Analysis Plan Design

To ensure the data simulation results accurately reflect objective market conditions, this section establishes parameter values based on relevant statistical data from China’s urban private transportation sector and integrates parameters employed in prior related studies. Drawing on research by [20], the baseline parking fee within residential communities is set at 5 yuan per hour.
To ensure the validity of the numerical simulation, model parameters were calibrated using empirical benchmarks from urban economics and real options literature (Table 3). We distinguish between the physical operating costs of a parking space and the Socio-Technical Friction ( w g g t ) required to manage shared transactions.
While the basic physical maintenance of a surface parking space is relatively low (approx. 1350 CNY/year [30], the Internal System Friction ( w g g t ) is set at a baseline of 10,000 CNY. This value captures the Total Transaction Costs in a manual system, including labor for gatekeeping, coordination, and privacy premiums [31].
Crucially, to address parameter uncertainty, we established Sensitivity Bands based on empirical variance. For instance, while we use a baseline volatility of σ p = 0.30, empirical studies on emerging infrastructure assets show a volatility range of 16–47% [32]. Our sensitivity analysis (ranging from −50% to +100%) amply covers this empirical confidence interval, ensuring the model’s robustness against market fluctuations.
Table 3. Parameter Calibration.
ParameterSymbolValueEmpirical Range/
Sensitivity Band
Source/Rationale
Platform Fee δ 0.100.05–0.25Commercial platforms (e.g., Didi/Uber) charge 20–25%; P2P models aim lower [16,20].
Internal Friction w g g t 10,000 CNY/year1500–15,000 CNY/yearLower bound: pure physical maintenance. Upper bound: manual labor + privacy costs [30,31,33].
Price Volatility σ p 0.300.16–0.47Based on real option volatility surfaces for emerging infrastructure [32,34].
Drift Rate u p 0.050–0.08Tracks urbanization rate and CPI for services in Tier 1 cities [35].
Discount Rater0.030.03–0.12Lower bound: Risk-free social rate. Upper bound: Corporate hurdle rate [36].
Initial shared parking space franchise fee ( C n ( T ) ): 100 T + 500 yuan
Government subsidy ( S ): 100 yuan
Shared parking usage price drift rate ( u p ): 0.05
Shared parking usage price volatility ( σ p ): 0.3
Discount rate (r): 0.03
Pre-sharing parking space maintenance cost ( M 0 ( t ) ): 600 yuan/year
Post-sharing parking space maintenance cost ( M n ( t ) ): 900 yuan/year
  • These are constants in the simulation, despite being functions in Equation (3).
Labor price for shared parking management ( w g g t ): 10,000 yuan/year
  • We set the baseline friction w g g t = 10,000 yuan/year to represent a high-friction manual scenario involving human gatekeeping and administration [33]. This accounts for approximately 85% of potential revenue, highlighting the necessity of automation to lower this cost curve.
Platform service fee (δ): 0.1 (10%)
Furthermore, we assume:
The parking space is available for sharing 8 h per day.
The average utilization rate during available hours is 80%.
Utilizing these established benchmark values, which are grounded in the Chinese urban context, the subsequent numerical analysis investigates the behavioral patterns of private parking space owners regarding their participation timing in shared parking decisions, as informed by the proposed conceptual model.

4.2. Analysis of System Dynamics

4.2.1. System Instability σ p and Participation Decision

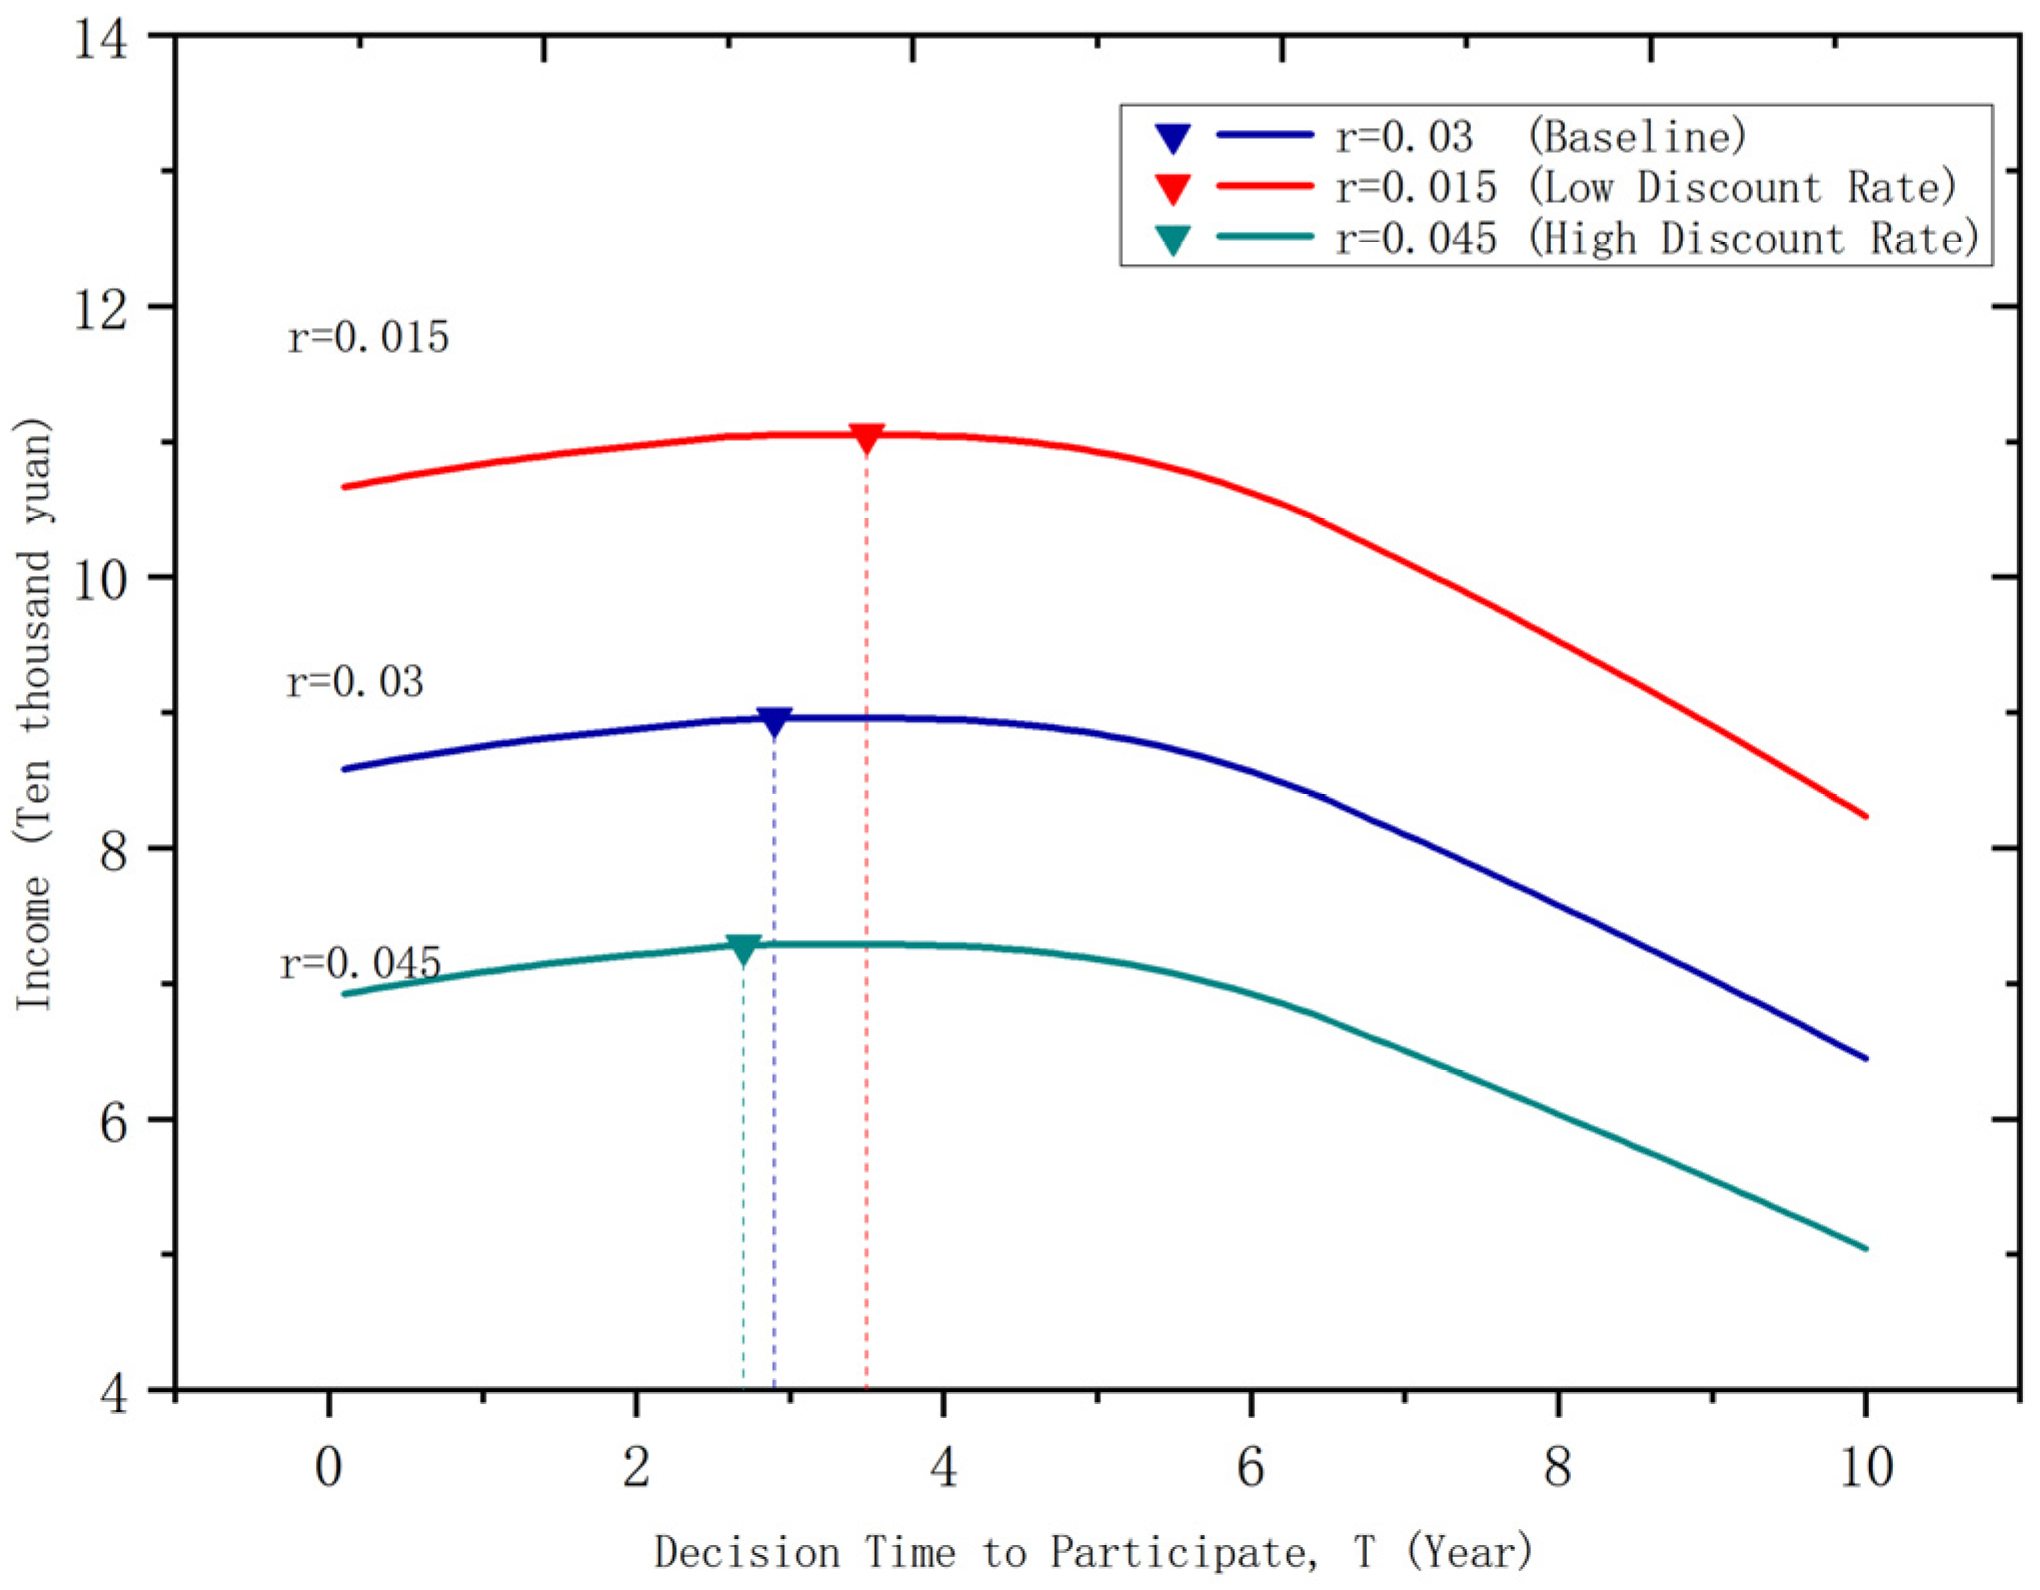
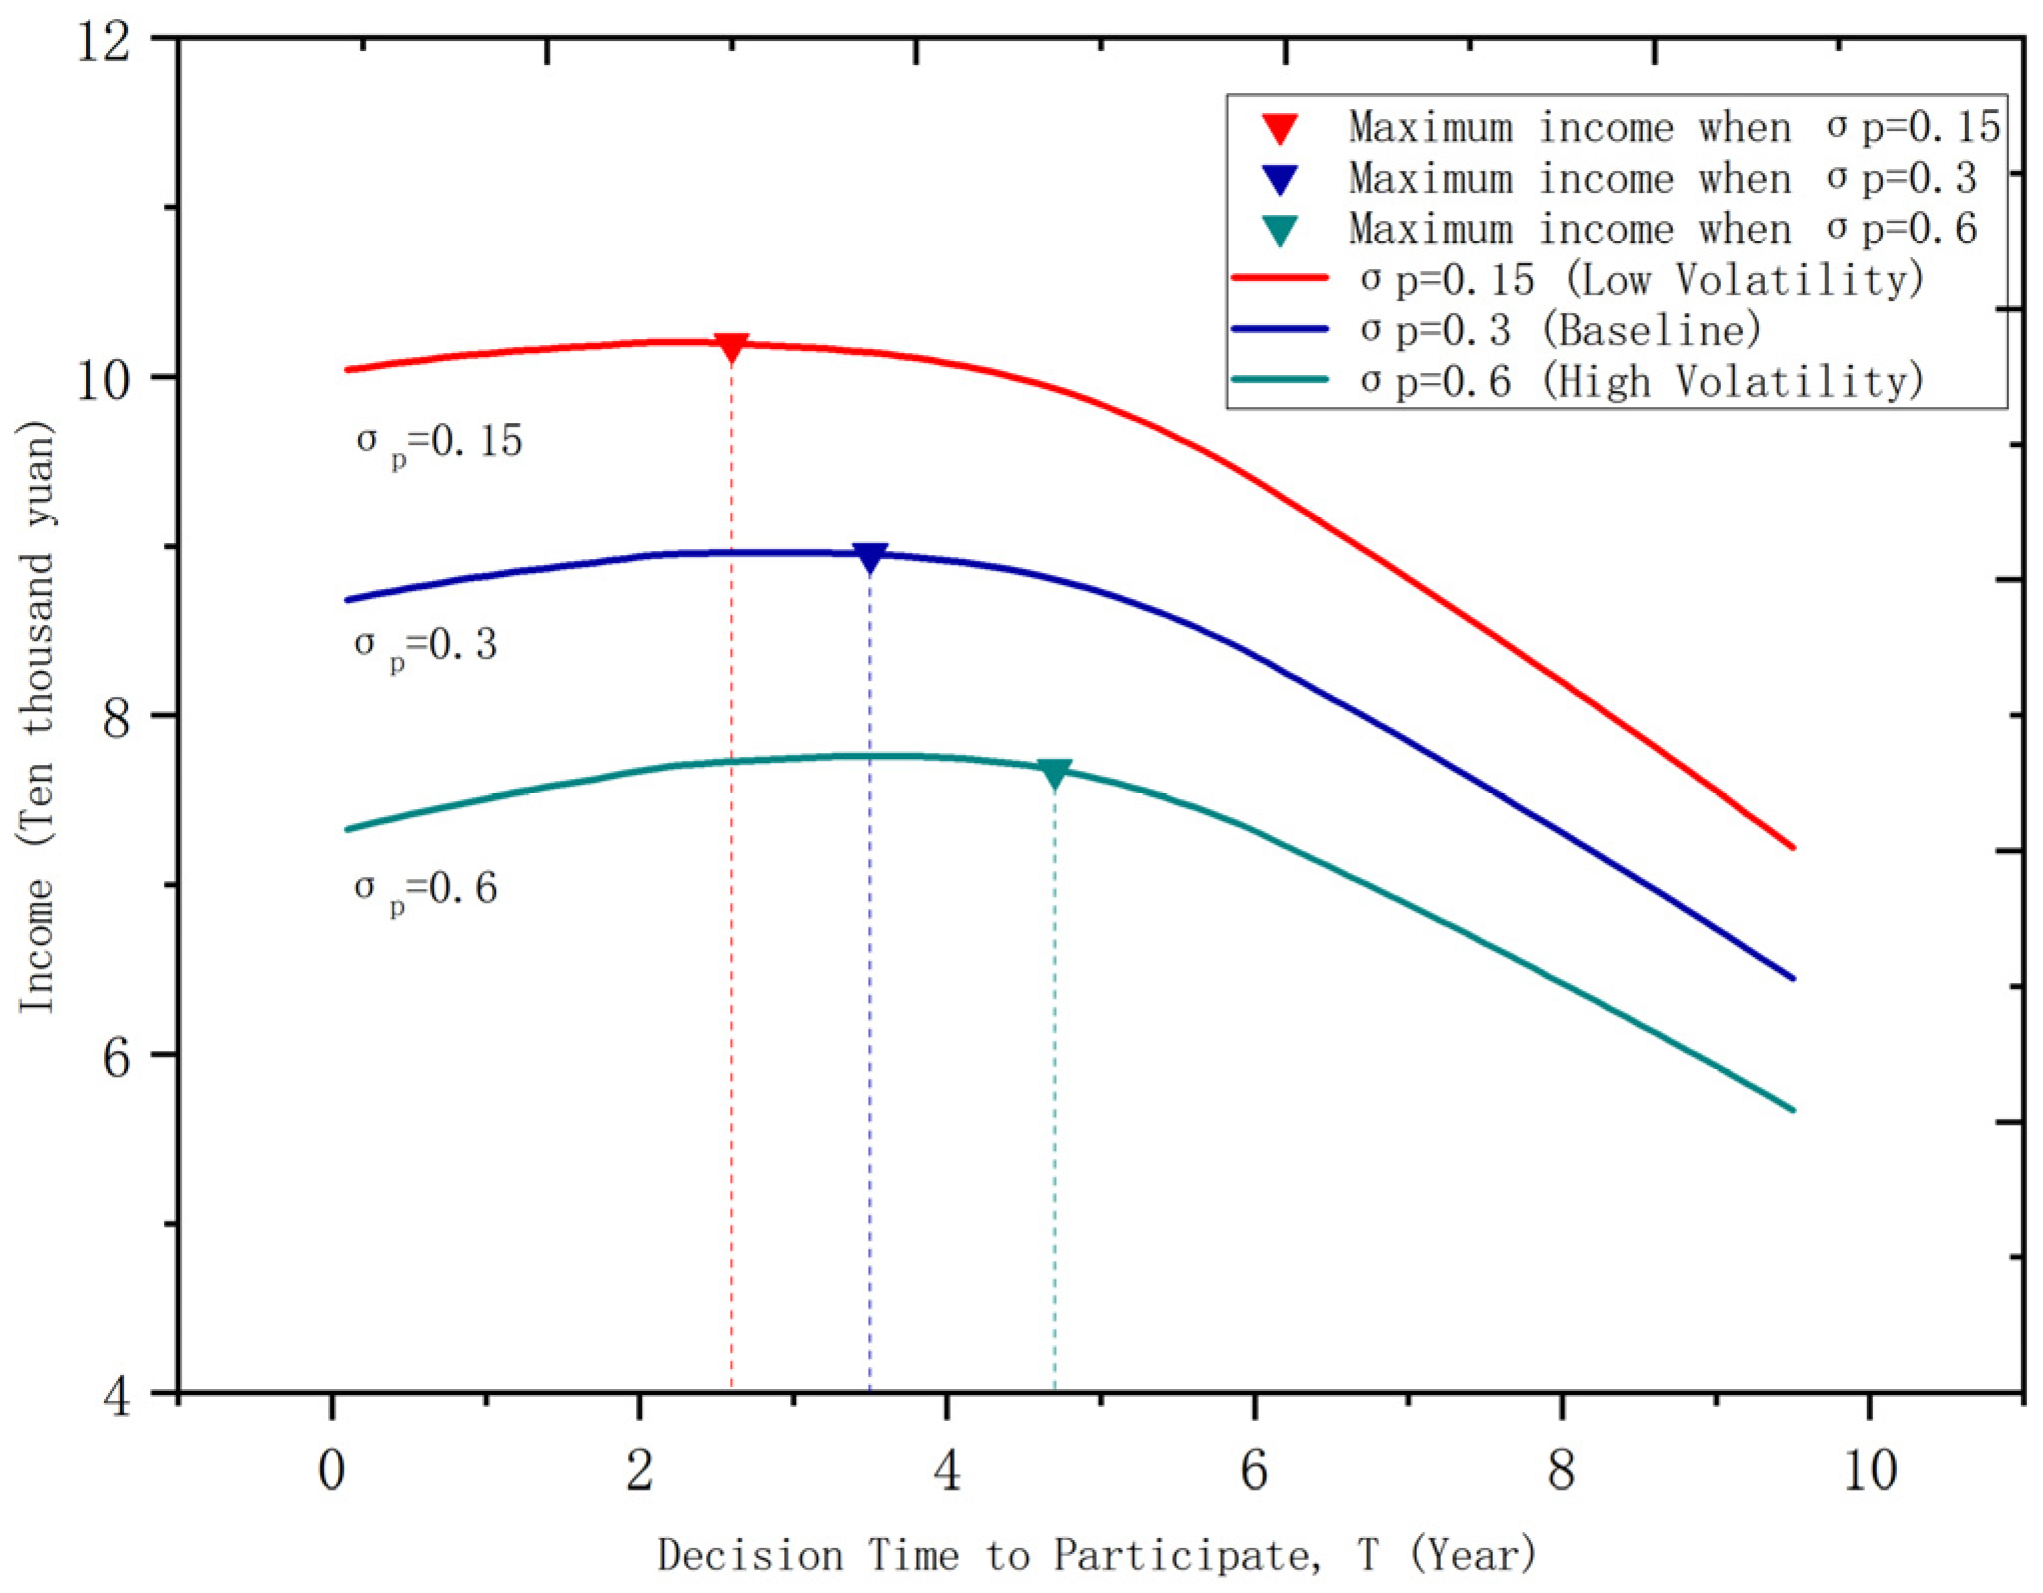
We first analyze the parameter σ p , which we reframe not merely as price volatility but as a proxy for system instability and the erosion of agent trust. The analysis (Figure 3) demonstrates a clear trend: increased system instability leads owners to postpone participation in shared parking.
The negative correlation between σ p and income is mathematically rooted in the diffusion term of the HJB equation (Equation (20)). As σ p increases, the value of the ‘wait’ region expands. Since the cost function is convex, the second derivative is positive, meaning higher volatility increases the required threshold price, effectively delaying entry and reducing the net present value of realized income during the simulation period.
This finding aligns with real-world expectations. For private parking space owners, shared parking represents a novel concept, and initial participation often occurs without prior experience. Under such circumstances, rapid fluctuations in shared parking prices introduce significant uncertainty (high σ p ), making participation decisions challenging.
The sensitivity analysis (Table 4) reveals the system’s highly non-linear response to this instability. While a 100% decrease in σ p (full stability) advances T* by 100% (immediate participation), a 100% increase in σ p delays T* by a massive 325.50%. This asymmetric response is critical: the negative impact of high instability (a 325% delay) is far greater than the positive impact of high stability (a 100% advance). This underscores owners’ pronounced risk aversion and a system-wide “freezing” effect when trust is low.
This reveals an Instability Trap. The system exhibits extreme risk aversion where entropy ( σ p ) erodes participation exponentially. This explains why subsidies fail in volatile markets: owners are not waiting for higher prices; they are waiting for lower entropy (order).
Policy Implications: These findings highlight a critical tension. Owners, seeking higher and stable profits, may delay participation amidst high volatility. Platforms and policymakers, aiming for rapid market adoption to alleviate urban congestion and pollution, need mechanisms to reduce this uncertainty. Therefore, establishing effective price stabilization mechanisms (e.g., reference pricing bands, volatility smoothing tools, or short-term price guarantees) is paramount for regulators and platforms to accelerate owner participation. Furthermore, targeted subsidies for early adopters entering a potentially volatile market could help mitigate perceived risks and encourage timely entry, fostering sustainable development of shared parking systems [27].

4.2.2. Positive Expectation Feedback Loops u p and Participation Timing

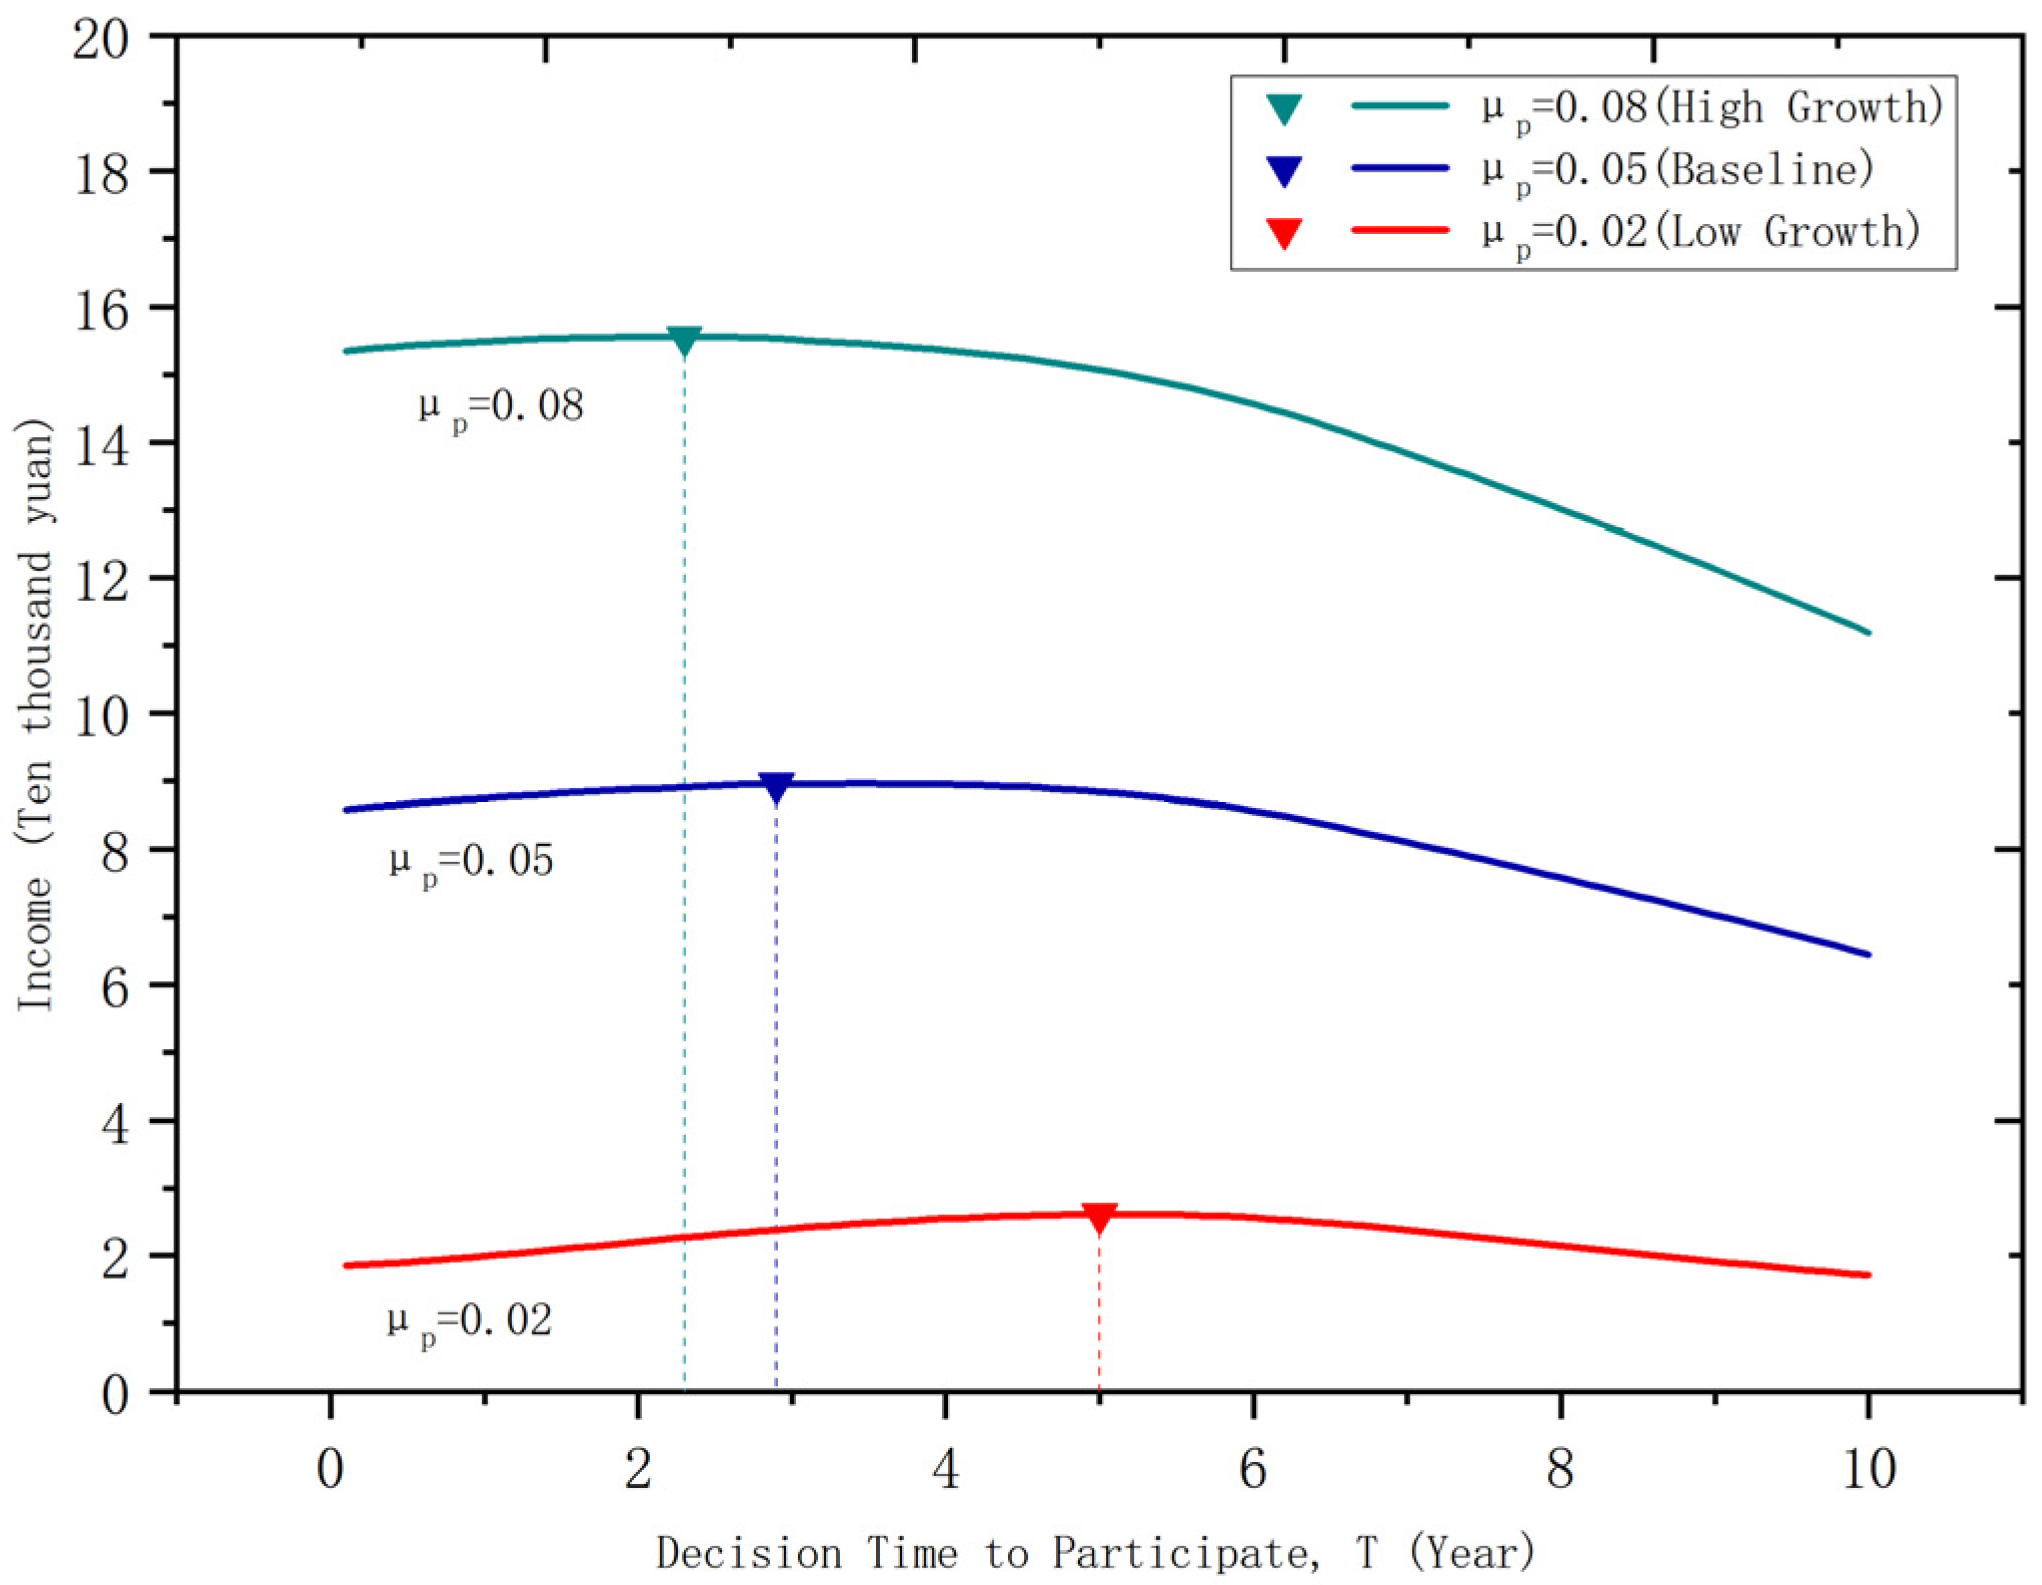
The price expectation rate parameter u p , or drift rate, acts as the primary positive expectation feedback loop in the system. The analysis (Figure 4) unequivocally demonstrates that higher expected growth rates u p significantly incentivize owners to advance their participation timing T* decreases). Elevated growth expectations signal greater future profitability, motivating rational owners to enter the sharing market earlier.
The sensitivity analysis (Table 5) reveals another critical asymmetric sensitivity. The system is far more sensitive to negative expectations than positive ones. A 100% decrease in u p (projecting price stagnation) causes a catastrophic 546.15% delay in T*. However, a 100% increase in u p (doubling growth expectation) only advances T* by 30.77%. This implies that a loss of confidence (negative u p ) is almost 18 times more damaging to system adoption than the benefit gained from high optimism.
Policy Implications: The potent influence of u p presents significant opportunities for market acceleration:
  • For Platforms: Actively communicating positive market trends and growth projections (e.g., rising demand, platform expansion plans) can leverage this sensitivity. Highlighting strong u p signals can be a powerful marketing tool to attract owners and encourage earlier commitments.
  • For Regulators: Policymakers play a vital role in fostering positive market expectations. This can be achieved through:
    Transparent Market Data: Regularly publishing data on parking demand growth, shared parking adoption rates, and price trends to substantiate positive u p
    Supportive Infrastructure & Regulations: Investing in enabling technologies (e.g., seamless access systems) and establishing clear, supportive legal frameworks for shared parking operations, boosting owner confidence in sustained market growth.
    Long-Term Planning Signals: Integrating shared parking into urban transportation master plans signals its permanence and growth potential.
Effectively managing and communicating growth expectations ( u p ) is thus a critical strategy for both platforms and regulators to drive timely owner participation and unlock the full potential of shared parking in alleviating urban congestion.

4.2.3. System Thresholds (r) and Participation Timing

The discount rate (r) reveals the system’s non-linear, threshold-driven impact. As Figure 5 shows, higher discount rates incentivize earlier participation (T* decreases), but reduce the net present value of total revenue.
The sensitivity analysis (Table 6) confirms this threshold behavior, which exhibits a piecewise function characteristic. The system is largely insensitive to increases in r (T* change = 0.00%). However, a critical threshold exists: a reduction in r exceeding approximately 10–25% triggers a discrete jump, or state-shift, delaying T* by a substantial 30.77%. This indicates the existence of a critical threshold value for r (around 0.027), below which owners abruptly postpone participation. This behavior is consistent with the concept of a ‘Discount Rate Wedge’ observed in Real Options literature [36,37].
Theoretically, this wedge represents the premium required to compensate for the irreversibility of the investment under uncertainty. While standard NPV theory suggests investing whenever r > 0 , our model demonstrates that in the presence of stochastic volatility ( σ p ), owners implicitly set a higher hurdle rate ( r + w e d g e ). The 0.027 threshold is therefore not arbitrary; it quantifies the specific ‘Option Value of Waiting’ within the Chinese shared parking market.
Policy Implications: This threshold effect has significant practical implications:
  • For Platforms: Changes in T* induced by r fluctuations do not substantially alter total owner revenue potential, but they impact when supply comes online. Platforms can employ targeted marketing strategies (e.g., emphasizing immediate income stability, offering sign-up bonuses) to counteract potential waning enthusiasm r falls near the threshold region, maintaining participation momentum.
  • For Regulators: The identified discount rate threshold (~0.027) offers a critical lever. When market interest rates drop below this threshold, policymakers should proactively deploy incentive mechanisms (e.g., accelerated depreciation for shared parking infrastructure, temporary tax credits for early participants) to counteract the natural tendency for participation delay revealed by this model. Such timely interventions can help sustain the growth trajectory of urban shared parking systems during low-interest-rate periods.

4.2.4. Internal System Friction ( w g g t ) and Systemic Collapse

We reframe management fees ( w g g t ) as internal system friction. This parameter is not merely a cost item; it represents the operational and coordination overhead (e.g., maintenance, user communication, community coordination) that “slows down” the system.
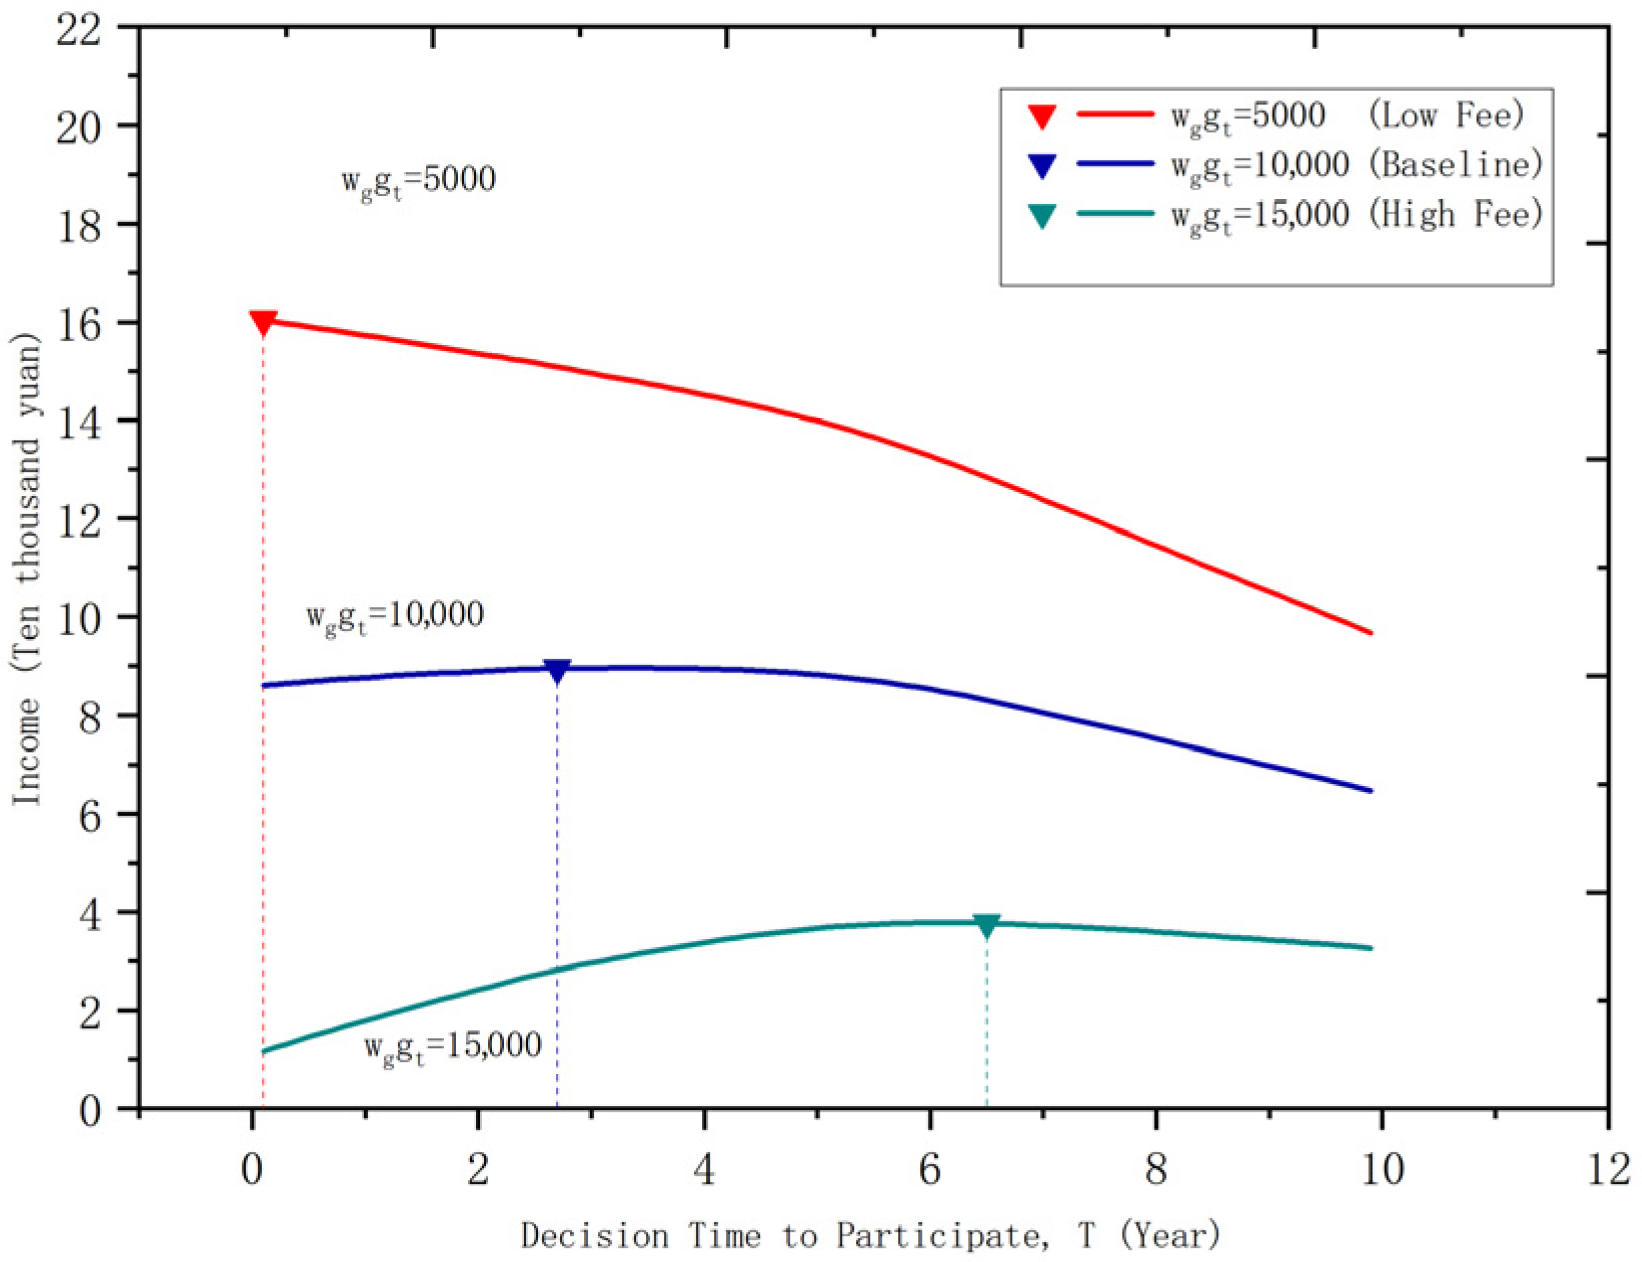
The results (Figure 6) demonstrate the system’s sensitivity to internal friction (management costs w g g t ), and the system’s extreme non-linearity and fragility to this friction.
The sensitivity analysis (Table 7) reveals a highly asymmetric leverage effect. A 10% reduction in friction advances T* by 7.69%. However, a 10% increase in friction delays T* by 76.92%—a tenfold negative impact.
This fragility escalates to a tipping point. A 100% increase in friction causes an extreme delay (492.31%) and a near-total revenue loss (95.48%). This is not a simple cost increase; it represents a systemic collapse. The high internal friction creates a prohibitive barrier that effectively “kills” the system, driving participation and revenue to zero. This identifies w g g t as the single highest-leverage point for policy intervention.
The system displays a phase transition we term the Friction Cliff. Once internal transaction costs cross a critical threshold, the system does not just become less profitable; it suffers a systemic collapse. This validates the Coasean theory that platforms exist solely to reduce these frictions below market levels.
Policy Implications: These results necessitate coordinated interventions:
  • Regulators should implement targeted management fee subsidies (e.g., covering 50–70% of baseline costs for early adopters) and standardize community access protocols to reduce coordination burdens.
  • Platforms must develop automated management tools (e.g., AI-based reservation systems, conflict resolution modules) to minimize owner operational overhead.

4.2.5. Positive Demand-Side Feedback (Q) and State-Shifts

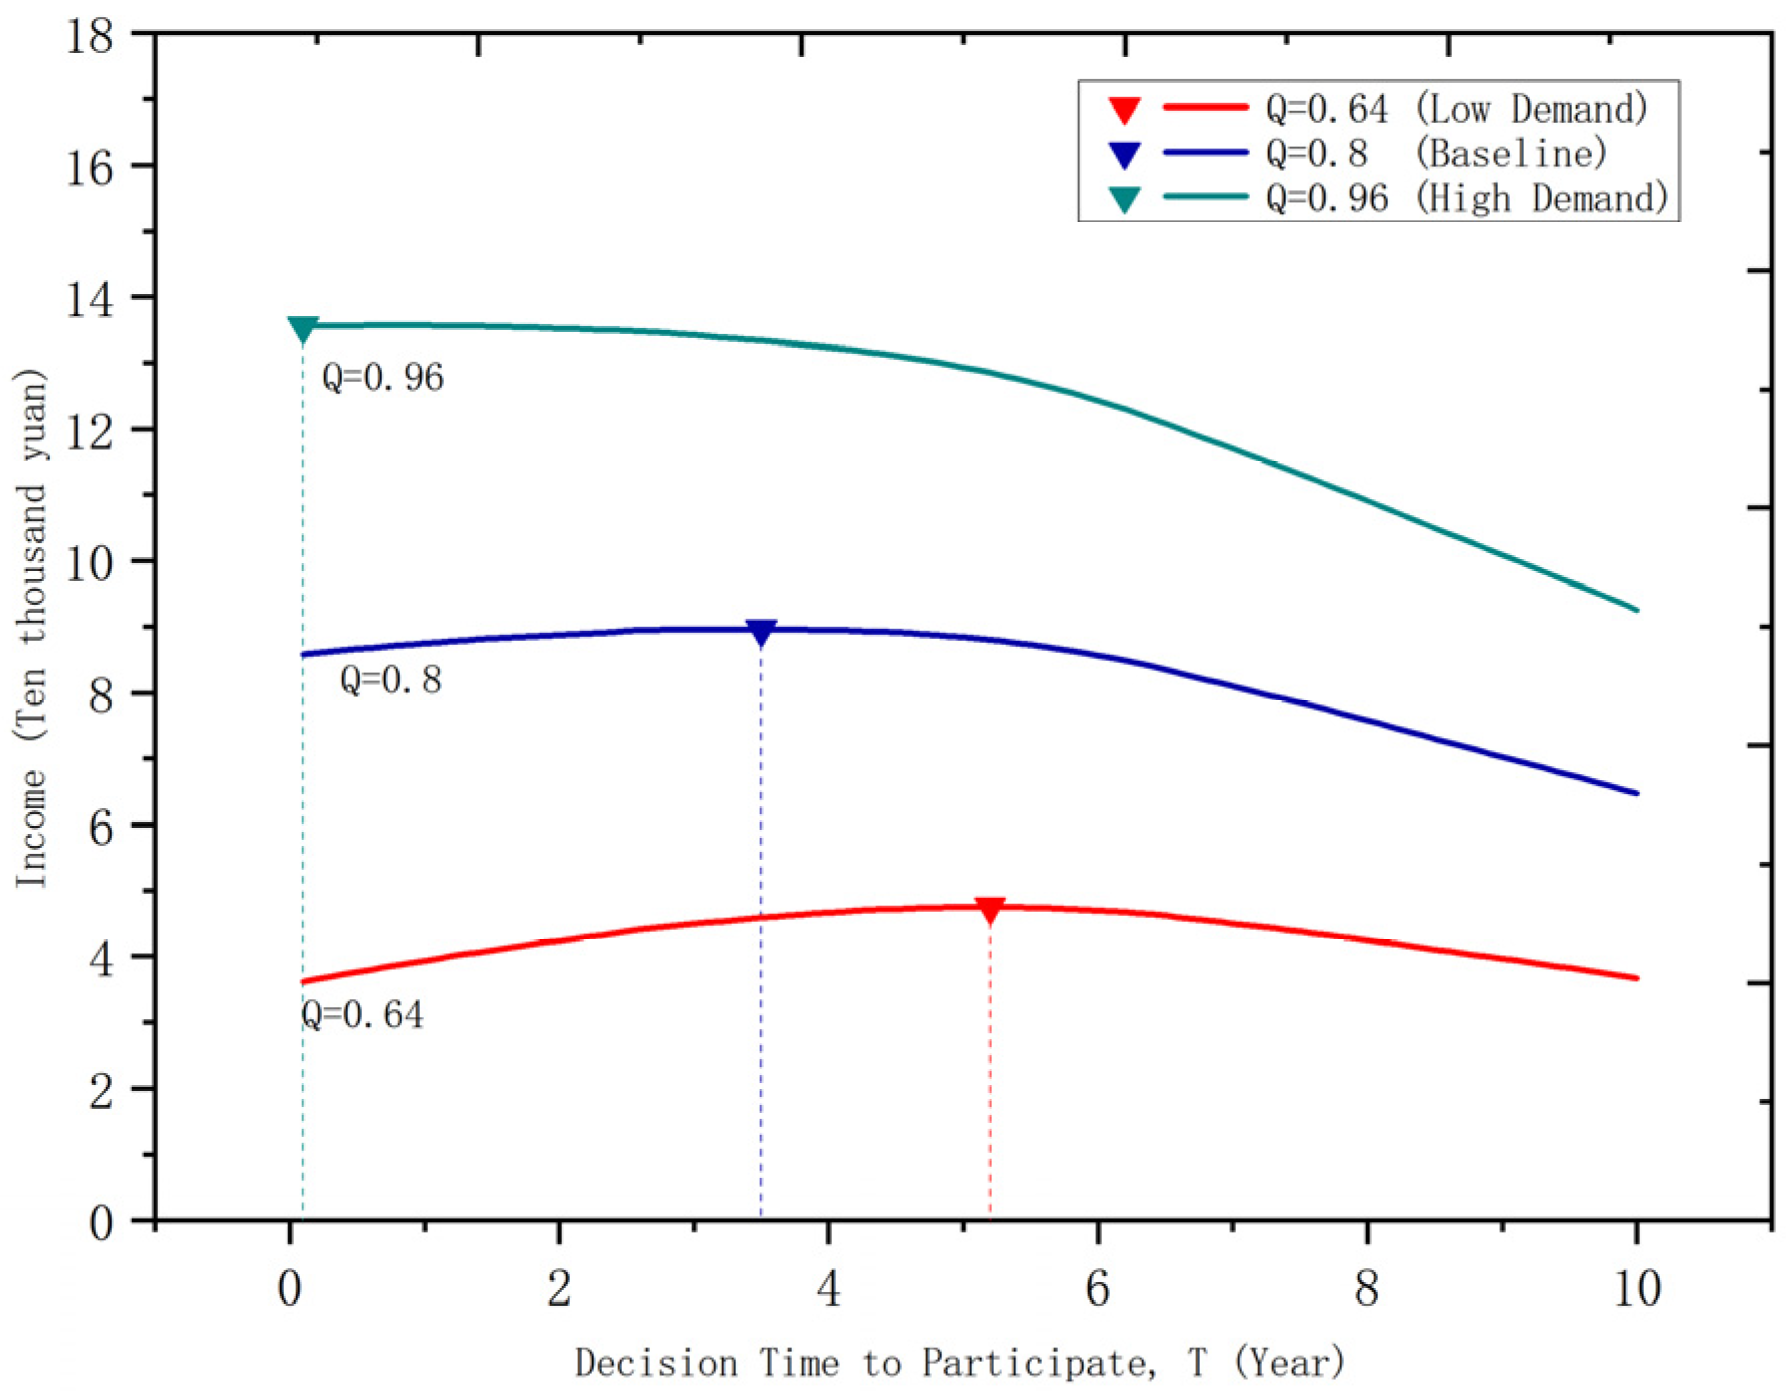
The transaction ratio (Q) represents the primary positive feedback loop from the “user” sub-system to the “owner” sub-system. Higher demand signals accelerate participation (T* decreases) and amplify revenue (Figure 7).
The system’s sensitivity to this feedback loop is profound (Table 8). A 20% decrease in demand (Q) delays T* by 92.31% and cuts revenue by 46.59%. However, a 20% increase in demand advances T* by 100% (triggering immediate participation) and increases revenue by 51.93%. This confirms the system can be rapidly “switched on” (a state-shift to T* 0) by amplifying its positive demand-side feedback loop.
Conversely, demand (Q) acts as a high-leverage trigger. A marginal 20% increase triggers a Positive Tipping Point, shifting the system instantly from a dormant state to an active state (T* → 0). This confirms the existence of powerful reinforcing feedback loops once critical mass is achieved.
Policy Implications:
  • Platforms should deploy demand-stimulating incentives (e.g., user coupons, peak-hour pricing discounts) which indirectly accelerate supply-side participation.
  • Municipalities must implement demand-shifting policies:
    Increase on-street parking fees by 30–50%
    Restrict CBD cruising through congestion pricing
    These measures redirect demand to shared platforms, elevating transaction ratios.

4.2.6. Transactional Friction ( δ ) and Asymmetric Response

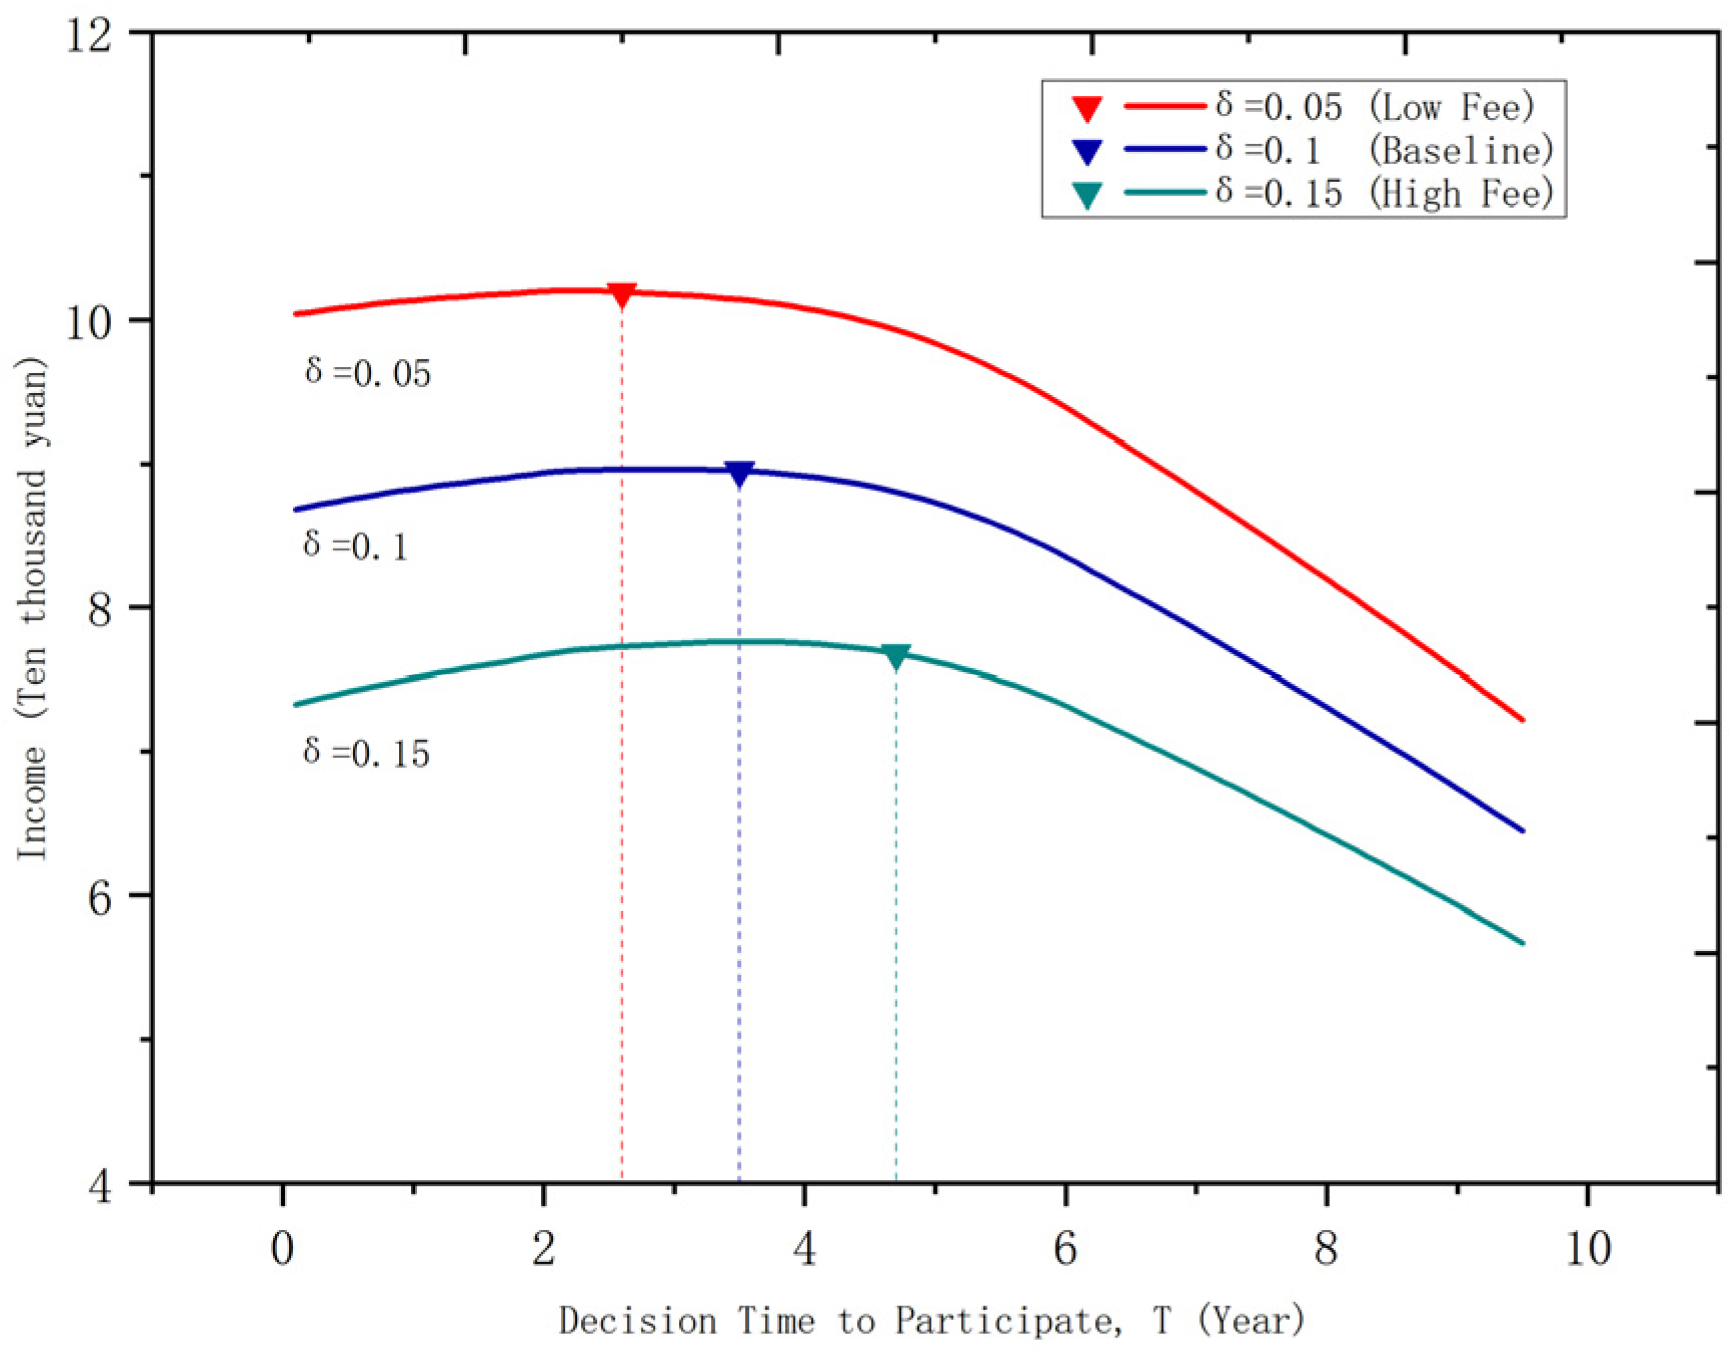
Finally, the platform fee ( δ ) represents transactional friction imposed by the platform operator (the system’s central “regulator”). Figure 8 and Table 9 reveal another asymmetric impact.
The system’s response to fee changes is not linear. A 25% decrease in fees (from 10% to 7.5%) has no effect on participation timing (T* change = 0.00%). However, a 25% increase (from 10% to 12.5%) triggers a 53.85% delay in participation. This demonstrates that once a fee is perceived as ‘fair’ (the 10% baseline), reducing it further yields no benefit, but increasing it incurs a disproportionate systemic penalty, acting as a ‘choke’ on agent participation.
Policy Implications:
  • Platforms require tiered commission models (e.g., 5–15% scaled by usage volume) to balance profitability with participation incentives.
  • Regulators should:
    Mandate fee transparency and cap increases beyond 20%
    Introduce tax rebates for platforms maintaining fees ≤ 10%

5. Discussion

5.1. Policy Implications: The Dynamic Calibration Protocol

Urban parking scarcity, driven by the persistent low utilization (<15%) of private assets, represents a critical policy failure in urban China. This study reframed this challenge, modeling shared parking not as a simple supply-demand problem, but as a complex socio-technical system vulnerable to policy misalignment and agent uncertainty. We developed and applied a dynamic LCC-HJB optimization framework to move beyond static analysis, providing the first evidence-driven tool to calibrate this system’s non-linear dynamics.
Our sensitivity analysis reveals that the system exhibits distinct “failure modes”: it freezes under high entropy ( σ p ) and collapses under high friction ( w g g t ). Consequently, a static policy bundle is insufficient. Instead, we propose a Dynamic Calibration Protocol sequenced in three stages: Stabilization, Friction Removal, and Activation. This sequence aligns policy interventions with the agent’s psychological adoption thresholds. Therefore, this study’s primary contribution is a synergistic policy bundle that must be implemented concurrently to ensure system viability:
(1) Stage 1: Stabilization (Addressing Institutional Entropy σ p )
The model shows that a 100% increase in volatility ( σ p ) delays participation by 325%. This indicates an Instability Trap: agents rationally delay participation (T*) when the future is opaque. Therefore, the immediate priority for regulators is not to maximize revenue, but to minimize entropy.
Policy Instrument: We recommend establishing a Minimum Revenue Guarantee (MRG) fund for the first 24 months. By capping the downside risk, the regulator artificially reduces the effective σ p perceived by owners.
(2) Stage 2: Friction Removal (Addressing Transaction Costs w g g t )
Our simulation identifies a Friction Cliff: a doubling of internal costs ( w g g t ) triggers a 95% revenue collapse. This suggests that high transaction costs—such as privacy concerns, gatekeeping by property managers, and complex hardware installation—are not just nuisances but existential threats to the system.
Policy Instrument: Municipalities should introduce targeted regulatory waivers for shared parking pilots, skipping redundant administrative approval steps. Subsidies, on the other hand, must focus strictly on removing technological friction, such as funding smart locks that do away with manual checks, instead of covering general operational costs.
(3) Stage 3: Activation (Triggering Demand Q)
Only after the system is stabilized and friction is reduced should demand-side levers be pulled. The model demonstrates a positive tipping point: a 20% increase in demand (Q) can trigger immediate participation (T* → 0).
Policy Instrument: Implement Dynamic Congestion Pricing and reduce on-street parking supply in pilot zones.
The LCC-HJB framework presented here serves as a dynamic Decision Support System (DSS). It provides urban planners and platform operators with a robust tool for scenario testing, allowing them to “wind tunnel” policy combinations before deployment to optimize the system for resilience and rapid adoption, ultimately helping to alleviate urban congestion.

5.2. Policy Coupling and Compensatory Dynamics

While our numerical analysis isolates individual parameters (ceteris paribus), the distinct non-linearities of Friction ( w g g t ) and Demand (Q) allow us to theorize their interaction.
Comparing Table 6 and Table 7 reveals a critical asymmetry in leverage. A 10% increase in Internal Friction ( w g g t ) delays participation by approximately 77%, creating strong inertia. Conversely, a 10% increase in Demand (Q) only advances participation by approximately 8%. This suggests that in the early stages of platform adoption, friction acts as a dominant constraint that demand signals cannot easily overcome.
However, because Demand (Q) exhibits a “tipping point” behavior at +20% (where T* → 0), we posit a Threshold Compensatory Mechanism: regulators cannot rely on incremental demand stimulation (e.g., small subsidies) to offset high friction. Instead, they must first reduce friction below the “collapse threshold” identified in Figure 6. Only once w g g t is stabilized can the non-linear “tipping point” of Demand (Q) be effectively triggered. This implies that Friction Removal is a prerequisite condition for Demand Activation, rather than a substitute.

5.3. Geographic Heterogeneity and Model Scalability

While this study calibrates parameters based on Tier-1 city data (characterized by high scarcity and high asset valuations), the LCC-HJB framework offers predictive insights for Tier-2 and Tier-3 cities. In lower-tier markets, the Friction Cliff dynamics are expected to shift due to the differential between labor costs and asset revenue. Theoretically, the lower cost of labor in Tier-3 cities could reduce the baseline Internal Friction ( w g g t ), potentially shifting the Friction Cliff to the right and allowing for more labor-intensive (manual) management models that would be economically unviable in Tier-1 contexts. However, this is counterbalanced by lower market clearing prices ( P p ) for parking. Our model implies that in these price-sensitive environments, the system’s tolerance for fixed technological costs (e.g., expensive smart locks) is lower. Therefore, while Tier-1 strategies must prioritize volatility suppression ( σ p ) to unlock high-value assets, Tier-3 strategies should prioritize cost minimization to ensure the lower revenue streams do not fall behind the viability thresholds identified in Figure 6. This suggests that a lite version of the platform technology—sacrificing some automation for lower franchise fees—may be optimal for lower-tier implementation.

5.4. Limitations & Future Work

While parameters reflect China’s urban context, this study has limitations that open avenues for future research.
First, the current model treats the Demand Signal ( Q ) as an exogenous parameter, independent of price. We acknowledge that in a fully dynamic market, demand is endogenous and price-elastic. Empirical studies on parking pricing reforms in Chinese cities demonstrate this sensitivity; for instance, implementing tiered pricing structures significantly reduced parking duration and demand volume [38]. Similarly, price increases led to a measurable decrease in on-street parking demand (approximately 20% in specific zones), confirming a negative price elasticity [39]. Future iterations of this framework will endogenize demand by defining Q as a decreasing function of price ( Q ( P p ) = Q 0 P p ε ), creating a closed-loop feedback system where platform pricing strategies ( P p ) dynamically equilibrate with user participation rates.
Second, while we simulated the interaction between Friction ( w g g t ) and Demand ( Q ) analytically in Section 5.2, future work should employ coupled stochastic differential equations to model their co-evolution mathematically.
Third, our parameter calibration relies on aggregate data from Tier-1 cities; future studies should expand regional validation to capture the heterogeneity of Tier-2 and Tier-3 cities where opportunity costs may differ.
Fourth, the current model relies on a single representative agent approach. It does not yet account for game-theoretic interactions, such as multi-owner competition (where one owner’s entry dilutes another’s demand) or multi-platform collaboration, which may influence the equilibrium strategies in high-density neighborhoods.

6. Conclusions

This study reframed the urban shared parking stagnation as a socio-technical optimal stopping problem. By integrating Life-Cycle Cost (LCC) analysis with the Hamilton-Jacobi-Bellman (HJB) optimization, we quantified the non-linear thresholds that govern the conversion of static assets into dynamic service flows.

6.1. Theoretical Contributions

The model identifies three critical failure modes in the current market:
(1) The Instability Trap: A 100% increase in institutional entropy ( σ p ) delays participation by 325%, confirming that volatility is a stronger deterrent than low prices.
(2) The Friction Cliff: Internal transaction costs ( w g g t ) exhibit a tipping point behavior; a doubling of these costs leads to a 95% collapse in revenue, validating the Coasean necessity of frictionless sharing.
(3) The Positive Tipping Point: Demand signals ( Q ) possess a non-linear leverage effect, where a 20% increase can trigger immediate system-wide adoption.

6.2. Managerial Implications for Platform Operators

Beyond public policy, these findings offer specific strategic imperatives for platform operators:
Risk Shielding: Since owners are hyper-sensitive to volatility, platforms should not merely act as matchmakers but as “insurers.” Implementing Minimum Revenue Guarantees (MRG) or fixed-rate payout models for the first 12 months can artificially suppress perceived σ p , accelerating owner onboarding.
Technology over Pricing: Sensitivity analysis shows that reducing platform fees ( δ ) below 10% yields negligible participation gains. Instead, platforms should reinvest commissions into automation hardware (e.g., smart locks, LPR cameras). Reducing the physical friction ( w g g t ) of the transaction is far more effective at unlocking supply than marginal fee reductions.
Signaling Growth: Given the asymmetry in drift rate expectations ( u p ), platforms must aggressively market future demand growth data to asset owners. Countering the “fear of stagnation” is as critical as the current pricing strategy.

Author Contributions

J.L. and F.C.; methodology, J.L. and F.C.; software, J.L. and J.X.; validation, J.X., L.Z. and H.W.; formal analysis, J.L.; investigation, J.L. and J.X.; resources, F.C.; data curation, J.X.; writing—original draft preparation, J.L.; writing—review and editing, F.C.; visualization, J.L.; supervision, F.C.; project administration, F.C.; funding acquisition, F.C., Y.L. and Z.Z. All authors have read and agreed to the published version of the manuscript.

Funding

This research was funded by the Guangxi Science and Technology Major Project (Grant No. AA22068057) and the National Natural Science Foundation of China (Grant Nos. 62262009, 62495083).

Data Availability Statement

The data supporting the findings of this study are available within the article.

Acknowledgments

I would like to thank my supervisor Fujian Chen and all individuals who have contributed to the completion of this paper.

Conflicts of Interest

The authors declare no conflicts of interest.

Abbreviations

The following abbreviations are used in this manuscript:
LCCLife-Cycle Cost
HJBHamilton-Jacobi-Bellman
STSSocio-Technical System
GBMGeometric Brownian Motion
FDMFinite Difference Method
DSSDecision Support System
ADAutonomous Driving
NPVNet Present Value

References

  1. Geroliminis, N. Cruising-for-Parking in Congested Cities with an MFD Representation. Econ. Transp. 2015, 4, 156–165. [Google Scholar] [CrossRef]
  2. Verma, P.; Perrotti, D.; Schiller, G. Metabolism of Interconnected Cities: A Review of the Literature and Analytical Framework. Resour. Conserv. Recycl. 2025, 217, 108194. [Google Scholar] [CrossRef]
  3. Zhang, Y. Urban Metabolism: A Review of Research Methodologies. Environ. Pollut. 2013, 178, 463–473. [Google Scholar] [CrossRef] [PubMed]
  4. Virág, D.; Wiedenhofer, D.; Haas, W.; Haberl, H.; Kalt, G.; Krausmann, F. The Stock-Flow-Service Nexus of Personal Mobility in an Urban Context: Vienna, Austria. Environ. Dev. 2022, 41, 100628. [Google Scholar] [CrossRef]
  5. Vespignani, A. Modelling Dynamical Processes in Complex Socio-Technical Systems. Nat. Phys. 2012, 8, 32–39. [Google Scholar] [CrossRef]
  6. Wang, A.; Guan, H.; Qin, Z.; Zhu, J. Study on the Intention of Private Parking Space Owners of Different Levels of Cities to Participate in Shared Parking in China. Discret. Dyn. Nat. Soc. 2021, 2021, 9955686. [Google Scholar] [CrossRef]
  7. Tscharaktschiew, S.; Reimann, F. The Economics of Speed Choice and Control in the Presence of Driverless Vehicle Cruising and Parking-as-a-Substitute-for-Cruising. Transp. Res. Part B Methodol. 2023, 178, 102834. [Google Scholar] [CrossRef]
  8. Shafiei, S.; Gu, Z.; Grzybowska, H.; Cai, C. Impact of Self-Parking Autonomous Vehicles on Urban Traffic Congestion. Transportation 2023, 50, 183–203. [Google Scholar] [CrossRef]
  9. Ardeshiri, A.; Safarighouzhdi, F.; Rashidi, T.H. Measuring Willingness to Pay for Shared Parking. Transp. Res. Part A Policy Pract. 2021, 152, 186–202. [Google Scholar] [CrossRef]
  10. Thi Kim, O.T.; Dang Tri, N.; Nguyen, V.D.; Tran, N.H.; Hong, C.S. A Shared Parking Model in Vehicular Network Using Fog and Cloud Environment. In Proceedings of the 2015 17th Asia-Pacific Network Operations and Management Symposium (APNOMS), Busan, Republic of Korea, 19–21 August 2015; pp. 321–326. [Google Scholar]
  11. Shao, C.; Yang, H.; Zhang, Y.; Ke, J. A Simple Reservation and Allocation Model of Shared Parking Lots. Transp. Res. Part C Emerg. Technol. 2016, 71, 303–312. [Google Scholar] [CrossRef]
  12. Ran, J.; Guo, X.; Tang, L.; Zhang, Y. Bi-Level Model for Shared Parking Decision-Making Based on Parking Lot Assignment Simulation. J. Southeast Univ. (Engl. Ed.) 2011, 27, 322–327. [Google Scholar]
  13. Li, Q.; Cheng, J.; Chen, L. Research on Shared Parking Allocation Considering the Heterogeneity of Parking Slot Providers’ Temporary Parking Demand. Transp. Lett. 2024, 16, 1305–1317. [Google Scholar] [CrossRef]
  14. Zhou, X.; Jiang, H.; Bai, M.; Chen, R. Online Pricing for Balancing Parking Demand and Supply in a Shared Parking Case. In Proceedings of the 2025 7th International Conference on Data-driven Optimization of Complex Systems (DOCS), Taiyuan, China, 19 August 2025; pp. 204–209. [Google Scholar]
  15. Jiang, B.; Fan, Z.-P. Optimal Allocation of Shared Parking Slots Considering Parking Unpunctuality under a Platform-Based Management Approach. Transp. Res. Part E Logist. Transp. Rev. 2020, 142, 102062. [Google Scholar] [CrossRef]
  16. Liu, Y.; Liu, C.; Luo, X. Spatiotemporal Deep-Learning Networks for Shared-Parking Demand Prediction. J. Transp. Eng. Part A Syst. 2021, 147, 04021026. [Google Scholar] [CrossRef]
  17. Wang, S.; Li, Z.; Xie, N. A Reservation and Allocation Model for Shared-Parking Addressing the Uncertainty in Drivers’ Arrival/Departure Time. Transp. Res. Part C Emerg. Technol. 2022, 135, 103484. [Google Scholar] [CrossRef]
  18. Yan, P.; Cai, X.; Ni, D.; Chu, F.; He, H. Two-Stage Matching-and-Scheduling Algorithm for Real-Time Private Parking-Sharing Programs. Comput. Oper. Res. 2021, 125, 105083. [Google Scholar] [CrossRef]
  19. Jiang, Y.-P.; Shao, X.-R.; Song, X.-C. Matching Model between Private Idle Parking Slots and Demanders for Parking Slot Sharing. J. Transp. Eng. Part A Syst. 2021, 147, 04021028. [Google Scholar] [CrossRef]
  20. Xiao, H.; Xu, M.; Gao, Z. Shared Parking Problem: A Novel Truthful Double Auction Mechanism Approach. Transp. Res. Part B Methodol. 2018, 109, 40–69. [Google Scholar] [CrossRef]
  21. Xiao, H.; Xu, M. How to Restrain Participants Opt out in Shared Parking Market? A Fair Recurrent Double Auction Approach. Transp. Res. Part C Emerg. Technol. 2018, 93, 36–61. [Google Scholar] [CrossRef]
  22. Haken, H. Synergetics. Phys. Bull. 1977, 28, 412. [Google Scholar] [CrossRef]
  23. Haken, H. An Introduction: Nonequilibrium Phase Transitions and Self-Organization in Physics, Chemistry and Biology. In Synergetics: Introduction and Advanced Topics; Springer: Berlin/Heidelberg, Germany, 2004; pp. 1–387. [Google Scholar]
  24. Portugali, J.; Haken, H. Synergetic Cities. In Handbook on Cities and Complexity; Edward Elgar Publishing: Cheltenham, UK; Northampton, MA, USA, 2021; pp. 108–135. ISBN 1-78990-012-3. [Google Scholar]
  25. Asiedu, Y.; Gu, P. Product Life Cycle Cost Analysis: State of the Art Review. Int. J. Prod. Res. 1998, 36, 883–908. [Google Scholar] [CrossRef]
  26. Farr, J.V. Systems Life Cycle Costing: Economic Analysis, Estimation, and Management; CRC Press: Boca Raton, FL, USA, 2011; ISBN 978-1-4398-2891-5. [Google Scholar]
  27. Yan, Q.; Feng, T.; Timmermans, H. Private Owners’ Propensity to Engage in Shared Parking Schemes under Uncertainty: Comparison of Alternate Hybrid Expected Utility-Regret-Rejoice Choice Models. Transp. Lett. 2023, 15, 754–764. [Google Scholar] [CrossRef]
  28. Weston, J.; Tolić, D.; Palunko, I. Application of Hamilton–Jacobi–Bellman Equation/Pontryagin’s Principle for Constrained Optimal Control. J. Optim. Theory Appl. 2024, 200, 437–462. [Google Scholar] [CrossRef]
  29. Dolgov, S.; Kalise, D.; Saluzzi, L. Data-Driven Tensor Train Gradient Cross Approximation for Hamilton–Jacobi–Bellman Equations. SIAM J. Sci. Comput. 2023, 45, A2153–A2184. [Google Scholar] [CrossRef]
  30. Litman, T. Parking Management Best Practices; Routledge: New York, NY, USA, 2020; ISBN 1-351-17954-3. [Google Scholar]
  31. Tyndall & Associates. Landscape B03: Coordinated Parking—Operational Cost Analysis. In Landscape Master Plan B.Framework; U.S. Air Force: Washington, DC, USA, 2019. [Google Scholar]
  32. González-Muñoz, R.-I.; Molina-Muñoz, J.; Mora-Valencia, A.; Perote, J. Real Options Volatility Surface for Valuing Renewable Energy Projects. Energies 2024, 17, 1225. [Google Scholar] [CrossRef]
  33. Litman, T. Autonomous Vehicle Implementation Predictions; VTPI: Victoria, BC, Canada, 2023. [Google Scholar]
  34. Martínez-Ceseña, E.A.; Mutale, J. Application of an Advanced Real Options Approach for Renewable Energy Generation Projects Planning. Renew. Sustain. Energy Rev. 2011, 15, 2087–2094. [Google Scholar] [CrossRef]
  35. Gao, G.L.; Wang, K. Operational situation and outlook of China’s urban economy (2023–2024). Bull. Chin. Acad. Sci. 2024, 39, 105–111. [Google Scholar]
  36. Gormsen, N.J.; Huber, K. Corporate Discount Rates. Am. Econ. Rev. 2025, 115, 2001–2049. [Google Scholar] [CrossRef]
  37. McDonald, R.; Siegel, D. The Value of Waiting to Invest. Q. J. Econ. 1986, 101, 707–727. [Google Scholar] [CrossRef]
  38. Wang, H.; Li, R.; Wang, X.; Shang, P. Effect of On-Street Parking Pricing Policies on Parking Characteristics: A Case Study of Nanning. Transp. Res. Part A Policy Pract. 2020, 137, 65–78. [Google Scholar] [CrossRef]
  39. Mo, B.; Kong, H.; Wang, H.; Wang, X.C.; Li, R. Impact of Pricing Policy Change on On-Street Parking Demand and User Satisfaction: A Case Study in Nanning, China. Transp. Res. Part A Policy Pract. 2021, 148, 445–469. [Google Scholar] [CrossRef]
Figure 1. Flowchart of private parking space sharing under resale model.
Systems 14 00091 g001
Figure 2. Life cycle cost of owners participating in shared parking spaces.
Systems 14 00091 g002
Figure 3. Shared parking space usage price volatility and owner-sharing decision-making. The vertical dashed lines indicate the optimal decision time (T*) corresponding to the maximum net income for each scenario.
Systems 14 00091 g003
Figure 4. Shared parking space usage price drift rate and owner-sharing decision-making. The vertical dashed lines indicate the optimal decision time (T*) corresponding to the maximum net income for each scenario.
Systems 14 00091 g004
Figure 5. Discount rate and owner-shared decision-making. The vertical dashed lines indicate the optimal decision time (T*) corresponding to the maximum net income for each scenario.
Systems 14 00091 g005
Figure 6. Shared parking space management costs and owners’ shared decision-making. The vertical dashed lines indicate the optimal decision time (T*) corresponding to the maximum net income for each scenario.
Systems 14 00091 g006
Figure 7. Shared parking space transaction ratio and owner-sharing decision-making. The vertical dashed lines indicate the optimal decision time (T*) corresponding to the maximum net income for each scenario.
Systems 14 00091 g007
Figure 8. Shared decision-making between platform fees and owners. The vertical dashed lines indicate the optimal decision time (T*) corresponding to the maximum net income for each scenario.
Systems 14 00091 g008
Table 1. Generational Evolution of Research Paradigms in Shared Parking.
Evolution StageFocusLimitation
Static MatchingMatching algorithms [10,11,12,13,14], Demand Forecasting [15,16]Static assumption; ignores agent behavior.
Market MechanismsRevenue models [15,17,18], Static pricing [19,20], Dynamic matching-pricing [21]Assumes immediate entry; ignores Institutional Entropy (volatility).
Table 2. Mathematical parameter setting.
ParameterIllustrateParameterIllustrate
C T S Full life cycle cost of parking space E Net present value of ( N P V ) operation and maintenance costs before and after participating in parking space sharing E ( E 0 + E n )
T The decision-making moment for owners to share parking spaces F 0 ( t ) Expenditure function for owners to participate in shared parking spaces
E 0 The total operation and maintenance cost of holding and using the parking space before time T r discount rate
E n Indicates the total operation and maintenance cost caused by using the parking space and sharing the parking space after sharing the parking space. F n ( p p ( t ) ) the maintenance and security costs per unit time after participating in the shared parking space
C n ( T ) Indicates T the price of the shared parking space franchise fee based on time M 0 ( t ) The maintenance cost of the parking space at time t
S Represents the amount of government subsidy to owners (set to 0 if none) M n ( t ) Maintenance fees for parking spaces after participating in shared parking spaces
I P Indicates the benefits brought by parking space sharing D The cost of participating in sharing
P p Prices for using shared parking spaces w g g t The labor price used to pay for the management of shared parking spaces, Internal Friction (Coasean transaction costs)
σ p Price Volatility, Standard deviation of price returns in GBM, Institutional Entropy (System stability proxy) δ Indicates the platform service fee for shared parking spaces
u p Drift rate using shared parking space prices Q Indicates the sales volume of shared parking spaces per unit time, Social Proof (Positive feedback signal)
z c Standard Brownian motion processT*Optimal stopping time solution, Option Value of Waiting (Inertia threshold)
Table 4. Sensitivity Analysis for Price Volatility ( σ p ).
Rate of Change of Parameter ( σ p )Rate of Change at Decision Time ( T *)Total Revenue Change Rate
−100%−100.00%−15.00%
−50%−65.70%−8.20%
−25%−38.20%−4.50%
−10%−15.50%−1.80%
0%0.00%0.00%
+10%+30.10%+2.10%
+25%+85.40%+5.50%
+50%+180.20%+10.80%
+100%+325.50%+20.50%
Table 5. Results of sensitivity analysis of parameter u p changes.
Rate of Change of Parameter ( u p ) Rate of Change at Decision Time (T*)Total Revenue Change Rate
−100%546.15%−109.02%
−50%88.46%−58.73%
−25%76.92%−29.62%
−10%53.85%−11.96%
00.00%0.00%
10%0.12%12.27%
25%−3.85%30.68%
50%−7.69%61.43%
100%−30.77%123.34%
Table 6. Results of sensitivity analysis of parameter r changes.
Rate of Change of Parameter ( r )Rate of Change at Decision Time (T*) Total Revenue Change Rate
−100%30.77%52.62%
−50%30.77%23.33%
−25%30.77%11.01%
−10%0.00%4.25%
00.00%0.00%
10%0.00%−4.07%
25%0.00%−9.84%
50%0.00%−18.64%
100%0.00%−33.59%
Table 7. Results of sensitivity analysis of parameter w g g t changes.
Rate of Change of Parameter ( w g g t )Rate of Change at Decision Time (T*)Total Revenue Change Rate
−100%minimum value163.43%
−50%minimum value79.94%
−25%minimum value38.20%
−10%−7.69%13.88%
00.00%0.00%
10%76.92%−12.28%
25%92.31%−29.86%
50%146.15%−57.82%
100%492.31%−95.48%
Table 8. Results of sensitivity analysis of parameter Q changes.
Rate of Change of Parameter QRate of Change at Decision Time T*Total Revenue Change Rate
−20%92.31%−46.59%
−15%88.46%−35.15%
−10%80.77%−23.60%
−5%57.69%−1.95%
00.00%0.00%
5%0.00%12.61%
10%−7.69%25.29%
15%−23.08%38.09%
20%−100.00%51.93%
Table 9. Results of sensitivity analysis of parameter δ changes.
Rate of Change of Parameter δ Rate of Change at Decision Time T*Total Revenue Change Rate
−100%−7.69%28.12%
−50%−3.85%14.01%
−25%0.00%7.01%
−10%0.00%2.80%
00.00%0.00%
10%30.77%2.71%
25%53.85%6.68%
50%61.54%13.26%
100%80.77%26.17%
Disclaimer/Publisher’s Note: The statements, opinions and data contained in all publications are solely those of the individual author(s) and contributor(s) and not of MDPI and/or the editor(s). MDPI and/or the editor(s) disclaim responsibility for any injury to people or property resulting from any ideas, methods, instructions or products referred to in the content.