Article

How Reclamation Policy Shapes China’s Coastal Wetland Ecosystem Services

Law School, Ningbo University, Ningbo 315211, China
*
Author to whom correspondence should be addressed.
Systems 2025, 13(6), 431; https://doi.org/10.3390/systems13060431
Submission received: 2 April 2025 / Revised: 26 May 2025 / Accepted: 29 May 2025 / Published: 3 June 2025
(This article belongs to the Special Issue Applying Systems Thinking to Enhance Ecosystem Services)

Abstract

:
China’s reclamation regulation policy is an important policy tool used by the government to balance land development and ecological protection in coastal areas, but few studies have focused on the impact of the implementation of this policy on ecosystem services. To fill the gap, this study takes Ningbo City as an example, applies the InVEST model as a scenario analysis and trend indication tool, combines the market value method to quantify the ecosystem services of coastal wetlands, and explores the impact of the reclamation regulation policy on the coastal wetland ecosystem services through the regression discontinuity model. The findings are as follows: (1) from 2005 to 2020, the natural ecological landscape in the coastal zone of Ningbo City continued to shrink, but the overall value of ecosystem services showed a fluctuating upward trend. Among them, cropland and wetlands served as the primary conduits for ecosystem services in this region, highlighting the need to strengthen the protection of these two land types. (2) The implementation of reclamation regulation policy has an impact on ecosystem services. The policy implementation in 2011 appeared to suppress the downward trend of ecological habitat quality and carbon storage, while the policy implementation in 2017 had a positive impact on the enhancement of carbon storage and material production. (3) As for the effect of reclamation regulation policy on the changes in ecosystem services, although the measured positive impact of reclamation regulation policy on ecological habitat quality was less statistically pronounced compared to other services during the study period, it had significant positive effects on carbon storage and material production. On the whole, the reclamation regulation policy proves effective in contributing to the maintenance of coastal wetland ecosystem services. Although the model-based results in this study reveal more indicator trends rather than precise quantitative evidence, it helps mitigate degradation trends and enhance specific services like carbon storage and material production. Through its implementation, the policy aids in pursuing the win–win goal of balancing urban economic development and ecological environment protection.

1. Introduction

Coastal wetlands, as transitional zones between terrestrial and marine ecosystems, are complex systems that provide vital resources for human survival and development while playing a crucial role in ecological regulation, including shoreline protection, water purification, biodiversity support, and significant carbon sequestration [1,2,3,4,5,6]. They serve as dynamic interfaces where land, water, and biotic components interact, forming intricate relationships that sustain biodiversity and ecosystem functions [7,8]. Coastal reclamation, one of the most beneficial ways to utilize the sea, has been widely practiced globally, particularly in countries like the Netherlands, Singapore, and Japan, to create additional space for urban expansion and industrial–agricultural development in coastal areas [9,10]. Currently, the economic benefits of coastal reclamation are often recognized [11], as well as its substantial ecological costs [12]. Thus, many developed countries have largely ceased such activities, many developing countries still choose to carry out reclamation on an appropriate scale within a controlled range, with China being a classic example.
Since entering the twenty-first century, the rapid development of urbanization and industrialization in China has led to a massive convergence of people and industries in coastal areas. In this process, coastal wetlands, as an important reserve land resource, have been seen as a solution to alleviate the shortage of land supply [13]. However, large-scale reclamation activities inevitably change the natural characteristics of the marine environment, leading to a series of ecological issues such as the destruction of natural coastlines, marine pollution, loss of coastal landscape diversity, decline of biodiversity, and reduced coastal disaster prevention capacity [14,15]. Numerous studies have demonstrated these detrimental impacts, including the loss and fragmentation of natural habitats [15], the significant declines in biodiversity (such as waterfront birds, benthic organisms) [16,17], changes in hydrological conditions and water quality degradation [18], as well as significant loss of key ecosystem services [19]. This degradation also poses consequences for the sustainable development of China’s marine economy and the well-being of coastal communities [20].
Recognizing these profound ecological consequences and aligning with global sustainability agendas, such as the United Nations’ Sustainable Development Goals (SDGs) in 2015, China has undergone a significant policy shift. Specifically, it has moved from the traditional “development first” approach to a more balanced approach that synergizes development and protection [17]. This shift is particularly relevant to achieving SDG 14 (Life Under Water) in “Transforming our World: The 2030 Agenda for Sustainable Development” proposed by the United Nations [21], which calls for the conservation and sustainable use of oceans, seas, and marine resources. Consequently, regulating coastal reclamation has emerged as one of the major initiatives.
Generally, key policy milestones mark this transition. Annual enclosing and reclamation quota management has been implemented in China since 2011, the National Development and Reform Committee (NDRC) and State Oceanic Administration (SOA) released the “Procedure for Management of Land Reclamation Plans”, in which detailed procedure of making, implementing and supervising annual reclamation quota plan is specified. Since the 18th CPC National Congress, with the in-depth promotion of the idea of ecological civilization, China has begun to adhere to the concept that economic development and ecological civilization construction complement each other and develop together. In order to alleviate the ecological problems caused by reclamation, the State Council (SC) released “Notice on Intensifying Coastal Wetland Protection and Land Reclamation Management” in 2018, which suspended the annual reclamation quota plan. No new sea reclamation projects will be approved other than the major projects approved by SC, including infrastructure construction, public service, and national defense. The policy objective is to strengthen ecological protection and restoration as well as to maintain ecosystem service functions.
Despite the intentions and significance of these reclamation policies are clear, a strict assessment of their effectiveness, especially the assessment of their impact on ecosystem services, has still not been fully explored. Existing studies on China’s reclamation policies mostly focus on descriptive analyses, including policy process analysis, legal frameworks, or qualitative descriptions of implementation challenges [22,23,24,25]. A large number of studies have evaluated the ecological impact of reclamation activities themselves [14,19,20], as well as the changes in ecosystem services driven by land use/land cover change (LUCC) in coastal areas [26,27,28]. However, there is a critical research gap regarding the causal relationship between specific policy interventions (such as the quota implementation in 2011 or the 2017/2018 effective ban) and changes in ecosystem services. The specific challenge lies in isolating the policy effect from other confounding factors that drive environmental changes [29]. The successful experiences of these policies and regulations in achieving their established ecological goals have not been well understood, thereby hindering the improvement of relevant policies. Therefore, against the backdrop of the complex interaction between China’s rapid urbanization, economic development, and environmental protection, it is imperative to evaluate the effectiveness of regulating reclamation policies.
To assess the impact of policies or regulations on ecosystem services, various methods and tools have been developed, including simple benefit transfer methods [4,30] and more complex spatial explicit models. Currently, popular spatial explicit assessment models include ARIES (Artificial Intelligence for Ecosystem Services) [31], SolVES (Social Value for Ecosystem Services) [32], and InVEST (Integrated Valuation of Ecosystem Services and Tradeoffs) [33]. These models have significant differences in terms of conceptual basis, data requirements, the specific services they handle, and applicability to various decision-making environments [34,35]. In this study, we selected the InVEST model, and its advantages include reliance on common geospatial data (LULC, DEM) [33], the available modules directly related to the functions of coastal wetlands (habitat quality, carbon storage), and its ability to generate spatially explicit output are crucial for tracking changes over time [36,37]. Moreover, the wide application of InVEST in different ecosystems (including coastal environments) facilitates the design of scenario comparison [38,39]. In view of this, the novelty of InVEST in this study lies in integrating its outputs into a powerful policy evaluation framework, enabling us to go beyond descriptive ES evaluations to estimate the causal effects at the point of policy implementation. Its efficiency in generating spatially explicit ES indicators across multiple time points makes it a suitable tool for providing the outcome variables required for policy impact analysis. However, it needs to be emphasized that in this study, the InVEST model was mainly used as a scenario simulation and illustrative tool to understand the potential direction and relative intensity of changes in ecosystem services under policy intervention, rather than a predictive model precisely calibrated and verified with localized empirical data. Therefore, its output results are designed to provide indicative trends for policy impact assessment rather than precise quantitative evidence.
Reliable methods are needed to evaluate the causal effects of policy intervention in socio-economic changes [29]. Regression discontinuity (RD) design is a quasi-experimental method, which is particularly suitable for analyzing policies implemented at specific time points [40]. By comparing the results before and after the implementation date of the policy (“discontinuity”), RD can isolate the local average therapeutic effect of the policy and provide stronger causal reasoning than related studies [41,42]. Applying it to assess the ecological impact of specific environmental policy milestones, such as the shift in China’s reclamation policy, represents a methodological advancement in this particular research field.
In conclusion, the subsequent sections of this study were as follows: Section 2 introduces the methodology adopted in this study. Subsequently, Section 3 reports the research results, and the meanings of these findings are further discussed in Section 4. Finally, the fifth section summarizes the main contributions of this study, and puts forward the limitations of this study and directions for future research.

2. Methodology

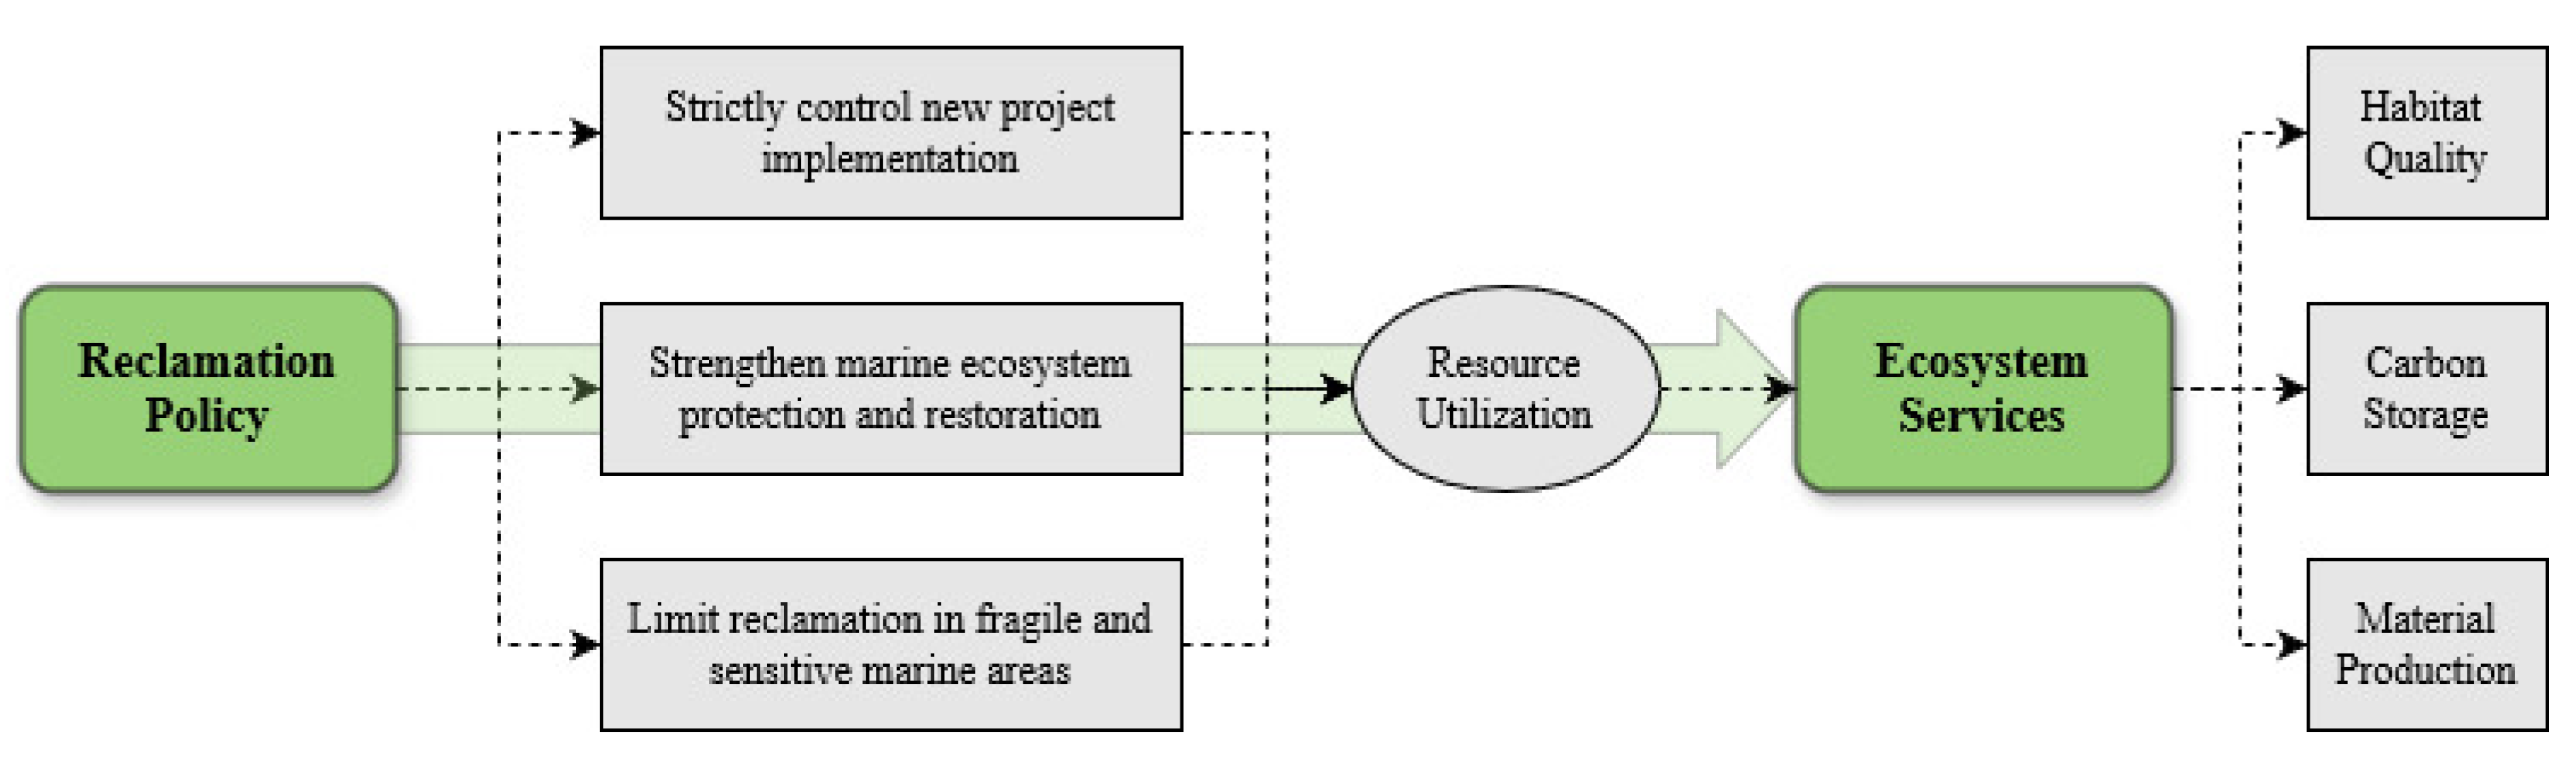
2.1. Theoretical Framework

Considering the public-good nature of marine resources, local governments’ pursuit of short-term economic benefits often leads to over-exploitation and a series of negative externalities or policy circumvention [43,44,45]. We hypothesize that, compared with the trends observed before these policy interventions, the implementation of stricter reclamation policies in 2011 and 2017 led to the stabilization or improvement of the key coastal wetland ecosystem services in the coastal areas of Ningbo. Therefore, this study aims to fill the research gap by investigating whether regulating reclamation policies can maintain ecosystem services. Drawing on the idea of public policy assessment, we establish an evaluation framework of “reclamation policy → resource utilization patterns → ecosystem service outcomes” and conduct an empirical test using the coastal zone in Ningbo as a case study (Figure 1). Specifically, we posit that stricter reclamation policies, by controlling coastal land use changes (e.g., limiting conversion of natural wetlands, encouraging restoration), can mitigate degradation or even enhance key ecosystem services such as habitat quality, carbon storage, and material production. Habitat quality is expected to benefit from reduced human disturbance and habitat destruction. Carbon storage may be maintained or increased by preventing the loss of carbon-rich wetlands and potentially promoting sequestration through restoration. Material production, while complex, could be indirectly influenced by policies affecting land allocation (e.g., preserving farmland or aquaculture areas) or overall ecosystem health. This approach not only assesses the direct impacts of policies on ecosystem services but also considers the systemic interactions within the coastal wetland ecosystem.
As for the reclamation policy in China, it has evolved significantly across different socio-economic development stages. These policies can be generally divided into three phases (See Figure 2): (1) Control period (2002–2011): at this stage, China began to plan reclamation projects, and from 2011, it was formally incorporated into the national economic and social development plan, implementing annual total control, and requiring all localities to scientifically determine the scale of reclamation. Policy measures adopted included legal, administrative, and economic tools like the system of paid use of marine areas and the environmental impact assessment system. (2) Strict control period (2011–2017): during this period, the focus of national policies was extended to the improvement of the coastal ecological environment through zoning control. At the same time, attention was also paid to promote the reconstruction of near-shore habitat. For example, the “Technical Guidelines for Ecological Construction of Enclosure and Reclamation Projects (for Trial Implementation)” issued in 2017 aim to carry out ecological design according to local conditions and create favorable conditions for the construction of seawall ecological zones. (3) Prohibition period (post-2017): by 2017, with the launch of the nationwide marine inspection, the central government began to ban local reclamation activities. The 2018 “Notice on Intensifying Coastal Wetland Protection and Land Reclamation Management” halted new reclamation projects except for major national strategic ones, and involved public supervision to curb illegal reclamation activities.
In view of this, the main objective of this study is, firstly, to quantify the spatio-temporal dynamic changes in key wetland ecosystem services (especially habitat quality, carbon storage and material production) in the coastal zone of Ningbo. On this basis, we focus on assessing the actual impact of major changes in China’s land reclamation control policies (especially the policy interventions around 2011 and 2017) on these ecosystem services. Ultimately, this study aims to provide scientific evidence for optimizing policy management and achieving sustainable development goals.

2.2. Study Area

Ningbo is located on the eastern coast of Zhejiang Province in China (28°51′~30°33′ N, 120°55′~122°16′ E), bordering the East China Sea, in the middle of the mainland coastline, with Hangzhou Bay to the north and Zhoushan Islands to the east. Ningbo’s coastal zone is geographically diverse, including different types of coastal landscapes such as coastal urban areas, harbor terminals, beaches, and islands. The total sea area of the city is about 8041 km2, and the total length of the coastline is 1685.7 km. Ningbo, as a large marine city and a major port city on the mainland coast, is the economic center of the southern wing of the Yangtze River Delta. The dense population and socio-economic activities have caused greater real disturbances and potential pressures on the ecological environment. The degree of artificiality of the coastline is relatively high, and the natural landscape resources of the coastline have been destroyed, resulting in the fragmentation of the coastal landscapes. In the past two decades, Ningbo City has actively responded to the national policy on reclamation and issued a number of local policies, which have played a key role in the development and protection of Ningbo’s coastal zone area. With the successive implementation and promotion of these policy documents, the development activities of reclamation in Ningbo’s coastal zone have gradually become standardized, proceduralized and institutionalized. In this paper, with reference to existing studies, the landward side of the coastal wetland boundary is defined as the inner boundary of the coastal township, and the seaward side is defined as the outermost boundary of the superimposed continental coastline, so as to determine the scope of the study area by combining the closed area generated by the landward and seaward boundaries (Figure 3) [26].

2.3. Data Source

This study collected several key datasets: land use/land cover (LULC) data, Digital Elevation Model (DEM) data, socio-economic statistics, and the administrative boundary of Ningbo, Zhejiang Province. First, the LULC data were derived from the China Land Cover Dataset (CLCD), produced by the team of Professors Jie Yang and Xin Huang of Wuhan University [46]. This dataset provides annual LULC classifications for China at a 30 m spatial resolution, based on Landsat images (TM, ETM+, OLI/TIRS) processed on Google Earth Engine (GEE) platform. We generally utilized the annual CLCD data for the period 2005 to 2020 and the overall accuracy is reported to be around 80%. Second, the DEM data used was the ASTER Global Digital Elevation Model Version 3 (ASTER GDEM V3) with a 30 m spatial resolution. This dataset was retrieved from the Geospatial Data Cloud platform (https://www.gscloud.cn/ (accessed on 26 May 2025)), operated by the Chinese Academy of Sciences. As for the socio-economic and other data, the watershed boundary data and administrative boundary data for Zhejiang Province and Ningbo City were obtained from the Resource and Environmental Science and Data Center (RESDC) of the Chinese Academy of Sciences (CAS) (http://www.resdc.cn (accessed on 26 May 2025)). The socio-economic statistics were compiled from the China Statistical Yearbook (2006–2021) and the Statistical Yearbook of Ningbo (2006–2021).

2.4. Ecosystem Services Assessment

The InVEST model is a model applied to the assessment of ecosystem service functions, which can be used to evaluate the capacity and quality of ecosystem services by studying changes in land use. Model data are input and output in the form of maps, which wazcan achieve spatial visualization for the quantitative evaluation of ecosystem service functions. The InVEST model is widely used and appropriate in wetland ecosystems because of its simple data acquisition, variety of assessment models, and applicability to small-scale studies. According to the typical characteristics of wetlands, the habitat quality and carbon storage modules of the InVEST model are usually chosen as the measurement criteria.

2.4.1. Habitat Quality

Habitat quality was estimated with the help of the InVEST model with reference to relevant parameters [47,48]:
Q x j = H j 1 D x j z D x j z + k z
D x j = r = 1 R y = 1 Y r W r r = 1 R W r × r y × i r x y × β x × S j r
where D x j is the habitat degradation degree of grid x in the j-th land use type, W r is the weight of threat factor r , y is the grid number of the r -th threat factor, and Y r is the total grid number of threat factor r . i r x y denotes the degree of grid y ’s threat value r y to grid x, which can be obtained by linear or exponential attenuation (Equation (2)). β x is the accessibility of various threat factors to grid x; S j r is the sensitivity of the j-th land use type to the r -th threat factor; Q x j is the habitat quality of grid x in the j-th land use type (Equation (1)); H j is the habitat suitability of the j-th land use type; k denotes the half-saturation coefficient, with a default value of 0.5. z is a normalization constant set to 2.5 in the model. R is the number of threat factors.
In this study, the two land use types of farmland and construction land, where human activities are most concentrated and have a relatively significant direct impact on habitat quality, are defined as habitat threat factors. Referring to the InVEST model usage guidelines, the maximum stress factor impact range (MAX-DIST) on the habitat is applied in the model. Stress factor weight (0–1), decreasing index of the impact of stress factors on habitat (0–1), sensitivity index of habitat to each stress factor (0–1) (Table 1 and Table 2) [33].

2.4.2. Carbon Storage

Carbon storage was estimated with the help of the InVEST model with reference to relevant parameters [50]:
The carbon cycle in InVEST is simplified and carbon storage can be described with four carbon pools based on the land use types. The equation can be described as follows:
C t o t a l i = C a b o v e i + C b e l o w i + C s o i l i + C d e a d i × A i
where A i is the area of each land use type; Four carbon pools refer to the carbon density for different parts of each LULC, they are aboveground biomass ( C a b o v e , t·hm−2), belowground biomass ( C b e l o w , t·hm−2), soil carbon density ( C s o i l , t·hm−2) and carbon density of dead organic matter ( C d e a d , t·hm−2) (Table 3).

2.4.3. Material Production

Material production services were assessed using the market-value method [52], as follows:
V = Y i A i P i
where V is the total market value of material production services in the study area, Y i is the mean value of the i-th material’s yield per unit area, A i is the production area of the i-th material, and P i is the mean value of the market price of the i-th material in a specified year. In the present study, the total values of the material production services provided in Ningbo City, where our study area located, were divided into the grain and cotton value, the Phragmites australis value, the aquaculture product value, the salt production value, and the fruit production value.
Yield increases due to technological innovations, changes in consumer preferences, changes in market prices caused by changes in supply and demand, and changes in inflation-induced values between the years were not accounted for. Excluding these factors prevented the calculation process from becoming too complicated and too sensitive to factors that are difficult to accurately account for. However, such factors could be accounted for in future research.

2.4.4. Limitations of the InVEST Model

In this study, the InVEST model was selected as the main tool for assessing the spatio-temporal dynamics of ecosystem services (particularly habitat quality and carbon storage). This model was chosen because it can generate spatially explicit ecosystem service indicators by using widely available geospatial data (such as LULC, DEMs), which is helpful for tracking changes at multiple time points and is applicable to policy scenario analysis. However, it must be clearly pointed out that the application of the InVEST model in this study has its inherent limitations. Firstly, the parameters of the model are mainly based on the existing literature and regional fitted data, and no field calibration or empirical verification has been conducted at specific locations for the coastal wetlands of Ningbo City. This means that the outputs of the model, such as the habitat quality index and the estimated carbon storage values, reflect more the relative trends and indicative changes based on land use change rather than precise absolute values. Secondly, the InVEST model itself has a heuristic structure and contains simplified ecological assumptions, which may not be able to fully capture the nuances of complex ecological processes. Therefore, the InVEST model utilized in this study aims to serve as a context-based and illustrative analytical tool. Its results should be understood as indicative trends, and it should be recognized that there is a considerable degree of uncertainty in them, rather than being regarded as direct and fully validated empirical evidence. These limitations will further elaborate on their significance for the interpretation of policy impacts in the discussion section.

2.5. Method of Policy Impacts Evaluation

The RD model is a commonly used quasi-experimental method in policy impacts evaluation. Generally speaking, RD is closer to randomized trials than other methods and can obtain estimation results similar to those of RCT [53]. It has stronger causal inference power, can avoid the endogeneity problem of causal estimation, and reflects the real causal relationship between variables, thus making the RD model one of the most credible quasi-experimental methods when conducting policy impacts evaluation [42]. The RD model is able to study the ecological effects of the implementation of the reclamation policy, because the only difference between the year before the implementation of the reclamation policy and the year of the implementation of the reclamation policy, for the coastal townships of Ningbo City, lies in the fact that whether or not the reclamation policy was implemented. Therefore, the year before policy implementation can be regarded as the control group, and the year after policy implementation can be regarded as the treatment group, i.e., the year of policy implementation is a precise grouping of whether the samples are involved in the implementation of the policy or not, and this feature determines the use of precise regression discontinuity in this study. The running variable was time, measured in years from 2005 to 2020. We specifically tested the discontinuity of the outcome variable trends at two key policy implementation points:
  • Cut-off point 1 ( t 1 2011 ): it corresponds to the implementation of stricter annual reclamation quota management, marking a significant initial tightening of supervision [9]. Operationally, we set the cut-off for the transition.
  • Cut-off point 2 ( t 2 2017 ): it corresponds to a shift towards the effective ban on new commercial reclamation projects and significantly strengthens ecological supervision [22,25]. Operationally, we also set the cut-off for the transition.
The RD model is presented as:
Y i , t = α + τ D i , t + γ 1 t x i + γ 2 D i , t t x i + δ i , t + ε i , t
D i , t = 1 ,   t x i 0 ,   t < x i
Y i , t is the outcome variable and represents the ESs of unit i in the year t. D i , t is the treatment variable and being a dummy variable that represent whether reclamation policy is issued or implemented. D i , t is calculated by Formula (6). x i indicates the year of reclamation policy issued. The coefficient τ of D i , t indicates the impact of reclamation policy on the ecological services at breakpoints. t x i is the normalization of the time variable t [54]. γ 2 D i , t t x i makes different regression slopes on both sides of the breakpoint. δ i , t is the time-fixed effect of unit i. ε i , t is the white noise that cannot be measured. No other control variables were added because the inclusion of control variables did not affect the regression discontinuity design, and if the control variables added were endogenous, they would affect the regression results [40,55].

2.6. Variable Selection

(1) Explained variables. The goal of the reclamation policy is to promote the transformation of the coastal area from extensive development to intensive development based on ecological protection, so as to realize the sustainable development of ecological economy. At the same time, the policy pays more attention to the restoration of the ecological environment, aiming to achieve strict protection, effective restoration and intensive utilization of marine ecological resources, and improve the overall ecosystem service level in coastal areas. Therefore, in order to evaluate the ecological benefits of this policy, this study selected three main indicators that can characterize ecosystem services, namely habitat quality, carbon storage, and material production, with reference to existing studies [52].
(2) Explanatory variable. Reclamation policy was selected as the core variable (D), which took the value of “1” after the implementation of the policy and “0” before the implementation of the policy. For the reclamation policy, it can be roughly divided into three policy phases according to the relevant policy documents, with two policy breakpoints D1 and D2. In view of this, this study conducted a phased analysis of these two breakpoints by using regression discontinuity [56].

3. Results

3.1. Changes in Ecosystem Services

(1) Habitat quality. Habitat quality data, obtained through InVEST model analysis, ranges from 0 to 1, with higher values indicating better quality, as shown in Figure 4. The results showed that from the temporal view, the mean values of the habitat quality index in the study area were 0.673, 0.669, 0.653, and 0.652, respectively. From the spatial view, the habitat quality gradually decreased from the marine area to inland areas. The quality of habitat in marine areas is higher because of less human disturbance. However, such areas are decreasing due to factors such as natural siltation and reclamation, resulting in a continuous reduction in high-quality habitat areas. In contrast, in inland areas, low-value areas are increasing due to the conversion of artificial wetlands.
(2) Carbon storage. Temporally, carbon storage in the study area showed a decreasing then increasing trend, and the values obtained were 3.96 × 10⁷ t, 3.92 × 10⁷ t, 4.62 × 10⁷ t, and 4.58 × 10⁷ t, respectively. Spatially, carbon storage gradually decreased from sea to inland areas, and the high value areas were scattered in the inland. Based on the carbon density data, the carbon storage of wetland is relatively strong, while that of non-wetland is weak. Since 2011, many marine areas in the northern and southern regions had been transformed into mudflats and wetlands, and at the same time, shallow sea waters have been transformed into silty beaches by reclamation and silting. These land use change activities have brought about an increase in carbon storage to a certain extent. As for the low-value zone, it is mainly distributed in shallow water and non-wetland areas, changing with land use.
(3) Material production. The overall trend of material production was to decrease first and then increase, with values of 2.99 × 10⁸ CNY/ha, 2.93 × 10⁸ CNY/ha, 2.97 × 10⁸ CNY/ha, and 2.96×10⁸ CNY/ha., respectively. Spatially, there was a gradual increase from the sea to the inland, with high-value areas inland. The low-value area was mainly distributed in the shallow water area and construction areas, changing with land use. Temporally, material production declined in 2011 compared to 2005.
It is important to recognize that although the above-mentioned spatio-temporal patterns are quantified based on the LULC data, the actual observed changes in ecosystem services may be the result of the complex interaction of multiple driving factors [6]. In addition to the significant impact of LULC transformation driven by human activities such as coastal reclamation and urbanization, broader environmental factors such as climate change (such as variations in sea surface temperature, sea level rise, storm frequency/intensity), and the intrinsic dynamics of coastal ecosystems (such as natural succession, fluctuations in nutrient cycling, and species interactions) will also inevitably have an impact on habitat quality, carbon storage, and material production [3].

3.2. Impacts of Reclamation Policies on the Ecosystem Services

To specifically evaluate the causal effect of major shifts in China’s reclamation policy on the observed ecosystem service trends, this study employs an RD design. The RD analysis tests whether there is a statistically significant discontinuity (jump or change in slope) in the trend of ecosystem services (habitat quality—HQ, carbon storage—CS, material production—MP) precisely around these policy implementation years (cut-off point 2011 and cut-off point 2017), which would indicate a policy effect. According to the method described in Section 2.4, we constructed four models to analyze the impacts of the reclamation policies issued in 2011 and 2017 on habitat quality, carbon storage, and material production, respectively. RD analysis was applied using 2011 and 2017 as breakpoints. Due to the ESs among the sixty units having different scales, we transformed the ESs for each year in each unit: Y i , t = Y i , t i = 2005 2020 Y i , t . Then, we examined the impact of policies on the ESs changes: Δ Y i , t = Y i , t Y i , t 1 .
Figure 5 and Figure 6 are the fitness curves of four RD models for the three ecosystem services of habitat quality, carbon storage, and material production, respectively. Table 1 is the coefficient of treatment variable D i , t and its significance test. As Table 4 shows, reclamation policies have a significant effect on the ESs. Except for model 1–2, the other two treatment variables passed the significance test. The changes in habitat quality generally coincided with the implementation of the reclamation policy. From 2006 to 2016, including the implementation of the reclamation plan indicator control policy in 2011, its effect was not particularly significant in Figure 5, but it suppressed the downward trend of habitat quality to a certain extent. In the latter years of the policy, a certain degree of growth was realized in some areas, as shown by a higher growth rate after the implementation of the policy than before. In Figure 6, we can see that the increasing trend of habitat quality is completely different from 2011. The increase in ecological value has become smaller before 2011 and the annual increment has become larger after 2011. The reclamation policy in 2011 had a positive effect on the annual increment of habitat quality, and the annual increment of habitat quality after 2011 increased by 0.375 compared with that before 2011. When the reclamation was completely banned in 2017, the quality of habitat quality in some areas had a certain degree of improvement. However, the effect of the policy is not sustainable. The reclamation policy in 2017 had a negative effect on the annual increment of habitat quality, with the annual increment of habitat quality after 2017 decreasing by 0.172 compared to that before 2017.
Changes in carbon storage coincided well with the implementation of the reclamation policy. Although the effect of the policy implementation on the overall carbon storage enhancement in the study area is not significant in Figure 5, in terms of the amount of change, the growth rate of carbon storage after the implementation of the policy is significantly higher than before in Figure 6. As can be seen from Table 1, both the reclamation policies in 2011 and 2017 have a positive effect on the annual increment of carbon storage, with the annual increment of carbon storage after 2011 increasing by 9.111 compared to the pre-2011 period, and the annual increment of carbon storage after 2017 increasing by 1.798 compared to the pre-2017 period.
Changes in material production coincided well with the implementation of the reclamation policy. Although the effect of the policy implementation on the overall material production enhancement in the study area is not significant in Figure 5, in terms of the amount of change, the growth rate of material production after the implementation of the policy is significantly higher than before in Figure 6. As can be seen from Table 1, both the 2011 and 2017 reclamation policies had a positive effect on the annual increment of material production, with the annual increment of material production after 2011 increasing by 1.166 compared to the pre-2011 period, and the annual increment of material production after 2017 increasing by 0.872 compared to the pre-2017 period.

3.3. Robustness Tests for Regression Discontinuity

The research found that the size of the bandwidth affects the randomness of the sample [41]. To verify whether the above results are affected by the bandwidth setting, the artificially set bandwidth was used in this study. The optimal bandwidths of 0.75 times and 1.25 times were selected to further test the robustness of the estimation results. It can be known from Table 5 that after adjusting the bandwidth to 0.75 times and 1.25 times, the breakpoint regression coefficient is basically positive. Through the significance levels of 5% and 1%, it is basically consistent with the benchmark breakpoint regression results, indicating that the benchmark breakpoint regression is robust. Secondly, the triangular kernel function was adjusted to the rectangular kernel function, and basically the consistent regression result was obtained. Finally, when the breakpoint was changed to one year before and after the policy implementation, the coefficient would be insignificant. The change in breakpoint had a limited influence on the model calculation, which confirmed that the benchmark RD passed the test.
In the above results of the robustness test, it was found that the carbon storage policy introduced in 2017 presented potentially insignificant effects. These may include the following factors: (1) lagged biophysical response: carbon sequestration in ecosystems is usually a slow process. Within the time frame of this study, the impact of the 2017 policy may not have been statistically detected yet, especially if the analysis ended shortly after implementation. (2) Data limitations: carbon density data may not be precise enough to capture subtle early policy impacts. Furthermore, other socio-economic changes may also potentially offset the expected impact of policies on carbon storage.

4. Discussion

Based on the objectives mentioned earlier, this section further explored the impact of reclamation policies on the key ecosystem service functions of Ningbo Coastal Wetlands on the basis of the results.

4.1. Policy Impacts on Ecosystem Services in Coastal Wetlands

Land use change is one of the most significant direct drivers for ecosystem service alterations [6], with urban expansion often negatively impacting the ecosystem service [57]. Although our results confirm that the urban land increased continuously from 2005 to 2020, exerting pressure on coastal ecosystems. We also found that the reclamation policies implemented during different periods have positively influenced ecosystem services (ESs), highlighting their necessity for ecological civilization and national security. It highlights the potential of using policy levers to balance the development and ecological integrity of dynamic coastal zones, but it is also very complex [52].
The impact of reclamation policies on habitat quality was limited and masked by the pressure of degradation, especially in rapidly developing areas. The Hangzhou Bay area was also planned during this period, where the ecological damage of urban expansion far outweighed efforts to restore it. This resulted in a significant decline in habitat quality, especially in Umdong Township, Xinpu Township, and Xiaocao’e Township. This indicates that the scale and intensity of urban expansion and development may exceed the mitigation effect of concurrent reclamation control or restoration efforts [58]. Our findings are similar to other estuarine areas in China (such as the Pearl River Delta), where habitat loss persisted despite evolving land use policies [59]. Although the RD analysis indicates that policies have had an impact on the habitat quality trends, it must be recognized that these habitat quality scores are model-derived indicators based on LULC changes, rather than direct field measurements. Therefore, the inhibition of the downward trend of habitat quality should be understood as a potential trend shift in the model output results. The specific extent of its impact on real biodiversity and ecological functions, as well as whether this shift is entirely attributed to policies, still require further field verification and in-depth research. The parameters of the model itself have not been calibrated locally, which limits our precise assessment of the absolute changes in habitat quality.
In contrast, the positive effects of reclamation policies on carbon storage and material production are more obvious at first glance, but it requires careful explanation. Prior to the implementation of stricter policies, the conversion of natural coastal wetlands known for their high carbon density into man-made landscapes (such as aquaculture ponds or construction land) reduced carbon storage and material production capacity. After the policy tightening (especially after 2017), this conversion trend was suppressed. At the same time, the ecological initiative of Zhejiang Province—“Blue Bay” project—had gradually restored the coastal ecological landscape. Although such restoration can improve environmental quality and has the potential to enhance the ecosystem over time [60], in restored or newly formed wetlands, the restoration of soil carbon storage is often a slow process. It would take several decades or even longer to reach a level comparable to that of natural systems [61]. Therefore, the observed stability in carbon storage may mainly reflect the cessation of further losses rather than the substantial recovery of the entire landscape function. Similarly, the positive effects identified through RD analysis of the carbon storage output reflect the simulated carbon pool changes related to land use transitions. Given that the model relies on universal carbon density values and lacks on-site measurement data of local soil carbon for calibration and verification, these findings point to indicative trends in carbon sink potential, but there is considerable uncertainty regarding its absolute amount and the accuracy of the changes. The observed stability or increase in carbon storage may mainly reflect the avoidance of losses rather than large-scale new carbon sinks. This distinction is crucial for a comprehensive understanding of policy effects.
Material production changed significantly, particularly after 2011. Transforming sea areas or low-productivity tidal flats into managed landscapes such as farmland or potential aquaculture ponds can indeed lead to higher local biomass production [62]. Compared to the sea, the material production capacity of farmland is higher, leading to an increase in material production, and after 2017, due to coastal silting, shallow water was transformed into a silty beach and then transformed into usable land, thus alleviating the downward trend in material production.
Comparing the policy effects of the two phases, the 2017 policy is more effective than the 2011 policy. In early 2011, the National Development and Reform Commission (NDRC) and the State Oceanic Administration (SOA) began introducing annual reclamation quotas, slowing the pace of reclamation [9]. However, due to insufficient central supervision, there was a large gap between actual reclamation and reported reclamation. This is a common challenge observed in the implementation of environmental policies under various circumstances [63]. In 2017, stricter central inspections found serious illegal reclamation activities in all coastal cities, prompting systematic supervision of local governments’ marine use and strict prohibition of local reclamation activities, which effectively curtailed illegal reclamation activities. The increased effectiveness of the policy is largely consistent with China’s shift towards intensive and sustainable development, with an emphasis on environmental protection and restoration.

4.2. Policy Implications

Based on the above results and discussion, in addition to confirming the potential effectiveness of stricter regulations, future coastal management and policy improvement are also key considerations. The key point lies not only in whether the policies are effective, but also in how to design and implement these policies to meet the long-term ecological sustainability and socio-economic demands.
Firstly, strengthening monitoring and enforcement remains crucial. Specifically, on the one hand, technologies (such as high-resolution remote sensing) need to be combined with traditional supervision to enhance the effectiveness of supervision. On the other hand, the combination of top-down supervision and public participation mechanism can enhance transparency and accountability.
Secondly, our results reveal that merely halting reclamation is not sufficient to restore the loss of ecological functions. Future policies should prioritize regions based on their potential to provide multiple ecosystem services [3] and carry out proactive ecosystem management.
Thirdly, the role of ecological performance assessment in official promotion evaluation can be strengthened. Officials and cadres with excellent performance assessment results may be given priority promotion due consideration; for officials and cadres who fail to pass the assessment results, they can be punished through demotion and accountability.
The interpretation of the results of this study, especially those ecosystem service assessment results, must fully consider the inherent limitations of the model. Due to the lack of field data calibration and validation for the study area, the output of the model should be regarded more as indicative trends and relative comparisons rather than precise quantitative predictions. This means that although the research has revealed the potential connection between policies and changes in ecosystem services, extra caution is needed when directly translating these findings into specific policy benefit evaluations or formulating refined management goals. For instance, the trend of increasing carbon storage shown by the model suggests the potential of policies in maintaining or enhancing carbon sink functions, but it should not be directly equated with calculated carbon credits. These model-based findings should serve as preliminary evidence for understanding the possible ecological effects of policies, and as a basis for guiding future research directions and giving priority to further field monitoring and verification in policy-making, to prevent over-interpretation of the evidence weight output by the models at the policy level. The transparency of science requires us to be clear about these uncertainties, to apply scientific discoveries to policy practice more responsibly.

5. Conclusions

This research has reviewed the evolution of reclamation policies and proposed an assessment logic based on “reclamation policy → resource utilization patterns → ecosystem service outcomes”. Using the InVEST model and the market value method, this study analyses the ecosystem services of coastal wetlands. RD model was used to discuss the changing characteristics of ES and whether the reclamation policy impact on coastal wetland ecosystem services. The results show that: (1) from 2005 to 2020, although the natural ecological landscape of coastal wetland in Ningbo was shrinking, the ecosystem services also showed a fluctuating upward trend. Cropland and wetland contributed more to the ecosystem services from 2005 to 2020, and these two land use types were the main carriers of coastal wetland ecosystem services in Ningbo, which provided a variety of ecosystem services, such as material production, habitat quality, and carbon storage. Therefore, on the basis of existing policies, the protection of cropland and wetlands should be further strengthened. (2) The implementation of the reclamation policy has an impact on coastal wetland ecosystem services. The policy in 2011 suppressed the downward trend of habitat quality and carbon storage; the policy in 2017 positively affected the enhancement of carbon storage and material production. (3) The implementation of the reclamation policy has achieved remarkable results. Although the quantitative assessment of these effects mainly relied on the indicative trends of the model in this study, the trend of coastal wetland ecosystem services in Ningbo is basically consistent with the evolution of the reclamation policy in China. Therefore, through the implementation of the policy of reclamation, it helps to realize the policy objective of win–win situation between urban economic development and ecological environmental protection.
Surely, several limitations should be considered. Firstly, the accuracy and resolution of the LULC data used may affect the precision of ES estimation. Secondly, apart from the three aspects of ecosystem services mentioned in this study, other related services, such as storm surge protection, water purification and fishery conservation functions, have not been fully considered and evaluated. Thirdly, although other recovery measures such as the “Blue Bay” project were mentioned, their specific contributions have not been isolated from the broader policy impact.
Based on this work, future research should give priority to several fields. Firstly, as described in the methods section, the InVEST model used in this study is mainly based on literature parameters and has not undergone localized field validation. Therefore, its quantitative results on ecosystem services should be regarded as indicative trends rather than precise absolute values, which limits the ability to conduct precise quantitative evaluations of policy impacts and may introduce uncertainties. Secondly, the use of remote sensing data with higher resolution can improve the mapping of land use change dynamics, habitat fragmentation and even vegetation health. Thirdly, expanding the assessment scope to include other key ecosystem services will provide decision-makers with a more comprehensive picture. Finally, the adoption of advanced statistical or econometric methods helps to more strictly distinguish the specific impacts of policy intervention from other confounding factors.

Author Contributions

Conceptualization, Y.Z. and G.L.; data curation, T.L.; methodology, T.L. and Z.X.; software, T.L.; validation, Z.X., Y.Z. and G.L.; formal analysis, G.L.; investigation, T.L.; resources, T.L., Z.X. and Y.Z.; writing—original draft preparation, Y.Z. and T.L.; writing—review and editing, G.L. and Z.X. All authors have read and agreed to the published version of the manuscript.

Funding

This research was funded by the Zhejiang Provincial Social Science Planning Special Project on “Study and Interpretation of the Spirit of the 20th National Congress of the CPC and the Second Plenary Session of the 15th Zhejiang Provincial Party Committee”, the Zhejiang Provincial Social Science Foundation of China (Grant No. 22NDJC068YB), the Ningbo Natural Science Foundation Project (Grant No. 2023J097), and the National Natural Science Foundation of China (NSFC No 42171254).

Data Availability Statement

The data are not publicly available due to privacy.

Conflicts of Interest

The authors declare no conflicts of interest.

References

  1. Chuai, X.W.; Huang, X.J.; Wu, C.Y.; Li, J.B.; Lu, Q.L.; Qi, X.X.; Zhang, M.; Zuo, T.H.; Lu, J.Y. Land use and ecosystems services value changes and ecological land management in coastal Jiangsu, China. Habitat Int. 2016, 57, 164–174. [Google Scholar] [CrossRef]
  2. Liu, L.; Wang, H.-j.; Yue, Q. China’s coastal wetlands: Ecological challenges, restoration, and management suggestions. Reg. Stud. Mar. Sci. 2020, 37, 101337. [Google Scholar] [CrossRef]
  3. Barbier, E.B. Chapter 27—The Value of Coastal Wetland Ecosystem Services. In Coastal Wetlands, 2nd ed.; Perillo, G.M.E., Wolanski, E., Cahoon, D.R., Hopkinson, C.S., Eds.; Elsevier: Amsterdam, The Netherlands, 2019; pp. 947–964. [Google Scholar]
  4. Costanza, R.; d’Arge, R.; Groot, R.d.; Farber, S.; Grasso, M.; Hannon, B.; Limburg, K.; Naeem, S.; O’Neill, R.V.; Paruelo, J.; et al. The value of the world’s ecosystem services and natural capital. Nature 1997, 387, 253–260. [Google Scholar] [CrossRef]
  5. Nellemann, C.; Corcoran, E.; Duarte, C.; Valdes, L.; Young, C.; Fonseca, L.; Grimsditch, G. Blue Carbon—The Role of Healthy Oceans in Binding Carbon; UN Environment, GRID-Arendal: Arendal, Norway, 2009. [Google Scholar]
  6. Millennium Ecosystem Assessment (MEA). Ecosystems and Human Well-Being; Island Press: Washington, DC, USA, 2005. [Google Scholar]
  7. Gedan, K.; Kirwan, M.; Wolanski, E.; Barbier, E.; Silliman, B. The Present and Future Role of Coastal Wetland Vegetation in Protecting Shorelines: Answering Recent Challenges to the Paradigm. Clim. Change 2010, 106, 7–29. [Google Scholar] [CrossRef]
  8. Newton, A.; Icely, J.; Cristina, S.; Perillo, G.; Turner, R.; Ahsan, D.; Cragg, S.; Luo, Y.; Tu, C.; Li, Y.; et al. Anthropogenic, Direct Pressures on Coastal Wetlands. Front. Ecol. Evol. 2020, 8, 144. [Google Scholar] [CrossRef]
  9. Li, F.; Ding, D.; Chen, Z.; Chen, H.; Shen, T.; Wu, Q.; Zhang, C. Change of sea reclamation and the sea-use management policy system in China. Mar. Policy 2020, 115, 103861. [Google Scholar] [CrossRef]
  10. Murray, N.J.; Phinn, S.R.; DeWitt, M.; Ferrari, R.; Johnston, R.; Lyons, M.B.; Clinton, N.; Thau, D.; Fuller, R.A. The global distribution and trajectory of tidal flats. Nature 2019, 565, 222–225. [Google Scholar] [CrossRef]
  11. Peng, B.; Lin, C.; Jin, D.; Rao, H.; Jiang, Y.; Liu, Y. Modeling the total allowable area for coastal reclamation: A case study of Xiamen, China. Ocean. Coast. Manag. 2013, 76, 38–44. [Google Scholar] [CrossRef]
  12. Kennish, M. Environmental threats and environmental future of estuaries. Environ. Conserv. 2002, 29, 78–107. [Google Scholar] [CrossRef]
  13. Tian, B.; Wu, W.; Yang, Z.; Zhou, Y. Drivers, trends, and potential impacts of long-term coastal reclamation in China from 1985 to 2010. Estuar. Coast. Shelf Sci. 2016, 170, 83–90. [Google Scholar] [CrossRef]
  14. Qiu, L.; Zhang, M.; Zhou, B.; Cui, Y.; Yu, Z.; Liu, T.; Wu, S. Economic and ecological trade-offs of coastal reclamation in the Hangzhou Bay, China. Ecol. Indic. 2021, 125, 107477. [Google Scholar] [CrossRef]
  15. Zhang, X.; Zhang, Z.; Xu, Z.; Gu, D.; Zheng, W. Landscape pattern change and its cumulative environmental effects of coastal wetlands in southern Laizhou Bay. Chin. J. Ecol. 2009, 28, 2437–2443. [Google Scholar] [CrossRef]
  16. Ma, Z.; Melville, D.; Liu, J.; Chen, Y.; Yang, H.; Ren, W.; Zhang, Z.-W.; Piersma, T.; Li, B. Rethinking China’s new great wall. Science 2014, 346, 912–914. [Google Scholar] [CrossRef]
  17. Wang, X.; Xiao, X.; Xu, X.; Zou, Z.; Chen, B.; Qin, Y.; Zhang, X.; Dong, J.; Liu, D.; Pan, L.; et al. Rebound in China’s coastal wetlands following conservation and restoration. Nat. Sustain. 2021, 4, 1076–1083. [Google Scholar] [CrossRef]
  18. Yin, Y.; Jiang, L.; Zhang, Z.; Yu, H. Hydrodynamic changes due to coastal reclamation activities in Daya Bay. Aquat. Ecosyst. Health Manag. 2019, 22, 215–227. [Google Scholar] [CrossRef]
  19. Liu, R.; Xu, H.; Li, J.; Pu, R.; Sun, C.; Cao, L.; Jiang, Y.; Tian, P.; Wang, L.; Gong, H. Ecosystem service valuation of bays in East China Sea and its response to sea reclamation activities. J. Geogr. Sci. 2020, 30, 1095–1116. [Google Scholar] [CrossRef]
  20. Cui, B.; Xie, T.; Wang, Q.; Li, S.; Yan, J.; Yu, S.; Liu, K.; Zheng, J.; Liu, Z. Impact of Large-scale Reclamation on Coastal Wetlands and Implications for Ecological Restoration, Compensation, and Sustainable Exploitation Framework. Bull. Chin. Acad. Sci. 2017, 32, 418–425. [Google Scholar] [CrossRef]
  21. United Nations. Transforming our World: The 2030 Agenda for Sustainable Development; United Nations: New York, NY, USA, 2015. [Google Scholar]
  22. Hou, X.; Zhang, H.; Li, D.; Hou, W.; Song, Y. Development Trend, Environmental and Ecological Impacts, and Policy Recommendations for Bohai Sea Reclamation. Acta Ecol. Sin. 2018, 38, 3311–3319. [Google Scholar] [CrossRef]
  23. Liu, S.; Sun, S.; Yu, Y.; Zhang, Y. Ecological problems and countermeasures caused by land reclamation. Ocean. Dev. Manag. 2013, 30, 63–66. [Google Scholar]
  24. Sun, L.; Liu, H.; Yang, Y.; Tan, Y.; Wang, X. Comparative Studies: Coastal Reclamation Management between China and Abroad. J. Ocean. Univ. China (Soc. Sci. Ed.) 2010, 5, 40–46. [Google Scholar]
  25. Wang, N.; Zhu, G.; Li, X.; Cheng, J.; Yi, W.; Liu, S.; Xie, Z. Transitions and suggestions for China’s coastal port reclamation policies. Ocean. Coast. Manag. 2023, 236, 106532. [Google Scholar] [CrossRef]
  26. Ye, M.; Shi, X.; Li, J.; Liu, Y.; Jiang, Y.; Shi, Z. Changes of ecosystem service value under the rapid urbanization in the coastal zone of Zhejiang Province. J. Appl. Oceanogr. 2017, 36, 427–437. [Google Scholar] [CrossRef]
  27. Sun, X.; Li, Y.; Zhu, X.; Cao, K.; Feng, L. Integrative assessment and management implications on ecosystem services loss of coastal wetlands due to reclamation. J. Clean. Prod. 2017, 163, S101–S112. [Google Scholar] [CrossRef]
  28. Lin, T.; Xue, X.; Shi, L.; Gao, L. Urban spatial expansion and its impacts on island ecosystem services and landscape pattern: A case study of the island city of Xiamen, Southeast China. Ocean. Coast. Manag. 2013, 81, 90–96. [Google Scholar] [CrossRef]
  29. Ferraro, P.J.; Pattanayak, S.K. Money for Nothing? A Call for Empirical Evaluation of Biodiversity Conservation Investments. PLoS Biol. 2006, 4, e105. [Google Scholar] [CrossRef] [PubMed]
  30. Xie, G.; Zhang, C.; Zhang, L.; Chen, W.; Li, S. Improvement of the Evaluation Method for Ecosystem Service Value Based on Per Unit Area. J. Nat. Resour. 2015, 30, 1243–1254. [Google Scholar] [CrossRef]
  31. Villa, F.; Bagstad, K.J.; Voigt, B.; Johnson, G.W.; Portela, R.; Honzák, M.; Batker, D. A Methodology for Adaptable and Robust Ecosystem Services Assessment. PLoS ONE 2014, 9, e91001. [Google Scholar] [CrossRef]
  32. Sherrouse, B.C.; Clement, J.M.; Semmens, D.J. A GIS application for assessing, mapping, and quantifying the social values of ecosystem services. Appl. Geogr. 2011, 31, 748–760. [Google Scholar] [CrossRef]
  33. Sharp, R.; Douglass, J.; Wolny, S.; Arkema, K.; Bernhardt, J.; Bierbower, W.; Chaumont, N.; Denu, D.; Fisher, D.; Glowinski, K.; et al. InVEST 3.9.0 User’s Guide; The Natural Capital Project; Stanford University; University of Minnesota; The Nature Conservancy; World Wildlife Fund: Standford, CA, USA, 2020. [Google Scholar]
  34. Martinez-Harms, M.; Balvanera, P. Methods for mapping ecosystem service supply: A review. Int. J. Biodivers. Sci. 2012, 8, 17–25. [Google Scholar] [CrossRef]
  35. Liquete, C.; Piroddi, C.; Drakou, E.G.; Gurney, L.; Katsanevakis, S.; Charef, A.; Egoh, B. Current Status and Future Prospects for the Assessment of Marine and Coastal Ecosystem Services: A Systematic Review. PLoS ONE 2013, 8, e67737. [Google Scholar] [CrossRef]
  36. Polasky, S.; Nelson, E.; Pennington, D.; Johnson, K.A. The Impact of Land-Use Change on Ecosystem Services, Biodiversity and Returns to Landowners: A Case Study in the State of Minnesota. Environ. Resour. Econ. 2011, 48, 219–242. [Google Scholar] [CrossRef]
  37. Redhead, J.W.; Stratford, C.; Sharps, K.; Jones, L.; Ziv, G.; Clarke, D.; Oliver, T.H.; Bullock, J.M. Empirical validation of the InVEST water yield ecosystem service model at a national scale. Sci. Total Environ. 2016, 569–570, 1418–1426. [Google Scholar] [CrossRef] [PubMed]
  38. Guerry, A.; Ruckelshaus, M.; Arkema, K.; Bernhardt, J.; Guannel, G.; Kim, C.-K.; Marsik, M.; Papenfus, M.; Toft, J.; Verutes, G.; et al. Modeling benefits from nature: Using ecosystem services to inform coastal and marine spatial planning. Int. J. Biodivers. Sci. Ecosyst. Serv. Manag. 2012, 8, 107–121. [Google Scholar] [CrossRef]
  39. Tussadiah, A.; Sujiwo, A.S.; Andesta, I.; Daeli, W. Assessment of coastal ecosystem services and its condition for policy management plan in East Nusa Tenggara, Indonesia. Reg. Stud. Mar. Sci. 2021, 47, 101941. [Google Scholar] [CrossRef]
  40. Wuepper, D.; Finger, R. Regression discontinuity designs in agricultural and environmental economics. Eur. Rev. Agric. Econ. 2023, 50, 1–28. [Google Scholar] [CrossRef]
  41. Imbens, G.; Lemieux, T. Regression Discontinuity Design: A Guide to Practice. J. Econom. 2008, 142, 615–635. [Google Scholar] [CrossRef]
  42. Liu, C.; Zhu, Y.; Li, H. Regression Discontinuity Design: Theoretical Developments and Extended Applications. China J. Econ. 2022, 9, 325–366. [Google Scholar] [CrossRef]
  43. Ostrom, E. Governing the Commons: The Evolution of Institutions for Collective Action; Cambridge University Press: Cambridge, UK, 1990. [Google Scholar]
  44. Ramanathan, R.; He, Q.; Black, A.; Ghobadian, A.; Gallear, D. Environmental regulations, innovation and firm performance: A revisit of the Porter hypothesis. J. Clean. Prod. 2017, 155, 79–92. [Google Scholar] [CrossRef]
  45. Yu, C.; Xiaohui, Z.; Luyao, M.; Zeng, X. How does environmental regulation promote firm performance? Evidence from Chinese environmentally friendly firms. J. Environ. Plan. Manag. 2025, 1–30. [Google Scholar] [CrossRef]
  46. Yang, J.; Huang, X. The 30 m annual land cover dataset and its dynamics in China from 1990 to 2019. Earth Syst. Sci. Data 2021, 13, 3907–3925. [Google Scholar] [CrossRef]
  47. Chen, Y.; Xia, H.; Xu, Z.; Li, G.; Zhuo, Y.; Wang, X. Evaluating the Performance of Ecological Conservation Red Line Based on Counterfactual Framework: A Case of Ningbo City. China Land Sci. 2023, 37, 128–140. [Google Scholar]
  48. Yue, W.; Xia, H.; Wu, T.; Xiong, J.; Zhong, P.; Chen, Y. Spatio-temporal evolution of habitat quality and ecological red line assessment in Zhejiang Province. Acta Ecol. Sin. 2022, 42, 6406–6417. [Google Scholar] [CrossRef]
  49. Liu, Y.; Zhou, Y.; Du, Y. Study on the Spatio-Temporal Patterns of Habitat Quality and Its Terrain Gradient Effects of the Middle of the Yangtze River Economic Belt Based on InVEST Model. Resour. Environ. Yangtze Basin 2019, 28, 2429–2440. [Google Scholar]
  50. Zhu, L.; Hu, K.; Sun, S.; Liu, Y.; Liang, J. Research on the Spatiotemporal Variation of Carbon Storage in the Coastal Zone of Liaoning Province Based on InVEST Model. Geoscience 2022, 36, 96. [Google Scholar] [CrossRef]
  51. Fang, Z.; Zhong, C.; Wang, F.; Cheng, C.; Lv, X.; Chen, X. Spatial-temporal Evolution and Prediction of Ecosystem Carbon Stocks on Hainan Island by Coupling the InVEST and FLUS Models. Bull. Soil Water Conserv. 2023, 43, 320–329. [Google Scholar] [CrossRef]
  52. Yang, W.; Jin, Y.W.; Sun, T.; Yang, Z.F.; Cai, Y.P.; Yi, Y.J. Trade-offs among ecosystem services in coastal wetlands under the effects of reclamation activities. Ecol. Indic. 2018, 92, 354–366. [Google Scholar] [CrossRef]
  53. Lee, D.S. Randomized experiments from non-random selection in US House elections. J. Econom. 2008, 142, 675–697. [Google Scholar] [CrossRef]
  54. Li, F.; Yin, X.; Shao, M. Natural and anthropogenic factors on China’s ecosystem services: Comparison and spillover effect perspective. J. Environ. Manag. 2022, 324, 116064. [Google Scholar] [CrossRef]
  55. Xiong, C.; Liang, Y.; Hu, Y.; Ni, X.; Luan, Q. Net Effect and Mechanism Analysis of Hainan International Tourism Island Construction on Urban Construction Land Expansion. China Land Sci. 2022, 36, 59–68. [Google Scholar] [CrossRef]
  56. Luo, Q.; Luo, L.; Zhou, Q.; Song, Y. Does China’s Yangtze River Economic Belt policy impact on local ecosystem services? Sci. Total Environ. 2019, 676, 231–241. [Google Scholar] [CrossRef]
  57. Yi, H.; Güneralp, B.; Kreuter, U.P.; Güneralp, İ.; Filippi, A.M. Spatial and temporal changes in biodiversity and ecosystem services in the San Antonio River Basin, Texas, from 1984 to 2010. Sci. Total Environ. 2018, 619, 1259–1271. [Google Scholar] [CrossRef] [PubMed]
  58. Gu, Y.; Lin, N.; Cao, B.; Ye, X.; Pang, B.; Du, W.; Dou, H.; Zou, C.; Xu, C.; Xu, D.; et al. Assessing the effectiveness of Ecological Conservation Red Line for mitigating anthropogenic habitat degradation in river corridors. Ecol. Indic. 2023, 154, 110742. [Google Scholar] [CrossRef]
  59. Qin, X.; Yang, Q.; Wang, L. The evolution of habitat quality and its response to land use change in the coastal China, 1985–2020. Sci. Total Environ. 2024, 952, 175930. [Google Scholar] [CrossRef] [PubMed]
  60. Zedler, J.; Kercher, S. Wetland Resources: Status, Trends, Ecosystem Services, and Restorability. Annu. Rev. Environ. Resour. 2005, 15, 39–74. [Google Scholar] [CrossRef]
  61. Craft, C. Freshwater input structures soil properties, vertical accretion, and nutrient accumulation of Georgia and U.S tidal marshes. Limnol. Oceanogr. 2007, 52, 1220–1230. [Google Scholar] [CrossRef]
  62. Nixon, S.; Buckley, B. “A Strikingly Rich Zone”: Nutrient Enrichment and Secondary Production in Coastal Marine Ecosystems. Estuaries 2002, 25, 782–796. [Google Scholar] [CrossRef]
  63. Rooij, B.v. The People’s Regulation: Citizens and Implementation of Law in China. Columbia J. Asian Law 2012, 25, 116. [Google Scholar] [CrossRef]
Figure 1. Theoretical framework for policy impacts on ecosystem services.
Systems 13 00431 g001
Figure 2. Evolution of China’s reclamation policy.
Systems 13 00431 g002
Figure 3. Location of the study area.
Systems 13 00431 g003
Figure 4. Changes in the distribution of ecosystem services from 2005 to 2020.
Systems 13 00431 g004
Figure 5. Models 1–2: the impacts of reclamation policies on absolute value of ESs using 2011 and 2017 as breakpoints (The red solid lines represent the linear fitting before the breakpoints, while the green dot lines represent the linear fitting after the breakpoints).
Systems 13 00431 g005
Figure 6. Model 3–4: the impacts of reclamation policies on the ESs changes, using 2011 and 2017 as breakpoints (The red solid lines represent the linear fitting before the breakpoints, while the green dot lines represent the linear fitting after the breakpoints).
Systems 13 00431 g006
Table 1. Threat factor parameters for habitat quality.
ThreatMax_dist (km)WeightDecayReferences
Farmland0.50.2LinearBased on [47,48,49].
Construction Land0.20.5Exponential
Table 2. LULC habitat suitability and sensitivity to threats.
LULCHabitatThreatsReferences
FarmlandConstruction Land
Farmland7.7457.831.32Based on [47,48,49].
Forest28.3895.352.15
Grassland14.2975.78.46
Wetland20.75160.422.65
Construction Land0.0020.780.00
Unused Land1.8215.880.00
Sea0.000.000.00
Table 3. Carbon densities for LULC types in the Ningbo coastal zone (t/hm2).
LULCC_AboveC_BelowC_SoilC_DeadReferences
Farmland7.745.2657.831.32Based on [50,51].
Forest28.3810.8295.352.15
Grassland14.2915.1975.78.46
Wetland20.7513.6160.422.65
Construction Land0.000.0020.780.00
Unused Land1.820.0015.880.00
Sea0.000.000.000.00
Table 4. Results of regression discontinuity.
HQCSMP
201120172011201720112017
Yi,tΔYi,tYi,tΔYi,tYi,tΔYi,tYi,tΔYi,tYi,tΔYi,tYi,tΔYi,t
0.001
(0.44)
0.375 ***
(3.19)
−0.001
(−0.41)
−0.172 ***
(−3.57)
0.002
(0.42)
9.111 ***
(3.23)
0.003
(0.82)
1.798 **
(2.42)
0.003
(0.65)
1.166 **
(2.12)
0.002
(0.27)
0.872 ***
(3.76)
***—significant at 1% level; **—significant at 5% level.
Table 5. Results of robustness test.
ItemOutcome VariableBreak PointMethodsCoef. of Di,t
HQΔYi,t2011Replacement bandwidth0.750.122 *
(1.86)
1.250.375 ***
(3.20)
Replacement kernel functionRectangle0.271 ***
(3.37)
Replacement breakpoint2010−0.173 **
(−2.48)
2012−0.046
(−0.50)
2017Replacement bandwidth0.75−0.033
(−1.01)
1.25−0.163 ***
(−3.37)
Replacement kernel functionRectangle−0.187***
(−3.84)
Replacement breakpoint20160.074 *
(1.94)
2018−0.207 ***
(−3.06)
CS2011Replacement bandwidth0.753.437 **
(2.23)
1.259.086***
(3.24)
Replacement kernel functionRectangle6.834 ***
(3.57)
Replacement breakpoint2010−4.116 ***
(−2.94)
2012−1.845
(−0.88)
2017Replacement bandwidth0.751.798 **
(2.42)
1.250.000
(.)
Replacement kernel functionRectangle−1.005
(−1.14)
Replacement breakpoint20161.942 ***
(5.27)
2018−5.717 ***
(−6.11)
MP2011Replacement bandwidth0.750.891
(1.29)
1.251.327 ***
(2.82)
Replacement kernel functionRectangle1.191 ***
(3.22)
Replacement breakpoint20100.880 *
(1.90)
2012−1.995 **
(−2.57)
2017Replacement bandwidth0.750.518 ***
(2.81)
1.250.670 **
(2.36)
Replacement kernel functionRectangle0.640 **
(2.25)
Replacement breakpoint20160.564 *
(1.66)
2018−0.730 *
(−1.94)
***—significant at 1% level; **—significant at 5% level, *—significant at 10% level.
Disclaimer/Publisher’s Note: The statements, opinions and data contained in all publications are solely those of the individual author(s) and contributor(s) and not of MDPI and/or the editor(s). MDPI and/or the editor(s) disclaim responsibility for any injury to people or property resulting from any ideas, methods, instructions or products referred to in the content.

