Article

Integrating ESG with Digital Twins and the Metaverse: A Data-Driven Framework for Smart Building Sustainability


1
LUM Enterprise S.r.l., 70010 Casamassima, Italy
2
Deloitte Consulting S.r.l., 20122 Milan, Italy
3
Dipartimento di Management, Finanza e Tecnologia (MFT), LUM University Giuseppe Degennaro, 70010 Casamassima, Italy
*
Author to whom correspondence should be addressed.
Systems 2025, 13(12), 1083; https://doi.org/10.3390/systems13121083
Submission received: 6 October 2025 / Revised: 6 November 2025 / Accepted: 27 November 2025 / Published: 1 December 2025

Abstract

This article proposes a complex solution to improve sustainable intelligent building management based on the principles of Environmental, Social, and Governance (ESG) factors. The ESG KPI Framework–Metaverse-Enabled Operations incorporates the latest digital twin solutions, IoT sensor systems, and metaverse platforms to deliver real-time management and optimization of ESG factors. A hybrid solution strategy has been used in this framework, focusing on auto-acquisition of information and multiple validations at different levels through correlation analysis, Principal Component Analysis (PCA), Ordinary Least Squares (OLS) regression, and Machine Learning. The designed prototype links all the solutions together in a multi-level dashboard to represent key performance factors such as carbon footprint, energy consumption, renewable energy use, and occupant wellness. Experiments conducted validate the effectiveness of the proposed solution in improving prediction efficiency and user interaction experience during metaverse simulations.

1. Introduction

Recent technological advancements and the sustainable development movement have led to revolutionary changes in intelligent building management. The present-day system has evolved from simple automation into complex network-based architectures that support data-driven and adaptive operations [1]. This transformation reflects the convergence of artificial intelligence, machine learning, Building Information Modeling (BIM), and digital twin technologies in the built environment [2].
Building Information Modeling (BIM) can be defined and explained at two levels of meaning: narrow and broad. In its narrow sense, Building Information Modeling is a technology that supports and enables the creation, visualization, and management of three-dimensional building elements with parametric information attached or embedded. In its broadest sense, Building Information Modeling is an integrated, collaborative approach that links, manages, and integrates multidisciplinary information and workflows throughout the life cycle of a building—from creation and construction to operation and maintenance.
The focus of smart building systems has consequently shifted from energy optimization alone to encompassing user health, carbon emission reduction, and ethical management principles [3]. However, the ever-increasing use of digital solutions has introduced greater complexity into urban systems, which now require more advanced tools for planning, operation, and monitoring [4]. This complexity has encouraged the development of innovative methodologies that extend beyond traditional control or energy management systems, emphasizing prediction, automation, and adaptability as the new priorities [5]. Consequently, the need for real-time monitoring systems with predictive and visual capabilities has become increasingly urgent, as current approaches are often static and reactive rather than dynamic and proactive [6]. Existing systems, in fact, have remained relatively basic, providing passive reporting based solely on limited variables such as temperature, occupancy, or energy efficiency. While such systems have contributed to initial efficiency gains, they neglect the broader context of sustainability and governance. Most fail to integrate Environmental, Social, and Governance (ESG) principles, which extend beyond energy metrics to include carbon neutrality, renewable energy use, user safety and well-being, and institutional transparency [7]. Digital twin technology, in particular, has emerged as one of the most promising solutions for implementing these multidimensional sustainability requirements. As highlighted by [1], digital twins enable real-time integration and optimization between physical and virtual systems in the building sector, supporting continuous feedback and adaptive management. Similarly, ref. [3] demonstrate that the integration of digital twins within urban infrastructures—such as in the SmartWins project—can significantly contribute to achieving carbon neutrality and operational resilience in smart cities. Complementing digital twins, Internet of Things (IoT) systems play a fundamental role by using sensor networks to monitor environmental parameters, including energy use, air quality, temperature, and occupancy patterns, which provide the empirical foundation for real-time analytics [6,7] further emphasize how such sensor-based systems, when coupled with digital twins, can predict thermal comfort and environmental performance, thereby enabling more precise control and sustainable decision-making. At the same time, metaverse environments have introduced new possibilities for immersive 3D visualization and interaction within the digital twin ecosystem [8] explore this potential through their integration of BIM–GIS–metaverse technologies in urban heritage planning, showing how immersive digital environments enhance both stakeholder engagement and design accuracy. Likewise, ref. [4] point out that digital technologies such as VR and AR are reshaping urban management and participatory planning, providing stakeholders with greater spatial awareness and collaborative capability in virtual spaces. Despite these advancements, the synergistic potential between metaverse technologies, digital twins, and ESG-oriented management remains largely unexploited. Most studies have focused primarily on optimization or visualization, with little attention given to embedding ESG metrics into real-time interactive frameworks [3,5]. Current ESG reporting systems are typically retrospective and periodic, offering limited predictive or prescriptive capabilities. This creates a disconnect between sustainability objectives and day-to-day operational management. The innovative solution presented in this study aims to overcome these limitations by linking the quantitative dimension of ESG factors to immersive digital environments, where stakeholders can experience and analyze sustainability performance dynamically. The proposed integration of digital twins, IoT sensing, and metaverse visualization establishes a continuous information loop, allowing users to access and interpret key ESG indicators—such as carbon footprint, energy consumption, renewable energy utilization, and occupant comfort—in real time [6,7]. This interactive model empowers stakeholders to move beyond passive observation toward active scenario development and decision-making, enhancing participatory governance and system transparency. By continuously feeding validated IoT data into predictive digital twin models and visualizing outcomes within the metaverse, the framework supports self-correcting, adaptive performance management. Predictions are refined through iterative simulation, improving responsiveness to dynamic environmental and behavioral changes in building operations. Furthermore, the spatial and immersive dimension of sustainability, as visualized in metaverse environments, transforms abstract data into geographically intuitive experiences. As [5,7] suggest, combining digital twins, blockchain networks, and sensor-based algorithms can create a foundation for sustainable smart city administration capable of integrating complex ESG objectives across multiple spatial and temporal layers. This approach redefines sustainability not merely as a numerical output but as an experiential geography, facilitating more effective spatial planning and community engagement toward sustainable urban development. Overall, this integrative strategy bridges the gap between ESG principles and the operational reality of sustainable development, contributing to the advancement of intelligent building management and the broader smart city paradigm. The resulting system aspires to move from static sustainability reporting to dynamic, data-validated, and user-centered decision-making, positioning metaverse-enabled digital twins as a transformative tool for achieving the next generation of sustainable, adaptive, and intelligent infrastructures.
However, despite the technological advancements achieved in previous studies, the area of concern identified still recognizes the lack of development in integrating ESG principles into the context of an immersive, real-time building management system. This has been attributed to the fact that previous studies have only addressed the technological capabilities of digital twins/IoT systems or the development of the metaverse. This specific area of concern is the development and verification of the ESG KPI Framework: Metaverse-Enabled Operations. This innovative solution combines the principles of digital twins, the use of IoT-based sensors, and metaverse visualization components to create a real-time ESG optimization solution. The applicability of the current area of concern can be specifically attributed to the fact that the development of immersive integrated environments can revolutionize the management of ESG.
The article continues as follows: the second section formulates the research question, “Toward an Integrated Metaverse-Based Platform for Smart Building Management,” which defines the conceptual scope of the study. The third section outlines the theoretical and technological framework underpinning the integration of digital twins, metaverse environments, and smart infrastructure management. The fourth section describes the development of an environmental dataset designed to evaluate smart infrastructure performance through digital twin integration, while Section 4.1, Section 4.2 and Section 4.3 detail the construction of Environmental, Social, and Governance (ESG) Key Performance Indicators (KPIs) that constitute the analytical foundation for sustainability assessment. The fifth section presents a descriptive statistical analysis of the KPI dataset, enabling preliminary validation of the proposed prototype. The sixth section defines the validation framework and data reliability procedures for the ESG-based smart building model. The seventh section examines the scientific validation of ESG data through correlation analysis, with Section 7.1, Section 7.2 and Section 7.3 analysing the Environmental (E), Social (S), and Governance (G) dimensions respectively. The eighth section introduces a regression-based validation approach for modelling smart building performance using the ESG dataset. The ninth section applies Principal Component Analysis (PCA) for the technical validation of the ESG dataset, and Section 9.1, Section 9.2 and Section 9.3 report the PCA outcomes for each ESG dimension. The tenth section employs machine learning regression methods to enhance the validation process, with Section 10.1, Section 10.2 and Section 10.3 focusing on the Environmental, Social, and Governance components. The eleventh section discusses the overarching theoretical framework of digital twin interoperability, user-centred virtual environments, and intelligent data-driven control systems in smart building management. The twelfth section operationalizes environmental sustainability through a metaverse-enhanced ESG dashboard for real-time smart building governance. The thirteenth section provides a critical discussion of the findings, followed by the fourteenth section, which addresses the study’s methodological and conceptual limitations. Finally, the fifteenth section concludes the paper by summarizing the principal results and outlining future directions for research on metaverse-based smart infrastructure management.

2. Research Question: Toward an Integrated Metaverse-Based Platform for Smart Building Management

The main topic of the aforementioned research stems from the NextHub Project’s purposes, in which the use of the metaverse in Smart Building solutions has been investigated. In this regard, the current research envisions the design and development of a management structure that integrates performance measurement based on ESG factors with digital immersive environments. This should enable real-time interaction and optimization of the performance of the aforementioned structures by leveraging the interplay among the Digital Twin paradigm, the Internet of Things (IoT), Artificial Intelligence (AI), and Extended Reality (XR) systems. The inspiration for the aforementioned research stems from the fact that Smart Building systems remain disparate and consist mainly of entities such as energy-efficiency tracking and control systems and user comfort control systems. In other words, the aforementioned systems lack a management structure that can connect the metric to digital immersion. Given that the aforementioned structures continue to evolve at a very rapid pace on the technological plane due to the acceleration driven by the metaverse environment, the development of a data-driven management structure that focuses on these factors has become the essence of the research. This forms the basis for the following research question: In what ways can the management system built for the metaverse, utilizing the concepts of Digital Twins, IoT, AI, and XR, be more effective in measurable aspects of ESG factors like energy efficiency, carbon footprint reduction, comfort levels of occupants, and transparency in governance than the currently available non-immersive systems? This question contextualizes the research effort within the wider discourse on the digital transformation of the built environment, in which the interplay between immersive visualization techniques, real-time analytics, and intelligent automation represents “the next phase of innovation in the built environment.” The emphasis on verifiable ESG factors thereby ensures that the research effort can remain more than merely speculative at the level of “grand concepts,” since empirical verification will instead be “grounded in measurable outcomes.” In order to inform the search effort, a specific search strategy has been conducted utilizing the Elsevier Scopus database (English language publications between 2018 and 2025), whereby the following query has been employed: “TITLE-ABS-KEY (“metaverse”) AND TITLE-ABS-KEY (“smart building”).” This specific query revealed only five peer-reviewed documents from the queried database. This outcome has confirmed that the topic has been addressed only very rarely. While the results obtained fall short of the level required for a formal Systematic Review, the outcome has qualitatively underscored the lack of a well-defined body of research. Current studies offer cherished but disintegrated insights: computing systems for intelligent building networks [9], extended reality solutions for building maintenance and user experience [10], IoT-blockchain integration for the management of decentralized data [11], experimental systems combining IoT sensors and commercial metaverse platforms [12], and theoretical systems merging the concepts of digital twins and metaverse [13]. See Table 1.
To ensure transparency in the literature selection process, a PRISMA-lite flow diagram was developed to illustrate the identification and screening of the retrieved studies. As shown in Figure 1 the Scopus database search conducted with the query TITLE-ABS-KEY (“metaverse”) AND TITLE-ABS-KEY (“smart building”) for the period 2018–2025 yielded five peer-reviewed records. No duplicates or exclusions were found, and all five studies were included in the qualitative synthesis summarized in Figure 1.
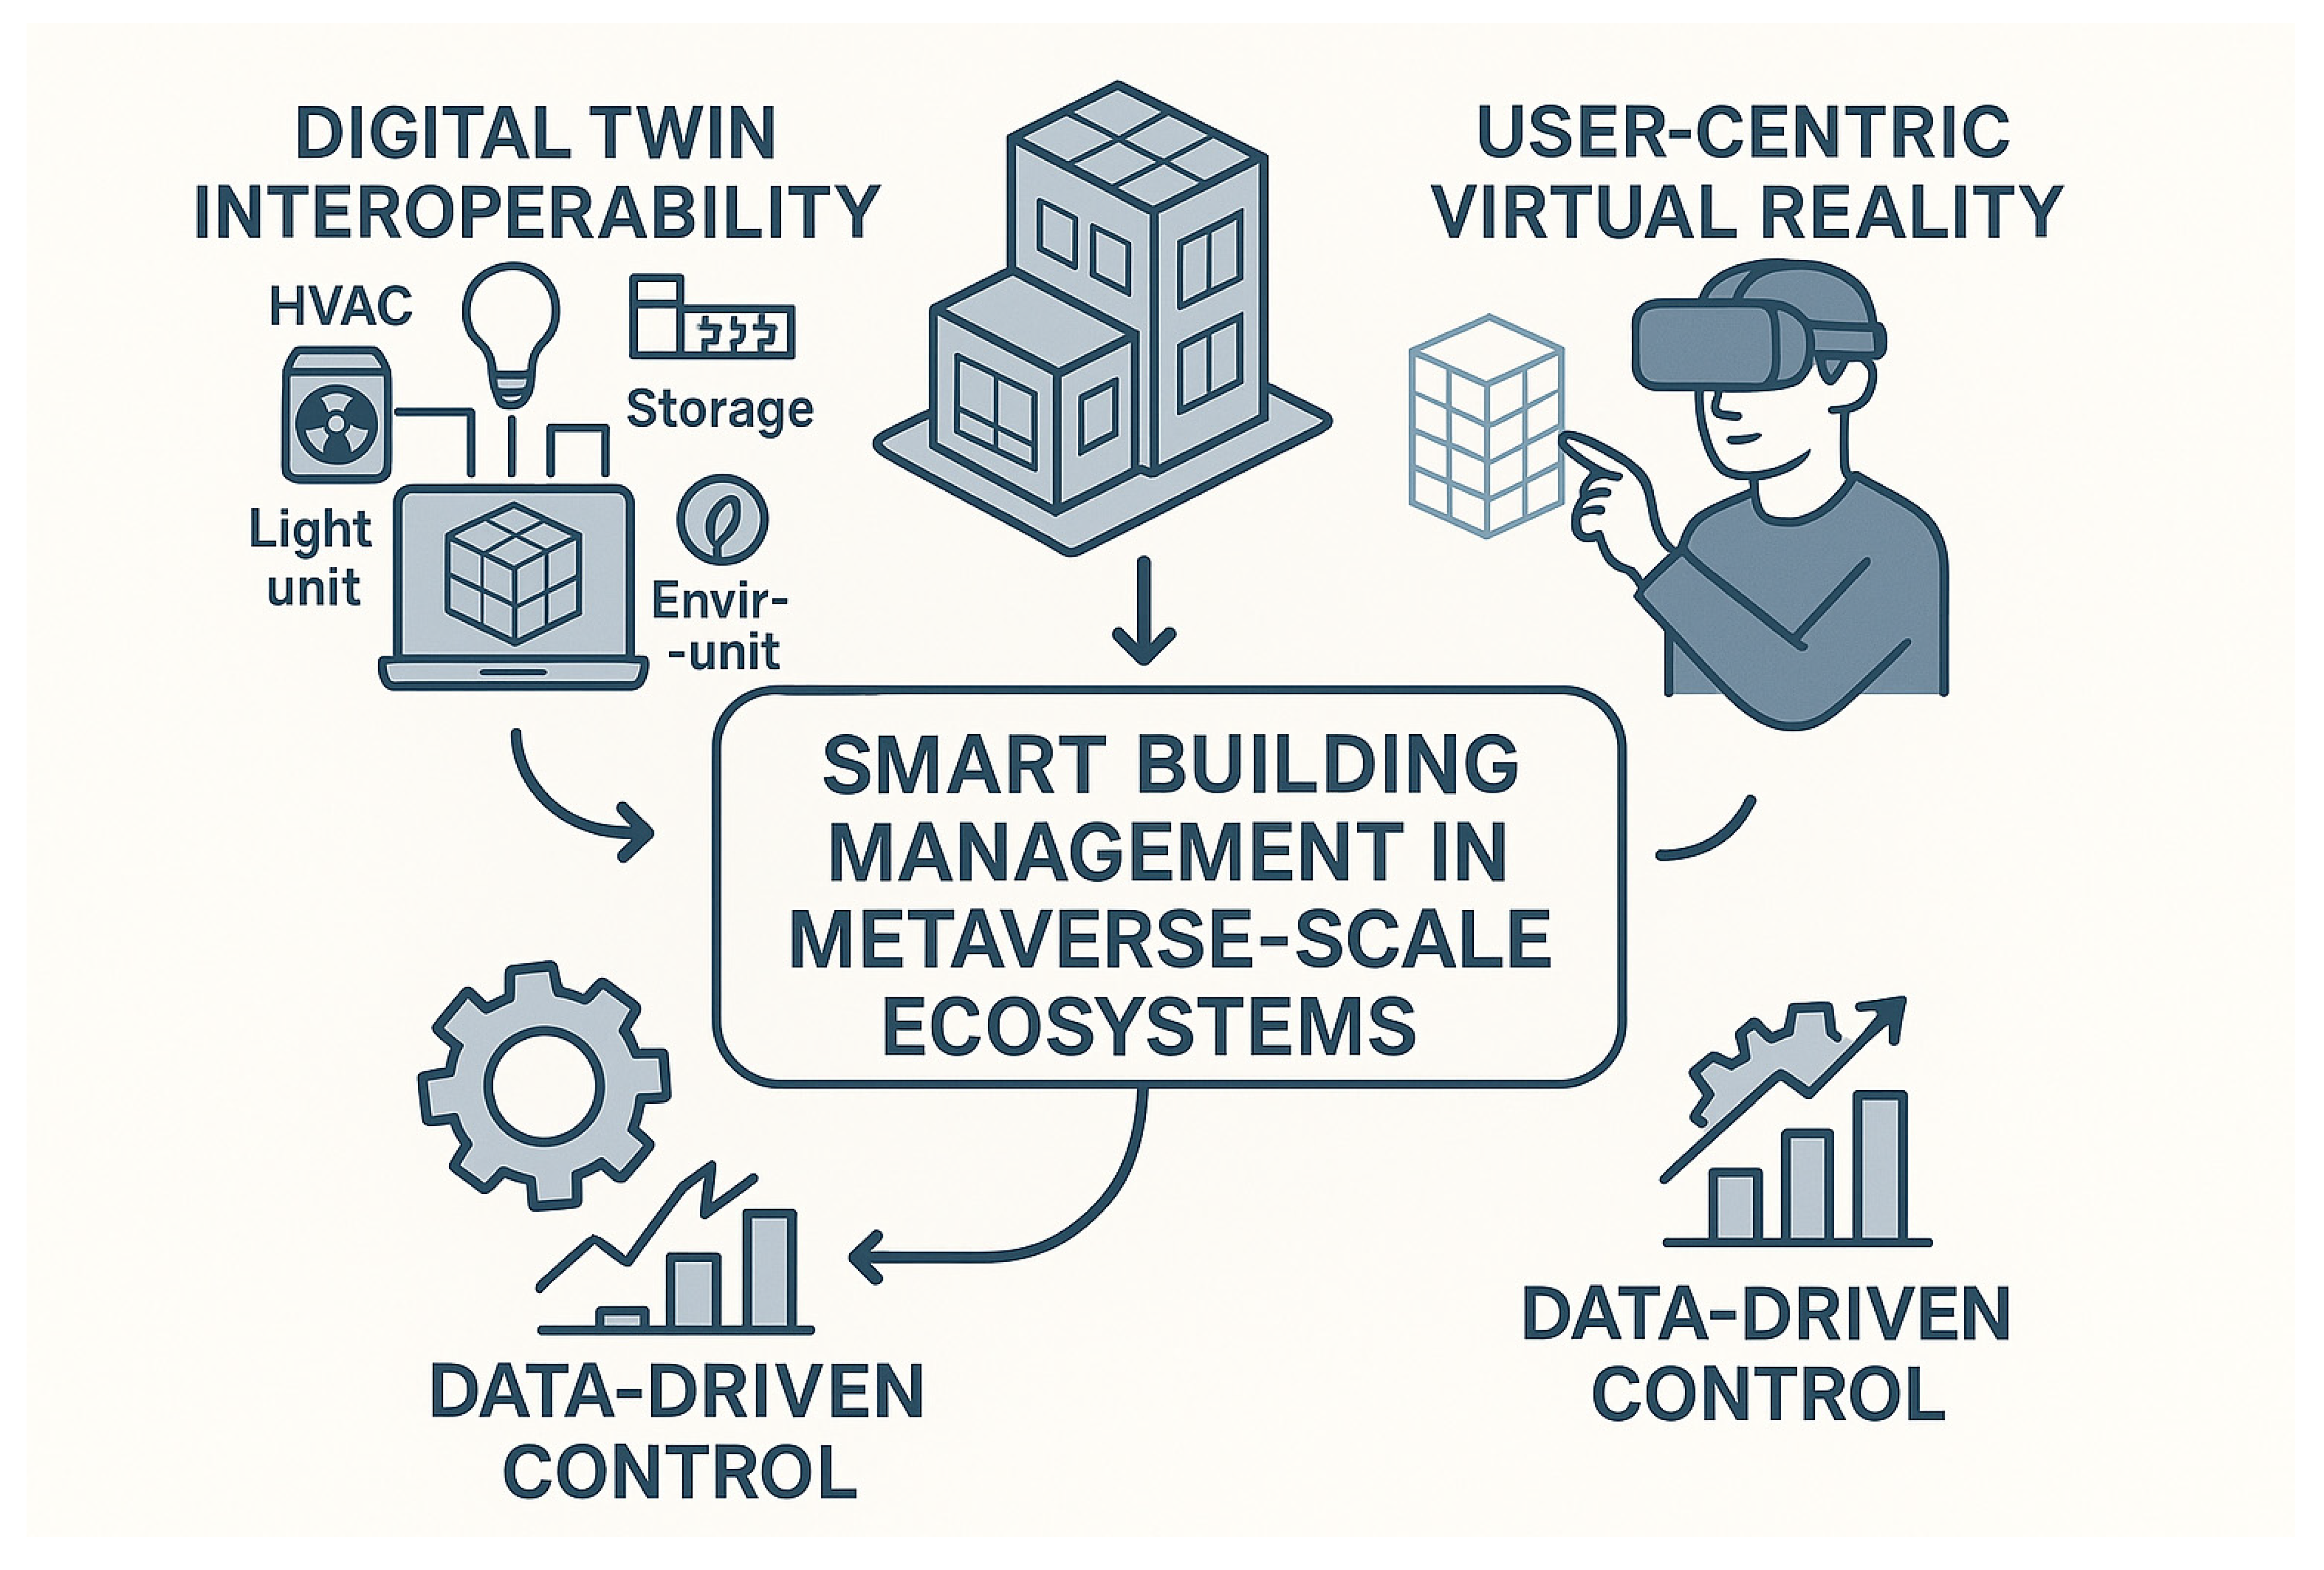
Though very useful, current studies are fragmented and lack a standardized metric and a management approach to synchronize intelligent building management across technological, management, and sustainability aspects. This work specifically builds upon prior foundation achievements and proposes a measurable, interactive management system that integrates the metaverse into building management. This system goes beyond the management model design and introduces standardized Key Performance Indicators for energy consumption efficiency, building maintenance efficiency, occupants’ health and well-being, and governance. All four performance indicators can be quantitatively measured using real-time building data-sense flow, validated through AI-empowered analytics. However, the immersive nature of the entire system facilitates the visualization of the aforementioned four building performance factors in physical space and supports building management-related decision-making. To clearly demonstrate the management structure of the interconnection among the three technology components of the entire building management system, Figure 1 presents a management-related schematic overview of the system. This management process finally ends at a level that demonstrates the digital transformation effectiveness of building management based on environmental sustainability (Figure 2).

3. Theoretical and Technological Framework

The above-mentioned ESG KPI Framework—Metaverse-Enabled Operations has been designed based upon the following three fundamental pillars: the theoretical foundation, the technological foundation, and the operational factors. From a theoretical foundation, the ESG KPI Framework has been based on the constructs of “Cyber-Physical Systems” and “Human–Computer Interaction,” which describe the relationship between the digital and physical worlds in intelligent environments. The “Cyber-Physical Systems” theory explains the symbiotic relationship between the building’s physical systems and their digital counterparts, and the interfaces that connect them, to establish a real-time sensing and control process between the virtual and physical systems [14,15]. This “Cyber-Physical” relationship has become more robust through the integration of “Human–Computer Interaction” principles, which simplify the development of human-centered interfaces that promote intuitive interaction and informed decision-making in the metaverse [16,17]. On the other hand, from a technological foundation perspective, the framework uses the “Digital Twin” as its computational core. A “Digital Twin” is the real-time digital representation of a physical structure that uses IoT-based information flows on energy consumption, indoor air quality, and occupancy patterns to optimize these factors. Moreover, the AI analytics module in the framework enhances the predictive capacity for pattern analysis, irregularity detection, and the development of self-adaptive management strategies [14]. Blockchain-based solutions are being adopted to make ESG reporting more trustworthy and reliable. Blockchain-based solutions add authenticity to information about the actual sustainability records of the concerned structure [15,18]. The “Metaverse” layer lies between human operators and the digital world. This layer enables users to navigate the real-time ESG performance indicators presented through “Human–Computer Interaction” visualization. This layer converts sustainability information from a numeric form into a spatial interface that can be navigated in 3D. Moreover, the “Virtual Reality” and “AR” solutions are adapted to enhance the perception of information on ESG factors in realistic contexts, thereby improving decision-making [16,17]. From the systemic and functional perspective: “The ESG KPI Framework can be viewed as a hierarchical cyber-physical architecture for intelligent building management. In the architecture, the IoT layer can be considered as the sensory layer. The Digital Twin layer can represent the analytics and prediction module. The Metaverse layer can represent the human–computer interaction layer. The interactions among the aforementioned layers can support a self-learning process encompassing the stages of “sensing,” “simulation,” “visualization,” and “optimization,” forming a closed loop. This closed-loop process enables real-time responsiveness and optimization. For example, ref. [14] describes a self-learning process for sensors that can monitor and analyze sensor readings. This can predict future sensor outputs. This can represent the prediction module. The prediction module can predict future human behavior as needed. This can represent the human module. The self-learning human module can generate appropriate human–machine interaction processes. This can represent the human–computer interaction module. The self-learning human module can influence the prediction module. This can represent the human–computer interaction module” [14]. In total, the proposed ESG KPI Framework incorporates the concepts of CPS, HCI, and ESG in the digital universe.

4. Development of the Environmental Dataset for Evaluating Smart Infrastructure Performance Through Digital Twin Integration

The creation of the environmental data set for the evaluation of environmental performances marks an imperative step in the design of an intelligent digital model based on digital twin applied to smart infrastructures. In light of this consideration, the environmental KPI set section marks the foundation of the proposed research based on digital twin applied to environmental performances of smart infrastructures. The bibliographic research on digital twin applied to environmental performances of smart infrastructures leads to an understanding of the relevant KPI necessities proposed by digital twin. The ultimate goal of designing digital twin applied to environmental performances of smart infrastructures is to introduce an integrated system that enables the simulation of environmental performances of infrastructures. The applied KPI set permits an operative analysis of the synergic relationship concerning energy efficiency, sustainability, and environmental performances. The proposed KPI set permits an analysis of carbon footprint and emission intensity that provides extend information on environmental sustainability. The remaining KPI set related to load cover factor and on-site energy ratio grants evidence on system autonomy and energy efficiency. The data set creation implemented by the KPI set permits an integrated analysis of environmental performances that corresponds to the principles of the environmental framework proposed by ESG. The designed data set permits an operative comparison of environmental performances of an infinite number of infrastructures. The data set designed permits an intelligent analysis of environmental performances that provides a knowledge base on environmental sustainability of infrastructures. The designed data set permits an analysis on environmental performances of infrastructures that marks a perpetual approach to design decision concerning data set creation. The data set creation design permits an intelligent extension on system environmental design that provides an intelligent knowledge on system environmental sustainability. In an ultimate analysis on data set creation designed by digital twin applied to environmental performances of infrastructures, digital twin represents an intelligent approach toward environmental sustainability of infrastructures.

4.1. Environmental Key Performance Indicators (KPIs) for Digital Twin-Based Evaluation of Smart Infrastructure

The chosen environmental Key Performance Indicators (KPIs) provide a comprehensive framework for evaluating the environmental performance characteristics of smart infrastructures. These factors help support the aims and scope of the proposed digital twin platform, aiming to analyze, model, and optimize the environmental, energy, and operational characteristics of buildings and urban infrastructures in an immersive and data-driven setting [3,18]. Each Key Performance Indicator adds a unique perspective on energy, resilience, and efficiency, combining to form a holistic model for managing and interpreting the sustainability of urban infrastructures [19]. The Carbon Footprint (CFPT) provides a fundamental measure of sustainability by quantifying the total greenhouse gas emissions generated by system activity. This metric allows for the interpretation of complex system operations through a comparative metric expressed in CO2-eq, evaluating both direct and indirect emissions [20]. Applied in digital twin analysis, it is essential for the CFPT, as it enables real-time analysis and projection of environmental implications across different system operation scenarios [21]. It effectively serves as the central model connecting energy performance characteristics to global environmental goals for climate regulation [20]. Emission Intensity (EMIN) adds a further dimension by using normalized factors directly related to the energy consumed or produced [22]. This type of ratio analysis permits different system-scale operations to compare system emissions, making it highly valuable for multi-building and city-scale analysis [23]. The Load Cover Factor (LCF) and Supply Cover Factor (SCF) assess the relationship presented by energy demand and supply, an important consideration for energy and resource sufficiency. The LCF will evaluate how much local energy production can sustain energy activity for a predetermined period, assessing system sufficiency, while SCF will assess how much local energy production can sustain energy use for a predetermined period, assessing system resource use [24]. The Load Matching Index (LMI) evaluates the synchrony of system dimensions for local energy production and energy activity. Large LMI values clearly indicate that local energy production and storage are well supported by local loads, thereby providing a fundamental basis for the efficiency and resilience of Smart Grids [25]. The On-Site Energy Ratio (OER) also captures the extent to which local energy consumption is supported by local use of Renewable Energy sources, thereby serving as a crucial factor in assessing the zero-energy building index [26]. The Grid Interaction Index (GII) and No-Grid Interaction Probability (NGI) further establish the global context for autonomy. The GII captures the intensity and direction of energy interactions, while the NGI estimates the probability of autonomy [3]. Capacity Factor (CAF) and One Percent Peak Power (OPP) establish system performance at varying loads. The Capacity Factor estimates system performance and its ability to use its installed energy resources, thereby forming a crucial index for judging performance return on investment, while the One Percent Peak Power focuses on peak loads and their intensity, thereby estimating impacts on system stress [27]. Building on the concept of behavior-based system performance, the Demand Response Percentage (DRS) estimates system performance flexibility in adapting to varying loads, particularly in Smart Pricing scenarios [28]. The system’s total flexibility level for adapting to global environmental stimuli, such as market prices or Renewable resource availability, thereby covering system transitions from Static Energy Management to Adaptability, is captured by the system’s triple dimensions—the Flexibility Factor (FLF), Flexibility Index (FLI), or Flexible Energy Efficiency (FEE) [24,29]. This framework satisfies not only system sustainability analysis requirements but also provides additional benefits for decision-making, scenario analysis, and future system optimization [18,20]. This framework therefore aligns well with the system requirements for an intelligent, fully interoperable, and environmentally sustainable Smart Urban Ecosystem, supported by measurable system performance indicators (Table 2).

4.2. Social and Environmental Key Performance Indicators (KPIs) for Digital Twin-Based Assessment of Smart Urban and Industrial Infrastructures

The set introduced for Key Performance Indicators (KPIs) plays an important role in facilitating the digital twin and metaverse software platform proposed, highlighted in the abstract, since it plays an important enabling role in assessing, optimizing, and ensuring the factors related to Smart Urban and Industrial Infrastructure [40,41]. The proposed set of KPIs serves as parameters that enable the processing of complex phenomena related to the environment into measurable values, enabling real-time processing, simulation, and optimization [42,43]. The integration process fully meets the aims of the ESG (Environmental, Social, and Governance) evaluation framework, particularly targeting both Environmental and Social factors [44]. Focusing on KPIs that assess indoor environmental quality, energy efficiency, and user comfort, the proposed platform enables, through an evidence-based process, the optimization of sustainable design, preventive maintenance, and energy-efficient building operations [45]. Humidity (HUM) is an important KPI for assessing indoor environmental quality. This parameter measures the actual water content percentage in the air, relative to its maximum threshold at a given temperature scale. Humidity level, when maintained within its optimal range (40% to 60%), plays a critical role in health and comfort, since low air humidity can lead to air irritation and electrical charges, whereas excess humidity can contribute to mold growth, causing material degradation. This phenomenon, when implemented in digital twin functionality, enables RH measurement, permitting, through algorithmic processing, automatic regulation of Heating, Ventilation, and Air Conditioning (HVAC) operation and, through forecast models, optimizing air-conditioned ventilation [46]. This leads, therefore, to thermal and hygrometric comfort, optimized through energy conservation, directly linking HUM to both social well-being and environmental factors, concerning optimized energy savings. Particulate Matter (PM10 and PM2.5) is an important environmental parameter. The proposed KPI aims to assess the level of air concentration of particles that can significantly provoke health problems, particularly in densely populated and industrially developed regions. Continuous exposure to particles can cause problems relating to heart and pulmonary diseases. The measurement process, set up for buildings, aims to assess effectiveness and identify pollution sources through functional analysis of ventilation systems. The integration of PM values in the proposed system contributes to the support for the ESG “Social” perspective by ensuring health for the inhabitants, along with achieving healthier approaches for efficient air circulation systems, thereby contributing to improvements in the “Environmental” perspective by ensuring cleaner, more efficient air circulation methods [47,48]. Volatile Organic Compound (VOC) concentrations enable the measurement of air pollution from harmful gases such as benzene, formaldehyde, and toluene, which are derived from construction materials, cleaning agents, and interior decor. Volatile organic compounds can significantly affect indoor air quality, comfort, and health. However, it is recommended that VOC concentrations not exceed 300 ppb to maintain global health standards. The integration of VOC concentration measurement in the digital twin system will enable real-time responses, enabling facility managers to trace the cause, adjust ventilation rates, or use low-emitting materials [45,49]. This reasonable preventive strategy will enhance indoor environmental quality and enable ESG factors to achieve “Social Sustainability,” resist factors that threaten health, and lead to occupant contentment. The rate of “Air Changes per Hour (ACH) Quantitative Indicator,” expressed by “ACC,” measures the rate at which total air replacement can occur inside an indoor space. An average rate range of 3 to 5 ACC will ensure adequate ventilation for residential and office buildings. The continuous measurement, adjustment, and calculation procedure for ACC using digital twin technology will enable facility managers to dynamically adjust ventilation rates, ensuring safe, healthy air and energy conservation by optimizing ventilation rates [43]. The ACC Key Performance Indicator has both social and environmentally friendly impacts for ESG achievement. Regarding ACC, it offers “Social Benefits,” ensuring healthy ventilation for human well-being, and “Environmental Benefits,” conserving energy by systematically adjusting ventilation rates to improve energy performance [43]. The “Thermal insulation rate (R-value) Quantitative Indicator,” also expressed as “R-value,” essentially estimates the “Thermal Resistance Capacity (TRC)” of construction materials to heat, thereby indicating how little heat will conduct through them, thereby ensuring greater energy conservation, as discussed previously. Increased insulation reduces heating and cooling loads, aligning with the ESG environmental aspect by reducing emissions from energy use and the social aspect by ensuring a comfortable temperature level without increasing costs [42]. The Sound Insulation Index (SND) rates sound insulation properties for construction structures, such as walls, windows, and floors. Noise pollution is gradually recognized for its impacts on both mental and physical health. The measurement of sound insulation level inside buildings helps stakeholders rate sound comfort, particularly in highly populous urban areas. This KPI actually improves the social sustainability aspect by fostering well-calibrated environments for concentration, rest, and quality of life [46]. Energy use actual KPIs, namely Energy Efficiency Ratio (EER) and the remaining three actual indicators, namely Coefficient of Performance (COP) and System Efficiency (SEF), that rate, along with EER, how well energy services translate from energy use, contribute singularly to how well energy inputs translate from energy services. The EER, COP, and SEF actual indicators are particularly important for rating energy services’ contribution to both chiller/heater performance ratios for cooling and heating, respectively. Values for higher ratios indicate greater use for every amount of power used, thereby improving digital twin capabilities for optimizing inefficiencies, predicting system degradation, and scheduling preventive maintenance [49] that support ‘Environmental’ and ‘Economic’ ESG spheres, along with, again, affordability, thereby strengthening ‘Social’ ESG factors. The actual Energy Use Intensity (EUI) and actual Lightning Power Density (LPD) actual indicators can, particularly, rate lighting energy use, and its intensity, respectively, that provide deeper insight into energy use per capita, by rating lighting energy use adjusted for expected user population, along with lighting energy consumption intensity adjusted for ex-pected unit floor space, respectively, that provide deeper, similar insight, by measur-ing shared relationship factors related to spatial, user, and energy use. The actual use of digital twins with similar data can enable various analyses, including simulations for different user occupancy scenarios, lighting system schedule optimizations, and adoption of intelligent lighting systems that dynamically adjust to different user behaviors [45]. Such enhancements lead to lower energy losses and operational costs, thereby aligning well with the ESG framework from both environmental and social perspectives, given their well-being benefits and resource distribution. Overall, integrating such KPIs into a digital twin and metaverse system constitutes a comprehensive framework for measurement, simulation, and improvement efforts to support greater sustainability and energy goals across various infrastructures in both urban and industrial settings. Each KPI has applicability to advancing or improving environmental, energy, and human comfort factors. Continuous surveillance using the set parameters allows a shift from a reactive governance model to a predictive one, in which any intervention depends on real-time factors rather than fixed paradigms that lack dynamic scope, thereby adhering to the ESG model’s focus on innovation directly linked to sustainable and inclusive elements (Table 3).

4.3. Governance Key Performance Indicators (KPIs) for ESG Evaluation in Digital Twin and Metaverse Applications

The selected Key Performance Indicators (KPIs) provide an integrated framework for evaluating ESG performance for Smart Infrastructure, specifically for the digital twin and metaverse applications related to the management of urban and industrial environments. Each Key Performance Indicator is a link that connects technology innovation and sustainability to enable real-time analysis and optimization of energy use, expenditure, and social impacts. The use of Key Performance Indicators, in aggregate, provides a holistic view of efficiency and equity, ensuring infrastructural advancement that encompasses technological innovation, sound ecology, and support for social justice. The relevance of the Key Performance Indicators is significant in the ESG framework, particularly because it directly covers both environmental and economic perspectives, and it has an indirect relationship with Governance, largely through interactions, accountabilities, and shared decision-making [58,59]. The Cost of Energy Saving (CES) is the single most important Key Performance Indicator under the ESG framework, since it estimates the financial costs of unit energy savings from efficiency. This Key Performance Indicator assists by evaluating the cost-effectiveness and investment-to-benefit ratio for environmental elements, leading to environmentally viable energy conversion [40]. The CES Key Performance Indicator has clear relevance to the ESG environmental domain, helping establish cost-optimal strategies for energy waste and emission savings, and also has implications for Governance, as it assists with financial accountabilities and forward-looking strategic planning for financial resource use. The Energy Return on Investment (EROI) is another highly important Key Performance Indicator, calculated as the ratio of energy output to energy invested for any given system. The Key Performance Indicator for energy has important implications for ESG’s environmental domain, as it indicates that when EROI increases, the energy output of the system is significantly higher than the energy consumed [60]. This shift leads to optimized energy resources and sustainable energy. This Key Performance Indicator has several ESG factors, as it supports the ESG environmental dimension by enabling transparent evaluation of energy system efficiency and helping strategic decision-making to maximize energy output from resources without harmful depletion [61]. The Energy Payback Time (EPBT) Key Performance Indicator complements the EROI Key Performance Indicator, as it describes the time required for a particular system to recover the energy invested in construction, setup, and maintenance operations. Functionally, from an ESG perspective, EPBT plays a crucial role in evaluating the life-cycle sustainability of energy systems [62]. In the digital twin environment, EPBT helps evaluate simulation scenarios and establish the sustainability level of different energy technologies, thereby strengthening the use of transparent data —an important consideration in ESG modeling for the governance process. The Cost of Peak Demand (CPD) measures the cost of peak electricity demand over a given time period. The use of CPD is critical for sustainability, both environmental and economic, since maximizing efforts to reduce peak loads will ease energy networks and prevent the need to generate additional energy from fossil fuels, which are characterized by higher emissions [63]. The Cumulative Cash Flow (CCF) criterion considers both financial and environmental factors, as it evaluates total cash flow for an energy project alongside investment costs. ESG analysis supports governance by using financial criteria to express financial transparency and assess future risk [64]. The positive interpretation of a project’s cash flow feature is critical, as it asserts that financial investment in a project, beyond financial benefits, helps achieve resource savings and sustainability. The Share of Project Cost Subsidized (SPC) measures the extent of grant use. This criterion assumes ESG duality, as it explains the financial attractiveness of sustainable project investment by focusing on social benefits arising from inclusivity for small players from developing communities in the use of sustainable technology [58]. Renewable Energy Use (REU) assumes critical importance as an essential ESG criterion that estimates the level of energy use from conservation to sustainable energy. Indicative interpretation assumes critical importance, particularly because it signifies a strong commitment to sustainability for a project, which is otherwise characterized by the continuous use of fossil fuels [65]. The use of digital twin technology is critical, as it assists in monitoring energy use across different scenarios, thereby enabling interpretation for sustainable energy use. The Energy Use per Worker Hour (EPWH) is dual in its interpretation of energy use across different labor productivity scenarios [66]. Socially, it signifies environmentally responsible production that does not strain human resources by being energy-intensive. EPWH, on a digital twin platform, supports modeling for appropriate workforce and energy equity balance interpretation, as well as effective energy use in labor-intensive industries [42]. Taking it all in, it forms a sound analysis framework for a comprehensive digital twin model that expresses difficult objectives for sustainable production through specific, quantified, and tractable information. The gauges improve the proposed digital twin framework’s capabilities for both real-time activity monitoring and, through simulation, forecasting future ESG performance implications. The proposed digital twin platform’s balanced model for ensuring a comprehensive, integrated, and holistic approach to ESG responsibility, covering environmentally responsible operations (EROI, REU, EPBT) for low-cost energy use, economic soundness (CES, CCF, CPD, SPC) for sustainable economic growth, and social responsibility (EPWH) for fair social implications, has therefore become possible through the incorporation and integration of such factors for its successful implementation (Table 4).
Apart from the previously listed key performance indicators, the following are also calculated for measurement in relation to the context of the given system, making it easier for normalization:
  • Area (Area_m2—AREA): This signifies the total floor space investigated for the energy and environment indices related to the building or infrastructural facility. The total floor space is presented in square meters.
  • Energy Consumption (Energy_Consumption_kWh—ENCO): This refers to the total consumption during the period under review, expressed in kilowatt-hours. This is the fundamental unit that can also produce comparative energy performance indicators
  • Occupants (OCC): This variable measures the number of people using or occupying any given space. This parameter enables calculations related to energy use and per capita environmental factors, making analysis easier for the user.
These factors establish highly important normalizing variables, enabling true comparability of performance across different buildings, facilities, and circumstances, thereby enhancing the robustness of the entire KPI system.

5. Descriptive Statistical Analysis of the KPI Dataset for the Validation of a Digital Twin and Metaverse Prototype for Smart Buildings

The results of the descriptive statistical analysis of the dataset highlight the complexity and diversity reflected in the Key Performance Indicators (KPIs) used to evaluate environmental, energy, and operational performance related to the functioning of Smart buildings and infrastructures. This also aligns well with existing studies that emphasize the significance of Key Performance Indicator frameworks for optimized building management [73,74]. The average surface area (AREA) for the sites analyzed is around 9637 m2, with considerable variability (SD greater than 5200 m2), indicating that low-scale buildings coexist with larger buildings, including structures larger than 19,000 m2. The energy consumption (ENCO) has an average value of around 981,000 kWh, with considerable variation, indicating that the dataset includes both energy-intensive and optimized buildings [75,76]. The Carbon Footprint (CFPT) has an average value of 296 tCO2e, confirming considerable emissions, which are reasonable given the dimensions of the dataset. The Emission Intensity (EMIN) rate, at 0.081 tCO2/kWh, indicates optimized energy use, with lower environmental impacts, as reflected in energy consumption, and aligns with energy optimization strategies for the functioning of Smart Infrastructure [77]. The average values for the energy coverage factors, Load Cover Factor (LCF) and Supply Cover Factor (SCF), are 0.81 and 0.814, respectively, indicating that approximately 80% of the energy can be covered through optimized resources, either on-site production or utilization. The Load Matching Index (LMI) average value, amounting to 71.7%, depicts optimized synchronization for energy production and energy requirements, whereas the average value for On-site Energy Ratio (OER) amounting to 0.75, reflects considerable on-site energy production, thereby making it clear that autonomy also has a strong dimension [78,79]. The average values for the Grid Interaction Index (GII) and No Grid Interaction Probability (NGI) sum to 47% and 0.47, indicating that optimized interaction levels for energy autonomy and interaction are crucial, suggesting optimized energy interaction strategies. The system entrance and operation indices remain uncertain for facility operation performance. The Capacity Factor (CAF), having an average value of 0.54, signifies that the actual use of the installed capacity is around half, along with a slight excess, while One Percent Peak Power (OPP) has an average value of 584 kW, indicating that there are periods where significant peak loads are used. The flexibility and Demand Response factors (DRS, FLF, FLI, FEE) signify the midpoint level for flexibility. It is pertinent to note that since the average for the Demand Response (DRS) factor is 9%, it signifies that it has flexibility for load reduction or time shift, whereas since the Flexible Energy Efficiency (FEE) factor average is around 49%, it also signifies that there is scope for improvement in dynamic energy use [80]. Considering environmental and comfort factors, indoor conditions are stable and acceptable, meeting comfort requirements. The average humidity (HUM) is 49%, well inside the range for maximum comfort. The level for Particulate Matter (PM25) and (PM10) (11.2 µg/m3 and 24.6 µg/m3) is lower than the World Health Organization’s requirements, thereby confirming that indoor air quality is satisfactory [81]. Volatile Organic Compound (VOC) concentration, averaging 186 ppb, shows significant variability, which can be influenced by building materials, effectiveness, and ventilation rates. The average air change rate (ACH) is 4, confirming that recommended rates for buildings that are not industries are met [78]. The comfort levels for thermal and acoustic performance factors also indicate acceptable comfort, with average values of Thermal Insulation Rate (THR) at 2.93 m2K/W and Sound Insulation Index (SND) at 43 dB, indicating well-insulated and comfortable acoustic environments [78]. Regarding energy subsystem factors, EER, COP, and SEF indicate that energy subsystems perform well, with average values of 10.3, 2.86, and 87.5%, respectively. The average Energy Use Intensity for each person (EUI) is 16.9 kWh/year, and the average lighting power density (LPD) value is 0.008 kW/m2, ensuring that lighting energy use is satisfactory [82]. However, from an economic perspective, there is greater variability. The average for the Cost of Energy Saving (CES) factor is 11.45 €/kWh, and that for the Energy Return on Investment (EROI) factor is 14.79, indicating equilibrium, albeit with considerable variability. The average Energy Payback Time (EPBT) is 4.9 years, indicating acceptable energy recovery time [81]. The Cumulative Cash Flow (CCF) is negative, indicating no full cost recovery by the project, while the Share of Project Cost Subsidized (SPC) = 35%, indicating strong subsidization, largely financial in nature. The Renewable Energy Use (REU) = 64%, indicating strong integration of clean energy, while Energy Use per Worker Hour (EPWH) = 39 MJ, indicating that average energy productivity can still improve [79]. See Table 5.

6. Validation Framework and Data Reliability for ESG-Based Smart Building Model

The image illustrates the validation framework for an ESG (Environmental, Social, Governance) Smart Building model, outlining a methodological process divided into four main phases (Figure 3).
The process starts with data preparation and structuring, in which data on environmental, social, and governance indicators should be collected and processed by normalizing and organizing them into three analytic blocks. In addition, data screening for outlier observation should be executed at the same stage to ensure data quality for subsequent analysis. The next process involves correlation analysis and Principal Component Analysis. The PCA analysis needs to identify hidden components and prove structural homogeneity. The next step involves Ordinary Least Squares linear regression for each component of environmental, social, and governance. The area will serve as the output for the data. In addition, the framework should use VIF to test for homogeneity in the data. Furthermore, it should apply the calculations for both the determination coefficient and the degrees of freedom. The framework should use machine learning algorithms to improve predictive analysis. At the same time, comparisons of various algorithms, such as Boosting algorithm analysis, Decision Tree Analysis by KNN, Random Forest by Regularization, and Support Vector Analysis, should be used. The analysis should be carried out separately for each component. The algorithm has been designed to ensure that the processed data can be used for testing during the design of a management system that combines the metaverse and a digital twin. At the same time, data structural homogeneity should be ensured. Therefore, based on the data structural homogeneity analysis, it is meaningful and timely to create an advanced digital environment that is both interactive and immersive. Furthermore, it should be an opportunity to create environmental management in an intelligent digital environment.

7. Scientific Validation of ESG Data Through Correlation Analysis for Smart Building Prototyping

The correlation matrix, as a validation technique for the database used in the analysis of ESG components, holds a strong position from a scientific perspective. Correlation analysis is the most robust statistical approach for assessing the internal consistency of the data. The advantage of correlation analysis lies in the ability of researchers to determine whether the set of investigated factors shows positive or negative correlations. In the analysis of ESG factors, it is confirmed that each factor has a specific property within the non-overlapping value of sustainability. From a scientific perspective, it confirms that the data structure holds strong internal consistency. In the context of smart building implementation, it plays an important role by validating the quality of data that flows into the digital management system. The analysis of correlations among various factors of energy consumption and environmental emissions confirms that the data set follows an independent distribution of sustainability. The moderate levels of correlation confirm that it holds multidimensional properties. In terms of scientific research and the scientific standards of environmental analysis and management science, it complies with high standards. It provides a robust foundation for further analysis, such as PCA and regression. These two analyses provide further evidence supporting research on environmental sustainability. Furthermore, it provides strong evidence that the data has been integrated into the digital twin metaverse. In respect of the research analysis targeting the assessment of smart building implementation on environmental factors. The research analysis holds three types of correlation analysis. The correlation analysis focuses on each ESG aspect. The three factors in the analysis include the Environmental factor (E), the Social factor (S), and the Good Governance factor. The analysis of these factors provides an important perspective, as it confirms that the data structure holds comprehensive internal properties.

7.1. Correlation Analysis and Validation of Environmental (E) Factors in the ESG Framework

The environmental factor in the ESG framework refers to operational characteristics related to energy, emissions, and environmental issues. The correlation matrix for the environmental factors (AREA, CFPT, ENCO, EMIN, LCF, SCF, LMI, OER, GII, NGI, OPP, DRS, FLF, FLI, FEE) helps the researcher perform initial checks for internal dataset coherence and multicollinearity among factors. The correlations appear to range from weak to medium, thereby ensuring that similar factors are not measured again [83,84]. This helps improve the construct validity of the environmental elements, as it clearly supports a wide range of factors and prevents overlap [85]. The AREA, which relates to the asset’s actual size, shows insignificant correlations with other factors. The slight negative correlations observed between energy use (ENCO) and Carbon Footprint (CFPT) indicate that larger areas do not necessarily lead to greater energy use and emissions [86]. The positive, albeit trivial, relationship between Load Cover Factor (LCF) and building size indicates that larger buildings tend to handle load factors better, though this relationship is not significant. CFPT, having relation to Carbon Footprint, is negatively correlated to both energy use (ENCO) and Emission Intensity (EMIN). The negative relationship between CFPT and ENCO may seem paradoxical, but it could reflect differences in the use of cleaner energy across organizations [87]. The negative association between CFPT and EMIN implies that when total emissions are higher, Emission Intensity tends to fall, suggesting that either larger organizations use different energy resources to scale or that better technological efficiencies account for better results [88]. The trivial relationship emphasizes that emissions, although controlled by many, are not solely defined by energy use quantities, making it valid for CFPT and EMIN to remain distinct factors. The energy use factor (ENCO) also has insignificant correlations for other factors in the environmental domain, thereby requiring support for its applicability. The presence of a weak negative relationship between it and LCF and SCF (Load and Supply Cover Factors) implies that greater energy use does not necessarily correspond to better load coverage or supply adequacy, thereby ensuring autonomy in quantity and management efficiency [88]. This adds strength to the theoretical basis for modeling, in which operational intensity and efficiency remain separate dimensions within the environment. The correlations for LCF, SCF, LMI, and OER, factors that indicate energy balance and autonomy, demonstrate an internal logical structure. For example, LCF shows a positive relationship with EMIN and LMI, thereby confirming that systems with greater load coverage tend to demonstrate greater operational matching. The positive relation between LCF and EMIN could prima facie appear contradictory: greater intensity could indicate inefficiency, yet it could also indicate systems running at, or near, full capacity, where greater loads tend to temporarily enhance intensity. The slight positive relationship between LCF and OER (On-site Energy Ratio) supports internal logic, in which greater load coverage enables greater on-site production —a sensible practice for system design that sustains the environment [40]. The GII and NGI, which indicate interaction on the power grid, tend to show slight negative or weak correlations with almost all other factors. This also appears sensible: systems that depend more on the power grid for functioning (greater NGI, lower GII) tend not to relate directly to greater efficiency (FEE) or flexibility (FLI) [87,88]. The slight correlations tend to confirm that interaction with the power grid remains an autonomous domain for the environment, suggesting that the dataset can properly account for almost every aspect of the environment, from production to system administration [84,86]. The factors for flexibility (FLF, FLI, FEE) tend to show slight correlations with each other, thereby confirming that flexibility and efficiency remain largely autonomous factors in analysis. The slight positive correlations between FLF and AREA, and between FEE and LCF, suggest that larger systems display greater flexibility, though only slightly. This slight autonomy in interdependence tends to confirm that, for the environment, different dimensions (structure, operation, and efficiency) relate only partially [84,86]. The correlations for the environment tend to confirm the dataset’s validity. The low to medium correlations confirm that the environmental factors are exploring different, albeit complementary, dimensions around the notion of ‘sustainability,’ without any considerable redundancy. This also adds strength to the basis for further analysis, such as PCA, that will also, in turn, support the interpretation of the factorial structure underlying the environmental dimension, achieving a meaningful combination of indicators [85,88]. See Table 6.
The relationship heat map is a graphical representation of the inherent relationships among the environmental indicators in the dataset. The intensity distribution in the heat map shows mainly light-colored regions and a few strong red and blue regions, suggesting that most correlations are low to moderately positive. This graphical interpretation also supports the initial statistical analysis, confirming that the majority of the environmental factors presented are mutually independent and cover different facets of energy consumption, emissions intensity, load management, and efficiency. The same correlations can also be found in ESG datasets, for which multidimensionality is crucial to guarantee the strength and ease of interpretation of modeling [89,90]. The absence of strongly correlated factors indicates that the dataset has an effective structure and lacks multicollinearity, ensuring it meets the requirements for accurate modeling and interpretation [84]. The regions that display moderately strongly correlated factors, found in different parts of the heat map, relate to well-known correlations for the expected dimensions. For example, a low, positive relationship between Emission Intensity (EMIN) and Load Cover Factor (LCF) could reflect operational conditions: when power systems operate at maximum load, emission intensity tends to increase. Other low, positive correlations for factors related to energy autonomy (on-site energy ratio, OER) and load matching (load matching indicators, LMI) demonstrate that there are coherent interactions in energy autonomy and system efficiency, thereby aligning with results from ESG analysis carried out using alternative methods [91]. The heat map analysis clearly shows that each set of factors has an inherent, logical structure without compromising its mutual independence. The heat map suggests that there are no strongly correlated factors that fully define the environmental dimension. This can also indicate that the dataset has inherent multidimensional characteristics, covering different facets related to energy, emission intensity, load balance, and flexibility, which contribute to a comprehensive ESG analysis in a unique way. An integrated view has also been applied in ESG analysis to evaluate smart city infrastructure [40]. This shows that the variables are distinct yet conceptually related, providing a strong basis for analysis such as PCA and regression models in the ESG framework (Figure 4).

7.2. Correlation Analysis and Validation of Social (S) Factors in the ESG Framework

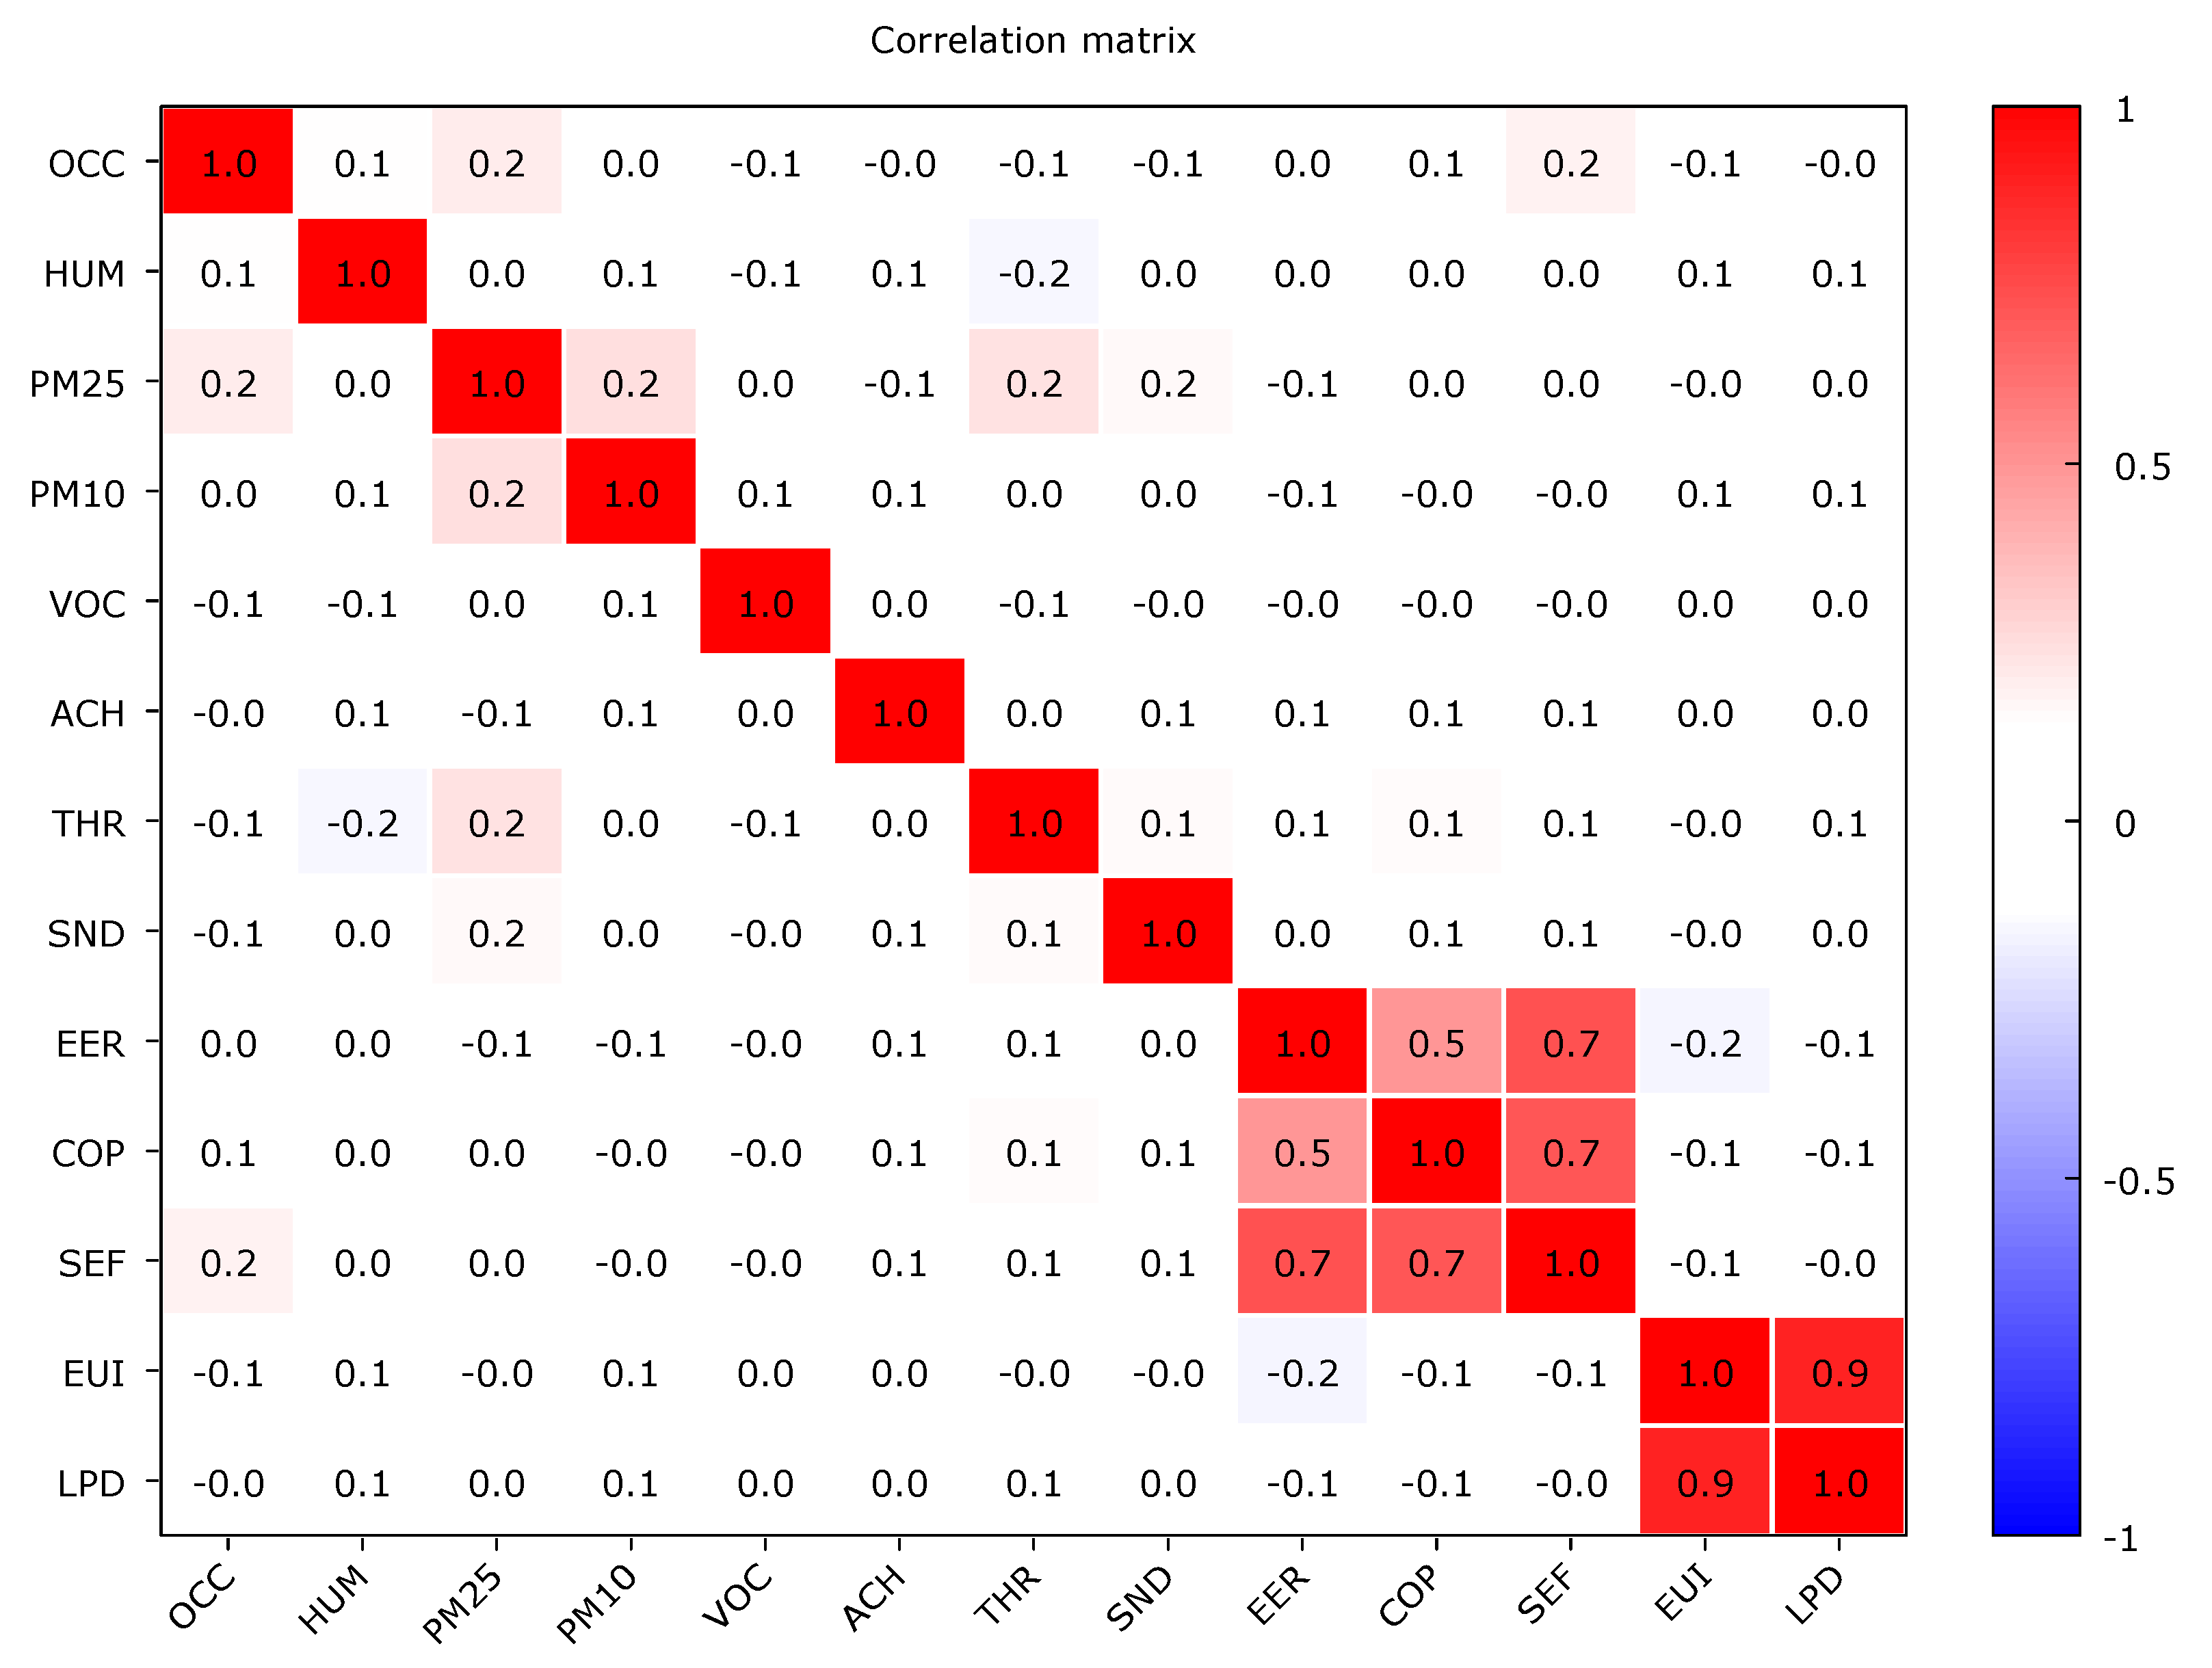
The social dimension of the ESG model emphasizes human and system characteristics at the building level, highlighting considerations such as user comfort, indoor air quality, thermal and sound performance, and efficiency. The given correlation matrix for the social dimension (OCC, HUM, PM25, PM10, VOC, ACH, THR, SND, EER, COP, SEF, EUI, and LPD) represents an important validation process for the dataset used for creating a management model that applies digital twin technology [43]. The correlations between variables are largely weak to moderate, signifying that each variable identifies a unique aspect without overlapping. The correlations for the number of occupants (OCC) range from small positive correlations for RH (HUM, 0.13) and fine particle concentration (PM2.5, 0.20), since higher human presence could lead to slight increases in concentration for both factors [46]. However, the correlations remain weak, strengthening the hypothesis that better-designed environmental conditions and ventilation systems can exclude environmental factors from having a major impact on indoor air quality [92]. The near-zero correlations between OCC and variables such as the concentration of Volatile Organic Compounds (VOC, −0.07) and thermal resistance (THR, −0.08) indicate little to no relationship between human presence and these factors, again proving that the balance of the dataset has been appropriately defined. The air quality variables (PM2.5, PM10, and VOC) tend to exhibit mild correlations, particularly between PM2.5 and PM10 (0.24), since both factors are closely related through their co-occurrence at the same locations [43]. The low correlations between VOCs and humidity indicate that air quality factors are largely independent of indoor environmental factors, supporting the continued separation of their measurement as separate elements for analysis under the social dimension [93]. Such correlations for air change rates (ACH) tend to reflect positive, albeit weak, correlations with temperature and sound insulation, again showing that ventilation rate performance is largely uninfluenced by envelope characteristics, which are important for digital twin simulations of indoor user comfort [94]. The thermal and acoustic factors (THR, SND) show medium-strength positive correlations with COP, SEF, and EER, suggesting that buildings with lower thermal and sound transmission tend to exhibit better energy system efficiency. This pattern is also expected, reinforcing the dataset’s internal validity by associating comfort factors with actual system performance [23]. Conversely, EER, COP, and SEF display strong positive correlations (ranging from 0.49 to 0.72) because energy efficiency factors are expected to show considerable convergence in value. However, for a digital twin model, such strong correlations are highly acceptable, as they can assess various system factors that are closely related yet supplementary to one another [95]. Interestingly, energy use intensity (EUI) and lighting power density (LPD) show a strong positive correlation (r = 0.88), as lighting factors strongly influence energy use per capita. This pattern explicitly verifies that the dataset accurately captures internal load patterns, both for assessing social comfort and productivity in digital twin settings, thereby becoming crucial for exploring social system factors through ESG models [95]. However, the low values for EUI, LPD, and social factors explicitly confirm that energy use patterns remain a separate system factor, not driven by social factors. The social component’s correlation matrix clearly shows that low-to-medium correlations indicate logical convergences among comfort, air quality, and energy factors, thereby explicitly confirming that the dataset captures supplementary system factors that are logically related to each other. This pattern clearly shows that the dataset’s social component, which focuses on ESG modeling, is robustly constructed, thereby ensuring its reliability for efficient analysis, simulations, and decision-making support through digital twin frameworks for managing energy-efficient buildings and enhancing social factors by maximizing energy performance in social buildings. See Table 7.
The heat map for the Correlation Matrix of the Social (S) dimension of ESG helps establish the intuitive structure of the mutual relationships among the variables that define indoor comfort, air quality, and energy efficiency in buildings. The structure is dominated by light colors, indicating that there is little to medium strength across the majority of variables; hence, the dataset provides a comprehensive range of social factors related to sustainability without duplication. The presence of mixed correlations in the heat map enhances its validity for use in digital twin-based building management systems to optimize building performance and human well-being. The red line running along the diagonal indicates the perfect relationship each has with itself, distinct from the existing correlations denoted by the colors along the diagonal. The red colors in the lower right corner indicate that the relationship (high correlation) between the energy-related variables EER, COP, and SEF (ranging from 0.7 to 0.8) is strong. However, it is expected that there was a relationship, given that it measures efficiency and performance. The same applies to the red square that connects EUI and LPD (0.9) correlations. The red square indicates that lighting load plays an important role in energy use per capita, thereby underscoring its role in defining energy efficiency. The top-left corner, related to the indicators for occupants’ and air quality (OCC, HUM, PM2.5, PM10, and VOC), shows pale colors with scattered red and blue. This indicates that the relationship (low correlations) is weak, confirming that building air quality and comfort are not reliant on factors related to occupants —an important characteristic for datasets that help model building conditions using digital twin methods. This helps indicate that humidity and pollutant concentrations can change through simulations that model different process scenarios, thereby avoiding building conditions that could arise from occupants’ varying factors related to building functionality and adaptations. The heat map indicates that it is valid for modeling the ESG social dimension in systems that apply analytics for building optimization and related human well-being (Figure 5).

7.3. Correlation Analysis and Validation of Governance (G) Factors in the ESG Framework

The correlation matrix for the Governance (G) component of the ESG model provides valuable insight into the interrelationships among indicators that represent economic and operational aspects of smart building management. These include cost-effectiveness (CES), energy return on investment (EROI), energy payback time (EPBT), capital cost factors (CPD and CCF), system performance (SPC), renewable energy utilization (REU), and energy productivity per worker hour (EPWH). The aim of analyzing these correlations is to validate the dataset used for the prototyping of a digital twin-based management model for smart buildings [23,96], ensuring that the indicators are statistically consistent, complementary, and capable of accurately reflecting the governance dynamics of sustainable infrastructure systems [97]. The overall pattern of correlations in this matrix shows that relationships between governance variables are generally weak to moderate—a desirable feature for multidimensional datasets [19]. The limited but coherent correlations between cost, performance, and efficiency metrics confirm that the Governance dimension of the ESG dataset is statistically reliable. It effectively captures the complexity of managing financial and operational sustainability [19], ensuring that the digital twin model can use these parameters to support optimization, predictive analysis, and performance benchmarking within a robust and transparent governance structure [98,99] (as shown in Table 8).
The corresponding heat map for the Governance (G) component clearly shows the structure of correlations associated with important governance factors, offering a quick look at the relationship profiles of financial, operational, and efficiency factors in the dataset. The color scale from deep red to blue also clearly emphasizes the type and intensity of correlations, differentiating red for positive correlations and blue for negative ones. This helps perform intuitive analysis aimed at assessing the level of internal association consistency in the dataset, which is important for approving the digital twin model for managing Smart buildings [100,101]. The first observed feature from the heat map is the strong negative association existing between the Cost of Energy Savings (CES) and the Capital Cost Factor (CCF), as indicated by the deep blue square (around −0.4). This association clearly shows that when capital costs are higher, energy savings are less beneficial and less important for governance-related financial decisions in Smart buildings [102]. This clearly shows that the numerical analysis is supported by the heat map, making it easier to observe clear, interpretable correlations among financial factors and enhancing the dataset’s credibility by appropriately referencing these correlations for cost and investment factors. An important group could also be observed for the efficiency and performance factors (CCF, SPC, and REU), characterized by weak to moderately red-toned correlations. This clearly shows that when better performance and usage of REU are positively associated with higher capital costs, it’s expected that investment level intensity will be higher, with a positive outcome for energy governance [20,103]. The same could also be analyzed by examining the REU and EPWH groups, as shown in a red-toned heat map, clearly indicating that REU has a positive relationship with EPWH and fully confirming the operational scenario for the efficiency model for Smart buildings [96]. The dominance of the light-toned palette for almost every corner in heat maps indicates that almost every variable has low levels of correlation, ensuring that the dataset is fully balanced and lacks multicollinearity, both of which outweigh benefits for digital twin applications, ensuring that it’s fully accurate for cause-and-effect simulations [104,105]. The heat map, therefore, validates the dataset’s effectiveness by illustrating that governance indicators are differentiated yet linked in a logical way, ensuring it’s apt for use in an integrated system for the governance of sustainable buildings [40,106]. Thus, it can unequivocally be concluded that the significance of governance heat maps is mandatory for analysis and, more appropriately, for decision-making regarding ESG integration in digital twin technology for infrastructural governance in a smart city [98] (as shown in Figure 6).

8. Regression-Based Validation of the ESG Dataset for Digital Twin Smart Building Modeling

To demonstrate the efficacy and applicability of the ESG model, the analysis equations will provide a crucial starting point for evaluating the dataset’s statistical validity and reliability. These equations will examine the levels of cohesion, interdependence, and applicability of the environmental, social, and governance dimensions within the broader context of sustainable building resource management. The analysis aims to demonstrate that the ESG dataset has the potential to significantly contribute to the conceptualization and ideation of an integrated building resource management model that leverages digital twin technology and the metaverse to model, monitor, and regulate the performance efficiency of intelligent buildings in real time [66]. The equations will use Ordinary Least Squares (OLS), with the dependent variable (AREA) indicating the scale, size, and functionality of buildings, and the independent variables indicating Key Performance Indicators for each ESG dimension. The equations will enable the researcher to assess the reliability and functionality of the dataset, thereby creating the opportunity to examine the applicability of fundamental ESG dimensions that can effectively contribute to sustainable building resource scale, functionality, and efficiency [107]. The structure and form of the equations will apply the three dimensions that govern ESG, creating a sound methodology for assessing environmental, social, and governance factors within a broader context of sustainable building resource scale, functionality, and efficiency [88]. The Environmental equation will appropriately indicate energy consumption, intensity, and efficiency factors that can contribute to building scale, the Social equation will indicate factors related to comfort, air, and user well-being, and the Governance equation will relate financial intensity and efficiency factors to building scale, functionality, and performance [88]. The equations will provide the crucial foundation for the validation and calibration of the given dataset, ensuring that its integration into digital twin and metaverse technology provides the fundamental soundness for reliable, accurate, and environmentally validated model building [108]. See Table 9.
The results for the Environmental model (E) indicate an R2 of 0.226 and an adjusted R2 of 0.005, suggesting that while the included variables explain approximately 22.6% of the variance in AREA, much of this explanatory power is not statistically robust once adjusted for the number of predictors. However, the F-statistic (1.02) and its corresponding probability value (0.451) confirm that the model structure remains consistent and free from specification errors. The significant variables, namely the Capacity Factor (CAF, p = 0.006) with a negative sign, and the Renewable Energy Utilization (REU, p = 0.065) with a positive sign, indicate logical relationships. Larger building areas tend to be associated with lower utilization efficiency (CAF) but higher renewable energy use (REU), a pattern coherent with real-world behavior in large smart infrastructures [109]. The low mean VIF (1.93) confirms the absence of multicollinearity, reinforcing dataset reliability for modeling energy-environmental dynamics. The Social (S) dimension regression exhibits an R2 of 0.085 and an adjusted R2 of 0.004, showing that social and comfort-related KPIs explain only a small fraction of the variation in building area. This result aligns with expectations, as social variables—such as air quality (PM2.5, PM10), humidity, and acoustic comfort—tend to capture internal environmental quality rather than scale-dependent properties. The significance of PM2.5 (p = 0.084) suggests that particulate concentration may have a weak relationship with building size, potentially due to differences in ventilation and occupancy density [100]. The low mean VIF (1.08) again validates the statistical independence of these indicators, confirming that the Social dataset is structurally well defined, even if its predictive strength remains marginal. The Governance (G) regression yields the most consistent results in terms of model validity, with an R2 of 0.124 and a higher adjusted R2 of 0.067. The F-statistic of 2.19 and a p-value of 0.051 indicate near-statistical significance at the 5% level, implying that the governance and economic indicators together provide a weak but coherent explanation of AREA variability. The negative signs of the significant variables—Capital Development Cost (CPD, p = 0.027) and Capital Cost Factor (CCF, p = 0.054)—reveal that greater efficiency and lower costs per unit area are associated with better governance performance. This outcome is particularly relevant for validating the economic component of the digital twin, as it suggests that financial optimization and governance transparency correlate with spatial and operational efficiency [40,106]. The low mean VIF (1.15) confirms internal model consistency and the absence of collinearity distortions. Overall, the three regressions validate the ESG dataset by confirming that each component captures a distinct dimension of building performance. While none of the models exhibits high explanatory power individually, their combined interpretation demonstrates structural coherence and logical sign directions. The Environmental model highlights operational and renewable energy dynamics, the Social model reflects comfort and health independence, and the Governance model reveals economic efficiency trends. Together, they provide a statistically sound and multidimensional foundation for implementing a digital twin system capable of assessing, simulating, and optimizing smart building governance and performance in line with ESG principles [66]. See Table 10.
The validation of the ESG dataset through the three regression models—each representing the Environmental, Social, and Governance dimensions—demonstrates the internal coherence and distinct contribution of each component to the explanation of building scale and performance, represented by the variable AREA. The results reveal a layered structure of relationships within the dataset that supports its robustness and analytical validity for modeling within a digital twin framework [62]. From a global perspective, the Governance (G) regression emerges as the most statistically relevant, with a Prob > F value around 0.05, suggesting marginal significance and indicating that this component captures some consistent structural patterns between governance and economic indicators and the dependent variable AREA. This finding implies that financial and efficiency-related parameters—such as cost per energy unit, return on investment, and payback time—are moderately predictive of the built area, reflecting how governance decisions and economic structures may scale with building size [107]. In contrast, the Environmental (E) and Social (S) models exhibit low explanatory power, with adjusted R2 values close to zero. This outcome is not unexpected, as environmental and social metrics often capture operational performance and contextual conditions rather than structural attributes like area. The Environmental model, although statistically weaker, presents logical directional relations, such as negative associations with carbon footprint (CFPT) and positive associations with renewable energy use (REU), which are consistent with theoretical expectations of sustainable design [109]. Similarly, the Social model demonstrates independence among variables, showing that indoor air quality, thermal and acoustic comfort, and occupancy metrics vary orthogonally without multicollinearity, as confirmed by low mean VIF values (below 2). The analysis of multicollinearity further reinforces the validity of the dataset. All three models have mean variance inflation factors below 5, confirming that no block of variables presents internal redundancy. This indicates that the dataset is structurally well-defined and that each KPI contributes unique information within its respective ESG dimension [110]. From a methodological standpoint, this supports the use of the dataset for higher-level analytical modelling, including multivariate or machine learning regressions, since predictor independence is a prerequisite for robust feature interpretation. The Governance block stands out for its structural coherence. Variables such as CPD (cost per design), CCF (capital cost factor), and SPC (sustainability performance cost) show statistically relevant coefficients, some with negative signs. This pattern indicates that higher building efficiency or optimized financial planning is associated with lower costs per unit area—an interpretation aligned with principles of sustainable financial governance and stakeholder-oriented management [111]. The presence of negative coefficients further reinforces the logic of efficiency-driven management models, where resource optimization translates into economic and environmental benefits. Overall, the regression-based validation confirms that the ESG dataset is both statistically sound and conceptually coherent. Each dimension provides non-redundant information, supporting the multidimensional structure of ESG analysis. While the E and S models describe operational and contextual variability, the G model anchors the dataset’s structural significance, establishing a measurable link between governance efficiency and building scale. The low multicollinearity, consistent variable behavior, and partial significance of the Governance model collectively validate the dataset for use in a digital twin context, where real-time data integration and predictive modeling depend on stable and interpretable variable relationships. This foundational validation demonstrates that the dataset can be reliably used for developing intelligent management systems capable of assessing performance and sustainability through interconnected ESG indicators [64,107]. See Table 11.

9. Principal Component Analysis (PCA) for Technical Validation of the ESG Dataset in Smart Building Governance

The analysis presented in this section aims to apply the Principal Component Analysis (PCA) technique to provide a technical and scientific validation of the ESG (Environmental, Social, and Governance) dataset developed for testing the smart building governance prototype. PCA is a widely recognized multivariate statistical method used to reduce the dimensionality of complex datasets while preserving their essential information structure. Its application in this context serves a dual purpose: to verify the internal coherence and multidimensionality of the ESG dataset and to ensure that the selected indicators accurately represent the underlying sustainability dimensions without redundancy. The purpose of this analysis is to confirm that the dataset is robust, logically structured, and suitable for integration into advanced digital environments such as digital twin and metaverse platforms. By identifying the principal components that explain the highest variance among the ESG indicators, PCA enables the researcher to isolate the most influential factors affecting smart building performance and governance. This validation step is essential to ensure that the prototype operates on a reliable and scientifically grounded dataset, capable of supporting dynamic simulations, predictive modeling, and real-time decision-making. Through PCA, the dataset’s structural soundness is assessed, verifying the independence and complementarity of the variables associated with environmental efficiency, social comfort, and governance effectiveness. The resulting components will form the analytical backbone for building an integrated system that governs and optimizes smart buildings in immersive digital environments. Ultimately, this approach ensures that the proposed governance prototype—based on digital twin and metaverse technologies—is supported by a technically validated and scientifically reliable data framework, reinforcing its potential for sustainable, data-driven management of intelligent infrastructures.

9.1. Principal Component Analysis (PCA) Results for the Environmental (E) Dimension of the ESG Model

The results of the Principal Component Analysis (PCA) applied to the environmental component of the ESG model provide a significant validation of the underlying dataset, confirming both its internal coherence and its multidimensional structure [112]. The PCA technique, which decomposes the dataset into orthogonal principal components, is particularly effective for evaluating the relationships among environmental indicators and identifying latent structures that capture the underlying variance of the data [113]. In this case, the eigenvalues associated with the first few components demonstrate that approximately 40% of the total variance is explained by the first four principal components, indicating that the environmental indicators share meaningful correlations without redundancy. This supports the use of PCA as a robust approach to assess data consistency and dimensionality reduction within the ESG framework. From the component loadings, the first principal component (PC1) captures the largest share of variance and is primarily driven by positive contributions from EMIN (Emission Intensity), LCF (Load Cover Factor), and ENCO (Energy Consumption), while variables such as CFPT (Carbon Footprint) and SCF (Supply Cover Factor) contribute negatively. This component appears to represent a balance between efficiency and energy consumption, reflecting how emissions and energy coverage jointly influence environmental performance. The second component (PC2) has strong positive loadings for OER (On-site Energy Ratio) and GII (Grid Interaction Index), while FLF (Flexibility Factor) shows a strong negative contribution. This suggests that PC2 differentiates systems with higher local energy autonomy from those that rely more on flexibility and grid interaction, aligning with the notion of distributed energy management [66]. The third and fourth components (PC3 and PC4) further refine the structure of the data, capturing subtler aspects of energy-environmental interactions. For instance, PC3 shows high positive loadings for ENCO and OPP (One Percent Peak Power), while LCF and LMI (Load Matching Index) load negatively, suggesting a contrast between energy demand peaks and load coverage capacity. PC4, on the other hand, captures variability associated with EMIN and CAF (Capacity Factor), pointing toward the efficiency of energy conversion processes within the system [114,115]. A noteworthy observation is that none of the variables display extreme loadings across multiple components, which indicates that the dataset lacks strong multicollinearity and maintains a balanced contribution of each indicator to the overall structure. This aligns with the earlier regression analyses that confirmed low mean variance inflation factors (VIF), thereby reinforcing the dataset’s internal consistency [93]. The presence of moderate but distributed loadings also implies that each variable contributes uniquely to the multidimensional understanding of environmental performance, making the dataset appropriate for subsequent modeling steps. The negative correlations observed in some components, such as between CFPT and EMIN, or SCF and CAF, emphasize the complexity of the environmental dimension. These negative signs do not indicate inconsistencies but rather complementary dynamics: higher carbon footprints tend to associate with lower emission intensity efficiency, while energy coverage and capacity factors reveal trade-offs between resource use and operational performance. This reinforces the interpretative depth of PCA as a diagnostic validation tool rather than a purely descriptive method [116]. Overall, the PCA results validate the environmental dataset as a coherent and structurally reliable foundation for the ESG model. The distribution of eigenvalues and loadings supports the presence of independent, interpretable dimensions within the environmental domain. This validation step is crucial, especially considering the dataset’s intended application in the development of a management prototype integrating Digital Twin and Metaverse technologies [66]. In this context, PCA ensures that the environmental indicators capture distinct yet complementary aspects of building energy efficiency, emission control, and operational sustainability. Consequently, the PCA model not only confirms the statistical robustness of the environmental data but also establishes a reliable basis for embedding it within a digital simulation environment for smart building management (Figure 7).

9.2. Principal Component Analysis (PCA) Results for the Social (S) Dimension of the ESG Model

The principal component analysis of the Social (S) dimension in the ESG framework provides a deep understanding of how human-related and comfort variables interact within smart building environments. Incorporating the identified variables—such as Occupants (OCC), Relative Humidity (HUM), Particulate Matter (PM2.5 and PM10), Volatile Organic Compounds (VOC), Air Changes per Hour (ACH), Thermal Insulation (THR), Sound Insulation (SND), Energy Efficiency Ratio (EER), Coefficient of Performance (COP), System Efficiency (SEF), Energy Use Intensity (EUI), and Lighting Power Density (LPD)—the PCA demonstrates the multidimensional structure of the social component, highlighting interdependencies between human comfort, air quality, and building performance metrics [117]. The first principal component (PC1) shows strong negative loadings for EER, COP, and SEF, indicating that this dimension captures the efficiency and operational quality aspects of social comfort. These parameters represent the building’s ability to maintain indoor well-being through technological optimization. Negative values suggest an inverse relationship between system efficiency and variability in occupant conditions, implying that as systems become more efficient, fluctuations in perceived comfort decrease. This aligns with the principles of smart building management, where automation and digital control stabilize the indoor environment [100] PC2 exhibits positive contributions from EUI and LPD, suggesting that energy consumption per person and lighting density are key indicators of human activity levels within buildings. This axis can be interpreted as a behavioral-energy dimension, linking occupant presence and usage patterns to energy demand. It supports the concept that social variables are not isolated but are reflections of dynamic interactions between people and infrastructure [118]. The third component (PC3) emphasizes indoor air quality factors, with high negative loadings for PM2.5, PM10, and THR. This reveals an important trade-off between particulate pollution and thermal comfort. In smart building contexts, this component provides insight into how environmental control systems influence both health-related and comfort-related metrics. Lower particulate concentrations may require higher ventilation rates (ACH), which in turn affect energy consumption and humidity balance [119,120]. PC4 is primarily characterized by strong positive loadings for Occupants (OCC) and Humidity (HUM), alongside moderate contributions from ACH and PM10. This suggests that the fourth component captures spatial and microclimatic comfort interactions, where occupant density and air renewal are central to maintaining an acceptable indoor environment. In digital twin applications, such relationships are essential for predicting comfort variations based on occupancy data and HVAC system behavior. Higher components, such as PC5 through PC7, refine specific comfort and acoustic dimensions. Negative loadings of SND and THR indicate the balance between thermal insulation, noise control, and user satisfaction. These components are crucial for understanding the subtle effects of building envelope performance on perceived comfort, an area that is increasingly relevant for ESG-oriented smart building metrics [121,122]. Finally, components like PC8 to PC13 capture residual variance associated with specific operational parameters, confirming that while social indicators are diverse, they remain statistically coherent and non-redundant. The consistent spread of variance across components underscores the structural validity of the dataset, confirming that each variable contributes uniquely to the representation of social sustainability within buildings. Overall, the PCA confirms that the social dataset is robust and internally coherent, providing strong empirical support for its use in validating the proposed metric model. The clear clustering of efficiency-related, environmental, and comfort indicators reflects a realistic representation of how occupants experience smart buildings. When integrated into a digital twin and metaverse-based management system, these results ensure that the model can simulate user-environment interactions, predict comfort dynamics, and optimize building operations in line with ESG principles [117,118] (as shown in Figure 8).

9.3. Principal Component Analysis (PCA) Results for the Governance (G) Dimension of the ESG Model

The Principal Component Analysis (PCA) of the Governance (G) component in the ESG model provides critical evidence for the statistical validity and structural coherence of the dataset intended for digital twin and metaverse-based smart building management. This component includes variables related to economic efficiency and governance performance—specifically, cost efficiency (CES), energy return on investment (EROI), energy payback time (EPBT), construction and operational costs (CPD, CCF), system performance and control (SPC), renewable energy utilization (REU), and energy productivity per worker (EPWH). Together, these indicators describe the economic and managerial dimension of sustainable smart buildings, where financial optimization, performance monitoring, and long-term resource efficiency are intertwined [40]. The first principal component (PC1) explains a substantial portion of the variance, with strong negative loading for CES (−0.537) and positive loading for CCF (0.531) and SPC (0.506) [121]. This pattern highlights a fundamental trade-off between cost reduction per unit of energy saved and capital or operational investment, which is typical in building governance models [122]. In a digital twin context, this suggests that reducing the marginal cost of energy efficiency (CES) is associated with higher upfront or management costs (CCF, SPC), reflecting realistic investment-efficiency dynamics [123]. PC1 can therefore be interpreted as a “financial governance axis,” emphasizing the relationship between cost control, structural investment, and system efficiency. The second component (PC2) shows significant negative correlations for EPBT (−0.472), REU (−0.516), and EPWH (−0.467), suggesting that this component represents the temporal and productivity-related aspect of governance. Shorter energy payback times and greater renewable energy utilization contribute to higher system efficiency but require optimization of workforce productivity and process management [122,123]. This factor can be understood as an “operational sustainability axis,” demonstrating the capacity of governance metrics to reflect the long-term return of energy and human capital investments. PC3 and PC4 reveal more specific structural relations within the dataset. The strong positive loading of EPBT (0.458) and CPD (0.619) in these components indicates that buildings with longer payback periods also tend to have higher cost structures. This pattern validates the consistency of the dataset, showing that financial and temporal metrics are not independent but logically correlated. In a digital twin simulation, these relationships can be used to model the trade-offs between project duration, capital investment, and lifecycle sustainability [124]. The significant contribution of EROI (−0.601 in PC4) further connects governance efficiency to the building’s ability to generate positive energy returns, highlighting the strategic value of integrating real-time energy flow analytics in metaverse-based management systems. The fifth and sixth components (PC5 and PC6) capture more subtle variations related to operational resilience and system integration. REU (0.325 in PC5, −0.584 in PC6) and EPWH (−0.751 in PC5) suggest that renewable energy performance and energy use efficiency per worker vary inversely, reflecting the complexity of aligning workforce productivity with renewable infrastructure adoption. This finding is particularly relevant for smart building governance because it illustrates how data-driven management—enabled by digital twins—can balance human and technological performance indicators [125,126]. Finally, PC7 and PC8 consolidate the multidimensionality of the governance structure. The strong positive loading of CES (0.519 and 0.536) indicates that cost efficiency remains a dominant variable across higher components, confirming that economic optimization is consistently embedded in the model. The coherence of loadings across multiple components demonstrates that each indicator contributes uniquely to the overall governance structure, with no redundancy or distortion. In summary, the PCA results confirm that the governance dataset is statistically robust and conceptually coherent. The clear differentiation of principal components reflects the internal logic of ESG-based governance, where financial, operational, and energy metrics interact systematically. This validates the model’s suitability for integration into a digital twin and metaverse framework, enabling predictive management, optimization of energy investment, and real-time governance of smart building performance. The structure uncovered by the PCA not only supports the empirical reliability of the data but also provides a scientific foundation for developing intelligent, data-driven systems aligned with sustainable management objectives (as shown in Figure 9).

10. Machine Learning Regression for ESG Dataset Validation in Digital Twin and Metaverse-Based Smart Building Governance

The machine learning regression analysis presented in this section was developed as a key step in the technical and scientific validation of a dataset designed for the testing and calibration of a prototype aimed at the management of smart buildings through Digital Twin and Metaverse technologies. The purpose of this process is to ensure that the dataset, structured according to the Environmental, Social, and Governance (ESG) framework, demonstrates high levels of internal consistency, predictive reliability, and interpretability—three essential conditions for its integration into intelligent, data-driven decision systems. By applying advanced machine learning algorithms such as Random Forest and Support Vector Machine (SVM), the study evaluates how effectively the dataset captures the complex, nonlinear relationships that characterize smart building governance. Each ESG dimension—environmental, social, and governance—is analyzed to identify the most suitable model capable of minimizing prediction errors (MSE, RMSE, MAE, MAPE) while maximizing explanatory performance (R2). The Random Forest model proves particularly effective for validating the Environmental and Social components, owing to its ensemble-based structure that captures multidimensional dependencies, avoids overfitting, and enhances interpretability through variable importance measures. The SVM algorithm, conversely, demonstrates superior performance in modeling the Governance dimension, where financial and operational variables interact through complex, non-linear patterns. The outcome of this machine learning validation process confirms that the ESG dataset provides a statistically robust foundation for developing an intelligent management prototype. Within a Digital Twin and Metaverse framework, this validated dataset will enable real-time simulation, optimization, and governance of building performance, energy efficiency, and sustainability—transforming smart buildings into adaptive, self-learning systems that support informed, data-driven decision-making.

10.1. Random Forest Regression for Environmental Dataset Validation Within the ESG Framework

The selection of the Random Forest algorithm as the best-performing model for the validation of the ESG dataset is grounded on a comprehensive evaluation of multiple performance metrics, some of which are to be minimized and others maximized. In predictive modeling, a reliable validation approach must consider this dual nature of indicators. The metrics such as Mean Squared Error (MSE), Root Mean Squared Error (RMSE), Mean Absolute Error (MAE), and Mean Absolute Percentage Error (MAPE) are indicators that must be minimized because they quantify the deviation between the predicted and actual values; lower values correspond to better accuracy and less dispersion of residuals. On the other hand, the coefficient of determination (R2) must be maximized, as it measures the proportion of the variance in the dependent variable explained by the model, thus reflecting its explanatory power. The Random Forest model demonstrates an optimal balance between these opposing objectives. Its normalized MSE, RMSE, MAE, and MAPE values are the lowest among all tested algorithms, indicating superior predictive precision and stability [113]. Even though its R2 is moderate compared to the Linear Regression model, this is compensated by the fact that Random Forest captures complex, nonlinear relationships that linear models fail to represent adequately [114]. The ensemble structure of Random Forest, based on the aggregation of multiple decision trees, allows it to reduce variance and avoid overfitting, which enhances its robustness when validating large and heterogeneous datasets such as those associated with ESG indicators [88]. Furthermore, the model’s interpretability and ability to estimate variable importance make it particularly suitable for applications in digital twin and metaverse environments. By quantifying the contribution of each variable, Random Forest supports both predictive accuracy and strategic understanding of how environmental, social, and governance components influence building performance. Its capacity to minimize prediction errors while maintaining stable explanatory reliability validates its use as a scientifically sound model for data validation in smart building management and ESG-driven digital infrastructures [115,116]. See Table 12.
The analysis of the Random Forest model applied to the ESG dataset reveals a coherent and scientifically valid validation process for its future use in the development of a smart building management prototype that integrates digital twin and metaverse technologies. The feature importance metrics, expressed through the mean dropout loss, serve as a robust indicator of how each environmental variable contributes to the predictive power of the model. This metric, based on fifty permutations of the dataset, measures the increase in error (in terms of RMSE) when a variable is randomly excluded from the model. Lower dropout loss values correspond to less influential variables, whereas higher values indicate features whose removal leads to a significant deterioration in predictive accuracy. In this case, CAF (Capacity Factor), SCF (Supply Cover Factor), and OER (On-site Energy Ratio) exhibit the highest dropout loss, showing that they are essential in explaining variations in the dependent variable AREA. These results are consistent with the physical logic of smart building systems, where energy capacity balance, supply coverage, and on-site generation efficiency play fundamental roles in determining operational performance and sustainability outcomes [117,118]. This importance ranking demonstrates that the Random Forest algorithm not only captures statistical correlations but also reflects the actual structural dynamics governing energy and environmental processes within buildings [119]. In particular, the model’s ability to represent nonlinear interactions enhances the interpretability of variable contributions—especially when dropout loss metrics are combined with ensemble-based prediction strategies [125,126,127,128,129,130]. Moreover, recent studies demonstrate that such methods significantly improve the readability and explainability of complex systems, supporting their use in high-dimensional, heterogeneous ESG datasets [131,132,133]. Consequently, the application of Random Forest in this context is not only statistically justified but also conceptually aligned with the operational goals of smart building governance. See Table 13.
The model’s ability to identify meaningful predictors supports the internal coherence of the ESG dataset and confirms its reliability as a basis for digital twin modelling. The additive explanations of the predictions further reinforce the model’s interpretability. Each predicted value is constructed from a baseline prediction (the “Base”) adjusted by the additive contributions of each variable. Positive contributions increase the predicted AREA, while negative ones decrease it. For example, in Case 1, positive influences from GII (Grid Interaction Index) and FLI (Flexibility Index) compensate for the negative impact of SCF and EMIN, resulting in a final prediction slightly above the baseline. This additive approach allows for a clear decomposition of the prediction mechanism, offering transparency in understanding how individual environmental factors shape the model’s output. Such interpretability is essential for validating the dataset in a scientific context, as it ensures that the model’s decisions are both explainable and consistent with domain knowledge. By integrating the mean dropout loss and additive prediction explanations, the Random Forest model provides a double-layer validation: it identifies the most influential features for prediction and explains how they act in shaping each result. This combination of accuracy, interpretability, and conceptual alignment with building energy dynamics confirms that the model is methodologically sound and suitable for the prototyping of an intelligent management system for smart buildings, capable of leveraging digital twin and metaverse technologies for real-time performance monitoring and sustainable decision-making (Table 14).

10.2. Machine Learning Validation of the Social (S) Component in the ESG Dataset

In the context of developing a scientifically grounded methodology for validating the ESG dataset, this section focuses on the Social (S) component by applying and comparing different machine learning regression algorithms. The goal is to identify which algorithm best captures the underlying relationships among social performance indicators relevant to smart building management while ensuring both predictive reliability and interpretability [134]. After the normalization of performance metrics, the Random Forest algorithm demonstrates the most balanced and consistent results. It achieves the lowest normalized error values across MSE, RMSE, and MAE, indicating superior predictive accuracy and robustness in modeling the social variables. The model’s relatively low MAPE further supports its reliability, as it suggests that Random Forest maintains stable relative error levels across the range of predicted values, ensuring that deviations between observed and estimated outputs remain proportionally small [20,132]. By contrast, Linear Regression, while producing the highest R2 value, exhibits significantly higher normalized error metrics. This indicates that despite its apparent explanatory power, the linear model fails to account for the complex, nonlinear interactions typical of social indicators in ESG frameworks, leading to overfitting and reduced generalizability [135,136]. In this sense, Random Forest provides a better trade-off between minimizing errors and maximizing interpretability, effectively capturing multidimensional relationships among variables such as occupant comfort, indoor air quality, and system efficiency, which collectively define the social sustainability of building operations. The results confirm that the Random Forest approach not only enhances the predictive stability of the validation process but also ensures methodological consistency with the broader objective of dataset validation within a digital twin and metaverse framework [137,138]. Its ability to model complex nonlinearities and maintain low residual variance validates the dataset’s structural coherence and reinforces its suitability for integration into the prototyping of a smart building management system capable of dynamic, data-driven decision-making (Table 15).
The application of the Random Forest algorithm to the Social (S) dimension of the ESG model provides valuable insights for validating the dataset’s internal coherence and predictive reliability in the context of smart building management. This validation is essential to support the prototyping of a management model based on digital twin and metaverse technologies, which require accurate, interpretable, and scalable data structures to simulate and optimize human-environment interactions within buildings [20]. The results obtained through feature importance metrics—mean decrease in accuracy, total increase in node purity, and mean dropout loss—illustrate the role and weight of social indicators such as air quality, comfort, and system efficiency in predicting the dependent variable [119]. The mean dropout loss, calculated through fifty permutations, serves as an indicator of the relative contribution of each feature to model accuracy. Lower dropout loss values correspond to higher importance, as their removal would significantly degrade model performance [135]. In this dataset, variables such as Sound Insulation (SND), Thermal Insulation (THR), System Efficiency (SEF), and Coefficient of Performance (COP) display some of the lowest dropout loss values, confirming their fundamental role in explaining the variance of the output. These indicators are directly linked to the comfort and operational quality of the indoor environment, which are central to the social sustainability dimension of smart buildings [138,139]. Conversely, variables such as Humidity (HUM), Occupants (OCC), and Air Changes per Hour (ACH) contribute to the model with a moderate but consistent effect, emphasizing how internal environmental control and occupancy behavior affect building performance through indirect interactions. The other two importance measures—mean decrease in accuracy and total increase in node purity—further reinforce these findings. The positive values associated with PM2.5 (PM25), System Efficiency (SEF), and COP indicate that they significantly enhance the model’s predictive capacity, while negative or small values in other variables reflect lower or context-dependent influence. The total increase in node purity, a measure of how much a variable reduces overall model variance when used to split data in decision trees, identifies similar key drivers, suggesting the model’s internal coherence across multiple evaluation metrics [140]. See Table 16.
The additive explanations for predictions provide another layer of interpretability, illustrating how each variable contributes to specific case predictions. For example, in the first test case, variables such as PM25 and EER (Energy Efficiency Ratio) have strong positive contributions to the predicted value, whereas factors like VOC and LPD exert negative effects. These additive contributions allow the decomposition of predictions into comprehensible components, which is particularly valuable for digital twin applications that rely on traceable, feature-level understanding to inform operational decisions [134]. The capacity to visualize how indoor comfort, air quality, and energy efficiency dynamically influence outcomes reinforces the model’s practical relevance for smart building management. Overall, the Random Forest model demonstrates a robust and balanced capability to capture complex, nonlinear interactions among social variables within the ESG framework. It effectively distinguishes between features with direct physical impacts—such as thermal and acoustic insulation—and those representing behavioral or environmental feedbacks, like occupancy and ventilation rates. This multi-level interpretability confirms the dataset’s scientific validity, showing that it contains coherent, measurable relationships consistent with the physical and social principles of building performance [125,135]. Therefore, this analysis validates the dataset as a reliable foundation for the development of an intelligent management prototype that integrates machine learning with digital twin and metaverse environments. The model’s structure supports the simulation of user comfort and operational efficiency, providing a data-driven mechanism for adaptive, sustainable management of smart buildings [131,136]. See Table 17.

10.3. Machine Learning Validation of the Governance (G) Component Within the ESG Framework

The validation of the Governance (G) component of the ESG model through machine learning techniques represents a critical step in ensuring the scientific reliability and applicability of the dataset for the prototyping of a smart building management system [137,138]. Within this context, the application of the Support Vector Machine (SVM) algorithm was identified as the most effective method for the validation process [119,139]. The Governance dataset includes key indicators such as Cost of Energy Saved (CES), Energy Return on Investment (EROI), Energy Payback Time (EPBT), Construction and Capital Costs (CPD and CCF), System Performance Coefficient (SPC), Renewable Energy Utilization (REU), and Energy Productivity per Worker Hour (EPWH). These variables jointly capture the economic and managerial dimensions of building performance, linking financial efficiency with operational sustainability [120,140,141]. SVM was selected due to its superior performance across multiple validation metrics, particularly in minimizing mean absolute error (MAE) and mean absolute percentage error (MAPE), while maintaining a high coefficient of determination (R2) [142,143,144]. Unlike linear regression or decision trees, which may struggle to represent nonlinear dependencies, SVM effectively models the complex and interrelated relationships among governance variables [145,146]. This is crucial for ESG-driven frameworks, where economic efficiency, energy optimization, and operational decision-making are deeply intertwined. The low normalized MSE and RMSE further confirm the algorithm’s capacity to reduce prediction variance, ensuring high accuracy in estimating key governance outcomes such as cost-effectiveness and return efficiency [139,147]. The dataset itself, composed of one hundred buildings with diverse energy and cost characteristics, provides a robust foundation for testing the generalization capabilities of the model. SVM’s kernel-based approach allows for capturing nonlinear interactions between energy payback time, system costs, and governance efficiency indicators without overfitting the data [148,149]. This adaptability makes it particularly suitable for applications in digital twin environments, where data-driven models must reflect real-time changes and complex system feedbacks. By integrating this validated model into a digital twin framework, it becomes possible to simulate governance-related decisions in virtual environments before implementing them in physical infrastructures. This enhances predictive control, cost management, and operational resilience in smart buildings. The ability to test policies, predict maintenance needs, or optimize energy-economic trade-offs within the metaverse extends the role of the Governance component beyond data analytics, transforming it into a dynamic management tool. Therefore, the use of SVM for database validation ensures methodological rigor and computational robustness, confirming that the dataset is not only statistically coherent but also operationally meaningful. This validation establishes a scientific foundation for developing a prototype capable of merging machine learning, digital twin technologies, and ESG-based governance metrics into a unified management model for smart, efficient, and sustainable buildings. See Table 18.
The results obtained from the validation of the Governance (G) component of the ESG model using machine learning provide a consistent and technically coherent confirmation of the dataset’s reliability for the prototyping of a smart building management system. In this validation phase, the analysis focuses on the feature importance metrics and the additive explanations derived from the Random Forest regression model, which was used to estimate the AREA variable based on a set of governance-related indicators including CES (Cost of Energy Saved), EROI (Energy Return on Investment), EPBT (Energy Payback Time), CPD (Construction Cost), CCF (Capital Cost Factor), SPC (System Performance Coefficient), REU (Renewable Energy Utilization), and EPWH (Energy Productivity per Worker Hour). The Mean Dropout Loss, which remains consistent across all variables at approximately 5.279, suggests that each feature contributes similarly to the model’s predictive accuracy. This uniformity implies that the dataset is well-structured, without any variable disproportionately influencing the model. The stability in dropout loss also confirms the absence of overfitting, ensuring that the model generalizes effectively to unseen data. From a methodological standpoint, this homogeneity validates the internal coherence of the Governance dataset and indicates that each metric contributes to explaining different aspects of building efficiency and management performance (Table 19).
The additive explanations of the predictions for the test set provide further insights into how each variable influences the estimated AREA values. The predictions show small but meaningful variations around the base value of 9.309, with feature contributions generally close to zero. These subtle shifts indicate that the model captures complex interactions among governance variables without introducing excessive noise. For instance, the CPD and CCF indicators show minor but systematic effects, reflecting the role of cost-related parameters in determining building scale and resource allocation. Similarly, the contributions from REU and EPWH confirm the connection between renewable energy utilization, labor productivity, and overall building governance efficiency. From a broader perspective, these results substantiate the model’s capacity to interpret governance-related dynamics within the ESG framework. The balanced feature importance distribution demonstrates that the variables are not redundant but complementary, collectively enhancing predictive accuracy and interpretative value. In the context of smart building management, this outcome is particularly relevant because it supports the integration of governance indicators into a decision-support system capable of optimizing energy efficiency, financial sustainability, and operational planning. Therefore, the validation confirms that the database is statistically consistent and suitable for the development of an intelligent management prototype leveraging digital twin and metaverse technologies. The capacity to model economic and performance interdependencies with precision establishes a strong foundation for advanced predictive control, simulation-based policy testing, and strategic governance of smart buildings. This ensures that the system’s management model is both scientifically validated and operationally viable in a real-world digital twin environment (Table 20).

11. Theoretical Framework: Digital Twin Interoperability, User-Centered Virtual Environments, and Intelligent Data-Driven Control Systems in Smart Building Management

The convergence of digital twin interoperability, user-centric virtual realities, and data-driven control systems constitutes the comprehensive theoretical framework for the smart management of buildings in metaverse-scale ecosystems [12,140]. The aspect of digital twin interoperability forms the foundational backbone in facilitating seamless connectivity among different units in a building, such as HVAC units, light units, storage units, and environmental units, among others, via standardized data exchange protocols and modulated interfaces [18,150]. The interoperability of digital twins ensures real-time synchronization between physical units and their corresponding digital twins, facilitating predictive maintenance, dynamic resource management, and adaptive energy management [141,151]. The continuous one-way data flow facilitates an integrated and dynamic infrastructure network that can evolve with users and adapt to different environmental settings, thereby forming the basis for scalable metaverse-scale governance models [140,152]. On the one hand, with the convergence of user-centric realities in the metaverse, the human factor arises, thereby facilitating the transition from a visualization technology to an interactive management solution space [142]. Occupants and users can thereby utilize immersion visualization technology to directly interact with different units in the metaverse to simulate spatial arrangements in real space to in-depth analyses of the situation, to co-develop sustainability strategies in real space via exploration of the third digital reality space in real time, respectively [153,154]. On the other hand, complemented by human-centric interaction technologies, data-driven control technology forms the analytical core of metaverse-scaled management platforms. The use of AI machine learning technology in data mechanisms enables multisource data collection to identify undetected data patterns, predict consumption patterns, and optimize performance [143,155,156]. The integration of smart algorithms into control mechanisms enables a transition from post-response to pre-response mechanisms, respectively, self-sustaining and adjusting to variations in occupancy, external environments, and consumption [12,157,158,159] (as shown in Figure 10).

12. Operationalizing Environmental Sustainability Through Digital Twins: A Metaverse-Enhanced ESG Dashboard for Smart Building Management

In this rapidly shifting landscape of AI-driven building management, ESG factors aligned with digital twin technology and metaverse-based engagement, like the metaverse itself, are driving a paradigm shift in sustainability [160,161]. As a precursor to this innovative solution developed to promote and enable prototyping and training for a digital twin infrastructure for sustainable building management in a smart city setup for ESG-based KPI development for digital twin sustainability metrics, this article proposes and brings to fore a critical dashboard that translates to The ESG KPI Framework—Metaverse-Enhanced Operations [162]. The above-mentioned dashboard provides a comprehensive perspective on environmental building metrics and includes critical dimensions related to carbon emissions, energy usage patterns, and the integration of renewable energy sources, in addition to sustainable and optimized building management performance. The dashboard is made possible by enhanced, streamlined inputs from real-time IoT-based streaming sources and is supported by advanced computational methods such as PCA and Ordinary Least Squares for predictive and related mathematical modeling to ensure feasibility. Moreover, through metaverse-based infrastructure development opportunities that are inclusive of interactive 3D platform development for critical sustainability metrics and factors such as carbon emissions and building performance, this dashboard translates into a critical sustainability perspective that resolves in a waterfall fashion. Thus, it essentially encapsulates critical sustainability and assurance translation and resolution through adaptive, advanced platform development. Moreover, it essentially translates to a critical confluence between sustainability intelligence and innovative digital platform development. Therefore, basically translates to a new and critical metaverse-driven paradigm for sustainability intelligence and related predictive development.

12.1. Environmental Dimension Dashboard: Metaverse-Enhanced ESG Framework for Smart Building Digital Twin Development

This dashboard is a representation of the Environmental (E) dimension of ESG KPI Framework—Metaverse-Enhanced Operations- and has specifically been designed for prototyping and training a digital twin and metaverse-based system for a smarter building management [144]. The dashboard is specifically designed to provide information on the building and its environmental performance, and to demonstrate how sustainability metrics can be measured, authenticated, and even visualized to improve ecological intelligence and efficiency within a metaverse-based management platform [145]. The dashboard essentially represents a systematic evaluation of key environmental factors designed to monitor and track the building’s carbon footprint and the renewable energy generated and integrated within the building. The Carbon Footprint, with a value of 453.75 TCO2e, essentially represents a measure of total carbon emissions that are generated as a result of building operation in a given period and is a critical factor within this context as it essentially suggests that a building is striving to achieve sustainability and is committed to reducing carbon emissions and staying within limitations and goals established within ESG frameworks. The Emission Intensity of 0.0249 TCO2/kWh suggests that this building maintains a high level of energy efficiency and has a negligible environmental impact. The building’s commitment to a sustainable cause is essential, as it provides critical information on the adoption and integration of 57.4% of renewable resources into its energy structure. The building is essentially committed to sustainability and is well aligned with ESG-based strategies that identify net-zero and transition to a green building approach [40]. The building’s Energy Consumption of 1440827 kWh and related Energy ROI of 260220.0 suggest that sustainability strategies and techniques can deliver returns in this context and ensure that actions and strategies are focused on and optimized for energy efficiency. The building is capable of and can provide a substantial portion of the demand through on-site and renewable sources, as indicated by its critical factors, which show a Load Covering Factor of 76.5% and a Supply Covering Factor of 84.8%. The On-site Energy Ratio of 0.68 and its ability to interact with grids and manage and sustain its operation based on strategic connections as suggested through its critical factor that essentially suggests that it is capable of and has a strategic connection to grids as suggested through its value that essentially suggests that it is capable to operate independently and autonomously as suggested within its critical factor of 58.6% related to its interaction between its independent and strategic connections to grids. The bottom portion of a dashboard essentially provides a pictorial representation through a number of critical factors that essentially represent and identify a building and its dynamics within a broader context that essentially represents sustainability as suggested within its critical factor that essentially represents Energy Flow as suggested within its critical factor that essentially represents its dynamics and level within a broader context that suggests that this is essentially a building that is capable to switch its sources and essentially manage and sustain its operation within this context as suggested related to its critical factor that essentially represents “This capability to forecast and react to changes in demand patterns is but one example of how predictive control methods are indeed imbedded within this environmental management framework” [12]. The information in this dashboard is continuously updated using IoT devices and validated using computational methods such as correlation analysis, Principal Components Analysis (PCA), Ordinary Least Squares (OLS), and Machine Learning algorithms [145]. The methods ensure that information is trustworthy and help make Key Performance Indicators science-based for training a digital twin. It is through this that “the environmental factor in ESG becomes not only descriptive but can accurately forecast future performance scenarios under different scenarios of either operation and climate in which a digital twin performs”. On the designer’s intent level, this dashboard makes it clear that integration between environmental intelligence and immersive technologies has been realized. At the metaverse level and within this context-based scenario, this information is analyzed in real time through interactive 3D to assist in “the direct effect of building operation decisions on energy and carbon emissions and system performance” [147]. The immersive experience is one that “brings monitoring and controlling traditional environments to an ‘experiential’ level for learning and strategies” while making “sustainability a not fixed information piece but a ‘dynamic’ and ‘participative’ strategy for decision-making” [153]. The dashboard is one of those building foundational ingredients that contribute to a strategy platform for a digital twin application in a smarter building environment. On its platform strategy formulation, this one offers “continuing” feedback between information and simulation and system-level “optimization” for better building performance through a logical, optimized logical calculus for a better development strategy [16]. IT recognizes that “strategic” developments for “building environmental intelligence and immersive display” are reaching a decisive point to achieve “an intelligent ecosystem that can self-act to improve its building environment while keeping to transparency and accountability” and for itself “the strategic de-velopment level for optimized building development” and “strategic” that can self-act through its “strategic development level for optimized building development” in making better strategies for building. In conclusion, and in relation to how this ESG theory can help develop better building strategies for smarter buildings through a digital twin immaterial platform. The “E” in ESG theory can actually help in making a computational strategy for building digital twins and metaverse technology, and making better building strategies. The dashboard has a “continuous” and “data-driven” strategy for developing a new “ecological” approach to smarter building infrastructure systems that are not “theoretical” but “founded,” “dynamic,” and “interactive” realities in carbon emissions and renewable energy (Figure 11).
Figure 10 above highlights the Environmental aspect of the “ESG KPI Framework—Metaverse-Enhanced Operations” component. The dashboard has been developed not only to visualize information but also to support active decision-making. All the information displayed on the dashboard links directly to the framework’s logic. This information comes directly from real-time IoT sensors and the “analytical engine” used in the actual ESG performance measures. From the first look at the dashboard above, the top of the page provides immediate information on the main aspects of the “environmental” factors. These factors include the Carbon Footprint, Indoor Air Quality, and the Energy ROI. All the factors shown are updated as new information becomes available regarding the relationship between the actual physical structure and the “metaverse” structure. This provides the user with access to up-to-date information that is constantly changing. Below the main information area of the page, additional information can be found. This information includes the “Emission Intensity,” “Renewable Energy Share,” “Load Cover Factor,” and the “On-site Energy Ratio” factors. All the above factors are created through the usage of “multiple data sources” and verified “analytical techniques” such as PCA and “OLS Regression Analysis.” This process makes the information obtained from the sensors more meaningful. This information provides the user with “patterns and trends” at the “operational level” of the structure. This information can only become beneficial as the “bottom-line” strategy. As mentioned at the end of the above information area of the page. The “bottom” area of the page provides additional information relative to the main information. This information teaches the user about “energy flow” and “load shifting” aspects. This information shows the “balance of play” between “grid-based” sources and “on-site” sources. In the “right” area of the main information page above, the “demand structure” aspect can be found. This aspect “charts the course” of the “demand factor” in real time. This aspect shows the user “expected peak demands” as compared to “alternative” strategies. This aspect “embodies the spirit” of the “living” page. As mentioned above. The page provides more than adequate information relative to the main aspect. This aspect provides the user with a “bird’s eye” view of the information. By integrating into the metaverse, the ability to analyze data interactively in 3D has become possible. This feature allows the user to analyze the effects of operational changes in the building. In other words, the user can analyze the effects of changes in carbon emissions, energy savings, and investment costs. This essentially enables the user to predict the changes before actually implementing them in the real-life structure. In other words, the dashboard has made sustainability information a decision-making tool. This shows how the ESG KPI Framework can shift from a descriptive model to a management experience.

12.2. Social Dimension Dashboard: Human-Centered ESG Framework for Digital Twin and Metaverse-Based Smart Building Management

The dashboard in Figure 11 represents the Social (S) factor in relation to the ESG Key Performance Indicator Framework—Metaverse-Enhanced Operations within a digital twin and Metaverse-based system for a smart building management system (Figure 12).
Unlike other dashboard views that consider sustainability in relation to environmental and governance factors, this dashboard focuses on directly improving user well-being and health through quantified, measurable Key Performance Indicators for social sustainability. The dashboard combines real-time monitoring from building sensors and digital twin analysis to evaluate indoor environmental quality (IEQ). This makes it a pivotal framework for ESG layers to ensure that building users’ well-being is maintained through a digital and sustainable metaverse platform. The top portion of this dashboard provides a summary of information on building sustainability. The Carbon Footprint (453.75 tCO2e) is maintained as indicative in ESG layers to promote sustainability. The key indicator directly related to building users’ health and well-being is given as an “Excellent” rating for indoor air quality. It is denoted as “11.4 μg/m3” and classified as a “PM2.5” concentration for air purity. The building maintains a “PM2.5” concentration within a “Very Low” level to ensure that building users are protected from inhaling building air pollutants. The subsequent section of this dashboard provides a deeper evaluation of key social factors that define the indoor experience for building users. The building maintains its “Relative Humidity” at “51.1%,” within the “Normal” range. Therefore, this ensures that building users experience health and well-being related to indoor humidity. The dashboard shows that the “PM10” air concentration is maintained at “20.9” “µg/m3,” while the “Volatile Concentration” is denoted as “20” “ppb” to support building health and well-being. The building maintains its “Air Changes/h/h” as “2.8” “1/h” to ensure that building users’ indoor health and well-being are maintained. The above-mentioned factor ensures that building users experience health and well-being benefits from indoor air quality improvements. The “r-Value” is maintained as a “2.19” building factor to ensure that building users experience health and well-being factors associated with indoor building temperatures. The above health and well-being factor related to indoor building temperatures is associated with indoor building noise levels. The building maintains its “Sound Insulation” level as “−” “dB” to ensure that building users’ health and well-being requirements are maintained. The factor is associated with indoor noise stress among building users. The above factor maintains indoor noise stress factors within a “Low” level. Therefore, indoor building noise stress factors are reduced to ensure that building users experience health and well-being related to indoor building noise. The dashboard displays that building users experience health and well-being factors within a “Very Low” level. The health and well-being factor is associated with indoor building temperatures. The above dashboard factor maintains indoor temperatures within a “Comfort” level. The health and well-being factor related to indoor building temperatures is associated with indoor building noise. The building serves as a component of its prototype for its digital twin system, translating abstract social sustainability criteria into measurable indicators to promote a new paradigm of human-centered, resilient building management.
Figure 11 represents the Social aspect of the ESG KPI Framework—Metaverse-Enhanced Operations. Rather than being used merely as a reporting screen, this dashboard has been developed as a living screen that integrates visual information, real-time reporting, and human-level decision-making in the metaverse. This helps management analyze comfort, health, and efficiency-related information in understandable patterns. On first look, the upper section provides a quick snapshot of the structure’s overall performance, highlighting key parameters such as Carbon Footprint (453.75 tCO2e), Indoor Air Quality (11.4 µg/m3 PM2.5, Excellent), and Energy ROI (26,022.0 with a 0.8-year payback). All these factors link the environmental theme to the social theme of the framework. These factors are updated at shorter intervals using IoT-based reporting systems, allowing the virtual structure to reflect the actual status of the structure at each given instance of the day. On the other hand, the figures at the end, pertaining to the Air Quality and HVAC Efficiency graphs, graphically represent the story of the structure “breathing” and “performing” as such. The figures at the end compare actual values to predetermined thresholds, allowing the user to gauge whether the structure sustains healthy indoor conditions or requires corrective measures. The HVAC Efficiency graph shows the “responsiveness” of the structure. Details such as EER, COP, and the total System Efficiency (86 percent) can be observed. This aspect of the structure indicates its efficiency in enabling human-level decision-making. This structure follows human-level design. Even when details were involved, the structure reduced visual strain through strategically grouped information and contrasting visual elements. This structure has been set up based on user-centered design principles. The configuration panel in the left corner of the structure enables the user to quickly perform real-time analytics on real structures rather than simulated ones. This structure can select other related structures or even perform activities such as visualizing the metaverse. In the end, this structure serves as a live decision-making environment rather than a reporting structure. Its availability in the metaverse enables users to perform experiment-oriented activities in 3D reality to analyze “what if” scenarios before getting started at the actual structure level. For instance, the user can model the effects that changes in the HVAC system might have on air quality levels or potential increases in energy savings. Essentially, the dashboard enables the user to view results in real time. The dashboard enables the user to translate sustainability-related information into a management experience. This comes from integrating live information and human insight. This allows the ESG KPI Framework to become a living entity.

12.3. Governance Dimension Dashboard: Financial Transparency and Strategic Decision-Making in Metaverse-Enhanced Smart Building Management

The dashboard in Figure 12 represents the Governance (G) dimension within the ESG KPI Framework—Metaverse-Enhanced Operations. The dashboard is specifically designed to train and validate a prototype for building an integrated digital twin and metaverse system for smart building management [139], Figure 13.
The dashboard is distinct from other ESG metrics because it focuses solely on economic governance and financial decisions related to energy management and sustainability [140]. The top portion of this dashboard frames its scope in relation to governance through three core metrics. Carbon Footprint (453.75 tCO2e) and Indoor Air Quality (11.4 μg/m3 PM2.5, Excellent) are maintenance metrics to maintain continuity with ESG dimensions. However, in this context, all metrics are financial in scope. The Energy ROI (26,022.0), with a 0.8-year payoff period, signifies economic sustainability in terms of how energy investments are returned [106]. The above-mentioned metric indicates financial efficiency in how capital and financial governance sustain this digital twin across financial and environmental parameters. The middle portion of this dashboard signifies a financial segregation regarding parameters for its governance. The Investment for system implementation is 1,679,500 €, while Subsidies are 883,081 €, corresponding to 52.6% of the total capital. The above-mentioned metrics indicate transparency and traceability levels for ESG financial governance by highlighting financial investment segregation within this ESG platform [141]. The Cost Energy Saving metric (0.701 €/kWh) signifies financial returns within energy-saving initiatives. The Annual S-avings value (22,513 €/yr) is reflected within this ESG platform for financial returns in relation to sustainability and financial benefit. The above-mentioned Peak Demand Cost (187,854 €) and the metrics related to demand on this ESG platform indicate financial sustainability. The aforementioned digital twin and demand within this ESG platform enable the platform to forecast demand cost variability across different scenarios [140]. The Cash Flow (–372,815 €), reflected in this ESG platform, is used to assess investment metrics for this digital twin platform’s financial sustainability. However, the above-mentioned metric is supported by a 15-year forecast in this ESG platform, as reflected in the cash flow projection below. The above graph is one of the most important aspects of the Governance factor and shows how both the «Annual Cash Flow» and «Cumulative Cash Flow» have been displayed to better define financial recovery dynamics over time [12]. The «Negative bar» in this first-year chart refers to capital outflows as a direct investment cost and «Positive bars» that follow specifically denote «yearly savings». The point where «cumulative curves shift into positive zones» will denote a stage where a given investment becomes profitable. The ability to simulate this within a digital twin system will help this metaverse platform project financial sustainability and performance in line with its ecological and operational potential [150]. The «Left side-bar» titled «Building Config» enhances this «governance strategy» by including «Real and Simulated parameters» within its digital twin platform. There is scope to switch between «Real Building Data» and «Simulated Data» and to define «building config parameters» like «Building Size » (16,795 m2), «Building Occupants» (701 people), and «Total Units» (209), all with a view to ensure «comparability» and «normalization» for «governance KPIs» when different building types will specifically come under this ESG factor and «Governance strategy» classification [153]. The «switch to enable» Renewable Energy Systems, «Smart & Grid Integration» and «Metaverse Technology» specifically not only enables monitoring but enhances training within this «governance logic» for this «prototype» to react and easily «predict» decisions to invest in the future in its «simulated metaverse» platform [150]. In essence, this dashboard can specifically act as a «Governance Cockpit» within this ESG framework that is specifically designed for monitoring and predicting «financial and strategic» aspects related to «smarter building» management. The dashboard directly connects financial accountability and sustainability goals and can define «Investment Efficiency» and «Savings» impact as well as «Pay Back Time» factors while predicting future «economic behavior» in this metaverse and digital twin platform. In reference to this digital twin and metaverse platform and prototype «indicators» and factors will specifically setup «training ground» for «algorithms» to easily execute direct «decision-making» in «immersing» management scenarios within its ecosystem. Thus, this dashboard can specifically address a «financial strategic» and related «Governance factor» related to this ESG strategy within its metaverse platform that directly translates this «G» factor to a «financial strategic digital governance model» within this metaverse digital twin. It not only proves that good governance is a management activity but is indeed a computational task that can be modeled and optimized in a digital twin space. So, in this context, a digital twin can indeed have a significant impact on building management.
Figure 12 shows the Governance (G) dimension of the ESG KPI Framework—Metaverse-Enhanced Operations. This dashboard has been created not only as a summarizing tool for financial information but also as a living space that links the dimensions of economy, environment, and operations in real time. Its design consists of a hierarchical system that enables the understanding of financial information through the ESG-based management of the building. Starting at the very top of the interface, the user can clearly see the first set of significant factors: Carbon Footprint (453.75 tCO2e), Indoor Air Quality (11.4 µg/m3 PM2.5, Excellent), and Energy ROI (26,022.0 with a payback time of 0.8 years). This set of figures serves as the link between the different components of the Environmental, Social, and Governance segments as a whole. This information is updated in real time using IoT-based data acquisition systems that track the behavior of the physical structure. The middle section of the screen highlights financial aspects that pertain to governance. Financial measures such as Investment (1,679,500 €), Subsidies (883,081 €−52.6%), Cost of Energy Saving per kWh (0.701 €), Average Annual Savings (€22,513 per year), or Peak Demand Cost (187,854 €) are processed by the analytics engine. In reality, the analytics engine uses regression analysis, PCA weights, and prediction formulas to analyze the raw data presented to the user. This way, the field of governance goes beyond the realm of accountancy. Thus, the results can lead to a more straightforward, easy-to-understand process for governing the field of cost efficiency and sustainability. The lower panel of the dashboard provides a 15-year Cash Flow Projection that highlights the long-term viability of financial investments through a graph integrating Annual Cash Flow (modeled as blue columns) and Cumulative Cash Flow (illustrated as a green line). The area where the green curve enters the positive region indicates the payback zone—the transition from mathematical financial investment predictions to easy visual understanding. Decision-makers can easily distinguish between investment and economic viability through the graph’s visual representation. In the design of the dashboard as a whole, clarity and usability were the emphases. The financial measures related to ESG factors are presented in chronological order, allowing trends to be easily observed. Guidelines based on Human–Computer Interaction (HCI) were at the forefront of the design. The use of contrast to highlight trends in performance across financial measures stands out. The real-time monitoring logic has been structured based on the connectivity between the digital twin and the IoT sensors. With the real-time connectivity between the digital twin and the IoT sensors, the financial aspects of the concerned entity —whether ROIs or subsidies, depending on the type of entity —are dynamically linked to variations in related operating factors, such as consumption and efficiency. From the perspective of a decision-support tool, the dashboard functions as a smart cockpit for facility management and policymakers. In the metaverse, users can navigate the financial flow experience in 3D. In the 3D world, the user can analyze investment options or run “what-if” scenarios on the cost of energy or the subsidy rate. The Governance Dashboard illustrates how the realms of digital visualization, real-time analytics, and the metaverse can come together to create a truly end-to-end solution for management. This transforms financial analysis from a passive reporting process into a hands-on experience that can promote greater transparency and adaptability across the entire ESG realm.

13. Discussion

This “Metaverse-Enhanced Operations” ESG KPI Framework offers a revolutionary paradigm for managing smart buildings. By capitalizing on the collective synergy among ESG factors, digital twins, and the metaverse paradigm [144], the framework enhances passive sustainability reporting. This approach goes beyond the previous digital twin-based systems’ focus on predicting maintenance activities and optimizing energy consumption [163], incorporating an ESG dimension. This dimension interlinks the above-mentioned environmental, user, and management factors within a holistic management system. The metaverse paradigm complements this management system and upgrades these synergistic systems. In this context, the manager can dynamically evaluate the functional dimension (HVAC efficiency factor, use of renewables, and users’ level of comfort), enabling access to the immediate outcomes of a diverse management approach. Thus, the synergy between digital twins and the metaverse paradigm creates a “management space” in which ESG factors serve as real-time inputs to simulation processes. From a theoretical perspective, the presented framework incorporates concepts from “Cyber-Physical Systems” (CPS) and “Human–Computer Interaction” (HCI). This CPS structure provides real-time alignment between the physical and digital layers through the use of IoT sensors and AI-based analytics. HCI principles outline human-centered designs for enhanced human interaction. Thus, this synergy between the above-mentioned concepts enhances the robustness and human-centered orientation of the management strategy. This approach goes beyond the status quo. According to [12], the synergy between the IoT and metaverse paradigms enables real-time prediction and management. Using this concept as a starting motivation point for the current motivation, the presented approach provides a metaverse-integrated ESG management system. This management system interlinks real-time performance information on physical factors (CO2 intensity factor, renewables-based factor) with financial and social factors (ROI factor, payback factor, user comfort factor), thereby overcoming the main weakness of current Building Information Modeling-BIM systems. This weakness consists of the systems’ exclusive reliance on geometry-based factors and their merely retrospective nature. This enables managers and decision-makers to model alternative sustainability strategies, predict the system’s behavior under changing conditions, and analyze trade-offs among the system’s goals related to green efficiency, occupant comfort, and financial gain. This paradigm enables traceability, transparency, and planning that align with the world’s Net-Zero and Industry 5.0 goals. In the end, the ESG KPI Framework—Metaverse-Enhanced Operations offers a scalable and human-centered paradigm that redefines the role of ESG principles and the built environment. In fact, incorporating the principles of CPS and HCI rectifies the current state of digital twins and repositions the technology from the descriptive phase to the intelligent and adaptive phase.

14. Limitations

Although the ESG KPI Framework—Metaverse-Enhanced Operations offers a profoundly innovative and integrated solution for smart building management in a metaverse, there are some limitations that need to be acknowledged and addressed in this context. The foremost and key limitation is that the current developmental stage of this system is a conceptual and technological prototype. In other words, it has been developed for testing and demonstration. The controlled testing environment has not yet been developed to encompass all the complexities associated with building management systems in real-time scenarios. The logical structure and associated logic for interactive engagement have been optimized but need a few more iterations to be fully Beer-optimized and streamlined for integration with building automation systems. The digital twin has been developed for training and testing, with sample scenarios developed under assumed boundary conditions. Although computational techniques like PCA, OLS regression, and machine learning implementations improve reliability, they are not yet capable of full-time deployment in real-time-built infrastructure. In this context, some field tests will be required to validate robustness under different patterns and factors [151]. The next limitation concerns scalability and hardware. In this context, metaverse-based immersive technology and infrastructure presuppose computational requirements and XR devices that are not yet cost-effective or universally available [150]. As a direct consequence, this is a concern and a limiting factor for adopting this metaverse-based technology across all building management scenarios. On top of that, since this is a prototype that has primarily focused on the environmental aspects of ESG for building and infrastructure management scenarios, the implementation and development of all aspects in this context remain partially conceptual. In this context, more needs to be developed to achieve a deeper level of understanding of the computational and immersive aspects of this metaverse than has already been developed in its environmental aspects [153]. The final point to note is that user privacy and related aspects of AI- and ML-driven technological developments have already been outlined and will require further development [152]. The above challenges are even more pertinent when scaling this system for its deployment within a public and/or residential infrastructure. In conclusion, within this context, this proposed system not only has a solid basis but is also a tough competitor compared to contemporary systems in its field; however, it still needs to be validated in a scaled environment. The above challenges define a development roadmap.

15. Conclusions

This research proposes a holistic, innovative solution for sustainable management in the realm of green buildings through the ESG KPI Framework—Metaverse-Enabled Management. This solution has extended the realm of sustainable management in the context of digital twins and metaverse-based systems. In fact, the solution has shown the potential of utilizing real-time IoT data for the real-time monitoring and analysis of ESG factors. From a methodology perspective, the solution has validated the KPIs using a robust, mathematical approach comprising Principal Component Analysis (PCA), Ordinary Least Squares Regression (OLS), and predictive modeling. This has made the solution more scientific and robust in terms of the assurance of KPI reliability for ESG factors. On the other hand, the solution has enabled real-time monitoring of important sustainability factors, such as the structure’s carbon impact and energy use. In fact, the solution presents important aspects for developing sustainable management systems that enable decision-making among stakeholders through its 3D interactive platform. In fact, the solution has extended the concept of sustainable management systems by leveraging digital twins and BIM. This has provided important coverage of both human and financial factors, as the solution integrates all ESG-related factors. This has made the solution important at the juncture of Human–Computer Interaction (HCI), as it has demonstrated the effectiveness of metaverse-based systems in this context. On the other hand, the solution has made available important coverage in the context of sustainability management. In fact, the solution has made important aspects of the sustainability management system development available due to its applicability. The solution has made available important coverage pertaining to the development of a sustainable management system. In fact, the solution has made sustainable management systems. This has proven beneficial for both commercial and government structures. This has made important aspects of the development of real-time monitoring of sustainability factors available. On the other hand, the solution has enabled sustainable management systems due to its applicability. In fact, the solution has made important aspects of sustainable management system development available. This has been beneficial for the development of sustainable management systems. In fact, the solution has made sustainable management systems. This has been beneficial at the juncture of the development of sustainable management systems because of their applicability. On the other hand, the solution has made important aspects of sustainable management system development available. This has been beneficial because of its applicability. On the other hand, the solution has made important aspects of sustainable management system development available. This has been beneficial at the juncture of developing sustainable management systems. Conclusion: This research has laid the foundation for a new paradigm for the management of smart, sustainable buildings. This paradigm has shifted from a reporting model of performance to an interactive, predictive model of decision-making. This has been achieved through the integration of data science innovation, digital twin simulation techniques, and the metaverse approach.

Author Contributions

Conceptualization, N.M., C.T., M.D.M., A.Z., V.N., E.Z. and A.L.; methodology, N.M., C.T., M.D.M., A.Z., V.N., E.Z. and A.L.; software, N.M., C.T., M.D.M., A.Z., V.N., E.Z. and A.L.; validation, N.M., C.T., M.D.M., A.Z., V.N., E.Z. and A.L.; formal analysis, N.M., C.T., M.D.M., A.Z., V.N., E.Z. and A.L.; investigation, N.M., C.T., M.D.M., A.Z., V.N., E.Z. and A.L.; resources, N.M., C.T., M.D.M., A.Z., V.N., E.Z. and A.L.; data curation, N.M., C.T., M.D.M., A.Z., V.N., E.Z. and A.L.; writing—original draft preparation, N.M., C.T., M.D.M., A.Z., V.N., E.Z. and A.L.; writing—review and editing, N.M., C.T., M.D.M., A.Z., V.N., E.Z. and A.L.; visualization, N.M., C.T., M.D.M., A.Z., V.N., E.Z. and A.L.; supervision, N.M., C.T., M.D.M., A.Z., V.N., E.Z. and A.L.; project administration, N.M., C.T., M.D.M., A.Z., V.N., E.Z. and A.L.; funding acquisition, N.M., C.T., M.D.M., A.Z., V.N., E.Z. and A.L. All authors have read and agreed to the published version of the manuscript.

Funding

This work has been supported by the following Project: “xTech NextHub: Competence Center for Innovative Solutions Development” through the Bando Regionale della Puglia per gli Aiuti in Esenzione 17 del 30/09/2014-BURP 139 suppl. del 06/10/2014 e s.m.i.—Titolo II Capo 2 del Regolamento Generale “Avviso per la Presentazione dei Progetti Promossi da Grandi Imprese ai Sensi Dell’articolo 17 del Regolamento”.

Data Availability Statement

The data supporting the findings of this study are available from the corresponding author upon reasonable request.

Conflicts of Interest

Authors Nicola Magaletti, Mauro Di Molfetta, Valeria Notarnicola and Angelo Leogrande were employed by the company LUM Enterprise S.r.l. Authors Chiara Tognon, Angelo Zerega and Ettore Zini ere employed by the company Deloitte Consulting S.r.l. The remaining authors declare that the research was conducted in the absence of any commercial or financial relationships that could be construed as a potential conflict of interest.

References

  1. Lemian, D.; Bode, F. Digital twins in the building sector: Implementation and key features. E3S Web Conf. 2025, 608, 05004. [Google Scholar] [CrossRef]
  2. Solmaz, A.Ş. Technological Advances in AEC: AI, Machine Learning, BIM, and the Future of Sustainable Building Design in a Post-Pandemic World. Black Sea J. Eng. Sci. 2024, 8, 757–774. [Google Scholar] [CrossRef]
  3. Fokaides, P.; Jurelionis, A.; Spudys, P. Boosting research for a smart and carbon neutral built environment with digital twins (SmartWins). In Proceedings of the 2022 IEEE International Smart Cities Conference (ISC2), Pafos, Cyprus, 26–29 September 2022; IEEE: New York City, NY, USA, 2022; pp. 1–4. [Google Scholar]
  4. Sabri, S.; Witte, P. Digital technologies in urban planning and urban management. J. Urban Manag. 2023, 12, 1–3. [Google Scholar] [CrossRef]
  5. Zavaleta, J.P.A. Digital Twins and BIM Toward the Smart Management of Post Occupancy Public Buildings. Preprints 2025. [Google Scholar] [CrossRef]
  6. Gao, Q.; Chu, Y.; Peng, Z.; Jin, Y.; Ji, X.; Ji, S.; Yue, Y. Smart Building Management System based on Digital Twin: A Case Study on Real-Time Environmental Monitoring and Thermal Comfort Prediction. In Proceedings of the 2024 IEEE International Symposium on Parallel and Distributed Processing with Applications (ISPA), Kaifeng, China, 30 October–2 November 2024. [Google Scholar]
  7. Matei, A.; Cocoșatu, M. Artificial Internet of Things, sensor-based digital twin urban computing vision algorithms, and blockchain cloud networks in sustainable smart city administration. Sustainability 2024, 16, 6749. [Google Scholar] [CrossRef]
  8. Misilmani, A.H.; Elbastawissi, I. Revolutionizing Urban Planning: Exploring the Synergy of BIM-GIS, Metaverse (VR & AR), and Real-World Applications to Urban Heritage Buildings in Beirut’s Rmeil and Medawar Clusters. MSA Eng. J. 2023, in press.
  9. Zhang, M.; Cao, J.; Sahni, Y.; Jiang, S.; Wu, T. EaaS: A service-oriented edge computing framework towards distributed intelligence. In Proceedings of the 16th IEEE International Conference on Service-Oriented System Engineering (SOSE), Newark, CA, USA, 15–18 August 2022; IEEE: New York City, NY, USA, 2022; pp. 165–175. [Google Scholar]
  10. Casini, M. Extended reality for smart building operation and maintenance: A review. Energies 2022, 15, 3785. [Google Scholar] [CrossRef]
  11. Din, I.U.; Awan, K.A.; Almogren, A.; Rodrigues, J.J.P.C. Integration of IoT and blockchain for decentralized management and ownership in the metaverse. Int. J. Commun. Syst. 2023, 36, e5612. [Google Scholar] [CrossRef]
  12. Masubuchi, Y.; Hiraki, T.; Hiroi, Y.; Ibara, M.; Matsutani, K.; Zaizen, M.; Morita, J. Development of Digital Twin Environment Through Integration of Commercial Metaverse Platform and IoT Sensors of Smart Building. In Proceedings of the 2025 IEEE Conference on Virtual Reality and 3D User Interfaces Abstracts and Workshops, Saint Malo, France, 8–12 March 2025; IEEE: New York City, NY, USA, 2025; pp. 852–855. [Google Scholar]
  13. Tang, M.; Nikolaenko, M.; Alrefai, A.; Kumar, A. Metaverse and digital twins in the age of AI and extended reality. Architecture 2025, 5, 36. [Google Scholar] [CrossRef]
  14. Elias, D.; Ziegenbein, D.; Mundhenk, P.; Hamann, A.; Rowe, A. The cyber-physical metaverse-where digital twins and humans come together. In Proceedings of the 2023 Design, Automation & Test in Europe Conference & Exhibition (DATE), Antwerp, Belgium, 17–19 April 2023; IEEE: New York City, NY, USA, 2023; pp. 1–2. [Google Scholar]
  15. Rafique, W.; Qadir, J. Internet of everything meets the metaverse: Bridging physical and virtual worlds with blockchain. Comput. Sci. Rev. 2024, 54, 100678. [Google Scholar] [CrossRef]
  16. Markopoulos, P.; Markopoulos, E.; Nandi, A.; Kantola, J. Integrating Digital Twins Into the Metaverse for Dynamic and Computer-Human Interactive Building Information Modelling. Sustain. Constr. Era Fourth Ind. Revolut. 2024, 149, 11–22. [Google Scholar]
  17. Stary, C. Digital process twins as intelligent design technology for engineering Metaverse/XR applications. Sustainability 2023, 15, 16062. [Google Scholar] [CrossRef]
  18. Picone, M.; Mariani, S.; Virdis, A.; Castagnetti, P. Digital Twin & Blockchain: Technology Enablers for Metaverse Computing. In Proceedings of the 2023 IEEE International Conference on Metaverse Computing, Networking and Applications (MetaCom), Kyoto, Japan, 26–28 June 2023; IEEE: New York City, NY, USA, 2023; pp. 1–8. [Google Scholar]
  19. Broo, D.G.; Bravo-Haro, M.; Schooling, J. Design and implementation of a smart infrastructure digital twin. Autom. Constr. 2022, 136, 104171. [Google Scholar] [CrossRef]
  20. Zahedi, F.; Alavi, H.; Sardroud, J.M.; Dang, H. Digital twins in the sustainable construction industry. Buildings 2024, 14, 3613. [Google Scholar] [CrossRef]
  21. Li, Y. AI-enhanced digital twins for energy efficiency and carbon footprint reduction in smart city infrastructure. Appl. Comput. Eng. 2025, 118, 42–47. [Google Scholar] [CrossRef]
  22. Alibrandi, U. Risk-informed digital twin of buildings and infrastructures for sustainable and resilient urban com-munities. ASCE-ASME J. Risk Uncertain. Eng. Syst. Part A Civ. Eng. 2022, 8, 04022032. [Google Scholar] [CrossRef]
  23. Chávez, C.A.G.; Bärring, M.; Frantzén, M.; Annepavar, A.; Gopalakrishnan, D.; Johansson, B. Achieving sustainable manufacturing by embedding sustainability kpis in digital twins. In Proceedings of the 2022 Winter Simulation Conference (WSC), Singapore, 11–14 December 2022; IEEE: New York City, NY, USA, 2022; pp. 1683–1694. [Google Scholar]
  24. Klar, R.; Angelakis, V. Linking Ports’ Digital Twins to Those of Cities. In Proceedings of the 2023 IEEE Smart World Congress (SWC), Portsmouth, UK, 28–31 August 2023; IEEE: New York City, NY, USA, 2023; pp. 1–8. [Google Scholar]
  25. Prandi, C.C.J.M.; Manzoni, P.; Peña-Haro, S.; Pierson, D.; Colom, W.; Senent, J. On integrating intelligent infrastructure and participatory monitoring for environmental modelling: The SMARTLAGOON approach. In Proceedings of the 2022 ACM Conference on Information Technology for Social Good, Limassol, Cyprus, 7–9 September 2022; pp. 236–243. [Google Scholar]
  26. Stipanovic, I.; Palic, S.S.; Casas, J.R.; Chacón, R.; Ganic, E. Inspection and maintenance KPIs to support decision making integrated into Digital Twin tool. Proc. Civ. Eng. 2023, 6, 1234–1241. [Google Scholar] [CrossRef]
  27. Yu, G.; Ye, X.; Xia, X.; Chen, Y. Digital twin enabled transition towards the smart electric vehicle charging in-frastructure: A review. Sustain. Cities Soc. 2024, 108, 105479. [Google Scholar] [CrossRef]
  28. Li, H.; Hong, T.; Lee, S.; Sofos, M. System-Level Key Performance Indicators for Building Performance Evaluation. Energy Build. 2020, 209, 109703. [Google Scholar] [CrossRef]
  29. Tennakoon, A.; Hewapathirana, D.; Jayathunga, R.; Dulani, H. A Guide for Carbon Footprint Assessment; The Climate Change Secretariat Ministry of Mahaweli Development and Environment: Battaramulla, Sri Lanka, 2016. [Google Scholar]
  30. Basu, P. Biomass Gasification, Pyrolysis and Torrefaction: Practical Design and Theory; Academic Press: Boston, MA, USA, 2018; ISBN 0-12-813040-7. [Google Scholar]
  31. Salom, J.; Marszal, A.; Widén, J.; Candanedo, J.; Lindberg, K. Analysis of Load Match and Grid Interaction Indicators in Net Zero Energy Buildings with Simulated and Monitored Data. Appl. Energy 2014, 136, 119–131. [Google Scholar] [CrossRef]
  32. Salom, J.; Widén, J.; Candanedo, J.; Sartori, I.; Voss, K.; Marszal, A. Understanding Net Zero Energy Buildings: Evaluation of Load Matching and Grid Interaction Indicators. In Proceedings of the Building Simulation, Sydney, Australia, 14–16 November 2011; Volume 6, pp. 2514–2521. [Google Scholar]
  33. Ala-Juusela, M.; Crosbie, T.; Hukkalainen, M. Defining and Operationalising the Concept of an Energy Positive Neighbourhood. Energy Convers. Manag. 2016, 125, 133–140. [Google Scholar] [CrossRef]
  34. Verbruggen, B.; Driesen, J. Grid Impact Indicators for Active Building Simulations. IEEE Trans. Sustain. Energy 2014, 6, 43–50. [Google Scholar] [CrossRef]
  35. Arteconi, A.; Polonara, F. Assessing the Demand Side Management Potential and the Energy Flexibility of Heat Pumps in Buildings. Energies 2018, 11, 1846. [Google Scholar] [CrossRef]
  36. Le Dréau, J.; Heiselberg, P. Energy Flexibility of Residential Buildings Using Short Term Heat Storage in the Thermal Mass. Energy 2016, 111, 991–1002. [Google Scholar] [CrossRef]
  37. Junker, R.; Azar, A.; Lopes, R.; Lindberg, K.; Reynders, G.; Relan, R.; Madsen, H. Characterizing the Energy Flexibility of Buildings and Districts. Appl. Energy 2018, 225, 175–182. [Google Scholar] [CrossRef]
  38. Kathirgamanathan, A.; Péan, T.; Zhang, K.; De Rosa, M.; Salom, J.; Kummert, M.; Finn, D. Towards Standardising Market-Independent Indicators for Quantifying Energy Flexibility in Buildings. Energy Build. 2020, 220, 110027. [Google Scholar] [CrossRef]
  39. Dovolil, P.; Svítek, M. Integrating ESG into the Smart City concept with focus on transport. In Proceedings of the 2024 Smart City Symposium Prague (SCSP), Prague, Czech Republic, 23–24 May 2024; IEEE: New York City, NY, USA, 2024; pp. 1–7. [Google Scholar]
  40. Barykin, S.E.; Strimovskaya, A.V.; Sergeev, S.M.; Borisoglebskaya, L.N.; Dedyukhina, N.; Sklyarov, I.; Saychenko, L. Smart city logistics on the basis of digital tools for ESG goals achievement. Sustainability 2023, 15, 5507. [Google Scholar] [CrossRef]
  41. Englezos, D.; Hadjidemetriou, L.; Papadopoulos, P.; Timotheou, S.; Polycarpou, M.; Panayiotou, C. A digital twin architecture for smart buildings. In Proceedings of the 2022 IEEE International Smart Cities Conference (ISC2), Paphos, Cyprus, 26–29 September 2022; IEEE: New York City, NY, USA, 2022; pp. 1–7. [Google Scholar]
  42. Hadjidemetriou, L.; Stylianidis, N.; Englezos, D.; Papadopoulos, P.; Eliades, D.; Timotheou, S.; Panayiotou, C. A digital twin architecture for real-time and offline high granularity analysis in smart buildings. Sustain. Cities Soc. 2023, 98, 104795. [Google Scholar] [CrossRef]
  43. Shaharuddin, S.; Abdul Maulud, K.N.; Syed Abdul Rahman, S.A.F.; Che Ani, A.I. Digital twin for indoor disaster in smart city: A systematic review. Int. Arch. Photogramm. Remote Sens. Spat. Inf. Sci. 2022, 46, 315–322. [Google Scholar] [CrossRef]
  44. Yitmen, I.; Almusaed, A.; Hussein, M.; Almssad, A. AI-Driven Digital Twins for Enhancing Indoor Environmental Quality and Energy Efficiency in Smart Building Systems. Buildings 2025, 15, 1030. [Google Scholar] [CrossRef]
  45. Lo, C.K. The Application of Digital Twin for Indoor Air Quality Management: A Case Study in Hong Kong. J. Sustain. Built Environ. 2025, 2, 11–22. [Google Scholar] [CrossRef]
  46. Saleh, S.; Abohamama, A.S.; Tolba, A.S. Intelligent Real-Time Air Quality Index Classification for Smart Home Digital Twins. Int. J. Adv. Comput. Sci. Appl. 2025, 16, 309–323. [Google Scholar] [CrossRef]
  47. Ariansyah, D.; Isnan, M.; Rahutomo, R.; Pardamean, B. Digital twin (DT) smart city for air quality management. Procedia Comput. Sci. 2023, 227, 524–533. [Google Scholar] [CrossRef]
  48. Venkateswarlu, N.; Sathiyamoorthy, M. Sustainable innovations in digital twin technology: A systematic review about energy efficiency and indoor environment quality in built environment. Front. Built Environ. 2025, 11, 1523464. [Google Scholar] [CrossRef]
  49. Peng, G.; Li, J.; Chen, Y.; Norizan, A.; Tay, L. High-Resolution Surface Relative Humidity Computation Using MODIS Image in Peninsular Malaysia. Chin. Geogr. Sci. 2006, 16, 260–264. [Google Scholar] [CrossRef]
  50. Kirešová, S.; Guzan, M. Measurement of Particulate Matter: Principles and Options of Measurement at Present. Acta Electrotech. Et Inform. 2022, 22, 8–18. [Google Scholar] [CrossRef]
  51. Vasudevan, J.; Coakley, D.; Angelopoulos, C.; Rastogi, P.; Sobek, O.; Jephson, G.; Eftekhari, M.; Dimitriou, V. Monitoring Indoor Environmental Quality (IEQ) in Buildings with Distributed Sensing; AIVC: Ghent, Belgium, 2023. [Google Scholar]
  52. Lu, X.; Lu, T.; Viljanen, M. Estimation of Space Air Change Rates and CO2 Generation Rates for Mechanically-Ventilated Buildings. In Advances in Computer Science and Engineering; IntechOpen: London, UK, 2011; pp. 237–260. [Google Scholar]
  53. Raouf, A.; Al-Ghamdi, S. Effect of R-Values Changes in the Baseline Codes: Embodied Energy and Environmental Life Cycle Impacts of Building Envelopes. Energy Rep. 2020, 6, 554–560. [Google Scholar] [CrossRef]
  54. Islam, S.; Bhat, G. Environmentally-Friendly Thermal and Acoustic Insulation Materials from Recycled Textiles. J. Environ. Manag. 2019, 251, 109536. [Google Scholar] [CrossRef]
  55. Andrade, Á.; Restrepo, A.; Tibaquirá, J. EER or Fcsp: A Performance Analysis of Fixed and Variable Air Conditioning at Different Cooling Thermal Conditions. Energy Rep. 2021, 7, 537–545. [Google Scholar] [CrossRef]
  56. Johra, H. Overview of the Coefficient of Performance (COP) for Conventional Vapour-Compression Heat Pumps in Buildings; Department of the Built Environment, Aalborg University: Aalborg, Denmark, 2022. [Google Scholar]
  57. Wu, W.; Fu, Y.; Wang, Z.; Liu, X.; Niu, Y.; Li, B.; Huang, G.Q. Consortium blockchain-enabled smart ESG reporting platform with token-based incentives for corporate crowdsensing. Comput. Ind. Eng. 2022, 172, 108456. [Google Scholar] [CrossRef]
  58. Zhang, S. Impact of Urban Digital Economy on ESG Performance: Do Technological and Business Model Innovation Matter. Innov. Econ. Front. 2025, 28, 14–30. [Google Scholar] [CrossRef]
  59. Hämäläinen, M. Smart city development with digital twin technology. In Proceedings of the 33rd Bled eConference-Enabling Technology for a Sustainable Society, Online, 28–29 June 2020. [Google Scholar]
  60. de Trizio, F.; Sciddurlo, G.; Cianci, I.; Piro, G.; Boggia, G. Optimizing key value indicators in intent-based networks through digital twins aided service orchestration mechanisms. Comput. Commun. 2024, 228, 107977. [Google Scholar] [CrossRef]
  61. Hu, L. Research on the application of Digital Twin in smart cities. Adv. Econ. Manag. Political Sci. 2023, 42, 14–20. [Google Scholar] [CrossRef]
  62. Ardebili, A.A.; Martella, C.; Longo, A.; Rucco, C.; Izzi, F.; Ficarella, A. IoT-Driven Resilience Monitoring: Case Study of a Cyber-Physical System. Appl. Sci. 2025, 15, 2092. [Google Scholar] [CrossRef]
  63. Hien, T.T.; Hanh, P.T.S. The direct effect of ESG reporting on firm performance: Empirical evidence from global firms during the early years of the green and digital twin transition. VNU Univ. Econ. Bus. 2024, 4, 1–12. [Google Scholar] [CrossRef]
  64. Becattini, M.; Fontani, G.; Paroli, L.; Iera, A. Digital Twin Networks for Sustainable In-network Computing in Future 6G Networks. In Proceedings of the 2024 IEEE 35th International Symposium on Personal, Indoor and Mobile Radio Communications (PIMRC), Valencia, Spain, 2–5 September 2024; IEEE: New York City, NY, USA, 2024; pp. 1–6. [Google Scholar]
  65. Zhang, M.; Yang, W.; Zhao, Z.; Pratap, S.; Wu, W.; Huang, G.Q. Is digital twin a better solution to improve ESG evaluation for vaccine logistics supply chain: An evolutionary game analysis. Oper. Manag. Res. 2023, 16, 1791–1813. [Google Scholar] [CrossRef]
  66. Suna, D.; Haas, R. How to Calculate Energy Savings and Costs of Energy Saving Obligations in a Harmonized Way. In Proceedings of the ECEEE Summer Study 2013, Toulon/Hyères, France, 3–8 June 2013. [Google Scholar]
  67. Hu, Y.; Chen, Y.; Tang, S.; Feng, L.; Huang, C. An Explanation of Energy Return on Investment From an Entropy Perspective. Front. Energy Res. 2021, 9, 633528. [Google Scholar] [CrossRef]
  68. Perpiñan, O.; Lorenzo, E.; Castro, M.; Eyras, R. Energy Payback Time of Grid Connected PV Systems: Comparison between Tracking and Fixed Systems. Prog. Photovolt. Res. Appl. 2009, 17, 137–147. [Google Scholar] [CrossRef]
  69. Thanos, G.; Minou, M.; Ganu, T.; Arya, V.; Chakraborty, D.; van Deventer, J.; Stamoulis, G. Evaluating Demand Response Programs by Means of Key Performance Indicators. In Proceedings of the 2013 Fifth International Conference on Communication Systems and Networks (COMSNETS), Bangalore, India, 7–10 January 2013; IEEE: New York City, NY, USA, 2013; pp. 1–6. [Google Scholar]
  70. Anna, R.; Simone, M.; Claudio, Z.; Giorgio, F. Key Performance Indicators of ‘Good Practices’ of Energy Efficiency in Industry: Application to Real Cases in Italy and in the European Union. Int. J. Energy Prod. Manag. 2017, 2, 239–250. [Google Scholar] [CrossRef][Green Version]
  71. Zhang, T.; Dornfeld, D. Energy Use per Worker-Hour: Evaluating the Contribution of Labor to Manufacturing Energy Use. In Proceedings of the Advances in Life Cycle Engineering for Sustainable Manufacturing Businesses: Proceedings of the 14th CIRP Conference on Life Cycle Engineering, Tokyo, Japan, 11–13 June 2007; pp. 189–193. [Google Scholar]
  72. Faria, P.; Lezama, F.; Vale, Z.; Khorram, M. A methodology for energy key performance indicators analysis. Energy Inform. 2021, 4, 6. [Google Scholar] [CrossRef]
  73. Alrashed, S. Key performance indicators for Smart Campus and Microgrid. Sustain. Cities Soc. 2020, 60, 102264. [Google Scholar] [CrossRef]
  74. Bandoria, L.H.; Cortes, B.; de Almeida, M.C. Statistical characterization of electricity use profile: Leveraging data analytics for stochastic simulation in a smart campus. Energy Build. 2024, 324, 114934. [Google Scholar] [CrossRef]
  75. Koutras, K.; Bompotas, A.; Halkiopoulos, C.; Kalogeras, A.; Alexakos, C. Dimensionality Reduction on IoT Monitoring Data of Smart Building for Energy Consumption Forecasting. In Proceedings of the 2023 IEEE International Smart Cities Conference (ISC2), Bucharest, Romania, 24–27 September 2023; IEEE: New York City, NY, USA, 2023; pp. 1–6. [Google Scholar]
  76. Ho, M.Y.; Lai, J.H.; Hou, H.; Zhang, D. Key performance indicators for evaluation of commercial building retrofits: Shortlisting via an industry survey. Energies 2021, 14, 7327. [Google Scholar] [CrossRef]
  77. Mustapha, Z.; Abilgah, T.; Tieru, C.K. Enhancing energy efficiency and management in smart buildings: A Holistic approach. J. Appl. Sci. Technol. Trends 2025, 6, 16–24. [Google Scholar] [CrossRef]
  78. Kumar, S.S.; Usha, P.; Balakrishnan, P.; Kannan, V.K.; Manjula, M.; Vijayakumar, M. Deep Learning Driven Engineering Innovations: Advancing Sustainable Green Building and Smart Infrastructure for a Resilient Future. In Proceedings of the 2024 First International Conference for Women in Computing (InCoWoCo), Pune, India, 14–15 November 2024; pp. 1–5. [Google Scholar]
  79. Romanska-Zapala, A.; Dudek, P.; Górny, M.; Dudzik, M. Modular statistical system for an integrated environmental control. E3S Web Conf. 2020, 172, 19006. [Google Scholar] [CrossRef]
  80. Hakawati, B.; Mousa, A.; Draidi, F. Smart energy management in residential buildings: The impact of knowledge and behavior. Sci. Rep. 2024, 14, 1702. [Google Scholar] [CrossRef]
  81. Arias-Requejo, D.; Pulido, B.; Keane, M.M.; Alonso-González, C.J. Clustering and deep-learning for energy consumption forecast in smart buildings. IEEE Access 2023, 11, 128061–128080. [Google Scholar] [CrossRef]
  82. Wang, Q. Correlation Analysis of ESG Ratings and Enterprise Performance. Asia Pac. Econ. Manag. Rev. 2024, 1, 57–63. [Google Scholar] [CrossRef]
  83. Eskantar, M.; Zopounidis, C.; Doumpos, M.; Galariotis, E.; Guesmi, K. Navigating ESG complexity: An in-depth analysis of sustainability criteria, frameworks, and impact assessment. Int. Rev. Financ. Anal. 2024, 95, 103380. [Google Scholar] [CrossRef]
  84. Handoko, S.; Afifudin, A.; Holili, M.H. The Strategic Integration of ESG Metrics in Performance Evaluation: Insights from Management Accounting Practices. J. Manag. Inform. 2024, 3, 141–156. [Google Scholar] [CrossRef]
  85. Hou, Z.; Li, D.; Jin, F.; Zhang, Y.; Luo, W. Green supply chain knowledge networks and corporate ESG performance: The role of green technology innovation and knowledge integration capability. Int. J. Prod. Res. 2025, 63, 4306–4327. [Google Scholar] [CrossRef]
  86. Zhou, L. Trustworthy digital twinning data platform for power infrastructure construction projects using blockchain and semantic web. Front. Built Environ. 2024, 10, 1440513. [Google Scholar] [CrossRef]
  87. Du, Q.; Sun, Z.; Goodell, J.W.; Du, A.M.; Yang, T. Ecological risk and corporate sustainability: Examining ESG performance, risk management, and productivity. Int. Rev. Financ. Anal. 2024, 96, 103551. [Google Scholar] [CrossRef]
  88. Wang, Y. A Study Of LYFEN’S ESG Disclosure and Its Impact on Corporate Performance. In Highlights in Business, Economics and Management; Darcy & Roy Press Co., Ltd.: Hillsboro, OR, USA, 2024; Volume 40, pp. 391–397. [Google Scholar]
  89. Ioannidis, E.; Tsoumaris, D.; Ntemkas, D.; Sarikeisoglou, I. Correlations of ESG ratings: A signed weighted network analysis. AppliedMath 2022, 2, 638–658. [Google Scholar] [CrossRef]
  90. Loukılı, M.; Benlı, V.F. Elaborating ESG criteria in investments. Press. Procedia 2023, 17, 228–229. [Google Scholar]
  91. Sorathiya, A.; Saval, P.; Sorathiya, M. Data-driven sustainable investment strategies: Integrating ESG, financial data science, and time series analysis for alpha generation. Int. J. Financ. Stud. 2024, 12, 36. [Google Scholar] [CrossRef]
  92. Cai, J.; Chen, J.; Hu, Y.; Li, S.; He, Q. Digital twin for healthy indoor environment: A vision for the post-pandemic era. Front. Eng. Manag. 2023, 10, 300–318. [Google Scholar] [CrossRef]
  93. Ni, Z.; Zhang, C.; Karlsson, M.; Gong, S. Edge-based Parametric Digital Twins for Intelligent Building Indoor Climate Modeling. In Proceedings of the 2024 IEEE 20th International Conference on Factory Communication Systems (WFCS), Toulouse, France, 17–19 April 2024; IEEE: New York City, NY, USA, 2024; pp. 1–8. [Google Scholar]
  94. Islam, M.B.; Guerrieri, A.; Gravina, R.; Fortino, G. A Deep Learning Based Digital Twin for Indoor Temperature Prediction in Smart Buildings. In Proceedings of the 2024 IEEE Conference on Pervasive and Intelligent Computing (PICom), Boracay Island, Philippines, 5–8 November 2024; IEEE: New York City, NY, USA, 2024; pp. 83–89. [Google Scholar]
  95. Hii, D.J.C.; Hasama, T. Towards the Digital Twinning and Simulation of a Smart Building for Well-Being. In Proceedings of the 2024 Winter Simulation Conference (WSC), Orlando, FL, USA, 15–18 December 2024; IEEE: New York City, NY, USA, 2024; pp. 726–737. [Google Scholar]
  96. Ravid, B.Y.; Aharon-Gutman, M. The social digital twin: The social turn in the field of smart cities. Environ. Plan. B Urban Anal. City Sci. 2023, 50, 1455–1470. [Google Scholar] [CrossRef]
  97. Roda-Sanchez, L.; Cirillo, F.; Solmaz, G.; Jacobs, T.; Garrido-Hidalgo, K.E. Building a smart campus digital twin: System, analytics, and lessons learned from a real-world project. IEEE Internet Things J. 2023, 11, 4614–4627. [Google Scholar] [CrossRef]
  98. Poels, G.; Proper, H.A.; Bork, D. DT4GITM: Vision for a framework for digital twin enabled IT governance. In Proceedings of the 55th Hawaii International Conference on System Sciences, Maui, HI, USA, 4–7 January 2022; pp. 6626–6635. [Google Scholar]
  99. Kljaić, Z.; Grdić, M.; Mlinarić, T.J.; Nikšić, M.; Pavković, D.; Cipek, M. Digital Twin Models with ESG Methodology as a Tool for the Transformation of Cities in the Area of Transport and Energy. In Proceedings of the 2024 47th MIPRO ICT and Electronics Convention (MIPRO), Opatija, Croatia, 20–24 May 2024; IEEE: New York City, NY, USA, 2024; pp. 1937–1942. [Google Scholar]
  100. Elnour, M.; Ahmad, A.M.; Abdelkarim, S.; Fadli, F.; Naji, K. Empowering smart cities with digital twins of buildings: Applications and implementation considerations of data-driven energy modelling in building management. Sustain. Cities Soc. 2024, 69, 102816. [Google Scholar] [CrossRef]
  101. Chungath, J.; Hacks, S. Requirements for a Digital Twin for Energy, Social, and Governance Data of Commercial Buildings. In Proceedings of the International Conference on Business Process Modeling, Development and Support, Limassol, Cyprus, 3–4 June 2024; Springer Nature: Cham, Switzerland, 2024; pp. 341–351. [Google Scholar]
  102. Cureton, P.; Dunn, N. Digital twins of cities and evasive futures. In Shaping Smart for Better Cities; Academic Press: Boston, MA, USA, 2021; pp. 267–282. [Google Scholar]
  103. Pileggi, P.; Lazovik, E.; Broekhuijsen, J.; Borth, M.; Verriet, J. Lifecycle governance for effective digital twins: A joint systems engineering and IT perspective. In Proceedings of the 2020 IEEE International Systems Conference (SysCon), Montreal, QC, Canada, 24 August–20 September 2020; IEEE: New York City, NY, USA, 2020; pp. 1–8. [Google Scholar]
  104. Lv, Z.; Cheng, C.; Lv, H. Digital twins for secure thermal energy storage in building. Appl. Energy 2023, 338, 120907. [Google Scholar] [CrossRef]
  105. Yue, A.; Mao, C.; Zhao, S. Smart governance of urban ecological environment driven by digital twin technology: A case study on the ecological restoration and management in s island of chongqing. IOP Conf. Ser. Earth Environ. Sci. 2022, 1101, 072003. [Google Scholar] [CrossRef]
  106. Hartmann, M.; Pawelzik, S.; Wimmer, M.A. Comparative Analysis of Digital Twins in Smart Cities. In Proceedings of the EGOV-CeDEM-ePart Conference, Ghent University and KU Leuven, Ghent/Leuven, Belgium, 1–5 September 2023. [Google Scholar]
  107. Cranford, R. Conceptual application of digital twins to meet ESG targets in the mining industry. Front. Ind. Eng. 2023, 1, 1223989. [Google Scholar] [CrossRef]
  108. Dou, X.; Yin, S. The impact of ESG on corporate financial performance: Based on fixed effects regression model. J. Comput. Methods Sci. Eng. 2024, 24, 2719–2731. [Google Scholar] [CrossRef]
  109. Liu, X.; Liao, K.T.; Wang, J.; Wu, S.; Su, Y. Topic mining and evolution analysis of digital governance in Chinese enterprises based on the BERTopic model. Chin. Manag. Stud. 2025. [Google Scholar] [CrossRef]
  110. Guo, Y.; Chen, C.; Luo, X.; Martek, I. Critical drivers and barriers of digital twin adoption in water infrastructure: An environmental, social, governance, and financial perspective. Sustain. Dev. 2025, 33, 1623–1648. [Google Scholar] [CrossRef]
  111. Su, J.; Sun, Y. An improved TOPSIS model based on cumulative prospect theory: Application to ESG performance evaluation of state-owned mining enterprises. Sustainability 2023, 15, 10046. [Google Scholar] [CrossRef]
  112. Chen, D.; Lin, H. Study on the impact of ESG performance on financial performance of firms based on multiple linear regression models. In Proceedings of the 2023 IEEE 3rd International Conference on Social Sciences and Intelligence Management (SSIM), Taichung, Taiwan, 15–17 December 2023; pp. 320–323. [Google Scholar]
  113. Berman, S.L.; Wicks, A.C.; Kotha, S.; Jones, T.M. Does stakeholder orientation matter? The relationship between stakeholder management models and firm financial performance. Acad. Manag. J. 1999, 42, 488–506. [Google Scholar] [CrossRef]
  114. Lai, K.E.; Rahiman, N.A.; Othman, N.; Ali, K.N.; Lim, Y.W.; Moayedi, F.; Dzahir, M.A.M. Quantification process of carbon emissions in the construction industry. Energy Build. 2023, 289, 113025. [Google Scholar] [CrossRef]
  115. Ascione, F.; De Masi, R.F.; Mastellone, M.; Vanoli, G. Building rating systems: A novel review about capabilities, current limits and open issues. Sustain. Cities Soc. 2022, 76, 103498. [Google Scholar] [CrossRef]
  116. Zhou, H.; Ji, S.; Zhang, Q.; Jin, W.; Feng, A.; Lin, C.; Li, Q. Wastewater treatment: A universal, scalable and recyclable catalyst with adjustable activity for diverse dyes degradation. J. Environ. Manag. 2023, 330, 117188. [Google Scholar] [CrossRef]
  117. Bonab, A.B.; Bellini, F.; Rudko, I. Theoretical and analytical assessment of smart green cities. J. Clean. Prod. 2023, 410, 137315. [Google Scholar] [CrossRef]
  118. Ma, S.; Huang, Y.; Liu, Y.; Kong, X.; Yin, L.; Chen, G. Edge-cloud cooperation-driven smart and sustainable production for energy-intensive manufacturing industries. Appl. Energy 2023, 337, 120843. [Google Scholar] [CrossRef]
  119. Hu, L.; Lu, S. Comparison of Thermal Comfort Models Based on Principal Component Analysis and Ant Colony Optimization. In Proceedings of the 2024 2nd International Conference on Artificial Intelligence and Automation Control (AIAC), Guangzhou, China, 20–22 December 2024; IEEE: New York City, NY, USA, 2024; pp. 67–70. [Google Scholar]
  120. Bezrukov, A.; Sadovnikova, N.; Lebedinskaya, O. Incorporating the Current Tendencies and Condition of the Financial Market of Russian Federation into Regional Cluster Modelling upon Principal Factor Analysis of Government Bonds. SSRN 2022, 4265198. [Google Scholar] [CrossRef]
  121. Pandhare, V.; Negri, E.; Ragazzini, L.; Cattaneo, L.; Macchi, M.; Lee, J. Digital twin-enabled robust production scheduling for equipment in degraded state. J. Manuf. Syst. 2024, 74, 841–857. [Google Scholar] [CrossRef]
  122. Zhang, Z.; Yu, J.; Tian, J. Community participation, social capital cultivation and sustainable community renewal: A case study from Xi’an’s southern suburbs, China. J. Knowl. Econ. 2024, 15, 11007–11040. [Google Scholar] [CrossRef]
  123. Inala, K.P.; Teja, K.K.; Reddy, K.S.; Archana, K. Optimal Load Prediction in a Smart Metering Network Using Random Forest Algorithm. In Proceedings of the 2024 Third International Conference on Power, Control and Computing Technologies (ICPC2T), Raipur, India, 18–20 January 2024. [Google Scholar]
  124. Ji, C.; Niu, Y. A hybrid evolutionary and machine learning approach for smart city planning: Digital twin approach. Sustain. Energy Technol. Assess. 2024, 64, 103650. [Google Scholar] [CrossRef]
  125. Ukwuoma, H.C.; Dusserre, G.; Coatrieux, G.; Vincent, J.; Ahmed, N.B. Optimising Intrusion Detection in Cyber-Physical Systems. In Proceedings of the 2024 8th Cyber Security in Networking Conference (CSNet), Paris, France, 4–6 December 2024; IEEE: New York, NY, USA, 2024; pp. 7–14. [Google Scholar]
  126. Vasilica, B.V.; Anton, F.D.; Pietraru, R.; Anton, S.O.; Chiriac, B.N. Enhancing Security in Smart Robot Digital Twins Through Intrusion Detection Systems. Appl. Sci. 2025, 15, 4596. [Google Scholar] [CrossRef]
  127. Du, Z. Prediction of Building Energy Consumption Based on LSTM-SVR-Random Forest Hybrid Model. Appl. Comput. Eng. 2024, 115, 75–85. [Google Scholar] [CrossRef]
  128. Kinshakov, E.; Parfenenko, Y.; Shendryk, V. Comparative analysis of methods for prediction continuous numerical features on big datasets. Technol. Audit. Prod. Reserves 2021, 6, 15–17. [Google Scholar] [CrossRef]
  129. Miao, Y.; Xu, Y. Random Forest-Based Analysis of Variability in Feature Impacts. In Proceedings of the 2024 IEEE 2nd International Conference on Image Processing and Computer Applications (ICIPCA), Shenyang, China, 28–30 June 2024; IEEE: New York City, NY, USA, 2024; pp. 1130–1135. [Google Scholar]
  130. Orlenko, A.; Moore, J.H. Improving the interpretability of random forest models of genetic association in the presence of non-additive interactions. Res. Sq. 2020. [Google Scholar] [CrossRef]
  131. Yu, F.; Wei, C.; Deng, P.; Peng, T.; Hu, X. Deep exploration of random forest model boosts the interpretability of machine learning studies of complicated immune responses and lung burden of nanoparticles. Sci. Adv. 2021, 7, eabf4130. [Google Scholar] [CrossRef]
  132. Li, W.; Xu, X. A hybrid evolutionary and machine learning approach for smart building: Sustainable building energy management design. Sustain. Energy Technol. Assess. 2024, 65, 103709. [Google Scholar] [CrossRef]
  133. Gaur, L.; Singh, G.; Solanki, A.; Jhanjhi, N.Z.; Bhatia, U.; Sharma, S.; Kim, W. Disposition of youth in predict-ing sustainable development goals using the neuro-fuzzy and random forest algorithms. Hum.-Centric Comput. Inf. Sci. 2021, 12, 11. [Google Scholar]
  134. Li, G.; Jiang, L. Random Forest Algorithm-based Modelling and Neural Network Analysis Between Social Anxiety Disorder of Childhood and Parents’ Socioeconomic Attributes. In Proceedings of the 2023 IEEE 6th Eurasian Conference on Educational Innovation (ECEI), Singapore, 3–5 February 2023; pp. 222–225. [Google Scholar]
  135. Khan, Z.; Vora, N. Predicting Consumer Shifts to Sustainable Products using Machine Learning Models. J. Inf. Technol. Digit. World 2024, 6, 302–316. [Google Scholar] [CrossRef]
  136. Xu, Y. Design of human resource allocation algorithm based on improved random forest. In Proceedings of the 2021 International Conference on Aviation Safety and Information Technology, Changsha, China, 18–20 December 2021; pp. 656–661. [Google Scholar]
  137. Chowdhury, M.A.F.; Abdullah, M.; Azad, M.A.K.; Sulong, Z.; Islam, M.N. Environmental, social and governance (ESG) rating prediction using machine learning approaches. Ann. Oper. Res. 2023, 1–25. [Google Scholar] [CrossRef]
  138. Lou, X. Evaluation of College Students’ Innovation and Entrepreneurship Abilities in the New Media Environment Using Tree Soft Set and Neutrosophic Modeling. Neutrosophic Sets Syst. 2025, 85, 22. [Google Scholar]
  139. Ozdemir, G.; Kuzlu, M.; Catak, F.O. Machine learning insights into forecasting solar power generation with explainable AI. Electr. Eng. 2025, 107, 7329–7350. [Google Scholar] [CrossRef]
  140. Drobnič, F.; Kos, A.; Pustišek, M. On the interpretability of machine learning models and experimental feature selection in case of multicollinear data. Electronics 2020, 9, 761. [Google Scholar] [CrossRef]
  141. Akhtar, K.; Yaseen, M.U.; Imran, M.; Khattak, S.B.A.; Nasralla, M.M. Predicting inmate suicidal behavior with an interpretable ensemble machine learning approach in smart prisons. PeerJ Comput. Sci. 2024, 10, e2051. [Google Scholar] [CrossRef]
  142. Wang, X. Construction and optimization of enterprise ESG performance evaluation model based on support vector machine. In Proceedings of the Second International Conference on Big Data, Computational Intelligence, and Applications (BDCIA 2024), Huanggang, China, 15–17 November 2024; SPIE: Bellingham, WA, USA, 2025; Volume 13550, pp. 748–754. [Google Scholar]
  143. Wu, Z.; Yang, L.; Fei, Y.; Wang, X. Regularization methods for sparse ESG-valued multi-period portfolio optimization with return prediction using machine learning. Expert Syst. Appl. 2023, 232, 120850. [Google Scholar] [CrossRef]
  144. Lin, H.Y.; Hsu, B.W. Empirical study of ESG score prediction through machine learning—A case of non-financial companies in Taiwan. Sustainability 2023, 15, 14106. [Google Scholar] [CrossRef]
  145. Koseoglu, M.A.; Arici, H.E.; Saydam, M.B.; Olorunsola, V.O. Predictive roles of environment, social, and governance scores on firms’ diversity: A machine learning approach. Nankai Bus. Rev. Int. 2025, 16, 284–306. [Google Scholar] [CrossRef]
  146. Suprihadi, E.; Danila, N. Forecasting ESG stock indices using a machine learning approach. Glob. Bus. Rev. 2024, 09721509241234033. [Google Scholar] [CrossRef]
  147. Aloqaily, M.; Bouachir, O.; Karray, F.; Al Ridhawi, I.; El Saddik, A. Integrating digital twin and advanced intelligent technologies to realize the metaverse. IEEE Consum. Electron. Mag. 2022, 12, 47–55. [Google Scholar] [CrossRef]
  148. Lyu, Z.; Fridenfalk, M. Digital twins for building industrial metaverse. J. Adv. Res. 2024, 66, 31–38. [Google Scholar] [CrossRef]
  149. Li, X.; Yang, Y.; Xie, B.; He, Z.; Chen, J.; Gan, W. AI-Driven Metaverse Digital Twin Cities: Prototype Platform Design for Integrated Virtual Urban Ecosystems and Services. In Proceedings of the 2024 3rd International Conference on Automation, Robotics and Computer Engineering (ICARCE), Virtual, 17–18 December 2024; IEEE: New York City, NY, USA, 2024; pp. 393–399. [Google Scholar]
  150. Ruiu, P.; Nitti, M.; Pilloni, V.; Cadoni, M.; Grosso, E.; Fadda, M. Metaverse & human digital twin: Digital identity, biometrics, and privacy in the future virtual worlds. Multimodal Technol. Interact. 2024, 8, 48. [Google Scholar] [CrossRef]
  151. Zainab; Bawanay, N.Z. Digital Twin, Metaverse and Smart Cities in a Race to the Future. In Proceedings of the 2023 24th International Arab Conference on Information Technology (ACIT), Ajman, United Arab Emirates, 6–8 December 2023; IEEE: New York, NY, USA, 2023; pp. 1–8. [Google Scholar]
  152. Stefko, R.; Michalikova, K.F.; Strakova, J.; Novak, A. Digital twin-based virtual factory and cyber-physical production systems, collaborative autonomous robotic and networked manufacturing technologies, and enterprise and business intelligence algorithms for industrial metaverse. Equilibrium 2025, 20, 389–425. [Google Scholar] [CrossRef]
  153. Farsangi, E.N.; Shehata, A.O.; Rashidi, M.; Ghassempour, N.; Mirjalili, S. Transitioning from BIM to digital twin to metaverse. Front. Built Environ. 2024, 10, 1486423. [Google Scholar] [CrossRef]
  154. Mahariya, S.K.K.A.; Singh, R.; Gehlot, A.; Akram, S.V.; Twala, B.; Priyadarshi, N. Smart campus 4.0: Digitalization of university campus with assimilation of industry 4.0 for innovation and sustainability. J. Adv. Res. Appl. Sci. Eng. Technol. 2023, 32, 120–138. [Google Scholar] [CrossRef]
  155. Hassani, H.; Huang, X.; MacFeely, S. Enabling digital twins to support the UN SDGs. Big Data Cogn. Comput. 2022, 6, 115. [Google Scholar] [CrossRef]
  156. Hernandez, M.S.; Sentosa, I.; Gaudreault, F.; Davison, I.; Sharin, F.H. The emergence of the metaverse in the digital blockchain economy: Applying the ESG framework for a sustainable future. In Proceedings of the 2023 3rd International Conference on Advance Computing and Innovative Technologies in Engineering (ICACITE), Greater Noida, India, 12–13 May 2023; IEEE: New York, NY, USA, 2023; pp. 1324–1329. [Google Scholar]
  157. Adnan, M.; Ahmed, I.; Iqbal, S.; Fazal, M.R.; Siddiqi, S.J.; Tariq, M. Exploring the convergence of Metaverse, Blockchain, Artificial Intelligence, and digital twin for pioneering the digitization in the envision smart grid 3.0. Comput. Electr. Eng. 2024, 120, 109709. [Google Scholar] [CrossRef]
  158. Park, J.; Choi, W.; Jeong, T.; Seo, J. Digital twins and land management in South Korea. Land Use Policy 2023, 124, 106442. [Google Scholar] [CrossRef]
  159. Trung, D.Q. Keynote talk# 2: From digital twin to metaverse: The role of 6G edge intelligence-based ultra-reliable and low latency communications. In Proceedings of the 2022 RIVF International Conference on Computing and Communication Technologies (RIVF), Ho Chi Minh City, Vietnam, 20–22 December 2022. [Google Scholar]
  160. Duong, T.Q.; Van Huynh, D.; Khosravirad, S.R.; Sharma, V.; Dobre, O.A.; Shin, H. From digital twin to metaverse: The role of 6G ultra-reliable and low-latency communications with multi-tier computing. IEEE Wirel. Commun. 2023, 30, 140–146. [Google Scholar] [CrossRef]
  161. Kuru, K. Metaomnicity: Toward immersive urban metaverse cyberspaces using smart city digital twins. IEEE Access 2023, 11, 43844–43868. [Google Scholar] [CrossRef]
  162. Chambon, A.; Sahli, A.; Rachedi, A.; Mebarki, A. Optimizing iot networks deployment under connectivity constraint for dynamic digital twin. In Proceedings of the 2023 IEEE International Conference on Metaverse Computing, Networking and Applications (MetaCom), Kyoto, Japan, 26–28 June 2023; IEEE: New York City, NY, USA, 2023; pp. 474–480. [Google Scholar]
  163. Jagatheesaperumal, S.K.; Yang, Z.; Yang, Q.; Huang, C.; Xu, W.; Shikh-Bahaei, M.; Zhang, Z. Semantic-aware digital twin for metaverse: A comprehensive review. IEEE Wirel. Commun. 2023, 30, 38–46. [Google Scholar] [CrossRef]
Figure 1. PRISMA-lite flow diagram illustrating the identification, screening, eligibility, and inclusion process of studies retrieved from Scopus (2018–2025) using the query TITLE-ABS-KEY (“metaverse”) AND TITLE-ABS-KEY (“smart building”). The arrows indicate the sequential progression through the PRISMA steps, showing how records move from identification to final inclusion. The colors distinguish the different phases of the process, with green representing identification, screening, and eligibility, and blue highlighting the final inclusion stage.
Systems 13 01083 g001
Figure 2. IoT-Enabled Digital Twin Architecture for ESG Outcomes. Note. This figure illustrates the multi-layered architecture integrating IoT sensor data, digital twin analytics, and metaverse visualization to generate ESG outcomes. IoT sensors capture environmental and comfort data, which are simulated and analyzed in the digital twin layer, visualized in immersive dashboards, and translated into measurable ESG performance indicators. The arrow indicates the directional flow of data and processes from one layer to the next within the architecture.
Systems 13 01083 g002
Figure 3. Validation Framework for ESG-Based Smart Building Model. This framework validates and structures ESG data for Smart Building applications, combining statistical and machine learning methods to ensure data reliability and predictive accuracy. The validated dataset supports testing and prototyping of a management system that integrates metaverse and digital twin technologies for advanced, real-time smart building management. The arrow indicates the sequential flow of the validation process, showing how each analytical phase leads into the next.
Systems 13 01083 g003
Figure 4. Heat Map of the Correlation Matrix for Environmental (E) Factors in the ESG Model. Note: The heat map shows mostly weak to moderate correlations, indicating that the environmental variables are independent and free from multicollinearity. This confirms the dataset’s structural validity and its suitability for integration into digital twin and metaverse-based smart building management models.
Systems 13 01083 g004
Figure 5. Heat Map of the Correlation Matrix for Social (S) Factors in the ESG Model. The heat map shows mostly weak to moderate correlations, indicating that the social variables—related to comfort, air quality, and energy efficiency—are distinct yet interrelated. This confirms the dataset’s internal coherence and its suitability for digital twin-based smart building simulations.
Systems 13 01083 g005
Figure 6. Heat Map of the Correlation Matrix for Governance (G) Factors in the ESG Model. Note: The heat map illustrates the correlations among governance indicators such as cost-effectiveness, capital costs, and system performance. The predominance of light colors indicates weak to moderate relationships, confirming the independence of the variables and the absence of multicollinearity. This validates the dataset’s consistency and its suitability for digital twin-based simulations in smart building governance.
Systems 13 01083 g006
Figure 7. Principal Component Loadings for Environmental (E) Factors in the ESG Model. Note: The figure illustrates the loading values of each environmental indicator (ENCO, CFPT, EMIN, LCF, SCF, LMI, OER, GII, NGI, CAF, OPP, DRS, and FLF) across the principal components (PC1–PC15). The distributed and moderate loading patterns confirm that no single factor dominates the variance, indicating balanced variable contributions and low multicollinearity. This supports the dataset’s structural integrity and validates its suitability for digital twin–based smart building governance modeling within the ESG framework.
Systems 13 01083 g007
Figure 8. Principal Component Loadings for Social (S) Factors in the ESG Model. Note: The figure presents the loading values of social indicators (OCC, HUM, PM2.5, PM10, VOC, ACH, THR, SND, EER, COP, SEF, EUI, and LPD) across the principal components (PC1–PC13). The distribution of moderate and distinct loadings confirms that each factor contributes uniquely to the social dimension. Efficiency variables (EER, COP, SEF) and comfort-related indicators (PM2.5, PM10, HUM) form separate but complementary clusters, validating the dataset’s internal consistency and its suitability for digital twin and metaverse-based smart building governance applications.
Systems 13 01083 g008
Figure 9. Principal Component Loadings for Governance (G) Factors in the ESG Model. Note. The figure displays the loadings of governance-related indicators (CES, EROI, EPBT, CPD, CCF, SPC, REU, and EPWH) across the principal components (PC1–PC8). The results highlight clear structural differentiation among financial, operational, and productivity dimensions. PC1 and PC2 capture cost–efficiency and sustainability trade-offs, while higher components (PC4–PC6) reflect investment and performance dynamics. The balanced distribution of loadings confirms the statistical coherence and multidimensional integrity of the governance dataset, validating its use for digital twin and metaverse-based smart building governance models.
Systems 13 01083 g009
Figure 10. Smart Building Management Framework within Metaverse-Scale Ecosystems. This figure depicts the integration of digital twin interoperability, user-centric virtual reality, and data-driven control in metaverse-scale smart building management. Through real-time virtual interaction and intelligent system feedback, users can monitor, predict, and optimize building performance, enhancing sustainability, efficiency, and user experience in interconnected digital environments.
Systems 13 01083 g010
Figure 11. Environmental Dimension Dashboard—ESG KPI Framework for Smart Building Digital Twin Development. Note: This dashboard represents the Environmental (E) dimension of the ESG KPI Framework—Metaverse-Enhanced Operations, focusing on carbon footprint, renewable energy use, and energy efficiency. The displayed KPIs—such as 453.75 tCO2e, 57.4% renewable energy, and 0.0249 tCO2/kWh emission intensity—demonstrate strong environmental performance. The Energy Flow and Load Shifting charts visualize real-time energy dynamics, supporting the digital twin prototype for sustainable and intelligent building management.
Systems 13 01083 g011
Figure 12. Social Dimension Dashboard—ESG KPI Framework for Digital Twin and Metaverse-Based Smart Building Management. This dashboard focuses exclusively on the Social (S) dimension of the ESG framework, illustrating KPIs that measure comfort, health, and indoor environmental quality. Indicators such as PM2.5 (11.4 µg/m3), VOC (20 ppb), Sound Insulation (35.6 dB), and System Efficiency (86.0%) provide quantifiable insight into occupant well-being. These data, integrated within the digital twin and metaverse-based prototype, form the basis for predictive, interactive, and human-centered smart building governance.
Systems 13 01083 g012
Figure 13. Governance Dimension Dashboard—ESG KPI Framework for Metaverse-Enhanced Smart Building Management. This dashboard focuses on the Governance (G) dimension of the ESG KPI Framework—Metaverse-Enhanced Operations, highlighting financial transparency and investment efficiency. KPIs such as Energy ROI (26,022.0), Payback Time (0.8 yrs), and Subsidies (52.6%) demonstrate strong economic performance, while the 15-Year Cash Flow Projection confirms long-term financial sustainability within the digital twin and metaverse-based governance model. The red dashed line represents the financial break-even threshold, indicating the point at which the project fully recovers its initial costs.
Systems 13 01083 g013
Table 1. Overview of the five peer-reviewed studies identified through the Scopus search (“metaverse” AND “smart building”), including type, methodology, inclusion criteria, main conclusions, and relevance to the present research.
Ref.TypeMethodologyInclusion CriterionMain ConclusionRelevance for Our Study
[9]Technical studySimulation-based system architecture analysis for intelligent building networksAddresses integration of intelligent computing systems for smart building networksDemonstrates that distributed control enhances communication and data flow efficiencyProvides the foundation for connecting digital twin data with real-time management systems
[10]Review paperSystematic review of XR applications in building operation and maintenanceFocuses on extended reality (XR) for maintenance and user experience in smart buildingsShows that XR improves monitoring, maintenance, and user engagementInforms the immersive visualization layer of the proposed metaverse-based management framework
[11]Conceptual frameworkAnalytical study integrating IoT and blockchain technologies for decentralized data managementExamines blockchain–IoT convergence for transparent smart building data handlingHighlights traceability and security benefits of decentralized systemsSupports the governance and transparency dimension in ESG-related metrics
[12]Experimental studyEmpirical testing using IoT sensors and commercial metaverse platformsInvestigates how physical IoT data interact with virtual metaverse spacesValidates feasibility of real-time immersive visualizationDemonstrates the interoperability between physical and virtual building environments
[13]Theoretical modelConceptual modelling and synthesis of digital twin–metaverse integrationExplores merging digital twin and metaverse paradigms for smart building managementProposes a conceptual framework for immersive, data-driven control of buildingsProvides the theoretical baseline for designing the integrated digital management model proposed in this research
Note. The five studies summarized in Table 1 were identified through a targeted Scopus search using the query TITLE-ABS-KEY (“metaverse”) AND TITLE-ABS-KEY (“smart building”) for the period 2018–2025. All selected papers are peer-reviewed and directly address the intersection of metaverse technologies and smart building management. Their synthesis provides the conceptual and methodological foundation for the development of the proposed integrated metaverse-based management framework.
Table 2. Environmental Key Performance Indicators (KPIs) and Their Computational Formulations.
KPIAcronymDescriptionFormula
Carbon FootprintCFPTIndicates the total amount of greenhouse gas (GHG) emissions caused by an individual, organization, or product, either directly or indirectly. The formula calculates the sum of emissions associated with different activities by multiplying the quantity of each activity by its corresponding emission factor [30]. C F = i ( A c t i v i t i e s   i × E m i s s i o n   F a c t o r s   i )
A c t i v i t i e s   i = Quantity of a specific activity that generates greenhouse gas emissions (e.g., km, kWh, liters).
E m i s s i o n   F a c t o r s   i = Rate of GHG emissions per unit of activity, expressed in CO2 equivalent per unit (e.g., tCO2e/kWh for electricity, tCO2e/liter for fuel, etc.).
Emission Intensity EIEMINEvaluates the environmental impact of an energy system by measuring the amount of carbon dioxide (CO2) emitted per unit of energy consumed or produced. A low E I value indicates that the system is more environmentally efficient, emitting less CO2 for each unit of energy consumed or produced (this can occur through the use of renewable energy sources). Conversely, high E I values typically occur in systems that rely heavily on fossil fuels [31].EI = i C O 2   E m i s s i o n s   i i E P r   i
C O 2   E m i s s i o n s   i = Total amount of CO2 emitted over a given period, resulting from the consumption of fossil fuels or the use of grid electricity [tCO2]
E P r   i = Total amount of energy consumed or produced during the same reference period [kWh]
Load Cover FactorLCFRepresents the ratio between the energy actually supplied by a generation source and the energy demanded or consumed over a given time interval. If equal to 1, it indicates that the generation capacity exceeds the demand, whereas values lower than 1 indicate that generation is insufficient to meet the required load. When γ l o a d = 1, the entire load demand is fully satisfied. When γ l o a d < 1, the load is not completely met during part of the period, due to limitations in generation or available resources. Range: 0 <   γ l o a d < 1 [32,33]. γ l o a d = τ 1 τ 2 min g t S t ζ t , l t d t τ 1 τ 2 l t d t
g t = On-site energy generation at a given time t [kWh]
ζ t = Storage energy losses at a given time t [kWh]
l t = Building load at a given time t [kWh]
τ 1 e τ 2 = Start and end of the evaluation period [s]
S t = Storage energy balance at a given time t [kWh]
S t = S c S d c
S c = Charging energy of the storage system [kWh]
S d c = Discharging energy of the storage system [kWh]
Supply Cover FactorSCFIndicates the ability of an organization to meet its energy demand through its own on-site supply resources. When γ s u p p l y = 1, the amount of useful supplied resources is exactly equal to the total available amount. This implies that there are no significant losses and that all available resources are fully utilized. When γ s u p p l y < 1, the amount of effectively usable resources is lower than the total available amount. Part of the generated energy is not used to meet the load, likely due to overproduction, losses, or storage capacity limitations. Range: 0 <   γ s u p p l y < 1 [32,33]. γ s u p p l y = τ 1 τ 2 min g t S t ζ t , l t d t τ 1 τ 2 g t   d t
g t   = On-site energy generation at a given time t [kWh]
ζ t = Storage energy losses at a given time t [kWh]
l t = Building load at a given time t [kWh]
τ 1 e τ 2 = Start and end of the evaluation period [s]
S t = Storage energy balance at a given time t [kWh]
S t = S c S d c
S c = Charging energy of the storage system [kWh]
S d c = Discharging energy of the storage system [kWh]
Load Matching IndexLMIMeasures the efficiency with which on-site energy generation (whether renewable or not) matches the energy load (demand) of a system.
It evaluates how well the energy production profile corresponds to the load profile over time by analyzing the synchrony between supply and demand.
A higher index indicates a better match between generation and load.
When f l o a d , i = 1, the load is fully met (i.e., generation and storage are sufficient to cover the required demand) in every considered interval.
When f l o a d , i < 1, the load is not fully met at certain times, meaning that the generation and/or storage capacity was lower than the demand.
Range: 0% ≤ f_(load,i) ≤ 100% [33].
f l o a d , i = τ 1 τ 2 min [   1 ,   g t S t ζ   ( t )   l   ( t ) ] N   · 100
i = Time intervals [hourly, daily, monthly]
g t = On-site energy generation at a given time t [kWh]
S t = Storage energy balance at a given time t [kWh]
ζ t = Energy losses at a given time t (sum of generation energy losses, storage energy losses, building technical system losses (excluding storage), and load-related energy losses such as distribution losses) [kWh]
l t = Building load at a given time t [kWh]
τ 1 e τ 2 = Start and end of the evaluation period [s]
N = Number of samples within the evaluation period, from τ1 to τ2. When hourly data are used and the evaluation period covers a full year, the number of samples is 8760.
On-site Energy Ratio OERDetermines the amount of energy produced on-site (e.g., from renewable sources such as solar panels or wind turbines) relative to the total energy consumption over a given period of time.
If O E R = 1, the on-site generated energy equals the total energy consumption.
If O E R < 1, the on-site produced energy is lower than total consumption, meaning that the system depends on external energy sources to meet the demand.
If O E R > 1, the on-site generated energy exceeds total consumption, indicating that energy production is greater than demand (and surplus energy may be exported to the grid).
Range: O E R 0 [34].
O E R = τ 1 τ 2 g t   d t τ 1 τ 2 l   t   d t
g t = On-site energy generation at a given time t [kWh]
l t = Total energy consumption (energy load) at a given time t [kWh]
τ 1 e τ 2 = Start and end of the evaluation period [s]
Grid Interaction Index (Indice di Interazione con la Rete)GIIMeasures the level of interaction and integration of a facility with the power grid, describing its average stress.
If f g r i d , i = 100%, the energy exchanged with the grid during interval i equals the maximum possible exchange.
If f g r i d , i = 0%, no energy exchange with the grid occurred at that moment.
If f g r i d , i < 0%, energy was injected into the grid rather than drawn from it [32,33].
f g r i d , i = n e t g r i d i max n e t g r i d   ·   100
n e t g r i d i = Net energy exchanged with the power grid during interval i (can be positive or negative depending on whether energy is being drawn from or injected into the grid) [kWh]
max n e t g r i d = Maximum absolute value of the net energy flow with the grid, taken over all considered time intervals [kWh]
i = Time intervals [hourly, daily, monthly]
No grid interaction probabilityNGIMeasures the probability that a building or facility operates autonomously from the power grid, and therefore the likelihood of no interaction with it.
It also indicates the extent to which the load is covered by stored energy or renewable energy use.
If P ( E = 0 ) = 0, there was no moment during the considered time interval when the net energy was zero or negative.
If P ( E = 0 ) = 1, the net energy was zero or negative for the entire considered period.
Range: 0 P ( E = 0 )   1 [32,33].
P ( E = 0 ) = τ 1 τ 2 d t n e t < 0 τ 2 τ 1
P ( E = 0 ) = Probability that the net energy n e t is zero or negative during the time interval | τ 2   τ 1 |
n e t = Normalized variable for the net exported energy at a given time t [kWh]
τ 1 e τ 2 = Start and end of the evaluation period [s]
Capacity FactorCAFDefines the ratio between the actual energy production of a system (energy exchanged between the building and the grid) and the maximum production that could be achieved if the system operated at full capacity over a given period of time.
If C F b = 1, the system operated at its maximum capacity for the entire considered period.
If C F b = 0, the system did not produce any energy.
Range: 0 C F b   1 [33].
C F b = τ 1 τ 2 | n e t | d t E d e s ·   T
n e t = Normalized variable for the net exported energy at a given time t [kWh]
E d e s = Maximum producible energy at full capacity (system capacity) [kWh]
T = τ 2   τ 1 = Evaluation period [s]
One Percent Peak Power OPPQuantifies the maximum power that an energy system can reach by calculating the energy production corresponding to the top 1% of peak periods.
A high O P P value indicates that the building or system experiences moments (the top 1% of the time) with very high energy consumption. This may point to significant peak loads that place stress on the electrical grid.
If O P P is low, the building’s energy demand is more evenly distributed over time, with fewer or smaller peaks. [35].
O P P = E 1 %   p e a k T
E 1 %   p e a k = Energy associated with the top 1% of a given value, calculated during periods of maximum demand or generation [kWh]
T = Time period over which the energy is measured [h]
Demand Response Percentage DRSRefers to the percentage variation of the Demand Response relative to a baseline value.
If D R p > 0, the Demand Response was successful in reducing power compared to the baseline level (load “reduction” capability).
If D R p = 0, no variation occurred.
If D R p < 0, it indicates an increase in power during the Demand Response implementation, which is generally undesirable (load “overload” condition) [36].
D R p = p h b a s e p h L S p h b a s e   · 100
p h b a s e = Baseline hourly power, i.e., the expected or normal power level without any Demand Response measures [kWh]
p h L S = Hourly power under Load Shifting conditions, i.e., the power recorded during the Demand Response event [kWh]
Flexibility FactorFLFMeasures the ability of an energy system to adapt to variations in energy demand and resource availability, and to shift energy use from high-price periods to lower-price periods. It applies a daily quartile-based price classification, dividing prices into three categories: low, medium, and high.
A high price is defined as one above the third quartile (price > 75% of all prices during a day).
A low price corresponds to a value within the first quartile (price ≤ 25%).
If F F = 0, consumption is balanced between low- and high-price periods.
If F F = 1, consumption occurs only during low-price periods.
If F F < 0, most consumption occurs during high-price periods.
Range: −1   F F   1 [37].
F F = i = 1 n ( E e l i · p i ) q 1 i = 1 n ( E e l i · p i ) > q 3   i = 1 n ( E e l i · p i ) q 1 + i = 1 n ( E e l i · p i ) > q 3
E e l i = Electricity consumption during time interval i [kWh]
p i = Energy price during time interval i
q 1 = Low-price periods (first quartile, i.e., the lowest 25% of prices)
q > 3 = High-price periods (above the third quartile, i.e., the highest 25% of prices)
n = Number of considered time intervals
Flexibility IndexFLICalculates the difference between the energy cost under a flexibility-controlled scenario and the energy cost under a reference scenario. The Flexibility Index is used to measure the effectiveness of flexibility strategies in reducing costs compared to a baseline case.
If F I < 0, the flexibility-controlled case has a higher energy cost than the reference case, meaning an undesirable cost increase.
If F I = 0, the total energy cost under flexible conditions is identical to that of the reference case, indicating that flexibility yields no savings.
If F I = 1, the total cost in the flexibility-controlled case is zero relative to the reference case—this represents an ideal but unrealistic situation.
If F I is positive and close to 1, it means that energy has been effectively shifted or managed, reducing costs compared to the reference scenario.
Range: −   <   F I   1 [38].
F I = 1 i = 1 n ( E e l i · p i ) f l e x   i = 1 n ( E e l i · p i ) r e f
E e l i = Electricity consumption during time interval i [kWh]
p i = Energy price during time interval i
( E e l i · p i ) f l e x = Total electricity cost in a flexibility-controlled scenario ( E e l i · p i ) r e f = Total electricity cost in a reference scenario without flexibility control
n = Number of considered time intervals
Flexible Energy EfficiencyFEEMeasures how effectively a system utilizes flexible energy compared to its reference energy consumption. It refers to the system’s ability to manage energy use during Demand Response (DR) events, considering the “rebound effect” (i.e., when energy consumption increases after a reduction event to restore normal operating conditions). A higher η f value indicates greater flexibility efficiency, meaning the system can better optimize energy use during flexible periods. Range: 0% η f 100% [39]. η f = E f E r b   · 100
E f = Flexible energy, i.e., the energy used during periods when the system operates in flexible mode (for example, by optimizing consumption based on renewable resource availability or variable pricing) [kWh]
E r b = Reference or baseline energy, i.e., the energy consumed under normal or non-flexible operating conditions [kWh]
Note. This table presents the Environmental Key Performance Indicators (KPIs) used to evaluate the environmental, energy, and operational performance of smart infrastructures within a digital twin framework. Each KPI is defined with its acronym, description, and mathematical formulation for standardized and comparative analysis.
Table 3. Social Key Performance Indicators (KPIs) for Indoor Environmental Quality and Energy Efficiency Assessment.
KPIAcronymDescriptionFormulaUoM
Relative Humidity HUMIndicates the amount of water vapor in the air relative to the maximum that can be contained at the same temperature.
The optimal relative humidity (RH) range for occupant comfort and health is between 40% and 60% [50].
R H = e e s   · 100 %
e = Water vapor pressure [Pa]
e s = Saturation vapor pressure [Pa]
Concentrazione di PM (Particulate Matter—PM10 e PM2.5)PM10 e PM2.5Measures the amount of suspended particles (particulate matter) in the air, typically expressed in micrograms per cubic meter (µg/m3).
PM2.5 refers to particles with a diameter smaller than 2.5 μm, while PM10 refers to particles smaller than 10 μm.
Recommended long-term health thresholds are PM2.5 < 20 µg/m3 and PM10 < 50 µg/m3 [51].
P M C = P M m V a i r µg/m3
P M m = Mass of particulate matter [µg]
V a i r = Volume of air [m3]
Volatile Organic CompoundsVOCEstablishes the concentration of VOCs—such as benzene, formaldehyde, and other potentially harmful gases.
Elevated VOC levels can cause discomfort and health issues in occupants.
The indicated threshold is V O C l e v < 300 ppb. [52].
V O C l e v = C   · 10 9 M     ·   1 V ppb
C = VOC concentration [mg/m3]
M = Molar mass of the VOC [g/mol]
V = Molar volume under standard conditions, generally considered as 24.45 L/mol (at standard temperature and pressure, 0 °C and 1 atm)
Air Changes per HourACHIndicates the number of times the air within a space is completely renewed in one hour.
An air change rate between 3–5 ACH is considered adequate for residential buildings or office environments [53].
A C H = Q V 1/h
Q = Airflow rate [m3/h]
V = Volume of the indoor space [m3]
Thermal Insulation RateTHRDetermines the thermal resistance of insulating materials, indicating how effectively they prevent heat loss.
A higher R-Value indicates better insulation performance [54].
R V a l u e = t λ m2·K/W
t = Materials thickness [m]
λ = Thermal conductivity of the materials [W/m·K]
Sound Insulation IndexSNDEvaluates the effectiveness of a building element in reducing sound transmission between two different spaces.
It is defined as the difference between the incident sound pressure level on a surface and the transmitted sound pressure level through it.
A higher R value indicates that walls, floors, or windows are more effective at blocking sound [55].
R = L 1 L 2 + 10   l o g 10   ( A S   ) dB
L 1 = Incident sound pressure level [dB]
L 2 = Transmitted sound pressure level [dB]
A = Equivalent absorption area [m2]
S = Separating surface area [m2]
Energy Efficiency RatioEERMeasures the efficiency of an air conditioning system (air conditioners or cooling units). A higher EER indicates that the air conditioning system provides more cooling output for each unit of energy consumed, making it more efficient.
If EER ≥ 12, the system is considered efficient. [56].
E E R = c P t -
t c i = Total cooling capacity provided by the system [kW]
P t = Electrical power input consumed by the system [kW]
Coefficient of PerformanceCOPAn indicator similar to the EER, it can be used to evaluate efficiency in both cooling and heating modes.
It is commonly applied to heat pumps. A higher COP indicates that the system can produce a greater amount of useful energy (heating or cooling) for each unit of electrical energy consumed.
If COP ≥ 3.5, the system is considered efficient. [57].
C O P = | | P t -
| | = h = c = Heating or cooling capacity provided by the system [kW]
P t = Electrical input power consumed by the system [kW]
System Efficiency ηSEFMeasures how much of the energy used by the system is effectively converted into useful heating or cooling.
A high system efficiency means that a large portion of the consumed energy is actually transformed into useful thermal energy, minimizing losses.
If η ≥ 85%, the system is considered efficient. [29].
η = E u t E t -
E u t = Useful energy delivered (cooling or heating capacity) [kWh]
E t = Total energy consumed (including system losses and auxiliary consumption) [kWh]
Energy Use Intensity based on people countEUIMeasures the energy consumption for lighting relative to the number of occupants in the building, reflecting energy efficiency in terms of per capita usage.
A high EUI indicates higher energy consumption for lighting per person, suggesting a lack of optimization.
Optimal values: EUI < 15 kWh/person/year. [29].
E U I p e o p l e = E l i g h t N p e o p l e · T kWh/
person/
year
E l i g h t = Energy consumed for lighting [kWh]
N p e o p l e = Number of occupants in the building
T = Duration of lighting usage [year]
Lighting Power Density per floor areaLPDDetermines the power consumed by lighting per unit of floor area.
It serves as an indicator of lighting efficiency in relation to the utilized space.
A high LPD indicates greater power consumption per unit area, suggesting inefficient lighting design.
Optimal values: LPD < 10 W/m2 [29].
L P D f l o o r = P l i g h t A kW/m2
P l i g h t = Power used for lighting [kW]
A = Illuminated indoor area [m2]
Note. This table summarizes the Social and Environmental Key Performance Indicators (KPIs) used to assess indoor environmental quality, user comfort, and energy efficiency in smart infrastructures. Each KPI is defined by its acronym, description, and calculation formula, providing measurable parameters that support ESG-oriented evaluation and digital twin integration.
Table 4. Governance Key Performance Indicators (KPIs) for ESG Evaluation within Digital Twin Frameworks.
KPIAcronym DescriptionFormulaUoM
Cost of Energy SavingCESMeasures the cost associated with energy savings achieved through energy efficiency interventions.
This parameter is particularly useful for comparing different investment options in terms of efficiency, as it estimates how much it costs to save one unit of energy (e.g., 1 kWh) through technological or operational measures.
The CES formula is structured to calculate the total cost of energy savings and divide it by the amount of energy saved, accounting for system inefficiencies.
A higher CES indicates a greater cost per unit of energy saved, suggesting that the intervention may be less cost-effective compared to other alternatives.
Conversely, a lower CES means a lower cost per unit of energy saved, making the energy efficiency measure more economically advantageous [67].
C E S = Δ I 0 · C R F +   Δ C o m p ·   Δ E     ·   ( 1 f s i d e ) Δ E     ·   1 f s i d e [€/kWh]
Δ I 0 = Change in initial investment. Represents the amount of capital required to implement the energy efficiency measure [€]
Δ C o m = Change in operating costs. Includes expenses related to the operation and maintenance of the energy efficiency measure [€]
p = Energy price. Represents the cost per unit of energy, which can influence the savings achieved by the measure [€/kWh]
Δ E = Change in energy consumption. Indicates the amount of energy saved as a result of the intervention [kWh]
f s i d e = Energy loss (or efficiency) factor associated with losses that may occur during the energy use process. It may include heat losses or other system inefficiencies [–]
C R F = Capital Recovery Factor. Used to calculate the annualized cost of the investment and determine how much an investment must generate each year to be recovered over time [−]
C R F = i   · ( 1 + i ) n ( 1 + i ) n 1
i = Interest rate [−]
n = Amortization period [years].
Energy Return on Investment EROIEvaluates the energy efficiency of a production source by measuring how much energy is obtained compared to how much energy is invested to produce it. It is a key indicator of energy sustainability: the higher the EROI, the more efficient the system.
If EROI > 1, the energy process is sustainable, as the energy produced exceeds the energy invested.
If EROI = 1, the energy produced is exactly equal to the energy invested, meaning the system is at the limit of sustainability and produces no usable net energy.
If EROI < 1, the system is inefficient, since it requires more energy than it generates. Such a process is neither economically nor energetically sustainable in the long term.
This indicator answers the question: “How efficient is the energy investment?” [68].
E R O I = i = 1 n λ i   E i O j = 1 m λ j   E j I   [−]
E i O = Total outgoing or produced energy from process i. This may include, for example, the electricity generated by a power plant or the fuel produced by a refinery [kWh].
E j I = Total incoming or consumed energy for process j. This may include the energy required to extract, transform, or transport the energy source [kWh].
λ i e λ j = Scaling factors that can represent the quality of energy. For instance, they may be used to assign greater or lesser importance to certain forms of energy or technologies [−].
Energy Payback TimeEPBTMeasures the time required for an energy system to produce the same amount of energy that was needed to build, install, and maintain it.
If EPBT is high, it takes longer for the system to return the energy invested. Conversely, if EPBT is low, the energy system quickly recovers the energy used for its construction and startup.
It is an indicator that answers the question: “How long does it take for the system to repay the energy invested?” [69].
  E P B T = i = 1 n E i I j = 1 m E j P Y [year]
E i I = Total invested energy required to build, install, maintain, and decommission the energy system throughout its life cycle [kWh].
E j P Y = Amount of energy that the system is capable of producing annually once it is operational [kWh/year].
Cost of Peak DemandCPDMeasures the cost associated with the peak electricity demand over a given period.
A lower CPD is desirable, as it indicates effective management and reduced exposure to energy costs [70].
C P D = P d   ·   C u [€]
P d = Represents the maximum power demand during a given period [kW].
C u = Represents the cost associated with each unit of power [€/kW].
Cumulative Cash FlowCCFMeasures the total cash flow generated by the project in relation to the initial investment.
The CCF is useful for investors and decision-makers, as it helps assess a project’s profitability, compare different investments, and plan future financial needs and returns on investment.
A CCF > 0 indicates that the project is generating more cash flow than the costs incurred, while a CCF < 0 indicates a loss. [24].
C C F = k = 1 n F E S k   · E C C k   · T L I C [€]
F E S k = Represents the Final Energy Savings in period k. This value indicates the final energy savings achieved through energy efficiency measures or other strategies [kWh].
E C C k = Energy Carrier Cost, i.e., the cost of energy per unit during period k. This may include costs for purchasing or using energy such as electricity, gas, etc. [€/kWh].
T L = Technical Life, i.e., the project period during which energy savings and economic benefits are expected [years].
I C = Investment Cost, i.e., the cost of the investment. It includes all expenses necessary to implement the project, such as installation, equipment, and other preliminary costs [€].
Share of Project Cost SubsidizedSPCIndicates the proportion of the total project cost that has been financed through grants.
A high SPCS means that a significant portion of the project has been funded through external aid, while a low SPCS suggests that the project has been mainly self-financed.
SPCS = 0% when no grants have been received (RS = 0), meaning no part of the project costs is subsidized.
SPCS = 100% when the entire project cost is covered by grants (RS = IC), meaning the entire project is subsidized.
Range: 0% ≤ SPCS ≤ 100% [71].
S P C S = R S I C   · 100 [%]
R S = Received Subsidies, meaning the total amount of grants or funding received for the project [€].
I C = Investment cost, meaning the total investment cost [€].
Renewable Energy UseREUProvides a measure of the proportion of final energy savings that comes from renewable sources compared to all energy sources used.
It is useful for energy policies and environmental assessments, as it helps quantify and compare the impact of different energy sources on overall sustainability and efficiency.
A higher REU indicates greater use of renewable energy, while a lower REU suggests a higher dependence on fossil fuels.
Range: 0% ≤ REU ≤ 100% [71].
R E U = k = 1 n |   F E S k   ·   C F k   · R E S   f a c t o r k   | k = 1 n |   F E S k   ·   C F k   |   · 100 [%]
F E S k = Final Energy Savings for each energy source k. Indicates the final energy savings achieved from that specific source [kWh].
C F k = Conversion Factor for each energy source k. This factor is used to convert the saved energy into a common unit, allowing comparison among different sources [−].
R E S   f a c t o r k   = Renewable Energy Source factor for each energy source k, which accounts for the sustainability of the source. This value varies depending on the type of energy:
  • 0 for fossil fuels, indicating they do not contribute to sustainable energy production [−]
  • 1 for renewable sources such as biomass, wind, solar, and other renewables, as they are considered sustainable [−]
A value between 0 and 1 for mixed sources, such as industrial waste or end-of-life tires, depending on the sustainability level of the source [−]
Energy Use per Worker-HourEPWHMeasures the total energy used by a production system in relation to the number of human resources and working time.
It calculates the energy used per working hour, taking into account the total supplied energy minus the imported one, and normalizing the result by the number of workers and the annual working hours.
This indicator is useful for evaluating the energy efficiency of an organization or an entire economy, allowing comparisons over time or between different sectors or countries.
A low EPWH is considered positive, as it indicates higher productivity with lower energy use, suggesting a more sustainable use of energy resources.
Conversely, a high EPWH may indicate energy inefficiency, potentially linked to poorly optimized production processes, outdated machinery, or energy-intensive technologies [72].
E P W H = T P E S I P E S N p o p   · (   h y   ) MJ/
(ab. h/years)
T P E S = Total Primary Energy Supply, i.e., the total amount of primary energy supplied, including all available energy sources [kWh].
N p o p = Population number, meaning the total number of individuals within the studied population.
h y = Total number of working hours per person per year [h/year].
I P E S = Industrial Primary Energy Supply, meaning the portion of TPES specifically used in the industrial sector [kWh].
I P E S = T P E S   ·   I F C T F C  
I F C = Industrial Final Consumption, referring to the final energy consumption by the industrial sector [MWh].
T F C = Total Final Consumption, referring to the total final energy consumption within a given economic system, including the industrial, residential, tertiary, and transport sectors [MWh].
Note: This table summarizes the Governance Key Performance Indicators (KPIs) used for ESG evaluation within digital twin frameworks. The listed indicators quantify economic efficiency, financial accountability, and strategic resource management, enabling transparent decision-making and long-term sustainability assessment. These variables collectively support the “Governance” dimension of ESG by linking economic performance with responsible investment, policy transparency, and data-driven management.
Table 5. Descriptive Statistics of the KPI Dataset for the Validation of a Digital Twin and Metaverse Prototype Applied to Smart Buildings.
VariableObsMeanStd_DevMinMaxp1p99SkewKurt
AREA1009637.35249.252116119,942117519,6940.1671.959
ENCO100981,000562,00063,556.651,970,00072,951.461,960,0000.111.79
CFPT100295.725130.65852.28495.5253.21491.685−0.2751.887
EMIN1000.0810.0390.0220.1490.0220.148−0.0171.765
LCF1000.8110.1250.6040.9970.6040.996−0.1461.722
SCF1000.8140.1190.60610.6091−0.0691.784
LMI10071.68213.7115199.3351.41599.2250.3831.981
OER1000.7530.250.331.1910.3391.180.0351.729
GII10047.03829.2130.4699.690.88599.0850.1041.86
NGI1000.4690.2810.0110.9840.0120.9660.0761.823
CAF1000.5410.3120.0180.9980.0190.995−0.1231.666
OPP100584.406263.627105.75995.42116.035989.245−0.2541.724
DRS1009.00611.919−9.6129.88−9.57529.6750.0731.825
FLF1000.0450.584−0.9390.993−0.9380.984−0.0721.735
FLI1000.270.445−0.4930.999−0.4920.99−0.1391.815
FEE10049.03626.920.7698.781.2997.535−0.0231.98
OCC100412.27225.18550933619270.3872.307
HUM10049.4637.4952573.727.2570.65−0.0784.539
PM2510011.2334.714322.3321.850.2742.341
PM1010024.6179.179842.9842.650.0742.285
VOC100186.0187.0962038320371−0.1632.445
ACH1004.0510.7952.256.052.2855.820.0432.616
THR1002.9340.8590.85.50.975.0250.0992.921
SND10043.3436.2273061.630.860.30.2782.962
EER10010.341.1697.1813.037.54512.885−0.1582.72
COP1002.8570.3682.23.592.23.590.0552.287
SEF10087.5114.89272.297.374.497.2−0.4363.155
EUI10016.9323.6837.525.48.625.350.0192.616
LPD1000.0080.0020.0050.0120.0050.0120.222.318
CES10011.45325.5270.019213.2370.02146.4115.40640.749
EROI10014.7921.2370.193121.6550.224114.7193.3214.856
EPBT1004.9111.7290.0886.670.0979.5755.54435.698
CPD100141,00073,729.4314,691.18298,00015,023.01298,0000.2322.306
CCF100−420,000785,000−1,780,0002,390,000−1,760,0002,050,0000.6443.843
SPC10034.94620.9020.2569.890.40569.8850.0191.789
REU10064.33813.58430.9895.5834.6492.81−0.0662.344
EPWH10039.76345.060.302229.5150.337189.3411.55.199
Note. This table presents the descriptive statistical parameters of the Key Performance Indicator (KPI) dataset developed to support the validation of a prototypal Digital Twin and Metaverse model for Smart Building management. The dataset integrates environmental, energy, operational, and governance-related variables, enabling the characterization of heterogeneous building typologies and operational conditions. The statistical descriptors (mean, standard deviation, minimum, maximum, skewness, and kurtosis) provide a quantitative overview of variability and distribution, essential for model calibration, simulation accuracy, and data-driven performance validation within the digital twin environment.
Table 6. Correlation Matrix for Environmental (E) Factors in the ESG Model.
VariablesAREACFPTENCOEMINLCF
AREA1.0000−0.0382−0.0608−0.06780.0483
CFPT−0.03821.0000−0.1416−0.2254−0.0229
ENCO−0.0608−0.14161.0000−0.0344−0.1235
EMIN−0.0678−0.2254−0.03441.00000.1844
LCF0.0483−0.0229−0.12350.18441.0000
SCF−0.0142−0.0214−0.2180−0.1927−0.1126
LMI0.03760.0284−0.0592−0.01650.2509
OER0.04320.0155−0.17930.02050.0918
GII−0.03800.0052−0.22300.0543−0.0519
NGI−0.01880.0250−0.0573−0.0805−0.0523
OPP−0.12480.04720.13310.2376−0.0651
DRS−0.05770.1073−0.1592−0.0992−0.1351
FLF0.1050−0.1392−0.04120.0490−0.0770
FLI0.00230.1272−0.08220.0331−0.0335
FEE0.0965−0.0327−0.0738−0.06780.0085
Note: The table presents the correlation coefficients among the environmental indicators used within the ESG framework. The low to moderate correlation values confirm that the variables are largely independent and represent distinct aspects of environmental performance, such as energy use, emissions, and operational efficiency. This statistical consistency validates the internal coherence of the dataset and ensures its suitability for advanced modeling techniques, including PCA and regression analysis. The results further demonstrate that the data are appropriate for use in the prototyping and testing of smart building management systems based on digital twin and metaverse technologies.
Table 7. Correlation Matrix for Social (S) Dimension Variables in the ESG Smart Building Model.
VariableOCCHUMPM25PM10VOCACHTHRSNDEERCOPSEFEUILPD
OCC1.00000.13290.19530.0406−0.0661−0.0387−0.08060.01720.03730.09120.1720−0.0849−0.0437
HUM0.13291.00000.00270.0540−0.05920.1160−0.15810.01720.04770.03990.00130.06180.0800
PM250.19530.00271.00000.23700.0320−0.0518−0.22710.1503−0.06160.03760.0095−0.01140.0935
PM100.04060.05400.23701.00000.07600.06830.02010.0481−0.0705−0.0022−0.03930.05870.0935
VOC−0.0661−0.05920.03200.07601.00000.0005−0.0622−0.0455−0.0209−0.0401−0.00850.04540.0214
ACH−0.03870.1160−0.05180.06830.00051.00000.02890.10620.07410.07840.06070.02430.0072
THR−0.0806−0.1581−0.22710.0201−0.06220.02891.00000.14670.10210.14250.1260−0.00780.0573
SND0.01720.01720.15030.0481−0.04550.10620.14671.00000.01190.06760.0631−0.02250.0202
EER0.03730.0477−0.0616−0.0705−0.02090.07410.10210.01191.00000.48720.7244−0.1632−0.0750
COP0.09120.03990.0376−0.0022−0.04010.07840.14250.06760.48721.00000.7074−0.0906−0.0529
SEF0.17200.00130.0095−0.0393−0.00850.06070.12600.06310.72440.70741.0000−0.1307−0.0399
EUI−0.08490.0618−0.01140.05870.04540.0243−0.0078−0.0225−0.1632−0.0906−0.13071.00000.8829
LPD−0.04370.08000.09350.09350.02140.00720.05730.0202−0.0750−0.0529−0.03990.88291.0000
Note. The table displays the correlations among social indicators such as comfort, air quality, and energy efficiency. The weak to moderate correlations confirm that these variables represent distinct yet complementary dimensions, ensuring the dataset’s internal consistency and its suitability for digital twin-based simulations in smart building management.
Table 8. Correlation Matrix for Governance (G) Factors in the ESG Smart Building Model.
VariableCESEROIEPBTCPDCCFSPCREUEPWH
CES1.0000−0.05960.03200.0069−0.4240−0.2163−0.1981−0.0780
EROI−0.05961.0000−0.22340.00830.08510.15530.07250.0126
EPBT0.0320−0.22341.0000−0.16970.0380−0.19810.13050.0050
CPD0.00690.0083−0.16971.0000−0.0017−0.08940.00770.0670
CCF−0.42400.08510.0380−0.00171.00000.22510.03270.1058
SPC−0.21630.1553−0.1981−0.08940.22511.0000−0.1582−0.0859
REU−0.19810.07250.13050.00770.0327−0.15821.00000.1860
EPWH−0.07800.01260.00500.06700.1058−0.08590.18601.0000
Note. The table shows weak to moderate correlations among governance indicators, confirming their independence and validity. The negative link between CES and CCF highlights an inverse cost–efficiency relationship, while positive ties among CCF, SPC, and EPWH indicate consistent governance performance suitable for digital twin-based smart building management.
Table 9. Regression Equations for ESG Dimensions in the Smart Building Model.
ESGEquations
E-Environment A R E A i = β 0 + β 1 E N C O i + β 2 C F P T i + β 3 E M I N i + β 4 L C F i + β 5 S C F i + β 6 L M I i + β 7 O E R i + β 8 G I I i + β 9 N G I i          + β 10 C A F i + β 11 O P P i + β 12 D R S i + β 13 F L F i + β 14 F L I i + β 15 F E E i + β 16 E E R i + β 17 C O P i          + β 18 S E F i + β 19 E U I i + β 20 L P D i + β 21 R E U i + β 22 E P W H i + ε i
S-Social A R E A i = β 0 + β 1 O C C i + β 2 H U M i + β 3 P M 25 i + β 4 P M 10 i + β 5 V O C i + β 6 A C H i + β 7 T H R i + β 8 S N D i + ε i
G-Governance A R E A i = β 0 + β 1 C E S i + β 2 E R O I i + β 3 E P B T i + β 4 C P D i + β 5 C C F i + β 6 S P C i + ε i
Note: The table presents the Ordinary Least Squares (OLS) regression equations used to validate the Environmental (E), Social (S), and Governance (G) dimensions of the ESG model. Each equation relates specific Key Performance Indicators (KPIs) to the dependent variable AREA, representing building scale and functionality. These equations provide the analytical foundation for integrating the ESG dataset into digital twin-based smart building management and simulation frameworks.
Table 10. Summary of Regression Results for ESG Dimensions in the Smart Building Model.
ESG DimensionE (Environment)S (Social)G (Governance)
Included KPIs (X)ENCO, CFPT, EMIN, LCF, SCF, LMI, OER, GII, NGI, CAF, OPP, DRS, FLF, FLI, FEE, EER, COP, SEF, EUI, LPD, REU, EPWHOCC, HUM, PM25, PM10, VOC, ACH, THR, SNDCES, EROI, EPBT, CPD, CCF, SPC
Vars2286
R20.2260.0850.124
Adj. R20.0050.0040.067
F (df1, df2)1.02 (22, 77)1.05 (8, 91)2.19 (6, 93)
Prob > F0.4510.4030.051
Root MSE523752385069
Mean VIF1.931.081.15
Significant Variables (p < 0.10)CAF (p = 0.006), REU (0.065), EPWH (0.108)PM25 (p = 0.084)CPD (p = 0.027), CCF (0.054)
SignCAF (−), REU (+)+both (−)
InterpretationEnvironmental KPIs are consistent but weakly predictive of AREA; no multicollinearity; logical directional signs.Social KPIs are independent and orthogonal; air quality and comfort show limited relation with building scale.Governance and economic KPIs show structural consistency and marginal significance; negative coefficients suggest efficiency gains with lower costs per area.
Note: This table summarizes the regression outcomes for the Environmental (E), Social (S), and Governance (G) dimensions of the ESG model. The results show that all models are statistically coherent and free from multicollinearity (Mean VIF < 2). While the Environmental and Social models exhibit low explanatory power, the Governance model shows marginal significance (Prob > F ≈ 0.05), indicating that financial and efficiency indicators play a stronger role in explaining building scale and performance within digital twin-based smart building systems.
Table 11. Summary of Key Analytical Insights from ESG Regression Models.
AspectObservation
Global significanceOnly the G model is marginally significant (Prob > F ≈ 0.05).
Internal coherence (VIF)All Mean VIF < 5 → no multicollinearity in any ESG block.
Predictive power vs. AREAE and S blocks have low explanatory power; G block moderate (Adj R2 ≈ 0.07).
General interpretationThe three ESG dimensions are statistically distinct and non-redundant. The Governance/Economic dimension shows the strongest structural consistency.
Note: The table presents the main analytical observations derived from the ESG regression analysis. It highlights that the Governance (G) model demonstrates marginal statistical significance and the strongest internal consistency, while the Environmental (E) and Social (S) models show lower explanatory power but maintain structural independence. The low VIF values confirm the absence of multicollinearity, validating the dataset’s robustness for digital twin–based smart building modeling.
Table 12. Normalized Performance Metrics of Machine Learning Models for ESG Dataset Validation—Environmental Component.
MetricBoostingDecision TreeKNNLinear RegressionRandom ForestRegularized LinearSVM
MSE0.330.300.651.000.000.360.38
RMSE0.350.330.731.000.000.420.44
MAE0.440.530.781.000.000.270.52
MAPE0.660.501.000.670.460.470.00
R20.010.070.381.000.000.440.00
Note: All metrics—MSE, RMSE, MAE, MAPE, and R2—are normalized to enable direct comparison among algorithms. The Random Forest model shows the lowest normalized errors and a stable R2, confirming its superior accuracy and robustness. These results validate its suitability for the technical–scientific verification of the environmental dataset used in developing a digital twin and metaverse-based smart building management prototype.
Table 13. Feature Importance Based on Mean Dropout Loss—Environmental Component.
VariablesMean Dropout LossVariablesMean Dropout Loss
CAF5.077CFPT5.068
SCF5.074LCF5.068
OER5.070OPP5.068
FLF5.069LMI5.068
GII5.069FLI5.068
EMIN5.069ENCO5.067
NGI5.068FEE5.067
DRS5.068
Note. The mean dropout loss values indicate each variable’s contribution to the Random Forest model. Higher values (e.g., CAF, SCF, OER) represent greater influence on model accuracy, confirming their key role in validating the environmental dataset for smart building analysis.
Table 14. Additive Feature Contributions in Random Forest Predictions—Environmental Component.
Case12345
Predicted9.1418.9369.1758.9318.931
Base9.0639.0639.0639.0639.063
ENCO−0.298−2.7654.759−9.1306.100
CFPT8.291−20.9370.2204.921−12.691
EMIN−10.720−1.9631.42816.626−17.500
LCF−16.680−18.8649.401−21.16822.139
SCF−9.687−2.902−13.972−59.684−46.113
LMI2.564−1.952−4.7292.1041.990
OER10.92110.93010.90210.91410.910
GII32.240−20.77935.824−22.6705.397
NGI8.78723.709−7.874−9.7811.382
CAF−33.9983.15334.955−36.673−36.673
OPP13.678−18.241−11.70613.536−4.859
DRS29.411−25.220−2.092−17.218−2.467
FLF42.525−52.68153.365−4.552−57.637
FLI0.4461.7801.5841.260−2.368
FEE−0.064−0.010−0.139−0.194−0.013
Note. This table shows the additive contributions of each environmental variable to the predicted AREA across five test cases. Positive values increase the prediction, while negative ones reduce it. The results highlight the interpretability of the Random Forest model, confirming that the dataset captures realistic and consistent relationships among energy and environmental indicators.
Table 15. Normalized Performance Metrics of Machine Learning Models—Social (S) Component.
MetricBoostingDecision TreeKNNLinearRandom ForestRegularized LinearSVM
MSE0.8280.2730.1860.7710.0000.0040.133
RMSE0.9890.1230.0270.9490.0000.0020.067
MAE0.7130.2100.0441.0000.0060.0000.038
MAPE1.0000.2380.2920.5950.2630.3160.000
R20.0000.1820.7271.0000.6670.1820.000
Note: The table presents normalized evaluation metrics for different machine learning algorithms applied to the Social (S) dataset. The Random Forest model achieves the lowest error values (MSE, RMSE, MAE) and balanced performance, confirming its superior predictive accuracy and suitability for validating social indicators within digital twin and metaverse smart building frameworks.
Table 16. Feature Importance Metrics for the Random Forest Model—Social (S) Component.
VariableMean Decrease in AccuracyTotal Increase in Node PurityMean Dropout Loss
VOC−310.0221.200 × 1083.820
PM252.522 × 1067.406 × 1073.919
HUM−361.8036.387 × 1073.727
OCC−455.3326.330 × 1073.647
ACH−777.4065.574 × 1073.644
PM10−38.8395.482 × 1073.632
LPD153.5705.290 × 1073.638
EUI120.7255.279 × 1073.653
COP346.3764.928 × 1073.666
SND284.5584.860 × 1073.602
THR−515.4084.721 × 1073.595
SEF862.2514.260 × 1073.623
EER−55.3963.588 × 1073.563
Note. This table reports the importance metrics derived from the Random Forest model, including mean decrease in accuracy, total increase in node purity, and mean dropout loss. Variables such as SEF, COP, and PM2.5 show the highest influence on model accuracy, confirming their central role in explaining social sustainability and indoor comfort dynamics in smart buildings.
Table 17. Additive Prediction Explanations for the Random Forest Model—Social (S) Component.
CasePredictedBaseOCCHUMPM25PM10VOC
110.1199.706137.642356.475102.444−145.549−198.943
29.4979.706−141.526−557.700510.704−426.882−234.224
38.3459.706271.758310.474−1.262−290.846−164.060
49.4099.706−99.743−292.405−1.277613.5521.001
59.8579.706−64.956461.545242.598−5.588−325.978
ACHTHRSNDEERCOPSEFEUILPD
−182.452−28.543158.293285.87874.686−124.03281.448−104.236
151.726122.638432.515−131.370255.324100.229−32.603−258.426
−167.946−121.153−146.3036.577260.931207.834−42.744−223.179
−253.14452.756403.440−192.171189.206139.739−392.002−191.752
−52.02784.146−43.087−56.376267.341184.743−363.505−178.109
Note. The table illustrates the additive contributions of each variable to the predicted values across five test cases. Positive and negative values indicate how each social indicator (e.g., OCC, PM2.5, SND, COP) influences the final prediction relative to the baseline. These results confirm the interpretability of the Random Forest model and its capacity to capture complex interactions between comfort, air quality, and energy efficiency in smart building environments.
Table 18. Normalized Performance Metrics of Machine Learning Models for ESG Dataset Validation—Governance (G) Component.
MetricBoostingDecision TreeKNNLinear RegressionRandom ForestRegularized LinearSVM
MSE0.0000.5860.9521.0000.5730.6940.436
RMSE0.0000.7420.9651.0000.7330.8120.570
MAE0.0000.8200.9081.0000.3800.1290.000
MAPE0.1641.0000.6820.6200.7830.9680.000
R20.9400.4330.9280.5600.9800.7930.000
Note. The table reports normalized performance metrics for several machine learning models applied to the Governance dimension of the ESG dataset. Among all tested algorithms, the Support Vector Machine (SVM) achieved the best overall balance, minimizing errors (MSE, RMSE, MAE, MAPE) while maintaining high explanatory power (R2), confirming its robustness for dataset validation in smart building governance modeling.
Table 19. Feature Importance Metrics Based on Mean Dropout Loss—Governance (G) Component.
VariablesEPWHCPDCCFSPCREUCESEROIEPBT
Mean Dropout Loss5.1555.1545.1515.1495.1485.1445.1445.142
Note. The table presents the Mean Dropout Loss values for each governance-related variable in the ESG dataset. The results show minimal variation among indicators (≈5.14–5.16), confirming a balanced contribution of all features to model accuracy and validating the internal consistency of the dataset used for smart building governance modeling.
Table 20. Additive Prediction Explanations for the Governance (G) Component—Feature-Level Contributions.
CasePredictedBaseCESEROIEPBTCPDCCFSPCREUEPWH
19.3099.309−0.0200.017−8.680 × 10⁻⁴−0.093−0.0070.091−0.049−0.092
29.3099.3090.022−0.0240.0270.2990.034−0.1200.116−0.149
39.3099.309−0.020−0.007−6.765 × 10−40.010−0.074−0.0070.086−0.155
49.3099.3090.0030.031−9.158 × 10−40.323−0.045−0.037−0.128−0.155
59.3099.3090.012−0.013−6.446 × 10⁻⁴−0.2650.108−0.136−0.0530.17
Note: The table shows the additive decomposition of predicted values for five test cases within the Governance (G) component. Each variable’s contribution is expressed as a deviation from the base prediction (9.309), illustrating how governance indicators such as CPD, CCF, and REU subtly influence model output. The small variations confirm the stability and coherence of the dataset and the balanced behavior of the machine learning model.
Disclaimer/Publisher’s Note: The statements, opinions and data contained in all publications are solely those of the individual author(s) and contributor(s) and not of MDPI and/or the editor(s). MDPI and/or the editor(s) disclaim responsibility for any injury to people or property resulting from any ideas, methods, instructions or products referred to in the content.