Article

Impact of Authenticity Perception on Experiential Value and Customer Satisfaction under Contactless Services

Department of Business Administration, National Yunlin University of Science and Technology, Yunlin 64002, Taiwan, China
*
Author to whom correspondence should be addressed.
Systems 2024, 12(1), 19; https://doi.org/10.3390/systems12010019
Submission received: 29 November 2023 / Revised: 30 December 2023 / Accepted: 1 January 2024 / Published: 9 January 2024

Abstract

:
The global economy has been profoundly affected by the COVID-19 pandemic. This impact is particularly evident in the restaurant industry, where restaurant traffic has dropped significantly, leading to a decline in revenue. In response to the impact of the pandemic, non-contact services, such as overseas delivery and door-to-door delivery, have been implemented to reduce interpersonal contact and minimize the spread of the virus. Contactless service not only provides consumers with more choices and convenience but is also an important means of livelihood for restaurant service staff during the pandemic. This study takes the Taiwanese chain restaurant Kura Sushi as an example to explore the impact of service contacts on authenticity consumption and experience value in the context of non-contact services. A total of 318 valid responses to a questionnaire were collected and analyzed using IBM SPSS 25.0 and IBM AMOS 25.0 software. This study made the following findings: (1) service staff performance has a significant positive impact on authenticity perception; (2) the physical restaurant environment has a positive impact on consumers’ perceptions of authenticity; (3) active interactions with other customers significantly enhance the sense of reality; (4) experience values significantly promote real consumption; and (5) experience values also significantly affect consumer satisfaction.

1. Introduction

1.1. Research Background and Motives

The COVID-19 pandemic, which has spread around the world since 2019, devastated the global economy. Many countries imposed border closures, quarantine measures, and social restrictions in response to the pandemic, and many businesses closed, laid off workers, or temporarily shut down. In addition, global trade, tourism, and restaurants were severely affected, leading to massive job losses and economic decline. Affected by the pandemic, people became more cautious in their social interactions. The Central Epidemic Command Center in Taiwan raised the COVID-19 alert level to Level 3, and the government required restaurants to halt dine-in service and provide take-out service only [1].
The emergence of contactless services could provide a way for the food and beverage (F and B) industry to respond to the current and future pandemic. Contactless services can avoid physical contacts between restaurant workers and customers to reduce the risk of virus transmission, ensure food service safety, reduce the risk of food contamination and infection, and increase consumer confidence in food safety. Contactless services can simplify the process of ordering, making payment, and picking up food, thereby reducing the amount of time customers have to wait in line and improving the efficiency of the restaurant industry. Such self-service technology can reduce personnel costs, improve service speed, efficiency, and order accuracy, as well as create service differentiation [2].
With the pandemic significantly changing people’s daily lives, the norms that existed prior to the pandemic can never be restored. This does not exclude previously perceived service encounters in the F and B industry. Fitzsimmons et al. [3] proposed that service encounter is a process of direct interaction between consumers and the institution or personnel providing the service. Meanwhile, service staff performance directly affects consumers’ overall evaluation of the service delivery process and service quality [4].
Keller [5] confirmed that the physical surroundings of a restaurant affect consumers’ authenticity perception as a whole. Winsted [6] proposed that the interaction with other customers is important and affects customers’ perceived authenticity of consumer products. According to the above studies, the service staff performance in the service encounter, the physical surroundings, and positive interactions with other customers are all important factors in the process of service delivery.
A number of studies argued that authenticity in service encounter needs to be emphasized [7,8,9]. Authenticity is a key quality indicator for enterprises. Consumers feel the authenticity of services provided by enterprises through the service staff performance, the design and layout of the physical surroundings, and the process of interaction with other customers. However, as the pandemic escalated, authenticity perception has evolved to respond to the needs of consumers_ and the ecology of the global crisis. During the pandemic, presenting authenticity perception and gaining consumer satisfaction has become one of the key factors for a company’s success.
Taiwan’s F and B industry suffered an unprecedented impact as a result of the COVID-19 pandemic. The F and B industry is one of the service industries that are closely related to daily life. However, because it is not possible to use protective measures such as masks when dining in restaurants, contactless service has become a prominent measure in this line of business. Hence, this study focused on restaurants.
The COVID-19 pandemic has created tremendous pressure to provide and receive contactless services [10,11]. However, without contact, communication between consumers and service staff is reduced or canceled, which may affect consumers’ satisfaction with and trust in the services provided by enterprises. The space of the service encounter is also shifting from occurring in physical stores to Internet or other virtual platforms, and the location where consumers receive services is also shifting to their homes or other non-physical locations. These related effects also change in contactless services. Consumers’ perceived authenticity and the experiential value may be affected by the lack of physical contact. These related effects warrant further study.
Kura Sushi is a revolving sushi restaurant in Japan, founded in 1977 and headquartered in Osaka Prefecture, Japan’s second largest city. The company has over 500 stores in Japan. In 2014, Kura Sushi entered Taiwan—the only Japanese revolving sushi restaurant with the largest number of stores in the country. The company had its revenue rebounded and stabilized during the pandemic mainly by introducing automated technologies, such as the first “SENDO-KUN” (sushi shield) IC chip to control the freshness of the ingredients and prevent airborne bacteria and dust from touching the food; the “E-queue Reservation”, a fast and convenient app system for advanced reservations to save time in the queue; the “Mobile Ordering System”, which allows customers to browse the online menu and order directly from their smartphones, reducing unnecessary contact; the “Touch-screen Ordering”, which allows customers to order their favorite products through the screen provided in the store; the “AI Table Counting”, which automatically counts the number of plates without the need for any person to come and touch them; the “Zero-touch Self-checkout”, which allows customers to conveniently complete the checkout process without having to go to the cashier.
Kura Sushi has adopted contactless services, from booking, ordering, picking up food, and making payment, to implement true contactless services [12]. Therefore, this study took Kura Sushi as the research target to explore the impact of service staff performance, physical surroundings, and positive interactions with other customers on authenticity perception, experiential value, and customer satisfaction in the post-COVID-19 era.

1.2. Research Purpose

Based on the above research background and motivation, the purposes of this study are as follows:
  • To explore the impact of three elements of service encounter for contactless services, namely, service staff performance, physical surroundings, and positive interactions with other customers, on consumers’ perceived authenticity, consumers’ authenticity perception, the impact of authenticity perception on experiential value, and customer satisfaction.
  • To provide practical suggestions and references for enterprises, so as to help enterprises to lay a solid foundation for their long-term development due to the impact of the pandemic.

2. Literature Review

2.1. Contactless Services

2.1.1. Definition of Contactless Services

The world has witnessed the emergence of innovative new technologies related to the F and B industry. In particular, drones have opened up unlimited possibilities for food delivery [13,14]. In the past, contactless food pickup, unmanned stores, unmanned supermarkets, and drones were available. During the pandemic, due to the need for social distancing, most people chose to stay at home, which thus increased the need for contactless food delivery services. Food service providers responded to this dramatic change by adopting more flexible business models, including taking additional precautions to minimize physical contact, such as expanded hygiene practices, providing more take-out services, and expanding drive-through and delivery options [15].
The impact of the COVID-19 pandemic has placed enormous pressure on the provision of, and access to, contactless services [10,11]. The term contactless refers to maintaining a certain distance between people or between people or things, without direct contact [16].
Lee and Lee [17] defined contactless service as service that is provided through digital technologies without face-to-face encounters between staff and customers. Different types of contactless services have been developed according to the needs of consumers, and personalized customer experiences have been provided [18,19,20,21,22].
Lee and Lee [23] suggested that while some of the contactless services already in place during the pandemic may revert to traditional face-to-face services, innovative contactless services that have been proven effective would remain practiced and even promoted in the post-pandemic era.

2.1.2. Contactless Service Model

Lovelock and Young [24] proposed that self-service technology allows consumers to serve themselves. It has changed the contact service and subverted attitudes towards traditional service provision. Ledingham [25] stated that when technology is applied in service, customers would feel that the service is more efficient and saves time compared to human service. Contactless services are often provided through advanced technologies such as artificial intelligence (AI), the Internet of Things (IoT), virtual reality (VR) or augmented reality (AR), big data, and cloud platforms [17].
The COVID-19 pandemic has amplified the demand for contactless services, changing global food service delivery models and channel patterns. In response, many companies are focusing on acquiring new business opportunities in the digital economy by combining the application and innovation of new technologies. The contactless service model can be divided into three major models: online reservation services, digital self-service ordering kiosks, and home delivery, which are introduced below.
  • Online reservation services: in 1999, Open Table launched the first online restaurant reservation service [26]. In order to address social distancing, consumers can save time waiting in line outside the restaurant through online reservation services. With online reservation services, new customers and old customers can be registered to ensure more a customized consumption experience, and the average consumption amount and product items of consumers can be learned from the back-office interface [27], thus improving the service quality of restaurants.
    In 2012, MOS Burger launched an online ordering app, the MOS Order, making it the first fast food company in Taiwan to launch mobile app ordering, allowing consumers to order through the app to reduce wait times [28,29].
    Starbucks Taiwan launched the Mobile Order and Pay feature (MOP) feature in 2021.
    In order to allow customers visiting during peak hours to save time waiting in line in the store, Starbucks Taiwan introduced a new service to provide VIP members with a more convenient experience [30]. The Action pre-order service aims at low contact and secure delivery and enables consumers to complete online ordering and payment, thereby reducing contact risks;
  • Digital self-service ordering kiosks: McDonald’s Taiwan introduced its first digital self-service ordering kiosks in April 2018, allowing consumers to browse menus conveniently, and pay with multiple payment methods [31]. The use of digital self-service ordering kiosks allows consumers to complete their own ordering and conduct cashless payments, thus minimizing physical contact between people;
  • Home delivery: this model is mainly used for making food deliveries, fresh retail, logistics, and other industries. HCT Logistics has promoted contactless signing and the use of technology to ensure the health and safety of customers and deliverers through services such as zero contact, QR code mobile phone signing, and photo message signing [32] to avoid the risk of person-to-person contact. In order to protect the health and safety of consumers and delivery partners, Foodpanda, an instant delivery platform, provides contactless delivery on its app interface, so that consumers can easily order and pick food without physical contact. Meanwhile, it has called on consumers to use online cards to order food and implemented contactless delivery to reduce encounters and decrease the risk of transmission.

2.2. Service Encounter

2.2.1. Definition of Service Encounter

Solomon et al. [33] defined the service encounter as “establishing a long-term interactive relationship with customers through face-to-face interactions between customers and service providers in the process of service to address various problems related to service marketing caused by service characteristics”. Carlzon and Peters [34] regard the service encounter as a moment of truth, indicating that the service encounter is a core element of service. According to Crosby et al. [35], the “service encounter, or moment of truth, occurs whenever the customer interacts directly with any contact person.” Morgan and Chadha [36] defined the service encounter as “the direct contact between customers and company representatives, which resulted in mutual interaction and two-way communication”.

2.2.2. Elements of Service Encounter

McCallum and Harrison [37] propose that the service encounter is one of the earliest and most important social contacts. Shostack [38] suggests that the service encounter is the interaction between customers and service providers, in which interaction is interpersonal contact and communication, and it is also the core of most service experiences [7]. Fang and Hsu [39] suggest that in the process of service provision, the service encounter affects customers’ cognition of service quality.
Baker [40] divided the elements of the service encounter into three categories, which are described below.
(1)
Ambient factors: the background situations that affect people’s potential awareness, such as temperature, sound, smell, light, and cleanliness, will affect whether customers are willing to stay or return to the environment. Customers usually do not immediately perceive or realize these potential factors, but these can easily have an invisible influence on the customer’s mind;
(2)
Design factors: obvious visual stimuli, such as external architectural designs, materials, and color service facilities, have a strong impact on customer perception;
(3)
Social factors: the appearance and behavior of personnel in the service environment, including personnel in the service environment and other customers, affect the customers’ perception.
Machleit and Eroglu [41] pointed out that an improvement in the music environment improves customers’ perceptions of crowding in their physical surroundings, thus further affecting customers’ shopping feelings and satisfaction with the store. Therefore, customers’ purchase intentions are strongly influenced by store environments [42]. Hence, the physical surroundings in which services are provided are conducive to service marketing and influencing service behavior.
The service encounter has three elements, namely, service staff performance, physical surroundings, and positive interactions with other customers [8]. The first element, service staff performance, refers to the quality of service provided by service staff, including the attitude, posture, mood, speed, and professionalism of service staff [43]. In the service encounter, service staff must have contact with customers; the customer’s feelings are very important. Service staff are the first line of contact with customers during the service encounter. For customers, staff are the representatives of the enterprise, and staff attitudes and behaviors have a profound impact [44]. The attitude, expertise, and efficiency of service staff all affect the perceived authenticity of the interactions between customers and service staff [45,46]. Therefore, service staff performance and behaviors in their interactions with customers have a great impact on customer experience.
The second element, physical surroundings, refers to the places where service takes place, including the space and facilities where services are delivered. Bitner [47] suggested that physical surroundings are divided into external facilities, including external designs, symbols, and parking lots; internal facilities, including interior designs, interior furnishings, and equipment; and other tangible elements, such as company uniforms, posters, and business cards. The interior design and decoration are the main constructs that form the image of a restaurant, and the design and arrangement of the dining environment can enhance the pleasant and satisfying dining experience of customers [48]. The dining environment created by a restaurant should be harmonious and make customers feel relaxed and comfortable, and also take into account the privacy of customers [49]. Keller [5] suggested that the service performance, facilities, and decorations of a restaurant affect customers’ authenticity perceptions as a whole.
The third element is positive interactions with other customers. Many service encounters occur when there is a need to co-exist or share a service environment with other customers. Winsted [6] reported that interactions with other customers are important and affect customers’ evaluations of the authenticity of consumer products. When customers co-exist in the same environment, the existence and behavior of some customers indirectly affect other customers and generate interpersonal encounters and interactions, potentially affecting the perception of other customers [50].

2.2.3. Research on Service Encounter

Surprenant and Solomon [51] propose that customers and staff are interdependent in the process of personnel service encounters. Berry and Parasuraman [52] suggest that how service staff present themselves to customers in the service process (e.g., behavior, conversation, and appearance of service staff) and the interaction in service encounters affect customers’ behavioral and repurchase intentions. Keller [5] pointed out that in a restaurant, the physical surroundings of the service encounters affect customers’ authenticity perception as a whole, and further affect their behavioral intentions. When customers have a positive perception of the service quality, they think that the service is valuable, and show satisfaction in the service they consume. Moreover, they have more obvious intentions for future consumption and become more loyal customers of the organization.

2.3. Authenticity Perception

2.3.1. Definition of Authenticity Perception

Bruhn et al. [53] integrated the previous definitions of authenticity in various fields and found that the perception of authenticity is a multi-faceted construct that covers originality, reliability, sincerity, naturalness, unaffectedness, credibility, and persuasiveness, and is closely related to independence. Authenticity refers to the degree to which it reflects the reality of things. Weber reported that perception can be seen as the ultimate integration of sensory information and the most meaningful experience. Senses are basic states of consciousness, while perception involves a deeper level of understanding and interpretation. The degree of perception can vary from person to person, and each person has a different understanding of senses [54].

2.3.2. Research on Authenticity Perception

Stern [55] linked an advertisement’s authenticity with the credibility of its persona or spokesperson. When customers think that an advertisement is highly authentic, they have a positive experience towards the brand and evaluate the brand as being more reliable and using better materials.
Leigh et al. [56] reported that social and personal attributes are related to customers’ authenticity perceptions and brand experiences, especially in enterprises that focus on symbolic value and meaning, such as the fashion industry [57]. For service brands, authenticity is one of the key factors in creating consumer behavioral intent [58].
Hwang et al. [59] pointed out that brand authenticity is different between robotic and human services. They also maintained that it contributes to brand satisfaction and brand preference and has a positive impact on brand loyalty. Service staff play a moderating role between utilitarian values and brand authenticity.

2.3.3. Impact of Authenticity Perception

Regarding the relationship between authenticity perception and experiential value, Casey et al. [60] pointed out that if authenticity perception clues are added to products, customers’ perception evaluation of the products could be improved. According to Mathwick et al. [61], consumers’ cognition and preference for product attributes or service performance form their evaluation of experiential value. The value increase can be realized through interactions because interactions can help or hinder the achievement of consumer goals. The consumer’s sense of a service, whether it triggers personal perception and then enhances the experiential value of the service activity, is important. In this study, consumers’ experiences in the service process and encounters were regarded as the authenticity perception.
According to the above literature, service staff performance in a restaurant, the physical surroundings, and positive interactions with other customers all influence consumers’ authenticity perception evaluation. Therefore, the following hypotheses are proposed in this paper:
H1: 
Service staff performance in a restaurant has a positive impact on consumers’ authenticity perception.
H2: 
The physical surroundings of a restaurant have a positive impact on consumers’ authenticity perception.
H3: 
Positive interactions with other customers have a positive impact on consumers’ authenticity perception.

2.4. Experiential Value

2.4.1. Definition of Experiential Value

Holbrook and Corfman [62] defined experiential value as the “basis of consumer preference after the consumers have direct interactions with a product or service, that is, the consumers’ overall feelings, comments and opinions about the product or service after they have paid for the product or service.” Experiential value is based on consumers’ experience and interactions when using products or services directly, which has a significant impact on personal preference and experiential value after consumption. The experience generated by such an interaction contains the basis of relative preference and influences consumers’ perceived value of products or services.
Mathwick et al. [61] defined experiential value as follows: “Consumers’ cognition and relative preference for product attributes or service performance can be improved through interactions, thus increasing the sense of value. In the process of interaction, it will help consumers achieve their goals, or vice versa.” As customers’ consumption experiences can be shaped, service providers only need to offer the right environment and scene to create a rich experience situation, trigger customers’ desire for an experience, and create value to enhance competitiveness [63]. For customers, experience is a response to a stimulating-feeling and experience. Enterprises should adjust their value creation behavior to adapt to the era of the experience economy.

2.4.2. Measurement Constructs of Experiential Value

The empirical value typology proposed by Holbrook [64] and revised by Mathwick et al. [61] can be divided into four quadrants, with intrinsic and extrinsic sources of value on one axis and active and reactive values on the other axis. The four experience values in the four quadrants are: (1) customer investment return: consumers’ financial investment, time investment, and behavioral investment; (2) service excellence: consumers’ recognition of the services provided by the company; (3) aesthetics: visual appeal during the service process and pleasure; and (4) consuming entertainment: something that provides a temporary escape from real life. Consumers’ interactions with products, services and experiences during participatory experiences can enhance or weaken their consumption perspectives and values.

2.4.3. Research on Experiential Value

Holbrook [64] suggested that value is formed by the interactions between consumers and products. Value has the characteristics of preference, which includes consumers’ preference judgment for products; value is a relative concept that refers to the evaluation or ordering of two or more items so that they can be compared. Meanwhile, value also has personal characteristics due to people having different values, and these views affect their evaluation and judgment of the situation after the occurrence. Value also comes with experience, not in the product purchased, the brand chosen, nor the ownership of the product, but in the experience of consumption.
Mathwick et al. [61] indicated that customer value in view of experience is called experiential value. The perception of experiential value is formed by people’s behaviors, such as direct utility or remote appreciation of products or services; experiential value is their cognition and relative preference for product attributes or service performance. The increase in value can be achieved through interactions.
Chang et al. [65] argued that tourists hold an attitude of recognition towards the experiential value, especially the aesthetic part. The experiential value is mainly affected by the emotion and correlation of experience marketing. Specifically, the correlation has the greatest impact. As long as tourists’ experiences of the correlation of experience marketing are improved, tourists’ experiential value perception of the tourism industry is improved. The experiential value is embodied in sense, emotion, thinking, action, and correlation.

2.4.4. Impact of Experiential Value

In consumers’ view of the product experience, value and satisfaction are intermingled [66], and experience value and customer satisfaction have a positive relationship. Oliver [67] proposed that the judgment of satisfaction comes from the emotional level and that the evaluation of satisfaction covers the whole experience process of the service transaction, the special behavior of the service industry and interactions with customers in the entire service context. Lee and Overby [68] pointed out that all value types positively affect customer satisfaction. When the consumers experience higher values, their travel satisfaction is also higher. Holbrook [64] emphasized that there is a correlation between value and experience, and that value is formed after the use of products or services. Lin used Formosan Aboriginal Culture Village as an example to discuss experiential value, customer satisfaction, and repurchase intention, in which experiential value was divided into the four constructs of consumer return on investment, service excellence, aesthetics, and playfulness. According to the literature, the authenticity perception of consumers is correlated with experiential value.
H4: 
Customers’ authenticity perception has a positive impact on experiential value.

2.5. Customer Satisfaction

Definition of Customer Satisfaction

Customer satisfaction defines the impact of the gap between customer anticipation and reality on customer satisfaction and repurchase intention [69]. Crosby et al. [35] explained that when consumers feel satisfied with their interactions with sellers, and the products and services are worthy of their trust, consumers increase their relationship with the sellers. According to Petrick et al. [70], enterprises know that it is important to analyze customer satisfaction. When an enterprise can identify the factors that influence consumer satisfaction with a product or service, it may be able to change the consumer experience when using the product or service so that consumers can obtain maximum satisfaction.
Kotler indicated that customer satisfaction refers to whether the actual results of purchased products or services are consistent with the expectations. In other words, it is a way of assessing the gap between the degree of consumer expectation and the actual perception. Satisfaction is determined by the difference between consumers’ perceived performance of goods or services and their original expectations after purchase and consumption. If the perceived satisfaction is higher than expected this means that the customer is satisfied, and vice versa. The greater the difference, the higher the degree of satisfaction or dissatisfaction. The satisfaction evaluation process encompasses the whole experience process of service delivery, especially interactions with customers [67].
According to Bearden and Jesse [71], Churchill and Surprenant [72], and Woodside and Daly [73], customer satisfaction is a kind of consumption attitude formation that reflects the degree of consumers’ feelings after purchasing goods or using services, including likes and dislikes. In other words, customer satisfaction can be viewed as feedback after the consumer experience that shows the consumer’s attitude towards the product or service. Fornell [74] suggested that satisfaction is a holistic feeling that can be regarded as the expression of consumers’ attitude towards the overall experience of the service or product they have received, reflecting their comprehensive like or dislike of the experience. Lee and Overby [68] pointed out that all value types positively affect customer satisfaction. When the consumers experience higher values, their satisfaction is greater. According to the literature, experiential value has a positive relationship with customer satisfaction and repurchase intention. Therefore, this study proposed the following hypothesis:
H5: 
Experiential value has a positive impact on customer satisfaction.

3. Research Method

Based on the above literature review, this study established a research framework and developed hypotheses. This section is divided into three parts. Part 1 is the research structure, part 2 presents the research subjects, and part 3 is the questionnaire design. The research framework is shown in Figure 1.
The research questionnaire was designed according to the research framework, and empirical data were collected to verify the validity of the five hypotheses in this study.

3.1. Research Subjects

This study adopted the questionnaire survey method. Questionnaires were issued and filled out through Surveycake to collect relevant information by convenient sampling. The sampling subjects were consumers who had received services from Kura Sushi. The subjects came from the general public, and there were no other restrictions. The purpose of the survey was to explore the correlation between service encounters, authenticity perception, experiential value, and customer satisfaction with Kura Sushi.
Because of the impact of the COVID-19 pandemic, contactless services have become an accepted way to receive services. Lee and Lee [17] defined contactless service as service that is provided through digital technologies, without face-to-face encounters between staff and customers. Kura Sushi established a complete contactless service system during the pandemic that included a fast and convenient reservation app system and a touch screen for menu selections. The store also introduced a mobile ordering service system through which users could easily browse the online menu and order food by scanning a QR code with smartphones. Meals were delivered to customers without contact via a conveyor belt. Meanwhile, an automatic checkout system was introduced, so that customers could quickly make payment without the need for a cashier. A contactless dining environment—from the moment customers enter the restaurant to the moment they leave—was created, reducing the contact between service staff and consumers. Meanwhile, the store implemented non-contact epidemic control measures to make contactless consumption become a daily pattern of consumers; therefore, the needs of the research purpose of the questionnaire were met.
The questionnaires were distributed for two months, from 4 February 2023 to 4 April 2023. The duration to complete the questionnaire was about five minutes. The collected questionnaires with blank, omitted, or incomplete answers were eliminated. A total of 318 valid questionnaires were retrieved.

3.2. Questionnaire Design

The variables measured in this study were service staff performance, physical surroundings, positive interactions with other customers, authenticity perception, experiential value, and customer satisfaction.
Three constructs of service staff performance (interactions between customers and service staff), physical surroundings, and positive interactions with other customers (impact of customers on customers) were integrated. There were 40 items in total. The five items for service staff performance were modified from the questionnaire developed by Baker et al. [43]. Physical surroundings were divided into ambient factors and design factors, and the questionnaire items were modified from the research questionnaire developed by Wakefield and Baker [75]. There were six items, with three items for each item. The operational definitions of Mcgrath and Otnes [76] and Parker and Ward [77] were used as references for positive interactions with other customers, and four types of interactions were summarized, containing four items. The measurement method of authenticity perception by Chhabra et al. [78] was adopted to measure customers’ overall authenticity perception, containing seven items. The experience consumption value proposed by Holbrook [64] and Mathwick et al. [79] was adopted to develop four constructs, namely, return on investment, service excellence, aesthetics, and playfulness to measure the experience value. There were 12 items, with three items for each construct. For customer satisfaction, the measurement method of Crosby et al. [35] was adopted to learn consumers’ subjective attitude towards the comprehensiveness and integrity of the products or services they received, containing six items. In addition to the basic information, all other constructs in this questionnaire were scored on a Likert five-point scale, ranging from 1 (strongly disagree) to 5 (strongly agree). The item contents are shown in Table 1.

4. Research Results

4.1. Analysis of the Sample Population Characteristics

The research subjects of this study included consumers who had dined in Kura Sushi during the pandemic and were deeply impressed by their experience with its services. The survey was conducted from 10 February to 31 March 2023 by distributing 450 formal questionnaires on the Internet. Recovered questionnaires with the same or missing answers were removed. Hence, 318 valid questionnaires were collected, with a validity return rate of 70.1%.
According to the recommendation of Schumacker and Lomax [80], the sample size should be between 200 and 500 for a structural equation modeling (SEM) study. The 318 valid samples of this study met the criterion.

4.1.1. Gender

Among the 318 valid samples, most respondents are females (204, 64.2%), and 114 are males (35.8%). The chi-square test value was 2.283, with a degree-of-freedom of 1 and a p-value of 0.131, greater than the α value of 0.05, indicating that the sample was representative. The chi-square analysis showed that the proportion of male and female subjects in the recovered samples was the same as the proportion of the actual parent population.

4.1.2. Age

In terms of the age distribution, 247 respondents are between 21 and 30 years old (77.7%), 29 are between 31 and 40 years old (9.1%), 18 are under the age of 20 (5.7%), 16 are between 41 and 50 years old (5%), 7 are between 51 and 60 years old (2.2%), and 1 is over 71 years old (0.3%).

4.1.3. Educational Level

In terms of educational level, the majority of the subjects are university graduates (166, 52.2%), while 129 have master’s or doctorate degrees (40.6%), 19 have a high school education (6%), and 4 have a junior high school education (1.8%).

4.1.4. Work industry

In terms of work industry, 183 subjects are students (57.5%), 29 work in other industries (9.1%), 26 work in the hospitality industry (8.2%), 22 work in the manufacturing/electronics industry (6.9%), 14 work in the financial industry (4.4%), 13 are in the military, civil servants, or teachers (4.1%), 13 work in the business/trade industry (4.1%), 11 are freelancers (3.5%), 5 work in the medical industry (1.6%), and 2 work in the farming, forestry, fishing, husbandry, and mining industries (0.6%).

4.1.5. Monthly Personal Income

Regarding monthly income, 201 subjects have monthly personal incomes of NTD 30,000 and below (63.2%), 53 have incomes between NTD 30,001 and NTD 40,000 (16.7%), 29 have incomes between NTD 40,001 and NTD 50,000 (9.1%), 13 have incomes between NTD 60,001 and NTD 70,000 (4.1%), 12 have incomes between NTD 50,001 and NTD 60,000 (3.8%), 3 have incomes between NTD 70,001 and NTD 80,000 (0.9%), 3 have incomes above NTD 100,000 (0.9%), 2 have incomes between NTD 80,001 and NTD 90,000 (0.6%), and 2 have incomes between NTD 90,001 and NTD 100,000 (0.6%). The distribution of the results is summarized in Table 2. According to The Internal Revenue Service of the U.S., the average exchange rate USD to NTD for 2022 is 29.813, and according to the Directorate General of Budget, Accounting and Statistics of Taiwan, Taiwan’s per capita GDP is $32,756 in 2022.

4.2. Reliability and Validity Analyses

Reliability analyses can measure the stability and consistency of questionnaire results. Cronbach’s α coefficient was used in this study. A higher reliability coefficient indicates higher stability and consistency in a questionnaire. A reliability coefficient above 0.70 or higher is considered acceptable. If the reliability coefficient is below 0.60, it is more appropriate to consider revising the research tool [81]. The Cronbach’s α values in this questionnaire were all greater than 0.80, indicating high consistency among items and the internal consistency of each construct. Therefore, the items had good reliability, and the results measured in this study were credible and representative. The analysis results of the measurement items of each variable are shown in Table 3:
For validity analysis, confirmatory factory analysis (CFA) has the following advantages: (i) clear expectations of the number of constructs included in tests and the relation between the constructs and test indicators; and (ii) more accurate and includes hypothetical testing. The test structure is inferred from observing the model fit between the measurement indicators and hypothetical model under the situation of eliminating measurement errors. In this study, CFA was conducted for all six constructs of the model (Figure 2, Table 4). The factor loading was 0.54–0.844, the component reliability was 0.781–0.936, and the average of variance extracted (AVE) was 0.38–0.86. These were in line with the criteria proposed by Hair et al. (2009) and Fornell and Larcker (1981). The factor loading was greater than 0.5, with the best state being greater than 0.7. The composite reliability (CR) was greater than 0.7. The factor loading must be higher than 0.7 when the AVE is greater than 0.5. However, considering the actual orientation of the data, the AVE can be higher than 0.36 to avoid forcible acceptance of the thresholds. This being the case, all six constructs had convergent validity. The collated data are shown in Table 4.

4.3. Confirmatory Factor Analysis

This study carried out CFA for all constructs. The standardized factor loads of the six constructs in the model were in the range of 0.540–0.844 and showed a significant relationship, representing a good measurement relationship. A construct with a CR value higher than 0.7 and an AVE value greater than 0.5 indicates that its factor load should be higher than 0.7. According to the data collected in this study, the AVE value can also be higher than 0.36 as barely acceptable. Therefore, all six constructs had convergence validity. The analysis results of the factor load coefficients are shown in Table 4.
Based on whether the data obtained from the evaluation and observation of the model fit the model proposed in this study, the fit index of the overall theoretical model in this study was as follows: x2/df = 3.334, GFI = 0.695, AGFI = 0.660, RMSEA = 0.086, and CFI = 0.824. Bagozzi and Yi [82] proposed that the chi-square value can be replaced by the ratio of the chi-square value to the degree of freedom to test the fit of the model and suggested that the ratio should be between 1 and 5. The ratio of the chi-square value to the degree of freedom in this study was 3.334, and the model and data fit of the results were acceptable. GFI > 0.8, AGFI > 0.8, RMSEA < 0.08, and CFI > 0.8 represent acceptable values of model fit, as shown in Table 5.

4.4. Correlation Analysis
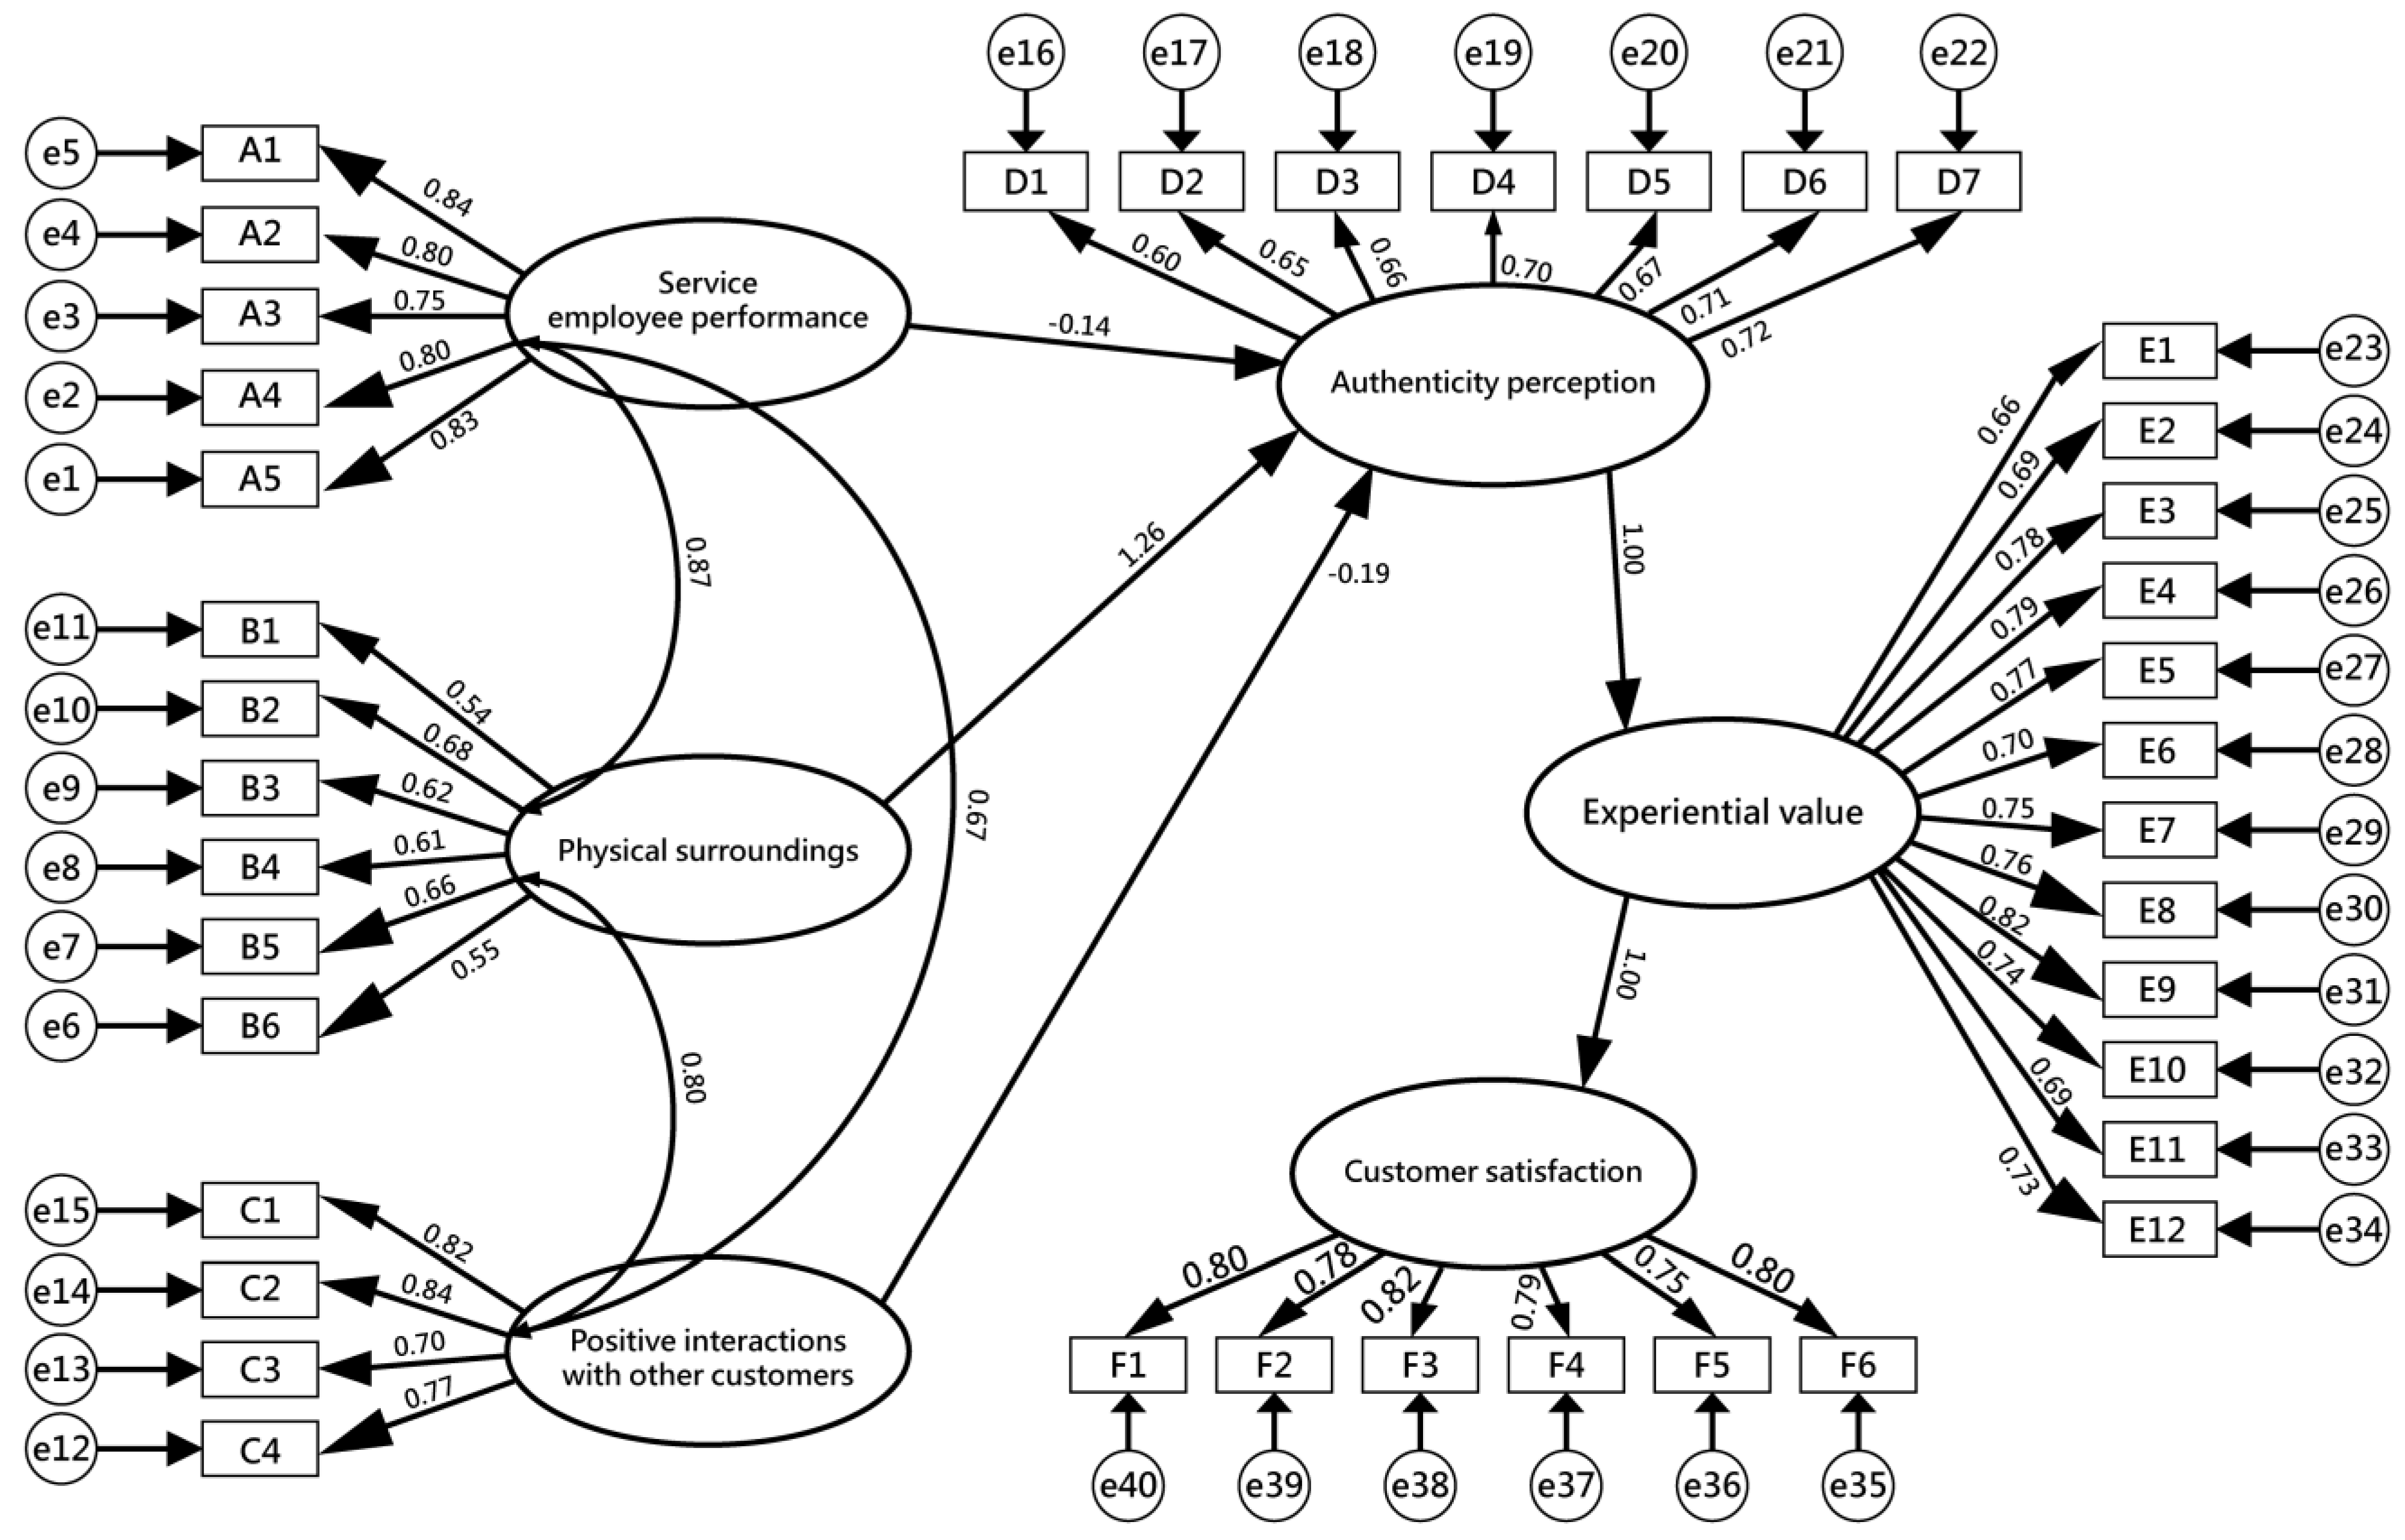
According to the Pearson correlation analysis, a higher correlation coefficient value indicates a higher correlation. If the coefficient value is above 0.7, it has a strong correlation; if the coefficient value is between 0.3–0.7, it has a medium correlation; if the coefficient value is below 0.3, it has a small correlation. Table 6 shows the relationships between service staff performance, physical surroundings, positive interactions with other customers, authenticity perception, experiential value, and customer satisfaction. The correlation coefficient matrix of the six variables was obtained through correlation analysis, and each construct reached a significant level. The correlation coefficient between experiential value and authenticity perception was 0.836, and the correlation coefficient between customer satisfaction and experiential value was 0.875, indicating a strong correlation between the two variables.

4.5. Path Analysis

As seen in Figure 3, the path coefficient of service staff performance on authenticity perception was 0.40, and the p value was significant; the path coefficient of physical surroundings to authenticity perception was 0.47, and the p value was significant; the path coefficient of positive interactions with other customers to authenticity perception was 0.25, and the p value was significant; the path coefficient of authenticity perception to experiential value was 0.78, and the p value was significant; the path coefficient of experiential value to customer satisfaction was 0.85, and the p value was significant.
According to the path analysis in Table 7, the standard coefficient of service staff performance to authenticity perception was 0.404; the standard coefficient of physical surroundings to authenticity perception was 0.467; the standard coefficient of positive interactions with other customers to authenticity perception was 0.252; the standard coefficient of authenticity perception to experiential value was 0.779; and the standard coefficient of experiential value to customer satisfaction was 0.846.

4.6. Hypothesis Verification

Based on the above path analysis coefficients, the verification analysis results of the research hypothesis are listed in Table 8 below.
From the path coefficients of the above path analysis, the results of this study indicated that: service staff performance in a restaurant has a positive impact on consumers’ authenticity perception; the physical surroundings of a restaurant has a positive impact on consumers’ authenticity perception; positive interactions with other customers have a positive impact on consumers’ authenticity perception; customers’ authenticity perception has a positive impact on experiential value; and experiential value has a positive impact on customer satisfaction. In other words, all five hypotheses are supported.

5. Conclusions and Suggestions

5.1. Conclusions

This study focused on contactless services and took Kura Sushi as an example to discuss the impact of three elements of service (service staff performance, physical surroundings, and positive interactions with other customers) on consumers’ authenticity perception, experiential value, and customer satisfaction.

5.1.1. Impact of Service Staff Performance on Authenticity Perception

The results of this study showed that service staff performance during a service encounter has a significant positive impact on consumers’ authenticity perception, which means that good service staff performance can increase consumers’ perception of service authenticity. This finding is consistent with previous studies [45,46], which suggested that the attitude, expertise, and efficiency of service staff all affect the perceived authenticity of the interactions between customers and service staff.

5.1.2. Impact of Physical Surroundings on Authenticity Perception

The results of this study showed that physical surroundings have a significant impact on consumers’ authenticity perception. This finding is consistent with Keller [5], who suggested that the service performance, facilities, and decoration of a restaurant affect customers’ authenticity perception as a whole. The design of the physical surroundings for contactless services is a new experience and is greatly different from the physical surroundings design of traditional restaurants. The physical surroundings design for contactless services can increase the sense of security of consumers, as they can reduce the encounters with others. Existing studies have demonstrated that customers’ feelings about the restaurant environment affect customers’ behavioral intentions. Levitt also found that the average consumer judges the physical aspects (e.g., the restaurant’s appearance or interior decoration) as part of their evaluation of the dining experience.

5.1.3. Impact of Positive Interactions with Other Customers on Authenticity Perception

The research results showed that positive interactions with other customers have a significant positive impact on the perception of authenticity of services. This indicates that positive interactions with other customers can make consumers experience a more authentic and sincere service experience. This result is consistent with Winsted [6], who found that interactions between other customers are important and affect customers’ authenticity evaluation of consumer products.

5.1.4. Impact of Authenticity Perception on Experiential Value

The research results showed that authenticity perception has a significant positive impact on experiential value, which means that when consumers believe the service is authentic, they give a positive evaluation of the experiential value. This finding is consistent with previous studies [83,84]. Sun et al. [83] confirmed that the authenticity construct has a positive impact on tourists’ perceived value and experience quality. According to Qiu et al. [84], authenticity perception has a positive and significant impact on experiential value.

5.1.5. Impact of Experiential Value on Customer Satisfaction

The results of this study showed that experiential value has a significant positive impact on customer satisfaction, indicating that when consumers think they have had a valuable experience, they are more satisfied with the service providers. This finding is consistent with previous studies [85,86]. Gallarza et al. [85] suggested that consumer value is an important factor affecting customer satisfaction, and that the level of experiential value indirectly affects customers’ perception of consumption value [61]. Experiential value is the pre-factor of customer satisfaction. Chang [86] reported that experiential value has a positive and direct impact on satisfaction.

5.2. Theoretical Implications

Previous research on authenticity perception was mostly conducted in the tourism industry, with few studies examining the impact of authenticity perception on the F and B industry. Therefore, this study examined the impact of contactless service on authenticity perception during the COVID-19 pandemic. Based on authenticity perception, this study discussed the relationship between authenticity perception and experiential value and customer satisfaction.
We investigated the impact of service employee performance, physical surroundings and positive interactions with other customers on authenticity perception, the impact of authenticity perception on experiential value, and the impact of experiential value on customer satisfaction for the F & B industry with respect to contactless services. While we focused on one restaurant, we also investigated the relationship between authenticity and experiential value and contactless services. This research is still a work in progress and in future, a theoretical framework based on the empirical model presented in this study could be further developed.

5.3. Practical Suggestions

After the COVID-19 pandemic, some contactless services may return to traditional face-to-face service, as the performance of service staff has a better mediating role than robots in terms of utilitarian values [59]. In this study, the performance of Kura Sushi’s service staff in welcoming customers to their seats through Japanese greetings and Japanese service could make consumers feel as if they were enjoying sushi in Japan without any difference in distance. Therefore, the performance of the service staff in this study had a significant impact on consumers’ perception of authenticity. The friendly Japanese terminology and service staff attire in Kura Sushi promote the whole atmosphere of the restaurant, making consumers experience the friendly atmosphere of the restaurant. The positive interactions also provide consumers with a better sense of authenticity perception. Kura Sushi’s unique Japanese architecture and classic white color theme make consumers feel as though they are dining in Japan as they experience Kura Sushi’s meticulous and thoughtful service concept. Furthermore, the perfect combination of food and atmosphere is crucial, as it allows the customer to have an immersive experience. Therefore, the physical environment has an impact on authenticity perception.
Prior to the pandemic, service was mostly a direct service between people. However, technology replaced some of this work during the pandemic, and a variety of contactless services began to expand as industries responded to consumer demand. Instead of direct service (i.e., human contact), both online and offline services will exist in the future, not only in the F and B industry but also in other industries, where both types of services need to be systematically established. Becker et al. [87] pointed out that authenticity has different dimensions and can have different effects on different outcomes. Authenticity perception can be enhanced through unique services that can meet the needs of consumers. For example, Kura Sushi presents the original Japanese conveyor belt sushi to the customers both during and after the pandemic while meeting the needs of its customers. As a result, customer satisfaction is enhanced, enabling authenticity perception to have a great impact on experiential value and customer satisfaction.

5.4. Research Limitations and Suggestions for Future Research

This study adopted an online questionnaire survey to collect data. However, consumers may have confused the dining experience at Kura Sushi with that at other revolving sushi restaurants (e.g., Sushiro), which might have further influenced the questionnaire results.
As can be seen from the questionnaires retrieved in this study, the student group accounted for 57.5% of the total valid samples. It is suggested that follow-up researchers expand the samples with different backgrounds. Expanding the samples to include participants with different backgrounds, and adopting various ways to collect opinions, will help to gain a broader and more comprehensive understanding of the consumer feedback of different age groups on the dining experience at Kura Sushi, and will have greater reference value for the promotion and application of follow-up research. For example, stratified sampling can be employed based on different age groups, educational levels, occupations, regions, and other variables to explore different ethnic groups’ views on, and use of, contactless services. Furthermore, through in-depth interviews and other means, researchers can understand the views and experiences of people with different backgrounds and different needs on contactless services.
Because this study focused on customers who had experienced dining at Kura Sushi, it is suggested that the samples be expanded to consumers of other similar restaurants in future research. At present, Kura Sushi is only available in specific regions. It is suggested that in future research, the culture and consumption habits of different regions be considered, in order to more accurately understand the evaluation and satisfaction of customers in different regions on the restaurant.
Each F and B service has unique characteristics and experiential values, and these values have different impacts on customer satisfaction and loyalty. Therefore, future researchers can choose representative F and B formats, such as coffee shops, fast-food restaurants, and other restaurant types to conduct in-depth discussions and research and explore experiential values and impacts on customer satisfaction and loyalty. Through research comparisons of different F and B industries, the experiential value and customer behavior of the F and B industry can be more comprehensively understood, and practical suggestions and improvement methods can be provided for F and B services.
As technology constantly improves, the F and B industry is paying increasing attention to the digital transformation. In the future, researchers can explore the impact of digital transformation on F and B services through digital methods such as online menus, online ordering, data analysis, and other aspects, and explore how to improve customer experiences and satisfaction through digital transformation in an era when we are witnessing many advances in science and technology.

Author Contributions

Conceptualization, C.-C.T.; methodology, Y.-H.C. and C.-L.L.; software, Y.-H.C. and C.-L.L.; validation, Y.-H.C. and C.-L.L.; formal analysis, C.-L.L.; investigation, Y.-H.C. and C.-L.L.; resources, Y.-H.C. and C.-L.L.; data curation, Y.-H.C. and C.-L.L.; writing—original draft preparation, C.-L.L.; writing—review and editing, C.-C.T.; visualization, C.-L.L.; supervision, C.-C.T.; project administration, C.-C.T.; funding acquisition, C.-C.T. All authors have read and agreed to the published version of the manuscript.

Funding

This research received no external funding.

Data Availability Statement

Data are contained within the article.

Acknowledgments

We would like to thank Choice Language Service Co., Ltd. for their services.

Conflicts of Interest

The authors declare no conflicts of interest.

References

  1. Centers for Disease Control, Ministry of Health and Welfare. The Nationwide Level 3 Epidemic Alert Will Be Extended to June 28 in Response to the Continued Severity of Local Infections; Related Measures Remain Effective to Fight against COVID-19 in Community. Available online: https://www.cdc.gov.tw/Bulletin/Detail/0SoUcz9h9xq6wfHsBCpV-g?typeid=9 (accessed on 7 June 2021).
  2. Yang, C.H. Under the Severe Impact of the COVID-19 on the Economy, what Taiwan Catering Services and Retail Industry “Should Do” and “How to do”? How Can They Complete Critical Things to Tide over the Difficulties without Spending Costs or even Reducing Costs and Expenditure? myMKC.com Management Knowledge. Available online: https://mymkc.com/article/content/23384 (accessed on 22 April 2020).
  3. Fitzsimmons, J.; Fitzsimmons, M.; Bordoloi, S. Chapter 9: The service encounter. In The Service Management: Operations, Strategy, and Information Technology; Irwin/ McGraw Hill: Boston, MA, USA, 1998. [Google Scholar]
  4. Schneider, B.; White, S.S.; Paul, M.C. Linking service climate and customer perceptions of service quality: Tests of a causal model. J. Appl. Psychol. 1998, 83, 150. [Google Scholar] [CrossRef]
  5. Keller, K.L. Brand synthesis: The multidimensionality of brand knowledge. J. Consum. Res. 2003, 29, 595–600. [Google Scholar] [CrossRef]
  6. Winsted, K.F. The service experience in two cultures: A behavioral perspective. J. Retail. 1997, 73, 337–360. [Google Scholar] [CrossRef]
  7. Bitner, M.J.; Booms, B.H.; Tetreault, M.S. The service encounter: Diagnosing favorable and unfavorable incidents. J. Mark. 1990, 54, 71–84. [Google Scholar] [CrossRef]
  8. Cote, S.; Morgan, L.M. A longitudinal analysis of the association between emotion regulation, job satisfaction, and intentions to quit. J. Organ. Behav. 2002, 23, 947–962. [Google Scholar] [CrossRef]
  9. Tsai, W.C.; Huang, Y.M. Mechanisms linking employee affective delivery and customer behavioral intentions. J. Appl. Psychol. 2002, 87, 1001. [Google Scholar] [CrossRef] [PubMed]
  10. Karim, W.; Haque, A.; Anis, Z.; Ulfy, M.A. The movement control order (MCO) for COVID-19 crisis and its impact on tourism and hospitality sector in Malaysia. Int. Tour. Hosp. J. 2020, 3, 1–7. [Google Scholar]
  11. Wen, J.; Kozak, M.; Yang, S.; Liu, F. COVID-19: Potential effects on Chinese citizens’ lifestyle and travel. Tour. Rev. 2020, 76, 74–87. [Google Scholar] [CrossRef]
  12. Kura Sushi. A Leader in the Industry! Introduction of Kura Sushi’s 6 Major Zero-Contact Services, Official Website of Kura Sushi. Available online: https://www.kurasushi.tw/activities/193 (accessed on 24 June 2022).
  13. Bamburry, D. Drones: Designed for product delivery. Des. Manag. Rev. 2015, 26, 40–48. [Google Scholar] [CrossRef]
  14. Hwang, J.; Lee, J.S.; Kim, H. Perceived innovativeness of drone food delivery services and its impacts on attitude and behavioral intentions: The moderating role of gender and age. Int. J. Hosp. Manag. 2019, 81, 94–103. [Google Scholar] [CrossRef]
  15. EHL. COVID-19: How Is the Foodservice Industry Coping? Available online: https://hospitalityinsights.ehl.edu/covid-19-foodservice-industry (accessed on 9 September 2020).
  16. Stockfeel. The COVID-19 Epidemic Has Created Opportunities for “Zero Contact”. Which Is the Next ‘Disruptive Industry’? Available online: https://www.stockfeel.com.tw (accessed on 19 November 2020).
  17. Lee, S.; Lee, D. “Untact”: A new customer service strategy in the digital age. Serv. Bus. 2020, 14, 1–22. [Google Scholar] [CrossRef]
  18. Kim, R.; Jeon, M.; Lee, H.; Choi, J.; Lee, J.; Kim, S.; Lee, S.; Seo, Y.; Kwon, J. Trend Korea 2018; Mira eBook Publishing Co.: Seoul, Republic of Korea, 2018. [Google Scholar]
  19. Sweeney, J.; Danaher, T.; McColl-Kennedy, J. Customer effort in value concretion activities: Improving quality of life and behavioral intentions of health care customers. J. Serv. Res. 2015, 18, 318–335. [Google Scholar] [CrossRef]
  20. Verleye, K. The co-creation experience from the customer perspective: Its measurement and determinants. J. Serv. Manag. 2015, 26, 321–342. [Google Scholar] [CrossRef]
  21. Lee, D. Strategies for technology-driven service encounters for patient experience satisfaction in hospitals. Technol. Forecast. Soc. Chang. 2018, 137, 118–127. [Google Scholar] [CrossRef]
  22. Lee, D. Effects of key value co-creation elements in the healthcare system: Focusing on technology applications. Serv. Bus. 2019, 13, 389–417. [Google Scholar] [CrossRef]
  23. Lee, S.M.; Lee, D. Opportunities and challenges for contactless healthcare services in the post-COVID-19 Era. Technol. Forecast. Soc. Chang. 2021, 167, 120712. [Google Scholar] [CrossRef]
  24. Lovelock, C.H.; Young, R.F. Look to consumers to increase productivity. Harv. Bus. Rev. 1979, 57, 168–178. [Google Scholar]
  25. Ledingham, J.A. Are consumers ready for the information age. J. Advert. Res. 1984, 24, 31–37. [Google Scholar]
  26. Modern Restaurant Management. A History of Restaurant Tech (Infographic). Available online: https://modernrestaurantmanagement.com/a-history-of-restaurant-tech- (accessed on 1 April 2018).
  27. Limetray. Online Table Reservation System. Available online: https://limetray.com/online-table-reservation-system (accessed on 7 August 2021).
  28. MOS Burger. Company History. Available online: https://www.mos.com.tw/invest/history (accessed on 9 March 2022).
  29. Wishmobile. MOS Order App. Available online: https://medium.com/wishmobile/%E6%91%A9%E6%96%AF%E6%BC%A2%E5%A0%A1-mos-order-d0f0a4bc9d34 (accessed on 5 September 2019).
  30. Planning and Production Team of Integrated Communication Department, Global Views Monthly. Launched Starbucks Mobile Action Pre-Order Service-Skip the Line, Reach the Good Moments with Ease. Available online: https://www.gvm.com.tw/article/82077 (accessed on 6 September 2021).
  31. Commercial Times. McDonald’s Rolled Out First Digital Self-Service Ordering Kiosk. Available online: https://www.chinatimes.com/newspapers/20180413000255-260202?chdtv (accessed on 13 April 2018).
  32. HCT Logistics. Promotes Contactless Signing from Today on, Official Website of HCT Logistics. Available online: https://www.hct.com.tw/News/News_Detail.aspx?ID=931 (accessed on 9 June 2022).
  33. Solomon, M.R.; Surprenant, F.C.; Czepiel, J.A.; Gutman, E.G. A role theory perspective on dyadic interactions: The service encounter. J. Mark. 1985, 51, 73–80. [Google Scholar] [CrossRef]
  34. Carlzon, J.; Peters, T. Moments of Truth; Harper Business: New York, NY, USA, 1987. [Google Scholar]
  35. Crosby, L.A.; Evans, K.R.; Cowles, D. Relationship quality in service selling: An interpersonal influence perspective. J. Mark. 1990, 54, 68–81. [Google Scholar] [CrossRef]
  36. Morgan, R.L.; Chadha, S. Relationship marketing at the service encounter: The case of life insurance. Serv. Ind. J. 1993, 13, 112–125. [Google Scholar] [CrossRef]
  37. McCallum, R.J.; Harrison, W. Interdependence in the service encounter. In The Service Encounter: Managing Employee/Customer Interaction in Service Businesses; Czepiel, J.A., Solomon, M.R., Superenant, C.F., Eds.; Lexington Books: Lanham, MA, USA, 1985; pp. 35–48. [Google Scholar]
  38. Shostack, G.L. Planning the Service Encounter, The Service Encounter; Lexington Books: Lanham, MA, USA, 1985. [Google Scholar]
  39. Fang, S.R.; Hsu, C.P. The impacts of technology-based and interpersonal-based service encounter on relationship benefits. Manag. Rev. 2005, 24, 53–76. [Google Scholar]
  40. Baker, J. The role of the environment in marketing services: The consumer perspective. In The Service Challenge: Integrating for Competitive Advantage, Czepiel, J.A., Congram, C.A., Shanahan, J., Eds.; American Marketing Association: Chicago, IL, USA, 1987; pp. 79–84. [Google Scholar]
  41. Machleit, K.A.; Eroglu, S.A. Describing and measuring emotional response to shopping experience. J. Bus. Res. 2000, 79, 101–111. [Google Scholar] [CrossRef]
  42. Zeithaml, V.A.; Bitner, M.J. Service Marketing; McGraw-Hill: New York, NY, USA, 1996. [Google Scholar]
  43. Baker, J.; Parasuraman, A.; Grewal, D.; Voss, G.B. The influence of multiple store environment cues on perceived merchandise value and patronage intentions. J. Mark. 2002, 66, 120–141. [Google Scholar] [CrossRef]
  44. Grove, S.J.; Fisk, R.P.; Bitner, M.J. Dramatizing the service experience: A managerial approach. Adv. Serv. Mark. Manag. 1992, 1, 91–121. [Google Scholar]
  45. Grandey, A.A.; Fisk, G.M.; Mattila, A.S.; Jansen, K.J.; Sideman, L.A. Is “service with a smile” enough? Authenticity of positive displays during service encounters. Organ. Behav. Hum. Decis. Process 2005, 96, 38–55. [Google Scholar] [CrossRef]
  46. Pugh, S.D. Service with a smile: Emotional contagion in the service encounter. Acad. Manag. J. 2001, 44, 1018–1027. [Google Scholar] [CrossRef]
  47. Bitner, M.J. Servicescapes: The impact of physical surroundings on customers and employees. J. Mark. 1992, 56, 57–71. [Google Scholar] [CrossRef]
  48. Ryu, K.; Jang, S. DINESCAPE: A scale for customers’ perception of dining environments. J. Foodserv. Bus. Res. 2008, 11, 2–22. [Google Scholar] [CrossRef]
  49. Jensen, Ø.; Hansen, K.V. Consumer values among restaurant customers. Int. J. Hosp. Manag. 2007, 26, 603–622. [Google Scholar] [CrossRef]
  50. Martin, C.L. Consumer-to-consumer relationships: Satisfaction with other consumers’ public behavior. J. Consum. Aff. 1996, 30, 146–169. [Google Scholar] [CrossRef]
  51. Surprenant, C.F.; Solomon, M.R. Predictability and personalization in the service encounter. J. Mark. 1987, 51, 86–96. [Google Scholar] [CrossRef]
  52. Berry, L.L.; Parasuraman, A. Marketing Services; Free Press: New York, NY, USA, 1991. [Google Scholar]
  53. Bruhn, M.; Schoenmuller, V.; Schafer, D.; Heinrich, D. Brand authenticity: Towards a deeper understanding of its conceptualization and measurement. Adv. Consum. Res. 2012, 40, 567–576. [Google Scholar]
  54. Shen, C.H. A Study on the Impact of Customer Perceived Authenticity on Experiential Value and Customer Satisfaction in Hualien Feature B&B Service-The Dramaturgy Theory Perspective. Master’s Thesis, National Dong Hwa University, Hualien, Taiwan, 2011. [Google Scholar]
  55. Stern, B. Authenticity and the textual persona: Postmodern paradoxes in advertising narrative. Int. J. Res. Mark. 1994, 11, 387–400. [Google Scholar] [CrossRef]
  56. Leigh, T.W.; Peters, C.; Shelton, J. The consumer quest for authenticity: The multiplicity of meanings within the MG subculture of consumption. J. Acad. Mark. Sci. 2006, 34, 481–493. [Google Scholar] [CrossRef]
  57. Kapferer, J.N. (Re) Inventing the Brand: Can Top Brands Survive the New Market Realities? Kogan Page Publishers: London, UK, 2001. [Google Scholar]
  58. Chen, R.; Zhou, Z.; Zhan, G.; Zhou, N. The impact of destination brand authenticity and destination brand self-congruence on tourist loyalty: The mediating role of destination brand engagement. J. Destin. Mark. Manag. 2000, 15, 100402. [Google Scholar] [CrossRef]
  59. Hwang, J.; Kim, M.H.; Joo, K.H.; Kim, J.J. The antecedents and consequences of brand authenticity in the restaurant industry: Robot service employees versus human service employees. J. Travel. Tour. Mark. 2022, 39, 256–270. [Google Scholar] [CrossRef]
  60. Casey, A.; Slugoski, B.; Helmes, E. Cultural authenticity as a heuristic process: An investigation of the distraction hypothesis in a consumer evaluation paradigm. Food Qual. Prefer. 2014, 38, 75–82. [Google Scholar] [CrossRef]
  61. Mathwick, C.; Malhotra, N.; Rigdon, E. Experiential value: Conceptualization, measurement and application in the catalog and internet shopping environment. J. Retail. 2001, 77, 39–56. [Google Scholar] [CrossRef]
  62. Holbrook, M.B.; Corfman, K.P. Quality and value in the consumption experience: Phaedrus rides again. In The Perceived Quality: How Consumers View Stores and Merchandise, Jacoby, J., Olson, J.C., Eds.; Lexington Books: Lexington, MA, USA, 1985; pp. 31–57. [Google Scholar]
  63. Schmitt, B.H. Experiential Marketing; Classic Communications Group: Taipei City, Taiwan, 2000. [Google Scholar]
  64. Holbrook, M.B. The nature of customer value: An axiology of service in the consumption experience, service quality. In The New Direction in Theory and Practice; Rust, R.T., Oliver, R.L., Eds.; Sage Publications: Thousand Oaks, CA, USA, 1994. [Google Scholar]
  65. Chang, Y.S.; Chang, C.Y.; Cheng, J.C.; Chien, S.H. The research of experiential marketing, experiential value, tourism factory image to revisiting intention- a case study of ribbon museum. J. Tour. Leis. Stud. 2019, 12, 39–62. [Google Scholar]
  66. Woodruff, R.B.; Schumann, D.W.; Gardial, S.F. Understanding value and satisfaction from the customer’s point of view. Surv. Bus. 1993, 29, 33–40. [Google Scholar]
  67. Oliver, R.L. Satisfaction: A Behavioral Perspective on the Consumer; McGraw Hill: New York, NY, USA, 1997. [Google Scholar]
  68. Lee, E.J.; Overby, J.W. Creating value for online shoppers: Implications for satisfaction and loyalty. J. Consum. Satisf. Dissatisfaction Complain. Behav. 2004, 17, 54–67. [Google Scholar]
  69. Cardozo, R.N. An experimental study of customer effort, expectation, and satisfaction. J. Mark. Res. 1965, 2, 244–249. [Google Scholar] [CrossRef]
  70. Petrick, J.F.; Morais, D.D.; Norman, W. An examination of the determinants of entertainment vacationers intentions to revisit. J. Travel. Res. 2001, 40, 41–48. [Google Scholar] [CrossRef]
  71. Bearden, W.; Jesse, T. Selected determinants of consumer satisfaction and complaint reports. J. Mark. Res. 1983, 20, 21–28. [Google Scholar] [CrossRef]
  72. Churchill, A.; Surprenant, C. An investigation into the determinants of customer satisfaction. J. Mark. Res. 1982, 19, 491–504. [Google Scholar] [CrossRef]
  73. Woodside, F.; Daly, T. Linking service quality, customer satisfaction and behavioral intention. J. Care Mark. 1989, 9, 5–7. [Google Scholar]
  74. Fornell, C. A national customer satisfaction barometer: The Swedish experience. J. Mark. 1992, 56, 6–21. [Google Scholar] [CrossRef]
  75. Wakefield, K.L.; Baker, J. Excitement at the mall: Determinants and effects on shopping response. J. Retail. 1998, 74, 515–539. [Google Scholar] [CrossRef]
  76. McGrath, M.A.; Otnes, C. Unacquainted influencers: When strangers interact in the retail setting. J. Bus. Res. 1995, 32, 261–272. [Google Scholar] [CrossRef]
  77. Parker, C.; Ward, P. An analysis of role adoptions and scripts during customer-to-customer encounters. Eur. J. Mark. 2000, 34, 341–359. [Google Scholar] [CrossRef]
  78. Chhabra, D.; Healy, R.; Sills, E. Staged authenticity and heritage tourism. Ann. Tour. Res. 2003, 30, 702–719. [Google Scholar] [CrossRef]
  79. Mathwick, C.; Malhotra, N.K.; Rigdon, E. The effect of dynamic retail experiences on experiential perceptions of value: An Internet and catalog comparison. J. Retail. 2002, 78, 51–60. [Google Scholar] [CrossRef]
  80. Schumacker, R.E.; Lomax, R.G. A Beginner’s Guide to Structural Equation Modeling; Lawrence Erlbaum Associates: Mahwah, NJ, USA, 1996. [Google Scholar]
  81. DeVellis, R.F. Scale Development: Theory and Applications; Sage: San Francisco, CA, USA, 1991. [Google Scholar]
  82. Bagozzi, R.P.; Youjae, Y. On the evaluation of structural equation models. J. Acad. Mark. Sci. 1988, 16, 76–94. [Google Scholar] [CrossRef]
  83. Sun, X.; Lin, B.; Chen, Y.; Tseng, S.; Gao, J. Can commercialization reduce tourists’ experience quality? Evidence from Xijiang Miao Village in Guizhou, China. J. Hosp. Tour. Res. 2019, 43, 120–140. [Google Scholar] [CrossRef]
  84. Qiu, Y.W.; Shen, C.H.; Wu, H.J. The relationship between service encounters elements, consumers’ authenticity perception, and customer reaction in service encounter: A study of the B&B industry. J. Tour. Leis. Stud. 2019, 25, 301–334. [Google Scholar]
  85. Gallarza, M.G.; Arteaga, F.; Gil-Saura, I. Customer value in tourism and hospitality: Broadening dimensions and stretching the value-satisfaction-loyalty chain. Tour. Manag. Perspect. 2019, 31, 254–268. [Google Scholar] [CrossRef]
  86. Chang, L.H. The research on the relationship among the participating motivation, experiential value, satisfaction, behavioral intention: Taking Kinmen Mid-Autumn Festival as an example. J. Natl. Quemoy Univ. 2013, 3, 69–82. [Google Scholar]
  87. Becker, M.; Wiegand, N.; Reinartz, W.J. Does it pay to be real? Understanding authenticity in TV advertising. J. Mark. 2019, 83, 24–50. [Google Scholar] [CrossRef]
Figure 1. Research framework.
Systems 12 00019 g001
Figure 2. Structural equation model diagram.
Systems 12 00019 g002
Figure 3. Path analysis diagram.
Systems 12 00019 g003
Table 1. Questionnaire design.
ConstructItemsSourceHypotheses
Service staff performance1. The service staff at Kura Sushi are professional.
2. The service staff at Kura Sushi are able to provide services according to my needs.
3. The service staff at Kura Sushi take the initiative to help customers and provide services quickly.
4. The service staff at Kura Sushi have a wealth of knowledge and skills.
5. The service staff at Kura Sushi are trustworthy.
[43]H1
Physical surroundings1. The background music played at Kura Sushi is unique.
2. Kura Sushi uses objects of quality.
3. The surroundings of Kura Sushi are neat and clean.
4. The overall layout of Kura Sushi is different from the general style.
5. The facilities provided by Kura Sushi are exquisite.
6. Kura Sushi’s venues are clearly marked.
[75]H2
Positive interactions with other customers1. When dining at Kura Sushi, other customers behave well.
2. When dining at Kura Sushi, I feel good about the interactions with other customers.
3. When dining at Kura Sushi, other customers do not make any loud noises.
4. When dining at Kura Sushi, other customers participate and cooperate with each other.
[76,77]H3
Authenticity perception1. I think the uniform of the service staff is in keeping with the theme.
2. I think the overall environmental facilities are in line with the featured theme.
3. I think the service staff are friendly and sincere.
4. I think the food served by Kura Sushi is authentic.
5. I think the process of dining is in line with the actual life in Japan.
6. I think the overall consumption of the meal is unique.
7. I think other customers are also engaged in the consumption process of the meal.
[78]H4
Experiential value1. Kura Sushi’s dining costs are acceptable to me.
2. The consumption at Kura Sushi is of excellent quality and has a reasonable price.
3. Overall, I have learned a lot from the dining experience at Kura Sushi.
4. Kura Sushi can provide its customers with an authentic Japanese service experience.
5. The customers can experience a smooth service system in Kura Sushi.
6. Kura Sushi’s service staff will explain the service model carefully.
7. Kura Sushi’s environmental facilities are aesthetic.
8. Dining at Kura Sushi is appealing to me.
9. I like the atmosphere and setting during the whole meal process.
10. Dining at Kura Sushi makes me feel at ease.
11. Dining at Kura Sushi is a convivial experience.
12. I find the whole arrangement of Kura Sushi interesting.
[64,79]H5
Customer satisfaction1. Overall, I am satisfied with Kura Sushi.
2. Overall, I am very satisfied with choosing Kura Sushi.
3. Overall, I love the services offered by Kura Sushi.
4. Kura Sushi provided better services than I expected.
5. I think the services provided by Kura Sushi are the best according to my past experience.
6. I am very satisfied with Kura Sushi compared with other restaurants according to my past experience.
[35]
Table 2. Descriptive statistical item analysis for samples.
Descriptive Statistical ItemCategoryNumberPercentage (%)Cumulative Percentage (%)
GenderMale11435.835.8
Female20464.2100
AgeUnder 20 years old185.75.7
21–30 years old24777.783.3
31–40 years old299.192.5
41–50 years old165.097.5
51–60 years old72.299.7
Over 71 years old10.3100
Educational levelJunior high school41.31.3
Senior high school196.07.2
University graduate16652.259.4
Master’s/doctorate degree12940.6100
Work industryStudent18357.557.5
Financial industry144.461.9
Hospitality industry268.270.1
Military/civil servant/ teacher134.174.2
Farming, forestry, fishing, husbandry, and mining services20.674.8
Business/trade industry134.178.9
Medical industry51.680.5
Freelancer113.584.0
Manufacturing/electronics industry226.990.9
Other industries299.1100
Monthly personal incomeBelow NTD 30,000 (inclusive)20163.263.2
NTD 30,001~40,0005316.779.9
NTD 40,001~50,000299.189.0
NTD 50,001~60,000123.892.8
NTD 60,001~70,000134.196.9
NTD 70,001~80,00030.997.8
NTD 80,001~90,00020.698.4
NTD 90,001~100,00020.699.1
Above NTD 100,00030.9100
Source: Compiled by this study.
Table 3. Reliability analysis.
ScaleQuestionCronbach’s α
Service staff performance1. Service staff at Kura Sushi are professional.
2. Service staff at Kura Sushi were able to provide services according to my needs.
3. Service staff at Kura Sushi take the initiative to help customers and provide services quickly.
4. Service staff at Kura Sushi have a wealth of knowledge and skills.
5. Service staff at Kura Sushi are trustworthy.
0.899
Physical surroundings1. The background music that Kura Sushi plays is unique.
2. Kura Sushi uses objects of quality.
3. The surroundings of Kura Sushi are neat and clean.
4. The overall layout of Kura Sushi is different from the general style.
5. The facilities provided by Kura Sushi are exquisite.
6. Kura Sushi’s venues are clearly marked.
0.827
Positive interactions with other customers1. When dining at Kura Sushi, other customers behaved well.
2. When dining at Kura Sushi, I felt good about the interactions with other customers.
3. When dining at Kura Sushi, other customers didn’t make any loud noises.
4. When dining at Kura Sushi, other customers participated and cooperated with each other.
0.859
Authenticity perception1. I think the uniform of the service staff is in keeping with the theme.
2. I think the overall environmental facilities are in line with the featured theme.
3. I think the service staff are very friendly and sincere.
4. I think the food served by Kura Sushi is very authentic.
5. I think the process of dining is in line with the actual life in Japan.
6. I think the overall consumption of the meal is unique.
7. I think other customers are also very engaged in the consumption process of the meal.
0.880
Experiential value1. Kura Sushi’s dining costs are acceptable to me.
2. The consumption at Kura Sushi is of excellent quality and reasonable price.
3. Overall, I have learned a lot from the dining experience at Kura Sushi.
4. Kura Sushi can provide its customers with an authentic Japanese service experience.
5. The customers can experience a smooth service system in Kura Sushi.
6. Kura Sushi’s service staff will explain the service model carefully.
7. Kura Sushi’s environmental facilities are aesthetic.
8. Dining at Kura Sushi is appealing to me.
9. I like the atmosphere and setting during the whole meal process.
10. Dining at Kura Sushi made me feel at ease.
11. Dining at Kura Sushi is a convivial experience.
12. I find the whole arrangement of Kura Sushi interesting.
0.937
Customer satisfaction1. Overall, I am satisfied with Kura Sushi.
2. Overall, I am very satisfied with choosing Kura Sushi.
3. Overall, I love the services offered by Kura Sushi.
4. Kura Sushi provided better services than I expected.
5. I think the services provided by Kura Sushi are the best in my past experience.
6. I am very satisfied with Kura Sushi compared with other restaurants in my past experience.
0.921
Table 4. Factor load coefficients.
Latent VariableMeasured VariableNon-Standard Factor LoadS.E.p ValueStandard Factor LoadAVECR
Service staff performanceA10.9720.0540.000 ***0.8440.6470.901
A20.8920.0540.000 ***0.800
A30.9870.0650.000 ***0.749
A41.0600.0640.000 ***0.797
A51.000 0.828
Physical surroundingsB11.1510.1420.000 ***0.5400.3740.781
B21.4220.1510.000 ***0.675
B31.1810.1330.000 ***0.618
B41.2120.1370.000 ***0.614
B51.2510.1350.000 ***0.660
B61.000 0.549
Positive interactions with other customersC11.0550.0710.000 ***0.8200.6140.864
C21.0940.0730.000 ***0.835
C31.1580.0920.000 ***0.707
C41.000 0.767
Authenticity perceptionD11.000 0.5960.4550.854
D21.0670.1080.000 ***0.650
D31.3220.1330.000 ***0.658
D41.3030.1240.000 ***0.708
D51.3320.1320.000 ***0.673
D61.4200.1350.000 ***0.711
D71.3070.1230.000 ***0.719
Experiential valueE11.000 0.6650.5500.936
E21.1350.1000.000 ***0.686
E31.2740.1000.000 ***0.784
E41.0940.0850.000 ***0.788
E51.0420.0830.000 ***0.768
E61.0680.0910.000 ***0.708
E71.1380.0930.000 ***0.750
E81.2130.0980.000 ***0.759
E91.1730.0880.000 ***0.822
E100.9900.0810.000 ***0.745
E110.9700.0850.000 ***0.685
E121.0560.0880.000 ***0.727
Customer satisfactionF10.8340.0500.000 ***0.8010.6260.909
F20.8650.0530.000 ***0.784
F30.8770.0510.000 ***0.818
F40.9880.0600.000 ***0.787
F51.0860.0710.000 ***0.747
F61.000 0.809
Note: *** p < 0.001. Source: Compiled by this study.
Table 5. Research model fit.
Statistical Test VariableStandard ValueResultsModel Fit Judgment
X2/df1–53.334Yes
GFIGreater than 0.80.695Yes
AGFIGreater than 0.80.660Yes
RMSEASmaller than 0.080.086Yes
CFIGreater than 0.80.824Yes
Source: Compiled by this study.
Table 6. Person correlation.
Service Staff PerformancePhysical SurroundingsPositive Interactions with Other CustomersAuthenticity PerceptionExperiential ValueCustomer Satisfaction
Service staff performance1
Physical surroundings0.644 ** 1
Positive interactions with other customers0.570 ** 0.587 ** 1
Authenticity perception0.699 ** 0.720 ** 0.617 ** 1
Experiential value0.738 ** 0.783 ** 0.612 ** 0.836 ** 1
Customer satisfaction0.737 ** 0.737 ** 0.629 ** 0.775 ** 0.875 ** 1
Note: ** p < 0.01. Source: Compiled by this study.
Table 7. Path analysis table.
Model PathEstimateS.E.p ValueResults
Service staff performance ->
Authenticity perception
0.4040.0320.000 ***Significant
Physical surroundings->Authenticity perception0.4670.0350.000 ***Significant
Positive interactions with other customers->Authenticity perception0.2520.0280.000 ***Significant
Authenticity perception->Experiential value0.7790.0390.000 ***Significant
Experiential value->Customer satisfaction0.8460.0360.000 ***Significant
Note: *** p < 0.001. Source: Compiled by this study.
Table 8. Research hypothesis results.
Research HypothesesResults
H1Supported
H2Supported
H3Supported
H4Supported
H5Supported
Source: Compiled by this study.
Disclaimer/Publisher’s Note: The statements, opinions and data contained in all publications are solely those of the individual author(s) and contributor(s) and not of MDPI and/or the editor(s). MDPI and/or the editor(s) disclaim responsibility for any injury to people or property resulting from any ideas, methods, instructions or products referred to in the content.

