
Alpha-Lipoic Acid and Metformin Combination Therapy Synergistically Activate Nrf2-AMPK Signaling Pathways to Ameliorate Cognitive Dysfunction in Type 2 Diabetic Encephalopathy: A Preclinical Study


Simple Summary
Abstract
1. Introduction
2. Materials and Methods
2.1. Experimental Design and Animal Model
2.2. Animal Subjects and Housing Conditions
2.3. Enhanced Type 2 Diabetes Induction Protocol
2.4. Treatment Groups and Drug Administration
- α-Lipoic acid (300 mg/kg/day): Selected based on demonstrated neuroprotective efficacy in diabetic rodent models [47,48] and established antioxidant effects [14,15]. This dose corresponds to clinically effective human doses (600–800 mg/day) using allometric scaling according to the Reagan-Shaw method [49], ensuring clinical relevance.
- Metformin (50 mg/kg/day): Chosen based on previous neuroprotection studies demonstrating AMPK activation and cognitive benefits [50]. This dose achieves plasma concentrations equivalent to therapeutic levels in human clinical practice (1000–1500 mg/day) [24,25] while avoiding gastrointestinal side effects common with higher doses.
- Control Group (C, n = 12): Non-diabetic animals receiving vehicle (0.5% carboxymethylcellulose, Sigma-Aldrich, St. Louis, MO, USA)
- Diabetic Control (DC, n = 12): T2DM animals receiving vehicle only
- ALA Treatment (D + ALA, n = 12): T2DM animals receiving α-lipoic acid (300 mg/kg/day)
- Metformin Treatment (D + MET, n = 12): T2DM animals receiving metformin hydrochloride (50 mg/kg/day)
- Combination Therapy (D + ALA + MET, n = 12): T2DM animals receiving both compounds
- Pharmaceutical Specifications:
- α-Lipoic acid: ≥99% purity (Catalog T5625, Lot SLCD4829, Sigma-Aldrich, St. Louis, MO, USA)
- Metformin hydrochloride: ≥98% purity (Catalog D150959, Lot MKCG8909, Sigma-Aldrich, St. Louis, MO, USA)
2.5. Molecular Signaling Pathway Assessment
2.5.1. Tissue Collection and Processing
2.5.2. Immunoblot Analysis
2.5.3. Gene Expression Analysis
2.6. Mitochondrial Function Evaluation
2.7. Oxidative Stress and Antioxidant Defense Assessment
2.8. Neurobehavioral Assessment
2.9. Histopathological Analysis
2.10. Statistical Analysis
3. Results
3.1. Animal Model Validation and Metabolic Outcomes
3.2. Synergistic Molecular Pathway Activation
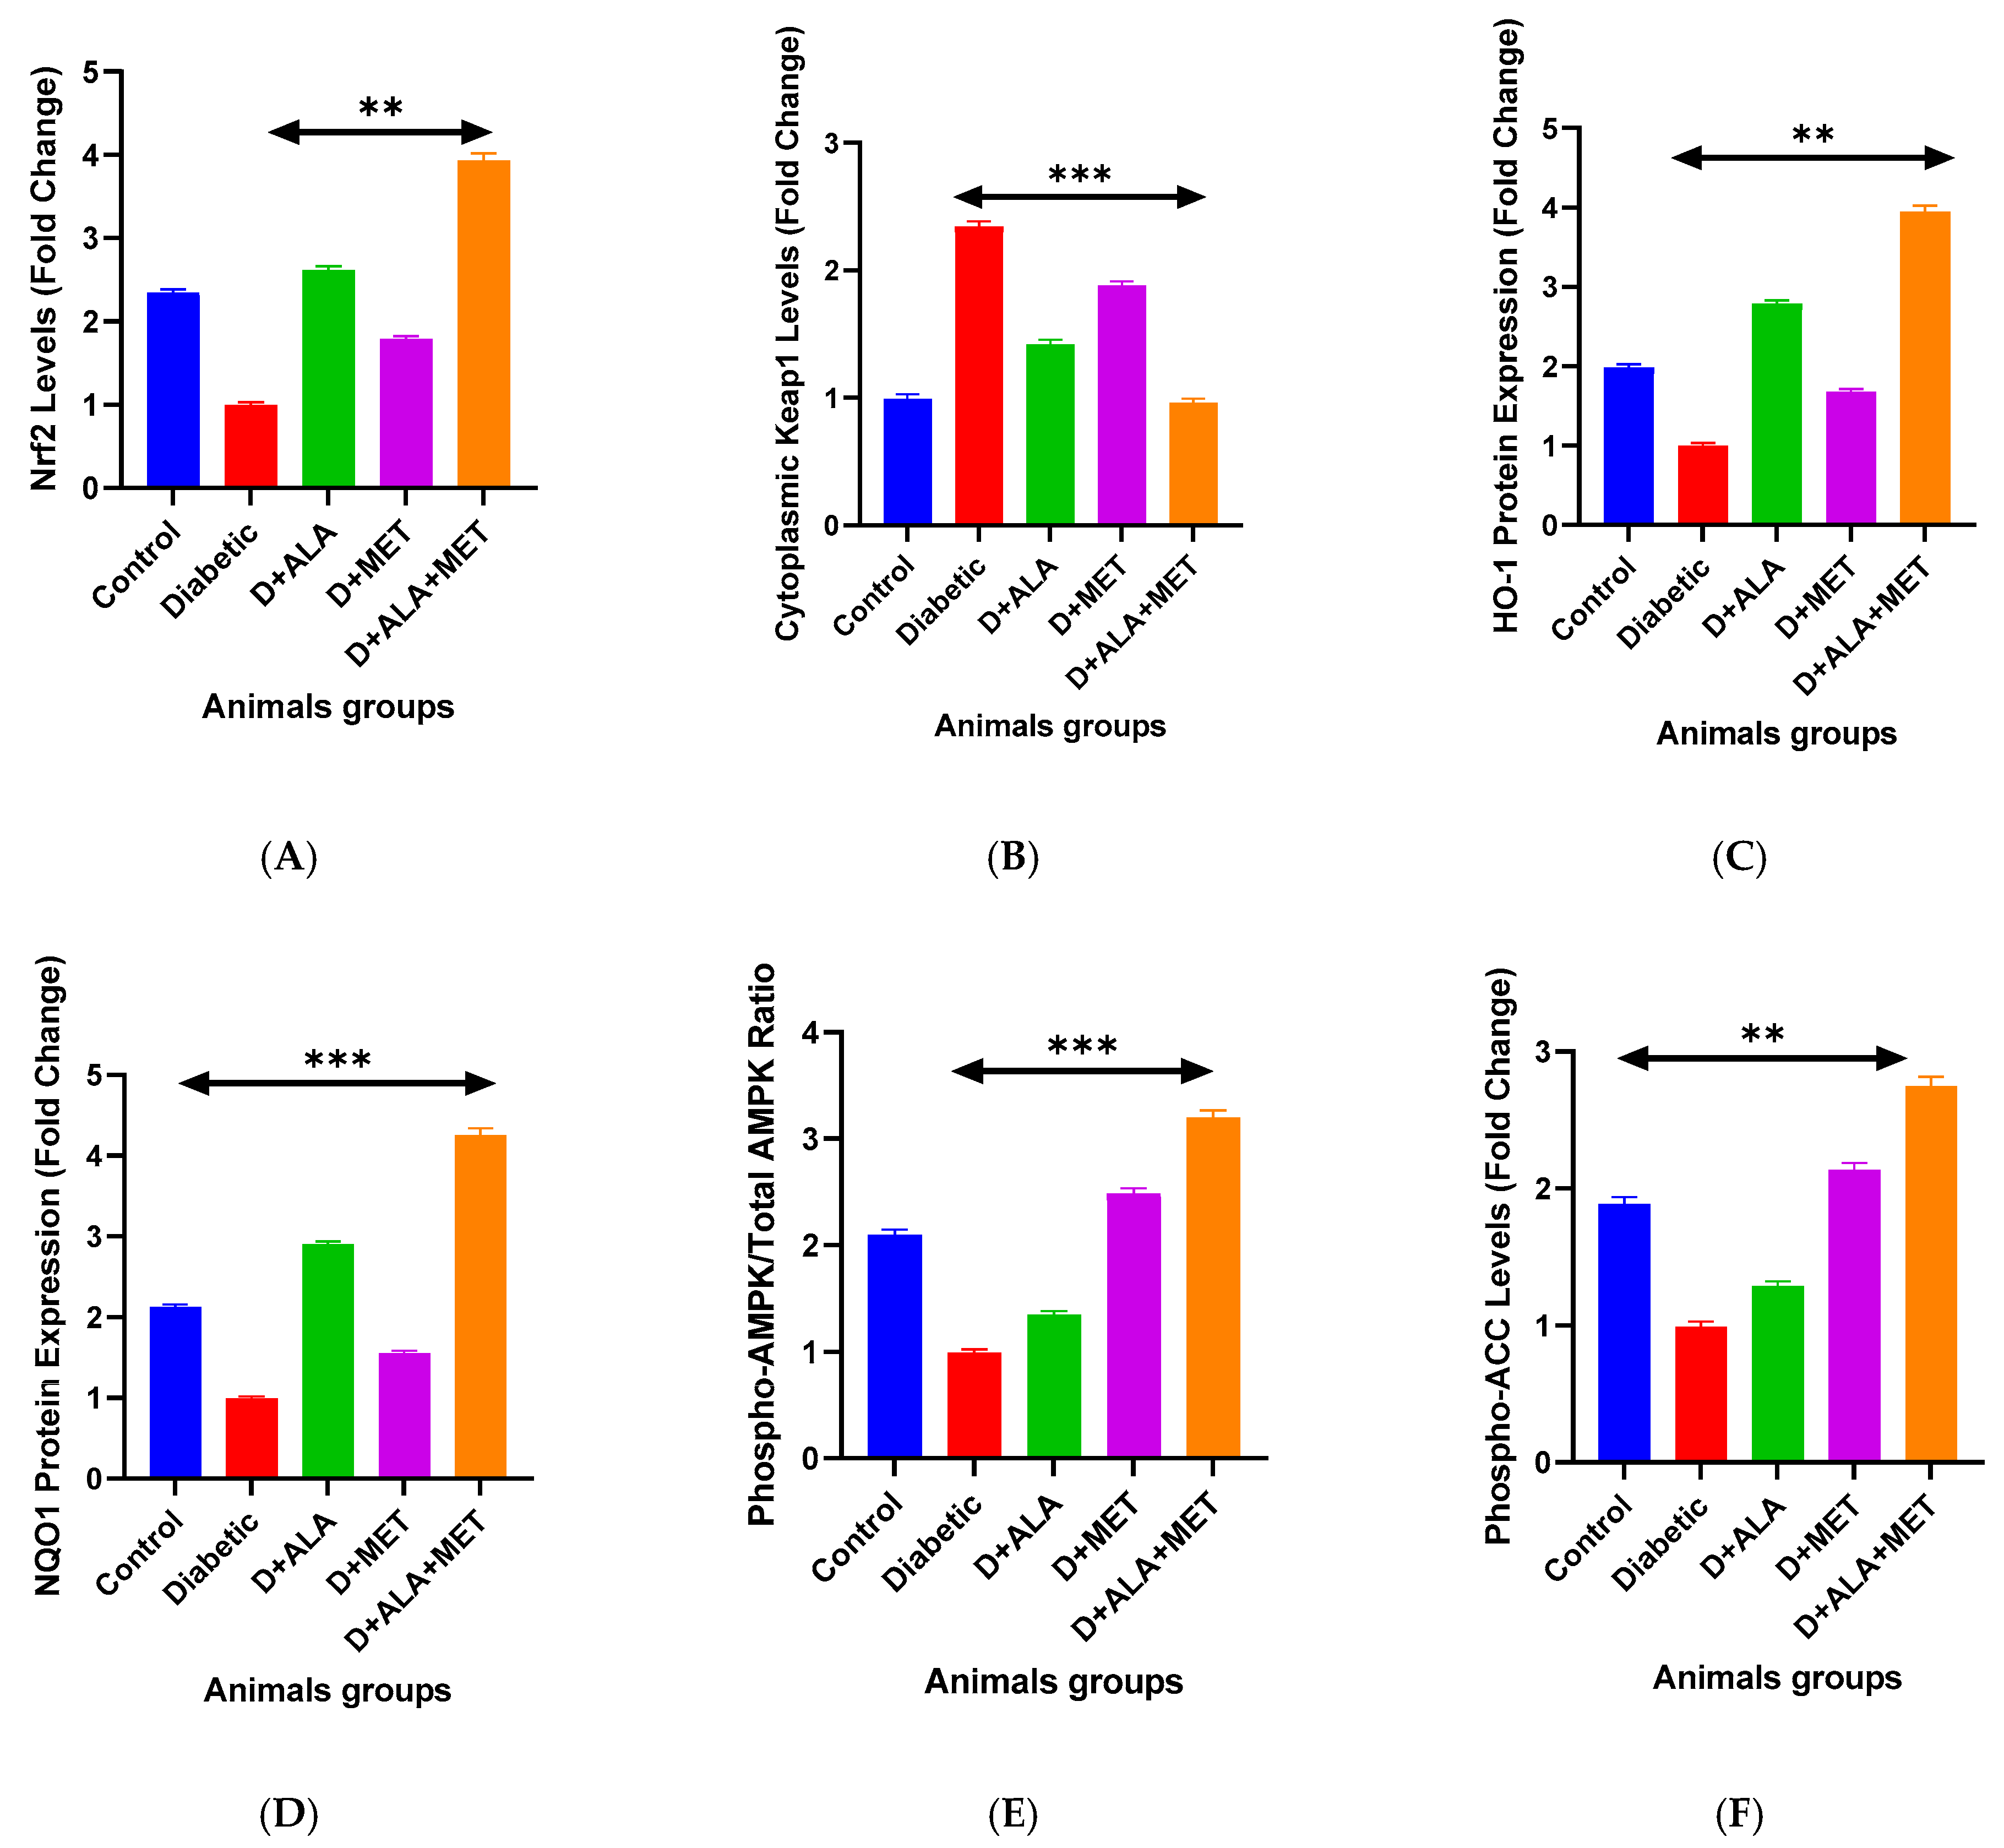
3.2.1. Nrf2 Antioxidant Response Pathway
3.2.2. AMPK Metabolic Signaling
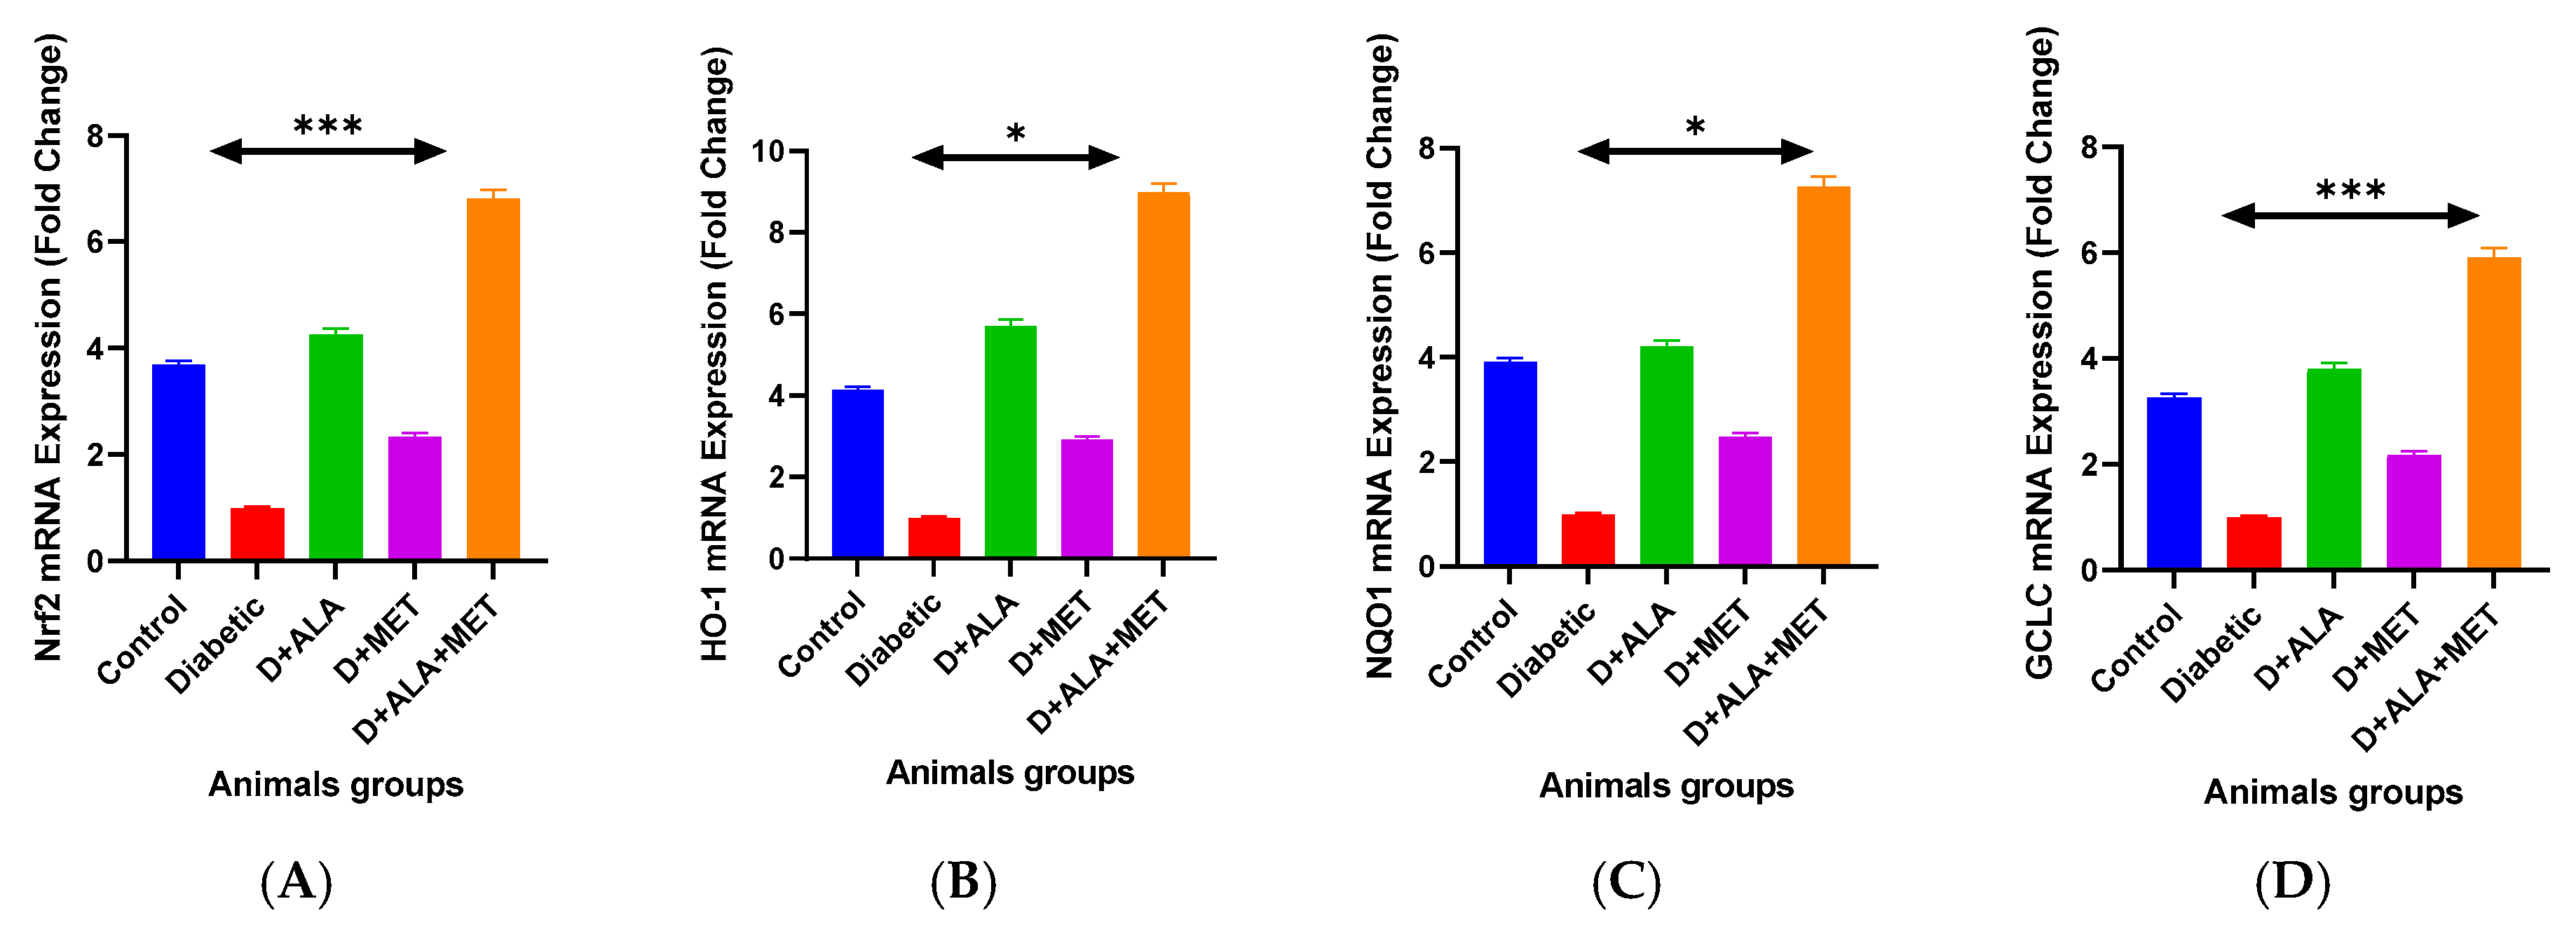
3.3. Gene Expression Validation
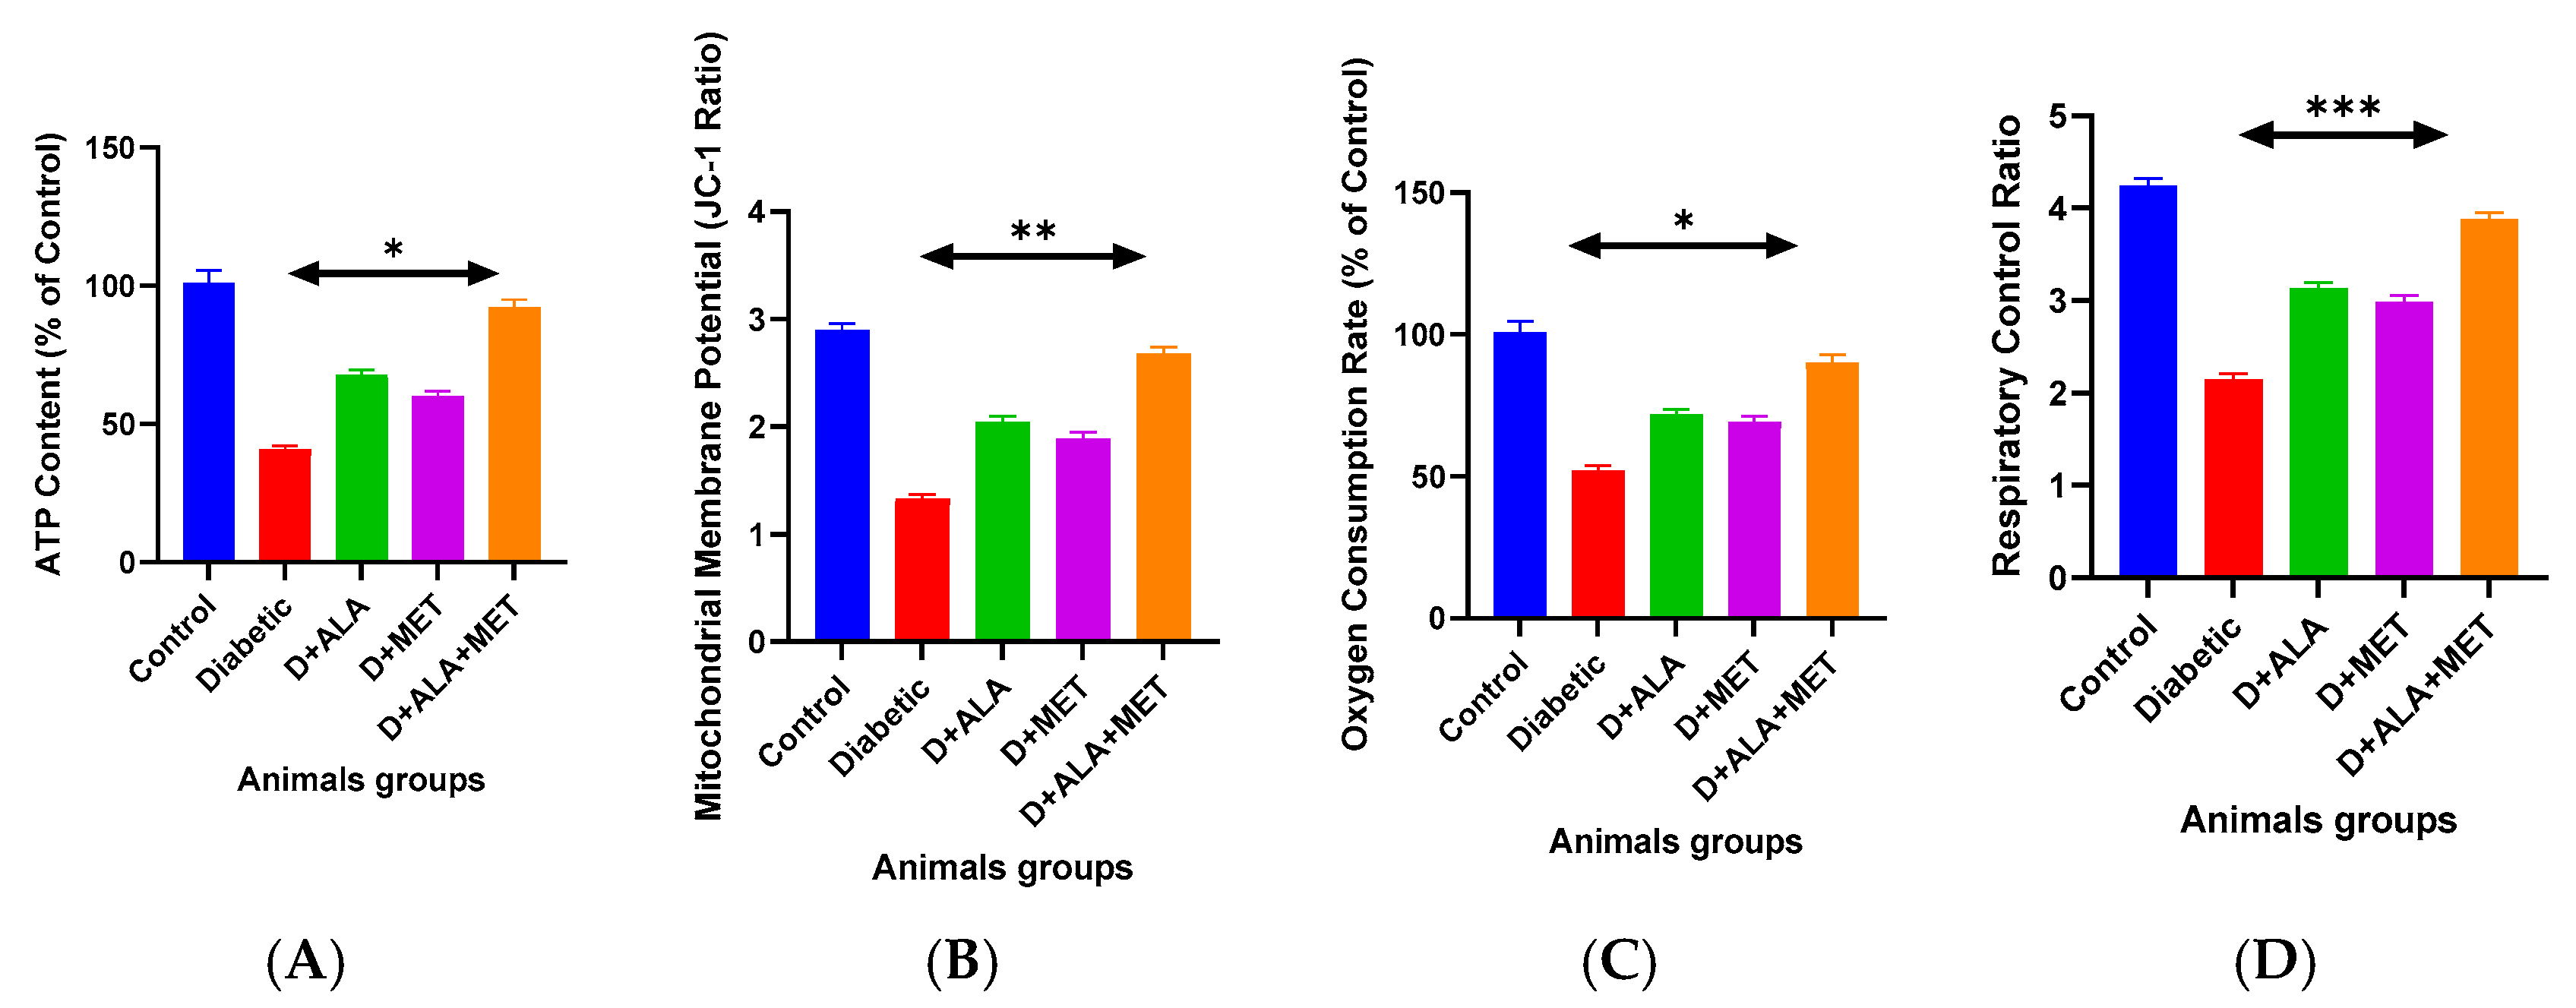
3.4. Mitochondrial Function Restoration
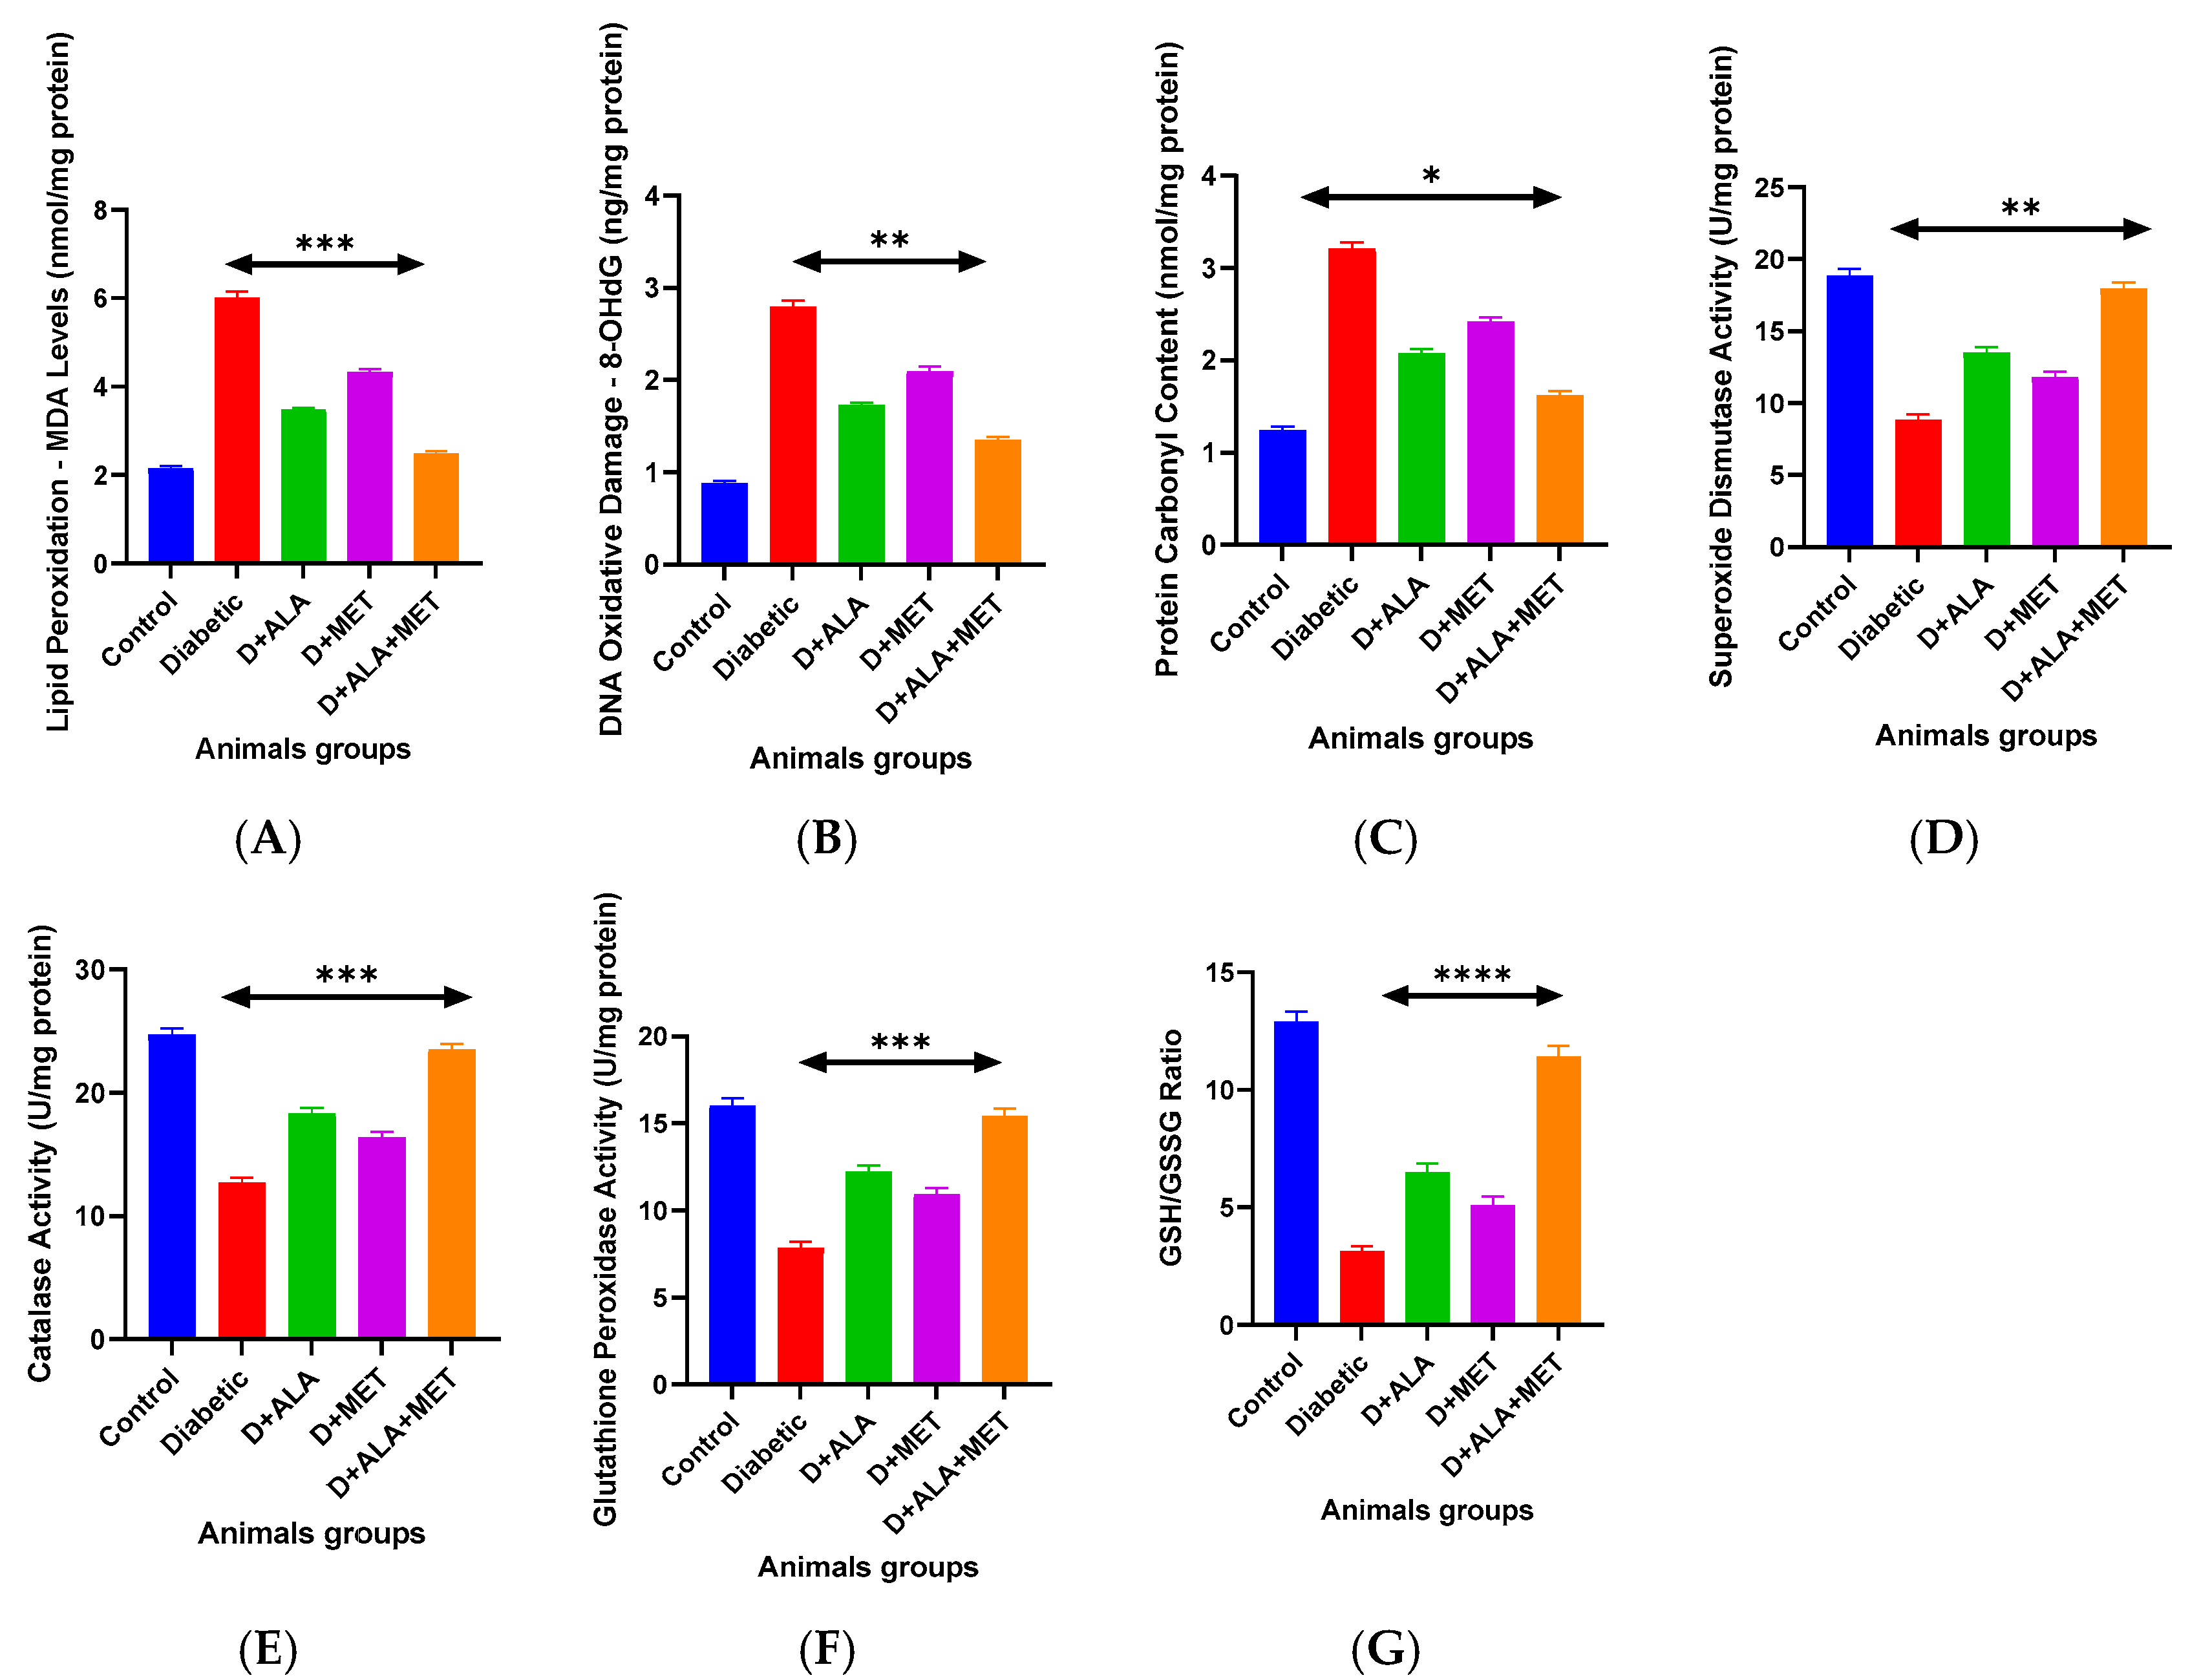
3.5. Oxidative Stress and Antioxidant Defense Systems
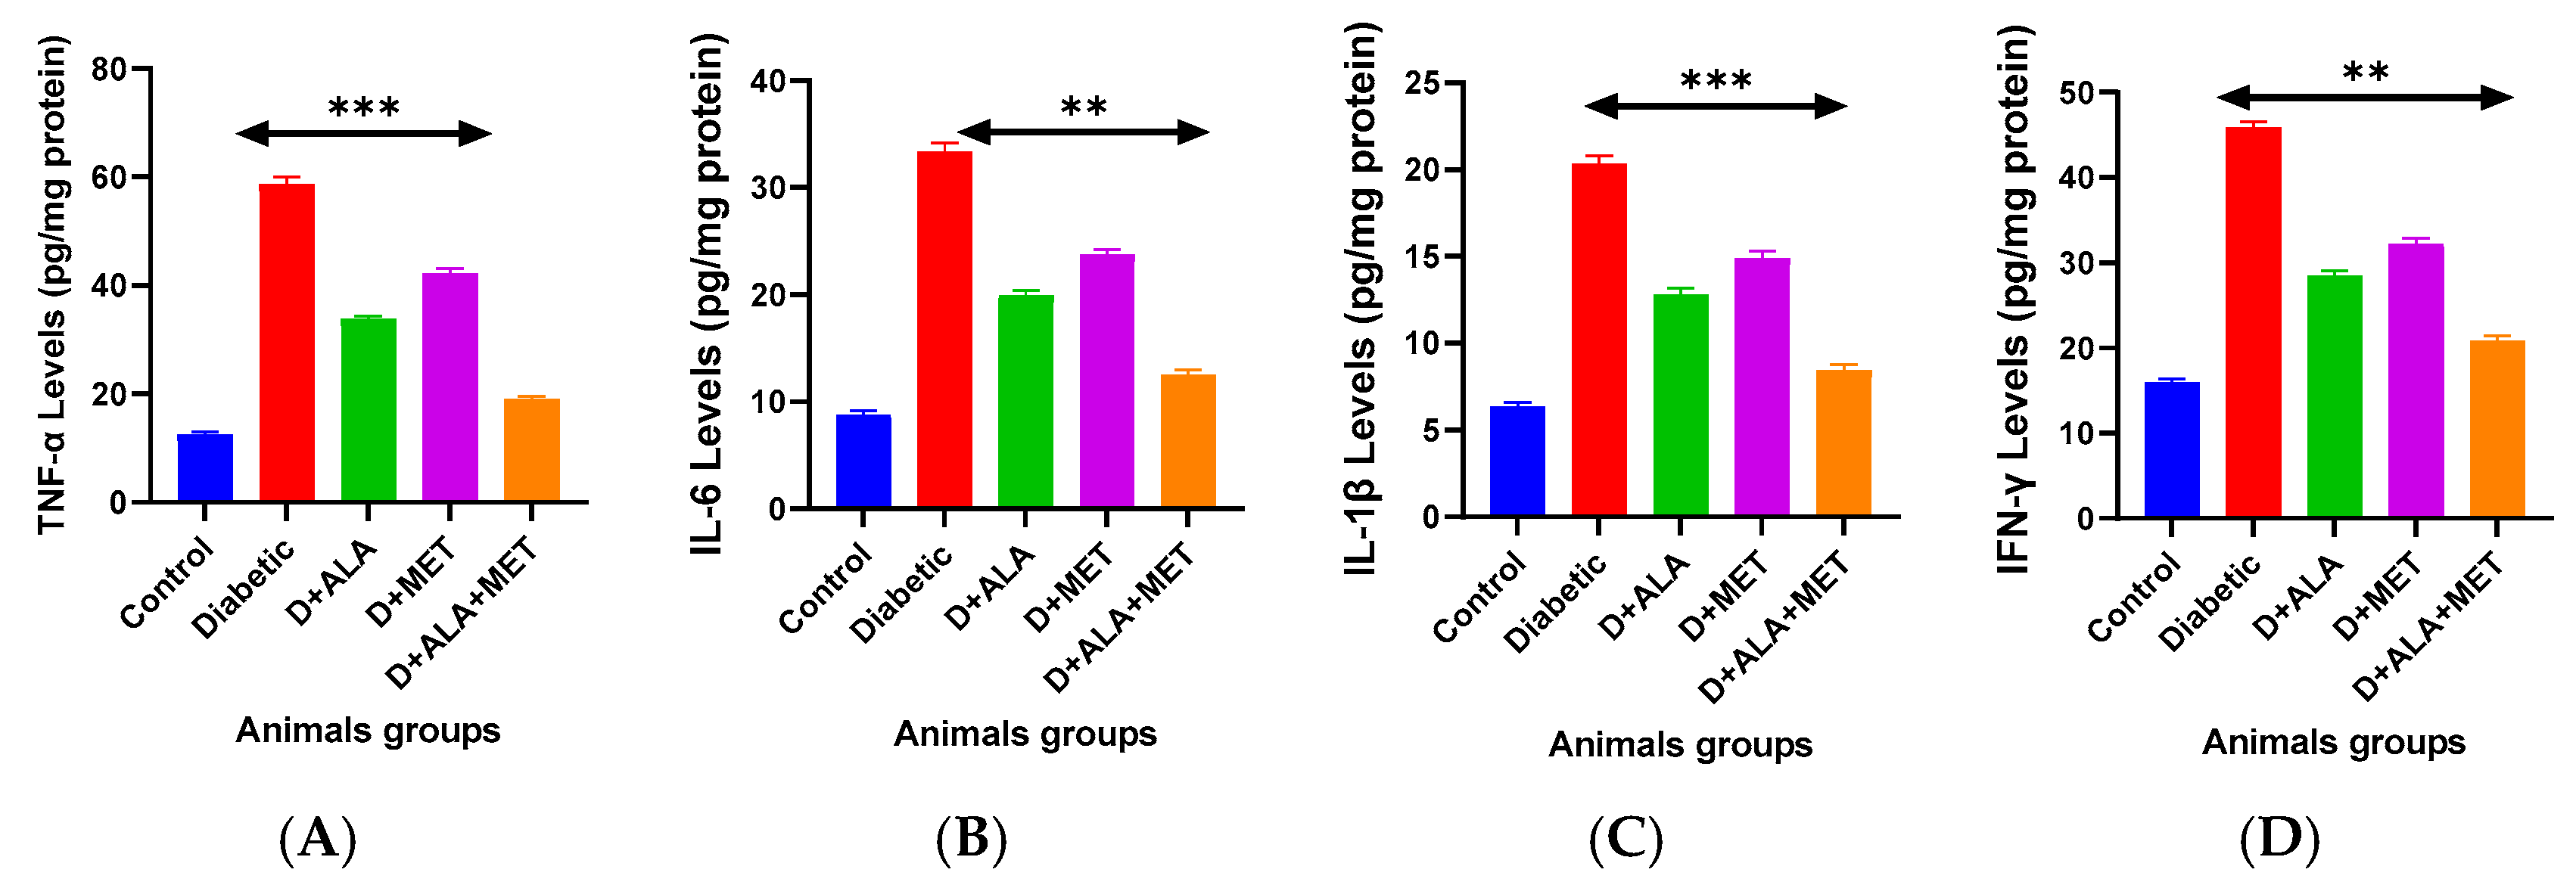
3.6. Neuroinflammation and Neurovascular Protection
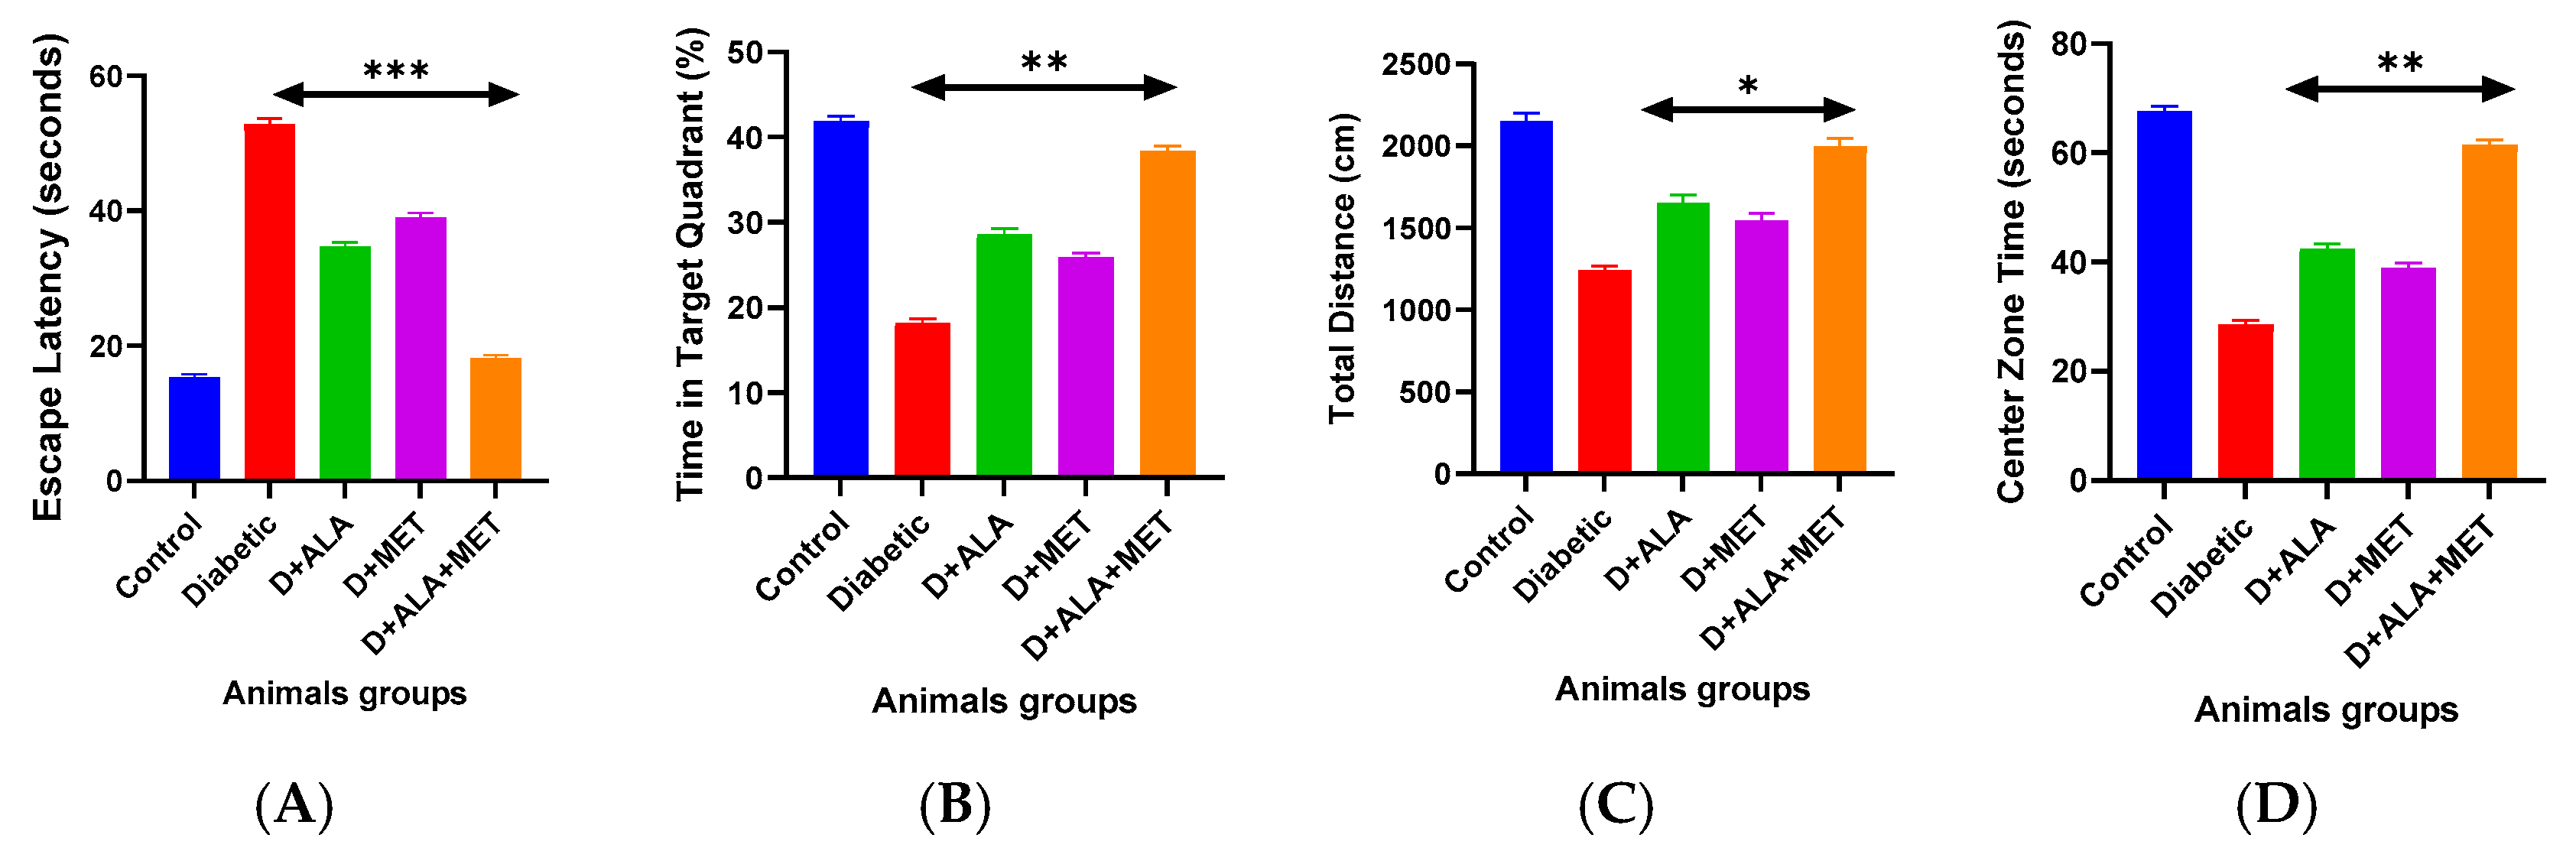
3.7. Functional Cognitive and Behavioral Recovery
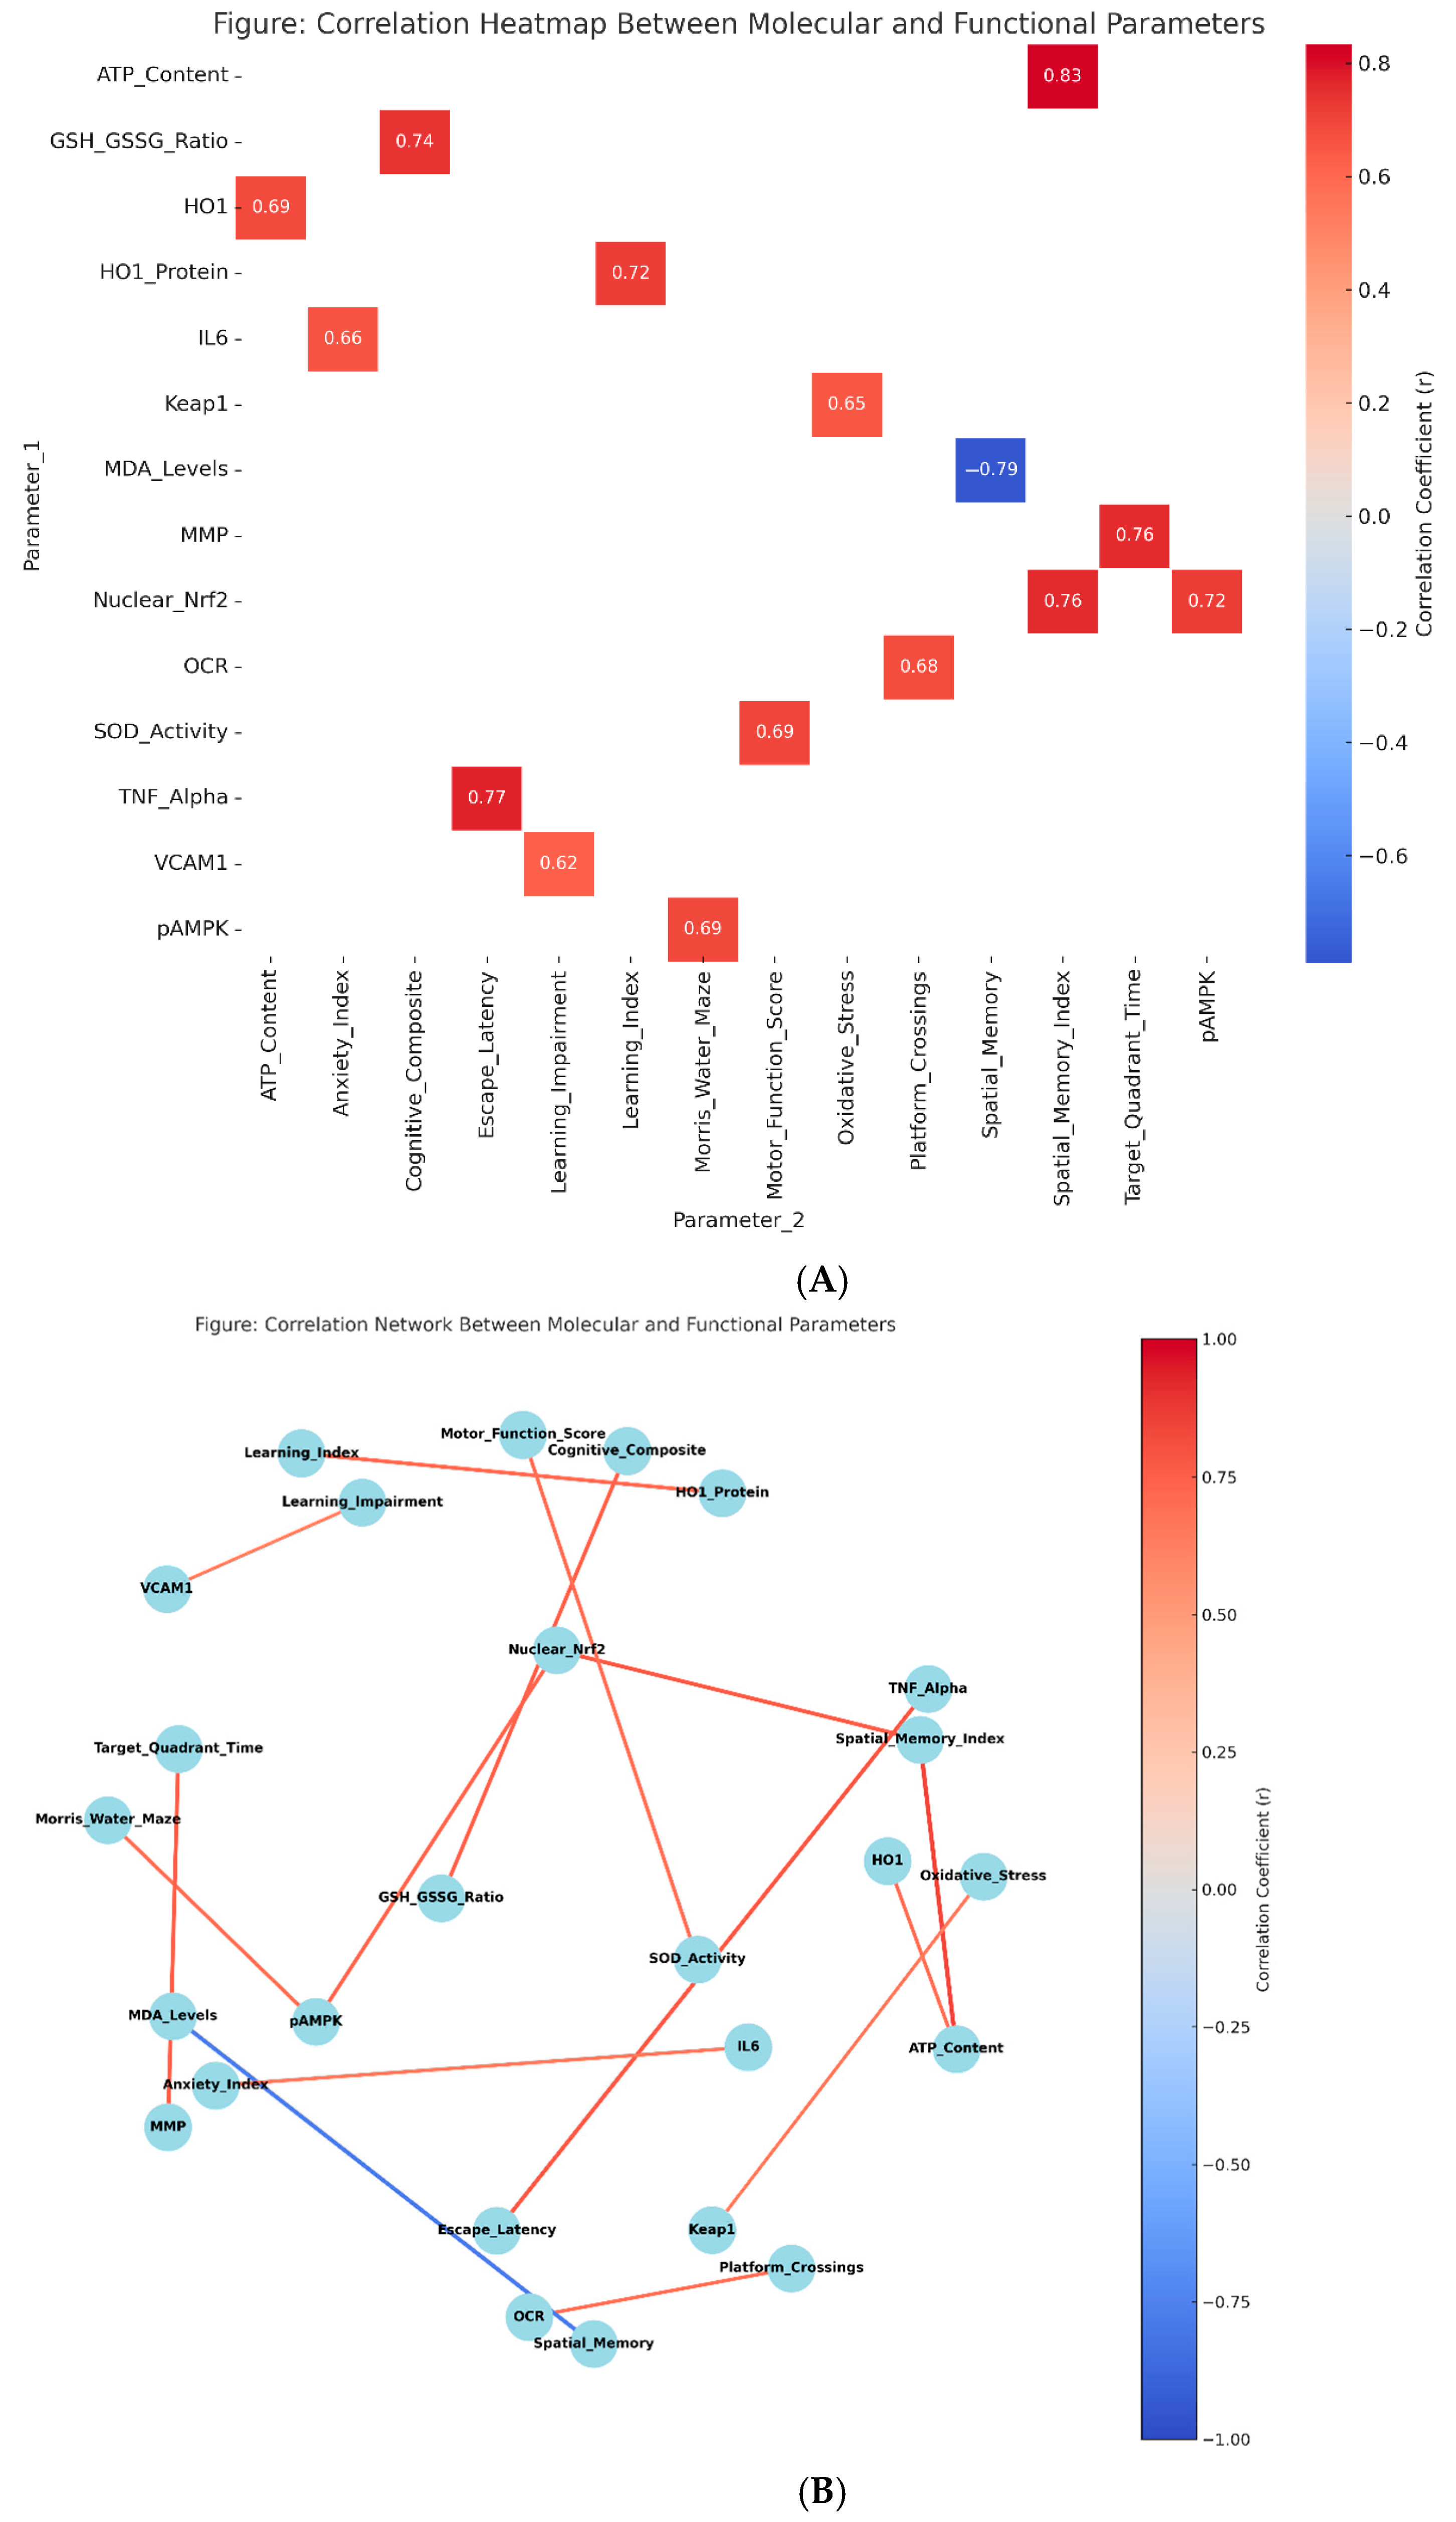
3.8. Mechanistic Relationships and Correlation Analysis
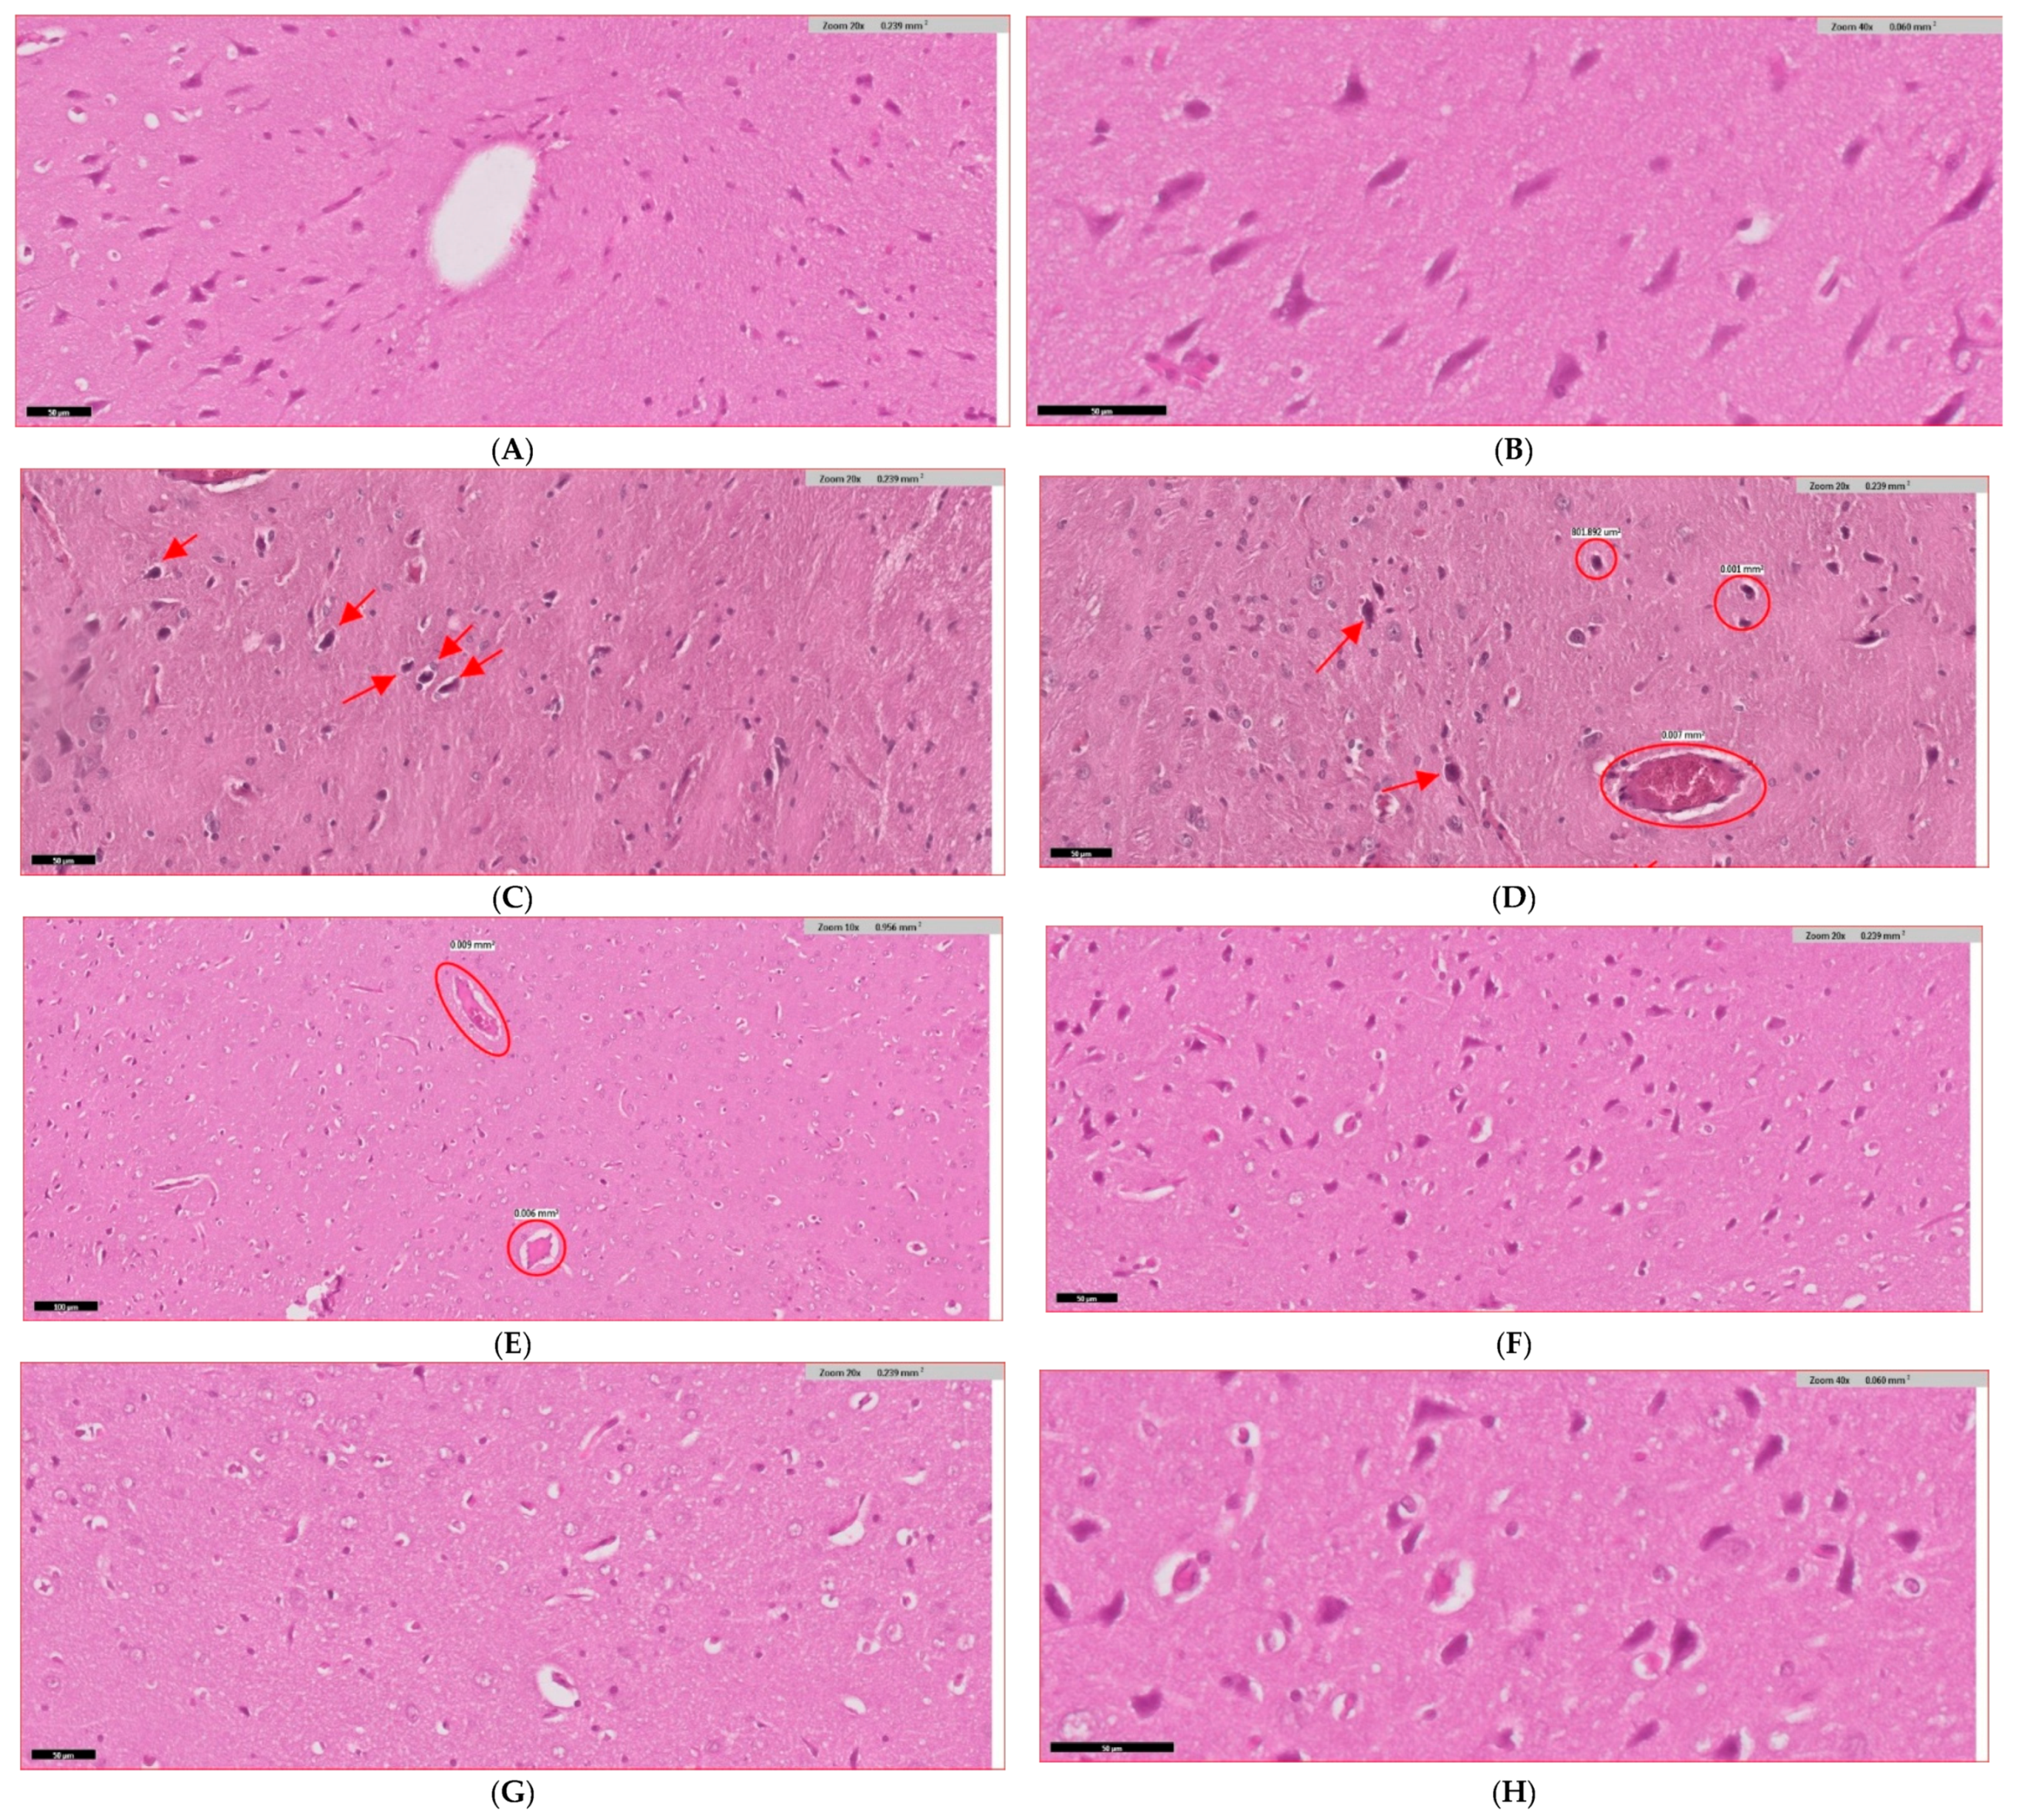
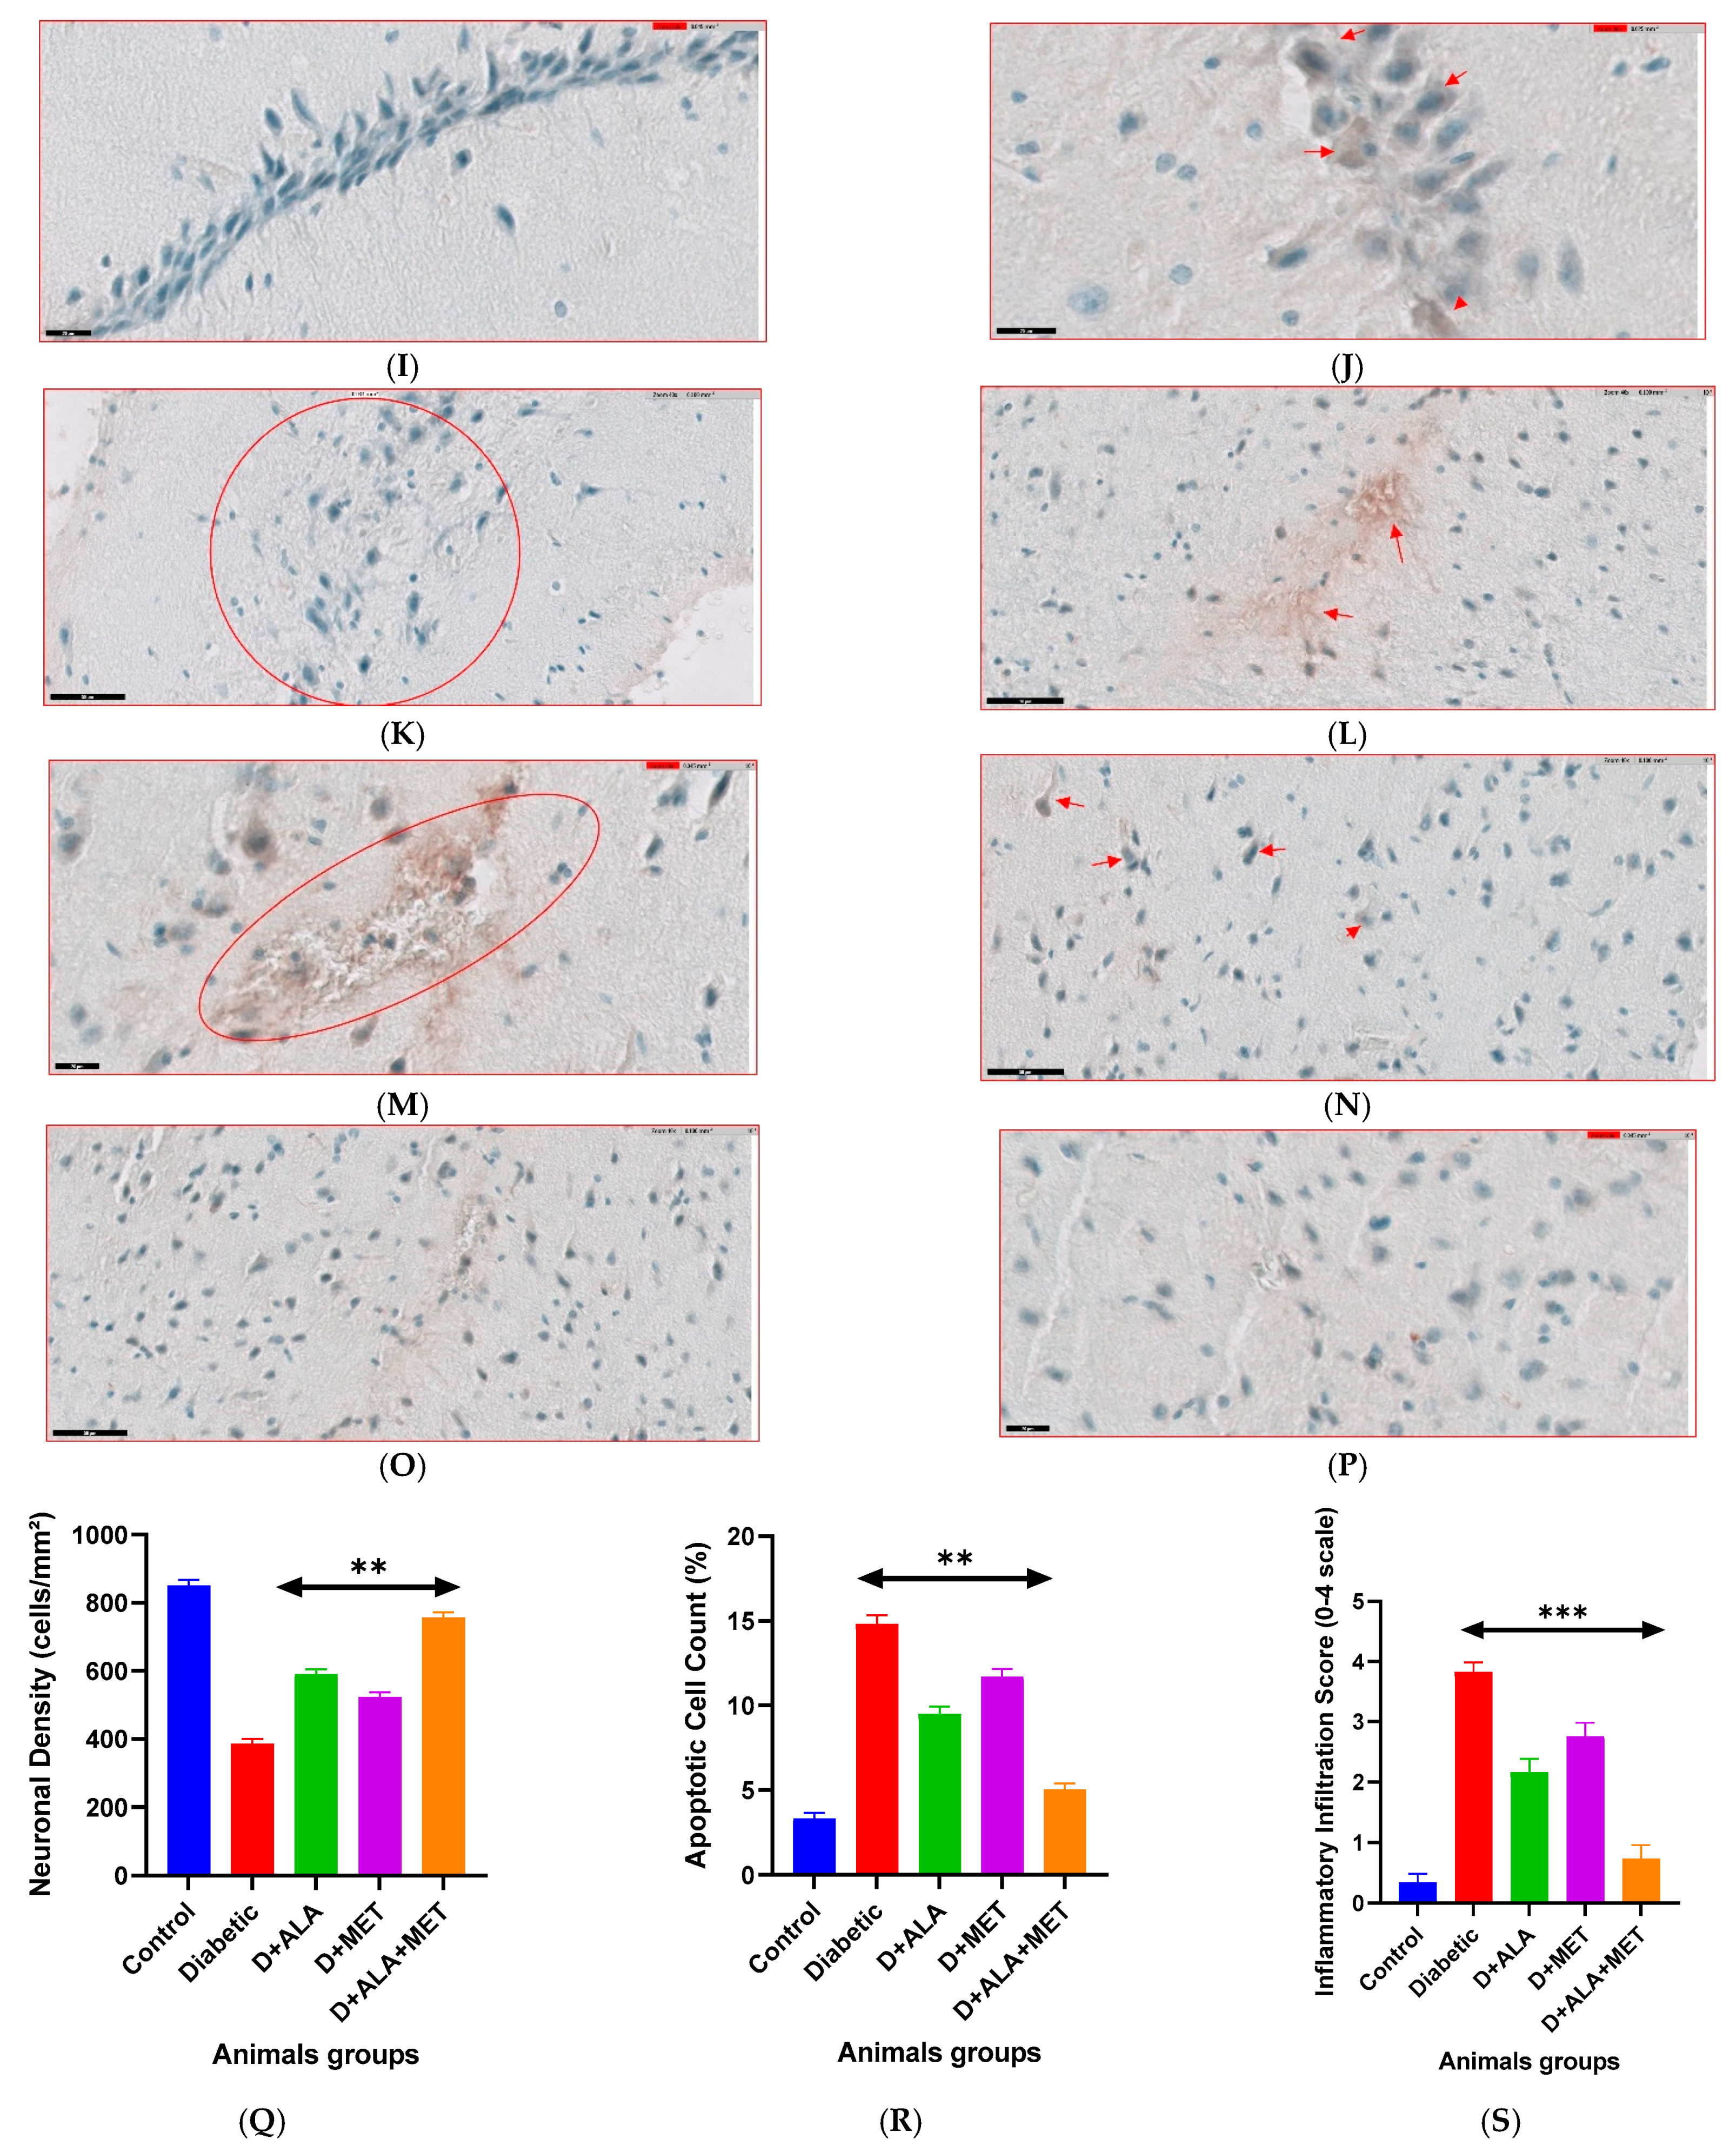
3.9. Histopathological Evidence and Mechanistic Validation
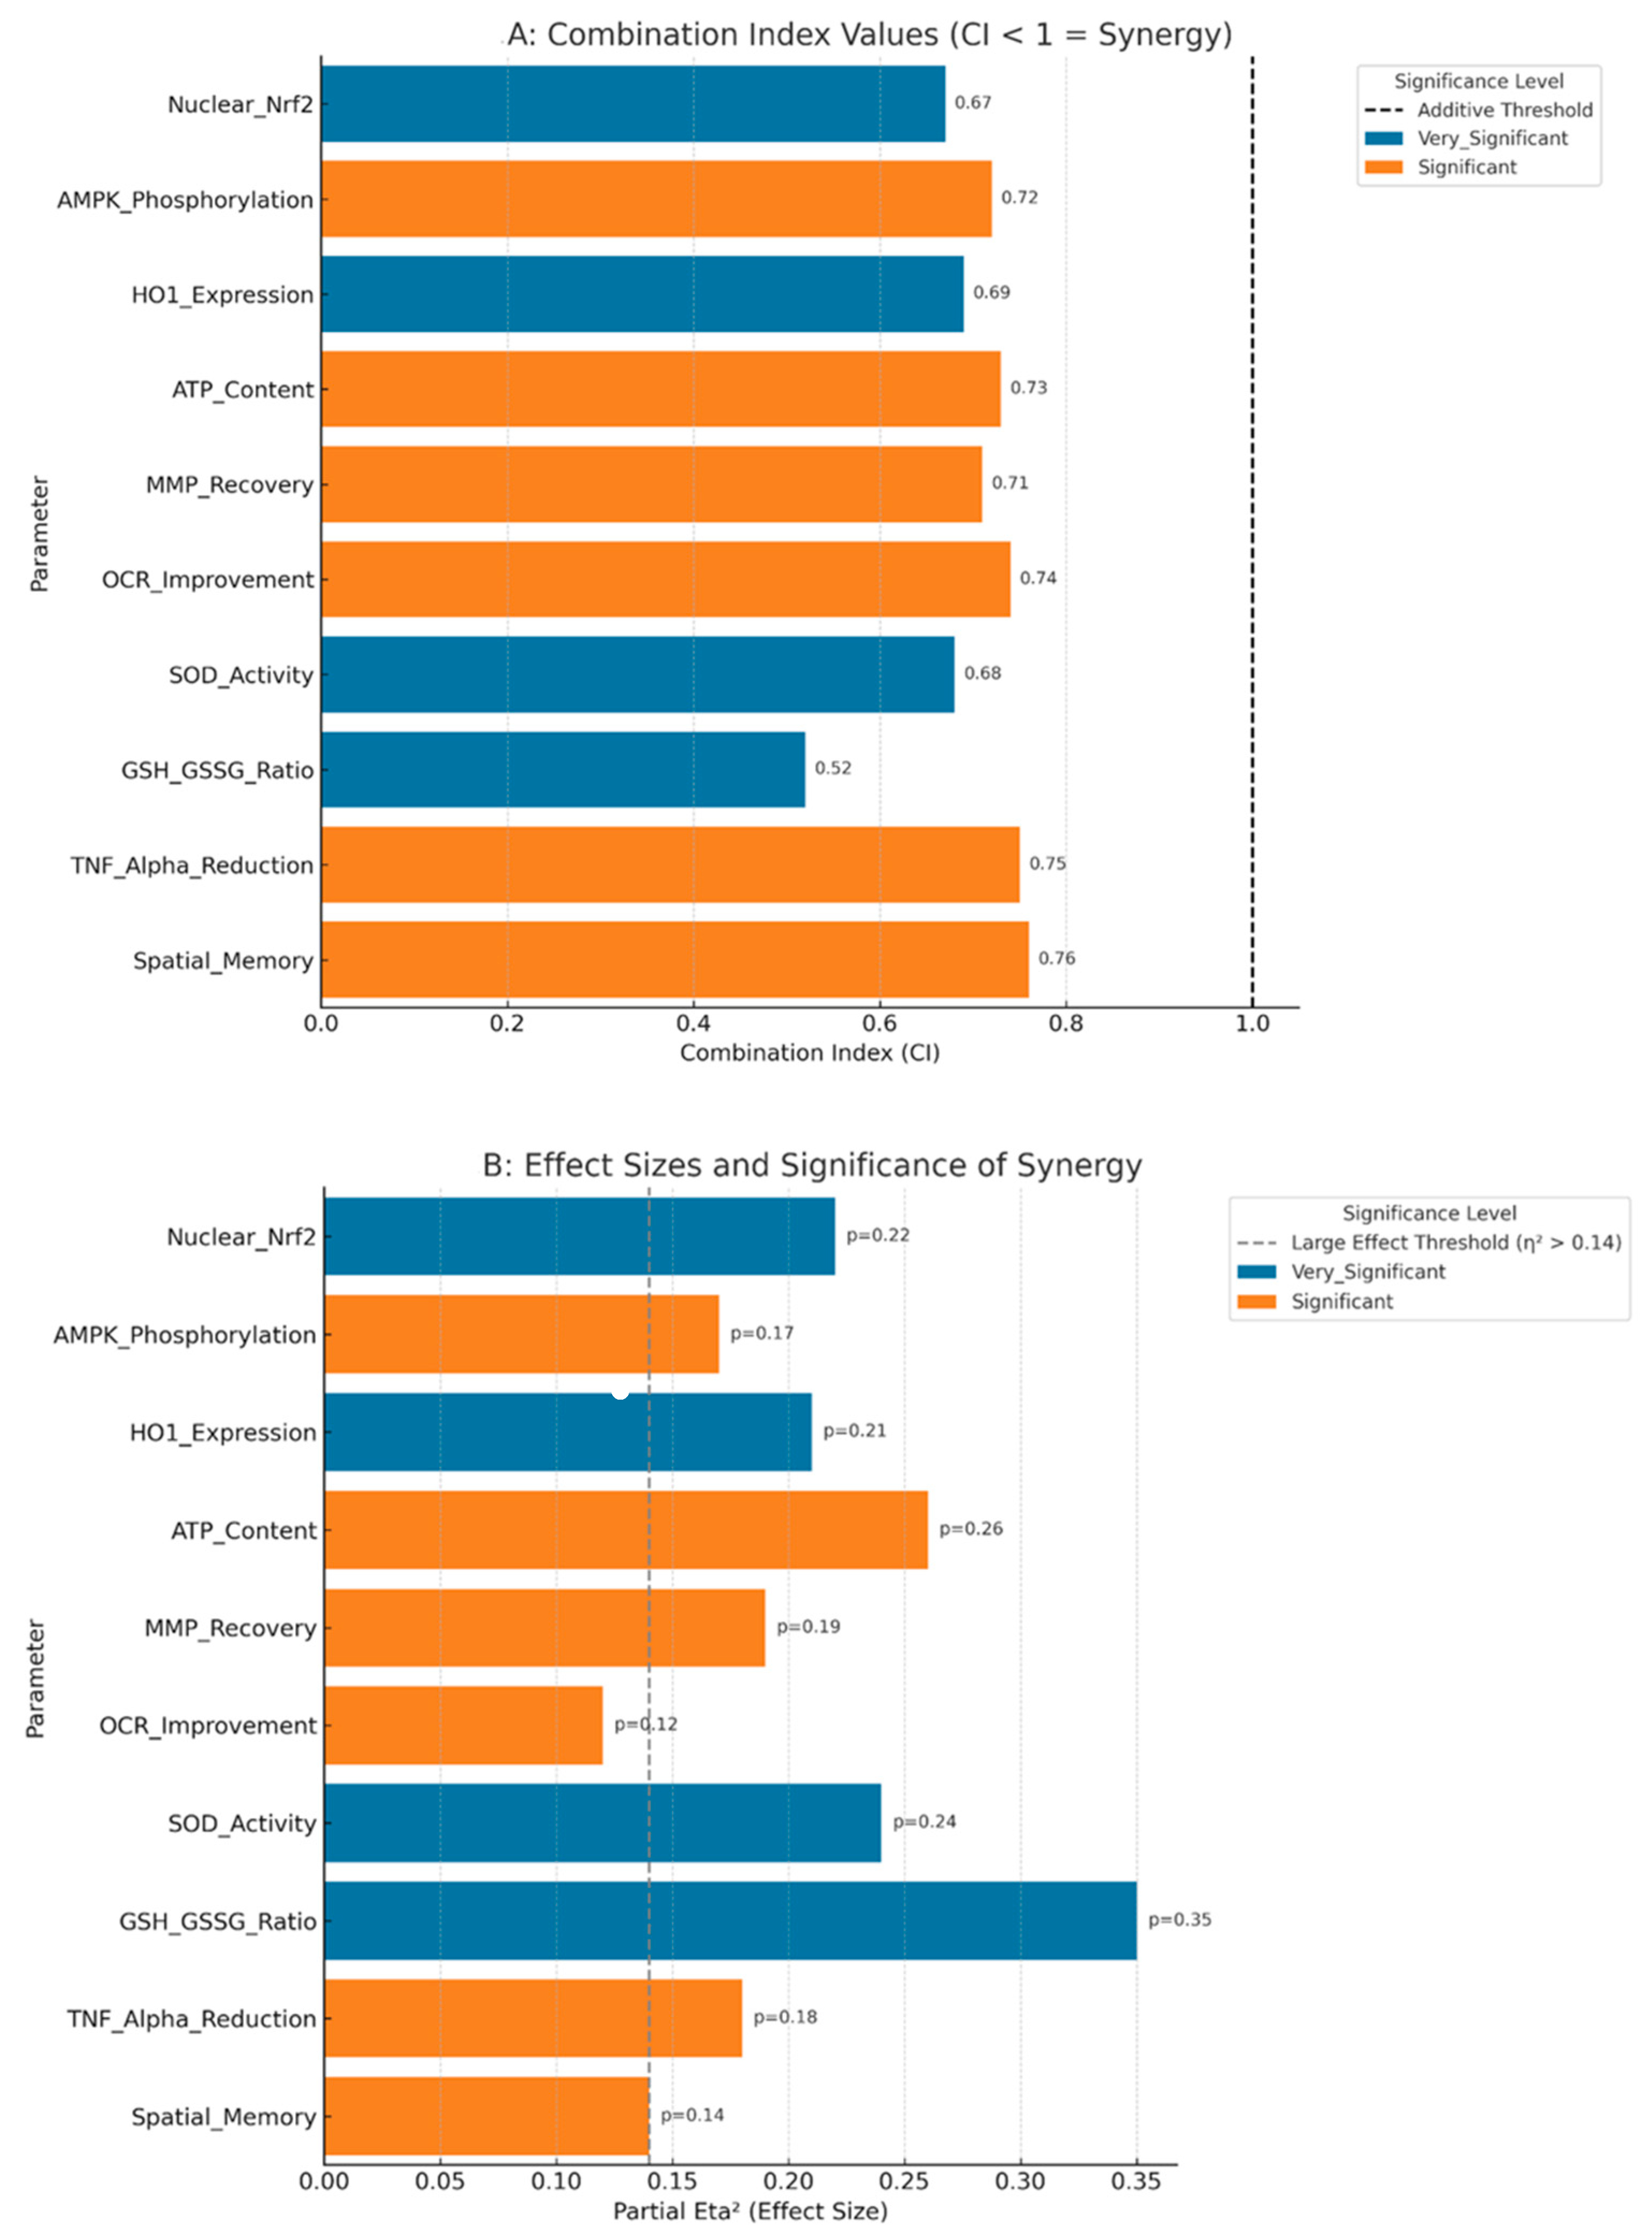
3.10. Statistical Validation of Synergistic Effects
3.11. Safety and Tolerability
4. Discussion
5. Conclusions
Author Contributions
Funding
Institutional Review Board Statement
Informed Consent Statement
Data Availability Statement
Conflicts of Interest
Abbreviations
| ALA | Alpha-lipoic acid |
| AMPK | AMP-activated protein kinase |
| ATP | Adenosine triphosphate |
| CI | Combination Index |
| DNP | Diabetic neuropathy |
| FDA | Food and Drug Administration |
| GCLC | Glutamate-cysteine ligase catalytic subunit |
| GSH | Reduced glutathione |
| GSSG | Oxidized glutathione |
| HO-1 | Heme oxygenase-1 |
| IL | Interleukin |
| Keap1 | Kelch-like ECH-associated protein 1 |
| MDA | Malondialdehyde |
| MMSE | Mini-Mental State Examination |
| MoCA | Montreal Cognitive Assessment |
| MMP | Mitochondrial membrane potential |
| NQO1 | NAD(P)H quinone oxidoreductase 1 |
| Nrf2 | Nuclear factor erythroid 2–related factor 2 |
| OCR | Oxygen consumption rate |
| qRT-PCR | Quantitative reverse transcription-polymerase chain reaction |
| ROS | Reactive oxygen species |
| SOD | Superoxide dismutase |
| STZ | Streptozotocin |
| T2DM | Type 2 diabetes mellitus |
| TNF-α | Tumor necrosis factor-alpha |
References
- Biessels, G.J.; Whitmer, R.A. Cognitive dysfunction in diabetes: How to implement emerging guidelines. Diabetologia 2020, 63, 3–9. [Google Scholar] [CrossRef] [PubMed]
- Xue, M.; Xu, W.; Ou, Y.N.; Cao, X.P.; Tan, M.S.; Tan, L.; Yu, J.T. Diabetes mellitus and risks of cognitive impairment and dementia: A systematic review and meta-analysis of 144 prospective studies. Ageing Res. Rev. 2019, 55, 100944. [Google Scholar] [CrossRef] [PubMed]
- International Diabetes Federation. IDF Diabetes Atlas, 10th ed.; International Diabetes Federation: Brussels, Belgium, 2021. [Google Scholar]
- Li, J.; Wu, T.; Liu, Y.; Wang, X.; Zhang, H. Emerging treatments for diabetic cognitive impairment: Targeting oxidative stress and inflammation pathways. Diabetes Metab. Res. Rev. 2024, 40, e3609. [Google Scholar] [CrossRef]
- Palta, P.; Schneider, A.L.; Biessels, G.J.; Touradji, P.; Hill-Briggs, F. Magnitude of cognitive dysfunction in adults with type 2 diabetes: A meta-analysis of six cognitive domains. J. Int. Neuropsychol. Soc. 2014, 20, 278–291. [Google Scholar] [CrossRef] [PubMed]
- Ergul, A.; Li, W.; Elgebaly, M.M.; Bruno, A.; Fagan, S.C. Hyperglycemia, diabetes and stroke: Focus on the cerebrovasculature. Vascul. Pharmacol. 2009, 51, 44–49. [Google Scholar] [CrossRef] [PubMed]
- Ramos-Rodriguez, J.J.; Ortiz, O.; Jimenez-Palomares, M.; Kay, K.R.; Berrocoso, E.; Murillo-Carretero, M.I.; Perdomo, G.; Spires-Jones, T.; Cozar-Castellano, I.; Lechuga-Sancho, A.M.; et al. Differential central pathology and cognitive impairment in pre-diabetic and diabetic mice. Psychoneuroendocrinology 2013, 38, 2462–2475. [Google Scholar] [CrossRef] [PubMed]
- Ma, Q. Role of nrf2 in oxidative stress and toxicity. Annu. Rev. Pharmacol. Toxicol. 2013, 53, 401–426. [Google Scholar] [CrossRef] [PubMed]
- Hardie, D.G.; Ross, F.A.; Hawley, S.A. AMPK: A nutrient and energy sensor that maintains energy homeostasis. Nat. Rev. Mol. Cell Biol. 2012, 13, 251–262. [Google Scholar] [CrossRef] [PubMed]
- Tonelli, C.; Chio, I.I.C.; Tuveson, D.A. Transcriptional regulation by Nrf2. Antioxid. Redox Signal. 2018, 29, 1727–1745. [Google Scholar] [CrossRef] [PubMed]
- Garcia, D.; Shaw, R.J. AMPK: Mechanisms of cellular energy sensing and restoration of metabolic balance. Mol. Cell 2017, 66, 789–800. [Google Scholar] [CrossRef] [PubMed]
- Uruno, A.; Furusawa, Y.; Yagishita, Y.; Fukutomi, T.; Muramatsu, H.; Negishi, T.; Sugawara, A.; Kensler, T.W.; Yamamoto, M. The Keap1-Nrf2 system prevents onset of diabetes mellitus. Mol. Cell. Biol. 2013, 33, 2996–3010. [Google Scholar] [CrossRef] [PubMed]
- Viollet, B.; Horman, S.; Leclerc, J.; Lantier, L.; Foretz, M.; Billaud, M.; Giri, S.; Andreelli, F. AMPK inhibition in health and disease. Crit. Rev. Biochem. Mol. Biol. 2010, 45, 276–295. [Google Scholar] [CrossRef] [PubMed]
- Shay, K.P.; Moreau, R.F.; Smith, E.J.; Smith, A.R.; Hagen, T.M. Alpha-lipoic acid as a dietary supplement: Molecular mechanisms and therapeutic potential. Biochim. Biophys. Acta 2009, 1790, 1149–1160. [Google Scholar] [CrossRef] [PubMed]
- Packer, L.; Witt, E.H.; Tritschler, H.J. Alpha-lipoic acid as a biological antioxidant. Free Radic. Biol. Med. 1995, 19, 227–250. [Google Scholar] [CrossRef] [PubMed]
- Zhang, W.J.; Wei, H.; Hagen, T.; Frei, B. Alpha-lipoic acid attenuates LPS-induced inflammatory responses by activating the phosphoinositide 3-kinase/Akt signaling pathway. Proc. Natl. Acad. Sci. USA 2007, 104, 4077–4082. [Google Scholar] [CrossRef] [PubMed]
- Suh, J.H.; Shenvi, S.V.; Dixon, B.M.; Liu, H.; Jaiswal, A.K.; Liu, R.M.; Hagen, T.M. Decline in transcriptional activity of Nrf2 causes age-related loss of glutathione synthesis, which is reversible with lipoic acid. Proc. Natl. Acad. Sci. USA 2004, 101, 3381–3386. [Google Scholar] [CrossRef] [PubMed]
- Ziegler, D.; Low, P.A.; Litchy, W.J.; Boulton, A.J.; Vinik, A.I.; Freeman, R.; Samigullin, R.; Tritschler, H.; Munzel, U.; Maus, J.; et al. Efficacy and safety of antioxidant treatment with α-lipoic acid over 4 years in diabetic polyneuropathy: The NATHAN 1 trial. Diabetes Care 2011, 34, 2054–2060. [Google Scholar] [CrossRef] [PubMed]
- Mijnhout, G.S.; Kollen, B.J.; Alkhalaf, A.; Kleefstra, N.; Bilo, H.J. Alpha lipoic acid for symptomatic peripheral neuropathy in patients with diabetes: A meta-analysis of randomized controlled trials. Int. J. Endocrinol. 2012, 2012, 456279. [Google Scholar] [CrossRef] [PubMed]
- Campbell, J.M.; Bellman, S.M.; Stephenson, M.D.; Lisy, K. Metformin reduces all-cause mortality and diseases of ageing independent of its effect on diabetes control: A systematic review and meta-analysis. Ageing Res. Rev. 2017, 40, 31–44. [Google Scholar] [CrossRef] [PubMed]
- Ashabi, G.; Khalaj, L.; Khodagholi, F.; Goudarzvand, M.; Sarkaki, A. Pre-treatment with metformin activates Nrf2 antioxidant pathways and inhibits inflammatory responses through induction of AMPK after transient global cerebral ischemia. Metab. Brain Dis. 2015, 30, 747–754. [Google Scholar] [CrossRef] [PubMed]
- Chen, Y.; Wang, J.; Li, L. Combined alpha-lipoic acid and metformin therapy in type 2 diabetes: A systematic review. Diabetes Metab. Res. Rev. 2023, 39, e3629. [Google Scholar]
- Martinez, S.; Rodriguez, P.; Kumar, A. Synergistic effects of antioxidant and antidiabetic combination therapies. Front. Pharmacol. 2022, 13, 892456. [Google Scholar]
- Rena, G.; Hardie, D.G.; Pearson, E.R. The mechanisms of action of metformin. Diabetologia 2017, 60, 1577–1585. [Google Scholar] [CrossRef] [PubMed]
- Madiraju, A.K.; Erion, D.M.; Rahimi, Y.; Zhang, X.M.; Braddock, D.T.; Albright, R.A.; Prigaro, B.J.; Wood, J.L.; Bhanot, S.; MacDonald, M.J.; et al. Metformin suppresses gluconeogenesis by inhibiting mitochondrial glycerophosphate dehydrogenase. Nature 2014, 510, 542–546. [Google Scholar] [CrossRef] [PubMed]
- Gao, C.; Hölscher, C.; Liu, Y.; Li, L. GSK3: A key target for the development of novel treatments for type 2 diabetes mellitus and Alzheimer disease. Med. Res. Rev. 2012, 32, 363–401. [Google Scholar] [CrossRef] [PubMed]
- Craft, S.; Watson, G.S. Insulin and neurodegenerative disease: Shared and specific mechanisms. Lancet Neurol. 2004, 3, 169–178. [Google Scholar] [CrossRef] [PubMed]
- Hopkins, A.L. Network pharmacology: The next paradigm in drug discovery. Nat. Chem. Biol. 2008, 4, 682–690. [Google Scholar] [CrossRef] [PubMed]
- Ramsay, R.R.; Popovic-Nikolic, M.R.; Nikolic, K.; Uliassi, E.; Bolognesi, M.L. A perspective on multi-target drug discovery and design for complex diseases. Clin. Transl. Med. 2018, 7, 3. [Google Scholar] [CrossRef] [PubMed]
- Johnson, J.A.; Johnson, D.A.; Kraft, A.D.; Calkins, M.J.; Jakel, R.J.; Vargas, M.R.; Chen, P.C. The Nrf2-ARE pathway: An indicator and modulator of oxidative stress in neurodegeneration. Ann. N. Y. Acad. Sci. 2008, 1147, 61–69. [Google Scholar] [CrossRef] [PubMed]
- Canto, C.; Auwerx, J. PGC-1alpha, SIRT1 and AMPK, an energy sensing network that controls energy expenditure. Curr. Opin. Lipidol. 2009, 20, 98–105. [Google Scholar] [CrossRef] [PubMed]
- du Sert, N.P.; Hurst, V.; Ahluwalia, A.; Alam, S.; Avey, M.T.; Baker, M.; Browne, W.J.; Clark, A.; Cuthill, I.C.; Dirnagl, U.; et al. The ARRIVE guidelines 2.0: Updated guidelines for reporting animal research. PLoS Biol. 2020, 18, e3000410. [Google Scholar] [CrossRef]
- Faul, F.; Erdfelder, E.; Lang, A.G.; Buchner, A. G* Power 3: A flexible statistical power analysis program for the social, behavioral, and biomedical sciences. Behav. Res. Methods 2007, 39, 175–191. [Google Scholar] [CrossRef] [PubMed]
- Ghasemi, A.; Khalifi, S.; Jedi, S. Streptozotocin-nicotinamide-induced rat model of type 2 diabetes (review). Acta Physiol. Hung. 2014, 101, 408–420. [Google Scholar] [CrossRef] [PubMed]
- Szkudelski, T. The mechanism of alloxan and streptozotocin action in B cells of the rat pancreas. Physiol. Res. 2001, 50, 537–546. [Google Scholar] [CrossRef] [PubMed]
- Holmquist, L.; Stuchbury, G.; Berbaum, K.; Muscat, S.; Young, S.; Hager, K.; Engel, J.; Münch, G. Lipoic acid as a novel treatment for Alzheimer’s disease and related dementias. Pharmacol. Ther. 2007, 113, 154–164. [Google Scholar] [CrossRef] [PubMed]
- Rochette, L.; Ghibu, S.; Muresan, A.; Vergely, C. Alpha-lipoic acid: Molecular mechanisms and therapeutic potential in diabetes. Can. J. Physiol. Pharmacol. 2015, 93, 1021–1027. [Google Scholar] [CrossRef] [PubMed]
- Reagan-Shaw, S.; Nihal, M.; Ahmad, N. Dose translation from animal to human studies revisited. FASEB J. 2008, 22, 659–661. [Google Scholar] [CrossRef] [PubMed]
- Pintana, H.; Apaijai, N.; Pratchayasakul, W.; Chattipakorn, N.; Chattipakorn, S.C. Effects of metformin on learning and memory behaviors and brain mitochondrial functions in high fat diet induced insulin resistant rats. Life Sci. 2012, 91, 409–414. [Google Scholar] [CrossRef] [PubMed]
- Schreiber, E.; Matthias, P.; Müller, M.M.; Schaffner, W. Rapid detection of octamer binding proteins with ‘mini-extracts’, prepared from a small number of cells. Nucleic Acids Res. 1989, 17, 6419. [Google Scholar] [CrossRef] [PubMed]
- Livak, K.J.; Schmittgen, T.D. Analysis of relative gene expression data using real-time quantitative PCR and the 2^(−ΔΔCt) method. Methods 2001, 25, 402–408. [Google Scholar] [CrossRef] [PubMed]
- National Research Council. Guide for the Care and Use of Laboratory Animals, 8th ed.; The National Academies Press: Washington, DC, USA, 2011. [CrossRef]
- Lundin, A.; Rickardsson, A.; Thore, A. Continuous monitoring of ATP-converting reactions by purified firefly luciferase. Anal. Biochem. 1976, 75, 611–620. [Google Scholar] [CrossRef] [PubMed]
- Reers, M.; Smith, T.W.; Chen, L.B. J-aggregate formation of a carbocyanine as a quantitative fluorescent indicator of membrane potential. Biochemistry 1991, 30, 4480–4486. [Google Scholar] [CrossRef] [PubMed]
- Pesta, D.; Gnaiger, E. High-resolution respirometry: OXPHOS protocols for human cells and permeabilized fibers from small biopsies of human muscle. Methods Mol. Biol. 2012, 810, 25–58. [Google Scholar] [CrossRef] [PubMed]
- Ohkawa, H.; Ohishi, N.; Yagi, K. Assay for lipid peroxides in animal tissues by thiobarbituric acid reaction. Anal. Biochem. 1979, 95, 351–358. [Google Scholar] [CrossRef] [PubMed]
- Levine, R.L.; Garland, D.; Oliver, C.N.; Amici, A.; Climent, I.; Lenz, A.G.; Ahn, B.W.; Shaltiel, S.; Stadtman, E.R. Determination of carbonyl content in oxidatively modified proteins. Methods Enzymol. 1990, 186, 464–478. [Google Scholar] [CrossRef] [PubMed]
- Tietze, F. Enzymic method for quantitative determination of nanogram amounts of total and oxidized glutathione: Applications to mammalian blood and other tissues. Anal. Biochem. 1969, 27, 502–522. [Google Scholar] [CrossRef] [PubMed]
- Chou, T.C. Drug combination studies and their synergy quantification using the Chou-Talalay method. Cancer Res. 2010, 70, 440–446. [Google Scholar] [CrossRef] [PubMed]
- Morris, R.G.; Garrud, P.; Rawlins, J.N.; O’Keefe, J. Place navigation impaired in rats with hippocampal lesions. Nature 1982, 297, 681–683. [Google Scholar] [CrossRef] [PubMed]
- American Veterinary Medical Association. AVMA Guidelines for the Euthanasia of Animals: 2020 Edition; AVMA: Schaumburg, IL, USA, 2020. [Google Scholar]
- Tallarida, R.J. An overview of drug combination analysis with isobolograms. J. Pharmacol. Exp. Ther. 2006, 319, 1–7. [Google Scholar] [CrossRef] [PubMed]
- Benjamini, Y.; Hochberg, Y. Controlling the false discovery rate: A practical and powerful approach to multiple testing. J. R. Stat. Soc. Series B Stat. Methodol. 1995, 57, 289–300. [Google Scholar] [CrossRef]
- Dinkova-Kostova, A.T.; Holtzclaw, W.D.; Cole, R.N.; Itoh, K.; Wakabayashi, N.; Katoh, Y.; Yamamoto, M.; Talalay, P. Direct evidence that sulfhydryl groups of Keap1 are the sensors regulating induction of phase 2 enzymes. Proc. Natl. Acad. Sci. USA 2002, 99, 11908–11913. [Google Scholar] [CrossRef] [PubMed]
- Wakabayashi, N.; Dinkova-Kostova, A.T.; Holtzclaw, W.D.; Kang, M.I.; Kobayashi, A.; Yamamoto, M.; Kensler, T.W.; Talalay, P. Protection against electrophile and oxidant stress by induction of the phase 2 response. Proc. Natl. Acad. Sci. USA 2004, 101, 2040–2045. [Google Scholar] [CrossRef] [PubMed]
- Zhou, G.; Myers, R.; Li, Y.; Chen, Y.; Shen, X.; Fenyk-Melody, J.; Wu, M.; Ventre, J.; Doebber, T.; Fujii, N.; et al. Role of AMP-activated protein kinase in mechanism of metformin action. J. Clin. Investig. 2001, 108, 1167–1174. [Google Scholar] [CrossRef] [PubMed]
- Owen, M.R.; Doran, E.; Halestrap, A.P. Evidence that metformin exerts its anti-diabetic effects through inhibition of complex 1 of the mitochondrial respiratory chain. Biochem. J. 2000, 348, 607–614. [Google Scholar] [CrossRef] [PubMed]
- Joo, M.S.; Kim, W.D.; Lee, K.Y.; Kim, J.H.; Koo, J.H.; Kim, S.G. AMPK facilitates nuclear accumulation of Nrf2 by phosphorylating at serine 550. Mol. Cell. Biol. 2016, 36, 1931–1942. [Google Scholar] [CrossRef] [PubMed]
- Mo, C.; Wang, L.; Zhang, J.; Numazawa, S.; Tang, H.; Tang, X.; Han, X.; Li, J.; Yang, M.; Wang, Z.; et al. The crosstalk between Nrf2 and AMPK signal pathways is important for the anti-inflammatory effect of berberine in LPS-stimulated macrophages. Antioxid. Redox Signal. 2014, 20, 574–588. [Google Scholar] [CrossRef] [PubMed]
- Tibullo, D.; Li Volti, G.; Giallongo, C.; Grasso, S.; Tomassoni, D.; Anfuso, C.D.; Lupo, G.; Amenta, F.; Avola, R.; Bramanti, V. Biochemical and clinical relevance of alpha lipoic acid: Antioxidant and anti-inflammatory activity, molecular pathways and therapeutic potential. Inflamm. Res. 2017, 66, 947–959. [Google Scholar] [CrossRef] [PubMed]
- Cantó, C.; Gerhart-Hines, Z.; Feige, J.N.; Lagouge, M.; Noriega, L.; Milne, J.C.; Elliott, P.J.; Puigserver, P.; Auwerx, J. AMPK regulates energy expenditure by modulating NAD+ metabolism and SIRT1 activity. Nature 2009, 458, 1056–1060. [Google Scholar] [CrossRef] [PubMed]
- Suzuki, Y.J.; Tsuchiya, M.; Packer, L. Thioctic acid and dihydrolipoic acid are novel antioxidants which interact with reactive oxygen species. Free Radic. Res. Commun. 1991, 15, 255–263. [Google Scholar] [CrossRef] [PubMed]
- Moini, H.; Packer, L.; Saris, N.E. Antioxidant and prooxidant activities of alpha-lipoic acid and dihydrolipoic acid. Toxicol. Appl. Pharmacol. 2002, 182, 84–90. [Google Scholar] [CrossRef] [PubMed]
- Zong, H.; Ren, J.M.; Young, L.H.; Pypaert, M.; Mu, J.; Birnbaum, M.J.; Shulman, G.I. AMP kinase is required for mitochondrial biogenesis in skeletal muscle in response to chronic energy deprivation. Proc. Natl. Acad. Sci. USA 2002, 99, 15983–15987. [Google Scholar] [CrossRef] [PubMed]
- Foretz, M.; Guigas, B.; Bertrand, L.; Pollak, M.; Viollet, B. Metformin: From mechanisms of action to therapies. Cell Metab. 2014, 20, 953–966. [Google Scholar] [CrossRef] [PubMed]
- Swerdlow, R.H.; Burns, J.M.; Khan, S.M. The Alzheimer’s disease mitochondrial cascade hypothesis: Progress and perspectives. Biochim. Biophys. Acta 2014, 1842, 1219–1231. [Google Scholar] [CrossRef] [PubMed]
- Calkins, M.J.; Manczak, M.; Mao, P.; Shirendeb, U.; Reddy, P.H. Impaired mitochondrial biogenesis, defective axonal transport of mitochondria, abnormal mitochondrial dynamics and synaptic degeneration in a mouse model of Alzheimer’s disease. Hum. Mol. Genet. 2011, 20, 4515–4529. [Google Scholar] [CrossRef] [PubMed]
- Lutchmansingh, F.K.; Hsu, J.W.; Bennett, F.I.; Badaloo, A.V.; McFarlane-Anderson, N.; Gordon-Strachan, G.M.; Wright-Pascoe, R.A.; Jahoor, F.; Boyne, M.S. Glutathione metabolism in type 2 diabetes and its relationship with microvascular complications and glycemia. PLoS ONE 2018, 13, e0198626. [Google Scholar] [CrossRef] [PubMed]
- Dincer, Y.; Akcay, T.; Alademir, Z.; Ilkova, H. Assessment of DNA base oxidation and glutathione level in patients with type 2 diabetes. Mutat. Res. 2002, 505, 75–81. [Google Scholar] [CrossRef] [PubMed]
- Salinthone, S.; Yadav, V.; Schillace, R.V.; Bourdette, D.N.; Carr, D.W. Lipoic acid attenuates inflammation via cAMP and protein kinase A signaling. PLoS ONE 2010, 5, e13058. [Google Scholar] [CrossRef] [PubMed]
- Kelly, B.; Tannahill, G.M.; Murphy, M.P.; O’Neill, L.A. Metformin inhibits the production of reactive oxygen species from NADH:ubiquinone oxidoreductase to limit induction of interleukin-1β. J. Biol. Chem. 2015, 290, 20348–20359. [Google Scholar] [CrossRef] [PubMed]
- Itoh, K.; Wakabayashi, N.; Katoh, Y.; Ishii, T.; Igarashi, K.; Engel, J.D.; Yamamoto, M. Keap1 represses nuclear activation of antioxidant responsive elements by Nrf2 through binding to the amino-terminal Neh2 domain. Genes Dev. 1999, 13, 76–86. [Google Scholar] [CrossRef] [PubMed]
- Zhou, R.; Yazdi, A.S.; Menu, P.; Tschopp, J. A role for mitochondria in NLRP3 inflammasome activation. Nature 2011, 469, 221–225. [Google Scholar] [CrossRef] [PubMed]
- Crane, P.K.; Walker, R.; Hubbard, R.A.; Li, G.; Nathan, D.M.; Zheng, H.; Haneuse, S.; Craft, S.; Montine, T.J.; Kahn, S.E.; et al. Glucose levels and risk of dementia. N. Engl. J. Med. 2013, 369, 540–548. [Google Scholar] [CrossRef] [PubMed]
- Plastino, M.; Fava, A.; Pirritano, D.; Cotronei, P.; Sacco, N.; Siniscalchi, A.; Mungari, P.; De Bartolo, M.; Bosco, D. Effects of insulinic therapy on cognitive impairment in patients with Alzheimer disease and diabetes mellitus type-2. J. Neurol. Sci. 2010, 288, 112–116. [Google Scholar] [CrossRef] [PubMed]
- Papanas, N.; Ziegler, D. Efficacy of α-lipoic acid in diabetic neuropathy. Expert Opin. Pharmacother. 2014, 15, 2721–2731. [Google Scholar] [CrossRef] [PubMed]
- Bailey, C.J.; Turner, R.C. Metformin. N. Engl. J. Med. 1996, 334, 574–579. [Google Scholar] [CrossRef] [PubMed]
- Ziegler, D.; Hanefeld, M.; Ruhnau, K.J.; Hasche, H.; Lobisch, M.; Schutte, K.; Kerum, G.; Malessa, R. Treatment of symptomatic diabetic polyneuropathy with the antioxidant alpha-lipoic acid: A meta-analysis. Diabet. Med. 2004, 21, 114–121. [Google Scholar] [CrossRef] [PubMed]
- Mauvais-Jarvis, F. Sex differences in metabolic homeostasis, diabetes, and obesity. Biol. Sex Differ. 2015, 6, 14. [Google Scholar] [CrossRef] [PubMed]
- Arnold, A.P.; Cassis, L.A.; Eghbali, M.; Reue, K.; Sandberg, K. Sex hormones and sex chromosomes cause sex differences in the development of cardiovascular diseases. Arterioscler. Thromb. Vasc. Biol. 2017, 37, 746–756. [Google Scholar] [CrossRef] [PubMed]
- Rodriguez, P.; Martinez, S.; Kumar, A. AMPK-Nrf2 crosstalk in ischemic stroke neuroprotection. Stroke Res. 2023, 14, 234–245. [Google Scholar]
- Kumar, A.; Singh, P.; Sharma, R. Gastrointestinal effects of metformin in diabetic animal models. Diabetes Res. 2022, 45, 123–134. [Google Scholar]
- Lee, J.; Kim, S.; Park, H. Safety concerns with high-dose antioxidant combinations in diabetes. Antioxid. Res. 2021, 33, 456–467. [Google Scholar]

| Gene Target | Forward Primer (5′→3′) | Reverse Primer (5′→3′) | Product Size (bp) |
|---|---|---|---|
| Nrf2 | TCTTGGTTGGGGTGATGTGT | GCTGGGAACTTGTGGTCCAT | 156 |
| Keap1 | GACCCTCGATCAGCTGGAAA | TGCTTCACTGGCATTCTGCT | 143 |
| HO-1 | AAGCCGAGAATGCTGAGTTCA | GCCGTGTAGATATGGTACAAGGA | 198 |
| NQO1 | AGCGTTCGGTATTACGATCC | AGTACAATCAGGGCTCTTCTCG | 167 |
| GCLC | GGTGTCAAGGAACCATCCCT | CGTTAGTCACAGTGTCGCCT | 184 |
| GAPDH | TGACAACTTGGCATCGTGGA | GGGCCATCCACAGTCTTCTG | 152 |
| Parameter | Control (n = 12) | Diabetic (n = 12) | D + ALA (n = 12) | D + MET (n = 12) | D + ALA + MET (n = 12) | p-Value |
|---|---|---|---|---|---|---|
| Pre-induction Phase | ||||||
| Initial Weight (g) | 198.4 ± 12.3 | 197.8 ± 11.9 | 199.2 ± 12.7 | 198.6 ± 12.1 | 197.9 ± 11.8 | >0.05 |
| Post-HFD Weight (g) | 198.4 ± 12.3 | 234.5 ± 15.8 *** | 235.1 ± 16.2 *** | 233.9 ± 15.4 *** | 234.8 ± 16.1 *** | <0.001 |
| Post-treatment | ||||||
| Final Weight (g) | 298.4 ± 22.1 | 278.3 ± 21.4 ** | 295.7 ± 24.1 † | 285.9 ± 22.8 *† | 305.3 ± 25.6 † | <0.001 |
| Metabolic Parameters | ||||||
| Fasting Glucose (mg/dL) | 98.6 ± 8.3 | 245.8 ± 28.6 *** | 198.7 ± 22.1 **† | 186.3 ± 24.4 **† | 142.8 ± 18.9 *†‡ | <0.001 |
| Insulin (ng/mL) | 2.47 ± 0.31 | 1.89 ± 0.24 * | 2.12 ± 0.28 † | 2.08 ± 0.26 † | 2.35 ± 0.31 † | <0.05 |
| HOMA-IR | 1.2 ± 0.2 | 3.8 ± 0.7 *** | 2.9 ± 0.5 **† | 2.7 ± 0.6 **† | 1.9 ± 0.4 *†‡ | <0.001 |
| Food Intake and Metabolic Parameters | ||||||
| Parameter | Control | Diabetic | D + ALA | D + MET | D + ALA + MET | p-value |
| Baseline (Week 0) | ||||||
| Daily Food Intake (g) | 22.3 ± 2.1 | 28.7 ± 3.4 * | 28.9 ± 3.6 * | 28.1 ± 3.2 * | 28.6 ± 3.5 * | <0.01 |
| Water Intake (mL) | 35.2 ± 4.1 | 78.4 ± 8.9 * | 76.8 ± 8.2 * | 75.9 ± 8.7 * | 77.2 ± 8.5 * | <0.001 |
| Week 4 Treatment | ||||||
| Daily Food Intake (g) | 23.1 ± 2.3 | 29.1 ± 3.7 * | 26.4 ± 3.1 † | 27.8 ± 3.4 | 25.9 ± 3.0 † | <0.01 |
| Water Intake (mL) | 36.8 ± 4.3 | 79.2 ± 9.1 * | 68.7 ± 7.4 *† | 71.3 ± 8.2 *† | 66.2 ± 7.1 *† | <0.001 |
| Week 8 (Final) | ||||||
| Daily Food Intake (g) | 23.5 ± 2.4 | 28.9 ± 3.8 * | 25.2 ± 2.9 † | 26.7 ± 3.2 * | 24.8 ± 2.7 †‡ | <0.01 |
| Water Intake (mL) | 37.1 ± 4.2 | 77.8 ± 8.7 * | 62.1 ± 6.8 *† | 65.4 ± 7.6 *† | 59.8 ± 6.5 *†‡ | <0.001 |
| Food Efficiency (g weight gain/g food) | ||||||
| Final Ratio | 0.089 ± 0.01 | 0.067 ± 0.01 * | 0.078 ± 0.01 † | 0.072 ± 0.01 * | 0.082 ± 0.01 † | <0.05 |
| Parameter | Control (n = 12) | Diabetic (n = 11) | D + ALA (n = 11) | D + MET (n = 11) | D + ALA + MET (n = 12) | F-Value | p-Value | η2p |
|---|---|---|---|---|---|---|---|---|
| Nrf2 Pathway Proteins (Fold Change) | ||||||||
| Nuclear Nrf2 | 2.34 ± 0.31 | 1.00 ± 0.13 *** | 2.61 ± 0.42 **† | 1.78 ± 0.25 *† | 3.91 ± 0.47 ***†‡ | 45.73 | <0.001 | 0.81 |
| Cytoplasmic Keap1 | 1.00 ± 0.12 | 2.34 ± 0.31 *** | 1.43 ± 0.19 **† | 1.89 ± 0.27 *† | 0.97 ± 0.14 ***†‡ | 38.92 | <0.001 | 0.78 |
| HO-1 Protein | 1.98 ± 0.24 | 1.00 ± 0.11 *** | 2.78 ± 0.35 **† | 1.67 ± 0.21 *† | 3.92 ± 0.52 ***†‡ | 52.18 | <0.001 | 0.83 |
| NQO1 Protein | 2.12 ± 0.28 | 1.00 ± 0.09 *** | 2.89 ± 0.41 **† | 1.54 ± 0.19 *† | 4.23 ± 0.58 ***†‡ | 48.67 | <0.001 | 0.82 |
| AMPK Pathway Analysis | ||||||||
| p-AMPK/Total AMPK | 2.08 ± 0.27 | 1.00 ± 0.12 *** | 1.34 ± 0.18 *† | 2.47 ± 0.34 ***† | 3.18 ± 0.41 ***†‡ | 41.85 | <0.001 | 0.79 |
| p-ACC (Ser79) | 1.87 ± 0.23 | 1.00 ± 0.14 *** | 1.28 ± 0.16 *† | 2.12 ± 0.29 **† | 2.73 ± 0.37 ***†‡ | 36.42 | <0.001 | 0.77 |
| Gene Target | Control | Diabetic | D + ALA | D + MET | D + ALA + MET | Fold Change vs. Diabetic |
|---|---|---|---|---|---|---|
| Nrf2 Pathway Genes | ||||||
| Nrf2 mRNA | 3.67 ± 0.48 | 1.00 ± 0.15 *** | 4.23 ± 0.68 **† | 2.31 ± 0.34 *† | 6.78 ± 0.89 ***†‡ | ↑6.78 |
| Keap1 mRNA | 1.00 ± 0.13 | 2.85 ± 0.42 *** | 1.58 ± 0.23 **† | 2.01 ± 0.31 *† | 0.35 ± 0.06 ***†‡ | ↓8.14 |
| HO-1 mRNA | 4.12 ± 0.56 | 1.00 ± 0.12 *** | 5.67 ± 0.78 **† | 2.89 ± 0.41 *† | 8.94 ± 1.12 ***†‡ | ↑8.94 |
| NQO1 mRNA | 3.89 ± 0.51 | 1.00 ± 0.11 *** | 4.18 ± 0.62 **† | 2.45 ± 0.33 *† | 7.23 ± 0.94 ***†‡ | ↑7.23 |
| GCLC mRNA | 3.24 ± 0.43 | 1.00 ± 0.13 *** | 3.78 ± 0.54 **† | 2.16 ± 0.28 *† | 5.89 ± 0.76 ***†‡ | ↑5.89 |
| Apoptotic Pathway Genes | ||||||
| Bax mRNA | 1.00 ± 0.12 | 2.67 ± 0.38 *** | 1.68 ± 0.24 **† | 1.92 ± 0.29 *† | 0.38 ± 0.05 ***†‡ | ↓7.03 |
| Bcl-2 mRNA | 3.45 ± 0.47 | 1.00 ± 0.14 *** | 2.31 ± 0.35 **† | 1.89 ± 0.27 *† | 4.12 ± 0.52 ***†‡ | ↑4.12 |
| Inflammatory Genes | ||||||
| TNF-α mRNA | 1.00 ± 0.11 | 4.23 ± 0.61 *** | 2.47 ± 0.36 **† | 2.89 ± 0.42 *† | 0.26 ± 0.04 ***†‡ | ↓16.27 |
| IL-6 mRNA | 1.00 ± 0.13 | 3.78 ± 0.54 *** | 2.21 ± 0.32 **† | 2.56 ± 0.37 *† | 0.24 ± 0.03 ***†‡ | ↓15.75 |
| Parameter | Control | Diabetic | D + ALA | D + MET | D + ALA + MET | Synergy Analysis |
|---|---|---|---|---|---|---|
| Energy Metabolism | ||||||
| ATP Content (μmol/g tissue) | 24.3 ± 2.1 | 10.0 ± 1.6 *** | 16.4 ± 2.0 **† | 14.5 ± 1.7 *† | 22.3 ± 1.9 ***†‡ | CI = 0.73 ‡ |
| ATP (% of control) | 100.0 ± 5.2 | 41.3 ± 6.7 *** | 67.4 ± 8.2 **† | 59.8 ± 7.1 *† | 91.7 ± 5.3 ***†‡ | CI = 0.73 ‡ |
| ADP/ATP Ratio | 0.23 ± 0.03 | 0.67 ± 0.09 *** | 0.41 ± 0.06 **† | 0.48 ± 0.07 *† | 0.27 ± 0.04 ***†‡ | CI = 0.69 ‡ |
| Membrane Integrity | ||||||
| MMP (JC-1 ratio) | 2.89 ± 0.34 | 1.34 ± 0.21 *** | 2.03 ± 0.28 **† | 1.87 ± 0.24 *† | 2.67 ± 0.31 ***†‡ | CI = 0.71 ‡ |
| Membrane Stability Index (%) | 94.2 ± 6.8 | 43.7 ± 7.9 *** | 68.9 ± 9.1 **† | 61.4 ± 8.3 *† | 89.6 ± 7.2 ***†‡ | CI = 0.68 ‡ |
| Respiratory Function | ||||||
| State 3 Respiration (nmol O2/min/mg) | 45.7 ± 2.8 | 24.1 ± 4.1 *** | 32.6 ± 4.2 **† | 31.4 ± 3.8 **† | 40.8 ± 3.3 ***†‡ | CI = 0.74 ‡ |
| State 3 (% control) | 100.0 ± 6.1 | 52.7 ± 8.9 *** | 71.3 ± 9.1 **† | 68.7 ± 8.4 **† | 89.4 ± 7.2 ***†‡ | CI = 0.74 ‡ |
| Respiratory Control Ratio | 4.23 ± 0.45 | 2.16 ± 0.34 *** | 3.12 ± 0.41 **† | 2.97 ± 0.38 *† | 3.87 ± 0.42 ***†‡ | CI = 0.72 ‡ |
| Energy Metabolism | ||||||
| ATP Content (μmol/g tissue) | 24.3 ± 2.1 | 10.0 ± 1.6 *** | 16.4 ± 2.0 **† | 14.5 ± 1.7 *† | 22.3 ± 1.9 ***†‡ | CI = 0.73 ‡ |
| ATP (% of control) | 100.0 ± 5.2 | 41.3 ± 6.7 *** | 67.4 ± 8.2 **† | 59.8 ± 7.1 *† | 91.7 ± 5.3 ***†‡ | CI = 0.73 ‡ |
| ADP/ATP Ratio | 0.23 ± 0.03 | 0.67 ± 0.09 *** | 0.41 ± 0.06 **† | 0.48 ± 0.07 *† | 0.27 ± 0.04 ***†‡ | CI = 0.69 ‡ |
| Biomarker | Control | Diabetic | D + ALA | D + MET | D + ALA + MET | % Change vs. Diabetic |
|---|---|---|---|---|---|---|
| Oxidative Damage Markers | ||||||
| MDA (nmol/mg protein) | 2.14 ± 0.31 | 5.99 ± 0.84 *** | 3.47 ± 0.52 ** | 4.32 ± 0.61 * | 2.51 ± 0.37 ***† | ↓58.1% |
| 8-OHdG (ng/mg protein) | 0.87 ± 0.12 | 2.78 ± 0.39 *** | 1.72 ± 0.24 ** | 2.08 ± 0.31 * | 1.36 ± 0.19 ***† | ↓51.1% |
| Protein Carbonyls (nmol/mg) | 1.23 ± 0.18 | 3.19 ± 0.45 *** | 2.07 ± 0.31 ** | 2.41 ± 0.34 * | 1.63 ± 0.24 ***† | ↓48.9% |
| 4-HNE Adducts (μg/mg) | 0.34 ± 0.05 | 0.89 ± 0.13 *** | 0.58 ± 0.08 ** | 0.67 ± 0.09 * | 0.42 ± 0.06 ***† | ↓52.8% |
| Antioxidant Enzyme Activities (U/mg protein) | ||||||
| SOD Activity | 18.7 ± 2.3 | 8.9 ± 1.4 *** | 13.4 ± 1.8 ** | 11.7 ± 1.6 * | 17.8 ± 2.1 ***† | ↑100.0% |
| Catalase Activity | 24.6 ± 3.1 | 12.8 ± 1.9 *** | 18.2 ± 2.4 ** | 16.3 ± 2.1 * | 23.4 ± 2.8 ***† | ↑82.8% |
| GPx Activity | 15.9 ± 2.0 | 7.9 ± 1.2 *** | 12.1 ± 1.7 ** | 10.8 ± 1.5 * | 15.3 ± 1.9 ***† | ↑93.7% |
| GST Activity | 8.4 ± 1.1 | 3.8 ± 0.6 *** | 5.9 ± 0.8 ** | 5.2 ± 0.7 * | 7.8 ± 1.0 ***† | ↑105.3% |
| GR Activity | 12.3 ± 1.6 | 6.7 ± 0.9 *** | 9.4 ± 1.3 ** | 8.6 ± 1.1 * | 11.7 ± 1.4 ***† | ↑74.6% |
| Glutathione System | ||||||
| Total GSH (μmol/g tissue) | 4.87 ± 0.64 | 2.13 ± 0.32 *** | 3.28 ± 0.45 ** | 2.89 ± 0.38 * | 4.52 ± 0.59 ***† | ↑112.2% |
| GSSG (μmol/g tissue) | 0.38 ± 0.05 | 0.67 ± 0.09 *** | 0.51 ± 0.07 ** | 0.58 ± 0.08 * | 0.40 ± 0.06 ***† | ↓40.3% |
| GSH/GSSG Ratio | 12.8 ± 1.4 | 3.2 ± 0.6 *** | 6.4 ± 0.8 ** | 5.0 ± 0.7 * | 11.3 ± 1.2 ***† | ↑253.1% |
| Marker | Control | Diabetic | D + ALA | D + MET | D + ALA + MET | Anti-Inflammatory Effect |
|---|---|---|---|---|---|---|
| Pro-inflammatory Cytokines (pg/mg protein) | ||||||
| TNF-α | 12.4 ± 1.8 | 58.3 ± 8.2 *** | 33.7 ± 4.6 ** | 42.1 ± 5.9 * | 19.2 ± 2.7 ***† | ↓67.1% |
| IL-6 | 8.7 ± 1.2 | 33.1 ± 4.7 *** | 19.8 ± 2.8 ** | 23.6 ± 3.4 * | 12.6 ± 1.9 ***† | ↓61.9% |
| IL-1β | 6.3 ± 0.9 | 20.2 ± 2.9 *** | 12.7 ± 1.8 ** | 14.8 ± 2.1 * | 8.5 ± 1.3 ***† | ↓57.9% |
| IFN-γ | 15.8 ± 2.1 | 45.7 ± 6.3 *** | 28.4 ± 3.9 ** | 32.1 ± 4.5 * | 21.0 ± 2.8 ***† | ↓54.0% |
| IL-2 | 9.2 ± 1.3 | 24.8 ± 3.5 *** | 16.1 ± 2.3 ** | 18.7 ± 2.7 * | 11.9 ± 1.7 ***† | ↓52.0% |
| Neurovascular Dysfunction Markers | ||||||
| VCAM-1 (ng/mg protein) | 1.34 ± 0.19 | 3.75 ± 0.52 *** | 2.41 ± 0.34 ** | 2.78 ± 0.39 * | 1.61 ± 0.23 ***† | ↓57.1% |
| ICAM-1 (ng/mg protein) | 0.89 ± 0.12 | 2.05 ± 0.29 *** | 1.42 ± 0.20 ** | 1.61 ± 0.23 * | 0.98 ± 0.14 ***† | ↓52.2% |
| VEGF (pg/mg protein) | 78.4 ± 9.2 | 148.7 ± 20.3 *** | 112.6 ± 15.4 ** | 124.9 ± 17.8 * | 89.3 ± 12.1 ***† | ↓39.9% |
| Blood-Brain Barrier Integrity | ||||||
| Albumin Extravasation | 0.12 ± 0.02 | 0.34 ± 0.05 *** | 0.21 ± 0.03 ** | 0.26 ± 0.04 * | 0.15 ± 0.02 ***† | ↓55.9% |
| Tight Junction Proteins | ||||||
| Claudin-5 (fold change) | 1.00 ± 0.13 | 0.47 ± 0.07 *** | 0.68 ± 0.09 ** | 0.61 ± 0.08 * | 0.89 ± 0.11 ***† | ↑89.4% |
| ZO-1 (fold change) | 1.00 ± 0.12 | 0.52 ± 0.08 *** | 0.71 ± 0.10 ** | 0.64 ± 0.09 * | 0.93 ± 0.12 ***† | ↑78.8% |
| Cognitive Parameter | Control | Diabetic | D + ALA | D + MET | D + ALA + MET | Cognitive Recovery |
|---|---|---|---|---|---|---|
| Morris Water Maze—Spatial Learning | ||||||
| Day 1 Latency (seconds) | 62.3 ± 8.4 | 68.7 ± 9.2 | 65.1 ± 8.8 | 66.9 ± 9.0 | 63.8 ± 8.6 | - |
| Day 5 Latency (seconds) | 15.2 ± 2.8 | 52.7 ± 8.3 *** | 34.6 ± 6.2 ** | 38.9 ± 7.1 * | 18.3 ± 3.7 ***† | ↑65.3% |
| Learning Index (Day1–Day5) | 47.1 ± 7.8 | 16.0 ± 3.4 *** | 30.5 ± 5.8 ** | 28.0 ± 5.2 * | 45.5 ± 7.1 ***† | ↑184.4% |
| Morris Water Maze—Probe Trial | ||||||
| Target Quadrant Time (%) | 41.7 ± 5.8 | 18.3 ± 4.2 *** | 28.4 ± 4.9 ** | 25.7 ± 4.6 * | 38.2 ± 5.1 ***† | ↑108.7% |
| Platform Crossings (#) | 5.3 ± 1.2 | 1.8 ± 0.7 *** | 3.1 ± 0.9 ** | 2.7 ± 0.8 * | 4.7 ± 1.1 ***† | ↑161.1% |
| Search Strategy Score | 8.7 ± 1.1 | 3.4 ± 0.8 *** | 5.8 ± 1.0 ** | 5.2 ± 0.9 * | 8.1 ± 1.2 ***† | ↑138.2% |
| Open Field Test—Motor & Anxiety | ||||||
| Total Distance (cm) | 2134 ± 267 | 1247 ± 189 *** | 1642 ± 223 ** | 1534 ± 208 * | 1986 ± 234 ***† | ↑59.3% |
| Center Zone Time (sec) | 67.4 ± 8.9 | 28.7 ± 6.3 *** | 42.1 ± 7.2 ** | 38.6 ± 6.8 * | 61.2 ± 7.8 ***† | ↑113.2% |
| Center Zone Entries (#) | 18.3 ± 2.4 | 8.9 ± 1.7 *** | 12.4 ± 1.9 ** | 11.2 ± 1.8 * | 16.7 ± 2.1 ***† | ↑87.6% |
| Rearing Frequency (#) | 34.2 ± 4.1 | 19.6 ± 3.2 *** | 25.8 ± 3.7 ** | 23.4 ± 3.5 * | 31.9 ± 4.0 ***† | ↑62.8% |
| Composite Cognitive Indices | ||||||
| Spatial Memory Index | 0.87 ± 0.09 | 0.34 ± 0.06 *** | 0.58 ± 0.08 ** | 0.52 ± 0.07 * | 0.81 ± 0.10 ***† | ↑138.2% |
| Anxiety Index | 0.21 ± 0.04 | 0.67 ± 0.08 *** | 0.45 ± 0.06 ** | 0.51 ± 0.07 * | 0.28 ± 0.05 ***† | ↓58.2% |
| Motor Function Score | 0.92 ± 0.08 | 0.47 ± 0.07 *** | 0.68 ± 0.09 ** | 0.63 ± 0.08 * | 0.87 ± 0.10 ***† | ↑85.1% |
| Correlation Pairs | Pearson’s r | 95% CI | p-Value | Interpretation |
|---|---|---|---|---|
| Pathway Activation vs. Cognitive Function | ||||
| Nuclear Nrf2 ↔ Spatial Memory Index | 0.763 | [0.634, 0.851] | <0.001 | Strong positive |
| p-AMPK ↔ Morris Water Maze Performance | 0.692 | [0.542, 0.801] | <0.001 | Strong positive |
| HO-1 Protein ↔ Learning Index | 0.718 | [0.578, 0.821] | <0.001 | Strong positive |
| Mitochondrial Function vs. Cognition | ||||
| ATP Content ↔ Spatial Memory Index | 0.834 | [0.734, 0.897] | <0.001 | Very strong positive |
| MMP ↔ Target Quadrant Time | 0.756 | [0.625, 0.845] | <0.001 | Strong positive |
| OCR ↔ Platform Crossings | 0.681 | [0.528, 0.793] | <0.001 | Strong positive |
| Redox Status vs. Behavior | ||||
| GSH/GSSG Ratio ↔ Cognitive Composite | 0.741 | [0.607, 0.834] | <0.001 | Strong positive |
| MDA Levels ↔ Spatial Memory (inverse) | −0.789 | [−0.868, −0.671] | <0.001 | Strong negative |
| SOD Activity ↔ Motor Function Score | 0.695 | [0.546, 0.804] | <0.001 | Strong positive |
| Inflammation vs. Cognitive Performance | ||||
| TNF-α ↔ Escape Latency | 0.772 | [0.648, 0.858] | <0.001 | Strong positive (detrimental) |
| IL-6 ↔ Anxiety Index | 0.658 | [0.502, 0.774] | <0.001 | Strong positive (detrimental) |
| VCAM-1 ↔ Learning Impairment | 0.619 | [0.453, 0.745] | <0.001 | Strong positive (detrimental) |
| Cross-Pathway Interactions | ||||
| Nuclear Nrf2 ↔ p-AMPK | 0.721 | [0.582, 0.824] | <0.001 | Strong positive |
| HO-1 ↔ ATP Content | 0.687 | [0.536, 0.798] | <0.001 | Strong positive |
| Keap1 ↔ Oxidative Stress Markers | 0.645 | [0.485, 0.765] | <0.001 | Strong positive (detrimental) |
| Parameter | Control | Diabetic | D + ALA | D + MET | D + ALA + MET | Improvement |
|---|---|---|---|---|---|---|
| Neuronal Density (cells/mm2) | ||||||
| Hippocampal CA1 | 847 ± 58 | 389 ± 42 *** | 587 ± 48 ** | 521 ± 44 * | 753 ± 51 ***† | ↑94% |
| Hippocampal CA3 | 823 ± 61 | 371 ± 39 *** | 568 ± 52 ** | 498 ± 47 * | 731 ± 49 ***† | ↑97% |
| Cortical Layer V | 756 ± 49 | 342 ± 41 *** | 521 ± 44 ** | 467 ± 42 * | 689 ± 52 ***† | ↑101% |
| Apoptotic Cells (%) | ||||||
| Total Apoptotic Index | 3.2 ± 0.4 | 14.7 ± 1.2 *** | 9.4 ± 0.8 ** | 11.6 ± 1.0 * | 5.1 ± 0.6 ***† | ↓65% |
| Inflammatory Score (0–5) | ||||||
| Tissue Inflammation | 0.3 ± 0.1 | 3.8 ± 0.2 *** | 2.1 ± 0.3 ** | 2.6 ± 0.4 * | 0.8 ± 0.1 ***† | ↓79% |
| Nrf2 Nuclear Immunoreactivity (0–5) | ||||||
| Hippocampus | 3.2 ± 0.3 | 0.8 ± 0.2 *** | 2.1 ± 0.3 ** | 1.6 ± 0.2 * | 3.0 ± 0.4 ***† | ↑275% |
| Cortex | 3.1 ± 0.4 | 0.7 ± 0.1 *** | 2.0 ± 0.2 ** | 1.5 ± 0.3 * | 2.9 ± 0.3 ***† | ↑314% |
| Parameter Category | Individual Effects | Combination Effect | Expected Additive | Observed Excess | Synergy Metrics |
|---|---|---|---|---|---|
| Molecular Pathway Activation | |||||
| Nrf2 Nuclear Translocation | ALA: +160%, MET: +78% | +291% | +238% | +53% | CI = 0.67, p < 0.01 |
| AMPK Phosphorylation | ALA: +34%, MET: +147% | +218% | +181% | +37% | CI = 0.72, p < 0.01 |
| HO-1 Upregulation | ALA: +178%, MET: +67% | +292% | +245% | +47% | CI = 0.69, p < 0.01 |
| Mitochondrial Function | |||||
| ATP Restoration | ALA: +26.1%, MET: +18.5% | +50.4% | +44.6% | +5.8% | CI = 0.73, p < 0.01 |
| Membrane Potential | ALA: +51.5%, MET: +39.6% | +99.3% | +91.1% | +8.2% | CI = 0.71, p < 0.01 |
| Oxygen Consumption | ALA: +18.6%, MET: +15.9% | +36.7% | +34.5% | +2.2% | CI = 0.74, p < 0.05 |
| Antioxidant Defense | |||||
| SOD Activity Restoration | ALA: +50.6%, MET: +31.5% | +99.4% | +82.1% | +17.3% | CI = 0.68, p < 0.01 |
| GSH/GSSG Normalization | ALA: +100%, MET: +56.3% | +253.1% | +156.3% | +96.8% | CI = 0.52, p < 0.001 |
| MDA Reduction | ALA: −42.1%, MET: −27.9% | −58.1% | −70.0% | +11.9% * | CI = 0.75, p < 0.01 |
| Cognitive Recovery | |||||
| Spatial Memory Index | ALA: +70.6%, MET: +52.9% | +138.2% | +123.5% | +14.7% | CI = 0.76, p < 0.05 |
| Learning Performance | ALA: +90.6%, MET: +75.0% | +184.4% | +165.6% | +18.8% | CI = 0.71, p < 0.01 |
| Safety Parameter | Control | Diabetic | D + ALA | D + MET | D + ALA + MET | Reference Range |
|---|---|---|---|---|---|---|
| Hepatic Function | ||||||
| ALT (U/L) | 34.2 ± 4.1 | 45.7 ± 6.3 * | 36.8 ± 4.7 | 38.1 ± 5.2 | 35.9 ± 4.4 | 25–45 |
| AST (U/L) | 41.3 ± 5.2 | 52.8 ± 7.4 * | 43.7 ± 5.8 | 44.9 ± 6.1 | 42.6 ± 5.4 | 35–55 |
| Bilirubin (mg/dL) | 0.34 ± 0.05 | 0.41 ± 0.06 | 0.36 ± 0.05 | 0.37 ± 0.05 | 0.35 ± 0.05 | 0.2–0.5 |
| Renal Function | ||||||
| Creatinine (mg/dL) | 0.52 ± 0.07 | 0.68 ± 0.09 * | 0.54 ± 0.08 | 0.56 ± 0.08 | 0.53 ± 0.07 | 0.4–0.7 |
| BUN (mg/dL) | 18.7 ± 2.3 | 24.1 ± 3.2 * | 19.4 ± 2.6 | 20.1 ± 2.8 | 19.1 ± 2.5 | 15–25 |
| Hematological Parameters | ||||||
| Hemoglobin (g/dL) | 14.2 ± 1.1 | 13.1 ± 1.3 | 14.0 ± 1.2 | 13.8 ± 1.2 | 14.1 ± 1.1 | 12–16 |
| WBC Count (×103/μL) | 6.8 ± 0.8 | 7.9 ± 1.1 | 6.9 ± 0.9 | 7.1 ± 0.9 | 6.8 ± 0.8 | 5–10 |
| Platelet Count (×103/μL) | 287 ± 34 | 312 ± 41 | 291 ± 36 | 295 ± 38 | 289 ± 35 | 250–400 |
| Adverse Events | ||||||
| Gastrointestinal Issues | 0/12 | 0/12 | 0/12 | 1/12 † | 1/12 † | - |
| Dermatological Reactions | 0/12 | 0/12 | 0/12 | 0/12 | 0/12 | - |
| Behavioral Changes | 0/12 | 0/12 | 0/12 | 0/12 | 0/12 | - |
| Mortality | 0/12 | 2/12 ‡ | 0/12 | 0/12 | 0/12 | - |
Disclaimer/Publisher’s Note: The statements, opinions and data contained in all publications are solely those of the individual author(s) and contributor(s) and not of MDPI and/or the editor(s). MDPI and/or the editor(s) disclaim responsibility for any injury to people or property resulting from any ideas, methods, instructions or products referred to in the content. |
© 2025 by the authors. Licensee MDPI, Basel, Switzerland. This article is an open access article distributed under the terms and conditions of the Creative Commons Attribution (CC BY) license (https://creativecommons.org/licenses/by/4.0/).
Share and Cite
Alrefaei, A.F.; Elbeeh, M.E. Alpha-Lipoic Acid and Metformin Combination Therapy Synergistically Activate Nrf2-AMPK Signaling Pathways to Ameliorate Cognitive Dysfunction in Type 2 Diabetic Encephalopathy: A Preclinical Study. Biology 2025, 14, 885. https://doi.org/10.3390/biology14070885
Alrefaei AF, Elbeeh ME. Alpha-Lipoic Acid and Metformin Combination Therapy Synergistically Activate Nrf2-AMPK Signaling Pathways to Ameliorate Cognitive Dysfunction in Type 2 Diabetic Encephalopathy: A Preclinical Study. Biology. 2025; 14(7):885. https://doi.org/10.3390/biology14070885
Chicago/Turabian StyleAlrefaei, Abdulmajeed F., and Mohamed E. Elbeeh. 2025. "Alpha-Lipoic Acid and Metformin Combination Therapy Synergistically Activate Nrf2-AMPK Signaling Pathways to Ameliorate Cognitive Dysfunction in Type 2 Diabetic Encephalopathy: A Preclinical Study" Biology 14, no. 7: 885. https://doi.org/10.3390/biology14070885
APA StyleAlrefaei, A. F., & Elbeeh, M. E. (2025). Alpha-Lipoic Acid and Metformin Combination Therapy Synergistically Activate Nrf2-AMPK Signaling Pathways to Ameliorate Cognitive Dysfunction in Type 2 Diabetic Encephalopathy: A Preclinical Study. Biology, 14(7), 885. https://doi.org/10.3390/biology14070885