Simple Summary
Our study showed that chemokine signaling pathways, MAPK signaling pathways, and cell cycle were identified in S. esculenta under different salinity stress. In particular, we identified the core genes, including NFKBIA. These findings suggest that NFKBIA, the core gene of this gene set, exhibits a central regulatory role, which potentially contributes to alleviating oxidative stress and regulating immune function. This study provides valuable insights for aquaculture practices guided by immunological principles.
Abstract
The stable marine environment is conducive to the development of the aquaculture industry. However, with the change of seawater salinity in recent years, it has had a great impact on the survival and breeding of cephalopods such as Sepia esculenta. In this study, biochemical measurement and transcriptome sequencing were performed on the larvae of S. esculenta after different salinity stresses (salinity of 20 ppt and 40 ppt), and the reliability of transcriptome results was proved by physiological indexes. We performed Gene Ontology (GO), Kyoto Encyclopedia of Genes and Genomes (KEGG) enrichment analysis, and gene set enrichment analysis (GSEA) on all annotated genes, and gene sets were identified, including chemokine signaling pathways, MAPK signaling pathways, and cell cycle pathways. Finally, we constructed the protein-protein interaction networks (PPI) between the core genes in these gene sets and differentially expressed genes (DEGs) to identify key genes, including NFKBIA. Among them, the NFKBIA is not only a core gene in the chemokine signaling pathway gene set under four stresses but also has a high number of protein interactions. We speculate that this gene may have important immunomodulatory functions in the face of different time and salinity stresses. The results of our study explored the molecular mechanism of S. esculenta in the face of environmental stress, revealed the key molecular regulatory pathways for its survival and adaptation under complex environmental pressures, and may provide insights relevant to the development of S. esculenta pond culture.
1. Introduction
For aquaculture, a stable and suitable marine environment is required as support [1,2]. However, in recent years, with the change of environment, the change of seawater index is accompanied by, such as, the fluctuation of seawater salinity in different sea areas [3,4]. Changes in seawater salinity caused by environmental changes pose a great threat to some marine organisms [5,6]. For example, increased salinity can trigger severe stress responses in marine organisms, sometimes leading to mortality [7]. Marine organisms are very susceptible to salinity changes, as even minor fluctuations can disrupt osmoregulatory mechanisms in aquatic organisms, ultimately compromising their viability and reproduction through osmotic stress [8]. Changes in ocean salinity could also have a significant influence on the vital activities of marine mollusks [9]. In some of the earlier studies, Knowles et al. [10] investigated physiological changes in Crassostrea gigas under low salinity stress. Their research results revealed that when stimulated by low salt concentration, the cells of Crassostrea gigas were negatively affected and obvious tissue lesions appeared [10]. Li et al. demonstrated that the increase in salinity stress enhanced the apoptosis of S. esculenta to reduce the tissue damage caused by the increase in seawater salinity [11].
High-throughput sequencing technology has advanced quickly in past years. Using this technology can make the analysis of organisms more efficient and accurate [12,13]. And in previous studies, this technique has been used to analyze the biological processes of aquatic organisms. For example, Zhao et al. found that the dual stress of high temperature and copper can cause DNA damage in S. esculenta, and there will be a serious inflammatory response by transcriptome analysis [14]. Through transcriptome analysis, Liu et al. found that Crassostrea gigas participates in the immune function of the body by regulating the MAPK signaling pathway and PIK3-Akt signaling pathway in the face of Vibrio alginolyticus invasion [15]. Building on these studies, the present work explores the biological responses of S. esculenta to different salinity stresses using transcriptome sequencing.
Cephalopods are an important part of marine ecosystems and have important economic value for fisheries [16]. Among them, S. esculenta is a kind of squid with high economic and commercial value, mainly distributed in the East China Sea, South China Sea, Yellow Sea, and Bohai Sea coastal waters [17]. Large environmental fluctuations significantly increase mortality in S. esculenta, leading to substantial aquaculture losses, which will cause huge losses to the aquaculture industry. Therefore, this study selected S. esculenta larvae for experiments to explore the influences of different time and salinity stress on mollusks and enriched the biological theory of S. esculenta in the face of adversity.
In the research, we first analyzed the influences of different time and salinity stresses on the activities of oxidative stress-related enzymes and immune-related enzymes in S. esculenta. The biological processes of S. esculenta larvae under different salt stresses were explored by sequencing. The larvae of S. esculenta under different salinity stress were sampled, and RNA sequencing was performed, and the quality was controlled. Then, the identified DEGs were used for GO and KEGG enrichment analysis. The core genes in the significantly enriched gene set were combined with the DEGs in the corresponding KEGG pathway to construct the PPI. After that, we took the protein interaction number as the main reference factor to explore the key genes of S. esculenta, such as NFKBIA. Previous studies have shown that NFKBIA can reduce the stimulation of external stress on the species itself to a certain extent and can respond to stress through its own protective mechanism [18,19]. Finally, we used qRT-PCR to verify the quality of the sequencing results. In view of current environmental changes and the prospects for pond culture of S. esculenta, this study provides insights into the effects of salinity stress on larvae, offering a theoretical basis for large-scale aquaculture.
2. Materials and Methods
2.1. Acquisition and Processing of Experimental Samples
In the research, we collected adult S. esculenta (weight: 348.93 ± 11.23 g, mantle length: 13.79 ± 0.20 mm) from the sea area near Qingdao in mid-July. After short-distance transportation, it was temporarily cultured in a culture pond to adapt to the environment. The seawater temperature in the pond was 21 ± 1 °C, and the salinity was 30.6 ± 1 °C. Subsequently, eggs were harvested from the pool every day using an attachment net and placed in a perforated plastic basin. After the eggs were collected, the culture basin was transferred to a designated acclimation pond implementing continuous flow-through seawater exchange with supplemental aeration, maintaining physicochemical parameters (temperature: 21 ± 1 °C; salinity: 30 ± 0.5 ppt; pH: 8.1 ± 0.1; dissolved oxygen: 5.7 ± 0.2 mg/L) equivalent to maternal pond conditions. We injected a total of 100 L of seawater into six square culture barrels with a capacity of 120 L. The two groups were set as the low salinity stress group (salinity of 20 ppt) and high salinity stress group (salinity of 40 ppt), and the other groups did not make any changes. Approximately 100 S. esculenta larvae in each group were placed and sampled at 4 h and 24 h. Seven experimental groups were set up, which were the normal growth control group (C_0h, C_4h, and C_24h), the low salinity stress group (SAL20_4h and SAL20_24h), and the high salinity stress group (SAL40_4h and SAL40_24h). Nine larvae were randomly selected at each time point in each experimental group, and three random samples were mixed together to generate three biological replicates. All samples were placed in test tubes and immediately frozen in liquid nitrogen.
2.2. Determination of Enzyme Activity and Related Product Content
The activity of Acid Phosphatase (ACP), Alkaline Phosphatase (AKP), Glutathione S-Transferase (GST), Superoxide Dismutase (SOD), and the content of Malondialdehyde (MDA) were measured by corresponding kits (Nanjing Jiancheng Bioengineering Institute, Nanjing, China). All experimental determinations were performed according to the kit instructions, and each measurement was repeated three times to ensure accuracy.
2.3. Transcriptome Data Processing and Analysis
The TRIzol method was used to extract total RNA, followed by library preparation. Paired-end sequencing was performed on the Illumina TruSeq HiSeq 4000 platform (New England Biolabs, Ipswich, MA, USA). Raw reads underwent rigorous quality filtering: adapter-containing sequences were removed, reads exceeding 10% undetermined bases (N ratio) were discarded, and low-quality reads were eliminated (defined as those with >50% bases showing Qphred ≤ 20). The resulting clean reads were subjected to quality assessment through FastQC (v0.12.0), with Q20 and Q30 average scores calculated as key quality metrics. Reference genome alignment was executed using HISAT2 (v2.2.1) with default parameters. Differential expression analysis was performed using DESeq2 (v1.38.3) with a negative binomial distribution model. The analytical workflow included data import and construction of the DESeqDataSet (dds) object; Dispersion estimation through DESeq function execution; and Comparative expression analysis between experimental groups (low salinity vs. control and high salinity vs. control). DEGs were identified using a significance threshold of |Log2 Fold Change| ≥ 1 and p-Value ≤ 0.05 after multiple testing correction.
2.4. Analysis of DEGs
In the study, the expression of DEGs was displayed by using volcano plots, heatmaps, and Venn diagrams. The volcano plots show the distribution of gene expression. The points with significant differences are given different colors by using the multiplicity of differences between groups to show the significance of the differences. The log10 of fold change values was used on the x-axis, and the −log10 of p-values was plotted on the y-axis. The clustering heatmap shows the expression patterns of DEGs in different samples. Z-score was used to standardize the FPKM data of DEGs and selected for horizontal clustering. The number of DEGs at different time points was shown by a Venn diagram.
2.5. Functional Analysis of DEGs
The DAVID database (https://david.ncifcrf.gov/tools.jsp, accessed on 7 November 2024) was used to perform GO and KEGG enrichment analysis on DEGs, and DEGs were annotated into GO terms and KEGG signaling pathways. Then, all the annotated genes in SAL20_4h, SAL20_24h, SAL40_4h, and SAL40_24h were used for GSEA analysis (R version 4.2.2), and the genes in the GO function enrichment term and the signal pathway of KEGG enrichment analysis were used as gene sets for analysis.
2.6. Protein-Protein Interaction Networks Analysis
Build the PPI networks by using the STRING v11.5 online website. The core genes in the pathway gene set with higher enrichment scores in GSEA-KEGG analysis and DEGs in KEGG enrichment analysis were combined to construct the protein-protein interaction networks. A minimum interaction score of 0.15 was applied. According to the number of protein interactions involved in the gene as the main reference factor, the key genes after high and low salt stress at different time points were analyzed.
2.7. qRT-PCR Validation
The accuracy of the sequencing results of this study was verified by qRT-PCR. Our qRT-PCR validation selected DEGs with more protein interaction numbers in the gene sets. The verified DEGs and their sequences are shown in Table 1. According to the manufacturer’s instructions, the remaining RNA from the library was synthesized into cDNA using reverse transcriptase (Promega, Madison, WI, USA) (42 °C, 1 h; 70 °C, 10 min). The qPCR program and final reaction volume were determined according to the instructions for the use of ABI 7500 (Thermo Fisher Scientific, Waltham, MA, USA) with SYBR® Premix Ex Taq™ (Takara, Dalian, China), and β-actin was used as an internal reference. The expression of target genes was calculated using the 2−△△CT comparative Ct value method. Differential expression of target genes was expressed as a fold change relative to the internal reference gene.

Table 1.
List of primers used for quantitative RT-PCR validation.
2.8. Statistical Analysis
All experiments in this study were repeated at least three times. To ensure maximum randomization during sample processing, nine larval specimens were randomly pooled from a cohort of 100 individuals spanning various experimental groups. This strategic mixing approach enhances the representativeness of biological samples while maintaining experimental rigor. And when evaluating the differences between groups, p < 0.05 was considered statistically significant.
3. Results
3.1. Sequencing Results
The sequencing results of different samples of S. esculenta were analyzed. The average scores of both Q20 and Q30 were above 90%. This indicates that the sequencing results can be used for subsequent processing (Table 2).

Table 2.
RNA-Seq results.
3.2. Enzyme Activity and Peroxide Content
The results of enzyme activity experiments showed that the activities of ACP and AKP, two immune-related enzymes, decreased significantly in the face of high salinity and low salinity stress. With temporal progression, compared with 4 h, the activity of the two enzymes even showed an upward trend at 24 h. The activities of GST and SOD, two oxidative stress-related enzymes, showed significant differences at 4 h and 24 h compared with 0 h in the face of three different stresses. MDA as a product of peroxidation in the face of stress, with the extension of time, has a significant upward trend. Figure 1 shows the changes in enzyme activity and peroxide content under different stresses.
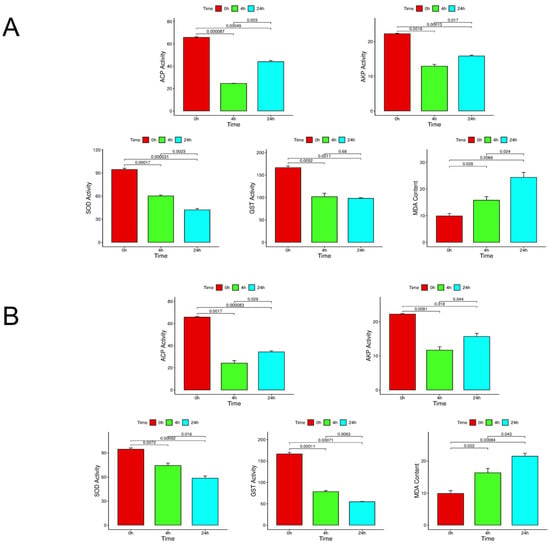
Figure 1.
The diagram shows the changes in enzyme activity and peroxide content under different stresses. (A): ACP, AKP, SOD, GST activity, and MDA content at different times under low salt stress. (B) Enzyme activity and peroxide content under high salt stress. Ensure three biological replicates, and p < 0.05 as a sign of significant difference.
3.3. Identification of DEGs
By comparing the samples of SAL20_4h, SAL20_24h, SAL40_4h, and SAL40_24h with the control group, 411, 709, 515, and 758 DEGs were identified with |log2 (fold change)| ≥ 1 and p-value ≤ 0.05 as thresholds (Figure 2). Subsequently, the DEG was analyzed by a Venn diagram (Figure 2E). The intersection of the Venn diagram produced 14 key genes, including SMP_049250, LOC114955324, KLF5, COL12A1, PML, SLIT2, CYP10, FOS, FMRFAR, FBXO4, NCL-1, COL14A1, APLNRB, and NOS1. It is worth noting that these 14 genes concurrently showed differential expression in four experimental groups, suggesting their potential critical functional roles in responding to temporal variations and varying salinity conditions.
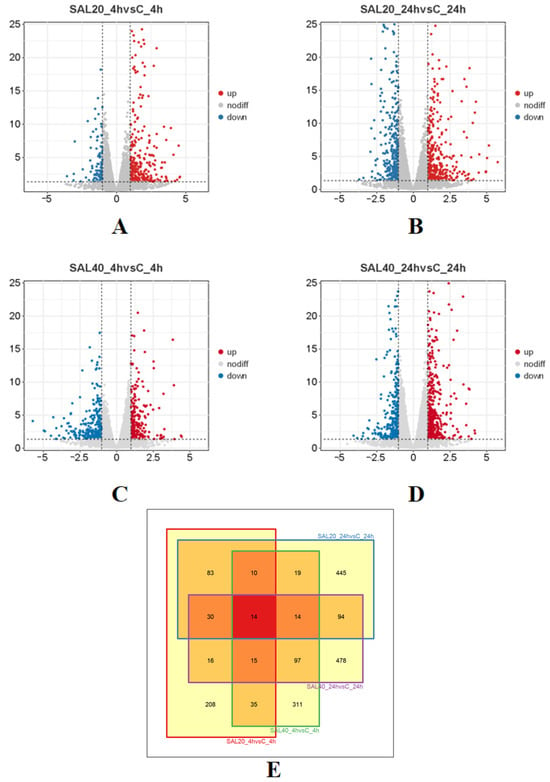
Figure 2.
Volcano diagram and Venn diagram of DEGs (|Log2FC| ≥ 1, p ≤ 0.05). (A) Gene expression between SAL20_4h samples. The up-regulated genes were expressed in orange, and the down-regulated genes were expressed in blue. Each point represents a gene. (B) Gene expression between SAL20_24h samples. (C) Gene expression between SAL40_4h samples. (D) Gene expression between SAL40_24h samples. (E) The number of DEGs in SAL20_4h, SAL20_24h, SAL40_4h, and SAL40_24h samples. Red indicates the number of co-expressed DEGs.
3.4. Clustering Heatmap Analysis
The intersection of DEGs at different times and different salinity stresses was analyzed by cluster heatmap (Figure 3). The findings indicated that there were basically the same expression patterns between the three groups of blank control groups at different times. Compared with the 4 h blank group, the 4 h experimental groups under different salinity stress showed significant differences. There was also a huge difference between the 24 h experimental group and the control group.
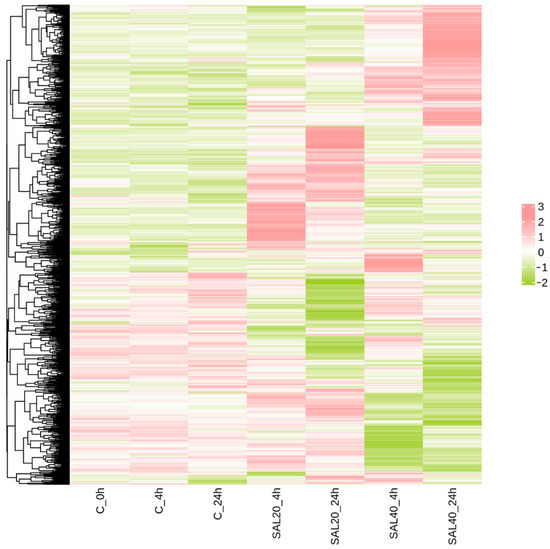
Figure 3.
Clustering heat map of DEGs. DEGs were differentially expressed in different experimental groups. Green to red indicates the relative expression from high to low. Color represents the result of Z-score processing of the FPKM values of all DEGs.
3.5. Functional Analysis of DEGs
The functions of DEGs under four different stress conditions were explored by GO enrichment analysis, and DEGs are enriched into three categories. Figure 4 shows the top 10 biological processes and the top 5 cellular components and molecular functions. Among them, a large number of terms are associated with DNA replication, binding, and regulation of RNA polymerase II transcription. After that, KEGG pathway enrichment was analyzed for DEGs across four experimental groups. Figure 5 shows the enrichment of DEGs in the Level-2 KEGG signaling pathway. Among them, in the signal transduction and immune system, a large number of DEGs were enriched in the four experimental groups. The enrichment of DEGs in the level-3 KEGG pathway under different time and salinity stresses was shown in the annex table (Supplementary Table S1).
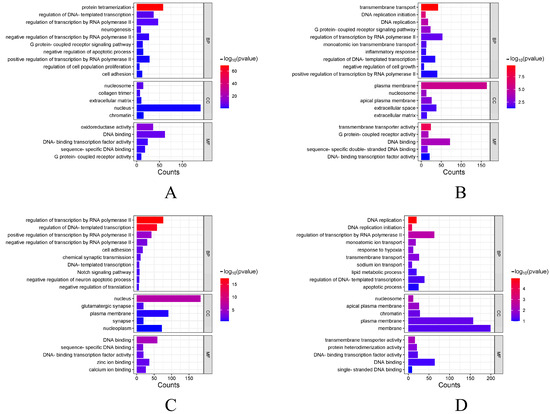
Figure 4.
GO enrichment analysis of DEGs. (A) GO term enriched under SAL20_4h stress. The vertical axis represents different terms, and the horizontal axis represents the number of genes. (B) GO term enriched under SAL20_24h stress. (C) GO term enriched under SAL40_4h stress. (D) GO term enriched under SAL40_24h stress. With a p-value < 0.05 as the selection criteria, and in line with the species we studied.
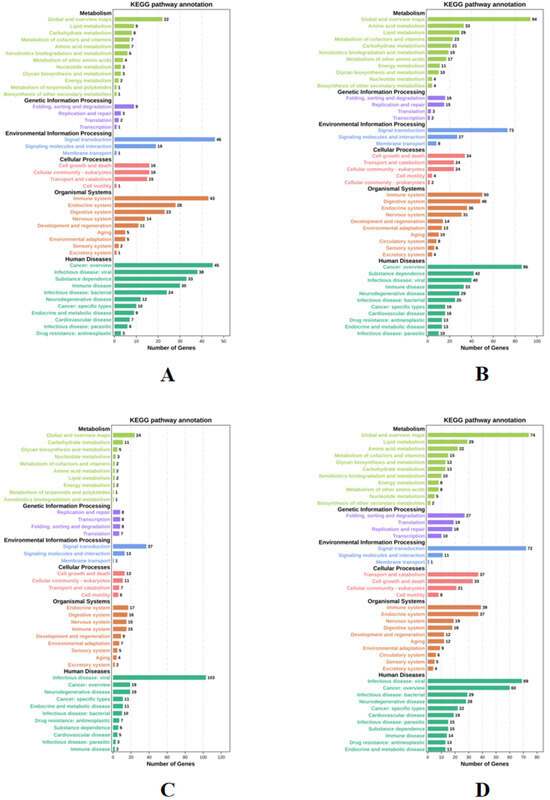
Figure 5.
Level-2 KEGG signaling pathways of DEGs. (A) KEGG signaling pathways were enriched with DEGs under SAL20_4h stress. (B) KEGG signaling pathways were enriched with DEGs under SAL20_24h stress. (C) KEGG signaling pathways are enriched using DEGs under SAL40_4h stress. (D) KEGG signaling pathways are enriched using DEGs under SAL40_24h stress. With a p-value < 0.05 as the selection criteria, and in line with the species we studied.
3.6. GSEA Analysis
GSEA-GO and GSEA-KEGG analyses were performed on all annotated genes in four different experimental groups. This comprehensive analysis enables us to determine the most significantly enriched gene sets at different time points and under different salinity stress conditions, providing valuable information for our in-depth understanding. Figure 6 shows that negative regulation of transcription by RNA polymerase II, sequence-specific DNA binding, and the MAPK signaling pathway are significantly enriched in SAL20_4h. DNA replication, DNA-binding transcription factor activity, chemokine signaling pathway, and cell cycle are significantly enriched at SAL20_24h. Cell adhesion, DNA-binding transcription factor activity, the chemokine signaling pathway, and the MAPK signaling pathway are significantly enriched in SAL40_4h. Finally, DNA replication, single-stranded DNA binding, the chemokine signaling pathway, and cell cycle are significantly enriched in SAL40_24h. The MAPK signaling pathway was significantly enriched in SAL20_4h and SAL40_4h, and the cell cycle was significantly enriched in SAL20_24h and SAL40_24h. More importantly, the chemokine signaling pathway is significantly enriched in SAL20_24h, SAL40_4h, and SAL20_24h. Although there is no significant enrichment in SAL20_4h, its core genes still contribute greatly to its gene set, so it has great biological significance. Therefore, the core genes of the chemokine signaling pathway in the GSEA analysis of the four experimental groups are compared, and it is found that NFKBIA appeared as a core gene in the four experimental groups. Therefore, we speculate that NFKBIA plays a more critical role under different time and salinity stress.
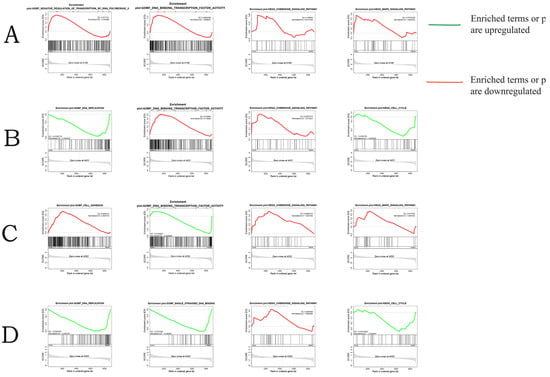
Figure 6.
GSEA analysis results. (A) Significantly enriched gene sets under SAL20_4h stress. (B) Significantly enriched gene sets under SAL20_24h stress. (C) Gene sets significantly enriched under SAL40_4h stress. (D) Gene sets significantly enriched under SAL40_24h stress.
3.7. Analysis of PPI
In the chemokine signaling pathway, GSK3B, MAP2K1, and PI3K family genes, such as PIK3CD, PIK3CA, and PIK3R1, have higher protein interactions. More importantly, NFKBIA is the core gene in the gene set and also has a high number of protein interactions. Therefore, we speculate that this gene may have a more important function in the face of different time and salinity stresses. In the MAPK signaling pathway, JUN, MAP2K1, and DUSP family genes, such as DUSP1, DUSP10, and DUSP7, have higher protein interaction numbers. In the cell cycle signaling pathway, CDK1, CHEK1, and CDC family genes, such as CDC6, CDC16, CDC25B, and CDC45, have higher protein interactions. Among them, MAP2K1 appears as a core gene in both pathways and may also play a key function in the face of salinity stress (Figure 7).
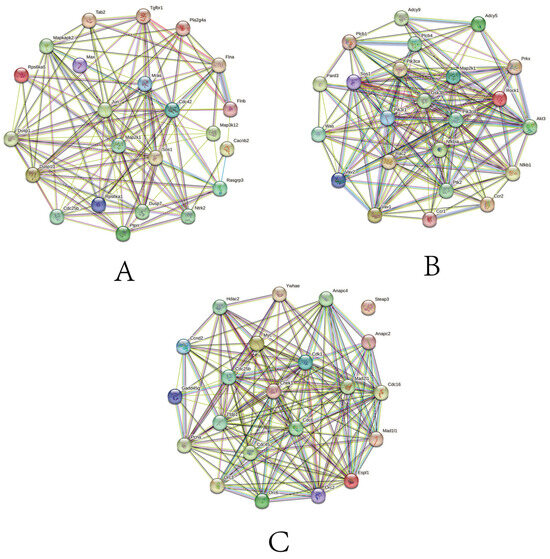
Figure 7.
PPI network of DEGs (a minimum interaction score of 0.15 was applied). Genes are represented by circles. (A) PPI network composed of core genes in chemokine signaling pathway gene set. (B) PPI network composed of core genes and DEGs in MAPK signaling pathway gene set. (C) PPI network composed of core genes and DEGs in cell cycle gene set.
3.8. qRT-PCR Validation of DEGs
The quantitative verification results proved the accuracy of the sequencing results. The fold changes under different experimental conditions were consistent, indicating that the change trend of DEGs was consistent (Figure 8).
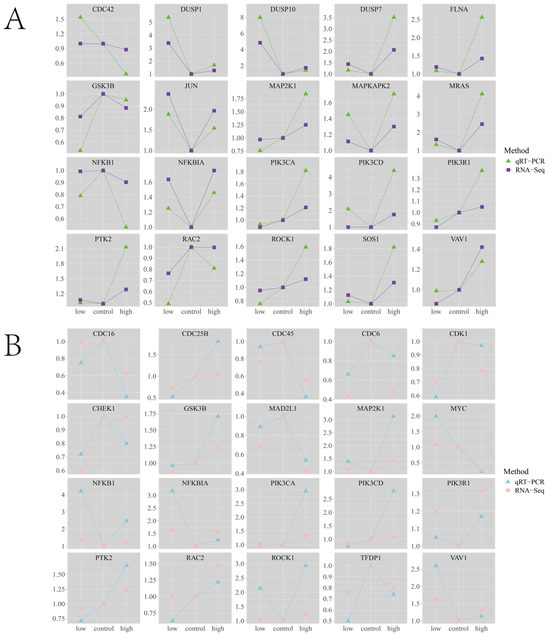
Figure 8.
qRT-PCR validation of core gene. (A) The core gene with the highest number of protein interactions in chemokine signaling pathway gene set and MAPK signaling pathway gene set. The abscissa represents the way of stress, and the ordinate represents the Fold change of 4h stress. (B) The core gene with the highest number of protein interactions in chemokine signaling pathway gene set and cell cycle gene set. The abscissa represents the way of stress, and the ordinate represents the Fold change of 24 h stress.
4. Discussion
4.1. Expression and Functional Enrichment Analysis of DEGs
In this research, four experimental groups of SAL20_4h, SAL20_24h, SAL40_4h, and SAL40_24h were set up to form a union of 1861 DEGs. And with the extension of time under different salinity stress, the number of DEGs also increased. The clustering heat map selects the filtered DEGs for drawing. Studies have shown that under different salinity stress, at 4 h and 24 h, a considerable number of DEGs have different expression levels. After that, 411, 709, 515, and 758 DEGs identified by SAL20_4h, SAL20_24h, SAL40_4h, and SAL40_24h were respectively subjected to GO and KEGG functional enrichment analysis. GO enrichment analysis showed that most of the terms were related to DNA replication, binding, and regulation of RNA polymerase II transcription. The significant enrichment of ‘ DNA replication ‘ as a basis for cell proliferation and genomic stability indicates that larvae enhance the replication process to reduce the harm caused by environmental stress under different salinity stimuli [20,21]. KEGG enrichment analysis showed that most DEGs were enriched in two Level-2 KEGG signaling pathways of signal transduction and the immune system in four different experimental groups. In the attached table, the three-level pathways of KEGG enrichment analysis are displayed. Among them, the MAPK signaling pathway is enriched in SAL20_4h, SAL20_24h, SAL40_4h, and SAL40_24h, and this pathway was important in the immune response of mollusks [22,23]. And in the three experimental groups, apoptosis was enriched, which means that the organism has immune-related problems [24]. In the SAL20_24h experimental group, this pathway was not enriched. It may be that the S. esculenta adapts to the stress of low salinity through its own regulation. The enrichment analysis of GO and KEGG shows that both high and low salinity seawater are likely to affect the growth and development of S. esculenta larvae. These results can provide a reference for the artificial breeding of S. esculenta to cope with different environmental changes.
4.2. Discussion on Enzyme Activity and Peroxide Content
Due to the lack of specific immune cells and related antibodies in mollusks, their humoral immunity primarily relies on non-specific enzymes or factors in the serum [25,26]. ACP enzyme and AKP enzyme are related to immunity and have important functions in immune response [27]. GST and SOD are important antioxidant enzymes that protect the body from oxidative stress [28,29]. MDA is an important product of peroxidation and is a key indicator of the level of oxidative stress in the body [30]. ACP and AKP were immune-related enzymes, and their enzyme activities showed a significant downward trend at 4 h. Therefore, we speculate that it may be because the body‘s immune system is difficult to adapt to this large-scale stress response in a short time. With the prolongation of time, the activities of ACP and AKP increased significantly at 24 h, indicating that with the prolongation of time, the body may regulate the expression of immune-related genes and other ways to make the body adapt to these three different stresses. GST and SOD as antioxidant enzymes, activity compared with 0 h, in 4 h and 24 h showed significant differences; the enzyme activity with the increase in time has been showing a significant downward trend, indicating that the three kinds of stress will lead to the body of S. esculenta antioxidant enzyme inhibition, thus weakening the S. esculenta larvae’s resistance to stress ability, resulting in S. esculenta antioxidant capacity being inhibited and significantly decreased. The content of MDA can measure the degree of oxidative damage to the body, so its accumulation is positively correlated with the level of oxidative stress. In our study, under three different stresses, the content of MDA showed a significant upward trend with temporal progression and reached the maximum at 24 h. It can be speculated that these stresses caused serious oxidative damage to the body of S. esculenta. The antioxidant defense system has also been damaged, and it is likely to have aggravated cell damage. These findings collectively highlight the critical role of immunity and oxidative balance in the stress response of mollusks, underscoring the intimate crosstalk between redox homeostasis and immune defense.
4.3. Chemokine Signaling Pathway
In the subsequent GSEA-GO analysis of all annotated genes, a large number of GO terms related to DNA replication, binding, and regulation of RNA polymerase II transcription were significantly enriched as gene sets under salinity stress at different times. In GSEA-KEGG analysis, the gene set of chemokine signaling pathway was significantly enriched in the three experimental groups of SAL20_24h, SAL40_4h, and SAL40_24h. Although not significantly enriched in SAL20_4h, the core genes of the gene set still have great biological significance. Therefore, in order to screen out more critical genes, PPI was constructed by constructing all the core genes in the GSEA analysis of the four experimental groups. Among them, GSK3B, MAP2K1, and PI3K family genes, such as PIK3CD, PIK3CA, and PIK3R1, have higher protein interaction numbers. Among them, the PIK3CD is involved in the immune response process and has an important function [31]. It is worth noting that NFKBIA also has a high number of protein interactions, and the chemokine signaling pathway in the four experimental groups is used as the core gene. NFKBIA-encoded IκBα protein is an important regulator of the NF-κB signaling pathway and has a significant function in coordinating various immune and inflammatory responses [32]. In previous studies, NFKBIA is directly involved in the regulation of the NF-κB signaling pathway and is a significant factor in maintaining the balance of NF-κB activity. NF-κB can enhance the antioxidant capacity of cells by regulating the expression of antioxidant genes [33,34]. In our experiment, by quantitatively analyzing the FPKM value of its expression level, it can be concluded that the gene showed an upward trend of expression under high and low salt stress at different times. This observed increase suggests a potential adaptive response where elevated NFKBIA/IκBα expression may contribute to fine-tuning NF-κB activity, potentially leading to enhanced cellular antioxidant defenses during salinity stress. Therefore, we speculate that the gene will increase its expression level in the face of salinity stress at different times so that the body‘s antioxidant defense ability can be improved, thereby helping the body to resist the damage caused by oxidation. In the GSEA-KEGG analysis of the four experimental groups, NFKBIA appeared as a core gene in the chemokine signaling pathway gene set; the consistent centrality of NFKBIA within the chemokine signaling pathway core gene sets across diverse salinity/time conditions underscores its likely significant role in S. esculenta’s molecular adaptation to osmotic challenge. Therefore, we infer that the upregulation of NFKBIA under salinity stress suggests its role in fine-tuning NF-κB activity to reinforce antioxidant defenses and modify immunophysiological adaptation in S. esculenta. The persistent enrichment of the chemokine signaling pathway underscores its fundamental role in orchestrating immune responses to different salinity stresses. Central genes such as PIK3CD and NFKBIA are pivotal in mediating inflammatory and antioxidant responses. Specifically, NFKBIA, through its regulation of NF-κB, modulates the expression of cytokines and antioxidants, thereby bridging innate immunity and oxidative stress management. This pathway is an important immunoregulatory pathway for immunophysiological adaptation of S. esculenta, facilitating survival under the condition of salinity fluctuation at different times through coordinated immune signaling and cellular defense mechanisms.
4.4. MAPK Signaling Pathway
The MAPK pathway regulates diverse disease-related processes, including oxidative stress, inflammatory response, cell proliferation, and apoptosis [35]. In the SAL20_4h and SAL40_4h experimental groups, the MAPK signaling pathway was significantly enriched as a gene set. In order to screen out more critical genes, we constructed a PPI network between all core genes in the GSEA analysis of SAL20_4h and SAL40_4h and all DEGs in the KEGG enrichment analysis. Among them, JUN, MAP2K1, and DUSP family genes, such as DUSP1, DUSP10, and DUSP7, have higher protein interaction numbers. Among them, DUSP1 functions as a phosphatase responsible for dephosphorylating target enzymes, having the regulatory function in multiple immune signaling cascades [36,37]. JUN can reduce the degree of tissue oxidative damage by inhibiting the production of ROS [38]. As a pivotal regulatory gene in immune response mechanisms, JUN coordinates multiple signaling pathways within the immune regulatory network, demonstrating critical functions across diverse biological processes, including inflammatory regulation, cellular proliferation/differentiation of immune components, and transduction of immunological signals [39,40]. MAP2K1 is a member of the bispecific protein kinase family. As a MAP kinase, it is expressed in different tissues. The protein kinase activates and regulates the enzyme activity of MAP kinase through extracellular and intracellular signaling pathways, thereby participating in a variety of physiological processes, including differentiation, proliferation, transcriptional regulation, and development [41]. The MEK1 protein encoded by MAP2K1 has a significant function in the Ras/MAPK pathway that controls many cellular and developmental processes [42,43]. This induction pattern, coupled with redox homeostasis and immunomodulation, implicates these hubs in orchestrating rapid osmoregulatory adaptation through antioxidant defense and immune pathway fine-tuning. Importantly, MAP2K1 appears as a core gene in both pathways and has a high number of protein interactions. We infer that the gene plays an important role in the regulation of cell-related processes in the face of salt stress, ensuring that the body can regulate cellular processes to help it adapt to the environment. In our research, the expression levels of the above genes were up-regulated in SAL20_4h and SAL40_4h. We speculated that the above genes may have an important function in the body‘s immunity and anti-oxidation in the face of short-term stress of different salinities. The enrichment of the MAPK pathway and the prominence of hub genes like JUN, DUSP1, and MAP2K1 highlight a rapid immune-transcriptional reprogramming in response to acute salinity stress. These genes are integral to regulating inflammation, oxidative stress, and immune cell responses—processes essential for maintaining immunometabolic homeostasis.
4.5. Cell Cycle Pathway
In SAL20_24h and SAL40_24h, the gene set of the cell cycle was significantly enriched. In order to screen out more critical genes, the same analysis method as above was used. Among them, CDK1, CHEK1, and CDC family genes, such as CDC6, CDC16, CDC25b, and CDC45, had higher protein interaction numbers. Among them, CDK1 has important functions in the coupling of cell proliferation and protein synthesis. CHEK1, as an important regulator, affects cell cycle arrest in the G2 phase, while DNA damage regulates cell cycle and apoptosis by acting on CDK1 and Chek1 [44,45,46]. CDC6 and CDC45 have the important function in the immune process of adjusting their own expression levels [47]. The coordinated upregulation and network prominence of these core cell cycle regulators suggest their involvement in modulating critical cellular processes during prolonged salinity stress in S. esculenta. This response represents an adaptive mechanism to manage cell proliferation, DNA replication, and genome stability under sustained osmotic challenge. The significant involvement of cell cycle regulators such as CDK1, CHEK1, and CDC genes under prolonged stress illustrates a critical layer of immune-cell proliferation and genomic integrity maintenance. As immune responses often require clonal expansion and rapid cell turnover, these genes support immunocompetence by ensuring orderly progression of the cell cycle under stress. Their adaptive expression underscores a mechanism by which S. esculenta preserves immune functionality and cellular viability during sustained environmental challenge. Their upregulation suggests a stress-induced reorganization of cell cycle activities that may support immune cell turnover and tissue repair under long-term different salinity stress.
4.6. Review of Key Gene Sets and Genes Under Different Salinity Stress
In our research, we found that the chemokine signaling pathway gene set was activated in all four experimental groups and may have more important biological significance under different time and salinity stress. Under the four stresses, NFKBIA, as the core gene of the gene set, may be used as a candidate factor, potentially mitigating oxidative stress and modulating immune function. Complementary physiological data demonstrated that both high- and low-salinity stress significantly enhanced immune competence and antioxidant capacity in S. esculenta, consistent with the functional predictions derived from the core genes and enrichment analyses. The identified hub genes, characterized by their central positions, are strongly implicated in mediating S. esculenta’s adaptation to environmental stressors. In the earlier research, the function of key genes such as NFKBIA has not been widely studied in S. esculenta.
5. Conclusions
In our research, we explored the molecular response of S. esculenta under different time and salinity stresses. The results of GO and KEGG enrichment analysis identified a large number of GO terms and signaling pathways related to immunity and signal transduction. Combined with physiological indicators, the response mechanism of S. esculenta was further supplemented and verified. Complementary physiological assays validated the activation of stress-responsive systems, aligning with molecular profiling data. More importantly, the chemokine signaling pathway gene set was significantly enriched in SAL40_4h, SAL20_24h, and SAL40_24h. The chemokine signaling pathway exhibited consistent enrichment across SAL40_4h, SAL20_24h, and SAL40_24h, suggesting its fundamental role in osmotic adaptation. We speculate that the gene set may have important biological significance when the S. esculenta faces salinity stress at different times. We constructed a mechanism map using the core genes with a high number of protein interactions in the above gene sets to express our speculation on the regulatory mechanism of these genes in the face of salinity stress (Figure 9). NFKBIAs upregulation positions it as a key candidate for mitigating oxidative damage during salinity adaptation. NFKBIA is the core gene in the gene set of the chemokine signaling pathway under different time and salinity stresses, indicating that this gene may protect the body from oxidative damage when S. esculenta faces salinity stress, but its specific mechanism of action needs further study. By linking transcriptomics with physiological verification, we propose a scientific hypothesis to improve the efficiency of aquaculture productivity and breeding of excellent varieties in the context of global environmental changes. Our results provide support for the study of the stress response mechanism of S. esculenta and contribute to the selection of excellent varieties of S. esculenta and further large-scale breeding.
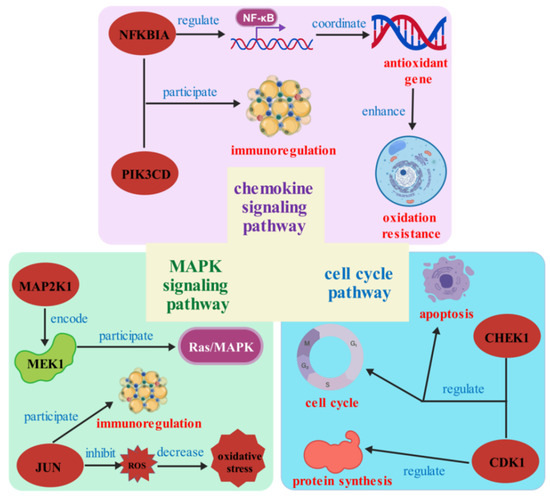
Figure 9.
Regulation mechanism of core genes with more protein interactions in the face of salinity stress.
Supplementary Materials
The following supporting information can be downloaded at: https://www.mdpi.com/article/10.3390/biology14101338/s1, Table S1: Level-3 KEGG signaling pathways of DEGs.
Author Contributions
Conceptualization, Z.L., X.X. and J.Y.; methodology, Z.L., X.X., C.C., W.W., X.L., J.Y., Y.Z., X.Z., J.Z. and X.T.; writing—original draft, Y.Z. and X.Z.; writing—review and editing, X.X. and Z.L.; supervision, X.X. and Z.L.; project administration, Z.L., X.X. and J.Y.; funding acquisition, Z.L. and J.Y. All authors have read and agreed to the published version of the manuscript.
Funding
This research was supported by the earmarked fund for CARS-49 and the Natural Science Foundation of Shandong Province (No. ZR2019BC052).
Institutional Review Board Statement
This research was conducted in accordance with the protocols of the Institutional Animal Care and Use Committee of Ludong University (protocol number LDU-IRB20210308NXY) and the China Government Principles for the Utilization and Care of Invertebrate Animals Used in Testing, Research, and Training (State Science and Technology Commission of the People’s Republic of China for No. 2, 31 October 1988).
Informed Consent Statement
Not applicable.
Data Availability Statement
Data will be made available on request.
Conflicts of Interest
The authors declare no conflicts of interest.
Abbreviations
The following abbreviations are used in this manuscript:
| S. esculenta | Sepia esculenta |
| GO | Gene Ontology |
| KEGG | Kyoto Encyclopedia of Genes and Genomes |
| DEGs | Differentially expressed genes |
| qRT-PCR | quantitative Reverse Transcription Polymerase Chain Reaction |
| PPI | Protein-Protein Interaction |
| GSEA | Gene Set Enrichment Analysis |
References
- Aura, C.M.; Saitoh, S.-I.; Liu, Y.; Hirawake, T.; Baba, K.; Yoshida, T. Implications of Marine Environment Change on Japanese Scallop (Mizuhopecten yessoensis) Aquaculture Suitability: A Comparative Study in Funka and Mutsu Bays, Japan. Aquacult. Res. 2014, 47, 2164–2182. [Google Scholar] [CrossRef]
- Zhou, C.; Wong, K.; Tsou, J.Y.; Zhang, Y. Detection and Statistics of Offshore Aquaculture Rafts in Coastal Waters. J. Mar. Sci. Eng. 2022, 10, 781. [Google Scholar] [CrossRef]
- Sinha, A.K.; AbdElgawad, H.; Zinta, G.; Dasan, A.F.; Rasoloniriana, R.; Asard, H.; Blust, R.; Boeck, G.D. Nutritional Status as the Key Modulator of Antioxidant Responses Induced by High Environmental Ammonia and Salinity Stress in European Sea Bass (Dicentrarchus labrax). PLoS ONE 2015, 10, e0135091. [Google Scholar] [CrossRef]
- Evans, T.G.; Kültz, D. The Cellular Stress Response in Fish Exposed to Salinity Fluctuations. J. Exp. Zool. A 2020, 333, 421–435. [Google Scholar] [CrossRef] [PubMed]
- Lu, M.; Su, M.; Liu, N.; Zhang, J. Effects of Environmental Salinity on the Immune Response of the Coastal Fish Scatophagus argus during Bacterial Infection. Fish Shellfish Immunol. 2022, 124, 401–410. [Google Scholar] [CrossRef]
- Gonzalez, R.J. The Physiology of Hyper-Salinity Tolerance in Teleost Fish: A Review. J. Comp. Physiol. B 2011, 182, 321–329. [Google Scholar] [CrossRef]
- Hossain, M.A.; Aktar, S.; Qin, J.G. Salinity Stress Response in Estuarine Fishes from the Murray Estuary and Coorong, South Australia. Fish Physiol. Biochem. 2016, 42, 1571–1580. [Google Scholar] [CrossRef]
- Röthig, T.; Trevathan-Tackett, S.M.; Voolstra, C.R.; Ross, C.; Chaffron, S.; Durack, P.J.; Warmuth, L.M.; Sweet, M. Human-Induced Salinity Changes Impact Marine Organisms and Ecosystems. Glob. Change Biol. 2023, 29, 4731–4749. [Google Scholar] [CrossRef] [PubMed]
- Maynard, A.; Bible, J.M.; Pespeni, M.H.; Sanford, E.; Evans, T.G. Transcriptomic Responses to Extreme Low Salinity among Locally Adapted Populations of Olympia Oyster (Ostrea lurida). Mol. Ecol. 2018, 27, 4225–4240. [Google Scholar] [CrossRef] [PubMed]
- Knowles, G.; Handlinger, J.; Jones, B.; Moltschaniwskyj, N. Hemolymph Chemistry and Histopathological Changes in Pacific Oysters (Crassostrea gigas) in Response to Low Salinity Stress. J. Invertebr. Pathol. 2014, 121, 78–84. [Google Scholar] [CrossRef]
- Li, Z.; Bao, X.; Liu, X.; Wang, Y.; Zhu, X.; Zhang, Y.; Wang, Z.; Maslennikov, S.; Whiteside, M.; Wang, W.; et al. Transcriptome Analysis Provides Preliminary Insights into the Response of Sepia esculenta to High Salinity Stress. Agric. Commun. 2024, 2, 100064. [Google Scholar] [CrossRef]
- Qian, X.; Ba, Y.; Zhuang, Q.; Zhong, G. RNA-Seq Technology and Its Application in Fish Transcriptomics. OMICS J. Integr. Biol. 2014, 18, 98–110. [Google Scholar] [CrossRef]
- Bao, X.; Wang, W.; Chen, X.; Feng, Y.; Xu, X.; Sun, G.; Li, B.; Liu, X.; Li, Z.; Yang, J. Exploration of Immune Response Mechanisms in Cadmium and Copper Co-Exposed Juvenile Golden Cuttlefish (Sepia esculenta) Based on Transcriptome Profiling. Front. Immunol. 2022, 13, 963931. [Google Scholar] [CrossRef]
- Zhao, Y.; Chang, D.; Zheng, Y.; Zhang, Y.; Wang, Y.; Bao, X.; Sun, G.; Feng, Y.; Li, Z.; Liu, X.; et al. Comparative Transcriptome Analysis Reveals Differences in Immune Responses to Copper Ions in Sepia esculenta under High-Temperature Conditions. BMC Genom. 2025, 26, 262. [Google Scholar] [CrossRef]
- Liu, X.; Wang, W.; Zhao, H.; Wang, Y.; Jiang, L.; Zhang, E.; Feng, Y.; Wang, X.; Qu, J.; Yang, J.; et al. Transcriptome Profiling of Triploid Crassostrea gigas Gills Indicates the Host Immune Mechanism against Bacterial Infection. Comp. Biochem. Physiol. Part D Genom. Proteom. 2025, 54, 101392. [Google Scholar] [CrossRef] [PubMed]
- Guerreiro, M.F.; Borges, F.O.; Santos, C.P.; Rosa, R. Future Distribution Patterns of Nine Cuttlefish Species under Climate Change. Mar. Biol. 2023, 170, 159. [Google Scholar] [CrossRef]
- Guo, H.; Zhang, D.; Wang, L.; Li, W.; He, P.; Näslund, J.; Zhang, X. Sperm Competition in Golden Cuttlefish Sepia esculenta: The Impact of Mating Order and Male Size. Aquaculture 2021, 530, 735929. [Google Scholar] [CrossRef]
- Xu, G.; Pan, Y.; Gu, W.; Huang, T.; Liu, E.; Wang, G. Evaluation of the Acute Toxic Effects of Ammonia on Juvenile Ussuri Cisco (Coregonus Ussuriensis) Based on Histopathology, Antioxidant Enzyme Activity, Immune Response and the Integrated Biomarker Response. Mar. Pollut. Bull. 2024, 209, 117215. [Google Scholar] [CrossRef] [PubMed]
- Xu, A.; Han, F.; Zhang, Y.; Chen, S.; Bian, L.; Gao, T. Transcriptomic Profiling Reveals the Immune Response Mechanism of the Thamnaconus Modestus Induced by the Poly (I:C) and LPS. Gene 2024, 897, 148065. [Google Scholar] [CrossRef]
- Ubhi, T.; Brown, G.W. Exploiting DNA Replication Stress for Cancer Treatment. Cancer Res. 2019, 79, 1730–1739. [Google Scholar] [CrossRef]
- Ekundayo, B.; Bleichert, F. Origins of DNA Replication. PLOS Genet. 2019, 15, e1008320. [Google Scholar] [CrossRef]
- Dong, X.; Kim, Y.-S.; Kim, E.-K.; Shin, W.-B.; Park, J.-S.; Kim, S.-J.; Go, E.-A.; Park, P.-J.; Kwon, S.-C. Scallop Extracts Inhibited LPS-Induced Inflammation by Suppressing MAPK and NF-κB Activation in RAW264.7 Macrophages. Adv. Exp. Med. Biol. 2019, 1155, 1069–1081. [Google Scholar] [CrossRef]
- Portillo-López, A.; Gould, M.C.; Stephano, J.L. MAPK Is Involved in Metaphase I Arrest in Oyster and Mussel Oocytes. Biol. Cell 2003, 95, 275–282. [Google Scholar] [CrossRef] [PubMed]
- Wang, L.; Song, X.; Song, L. The Oyster Immunity. Dev. Comp. Immunol. 2018, 80, 99–118. [Google Scholar] [CrossRef] [PubMed]
- Yang, W.; Tran, N.T.; Zhu, C.-H.; Yao, D.-F.; Aweya, J.J.; Gong, Y.; Ma, H.-Y.; Zhang, Y.-L.; Li, G.-L.; Li, S.-K. Immune Priming in Shellfish: A Review and an Updating Mechanistic Insight Focused on Cellular and Humoral Responses. Aquaculture 2021, 530, 735831. [Google Scholar] [CrossRef]
- Muta, T.; Iwanaga, S. The Role of Hemolymph Coagulation in Innate Immunity. Curr. Opin. Immunol. 1996, 8, 41–47. [Google Scholar] [CrossRef] [PubMed]
- Kong, X.; Wang, S.; Jiang, H.; Nie, G.; Li, X. Responses of Acid/Alkaline Phosphatase, Lysozyme, and Catalase Activities and Lipid Peroxidation to Mercury Exposure during the Embryonic Development of Goldfish Carassius auratus. Aquat. Toxicol. 2012, 120–121, 119–125. [Google Scholar] [CrossRef]
- Kim, J.-H.; Kim, S.K.; Hur, Y.B. Toxic Effects of Waterborne Nitrite Exposure on Antioxidant Responses, Acetylcholinesterase Inhibition, and Immune Responses in Olive Flounders, Paralichthys olivaceus, Reared in Bio-Floc and Seawater. Fish Shellfish Immunol. 2020, 97, 581–586. [Google Scholar] [CrossRef]
- White, C.C.; Viernes, H.; Krejsa, C.M.; Botta, D.; Kavanagh, T.J. Fluorescence-Based Microtiter Plate Assay for Glutamate-Cysteine Ligase Activity. Anal. Biochem. 2003, 318, 175–180. [Google Scholar] [CrossRef]
- Wu, H.; Kong, Y.; Zhao, W.; Wang, F. Measurement of Cellular MDA Content through MTBE-Extraction Based TBA Assay by Eliminating Cellular Interferences. J. Pharm. Biomed. Anal. 2024, 248, 116332. [Google Scholar] [CrossRef]
- Li, Z.; Liu, X.; Liu, J.; Zhang, K.; Yu, H.; He, Y.; Wang, X.; Qi, J.; Wang, Z.; Zhang, Q. Transcriptome Profiling Based on Protein–Protein Interaction Networks Provides a Core Set of Genes for Understanding Blood Immune Response Mechanisms against Edwardsiella Tarda Infection in Japanese Flounder (Paralichthys olivaceus). Dev. Comp. Immunol. 2018, 78, 100–113. [Google Scholar] [CrossRef]
- Li, Q.; Verma, I.M. NF-kappaB Regulation in the Immune System. Nat. Rev. Immunol. 2002, 2, 725–734. [Google Scholar] [CrossRef]
- Paciolla, M.; Boni, R.; Fusco, F.; Pescatore, A.; Poeta, L.; Ursini, M.V.; Lioi, M.B.; Miano, M.G. Nuclear Factor-Kappa-B-Inhibitor Alpha (NFKBIA) Is a Developmental Marker of NF-κB/P65 Activation during in Vitro Oocyte Maturation and Early Embryogenesis. Hum. Reprod. 2011, 26, 1191–1201. [Google Scholar] [CrossRef]
- Qin, J.; Yang, J.; Li, J.; Zhao, D.; An, J.; Zhai, Z.; Wang, H.; Li, J.; Dou, M.; Du, R. Role of NF-κB Signaling Pathway in H2O2-Induced Oxidative Stress of hiPSCs. Vitr. Cell. Dev. Biol. Anim. 2024, 60, 1021–1033. [Google Scholar] [CrossRef]
- Fang, J.Y.; Richardson, B.C. The MAPK Signalling Pathways and Colorectal Cancer. Lancet Oncol. 2005, 6, 322–327. [Google Scholar] [CrossRef] [PubMed]
- Li, S.; Hao, G.; Li, J.; Peng, W.; Geng, X.; Sun, J. Comparative Analysis of Dual Specificity Protein Phosphatase Genes 1, 2 and 5 in Response to Immune Challenges in Japanese Flounder Paralichthys olivaceus. Fish Shellfish Immunol. 2017, 68, 368–376. [Google Scholar] [CrossRef] [PubMed]
- Sun, Y.; Chu, Q.; Zhao, X.; Zhou, Z.; Bi, D.; Xu, T. microRNA-375 Modulates the NF-κB Pathway in Miiuy Croaker by Targeting DUSP1 Gene. Dev. Comp. Immunol. 2018, 86, 196–202. [Google Scholar] [CrossRef]
- Davis, J.E.; Gabler, N.K.; Walker-Daniels, J.; Spurlock, M.E. The C-Jun N-Terminal Kinase Mediates the Induction of Oxidative Stress and Insulin Resistance by Palmitate and Toll-like Receptor 2 and 4 Ligands in 3T3-L1 Adipocytes. Horm. Metab. Res. 2009, 41, 523–530. [Google Scholar] [CrossRef]
- Brenner, D.A.; Seki, E.; Taura, K.; Kisseleva, T.; Deminicis, S.; Iwaisako, K.; Inokuchi, S.; Schnabl, B.; Oesterreicher, C.H.; Paik, Y.H.; et al. Non-Alcoholic Steatohepatitis-Induced Fibrosis: Toll-like Receptors, Reactive Oxygen Species and Jun N-Terminal Kinase. Hepatol. Res. 2011, 41, 683–686. [Google Scholar] [CrossRef]
- Karin, M.; Liu, Z.G.; Zandi, E. AP-1 Function and Regulation. Curr. Opin. Cell Biol. 1997, 9, 240–246. [Google Scholar] [CrossRef] [PubMed]
- Couto, J.A.; Huang, A.Y.; Konczyk, D.J.; Goss, J.A.; Fishman, S.J.; Mulliken, J.B.; Warman, M.L.; Greene, A.K. Somatic MAP2K1 Mutations Are Associated with Extracranial Arteriovenous Malformation. Am. J. Hum. Genet. 2017, 100, 546–554. [Google Scholar] [CrossRef]
- Wortzel, I.; Seger, R. The ERK Cascade: Distinct Functions within Various Subcellular Organelles. Genes Cancer 2011, 2, 195–209. [Google Scholar] [CrossRef]
- Caunt, C.J.; Sale, M.J.; Smith, P.D.; Cook, S.J. MEK1 and MEK2 Inhibitors and Cancer Therapy: The Long and Winding Road. Nat. Rev. Cancer 2015, 15, 577–592. [Google Scholar] [CrossRef] [PubMed]
- Santamaría, D.; Barrière, C.; Cerqueira, A.; Hunt, S.; Tardy, C.; Newton, K.; Cáceres, J.F.; Dubus, P.; Malumbres, M.; Barbacid, M. Cdk1 Is Sufficient to Drive the Mammalian Cell Cycle. Nature 2007, 448, 811–815. [Google Scholar] [CrossRef] [PubMed]
- Bartek, J.; Lukas, J. Chk1 and Chk2 Kinases in Checkpoint Control and Cancer. Cancer Cell 2003, 3, 421–429. [Google Scholar] [CrossRef]
- Zhao, C.; Chen, L.; Jin, Z.; Liu, H.; Ma, C.; Zhou, H.; Xu, L.; Zhou, S.; Shi, Y.; Li, W.; et al. Knockdown of MRPL35 Promotes Cell Apoptosis and Inhibits Cell Proliferation in Non-Small-Cell Lung Cancer. BMC Pulm. Med. 2023, 23, 507. [Google Scholar] [CrossRef]
- Ke, Y.; Guo, W.; Huang, S.; Li, Y.; Guo, Y.; Liu, X.; Jin, Y.; Ma, H. RYBP Inhibits Esophageal Squamous Cell Carcinoma Proliferation through Downregulating CDC6 and CDC45 in G1-S Phase Transition Process. Life Sci. 2020, 250, 117578. [Google Scholar] [CrossRef] [PubMed]
Disclaimer/Publisher’s Note: The statements, opinions and data contained in all publications are solely those of the individual author(s) and contributor(s) and not of MDPI and/or the editor(s). MDPI and/or the editor(s) disclaim responsibility for any injury to people or property resulting from any ideas, methods, instructions or products referred to in the content. |
© 2025 by the authors. Licensee MDPI, Basel, Switzerland. This article is an open access article distributed under the terms and conditions of the Creative Commons Attribution (CC BY) license (https://creativecommons.org/licenses/by/4.0/).