


Decline in Running Performance in Highest-Level Soccer: Analysis of the UEFA Champions League Matches

 ,
,  ,
,  ,
,  ,
,  ,
,  , and
, and
Abstract
Simple Summary
Abstract
1. Introduction
2. Materials and Methods
2.1. Participants and Study Design
2.2. Procedures
2.3. Statistical Analysis
3. Results
4. Discussion
5. Conclusions
Author Contributions
Funding
Institutional Review Board Statement
Informed Consent Statement
Data Availability Statement
Acknowledgments
Conflicts of Interest
References
- Silva, A.F.; Alvurdu, S.; Akyildiz, Z.; Clemente, F.M. Relationships of Final Velocity at 30-15 Intermittent Fitness Test and Anaerobic Speed Reserve with Body Composition, Sprinting, Change-of-Direction and Vertical Jumping Performances: A Cross-Sectional Study in Youth Soccer Players. Biology 2022, 11, 197. [Google Scholar] [CrossRef] [PubMed]
- Toselli, S.; Mauro, M.; Grigoletto, A.; Cataldi, S.; Benedetti, L.; Nanni, G.; Di Miceli, R.; Aiello, P.; Gallamini, D.; Fischetti, F.; et al. Assessment of Body Composition and Physical Performance of Young Soccer Players: Differences According to the Competitive Level. Biology 2022, 11, 823. [Google Scholar] [CrossRef] [PubMed]
- Roso-Moliner, A.; Mainer-Pardos, E.; Arjol-Serrano, J.L.; Cartón-Llorente, A.; Nobari, H.; Lozano, D. Evaluation of 10-Week Neuromuscular Training Program on Body Composition of Elite Female Soccer Players. Biology 2022, 11, 1062. [Google Scholar] [CrossRef] [PubMed]
- Arjol-Serrano, J.L.; Lampre, M.; Díez, A.; Castillo, D.; Sanz-López, F.; Lozano, D. The Influence of Playing Formation on Physical Demands and Technical-Tactical Actions According to Playing Positions in an Elite Soccer Team. Int. J. Environ. Res. Public Health 2021, 18, 4148. [Google Scholar] [CrossRef]
- Modric, T.; Versic, S.; Sekulic, D. Relations of the Weekly External Training Load Indicators and Running Performances in Professional Soccer Matches. Sport Mont 2021, 19, 31–37. [Google Scholar]
- Nobari, H.; Gholizadeh, R.; Martins, A.D.; Badicu, G.; Oliveira, R. In-Season Quantification and Relationship of External and Internal Intensity, Sleep Quality, and Psychological or Physical Stressors of Semi-Professional Soccer Players. Biology 2022, 11, 467. [Google Scholar] [CrossRef]
- Chmura, P.; Liu, H.; Andrzejewski, M.; Chmura, J.; Kowalczuk, E.; Rokita, A.; Konefał, M. Is there meaningful influence from situational and environmental factors on the physical and technical activity of elite football players? Evidence from the data of 5 consecutive seasons of the German Bundesliga. PLoS ONE 2021, 16, e0247771. [Google Scholar]
- Bezuglov, E.; Talibov, O.; Khaitin, V.; Pirmakhanov, B.; Waśkiewicz, Z.; Butovskiy, M.; Morgans, R. Running Performance during the Holy Month of Ramadan in Elite Professional Adult Soccer Players in Russia. Int. J. Environ. Res. Public Health 2021, 18, 11731. [Google Scholar] [CrossRef]
- Sekulic, D.; Versic, S.; Decelis, A.; Castro-Piñero, J.; Javorac, D.; Dimitric, G.; Idrizovic, K.; Jukic, I.; Modric, T. The Effect of the COVID-19 Lockdown on the Position-Specific Match Running Performance of Professional Football Players; Preliminary Observational Study. Int. J. Environ. Res. Public Health 2021, 18, 12221. [Google Scholar] [CrossRef]
- Andrzejewski, M.; Chmura, J.; Pluta, B.; Konarski, J.M. Sprinting activities and distance covered by top level Europa league soccer players. Int. J. Sport. Sci. Coach. 2015, 10, 39–50. [Google Scholar] [CrossRef]
- De Albuquerque Freire, L.; Brito, M.A.; Muñoz, P.M.; Pérez, D.I.V.; Kohler, H.C.; Aedo-Muñoz, E.A.; Slimani, M.; Brito, C.J.; Bragazzi, N.L.; Znazen, H. Match Running Performance of Brazilian Professional Soccer Players according to Tournament Types. Montenegrin J. Sport. Sci. Med. 2022, 11, 53–58. [Google Scholar] [CrossRef]
- Alcantarilla-Pedrosa, M.; Álvarez-Santana, D.; Hernández-Sánchez, S.; Yañez-Álvarez, A.; Albornoz-Cabello, M. Assessment of External Load during Matches in Two Consecutive Seasons Using the Mediacoach® Video Analysis System in a Spanish Professional Soccer Team: Implications for Injury Prevention. Int. J. Environ. Res. Public Health 2021, 18, 1128. [Google Scholar] [CrossRef] [PubMed]
- Teixeira, J.E.; Forte, P.; Ferraz, R.; Leal, M.; Ribeiro, J.; Silva, A.J.; Barbosa, T.M.; Monteiro, A.M. Monitoring Accumulated Training and Match Load in Football: A Systematic Review. Int. J. Env. Res. Public Health 2021, 18, 3906. [Google Scholar] [CrossRef] [PubMed]
- Aquino, R.; Vieira, L.H.P.; Carling, C.; Martins, G.H.; Alves, I.S.; Puggina, E.F. Effects of competitive standard, team formation and playing position on match running performance of Brazilian professional soccer players. Int. J. Perform. Anal. Sport 2017, 17, 695–705. [Google Scholar] [CrossRef]
- Modric, T.; Versic, S.; Sekulic, D.; Liposek, S. Analysis of the Association between Running Performance and Game Performance Indicators in Professional Soccer Players. Int. J. Environ. Res. Public Health 2019, 16, 4032. [Google Scholar] [CrossRef]
- Vigne, G.; Gaudino, C.; Rogowski, I.; Alloatti, G.; Hautier, C. Activity profile in elite Italian soccer team. Int. J. Sport. Med. 2010, 31, 304–310. [Google Scholar] [CrossRef]
- Mallo, J.; Mena, E.; Nevado, F.; Paredes, V. Physical demands of top-class soccer friendly matches in relation to a playing position using global positioning system technology. J. Hum. Kinet. 2015, 47, 179–188. [Google Scholar] [CrossRef]
- Jones, R.; Tranter, T. Soccer Strategies: Defensive and Attacking Tactics; Reedswain Inc.: Spring City, PA, USA, 1999. [Google Scholar]
- Bangsbo, J.; Peitersen, B. Soccer Systems and Strategies; Human Kinetics: Champaign, IL, USA, 2000. [Google Scholar]
- Jerkovic, Z.; Modric, T.; Versic, S. Analysis of the Associations between Contextual Variables and Match Running Performance in Croatian First Division Soccer. Sport Mont 2022, 20, 125–130. [Google Scholar] [CrossRef]
- Algroy, E.; Grendstad, H.; Riiser, A.; Nybakken, T.; Saeterbakken, A.H.; Andersen, V.; Gundersen, H.S. Motion Analysis of Match Play in U14 Male Soccer Players and the Influence of Position, Competitive Level and Contextual Variables. Int. J. Environ. Res. Public Health 2021, 18, 7287. [Google Scholar] [CrossRef]
- Teixeira, J.E.; Leal, M.; Ferraz, R.; Ribeiro, J.; Cachada, J.M.; Barbosa, T.M.; Monteiro, A.M.; Forte, P. Effects of Match Location, Quality of Opposition and Match Outcome on Match Running Performance in a Portuguese Professional Football Team. Entropy 2021, 23, 973. [Google Scholar] [CrossRef]
- Linke, D.; Link, D.; Weber, H.; Lames, M. Decline in match running performance in football is affected by an increase in game interruptions. J. Sport. Sci. Med. 2018, 17, 662. [Google Scholar]
- Rampinini, E.; Impellizzeri, F.M.; Castagna, C.; Coutts, A.J.; Wisløff, U. Technical performance during soccer matches of the Italian Serie A league: Effect of fatigue and competitive level. J. Sci. Med. Sport 2009, 12, 227–233. [Google Scholar] [CrossRef] [PubMed]
- Di Salvo, V.; Gregson, W.; Atkinson, G.; Tordoff, P.; Drust, B. Analysis of high intensity activity in Premier League soccer. Int. J. Sport. Med. 2009, 30, 205–212. [Google Scholar] [CrossRef] [PubMed]
- Mohr, M.; Krustrup, P.; Bangsbo, J. Match performance of high-standard soccer players with special reference to development of fatigue. J. Sport. Sci. 2003, 21, 519–528. [Google Scholar] [CrossRef]
- Rey, E.; Kalén, A.; Lorenzo-Martínez, M.; López-Del Campo, R.; Nevado-Garrosa, F.; Lago-Peñas, C. Elite Soccer Players do Not Cover Less Distance in the Second Half of the Matches When Game Interruptions Are Considered. J. Strength Cond. Res. 2020; publish ahead of print. [Google Scholar] [CrossRef]
- Bradley, P.S.; Di Mascio, M.; Peart, D.; Olsen, P.; Sheldon, B. High-intensity activity profiles of elite soccer players at different performance levels. J. Strength Cond. Res. 2010, 24, 2343–2351. [Google Scholar] [CrossRef]
- Akenhead, R.; Hayes, P.R.; Thompson, K.G.; French, D. Diminutions of acceleration and deceleration output during professional football match play. J. Sci. Med. Sport 2013, 16, 556–561. [Google Scholar] [CrossRef]
- Barros, R.M.; Misuta, M.S.; Menezes, R.P.; Figueroa, P.J.; Moura, F.A.; Cunha, S.A.; Anido, R.; Leite, N.J. Analysis of the distances covered by first division Brazilian soccer players obtained with an automatic tracking method. J. Sport. Sci. Med. 2007, 6, 233. [Google Scholar]
- Carling, C.; Dupont, G. Are declines in physical performance associated with a reduction in skill-related performance during professional soccer match-play? J. Sport. Sci. 2011, 29, 63–71. [Google Scholar] [CrossRef]
- Bradley, P.S.; Noakes, T.D. Match running performance fluctuations in elite soccer: Indicative of fatigue, pacing or situational influences? J. Sport. Sci. 2013, 31, 1627–1638. [Google Scholar] [CrossRef]
- Bendiksen, M.; Bischoff, R.; Randers, M.B.; Mohr, M.; Rollo, I.; Suetta, C.; Bangsbo, J.; Krustrup, P. The Copenhagen Soccer Test: Physiological response and fatigue development. Med. Sci. Sport. Exerc. 2012, 44, 1595–1603. [Google Scholar] [CrossRef] [PubMed]
- Krustrup, P.; Mohr, M.; Steensberg, A.; Bencke, J.; Kjær, M.; Bangsbo, J. Muscle and blood metabolites during a soccer game: Implications for sprint performance. Med. Sci. Sport. Exerc. 2006, 38, 1165–1174. [Google Scholar] [CrossRef] [PubMed]
- Drust, B.; Atkinson, G.; Reilly, T. Future perspectives in the evaluation of the physiological demands of soccer. Sport. Med. 2007, 37, 783–805. [Google Scholar] [CrossRef]
- Edwards, A.M.; Noakes, T.D. Dehydration. Sport. Med. 2009, 39, 1–13. [Google Scholar] [CrossRef] [PubMed]
- Modric, T.; Versic, S.; Chmura, P.; Konefał, M.; Andrzejewski, M.; Jukic, I.; Drid, P.; Pocek, S.; Sekulic, D. Match Running Performance in UEFA Champions League: Is There a Worthwhile Association with Team Achievement? Biology 2022, 11, 867. [Google Scholar] [CrossRef] [PubMed]
- Kołodziejczyk, M.; Chmura, P.; Modric, T.; Versic, S.; Andrzejewski, M.; Chmura, J.; Sekulic, D.; Rokita, A.; Konefał, M. Do players competing in the UEFA Champions League maintain running performance until the end of the match? Positional analysis between halves and 5-minute intervals. J. Sport. Med. Phys. Fit. 2022. [Google Scholar] [CrossRef]
- Lago-Peñas, C.; Lago-Ballesteros, J.; Rey, E. Differences in performance indicators between winning and losing teams in the UEFA Champions League. J. Hum. Kinet. 2011, 27, 135–146. [Google Scholar] [CrossRef]
- Lorenzo-Martinez, M.; Kalén, A.; Rey, E.; López-Del Campo, R.; Resta, R.; Lago-Peñas, C. Do elite soccer players cover less distance when their team spent more time in possession of the ball? Sci. Med. Footb. 2021, 5, 310–316. [Google Scholar] [CrossRef]
- Kubayi, A. Position-specific physical and technical demands during the 2019 COPA America Football tournament. S. Afr. J. Sport. Med. 2021, 33, 1–6. [Google Scholar] [CrossRef]
- Modric, T.; Versic, S.; Stojanovic, M.; Chmura, P.; Andrzejewski, M.; Konefał, M.; Sekulic, D. Factors affecting match running performance in elite soccer: Analysis of UEFA Champions League matches. Biol. Sport 2022, 40, 409–416. [Google Scholar] [CrossRef]
- Yi, Q.; Groom, R.; Dai, C.; Liu, H.; Gómez Ruano, M.Á. Differences in technical performance of players from ‘the big five’European football leagues in the UEFA Champions League. Front. Psychol. 2019, 10, 2738. [Google Scholar] [CrossRef] [PubMed]
- Perneger, T.V. What’s wrong with Bonferroni adjustments. BMJ 1998, 316, 1236–1238. [Google Scholar] [CrossRef] [PubMed]
- Kelly, D.M.; Strudwick, A.J.; Atkinson, G.; Drust, B.; Gregson, W. Quantification of training and match-load distribution across a season in elite English Premier League soccer players. Sci. Med. Footb. 2020, 4, 59–67. [Google Scholar] [CrossRef]
- Batterham, A.M.; Hopkins, W.G. Making meaningful inferences about magnitudes. Int. J. Sport. Physiol. Perform. 2006, 1, 50–57. [Google Scholar] [CrossRef]
- Weston, M.; Drust, B.; Gregson, W. Intensities of exercise during match-play in FA Premier League referees and players. J. Sport. Sci. 2011, 29, 527–532. [Google Scholar] [CrossRef] [PubMed]
- Modric, T.; Versic, S.; Sekulic, D. Does aerobic performance define match running performance among professional soccer players? A position-specific analysis. Res. Sport. Med. 2021, 29, 336–348. [Google Scholar] [CrossRef]
- Barrera, J.; Sarmento, H.; Clemente, F.M.; Field, A.; Figueiredo, A.J. The Effect of Contextual Variables on Match Performance across Different Playing Positions in Professional Portuguese Soccer Players. Int. J. Environ. Res. Public Health 2021, 18, 5175. [Google Scholar] [CrossRef]
- Modric, T.; Jelicic, M.; Sekulic, D. Relative Training Load and Match Outcome: Are Professional Soccer Players Actually Undertrained during the In-Season? Sports 2021, 9, 139. [Google Scholar] [CrossRef]
- Aquino, R.; Carling, C.; Palucci Vieira, L.; Martins, G.; Jabor, G.; Machado, J.; Puggina, E. Influence of situational variables, team formation, and playing position on match running performance and social network analysis in brazilian professional soccer players. J. Strength Cond Res. 2020, 34, 808–817. [Google Scholar] [CrossRef]
- Trewin, J.; Meylan, C.; Varley, M.C.; Cronin, J. The influence of situational and environmental factors on match-running in soccer: A systematic review. Sci. Med. Footb. 2017, 1, 183–194. [Google Scholar] [CrossRef]
- Lago, C.; Casais, L.; Dominguez, E.; Sampaio, J. The effects of situational variables on distance covered at various speeds in elite soccer. Eur. J. Sport Sci. 2010, 10, 103–109. [Google Scholar] [CrossRef]
- Barte, J.C.; Nieuwenhuys, A.; Geurts, S.A.; Kompier, M.A. Fatigue experiences in competitive soccer: Development during matches and the impact of general performance capacity. Fatigue Biomed. Health Behav. 2017, 5, 191–201. [Google Scholar] [CrossRef]
- Bradley, P.S.; Carling, C.; Archer, D.; Roberts, J.; Dodds, A.; Di Mascio, M.; Paul, D.; Gomez Diaz, A.; Peart, D.; Krustrup, P. The effect of playing formation on high-intensity running and technical profiles in English FA Premier League soccer matches. J. Sport. Sci. 2011, 29, 821–830. [Google Scholar] [CrossRef] [PubMed]
- Modric, T.; Versic, S.; Jelicic, M. Monitoring Technical Performance in the UEFA Champions League: Differences Between Successful and Unsuccessful Teams. Montenegrin J. Sport. Sci. Med. 2022; 11, ahead of print. [Google Scholar]
- Dellal, A.; Wong, d.P.; Moalla, W.; Chamari, K. Physical and technical activity of soccer players in the French First League-with special reference to their playing position. Int. Sport. J. 2010, 11, 278–290. [Google Scholar]


| Central Defenders | Fullbacks | Central Midfielders | Wide Midfielders | Forwards | |
|---|---|---|---|---|---|
| Total distance | |||||
| Match period | 53.22 (0.01) | 38.8 (0.01) | 42.96 (0.01) | 25.94 (0.01) | 17.11 (0.01) |
| Match outcome | 0.04 (0.85) | 1.1 (0.29) | 0.18 (0.67) | 0.22 (0.64) | 0.29 (0.60) |
| Match location | 1.39 (0.24) | 2.69 (0.11) | 1.02 (0.31) | 1.16 (0.29) | 0.06 (0.82) |
| Team quality | 1.58 (0.22) | 1.8 (0.19) | 0 (0.98) | 0.59 (0.45) | 0.02 (0.89) |
| Opponent quality | 0.17 (0.68) | 1.61 (0.21) | 2.75 (0.10) | 1.68 (0.20) | 0.05 (0.82) |
| High-intensity running | |||||
| Match period | 3.73 (0.01) | 7.25 (0.01) | 4.75 (0.01) | 3.98 (0.01) | 3.84 (0.01) |
| Match outcome | 1.77 (0.19) | 2.7 (0.10) | 2.81 (0.10) | 0.86 (0.36) | 0.03 (0.88) |
| Match location | 1.18 (0.28) | 0.05 (0.82) | 0.01 (0.93) | 0.95 (0.34) | 0.43 (0.52) |
| Team quality | 0.67 (0.42) | 2.58 (0.12) | 0.04 (0.84) | 1.87 (0.19) | 1.22 (0.29) |
| Opponent quality | 2.89 (0.09) | 0.07 (0.79) | 0.44 (0.51) | 0.63 (0.43) | 0.22 (0.65) |
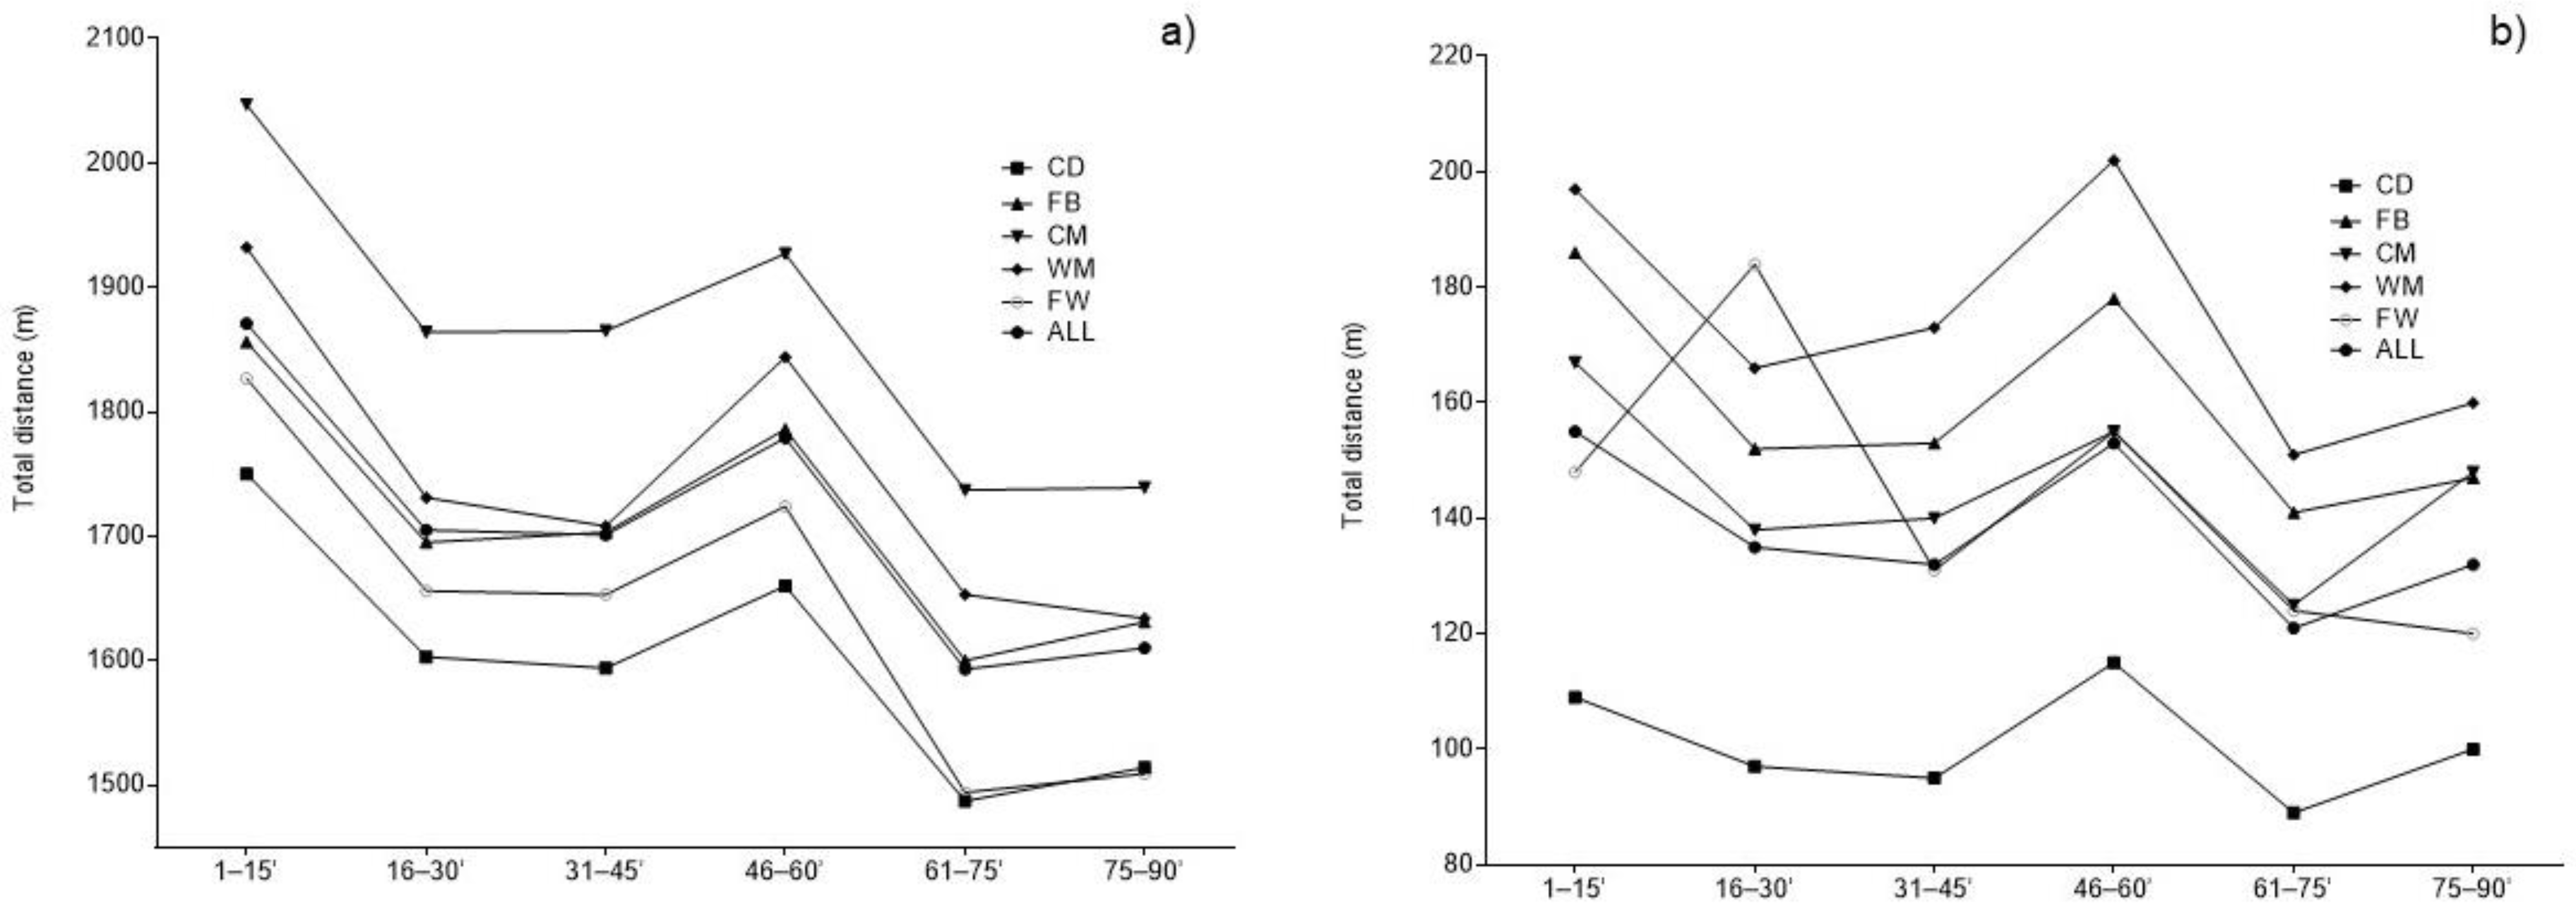
| Match Period | Independently of Position | Central Defenders | Fullbacks | Central Midfielders | Wide Midfielders | Forwards |
|---|---|---|---|---|---|---|
| Total distance covered | ||||||
| 1–15′ | 1871 ± 193 | 1750 ± 141 | 1856 ± 169 | 2047 ± 152 | 1932 ± 183 | 1827 ± 168 |
| 16–30′ | 1705 ± 209 | 1603 ± 192 | 1695 ± 206 | 1864 ± 174 | 1731 ± 150 | 1656 ± 172 |
| 31–45′ | 1701 ± 187 | 1594 ± 148 | 1703 ± 161 | 1865 ± 179 | 1708 ± 155 | 1653 ± 141 |
| 46–60′ | 1779 ± 192 | 1660 ± 160 | 1786 ± 155 | 1927 ± 172 | 1844 ± 174 | 1724 ± 181 |
| 61–75′ | 1593 ± 168 | 1487 ± 142 | 1600 ± 135 | 1737 ± 138 | 1653 ± 130 | 1494 ± 152 |
| 75–90′ | 1610 ± 166 | 1514 ± 134 | 1631 ± 149 | 1739 ± 134 | 1634 ± 153 | 1509 ± 155 |
| f (p) | 176.62 (0.01) | 53.01 (0.01) | 40.66 (0.01) | 42.54 (0.01) | 26.04 (0.01) | 17.57 (0.01) |
| η2 | 0.42 | 0.40 | 0.39 | 0.44 | 0.49 | 0.52 |
| High-intensity running | ||||||
| 1–15′ | 155 ± 73 | 109 ± 54 | 186 ± 72 | 167 ± 71 | 197 ± 66 | 148 ± 53 |
| 16–30′ | 135 ± 64 | 97 ± 45 | 152 ± 60 | 138 ± 58 | 166 ± 59 | 184 ± 84 |
| 31–45′ | 132 ± 59 | 95 ± 50 | 153 ± 58 | 140 ± 54 | 173 ± 47 | 131 ± 44 |
| 46–60′ | 153 ± 66 | 115 ± 54 | 178 ± 60 | 155 ± 60 | 202 ± 73 | 155 ± 42 |
| 61–75′ | 121 ± 55 | 89 ± 48 | 141 ± 50 | 125 ± 52 | 151 ± 46 | 124 ± 64 |
| 75–90′ | 132 ± 66 | 100 ± 60 | 147 ± 60 | 148 ± 69 | 160 ± 56 | 120 ± 64 |
| f (p) | 18.42 (0.01) | 3.67 (0.01) | 7.64 (0.01) | 4.78 (0.01) | 3.99 (0.01) | 3.79 (0.01) |
| η2 | 0.07 | 0.05 | 0.10 | 0.08 | 0.13 | 0.19 |
| Match Period | Independently of Position | Central Defenders | Fullbacks | ||||||
|---|---|---|---|---|---|---|---|---|---|
| MD (95%CI) | % | d | MD (95%CI) | % | d | MD (95%CI) | % | d | |
| 16–30′ vs. 1–15′ | −166 (−188, −146) | −9 | 0.83 | −147 (−185, −109) | −8 | 0.87 | −161 (−200, −121) | −9 | 0.85 |
| 31–45′ vs. 16–30′ | −4 (−28, 21) | 0 | 0.02 | −9 (−52, 34) | −1 | 0.05 | 8 (−42, 58) | 0 | 0.04 |
| 46–60′ vs. 31–45′ | 78 (56, 100) | 5 | 0.41 | 66 (33, 98) | 4 | 0.43 | 83 (−129, −37) | 5 | 0.53 |
| 61–75′ vs. 46–60′ | −186 (−205, −168) | −10 | 1.03 | −173 (−203, −143) | −10 | 1.14 | −186 (−223, −149) | −10 | 1.28 |
| 75–90′ vs. 61–75′ | 17 (−35, 1) | 1 | 0.10 | 27 (−7, 62) | 2 | 0.20 | 31 (−3, 64) | 2 | 0.22 |
| 75–90′ vs. 1–15′ | −261 (−282, −242) | −14 | 1.45 | −236 (−270, −201) | −13 | 1.72 | −225 (−266, −183) | −12 | 1.41 |
| Match Period | Central Midfielders | Wide Midfielders | Forwards | ||||||
| MD (95%CI) | % | d | MD (95%CI) | % | d | MD (95%CI) | % | d | |
| 16–30′ vs. 1–15′ | −183 (−234, −133) | −9 | 1.12 | −201 (−249, −153) | −10 | 1.2 | −171 (−261, −82) | −9 | 1.01 |
| 31–45′ vs. 16–30′ | 1 (−59, 60) | 0 | 0.01 | −23 (−86, 40) | −1 | 0.15 | −3 (−104, 98) | 0 | 0.02 |
| 46–60′ vs. 31–45′ | 62 (10, 114) | 3 | 0.35 | 136 (63, 208) | 8 | 0.83 | 71 (−24, 166) | 4 | 0.44 |
| 61–75′ vs. 46–60′ | −190 (−235, −146) | −10 | 1.22 | −191 (−256, −127) | −10 | 1.24 | −230 (−304, −155) | −13 | 1.38 |
| 75–90′ vs. 61–75′ | 2 (−37, 42) | 0 | 0.01 | −19 (−73, 36) | −1 | 0.13 | 15 (−51, 80) | 1 | 0.1 |
| 75–90′ vs. 1–15′ | −308 (−351, −264) | −15 | 2.15 | −298 (−351, −244) | −15 | 1.77 | −318 (−383, −254) | −17 | 1.97 |
| Match Period | Independently of Position | Central Defenders | Fullbacks | ||||||
|---|---|---|---|---|---|---|---|---|---|
| MD (95%CI) | % | d | MD (95%CI) | % | d | MD (95%CI) | % | d | |
| 16–30′ vs. 1–15′ | −20 (−30, −12) | −13 | 0.29 | −12 (−25, 2) | −11 | 0.24 | −34 (−53, −18) | −18 | 0.51 |
| 31–45′ vs. 16–30′ | −3 (−12, 7) | −2 | 0.05 | −2 (−16, 11) | −2 | 0.04 | 1 (−18, 21) | 1 | 0.02 |
| 46–60′ vs. 31–45′ | 21 (13, 30) | 16 | 0.34 | 20 (8, 32) | 21 | 0.38 | 25 (5, 44) | 16 | 0.42 |
| 61–75′ vs. 46–60′ | −32 (−24, −42) | −21 | 0.53 | −26 (−41, −10) | −23 | 0.51 | −37 (−56, −18) | −21 | 0.67 |
| 75–90′ vs. 61–75′ | 11 (4, 19) | 9 | 0.18 | 11 (−3, 25) | 12 | 0.20 | 6 (−10, 22) | 4 | 0.11 |
| 75–90′ vs. 1–15′ | −23 (−33, −14) | −15 | 0.33 | −9 (−24, 6) | −8 | 0.16 | −39 (−58, −20) | −21 | 0.59 |
| Match Period | Central Midfielders | Wide Midfielders | Forwards | ||||||
| MD (95%CI) | % | d | MD (95%CI) | % | d | MD (95%CI) | % | d | |
| 16–30′ vs. 1–15′ | −29 (−48, −9) | −17 | 0.45 | −31 (−58, −5) | −16 | 0.50 | 36 (−3, 76) | 24 | 0.51 |
| 31–45′ vs. 16–30′ | 2 (−18, 22) | 1 | 0.04 | 7 (−21, 36) | 4 | 0.13 | −53 (−98, −9) | −29 | 0.79 |
| 46–60′ vs. 31–45′ | 15 (−3, 33) | 11 | 0.26 | 29 (−1, 58) | 17 | 0.47 | 24 (−1, 47) | 18 | 0.56 |
| 61–75′ vs. 46–60′ | −30 (−44, −15) | −19 | 0.53 | −51 (−84, −19) | −25 | 0.84 | −31 (−61, 1) | −20 | 0.57 |
| 75–90′ vs. 61–75′ | 23 (6, 40) | 18 | 0.38 | 9 (−17, 35) | 6 | 0.18 | −4 (−43, 34) | −3 | 0.06 |
| 75–90′ vs. 1–15′ | −19 (−41, 4) | −11 | 0.27 | −37 (−70, −5) | −19 | 0.60 | −28 (−68, 12) | −19 | 0.48 |
Publisher’s Note: MDPI stays neutral with regard to jurisdictional claims in published maps and institutional affiliations. |
© 2022 by the authors. Licensee MDPI, Basel, Switzerland. This article is an open access article distributed under the terms and conditions of the Creative Commons Attribution (CC BY) license (https://creativecommons.org/licenses/by/4.0/).
Share and Cite
Modric, T.; Versic, S.; Alexe, D.I.; Gilic, B.; Mihai, I.; Drid, P.; Radulovic, N.; Saavedra, J.M.; Menjibar, R.B. Decline in Running Performance in Highest-Level Soccer: Analysis of the UEFA Champions League Matches. Biology 2022, 11, 1441. https://doi.org/10.3390/biology11101441
Modric T, Versic S, Alexe DI, Gilic B, Mihai I, Drid P, Radulovic N, Saavedra JM, Menjibar RB. Decline in Running Performance in Highest-Level Soccer: Analysis of the UEFA Champions League Matches. Biology. 2022; 11(10):1441. https://doi.org/10.3390/biology11101441
Chicago/Turabian StyleModric, Toni, Sime Versic, Dan Iulian Alexe, Barbara Gilic, Ilie Mihai, Patrik Drid, Nikola Radulovic, Jose M. Saavedra, and Rafael Burgueño Menjibar. 2022. "Decline in Running Performance in Highest-Level Soccer: Analysis of the UEFA Champions League Matches" Biology 11, no. 10: 1441. https://doi.org/10.3390/biology11101441
APA StyleModric, T., Versic, S., Alexe, D. I., Gilic, B., Mihai, I., Drid, P., Radulovic, N., Saavedra, J. M., & Menjibar, R. B. (2022). Decline in Running Performance in Highest-Level Soccer: Analysis of the UEFA Champions League Matches. Biology, 11(10), 1441. https://doi.org/10.3390/biology11101441