Evaluation of the Relationships between Simple Anthropometric Measures and Bioelectrical Impedance Assessment Variables with Multivariate Linear Regression Models to Estimate Body Composition and Fat Distribution in Adults: Preliminary Results

 ,
,  ,
,  ,
,  , , , , ,
  , ,
, ,  ,
,  ,
,  and
and 
Abstract
:Simple Summary
Abstract
1. Introduction
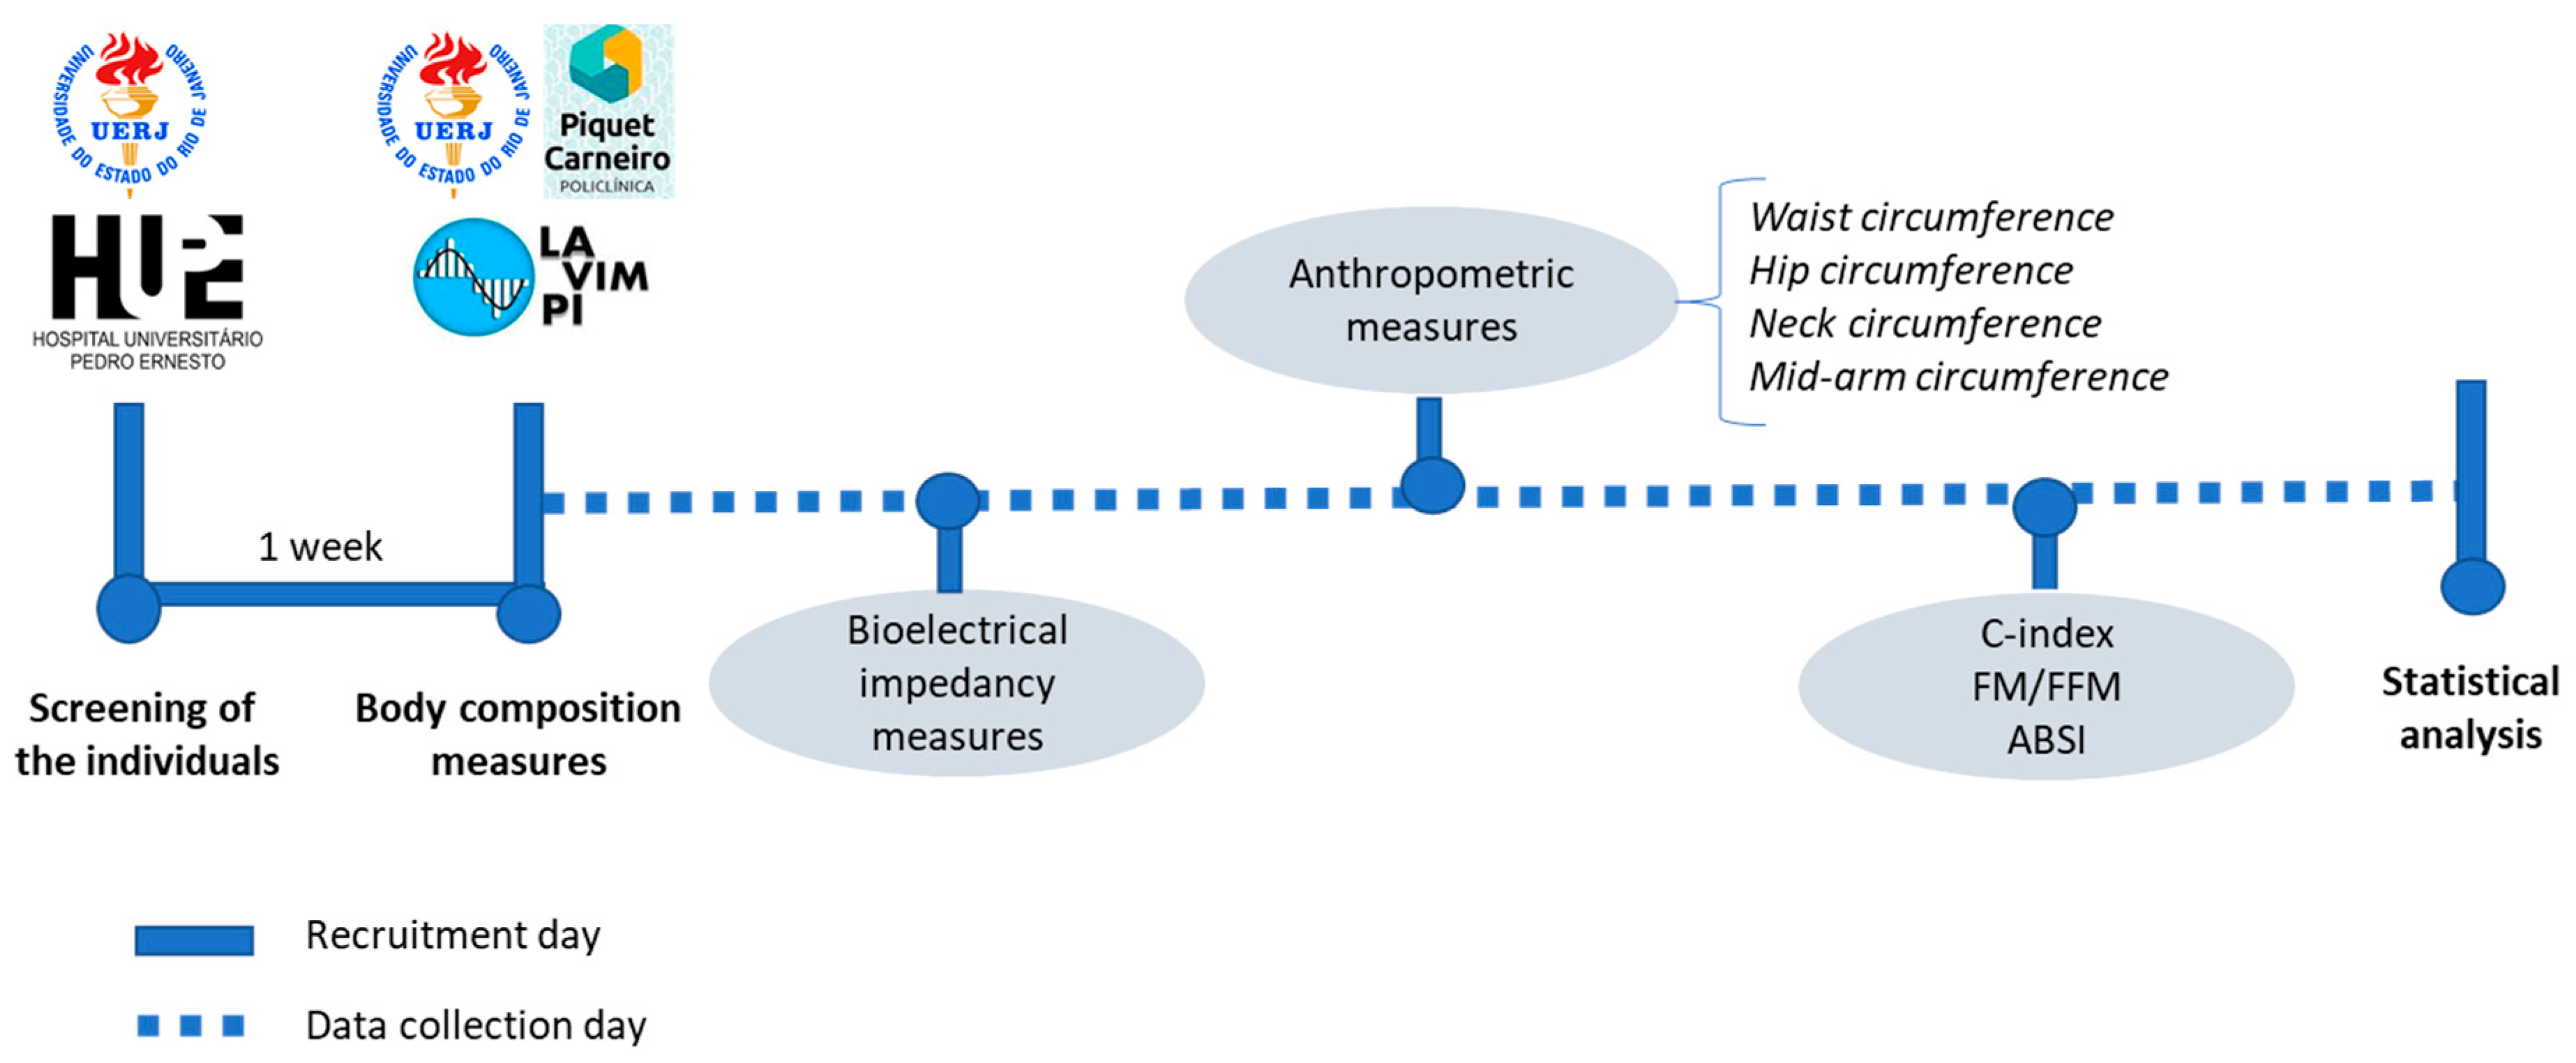
2. Methods
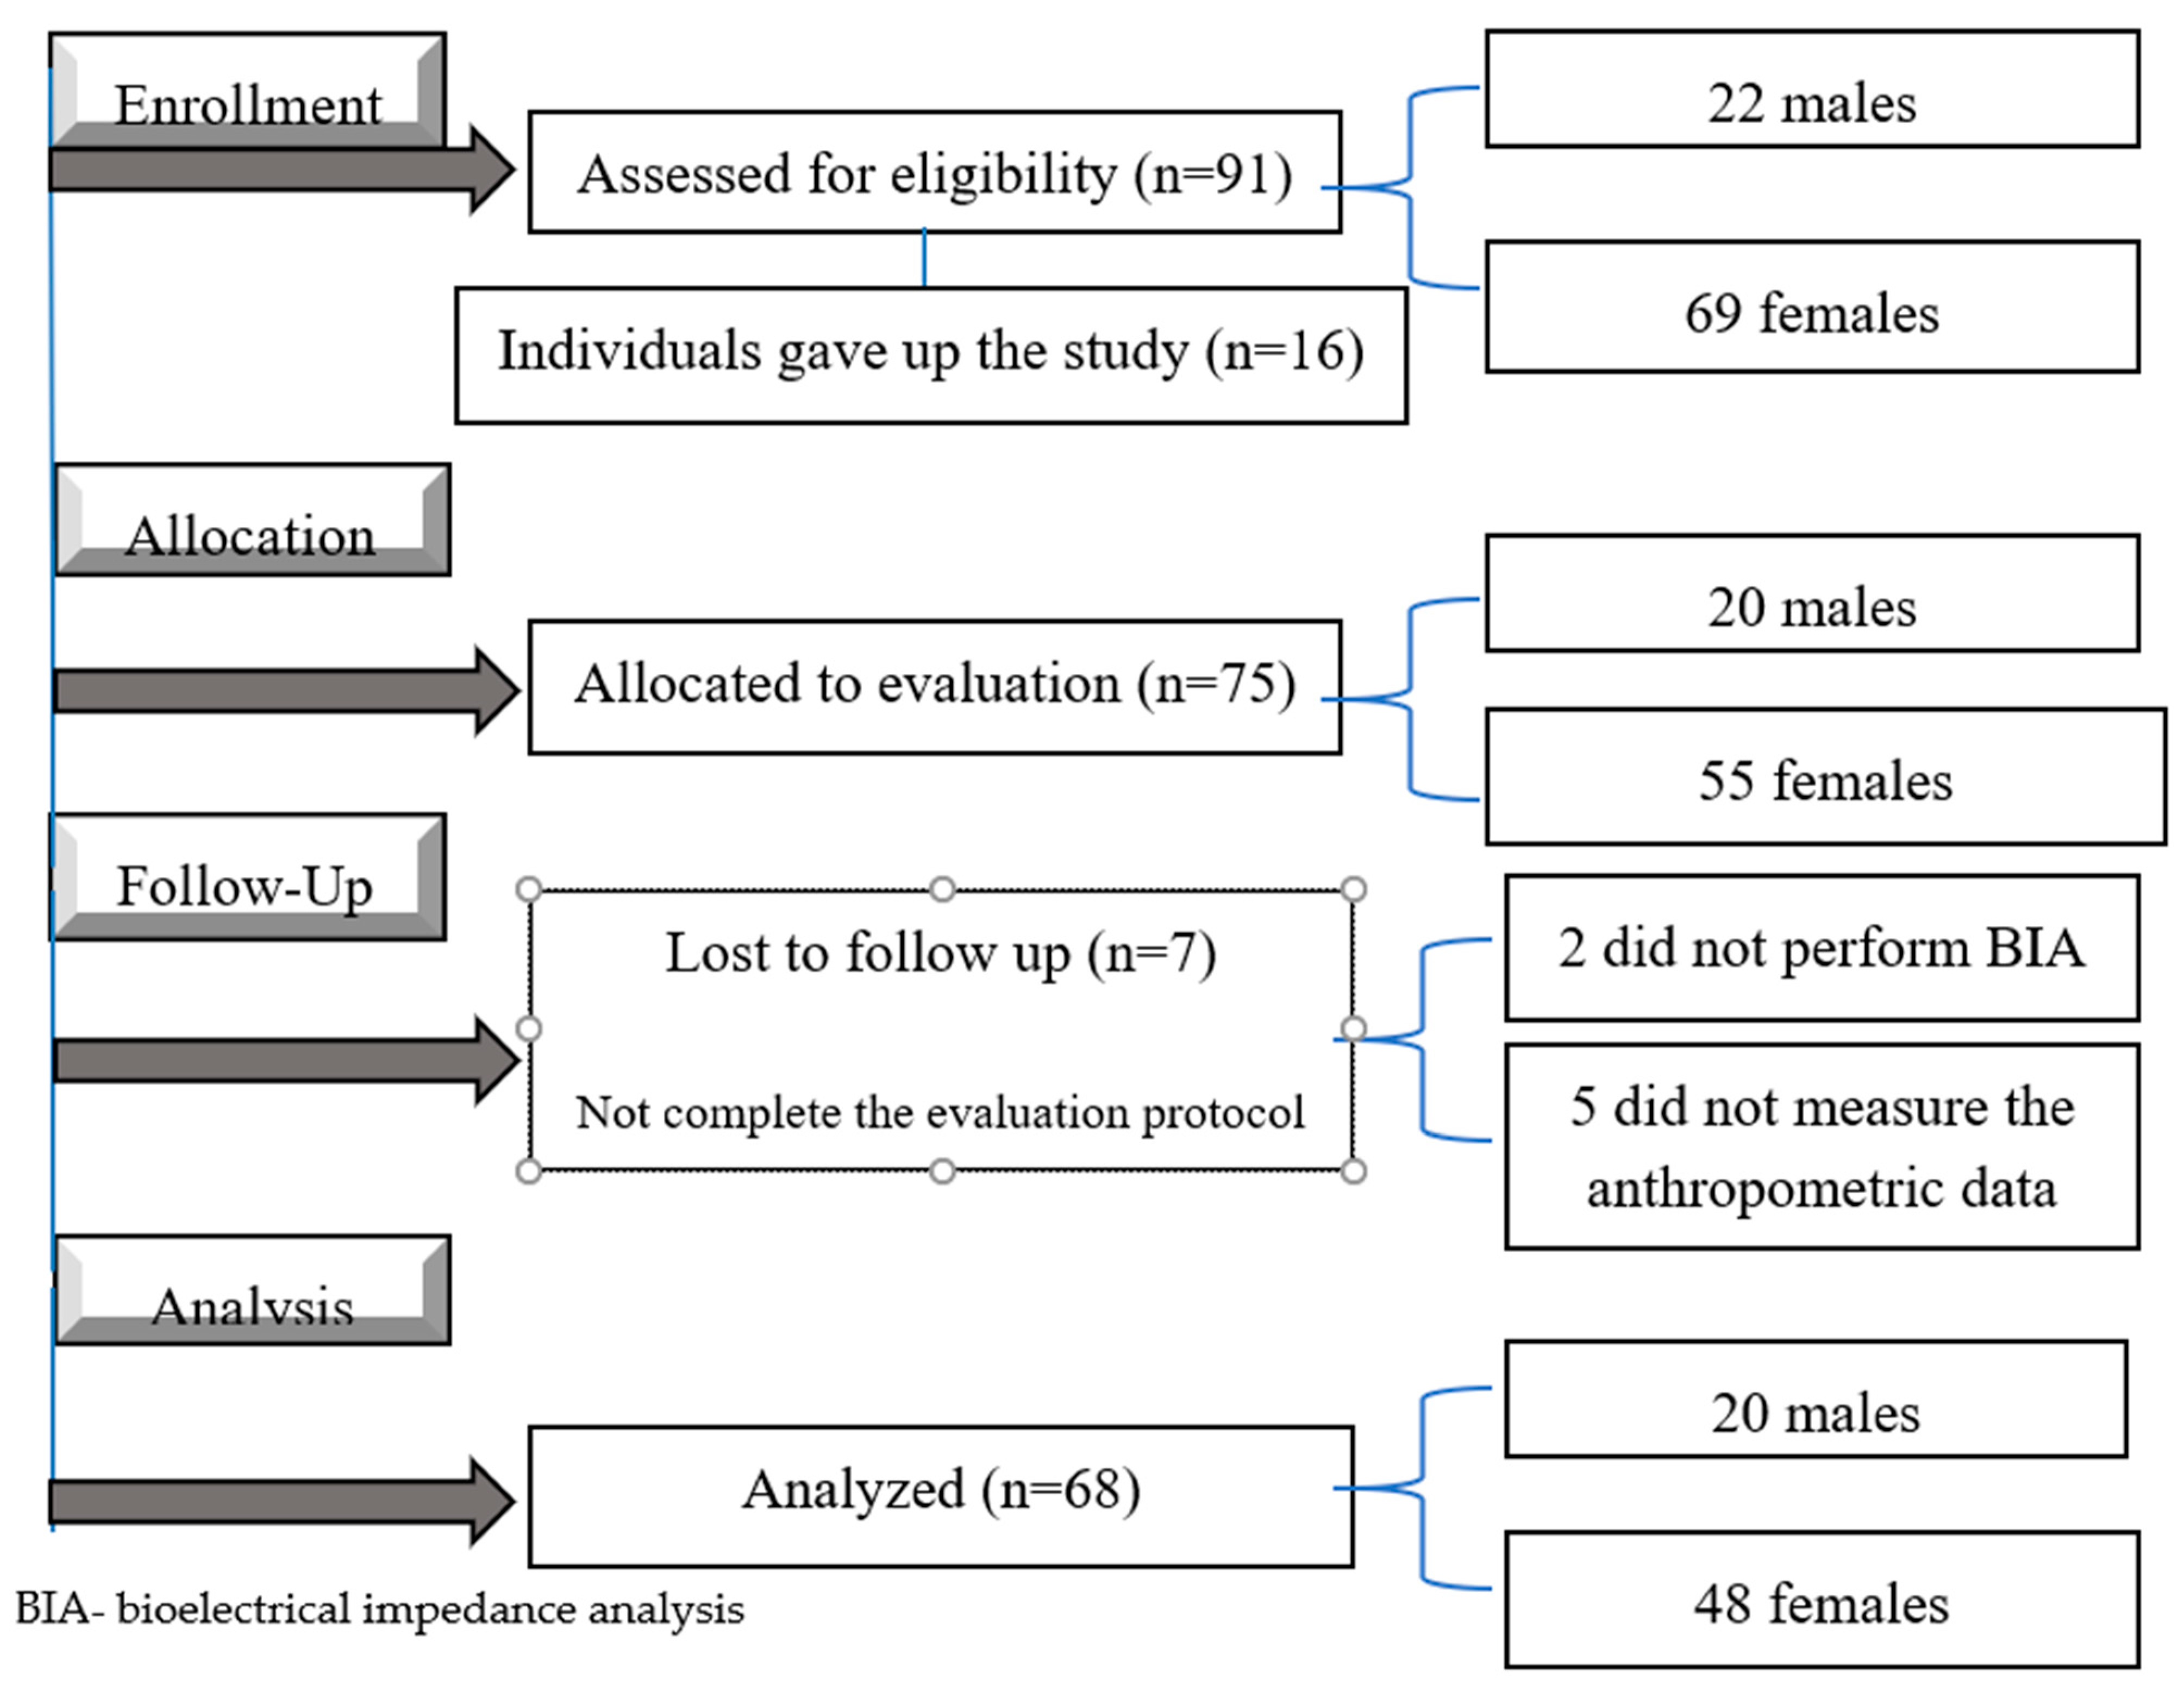
2.1. Subjects
2.2. Measurements
2.3. Bioelectrical Impedance Analysis
2.4. Anthropometric Measures: Waist Circumference, Hip Circumference, Neck Circumference, the Mid-Arm Circumference
2.5. The C-Index, the FM/FFM Ratios and ABSI
3. Statistical Analysis
4. Results
5. Discussion
6. Conclusions
Author Contributions
Funding
Institutional Review Board Statement
Informed Consent Statement
Data Availability Statement
Acknowledgments
Conflicts of Interest
References
- WHO. Obesity and Overweight. Available online: https://www.who.int/news-room/fact-sheets/detail/obesity-and-overweight (accessed on 6 November 2021).
- Bennett, G.; Young, E.; Butler, I.; Coe, S. The Impact of Lockdown during the COVID-19 Outbreak on Dietary Habits in Various Population Groups: A Scoping Review. Front. Nutr. 2021, 8, 1–10. [Google Scholar] [CrossRef]
- Simmonds, M.; Llewellyn, A.; Owen, C.G.; Woolacott, N. Predicting adult obesity from childhood obesity: A systematic review and meta-analysis. Obes. Rev. 2016, 17, 95–107. [Google Scholar] [CrossRef] [PubMed] [Green Version]
- Goossens, G.H. The Metabolic Phenotype in Obesity: Fat Mass, Body Fat Distribution, and Adipose Tissue Function. Obes. Facts 2017, 10, 207–215. [Google Scholar] [CrossRef]
- FCFP, N.J.B.M.C. Normal-weight central obesity. Can. Fam. Physician 2019, 65, 399–408. [Google Scholar]
- Carey, V.J.; Walters, E.E.; Colditz, G.A.; Solomon, C.G.; Willett, W.C.; Rosner, B.A.; Speizer, F.E.; Manson, J.E. Body fat distribution and risk of non-insulin-dependent diabetes mellitus in women: The nurses’ health study. Am. J. Epidemiol. 1997, 145, 614–619. [Google Scholar] [CrossRef] [PubMed] [Green Version]
- Shuster, A.; Patlas, M.; Pinthus, J.H.; Mourtzakis, M. The clinical importance of visceral adiposity: A critical review of methods for visceral adipose tissue analysis. Br. J. Radiol. 2012, 85, 1–10. [Google Scholar] [CrossRef] [PubMed] [Green Version]
- Peppa, M.; Stefanaki, C.; Papaefstathiou, A.; Boschiero, D.; Dimitriadis, G.; Chrousos, G.P. Bioimpedance analysis vs. DEXA as a screening tool for osteosarcopenia in lean, overweight and obese Caucasian postmenopausal females. Hormones 2017, 16, 181–193. [Google Scholar] [CrossRef] [PubMed] [Green Version]
- Srikanthan, P.; Karlamangla, A.S. Relative muscle mass is inversely associated with insulin resistance and prediabetes. Findings from the Third National Health and Nutrition Examination Survey. J. Clin. Endocrinol. Metab. 2011, 96, 2898–2903. [Google Scholar] [CrossRef] [Green Version]
- Van Marken Lichtenbelt, W.D.; Fogelholm, M. Increased extracellular water compartment, relative to intracellular water compartment, after weight reduction. J. Appl. Physiol. 1999, 87, 294–298. [Google Scholar] [CrossRef] [PubMed] [Green Version]
- Kreidieh, D.; Itani, L.; El Masri, D.; Tannir, H.; Citarella, R.; El Ghoch, M. Association between Sarcopenic Obesity, Type 2 Diabetes, and Hypertension in Overweight and Obese Treatment-Seeking Adult Women. J. Cardiovasc. Dev. Dis. 2018, 5, 51. [Google Scholar] [CrossRef] [Green Version]
- Adedia, D.; Boakye, A.A.; Mensah, D.; Lokpo, S.Y.; Afeke, I.; Duedu, K.O. Comparative assessment of anthropometric and bioimpedence methods for determining adiposity. Heliyon 2020, 6, e05740. [Google Scholar] [CrossRef] [PubMed]
- Lin, T.Y.; Lim, P.S.; Hung, S.C. Impact of Misclassification of Obesity by Body Mass Index on Mortality in Patients with CKD. Kidney Int. Reports 2018, 3, 447–455. [Google Scholar] [CrossRef] [PubMed] [Green Version]
- Bacopoulou, F.; Efthymiou, V.; Landis, G.; Rentoumis, A.; Chrousos, G.P. Waist circumference, waist-to-hip ratio and waist-to-height ratio reference percentiles for abdominal obesity among Greek adolescents. BMC Pediatr. 2015, 15, 1–9. [Google Scholar] [CrossRef] [Green Version]
- Patnaik, L.; Pattnaik, S.; Rao, E.V.; Sahu, T. Validating neck circumference and waist circumference as anthropometric measures of overweight/obesity in adolescents. Indian Pediatr. 2017, 54, 377–380. [Google Scholar] [CrossRef]
- Madden, A.M.; Smith, S. Body composition and morphological assessment of nutritional status in adults: A review of anthropometric variables. J. Hum. Nutr. Diet. 2016, 29, 7–25. [Google Scholar] [CrossRef] [PubMed]
- Andrade, M.D.; de Freitas, M.C.P.; Sakumoto, A.M.; Pappiani, C.; de Andrade, S.C.; Vieira, V.L.; Damasceno, N.R.T. Association of the conicity index with diabetes and hypertension in Brazilian women. Arch. Endocrinol. Metab. 2016, 60, 436–442. [Google Scholar] [CrossRef] [Green Version]
- Ling, C.H.Y.; de Craen, A.J.M.; Slagboom, P.E.; Gunn, D.A.; Stokkel, M.P.M.; Westendorp, R.G.J.; Maier, A.B. Accuracy of direct segmental multi-frequency bioimpedance analysis in the assessment of total body and segmental body composition in middle-aged adult population. Clin. Nutr. 2011, 30, 610–615. [Google Scholar] [CrossRef] [Green Version]
- Wei, J.; Liu, X.; Xue, H.; Wang, Y.; Shi, Z. Comparisons of Visceral Adiposity Index, Body Shape Index, Body Mass Index and Waist Circumference and Their Associations with Diabetes Mellitus in Adults. Nutrients 2019, 11, 1580. [Google Scholar] [CrossRef] [Green Version]
- Vecchié, A.; Dallegri, F.; Carbone, F.; Bonaventura, A.; Liberale, L.; Portincasa, P.; Frühbeck, G.; Montecucco, F. Obesity phenotypes and their paradoxical association with cardiovascular diseases. Eur. J. Intern. Med. 2018, 48, 6–17. [Google Scholar] [CrossRef]
- Vandenbroucke, J.P.; Von Elm, E.; Altman, D.G.; Gøtzsche, P.C.; Mulrow, C.D.; Pocock, S.J.; Poole, C.; Schlesselman, J.J.; Egger, M. Strengthening the Reporting of Observational Studies in Epidemiology (STROBE): Explanation and elaboration. PLoS Med. 2007, 4, 1628–1654. [Google Scholar] [CrossRef] [PubMed] [Green Version]
- Sharp, S.J.; Poulaliou, M.; Thompson, S.G.; White, I.R.; Wood, A.M. A review of published analyses of case-cohort studies and recommendations for future reporting. PLoS ONE 2014, 9, e101176. [Google Scholar] [CrossRef]
- Champely, S. Basic Functions for Power Analysis. R Package. 2020. Available online: https://cran.r-project.org/web/packages/pwr/index.html (accessed on 6 November 2021).
- Kyle, U.G.; Bosaeus, I.; De Lorenzo, A.D.; Deurenberg, P.; Elia, M.; Gómez, J.M.; Heitmann, B.L.; Kent-Smith, L.; Melchior, J.C.; Pirlich, M.; et al. Bioelectrical impedance analysis—Part II: Utilization in clinical practice. Clin. Nutr. 2004, 23, 1430–1453. [Google Scholar] [CrossRef]
- Mulasi, U.; Kuchnia, A.J.; Cole, A.J.; Earthman, C.P. Bioimpedance at the bedside: Current applications, limitations, and opportunities. Nutr. Clin. Pract. 2015, 30, 180–193. [Google Scholar] [CrossRef] [Green Version]
- Ugras, S. Evaluating of altered hydration status on effectiveness of body composition analysis using bioelectric impedance analysis. Libyan J. Med. 2020, 15, 1741904. [Google Scholar] [CrossRef] [PubMed] [Green Version]
- The American Journal of Clinical Nutrition Page. Available online: https://academic.oup.com/ajcn/article/64/3/524S/4651674 (accessed on 6 November 2021).
- Weir, C.B.; Jan, A. BMI Classification Percentile and Cut off Points; StatPearls Publishing: Treasure Island, FL, USA, 2021. Available online: https://pubmed.ncbi.nlm.nih.gov/31082114/ (accessed on 6 November 2021).
- Ostchega, Y.; Zhang, G.; Gu, Q.; Isfahani, N.S.; Hughes, J.P.; Schall, J. Developing equations to predict waist circumference measurements based on the National Heart, Lung, and Blood Institute method from the World Health Organization method. Ann. Epidemiol. 2021, 53, 21–26.e1. [Google Scholar] [CrossRef]
- Browning, L.M.; Hsieh, S.D.; Ashwell, M. A systematic review of waist-to-height ratio as a screening tool for the prediction of cardiovascular disease and diabetes: 05 could be a suitable global boundary value. Nutr. Res. Rev. 2010, 23, 247–269. [Google Scholar] [CrossRef] [Green Version]
- Ashwell, M.; Hsieh, S.D. Six reasons why the waist-to-height ratio is a rapid and effective global indicator for health risks of obesity and how its use could simplify the international public health message on obesity. Int. J. Food Sci. Nutr. 2005, 56, 303–307. [Google Scholar] [CrossRef] [PubMed]
- Ferreira, F.G.; Juvanhol, L.L.; Da Silva, D.C.G.; Longo, G.Z. Visceral adiposity index is a better predictor of unhealthy metabolic phenotype than traditional adiposity measures: Results from a population-based study. Public Health Nutr. 2019, 22, 1545–1554. [Google Scholar] [CrossRef] [Green Version]
- Hingorjo, M.R.; Qureshi, M.A.; Mehdi, A. Neck circumference as a useful marker of obesity: A comparison with body mass index and waist circumference. J. Pak. Med. Assoc. 2012, 62, 36–40. [Google Scholar] [PubMed]
- Opdam, M.H.; Koekkoek, K.W.A.C.; Boeije, T.; Mullaart, N.; Van Zanten, A.R.H.; Bellou, A. Mid-arm circumference method is invalid to estimate the body weight of elderly Emergency Department patients in the Netherlands. Medicine 2019, 98, 1–5. [Google Scholar] [CrossRef]
- Tang, A.M.; Chung, M.; Dong, K.R.; Bahwere, P.; Bose, K.; Chakraborty, R.; Charlton, K.; Das, P.; Ghosh, M.; Hossain, M.I.; et al. Determining a global mid-upper arm circumference cut-off to assess underweight in adults (men and non-pregnant women). Public Health Nutr. 2020, 23, 3104–3113. [Google Scholar] [CrossRef]
- Franssen, F.M.E.; Rutten, E.P.A.; Groenen, M.T.J.; Vanfleteren, L.E.; Wouters, E.F.M.; Spruit, M.A. New reference values for body composition by bioelectrical impedance analysis in the general population: Results from the UK biobank. J. Am. Med. Dir. Assoc. 2014, 15, 448.e1–448.e6. [Google Scholar] [CrossRef] [PubMed]
- Prado, C.M.M.; Wells, J.C.K.; Smith, S.R.; Stephan, B.C.M.; Siervo, M. Sarcopenic obesity: A Critical appraisal of the current evidence. Clin. Nutr. 2012, 31, 583–601. [Google Scholar] [CrossRef] [PubMed]
- Krakauer, N.Y.; Krakauer, J.C. A new body shape index predicts mortality hazard independently of body mass index. PLoS ONE 2012, 7, e39504. [Google Scholar] [CrossRef]
- Gomez-Peralta, F.; Abreu, C.; Cruz-Bravo, M.; Alcarria, E.; Gutierrez-Buey, G.; Krakauer, N.Y.; Krakauer, J.C. Relationship between “a body shape index (ABSI)” and body composition in obese patients with type 2 diabetes. Diabetol. Metab. Syndr. 2018, 10, 1–8. [Google Scholar] [CrossRef]
- Hoermann, R.; Fui, M.N.T.; Krakauer, J.C.; Krakauer, N.Y.; Grossmann, M. A body shape index (ABSI) reflects body composition changes in response to testosterone treatment in obese men. Int. J. Obes. 2019, 43, 2210–2216. [Google Scholar] [CrossRef] [PubMed]
- R Core Team a Language and Environment for Statistical Computing; R Foundation for Statistical Computing: Vienna, Austria, 2020.
- Venables, W.N.; Ripley, B.D. NoModern Applied Statistics with S, 4th ed.; Springer: New York, NY, USA, 2002. [Google Scholar]
- Hornik, T.; Hornik, K. Exact Distributions for Rank and Permutation Tests. R Package Version. 2021. Available online: https://cran.r-project.org/web/packages/exactRankTests/index.html (accessed on 6 November 2021).
- Yoshida, K.; Bartel, A.; Chipman, J.J.; Bohn, J.; McGowan, L.D.; Barrett, M.; Christensen, R.H.B. Tableone: Create “Table 1” to Describe Baseline Characteristics. R Package Version. 2020. Available online: https://cran.r-project.org/web/packages/tableone/index.html (accessed on 6 November 2021).
- Mukaka, M.M. Statistics corner: A guide to appropriate use of correlation coefficient in medical research. Malawi Med. J. 2012, 24, 69–71. [Google Scholar] [PubMed]
- Radetti, G.; Fanolla, A.; Grugni, G.; Lupi, F.; Tamini, S.; Cicolini, S.; Sartorio, A. The role of different indexes of adiposity and body composition for the identification of metabolic syndrome in women with obesity. J. Clin. Med. 2021, 10, 1975. [Google Scholar] [CrossRef]
- Radetti, G.; Fanolla, A.; Lupi, F.; Sartorio, A.; Grugni, G. Accuracy of different indexes of body composition and adiposity in identifying metabolic syndrome in adult subjects with Prader-Willi syndrome. J. Clin. Med. 2020, 9, 1646. [Google Scholar] [CrossRef]
- Radetti, G.; Fanolla, A.; Grugni, G.; Lupi, F.; Sartorio, A. Indexes of adiposity and body composition in the prediction of metabolic syndrome in obese children and adolescents: Which is the best? Nutr. Metab. Cardiovasc. Dis. 2019, 29, 1189–1196. [Google Scholar] [CrossRef] [PubMed]
- Piqueras, P.; Ballester, A.; Durá-Gil, J.V.; Martinez-Hervas, S.; Redón, J.; Real, J.T. Anthropometric Indicators as a Tool for Diagnosis of Obesity and Other Health Risk Factors: A Literature Review. Front. Psychology 2021, 12, 631179. [Google Scholar] [CrossRef] [PubMed]
- Kuźnar-Kamińska, B.; Grabicki, M.; Trafas, T.; Szulińska, M.; Cofta, S.; Piorunek, T.; Brajer-Luftmann, B.; Nowicka, A.; Bromińska, B.; Batura-Gabryel, H. Body composition, anthropometric indices and hydration status of obstructive sleep apnea patients: Can cachexia coexist with obesity? Adv. Exp. Med. Biol. 2017, 1020, 43–51. [Google Scholar] [CrossRef] [PubMed]
- Mattoo, T.K.; Lu, H.; Ayers, E.; Thomas, R. Total body water by BIA in children and young adults with normal and excessive weight. PLoS ONE 2020, 15, e0239212. [Google Scholar] [CrossRef] [PubMed]
- Kashiwazaki, H.; Dejima, Y.; Orias-Rivera, J.; Coward, W.A. Prediction of total body water and fatness from anthropometry: Importance of skinfold measurements. Am. J. Hum. Biol. 1996, 8, 331–340. [Google Scholar] [CrossRef]
- Raison, J.; Achimastos, A.; Simon, A.; Safar, M. Extracellular and ltiterstitial Fluid Volume in Obesity With atid Without Associated Systemic Hypertension A lteration in partition of fluid volumes in overweight. Am. J. Cardiol. 1988, 57, 223–228. [Google Scholar] [CrossRef]
- Vilhena, D.S.; Fernandes, D.F.; Santos, R.C.; Azevedo Albuquerque, A.P.; Materko, W. Comparison of the Relative Body Fat By Anthropometry, Skin Fold and Bioimpedance in University Students Living in Macapá/Ap. Coleção Pesquisa em Educação Física 2020, 18, 17–24. [Google Scholar]
- Pelegrini, A.; Silva, D.A.S.; de Lima Silva, J.M.F.; Grigollo, L.; Petroski, E.L. Anthropometric indicators of obesity in the prediction of high body fat in adolescents. Rev. Paul. Pediatr. 2015, 33, 56–62. [Google Scholar] [CrossRef] [Green Version]
- Pereira, P.F.; Serrano, H.M.S.; Carvalho, G.Q.; Ribeiro, S.M.R.; Peluzio, M.D.C.G.; Franceschini, S.D.C.C.; Priore, S.E. Medidas de localização da gordura corporal: Uma avaliação da colinearidade com massa corporal, adiposidade e estatura em adolescentes do sexo feminino. Rev. Paul. Pediatr. 2015, 33, 63–71. [Google Scholar] [CrossRef] [Green Version]
- Sedlmeier, A.M.; Baumeister, S.E.; Weber, A.; Fischer, B.; Thorand, B.; Ittermann, T.; Dörr, M.; Felix, S.B.; Völzke, H.; Peters, A.; et al. Relation of body fat mass and fat-free mass to total mortality: Results from 7 prospective cohort studies. Am. J. Clin. Nutr. 2021, 113, 639–646. [Google Scholar] [CrossRef] [PubMed]

| Parameters (Median [IQR]) or (%) | Normal Weight (n = 15) | Overweight (n = 24) | Obese (n = 29) | p-Value |
|---|---|---|---|---|
| Sex = M | 3 (20.0%) | 7 (29.2%) | 10 (34.5%) | 0.607 |
| Age (years) | 36.00 [33.50, 41.50] | 45.50 [40.50, 52.50] | 44.00 [37.00, 51.00] | 0.078 |
| Body mass (kg) | 60.50 [53.20, 63.75] *,ᵜ | 78.35 [68.78, 80.88] ᵝ | 92.80 [79.80, 109.30] | <0.001 |
| Height (m) | 1.66 [1.58, 1.71] | 1.67 [1.60, 1.70] | 1.64 [1.57, 1.73] | 0.909 |
| BMI (kg/m2) | 22.10 [20.70, 23.15] *,ᵜ | 27.25 [26.45, 28.15] ᵝ | 33.80 [32.00, 36.10] | <0.001 |
| NC (cm) | 31.57 [30.70, 33.06] *,ᵜ | 34.15 [33.17, 37.52] | 36.75 [34.30, 40.45] | <0.001 |
| MAC (cm) | 27.25 [26.61, 29.60] *,ᵜ | 32.25 [30.28, 33.16] ᵝ | 36.20 [34.20, 40.23] | <0.001 |
| WC (cm) | 71.12 [69.14, 75.72] *,ᵜ | 82.50 [79.38, 88.50] ᵝ | 100.80 [93.10, 103.38] | <0.001 |
| HC (cm) | 94.95 [92.50, 97.22] *,ᵜ | 103.17 [99.90, 105.50] ᵝ | 114.25 [110.09, 121.44] | <0.001 |
| WHR | 0.75 [0.72, 0.78] *,ᵜ | 0.80 [0.78, 0.86] | 0.85 [0.78, 0.93] | <0.001 |
| C-index | 1.10 [1.08, 1.11] ᵜ | 1.14 [1.10, 1.18] | 1.20 [1.14, 1.25] | 0.002 |
| ABSI | 0.07 [0.07, 0.07] | 0.07 [0.07, 0.07] | 0.07 [0.07, 0.07] | 0.953 |
| FM/FFM | 0.38 [0.31, 0.45] *,ᵜ | 0.60 [0.49, 0.64] ᵝ | 0.82 [0.65, 0.92] | <0.001 |
| TBW (kg) | 30.90 [28.20, 33.15] ᵜ | 35.75 [30.85, 39.68] | 38.00 [32.40, 44.40] | 0.007 |
| Proteins (kg) | 8.20 [7.60, 8.90] ᵜ | 9.50 [8.28, 10.62] | 10.40 [8.70, 12.10] | 0.006 |
| Minerals (kg) | 3.10 [2.76, 3.33] ᵜ | 3.51 [2.99, 3.75] | 3.53 [3.04, 4.31] | 0.024 |
| FM (kg) | 16.10 [13.80, 18.45] * | 26.25 [24.23, 30.40] ᵝ | 39.10 [34.60, 47.90] | <0.001 |
| Lean mass (kg) | 39.70 [36.30, 42.60] ᵜ | 45.85 [39.70, 51.08] | 49.00 [41.60, 57.20] | 0.007 |
| FFM (kg) | 42.20 [38.55, 45.35] ᵜ | 48.70 [42.25, 54.20] | 51.90 [44.20, 60.70] | 0.008 |
| BFP (%) | 27.80 [23.60, 30.85] * | 37.60 [32.85, 39.05] ᵝ | 45.00 [39.40, 48.00] | <0.001 |
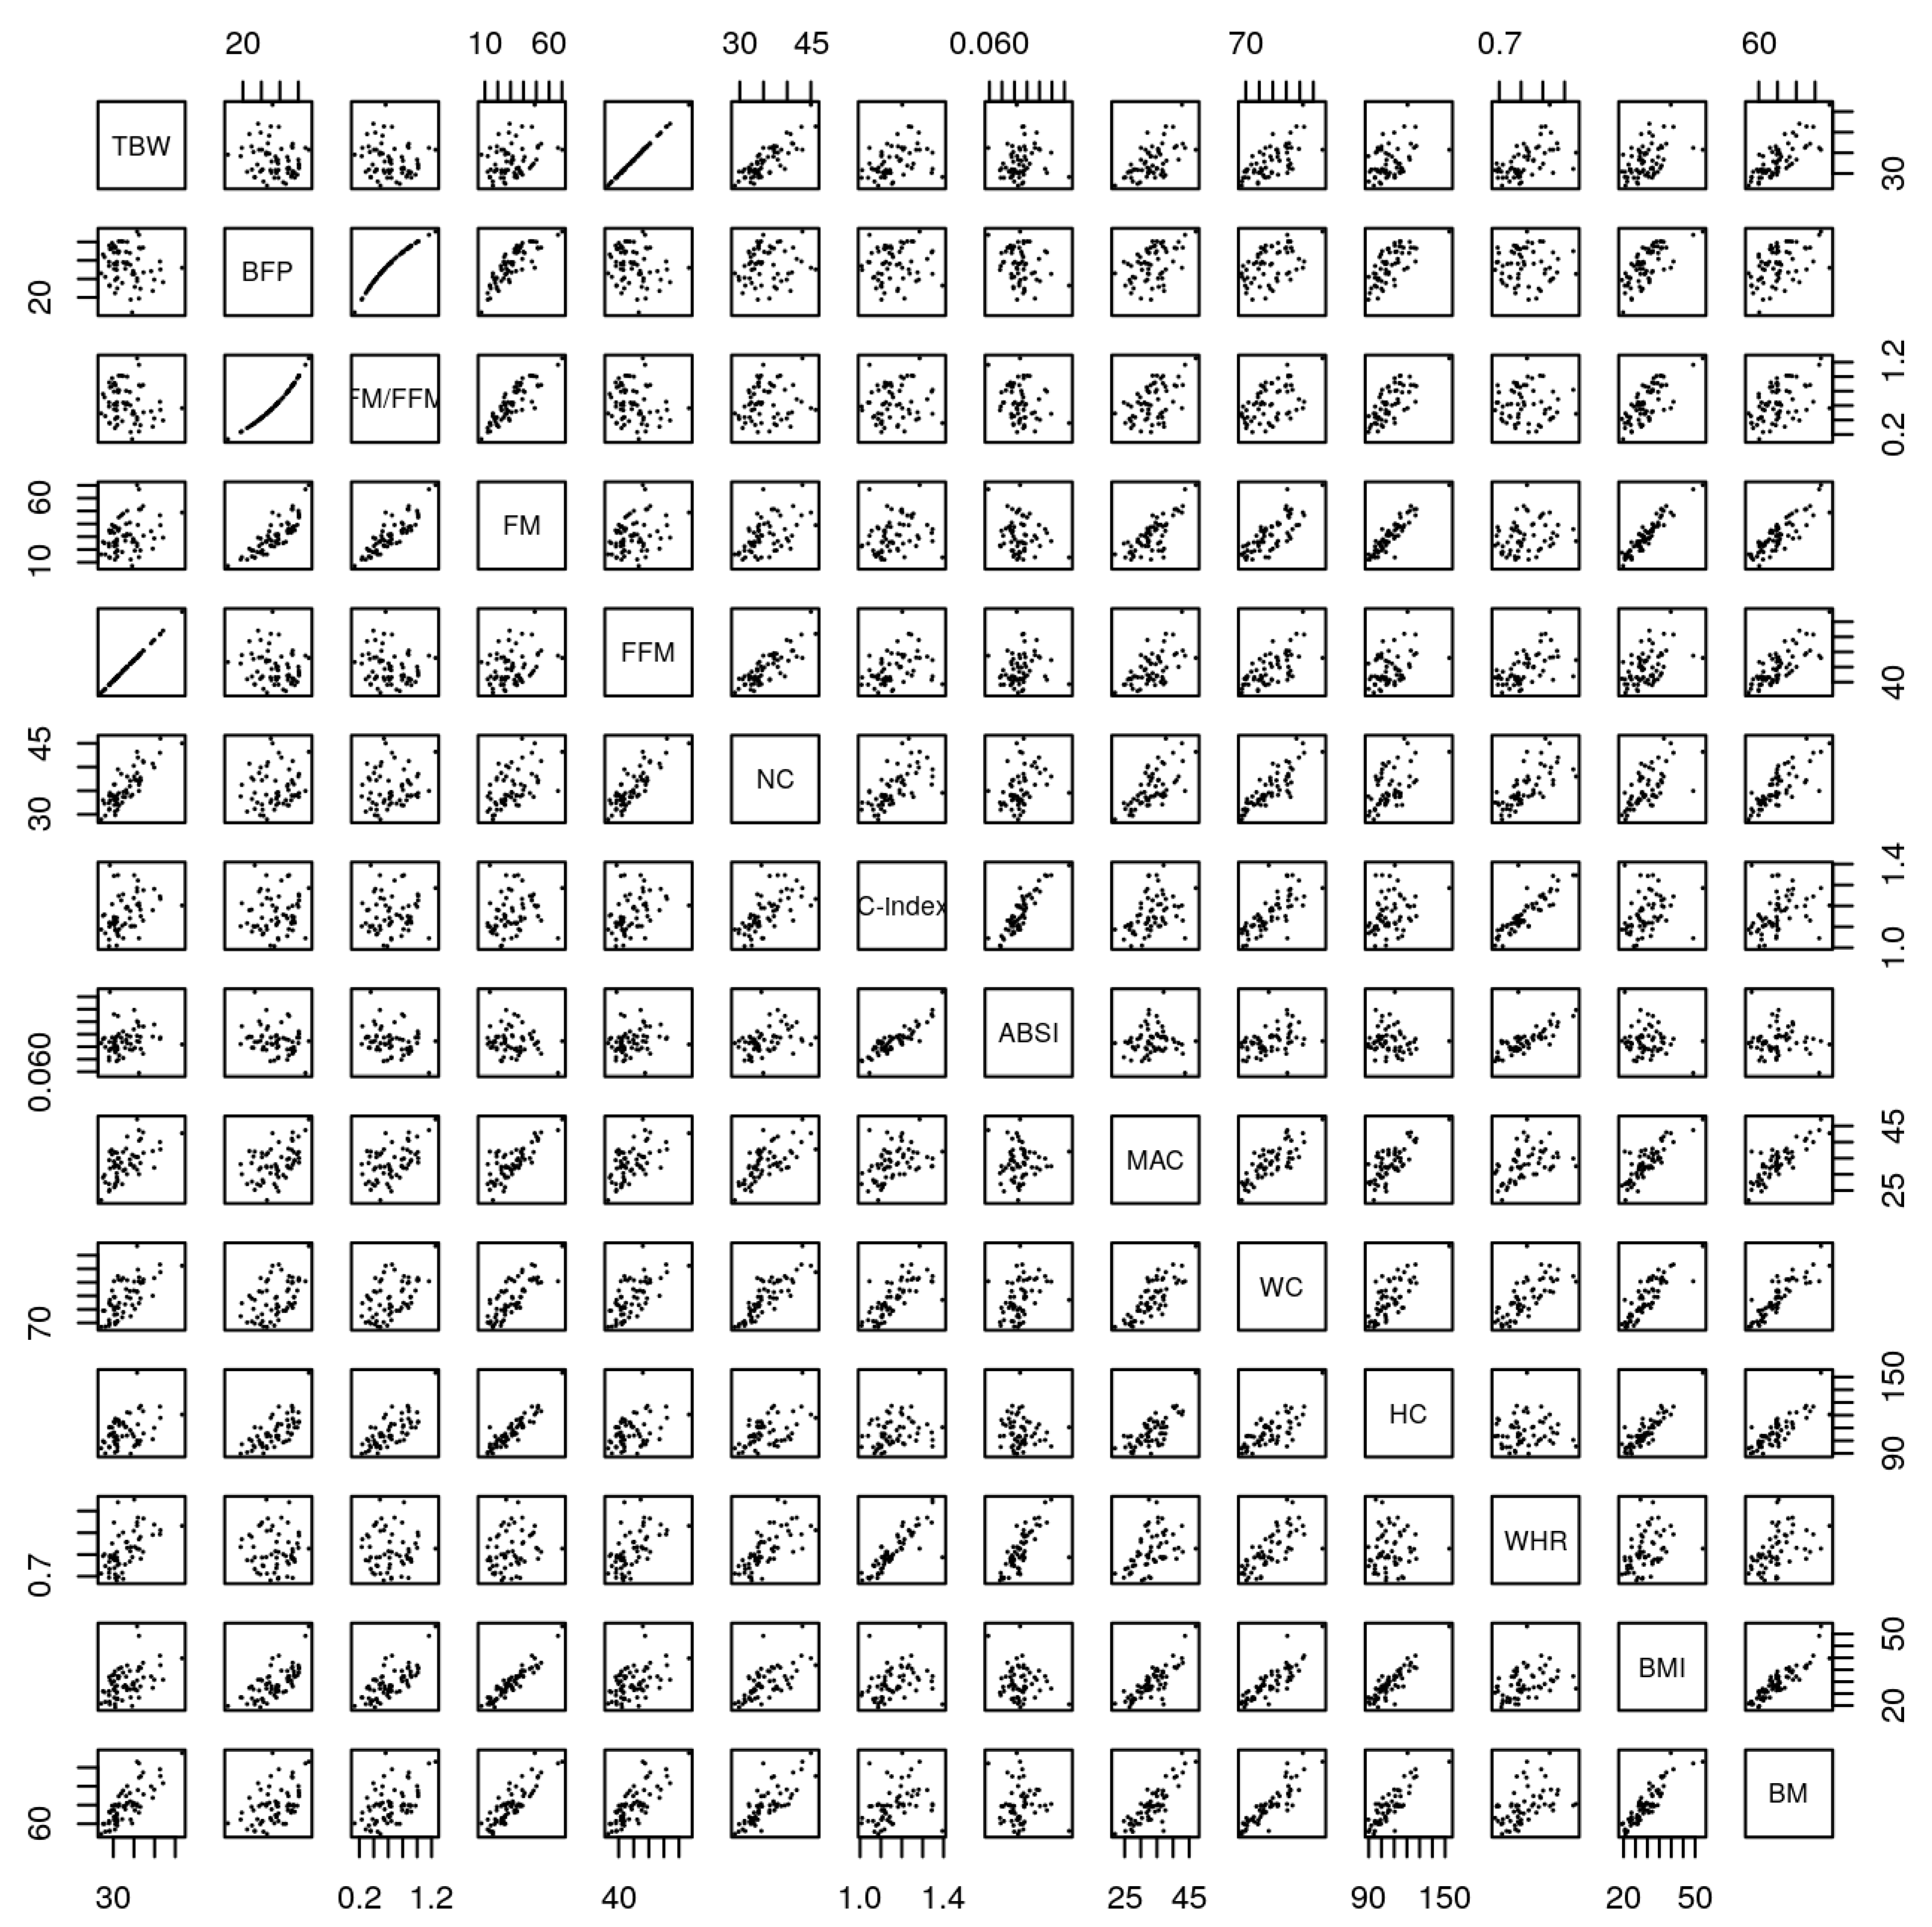
| TBW | BFP | FM/FFM | FM | FFM | NC | C-Index | ABSI | MAC | WC | HC | BMI | BM | WHR | |
|---|---|---|---|---|---|---|---|---|---|---|---|---|---|---|
| TBW | - | −0.18 | −0.17 | 0.33 | 1.00 | 0.84 | 0.36 | 0.13 | 0.59 | 0.66 | 0.35 | 0.48 | 0.78 | 0.56 |
| BFP | ns | - | 0.98 | 0.84 | −0.18 | 0.12 | 0.07 | −0.27 | 0.47 | 0.48 | 0.45 | 0.70 | 0.46 | −0.03 |
| FM/FFM | ns | c | - | 0.87 | −0.17 | 0.14 | 0.08 | −0.27 | 0.51 | 0.50 | 0.45 | 0.74 | 0.49 | −0.02 |
| FM | a | c | c | - | 0.32 | 0.51 | 0.23 | −0.21 | 0.77 | 0.78 | 0.63 | 0.94 | 0.85 | 0.22 |
| FFM | c | ns | ns | a | - | 0.83 | 0.35 | 0.12 | 0.59 | 0.66 | 0.35 | 0.47 | 0.77 | 0.56 |
| NC | c | ns | ns | c | c | - | 0.62 | 0.33 | 0.68 | 0.85 | 0.38 | 0.64 | 0.78 | 0.70 |
| C-index | a | ns | ns | ns | a | c | - | 0.89 | 0.39 | 0.73 | 0.17 | 0.29 | 0.34 | 0.84 |
| ABSI | ns | a | a | ns | ns | a | c | - | 0.03 | 0.35 | −0.10 | −0.17 | −0.07 | 0.70 |
| MAC | c | b | c | c | c | c | a | ns | - | 0.79 | 0.60 | 0.82 | 0.83 | 0.42 |
| WC | c | b | c | c | c | c | c | a | c | - | 0.52 | 0.84 | 0.87 | 0.72 |
| HC | a | b | b | c | a | a | ns | ns | c | c | - | 0.63 | 0.61 | 0.05 |
| BMI | c | c | c | c | c | c | a | ns | c | c | c | - | 0.89 | 0.37 |
| BM | c | c | c | c | c | c | a | ns | c | c | c | c | - | 0.46 |
| WHR | c | ns | ns | ns | c | c | c | c | c | c | ns | ns | b | - |
| Multiple Linear Regression, Dependent Variable TBW | Multiple Linear Regression, Dependent Variable FM | ||||
|---|---|---|---|---|---|
| Variables | Coefficients | p-value | Variables | Coefficients | p-value |
| (Intercept) | −22.10 | 0.00000546 | (Intercept) | 29.50 | 0.00000617 |
| NC | 0.99 | 0.000000126 | NC | −1.33 | 0.000000128 |
| ‘C-index’ | −198.51 | 2.00E-16 | ‘C-index’ | 275.00 | 2.00E-16 |
| ABSI | 2660.69 | 5.13E-15 | ABSI | −3685.00 | 1.71E-15 |
| WHR | 29.25 | 0.0000336 | WHR | −40.20 | 0.0000237 |
| BM | 0.47 | 1.28E-15 | BM | 0.35 | 5.49E-08 |
| Adjusted R-squared: 0.9322 | Adjusted R-squared: 0.9506 | ||||
| Multiple linear regression, dependent variable BFP | Multiple linear regression, dependent variable FFM | ||||
| Variables | Coefficients | p-value | Variables | Coefficients | p-value |
| (Intercept) | 126.35 | 4.07E-09 | (Intercept) | −29.54 | 0.00000602 |
| NC | −1.51 | 3.39E-08 | NC | 1.33 | 0.000000128 |
| ‘C-index’ | 656.62 | 0.00000034 | ‘C-index’ | −275.15 | 2.00E-16 |
| ABSI | −9468.26 | 0.00000063 | ABSI | 3687.07 | 1.66E-15 |
| WHR | −62.14 | 0.000143 | WHR | 40.24 | 0.0000233 |
| BMI | −2.13 | 0.003251 | BM | 0.65 | 4.13E-16 |
| Adjusted R-squared: 0.839 | Adjusted R-squared: 0.934 | ||||
| Multiple linear regression, dependent variable FM/FFM | |||||
| Variables | Coefficients | p-value | |||
| (Intercept) | 1.58 | 1.53 × 10⁻¹¹ | |||
| NC | −0.05 | 8.33 × 10⁻¹² | |||
| ‘C-index’ | 8.53 | 2.00 × 10⁻¹⁶ | |||
| ABSI | −117.00 | 2.00 × 10⁻¹⁶ | |||
| WHR | −0.89 | 0.00205 | |||
| Adjusted R-squared: 0.8577 | |||||
Publisher’s Note: MDPI stays neutral with regard to jurisdictional claims in published maps and institutional affiliations. |
© 2021 by the authors. Licensee MDPI, Basel, Switzerland. This article is an open access article distributed under the terms and conditions of the Creative Commons Attribution (CC BY) license (https://creativecommons.org/licenses/by/4.0/).
Share and Cite
da Cunha de Sá-Caputo, D.; Sonza, A.; Coelho-Oliveira, A.C.; Pessanha-Freitas, J.; Reis, A.S.; Francisca-Santos, A.; dos Anjos, E.M.; Paineiras-Domingos, L.L.; de Rezende Bessa Guerra, T.; da Silva Franco, A.; et al. Evaluation of the Relationships between Simple Anthropometric Measures and Bioelectrical Impedance Assessment Variables with Multivariate Linear Regression Models to Estimate Body Composition and Fat Distribution in Adults: Preliminary Results. Biology 2021, 10, 1209. https://doi.org/10.3390/biology10111209
da Cunha de Sá-Caputo D, Sonza A, Coelho-Oliveira AC, Pessanha-Freitas J, Reis AS, Francisca-Santos A, dos Anjos EM, Paineiras-Domingos LL, de Rezende Bessa Guerra T, da Silva Franco A, et al. Evaluation of the Relationships between Simple Anthropometric Measures and Bioelectrical Impedance Assessment Variables with Multivariate Linear Regression Models to Estimate Body Composition and Fat Distribution in Adults: Preliminary Results. Biology. 2021; 10(11):1209. https://doi.org/10.3390/biology10111209
Chicago/Turabian Styleda Cunha de Sá-Caputo, Danúbia, Anelise Sonza, Ana Carolina Coelho-Oliveira, Juliana Pessanha-Freitas, Aline Silva Reis, Arlete Francisca-Santos, Elzi Martins dos Anjos, Laisa Liane Paineiras-Domingos, Thais de Rezende Bessa Guerra, Amanda da Silva Franco, and et al. 2021. "Evaluation of the Relationships between Simple Anthropometric Measures and Bioelectrical Impedance Assessment Variables with Multivariate Linear Regression Models to Estimate Body Composition and Fat Distribution in Adults: Preliminary Results" Biology 10, no. 11: 1209. https://doi.org/10.3390/biology10111209
APA Styleda Cunha de Sá-Caputo, D., Sonza, A., Coelho-Oliveira, A. C., Pessanha-Freitas, J., Reis, A. S., Francisca-Santos, A., dos Anjos, E. M., Paineiras-Domingos, L. L., de Rezende Bessa Guerra, T., da Silva Franco, A., Xavier, V. L., Barbosa e Silva, C. J., Moura-Fernandes, M. C., Mendonça, V. A., Rodrigues Lacerda, A. C., da Rocha Pinheiro Mulder, A., Seixas, A., Sartorio, A., Taiar, R., & Bernardo-Filho, M. (2021). Evaluation of the Relationships between Simple Anthropometric Measures and Bioelectrical Impedance Assessment Variables with Multivariate Linear Regression Models to Estimate Body Composition and Fat Distribution in Adults: Preliminary Results. Biology, 10(11), 1209. https://doi.org/10.3390/biology10111209