Abstract
This paper studies the addition of fibers from end-of-life tires to commercial mortar mixtures. Two different types of mortar, one lime-plastic and other cement-fluid, are mixed with different percentage of fibers ranging from 0% to 1%. The changes in bulk density, consistency, compressive and flexural strength, dynamic Young modulus and water absorption are studied. According to the results, consistency is the property that shows more relevant changes for an addition of 0.25% fibers. Consistency is related to workability and affects the water absorption and the Young modulus values. On the contrary, bulk density and mechanical properties did not change with the addition of fibers. The results prove that this fiber, considered a waste from recycling of end-of-life tires, can be used in commercial mixtures without losing strength. On the other hand, mortar workability limits the amount of fibers that can be included in the mixture and this parameter determines the performance of the mortar.
1. Introduction
Mortar is a common building material. It is widely used in new construction and in restoration of historical structures. It plays a very important role, either aesthetically, for plasters, or as a structural component of masonry walls and columns. Mortar exhibits a medium–low compression strength compared to other cement-based materials, like concrete, while its flexural performance is quasi-brittle. Finally, mortar might suffer shrinkage cracking and experience durability problems on the long term, depending on the environmental conditions.
Fiber-reinforcement is a common strategy to increase the mechanical competence of mortars. Fibers reduce the crack growth. They do not avoid cracking, but restrain crack opening and help to develop a sort of ductility through the formation of a post-cracking binding.
There are experiences of using recycled materials as aggregates to modify mortar performance. Saikia and de Brito [1] wrote a complete review about plastic waste used in mortar composition. Some authors have used waste of polyethylene terephthalate (PET) bottles and studied the effect of the sand-to-PET ratio achieving contradictory results; while Ge et al. [2] observed an increase of the mechanical properties of mortar, Iucolano et al. [3] obtained a reduction of the mechanical competence but improved thermal properties. Pereira-de-Oliveira et al. [4] studied acrylic fiber reinforced mortars and found that their durability and their physical and mechanical properties are similar to mortars reinforced with glass or polypropylene fibers. Silva et al. [5] showed an improvement of the strength of mortar composites reinforced with hybrid-blended fibers of polypropylene/polyethylene (PP/PE). Bentchikou et al. [6] used recycled cellulose fibers and Spadea et al. [7] recycled nylon fibers from waste fishing nets. Di Bella et al. [8] studied the effect of natural fibers (kenal and sisal) mixed in plasters and compared their mechanical properties to polypropylene fibers. Izaguirre et al. [9] analyzed the effect of polypropylene fibers in lime-mortars. Le Troëdec et al. [10] compared the effect of chemical treatment of hemp fibers and the mechanical performance of lime mortars.
The end-of-life tires (ELTs) are non-reusable tires. When a tire reaches its end of life-cycle, it enters in a waste management system. Whole ELTs can be used as combustible, producing energy by burning. Alternatively they can be ground and separated into components and can find applications in the civil engineering market. It is common to use ground rubber from ELTs as an aggregate for rubber-modified asphalt, recreational surfaces, including playgrounds, synthetic turf and athletic tracks, flooring and new molded products. Steel wires obtained from ELTs also have some economical interest. Unfortunately, the textiles included in the tire are dumped in a landfill.
The tires have also been tentatively mixed with mortar. In particular, Turantsize et al. [11], and Cintra et al. [12] used rubber aggregates from end-of-life tires. Aziz et al. [13] used rubber crumbs and natural fibers. Vasconcelos et al. [14] used recycled textile fibers resulting from the recycling of used tires and mixed them with cork and gypsum to manufacture a new composite material for partition walls. Finally, Mavridou and Oikonomou [15] used textile fibers from tires with laboratory-made cement mortars.
Our research focuses on the addition of fibers from ELTs to mortars, and the study of the modification of the properties. The main goal is to find an application for the ELT fibers mixed with commercial cement and lime mortars. In order to achieve these results, several mortar mixtures, with two types of mortar and different fiber concentrations, were tested.
2. Experimental Section
2.1. Materials
2.1.1. Fibers
Fibers, constituted by polyester, are one important component of tires. Approximately, it represents around 5% of the tire. The fabric is a high-strength material that contributes significantly to the mechanical performance of the tire.
Figure 1 and Figure 2 show the characterization of final fiber products obtained at the end of the recycling process. During the process of cutting and crushing of the used tires, fibers suffer severe mechanical damage. Using microscopy, it is possible to observe the effects of cutting, smashing and stretching on the fibers (Figure 3). Because fibers are not the main product of recycling, there is no control on the cutting size, producing a large variety of fiber lengths. The average length of the fibers in a normal recycling process is around 1 mm, but shorter and longer fibers are also present in the product, as shown in Table 1. The diameter of the fibers is relatively uniform, in the range of 0.02 mm. Consequently, the aspect ratio changes because of the variable length (Figure 4 and Figure 5). The average aspect ratio is 68, but most fibers have an aspect ratio near to 50.
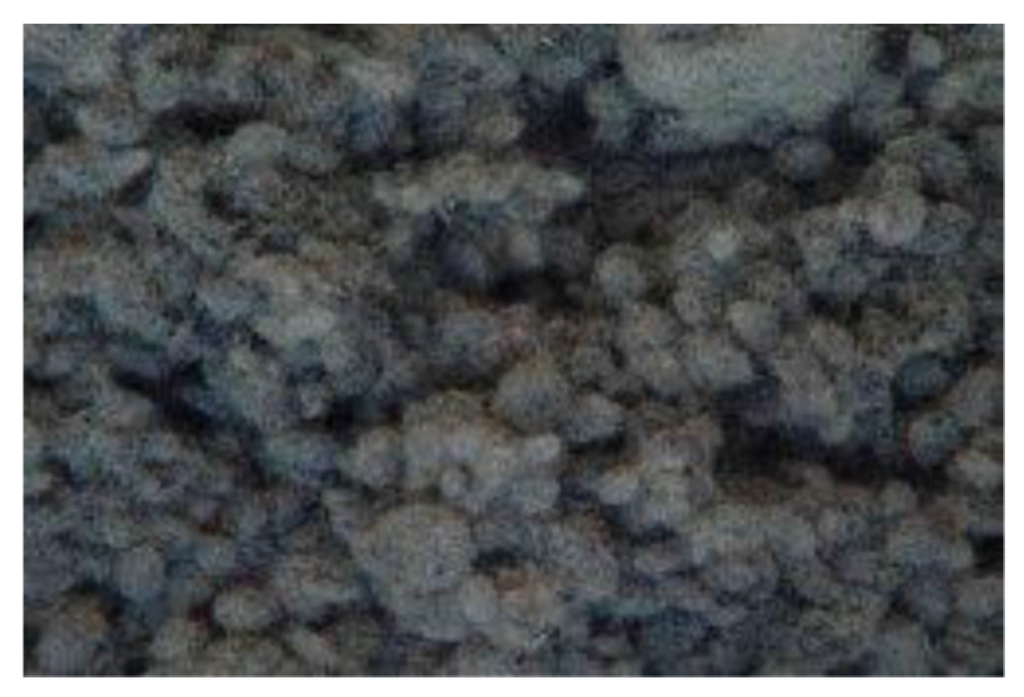
Figure 1.
Resultant fibers after recycling process.
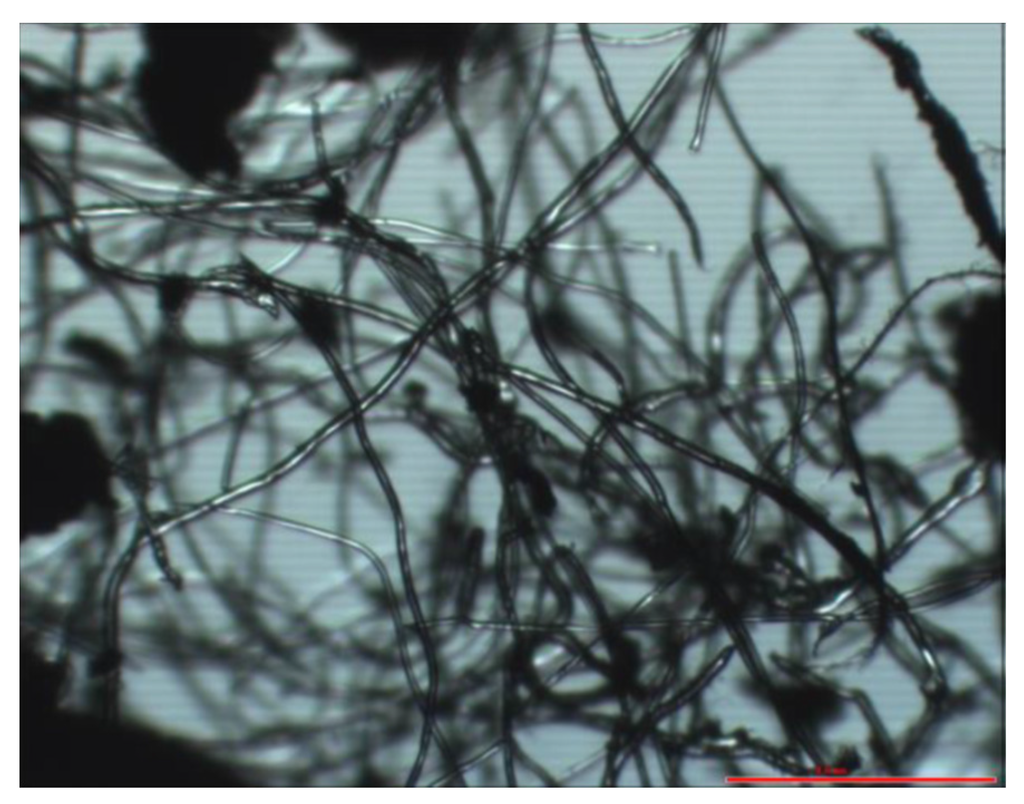
Figure 2.
Fibers with optical microscopy.
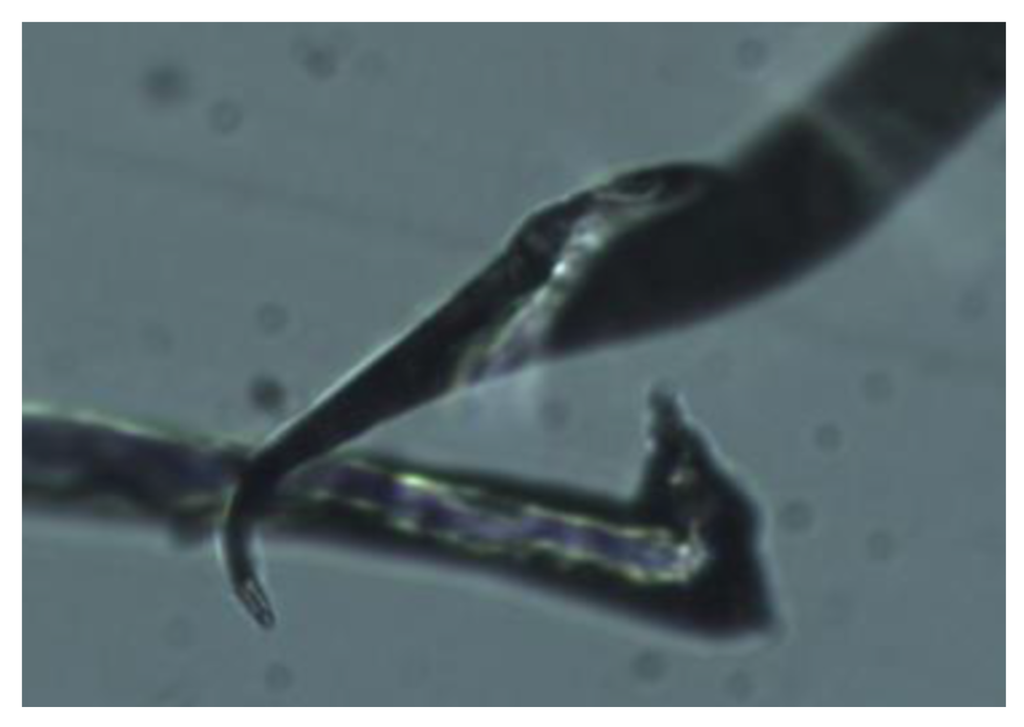
Figure 3.
Detail of damaged fiber.

Table 1.
Fiber lengths.
| Fiber # | Length (mm) | Diameter (mm) | Aspect Ratio |
|---|---|---|---|
| 1 | 1.21 | 0.027 | 45 |
| 2 | 0.71 | 0.015 | 49 |
| 3 | 0.29 | 0.020 | 15 |
| 4 | 0.93 | 0.024 | 38 |
| 5 | 0.63 | 0.015 | 43 |
| 6 | 0.18 | 0.015 | 12 |
| 7 | 3.23 | 0.020 | 165 |
| 8 | 1.30 | 0.015 | 89 |
| 9 | 2.67 | 0.017 | 156 |
| Average values | 1.24 | 0.018 | 68 |
| Median values | 0.93 | 0.017 | 45 |
| Standard deviation | 1.05 | 0.00 | 57 |

Figure 4.
Size of short isolated fibers labeled according Table 1.
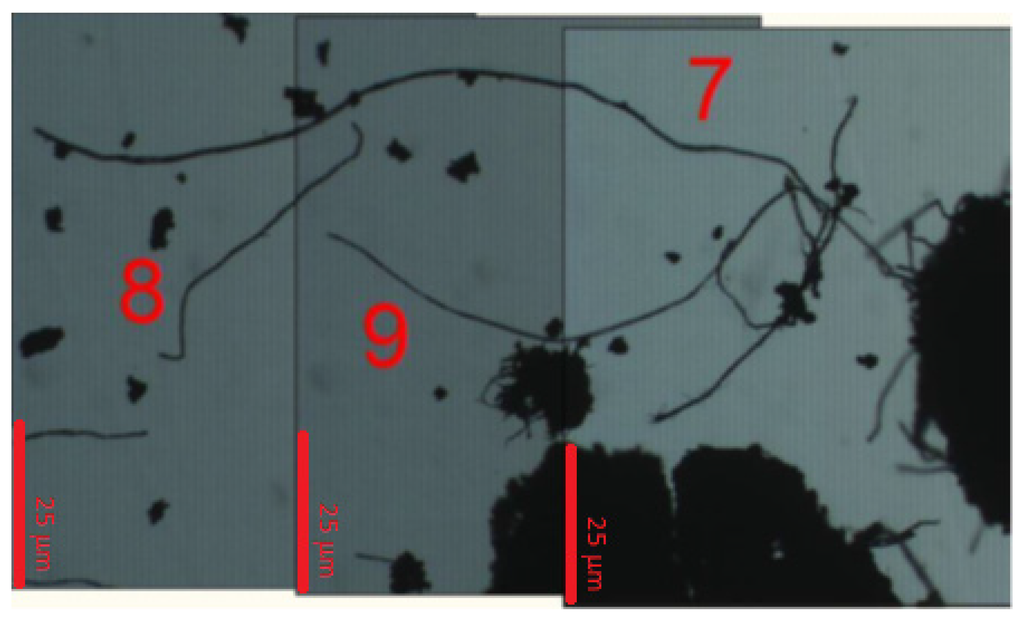
Figure 5.
Size of long isolated fibers labeled according Table 1.
2.1.2. Mortars
Two different types of commercial mortar have been selected in order to determine the influence of the type of mortar on the effectiveness of fiber addition. One of the mortars is cement-based, while the other contains natural hydraulic lime. In practice, cement mortar would be more convenient for restoration of buildings that were built after the Industrial Revolution, while the lime mortar is more suitable for older structures.
Cement mortar (CM) is a dry cement-based mortar fabricated according to the Norm EN 998-2 [16]. It is a multipurpose mortar intended for use in interior and exterior constructions: plasters and walls made of brick or concrete blocks. The mortar consists of Portland cement, sand with a grain size of 0/2 mm, and inorganic additives.
Natural hydraulic lime mortar LM is a two-component, pre-blended, high-ductility mortar. It is made with natural hydraulic lime, eco-pozzolan, natural sand, special additives and synthetic polymers in water dispersion. It is a specially designed for restoration and has good mechanical performance. This mortar is normally applied to strengthen structures.
2.1.3. Mixtures
In order to explore how the fibers affect the mortar properties, different percentages of fibers were used for each of the mortars. During the process of mixing, lime mortar presented limited workability with the addition of 1wt%. of fiber. Therefore, the composition of the mixtures was 0%, 0.25%, 0.5%, 0.75% and 1wt% fiber for both, lime and cement mortar.
Cement mortar was made with a ratio of 0.5 water–cement (w/c). Lime mortar has latex as one of the components and the ratio of w/c was 0.2. Both mixtures were elaborated according to the manufacturers’ specifications.
2.2. Tests and Results
2.2.1. Fresh Mortar
Consistency and bulk density are indicators of the workability of fresh mortar. The measurement of consistency was performed according to European standard EN 1015-3 [17]. Obtained results are shown in Figure 6. Bulk density was determined following European standard EN 1015-6 [18] and the obtained results appear in Figure 7.
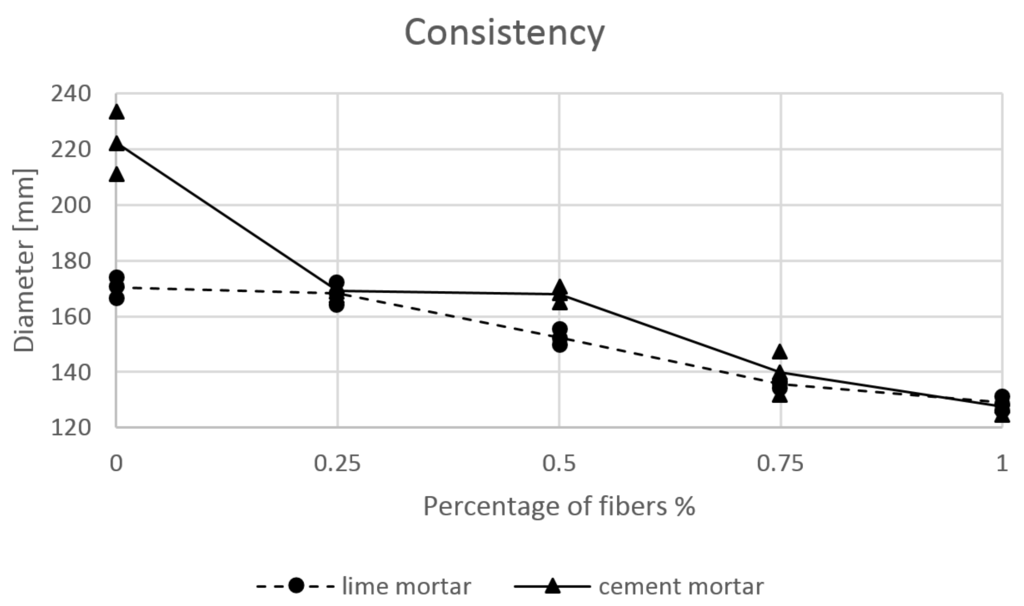
Figure 6.
Consistency measurements.
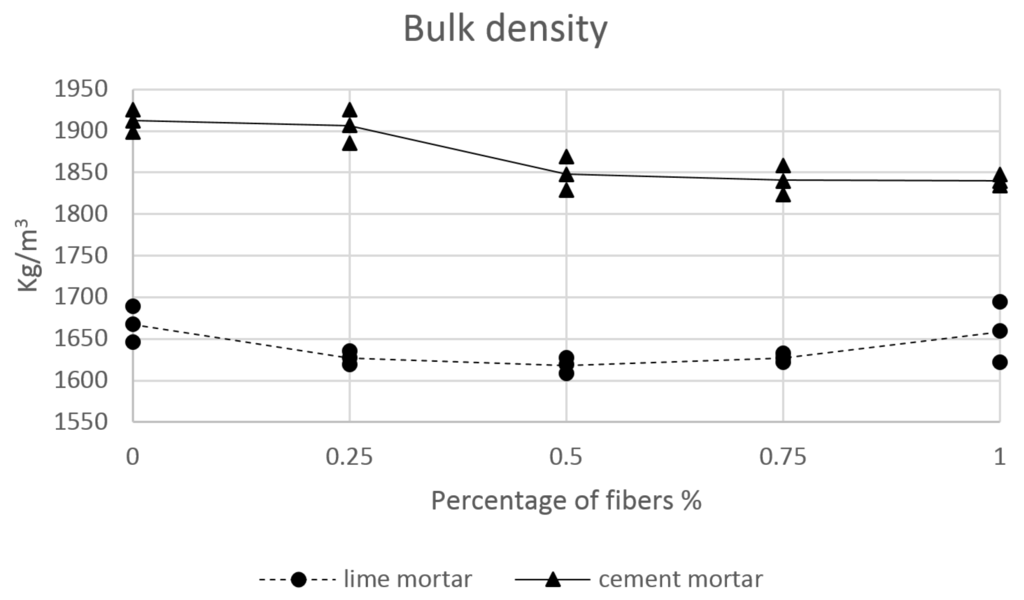
Figure 7.
Bulk density results.
2.2.2. Hardened Mortar
Mechanical performance of hardened mortar was also studied. For this purpose, the specimens were tested at the age of 7 and 28 days after curing in water, as specified by the standard EN 1015-11 [19]. The mechanical properties tested were compressive and flexural strength.
Results obtained in the compression of specimens are shown at Table 2 and Table 3. Figure 8 shows the average results of the compression test for both types of mortar and different percentage of fibers. The results for flexural tests appear in Table 4 and Table 5, and Figure 9 shows the flexural stress average values.

Table 2.
Compression tests for lime mortar.
| Days/% Fiber | Lime Mortar—Compressive Ultimate Stress (N/mm2) | ||||
|---|---|---|---|---|---|
| 0 | 0.25 | 0.5 | 0.75 | 1 | |
| 7 | 8.5 | 6.2 | 9.1 | 8.1 | 9 |
| 7 | 8.3 | 6.4 | 9.2 | 7.9 | 10 |
| 7 | 8.5 | 5.1 | 9.1 | 8.1 | 9 |
| 7 | 7.8 | 6.2 | 7.8 | 9.1 | 8.7 |
| 7 | 8.5 | 6.1 | 7.8 | 9.8 | 10 |
| 7 | 8.7 | 9 | 8 | 8.2 | 8.7 |
| 28 | 16.1 | 12.2 | 14.4 | 16.8 | 16.1 |
| 28 | 15.2 | 13.5 | 14.3 | 15.9 | 16.3 |
| 28 | 15.5 | 15.1 | 14.3 | 16 | 15.1 |
| 28 | 15.4 | 15 | 13.3 | 16 | 15.5 |
| 28 | 15.2 | 14.1 | 13.2 | 17.1 | 15.8 |
| 28 | 16 | 15 | 13.4 | 16.5 | 15.8 |

Table 3.
Compression tests for cement mortar.
| Days/% Fiber | Cement Mortar—Compressive Ultimate Stress (N/mm2) | ||||
|---|---|---|---|---|---|
| 0 | 0.25 | 0.5 | 0.75 | 1 | |
| 7 | 1.3 | 1.4 | 1.3 | 1 | 2.1 |
| 7 | 1.3 | 1.3 | 1.3 | 1 | 2 |
| 7 | 1.2 | 1.4 | 1.3 | 0.9 | 1.8 |
| 7 | 1.1 | 1.3 | 1.5 | 1 | 2.2 |
| 7 | 1.4 | 1.5 | 1.9 | 1.2 | 2.1 |
| 7 | 1.3 | 1.4 | 1.8 | 1 | 2.1 |
| 28 | 2.2 | 2.9 | 2.5 | 2.1 | 3.8 |
| 28 | 2.2 | 3 | 2.4 | 2.3 | 3.2 |
| 28 | 2.3 | 2.3 | 2.4 | 2 | 3.5 |
| 28 | 2.2 | 2.8 | 2.6 | 3.2 | 3 |
| 28 | 2.3 | 2.7 | 2.6 | 3.4 | 3 |
| 28 | 2.4 | 2.3 | 1.8 | 3.4 | 3.1 |

Table 4.
Flexural tests for lime mortar.
| Days/% Fiber | Lime Mortar—Flexural Ultimate Stress (N/mm2) | ||||
|---|---|---|---|---|---|
| 0 | 0.25 | 0.5 | 0.75 | 1 | |
| 7 | 3.9 | 4.7 | 4.7 | 4.4 | 4.1 |
| 7 | 4.3 | 3.8 | 5 | 4.9 | 4.3 |
| 7 | 2.8 | 5.2 | 3.8 | 4.5 | 3.6 |
| 28 | 7.5 | 6.2 | 5.6 | 6.9 | 6.1 |
| 28 | 7.2 | 7.8 | 6.2 | 6.7 | 5.9 |
| 28 | 6.0 | 7.4 | 6.8 | 6.6 | 6.1 |

Table 5.
Flexural tests for cement mortar.
| Days/% Fiber | Cement Mortar—Flexural Ultimate Stress (N/mm2) | ||||
|---|---|---|---|---|---|
| 0 | 0.25 | 0.5 | 0.75 | 1 | |
| 7 | 1.5 | 0.6 | 1.2 | 0.9 | 0.8 |
| 7 | 1.2 | 0.6 | 1.2 | 0.5 | 0.5 |
| 7 | 1.2 | 0.7 | 1.1 | 0.4 | 0.8 |
| 28 | 2.0 | 1.4 | 1.5 | 1.4 | 1.7 |
| 28 | 2.0 | 1.3 | 1.2 | 1.4 | 1.6 |
| 28 | 1.5 | 1.3 | 1.6 | 1.4 | 1.6 |
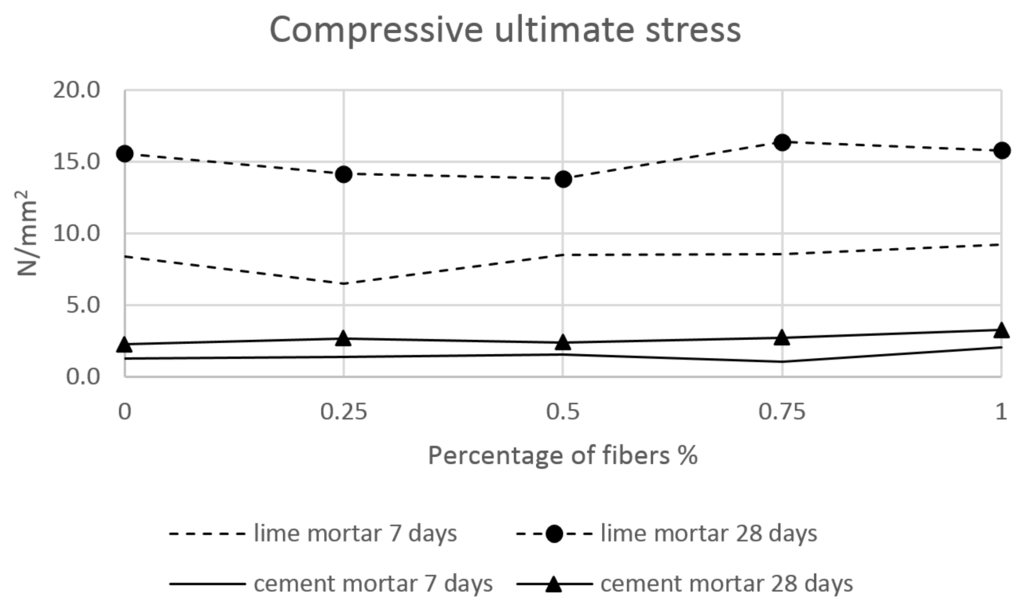
Figure 8.
Compressive test results.
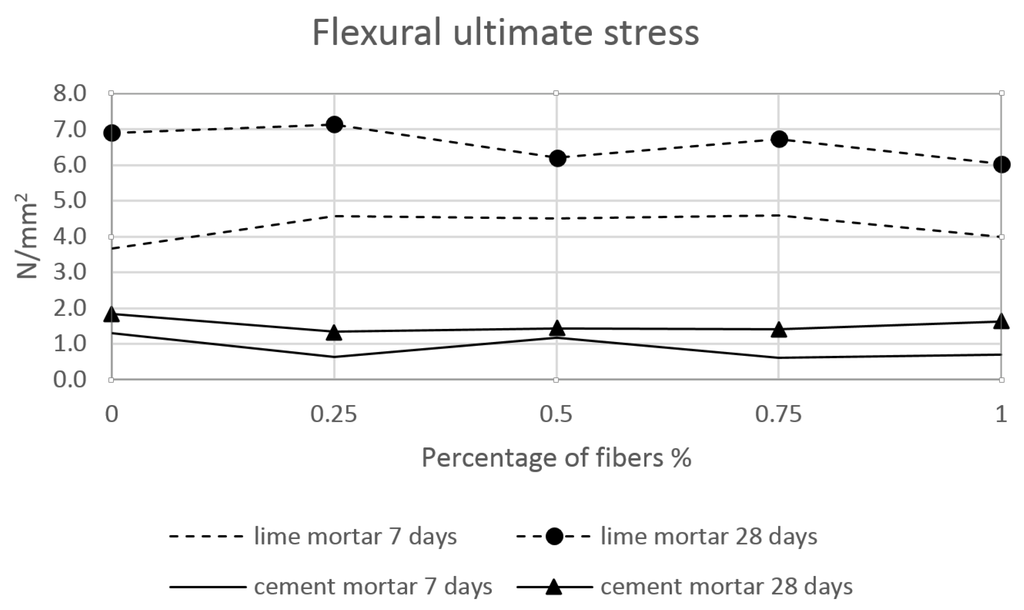
Figure 9.
Flexural test results.
The performance under the compression and flexural tests are shown in Figure 10 and Figure 11. Failure patterns can be observed in Figure 12 and Figure 13.
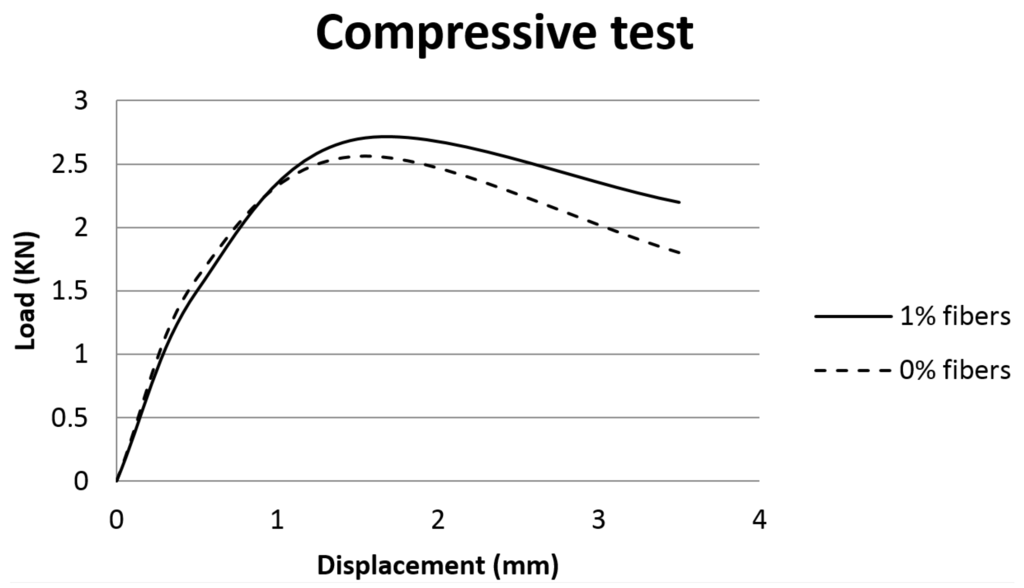
Figure 10.
Load-displacement curve of compression test.
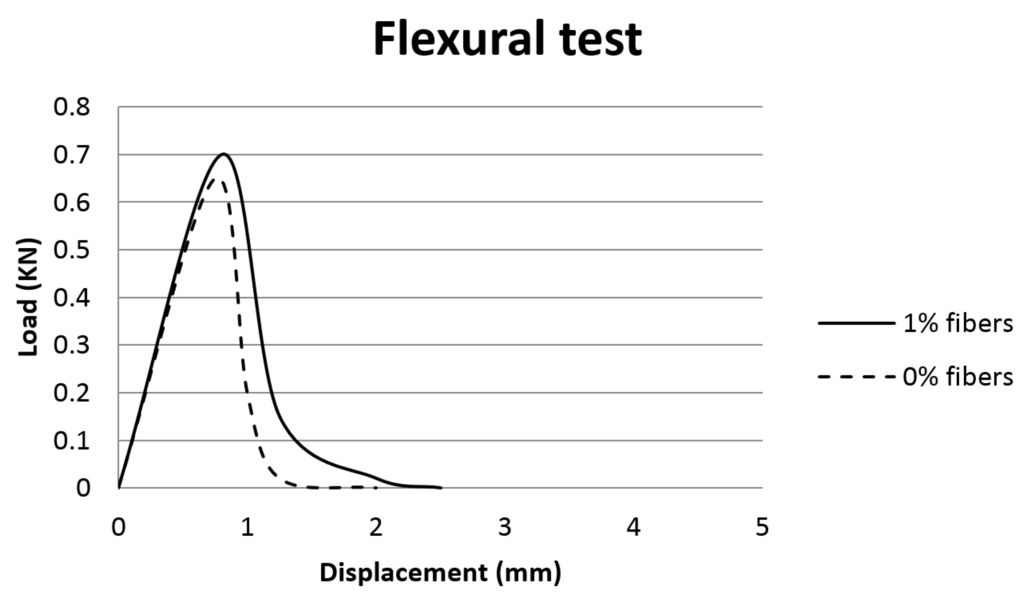
Figure 11.
Load-displacement curve of flexural test.
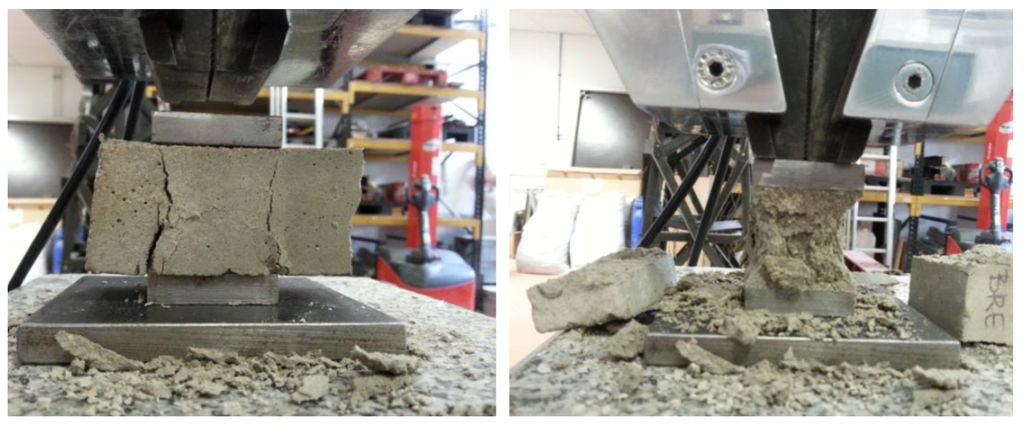
Figure 12.
Failure patterns of compression tests.
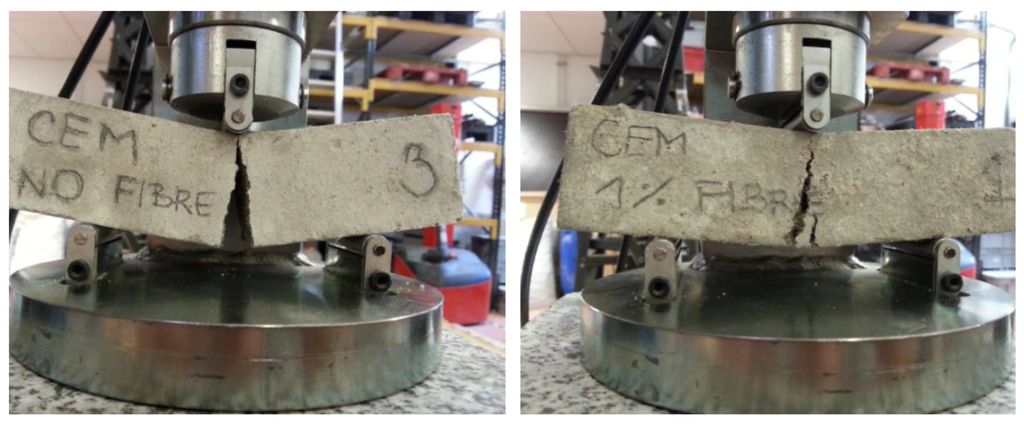
Figure 13.
Failure patterns of flexural tests.
2.2.3. Dynamic Modulus of Elasticity
Another relevant parameter is the dynamic modulus of elasticity, measured with ultrasonic waves. The reference test was EN 12504-4 [20] for concrete structures. The measurements of time of flight are performed in longitudinal and transversal directions. In all cases, transversal direction showed slightly larger values, because the number of discontinuities is proportionally less in a short distance. The average results of the measurements together with their span values are shown in Figure 14. Pictures of the tests are displayed in Figure 15 and Figure 16.
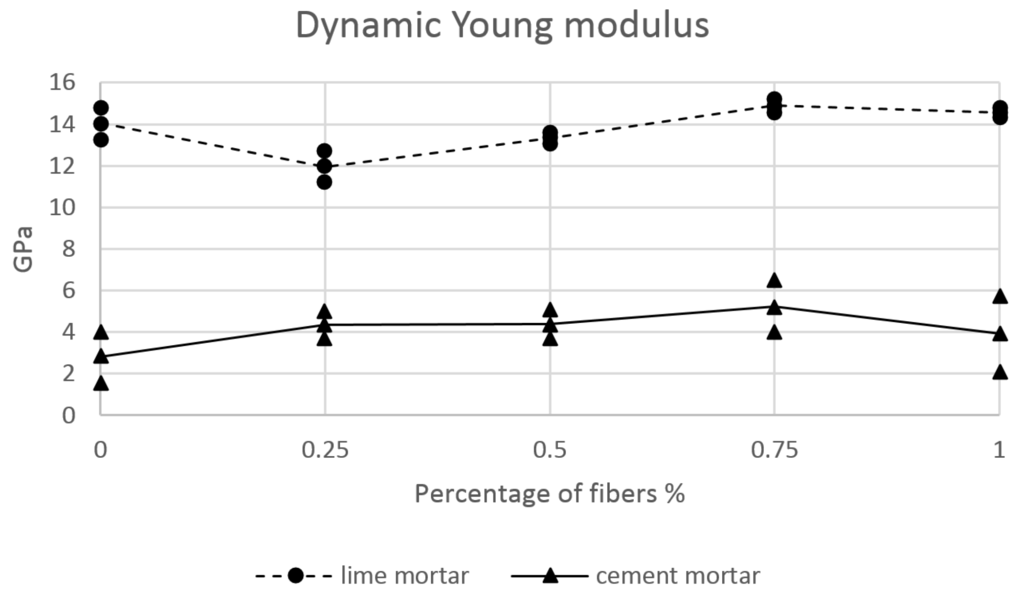
Figure 14.
Ultrasonic estimation of Young Modulus of mortars.
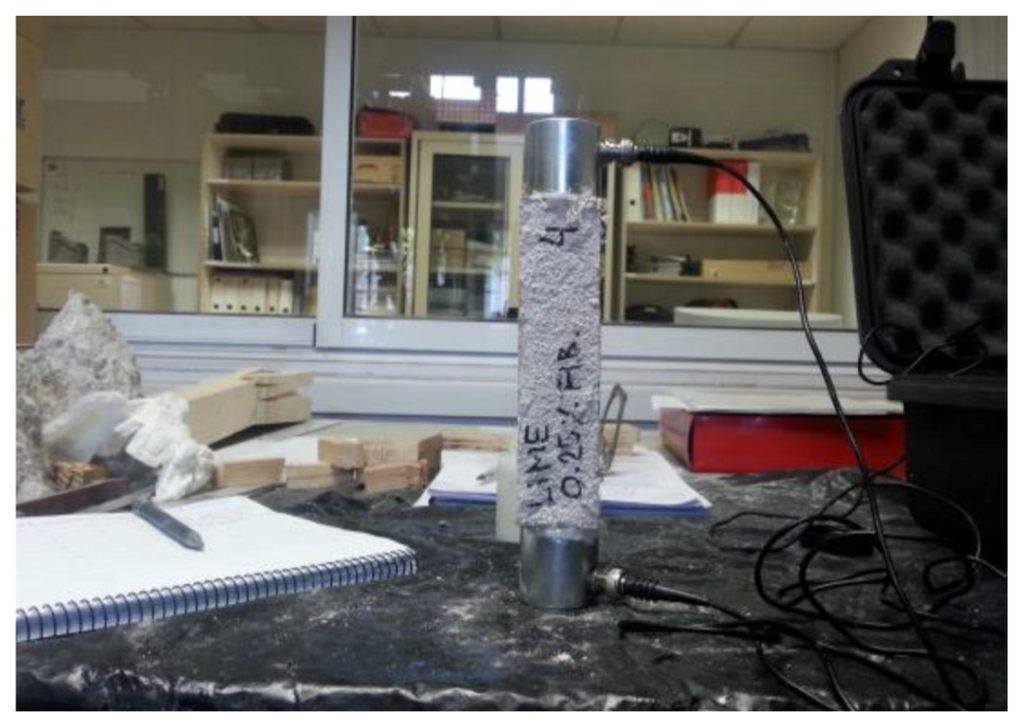
Figure 15.
Longitudinal ultrasonic measurement.
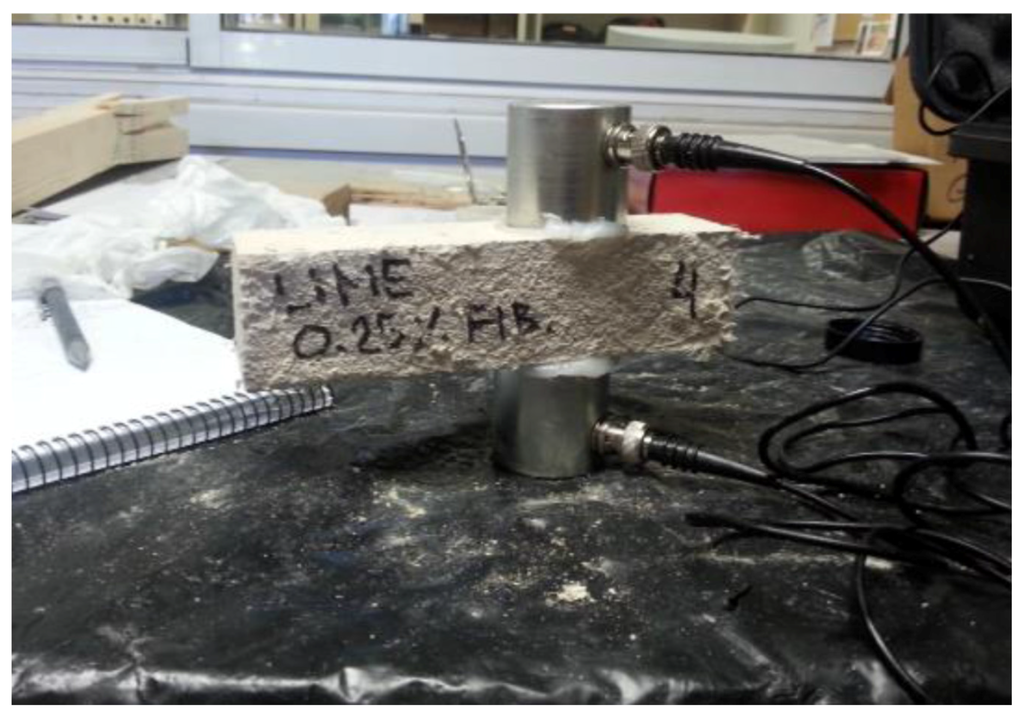
Figure 16.
Transversal ultrasonic measurement.
Values of Young Modulus E were estimated using Equation (1):
where v is the Poisson coefficient, estimated with a reasonable value of 0.2, ρ is the measured density of each specimen, L is the length, longitudinal or transversal and t the time of flight of the ultrasonic wave.
2.2.4. Water Absorption
One factor that affects mortar durability is the resistance to the diffusion of aggressive ions. Water absorption is a measure of the porosity of the mortar and supplies useful information about the permeable pore volume inside the specimen and potential connectivity between these pores. The influence of fibers on the water absorption of the hardened mortars is evaluated with a procedure based on EN 1015-18 [21]. Samples were kept at room temperature and humidity for a month. After testing their flexural performance, the two half parts of the broken specimen are weighted (M0) and submerged under into water, placing the break surface in full contact with the water. The depth of the water in the container was 10 mm and kept constant during the test. The container is covered to avoid the evaporation of water. After 10 min in the water, the surface moisture was whipped and the mass of each specimen was measured (M1). The same procedure was repeated 90 min later and mass of the specimen (M2) was also recorded. Finally, the procedure was repeated 24 h later and a new mass result (M3) is recorded. The difference of weight between the measurements indicates directly the amount of absorbed water. Results appear in Figure 17.
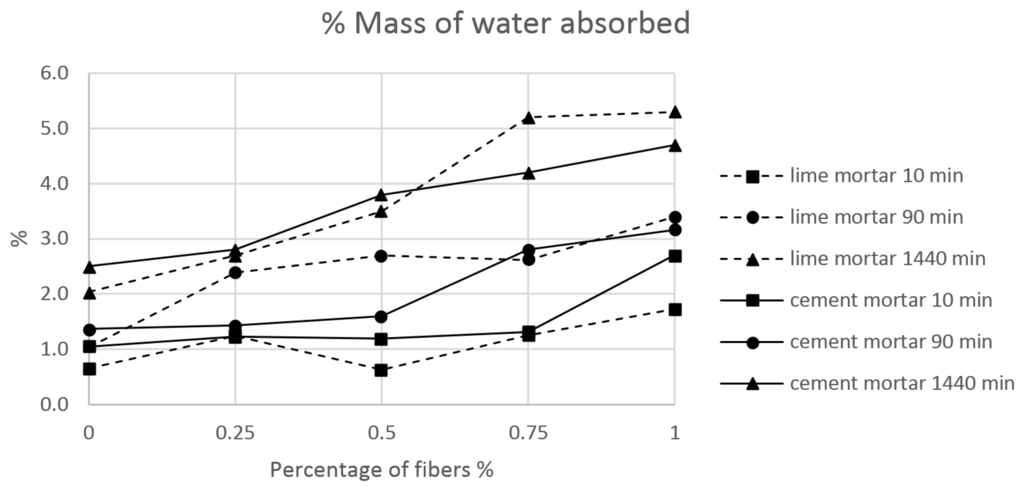
Figure 17.
Results of water absorption.
3. Discussion
3.1. Consistency and Bulk Density
Figure 6 shows that fiber addition affects directly the consistency of both mortars. The change is in such way that the higher percentage of fibers leads to the dryer consistency. It is interesting to notice that both mortars reach a similar consistency when the maximum amount of fibers is added, while the mixtures of these two mortars, without fibers, behave in a very different way. Hence, cement mortar more quickly loses consistency compared to the lime mortar. The most important change happens during the first 0.25% fraction of fibers. Lime mortar had a plastic consistency from the very beginning, while cement mortar was fluid before the fibers were added. The more fluid a mortar is, the more likely that small fractions of fibers may reduce its consistency is.
Bulk density test results in Figure 7 show some contradictory values depending on the mortar. Cement mortar clearly reduces in density with the addition of fibers. This seems reasonable because fibers are lighter than cement and aggregates, and a larger volume of fibers will decrease the density. Moreover, fibers contain air and this might also reduce density. Observing Figure 7, it is clear that this rule does not apply to lime mortar. In this case, there is a scattering of the density results. One of the reasons might be that the addition of fibers produces an increase in the stiffness of the mortar and compaction becomes more difficult. Further addition of fibers produces more stiffness, and the span of density values also increases with the amount of fiber, making the result of the final mixture more uncertain. During the preliminary mixtures, lime mortar showed a worse performance and a limit of 1% as the maximum amount of fibers was determined by the behavior of the lime mortar. The attempt to increase the amount of fiber concentration in the mixture lead to a segregation, because fibers rolled over themselves, producing isolated clusters.
Nevertheless, results must be taken cautiously because the variety of density reaches a maximum value of 5%, which is relatively low compared with the normative error that is allowed during the measurements (until 10%).
3.2. Compressive and Flexural Strength
Compressive tests perform similarly for both mortars and for all amounts of fibers. Looking at Table 2 and Table 3 and Figure 8, all samples perform identically. Failure patterns follow the expected hourglass shape. Nevertheless, mortar with fibers did not disintegrate and showed cohesion after failure, while mortar without fibers had no cohesion and produced a lot of small particles (Figure 12). In that sense, fibers seem to introduce some minor cohesion that tightens material and prevents dust formation, but they do not contribute relevantly to the improvement of compression strength. The load-displacement curve in Figure 10 shows that the tail of the curve is softer at maximum fiber content. This is also related to the cited cohesive phenomenon that prevents specimen destruction but it is not very relevant.
A flexural test with three-point bending produced an expected failure pattern with a crack in the middle cross-section. At high contents of fiber, 1% of the crack was slightly inclined and not perfectly perpendicular to the length, as shown in Figure 13. The reason for this minor change in the failure pattern can be related to an irregular distribution of the mass of the specimens, for example, due to the creation of fiber clusters. When the content of fiber is around 1%, the difficulty of mixing can lead to a non-homogeneous distribution of aggregates and fibers. This happened in both the cases of cement and lime mortars.
The addition of fibers does not dramatically change the flexural mechanical properties of the mortar. The flexural stress of lime mortar ranges from 7 N/mm2 to 6 N/mm2 and the cement mortar stays stable around 1.4 N/mm2 (see Table 4 and Table 5 and Figure 9). Moreover, fibers do not contribute to the ductile behavior of the mortar (Figure 11). The comparison of the force-displacement curves shows that the peak is similar and the tail is not longer, as one would expect if fibers would contribute to the post-cracking behavior. The reason for this is simple, in spite of the fact that the strength of the fibers is very high, they are too short to tighten the mortar. If the recycling process does not change in order to produce longer fibers, they will not help to improve post-cracking behavior. Unfortunately, a change in this direction is very difficult because the separation of materials requires the cutting of tires into very small fractions.
Finally, it is worth highlighting that cement mortar showed low strength values, similar to previous research conducted by Ernest et al. [22], while lime mortar showed high strength values because of its chemical composition, with additives that improved mechanical performance, and allowed it to be applied as a strengthening material.
3.3. Dynamic Young Modulus
The addition of fibers does not modify the dynamic Young modulus of the lime mixture. The value without fibers is 14 GPa, and, with the addition of fibers, it produced values in a range between 12 and 14.9 GPa. On the contrary, the cement mortar showed a relevant change in the modulus. From a very low value of 2 GPa without fibers, increasing to a range of between 4 and 5.3 GPa. The reason for this different performance is associated with the different nature of the mixtures. While the lime mortar was plastic from very beginning, the cement mortar changed from fluid to a consistent blend. Moreover, the scattering of measurements was higher in the cement mortar than in the lime mortar. For example, for 1% fiber, the Young modulus of cement mortar spans from 5.8 to 2.1 GPa in some samples, while lime mortar was between 14.8 and 14.3 GPa. As discussed before, bulk density and consistency show clear agreement with the values of a dynamic Young modulus.
3.4. Water Absorption
Water absorption showed few differences between the specimens that did not contain fibers (Figure 17). Cement or lime mortar with 0% fiber performed similarly, with a maximum of 2.5% of water after 1440 min. This indicates that the porosity is limited within original mortars. The inclusion of fibers increased water absorption for both mortars. The greater the percentage of fibers, the greater the porosity within the mortar. This behavior is related to the difficulty of mixing, the addition of fibers, and the changes in the consistency. During the manufacturing of the mixture, fibers tended to create clusters and were segregated from the mortar paste. Therefore, mortar did not penetrate among the fibers, leaving interconnected voids. However, because of the hydrophobic nature, fibers are not natural channels for water flooding. Figure 17 shows that when the percentage of fibers is lower than 0.5%, it has no strong effect in water absorption, but over 0.5% fiber, the mixture can absorb a relevant amount of water.
4. Conclusions
(1) Fibers change the nature of mortar and affect the workability of the material. For mortars with a plastic consistency, such as lime mortar, the addition of fibers slightly decreases the consistency. On the other hand, fluid mortars, such as cement, lose consistency very quickly with a small addition of 0.25% fibers. For the maximum amount of fibers that allowed workability (1%) both mortars had the same consistency.
(2) Fibers do not fundamentally modify the bulk density. The addition of fibers should drive a loss of weight of the material. Nevertheless, the workability limitation of 1% of fibers prevents relevant changes in density and sets the variation of density within the limits of the error measurement allowed by normative. Nevertheless, qualitatively, fibers tend to slightly reduce density.
(3) Compression strength was not reduced with the addition of fibers. Material showed a cohesion, produced by fibers, that prevented the formation of small particles and dust after failure of the specimen.
(4) Flexural strength was not affected by fibers addition. Materials did not show a post-cracking binding behavior because the fibers are too short to tighten the paste.
(5) Dynamic Young modulus did not change for lime mortar, while cement mortar showed an increase of nearly double. Moreover, the scattering of results was larger for cement mortar than for lime mortar. The reason is associated with the changes in the consistency of mortars. Cement mortar changed dramatically, from a fluid to a consistent mortar, while the lime mortar behaved plastically from the initial mixture.
(6) Water absorption increases with the addition of fibers. This is related to the problems in mixing and the creation of fibers clusters that leave voids and interconnected porosity. Fibers are not natural channels for water because of their hydrophobic nature. For samples with less than 0.5% fibers, the addition does not to modify the water absorption compared with the original mixture.
The experience shows that fibers from the recycling of tires can be added to commercial mixtures without losing important mechanical properties.
The major limitation is in workability; in this work, mixtures included a maximum of 1% in weight but this value could probably be increased with the help of some additives. This approach could constitute an interesting line of future research. Another relevant parameter is durability. The addition of fibers produces voids and interconnected porosity that might make the mortar dangerous for chemical attack. Research to check the ion-penetration risk is in order.
Acknowledgments
Thanks to Spanish Ministry of Economy and Competitiveness MINECO for funding a research project IPT-2012-0990-310000 about ELT’s and fibers reuse. A special thanks to Jelena Ogrizovic, Alejandro Ortiz and Vicenç Andreu for their assistance.
Author Contributions
Lluís Gil leaded the research, designed experiments and wrote the paper, Ernest Bernat-Masó assisted during mechanical test execution and data interpretation, Francisco Javier Cañavate assisted for non-mechanical testing and data interpretation.
Conflicts of Interest
The authors declare no conflict of interest.
References
- Saikia, N.; de Brito, J. Use of plastic waste as aggregate in cement mortar and concrete preparation: A review. Constr. Build. Mater. 2012, 34, 385–401. [Google Scholar] [CrossRef]
- Ge, Z.; Sun, R.; Zhang, K.; Gao, Z.; Li, P. Physical and mechanical properties of mortar using waste Polyethylene Terephthalate bottles. Constr. Build. Mater. 2013, 44, 81–86. [Google Scholar] [CrossRef]
- Iucolano, F.; Liguori, B.; Caputo, D.; Colangelo, F.; Cioffi, R. Recycled plastic aggregate in mortars composition: Effect on physical and mechanical properties. Mater. Des. 2013, 52, 916–922. [Google Scholar] [CrossRef]
- Pereira-de-Oliveira, L.A.; Castro-Gomes, J.P.; Nepomuceno, M.C.S. Effect of acrylic fibres geometry on physical, mechanical and durability properties of cement mortars. Constr. Build. Mater. 2012, 27, 189–196. [Google Scholar] [CrossRef]
- Silva, E.R.; Coelho, J.F.J.; Bordado, J.C. Strength improvement of mortar composites reinforced with newly hybrid-blended fibres: Influence of fibres geometry and morphology. Constr. Build. Mater. 2013, 40, 473–480. [Google Scholar] [CrossRef]
- Bentchikou, M.; Guidoum, A.; Scrivener, K.; Silhadi, K.; Hanini, S. Effect of recycled cellulose fibres on the properties of lightweight cement composite matrix. Constr. Build. Mater. 2012, 34, 451–456. [Google Scholar] [CrossRef]
- Spadea, S.; Farina, I.; Carrafiello, A.; Fraternali, F. Recycled nylon fibers as cement mortar reinforcement. Constr. Build. Mater. 2015, 80, 200–209. [Google Scholar] [CrossRef]
- Di Bella, G.; Fiore, V.; Galtieri, G.; Borsellino, C.; Valenza, A. Effects of natural fibres reinforcement in lime plasters (kenaf and sisal vs. Polypropylene). Constr. Build. Mater. 2014, 58, 159–165. [Google Scholar] [CrossRef]
- Izaguirre, A.; Lanas, J.; Alvarez, J.I. Effect of a polypropylene fibre on the behaviour of aerial lime-based mortars. Constr. Build. Mater. 2011, 25, 992–1000. [Google Scholar] [CrossRef]
- Le Troëdec, M.; Dalmay, P.; Patapy, C.; Peyratout, C.; Smith, A.; Chotard, T. Mechanical properties of hemp-lime reinforced mortars: Influence of the chemical treatment of fibers. J. Compos. Mater. 2011, 45, 2347–2357. [Google Scholar] [CrossRef]
- Turatsinze, A.; Bonnet, S.; Granju, J.L. Mechanical characterisation of cement-based mortar incorporating rubber aggregates from recycled worn tyres. Build. Environ. 2005, 40, 221–226. [Google Scholar] [CrossRef]
- Cintra, C.L.D.; Paiva, A.E.M.; Dos Santos, W.N.; Baldo, J.B. Masonry light weight mortars containing vermiculite and rubber crumbs of recycled tires. InterCeram: Int. Ceram. Rev. 2014, 63, 40–43. [Google Scholar]
- Aziz, F.N.A.A.; Bida, S.M.; Nasir, N.A.M.; Jaafar, M.S. Mechanical properties of lightweight mortar modified with oil palm fruit fibre and tire crumb. Constr. Build. Mater. 2014, 73, 544–550. [Google Scholar] [CrossRef]
- Vasconcelos, G.; Lourenço, P.B.; Camões, A.; Martins, A.; Cunha, S. Evaluation of the performance of recycled textile fibres in the mechanical behaviour of a gypsum and cork composite material. Cem. Concr. Compos. 2015, 58, 29–39. [Google Scholar] [CrossRef]
- Mavridou, S.; Oikonomou, N. Utilization of textile fibres from worn automobile tires in cement based mortars. Glob. Nest J. 2011, 13, 176–181. [Google Scholar]
- British Standards Institution. Specification for Mortar for Masonry. Part 2: Masonry Mortar; EN 998-2; British Standards Institution: London, UK, 2003. [Google Scholar]
- British Standards Institution. Methods of Test for Mortar for Masonry. Determination of Consistence of Fresh Mortar (by Flow Table); EN 1015-3; British Standards Institution: London, UK, 1999. [Google Scholar]
- British Standards Institution. Methods of Test for Mortar for Masonry. Determination of Bulk Density of Fresh Mortar; EN 1015-6; British Standards Institution: London, UK, 1999. [Google Scholar]
- British Standards Institution. Methods of Test for Mortar for Masonry. Determination of Flexural and Compressive Strength of Hardened Mortar; EN 1015-11; British Standards Institution: London, UK, 1999. [Google Scholar]
- British Standards Institution. Testing Concrete. Determination of Ultrasonic Pulse Velocity; EN 12504-4; British Standards Institution: London, UK, 2004. [Google Scholar]
- British Standards Institution. Methods of Test for Mortar for Masonry. Determination of Water Absorption Coefficient due to Capillary Action of Hardened Mortar; EN 1015-18; British Standards Institution: London, UK, 2002. [Google Scholar]
- Bernat, E.; Gil, L.; Roca, P.; Sandoval, C. Experimental and numerical analysis of bending–buckling mixed failure of brickwork walls. Constr. Build. Mater. 2013, 43, 1–13. [Google Scholar] [CrossRef]
© 2016 by the authors; licensee MDPI, Basel, Switzerland. This article is an open access article distributed under the terms and conditions of the Creative Commons by Attribution (CC-BY) license (http://creativecommons.org/licenses/by/4.0/).