Article

Dynamic Parameters of Fiber-Reinforced Soils at Very Small Strains

by
Konstantinos E. Bantralexis
,
Eleni S. Boura
,
Ioannis N. Markou
* and
Evangelos D. Evangelou
Soil Mechanics and Foundation Engineering Laboratory, Department of Civil Engineering, Democritus University of Thrace, University Campus Kimmeria, GR-67150 Xanthi, Greece
*
Author to whom correspondence should be addressed.
Fibers 2026, 14(7), 77; https://doi.org/10.3390/fib14070077
Submission received: 8 April 2026 / Revised: 10 June 2026 / Accepted: 25 June 2026 / Published: 29 June 2026

Highlights

What are the main findings?
The dynamic and small-strain stiffness parameters of fiber-reinforced soils obtained by conducting Bender Element tests increase with increasing confining pressure and are significantly affected by the soil type, the fiber type, and the content.
Although fiber inclusion resulted generally in a reduction of the dynamic properties of soils at very small strains, increases ranging from 5% to 55% were observed in certain soil–fiber combinations in comparison with the unreinforced soils.
What are the implications of these findings?
This research effort systematically analyzes the dynamic behavior of fiber-reinforced soils at very small strains and provides a significant amount of experimental Bender Elements measurements, enriching and supplementing the extremely limited available database on this topic, which could be very useful in practice in numerous seismic applications.
The results of this investigation can be incorporated in correlations with the results of other laboratory testing methods, e.g., resonant column tests, possibly eliminating the need for additional testing, and can be utilized as a guide or reference for the inclusion of other synthetic or natural fibers in soils, taking into consideration simultaneously the environmental impact of each fiber type.

Abstract

Improvement of the engineering properties of soils by reinforcing them with fibers, at an appropriate percentage of the weight of dry soil, is frequently selected to ensure the safe construction and operation of many structures. However, the published information regarding the investigation of the dynamic properties of fiber-reinforced soils at very small strains is very limited. Toward this end, the dynamic behavior of fiber-reinforced soils is investigated experimentally by conducting Bender Element tests under different confining pressures. The effect of polypropylene fiber reinforcement on the shear wave velocity (Vs), the velocity of the primary wave (Vp), the initial Young’s modulus (E0) and the initial shear modulus (G0) of sand and sand–clay mixtures with varying compositions is examined in this study. The soils were reinforced with five different types of polypropylene fibers having lengths from 9 mm to 50 mm, at fiber contents from 0.5% to 2% by weight of dry soil. The results indicate that the dynamic and the small-strain stiffness parameters of fiber-reinforced soils increase with increasing confining pressure, while also being affected by the soil type, the fiber type, and content. Although fiber inclusion resulted generally in a reduction of the dynamic properties of soils, increases ranging from 5% to 55% were observed in certain soil–fiber combinations in comparison with the unreinforced soils.

1. Introduction

The identification of geotechnical characteristics is a priority for the successful and safe construction of a Civil Engineering project. The in situ soil exhibits negligible capability in resisting tensile forces and often does not meet the requirements of the project under consideration, either due to low bearing capacity or excessive deformability. To overcome these disadvantages, soil reinforcement and improvement techniques have been developed over the years. The need for soil reinforcement with additional materials has been widely recognized, as it offers significant benefits in improving the mechanical behavior [1]. Various methods have been proposed for this purpose, such as grouting of the soil with cement suspensions [2] and soil reinforcement with polymer materials [3]. The choice of the proper soil reinforcement method is determined by soil characteristics [4] and other factors, such as the cost of implementation and the environmental impact of the reinforced soils. Of major interest among the above-mentioned techniques is soil reinforcement with the addition of fibers—either natural, such as coconut or sisal fibers, or synthetic, such as polypropylene, polyester, or glass fibers. For example, a mixture of straw and binding material-reinforced soil has been used as a basic building material in Iran since prehistoric times [5].
The inclusion of fibers into the soil creates a new reinforced-soil composite. The fibers act as reinforcement within the soil material and tend to improve its mechanical properties, due to their capability to develop tensile stresses. They are usually randomly and homogeneously distributed into the soil, forming an internal network that enhances shear strength and deformability characteristics [6,7]. The addition of fibers (synthetic or natural) increases soil cohesion and improves its resistance to tensile stresses [8,9]. Natural fibers have an affordable cost and adequate strength, and they are environmentally friendly, although they lack reproducibility and durability. Synthetic fibers, and more specifically polypropylene fibers, have a low cost; they are convenient for use in laboratory conditions and do not biodegrade when subjected to multiple environments [6]. Polypropylene fibers have proven effective in reinforcing plain soil and cemented soil, and their desirable dispersibility ensures uniform distribution in soil and significantly improves compressive strength, tensile strength, integrity, wear resistance, and cracking resistance of plain soil and cemented soil [10].
The results of several research efforts focusing on the mechanical behavior of fiber-reinforced soils, mainly under monotonic loads, have been reported in the international literature. These studies usually utilize laboratory tests, such as unconfined compression (UCS), direct shear, triaxial compression, and California bearing ratio (CBR), to investigate the basic mechanical parameters in terms of strength and deformability [6,11,12,13,14,15]. Triaxial compression tests seem to be a dominant laboratory practice performed in fiber-reinforced soils. In most of these studies, synthetic fibers were utilized for soil reinforcement and, more specifically, polypropylene fibers have been widely investigated in various types of soils with multiple mechanical properties, covering 34% of the unconsolidated-undrained (UU) tests and 40% of the consolidated-undrained (CU) and consolidated-drained (CD) triaxial compression tests conducted for the purposes of research studies in this field, respectively [16,17].
The study of the behavior of fiber-reinforced soils under dynamic or seismic loading conditions is also a field of major importance to research. Cyclic triaxial compression, Resonant Column and Piezoelectric Ring-Actuator tests [2,18,19,20,21,22,23] are the most common practices to assess the dynamic parameters of these materials. The Bender Element tests are also considered very reliable for the quantification of the dynamic properties of soils at very small strains [21,22]. The Bender Elements method is a non-destructive laboratory practice based on the emission and detection of shear waves (S-waves) and primary waves (P-waves) with piezoceramic elements placed at the edges of the soil specimen. By utilizing this method, it is possible to measure the wave propagation velocities (Vs and Vp) within the soil specimen and, as a result, to calculate the initial shear modulus (G0) and the initial Young’s modulus (E0) of the soil at very small strains. Moreover, by combining other laboratory measurements with the Bender Element tests, critical soil parameters can be estimated, such as the degree of saturation [21], the shear modulus (G) through cyclic loading [24], and the anisotropy and age of soils [25]. At the same time, this test is widely used in the design of foundations and dams, as it contributes to the estimation of soil stiffness at small strains [26].
The investigation of the response of fiber-reinforced soils in Bender Element tests is extremely limited. The stiffness at very small strains is an essential property for the geotechnical characterization and the modeling of the small-to-medium strain behavior of geomaterials [27]. The initial shear modulus (G0) of a soil specimen under particular stress and time conditions is an important parameter in small-strain dynamic analyses such as those to predict soil behavior or soil–structure interaction during earthquakes, explosions, and machine or traffic vibrations. G0 can be equally important for small-strain cyclic situations such as those caused by wind or wave loading. Shear wave velocity and G0 can be used to compare different soil specimens in a laboratory testing program, and also for comparing laboratory and field measurements of these parameters. Researchers have conducted Bender Element tests (very small strains), which were accompanied by Resonant Column tests to obtain dynamic parameters at larger strains. The analysis that took place was based on the percentage of fiber inclusion in soils by weight, along with increasing confining pressures [3,27]. The addition of synthetic fibers to soils has been shown to significantly enhance maximum strength and ductility [3]. However, at very small strains, the effect of fibers on the initial shear modulus (G0) of soil is not always positive. It was observed that a fiber content above 0.5% can lead to a decrease in G0, possibly due to the increase in porosity and decrease in contact between grains [3,27]. However, this negative performance was not observed systematically, and an improvement of fiber-reinforced soil behavior was indicated at larger strains based on the results obtained from the Resonant Column tests. Taking into consideration this noticeable lack of sufficient experimental evidence, the present study aims at a better understanding of the dynamic behavior of fiber-reinforced soils at very small strains by conducting Bender Element tests in various soil specimens containing synthetic polypropylene fibers. The effect of various parameters such as soil type (cohesive and non-cohesive), fiber type (monofilament, Tape 1, Tape 2, Hollow, Fibrillated), fiber length (9 mm, 18 mm, 30 mm, and 50 mm), and fiber content (0.5%, 1%, 1.5%, and 2%) on the response of the composite material is analyzed extensively, and the improvement of dynamic and small-strain stiffness parameters is also presented. Eventually, the results of this study also serve to enrich and supplement the available experimental database by reporting the dynamic parameters of fiber-reinforced soils at very small strains.

2. Materials and Methods

The Bender Elements method is a reliable and widely used laboratory technique for determining the dynamic properties of soils (e.g., [2,3,19,20,23]). The basic principle of the test is based on measuring the propagation velocities of primary waves (Vp) and shear waves (Vs), from which the initial Young’s modulus (E0) and the initial shear modulus (G0) are calculated, i.e., the parameters that describe the stiffness of the soil under conditions of very small strains. By utilizing this method, an experimental program containing 5 different soil types reinforced with different types, lengths and contents of polypropylene fibers has been performed in this research effort. The materials used and the experimental procedures applied are analyzed below.

2.1. Soils

The five soils tested in this study include a poorly graded sand with a negligible fine-grained fraction and four composite soils produced by mixing this sand with a lean clay, by weight, using the proportions shown in Table 1. The sand and lean clay are classified as SP and CL, respectively, according to the Unified Soil Classification System (USCS) [28] and as A-1-b and A-7-6 type, respectively, according to the AASHTO (American Association of State Highway and Transportation Officials) M 145 specification [29]. The mixing proportions were selected to produce four composite soils (CS1-CS4) that belong to different categories. Characteristic grain sizes, the values of Atterberg limits (liquid limit, LL, and plastic limit, PL), and the classification of all soils are shown in Table 1. The tested soils cover a wide variety of specimens that can be used in earthwork structures with SP, CS1 and CS2 characterized as “excellent to good” soils and CS3 and CS4 characterized as “fair to poor” soils for that purpose [29]. The specimens in this study were prepared by compacting the soils, either in a dry condition (SP soil) or with the optimum water content (CS1-CS4 soils), so as to obtain the maximum dry unit weight determined by the compaction test conducted in accordance with the ASTM Standard D 698 [30].

2.2. Fibers

The abovementioned soils were reinforced with polypropylene fibers of five different types having densities equal to 905 kg/m3 and melting points at 165 °C. More specifically, monofilament fibers of circular cross-section, two tapes of different widths, and hollow and fibrillated fibers, with dimensions and relevant properties presented in previous research effort [16], were used for soil reinforcement. These fibers are designated as M, T1, T2, H, and F, respectively. All fibers were selected due to their low cost, impermeability, and chemical inertness [7]. M, T1, T2 and F fibers are usually tested in research efforts on fiber-reinforced soil, and H fiber was selected as a new fiber type that has not been investigated so far. Another characteristic of the H fiber that contributed to its selection in the present study is its significantly higher elongation at failure compared to the other fibers investigated (Table 2). Four different fiber lengths (9 mm, 18 mm, 30 mm and 50 mm) were used in the experimental measurements, and their concentrations in the soil–fiber mixtures ranged from 0.5% to 2.0% by weight of dry soil, to investigate the effect of fiber length and content on the dynamic behavior of fiber-reinforced soils.
The selection of polypropylene (PP) fibers for the purposes of this research effort was based on their abovementioned effectiveness to improve the mechanical properties of the soils, combined with the availability of material and their advantages in comparison with other synthetic fibers [6]. Another factor taken into consideration for the investigation of PP fibers in this study was their environmental impact on the soil. Soil contamination is a field of major importance in the Civil Engineering community, and it focuses on how microplastics affect the physical, chemical and biological properties of the soil [31,32]. In terms of environmental effects, the inclusion of PP materials in soils with limited concentrations (up to 2% by weight) are proven not to have significant effects on soil physical properties [32]. Finally, synthetic polymers are quite resistant to biodegradation (with degradation periods reaching decades or even centuries) [33], and the sustainability profile of PP fibers demonstrates significant environmental benefits in comparison with other traditional reinforcement techniques (e.g., cement and lime treatment methods), including a 55–62% reduction in global warming potential, 70–75% reduced embodied energy requirements, and 80–85% less abiotic resource depletion [34].

2.3. Preparation and Examination of Cohesive Soil Samples

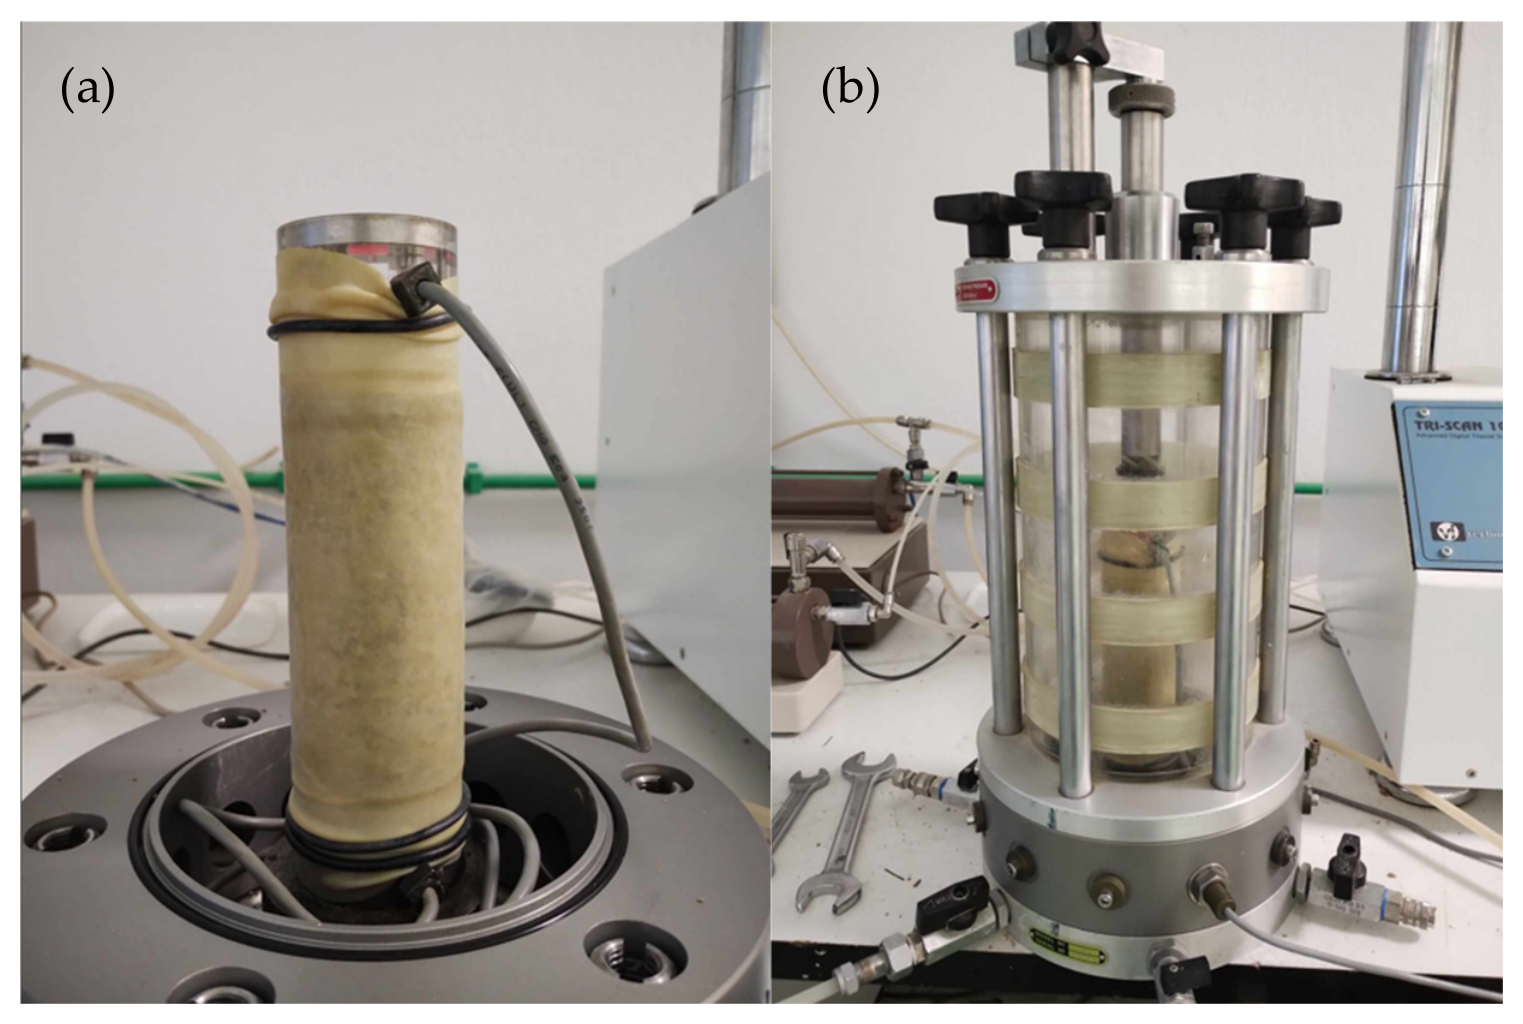
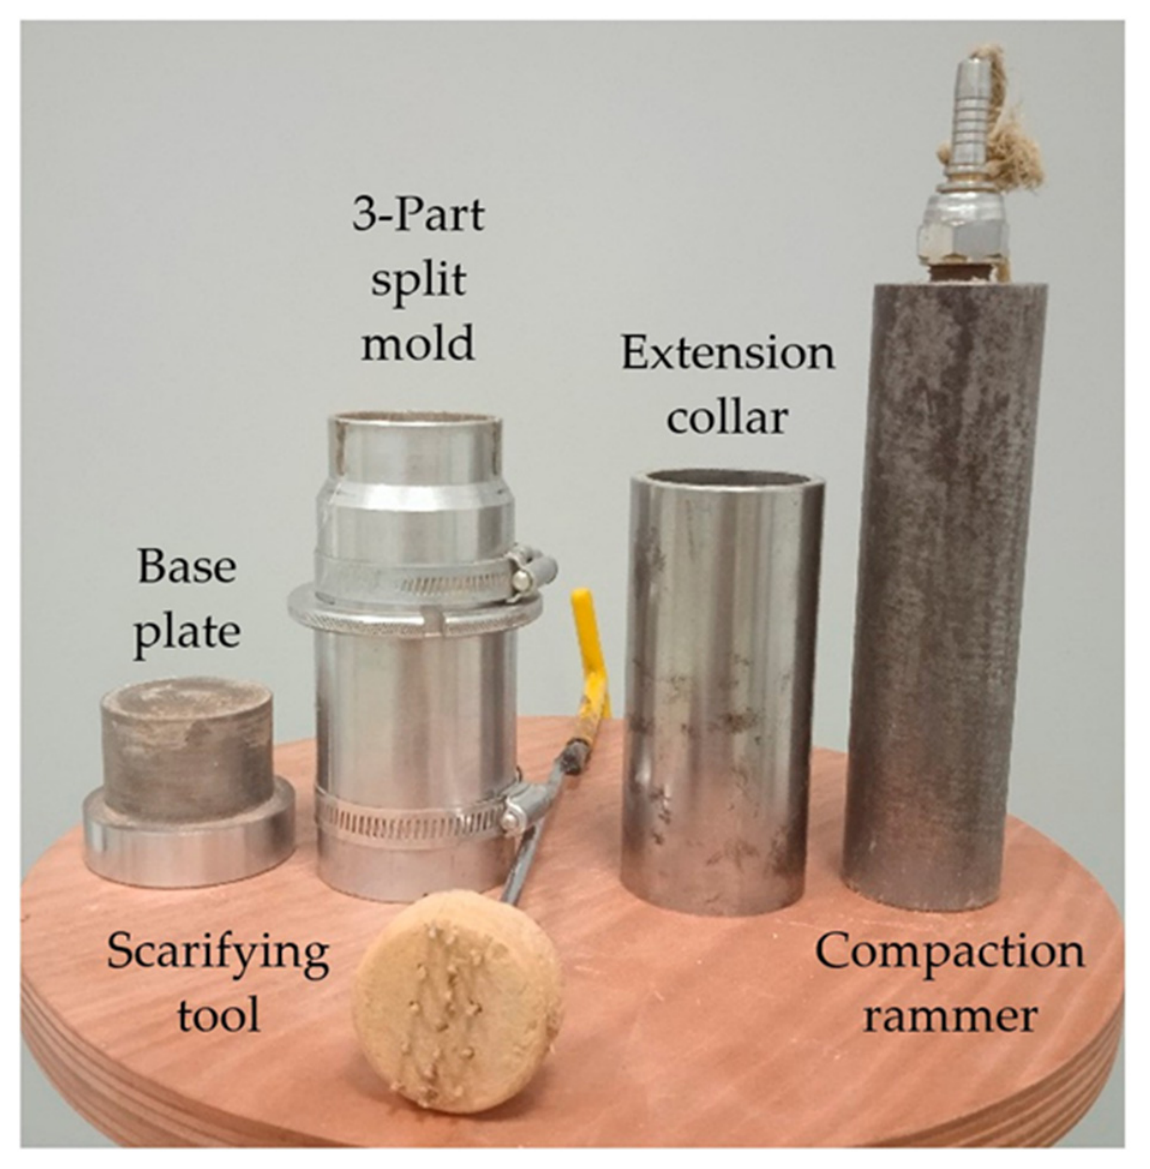
The specimens of fiber-reinforced cohesive (CS1-CS4) soils were prepared with the optimum water content and compacted appropriately to obtain the maximum dry unit weight determined in a previous research effort [35] by conducting compaction tests in accordance with the ASTM Standard D 698 [30]. A homogeneous soil–fiber mixture was initially attained and was manually mixed with water until the moisture was evenly distributed within the sample. The compaction of two equal layers of fiber-reinforced soil was conducted in the 3-part split compaction mold using the compaction rammer shown in Figure 1. A scarifying tool was utilized during the compaction to achieve uniform specimen consistency between the two compacted layers. The cylindrical specimens prepared for Bender Element testing had a diameter of 50 mm and a height of 110 mm and were placed on the chamber base with suitable porous stones on both surfaces. The rubber membrane was then placed on each specimen and secured with elastic rings, as shown in Figure 2a, and afterwards, the chamber shell was placed on the base (Figure 2b). The Bender Elements chamber was connected to the water supply and pressure system, and the tests were conducted at confining pressures (σ3) equal to 0 kPa, 50 kPa, 100 kPa, 200 kPa, and 400 kPa.

2.4. Preparation and Examination of Non-Cohesive Soil Samples

The specimens of fiber-reinforced non-cohesive (SP) soil were prepared by compacting the soil in a dry condition to obtain the maximum dry unit weight determined in previous research efforts [16,35]. Τhe homogeneous dry sand–fiber mixture was divided into 5 equal parts, and each part was compacted in the three-part split mold on the chamber base. After the compaction of all layers, the upper porous stone and the top cap were placed on the specimen, and the rubber membrane was secured with elastic rings on the top cap. The cylindrical specimens produced with this method had a diameter of 50 mm and a height of 112 mm. Then, the specimens were subjected to negative internal pressure by a vacuum pump to maintain their composition and structure until the application of the confining pressure. Consequently, it was not feasible to obtain measurements at a confining pressure equal to zero. The differences in the values of Vs and Vp velocities for different negative internal (confining) pressures (−10 kPa, −20 kPa and −50 kPa) applied to the same specimen type ranged between 6 to 20%. Therefore, it was decided to use the negative confining pressure of −50 kPa because it led to better coupling between the sensors and the dry sand specimen, resulting in better quality of the wave propagation signals. Accordingly, the tests were conducted at confining pressures (σ3) equal to −50 kPa, 50 kPa, 100 kPa, 200 kPa, and 400 kPa. Taking the above-mentioned analysis into consideration, the experimental measurement at −50 kPa is in correspondence with the measurement at a confining pressure of 0 kPa adopted for the cohesive soils.

2.5. Bender Elements Experimental Procedure

The GDS Bender Elements System was utilized to perform the experimental program in fiber-reinforced, as well as in unreinforced, soil specimens. The GDS BES software V 2.8.4.16 is designed for use with the Bender Elements system and allows test control and data acquisition for both primary P-waves and shear S-waves. In this study, the primary conditions of the test are listed as follows: (a) transmitter—receiver distance (i.e., the height of the test specimen), (b) sample frequency: 2500 ksamp/s, (c) sampling time: 5 s (total recording duration per reception), (d) wave propagation via the piezoceramic elements (sinusoidal wave), (e) wave period: 0.4 ms, and (f) wave amplitude: 10 V. Two methods for identifying characteristic time points defined in the literature, (a) the First Arrival method and (b) the Peak-to-Peak method, are examined and compared in this study to enhance the trustworthiness of the results. The polarity of the signal, along with the signal quality, was also taken into consideration. During testing, certain external factors were identified that can negatively affect the quality and reliability of the measurements. The most important of these factors are (a) water ingress into the test specimen, (b) near-field effects, (c) poor coupling of the sensors with the sides of the specimen, and (d) misalignment of the top cap with the bottom of the chamber. All tests in this study were carried out in accordance with the provisions of the ASTM D8295-19 standard [36].
During the test, the propagation times of the two waves, Δtp and Δts, respectively, were recorded. More specifically, Δtp and Δts are the time domains between the transmitted and received primary and shear waves, respectively, in accordance with each of the two adopted methods of analysis (First Arrival and Peak-to-Peak methods). The value of the propagation velocity of small-amplitude primary waves, Vp, and the value of the propagation velocity of shear waves, VS, were then calculated as follows:
V p = L Δ t p
V s = L Δ t s
where L is the wave travel length (distance between the ends of the piezoceramic emission and reception elements). As a result, the Poisson’s ratio, ν, was calculated with the equation:
v =   1 2   V P V S 2 1 V P V S 2 1
The initial shear modulus at small strains, G0, and the initial Young’s modulus at small strains, E0, were calculated using the following equations and are considered as small-strain stiffness parameters because they are based on the Vs and Vp values:
G 0 = ρ V s 2
E 0 = 1 2 v 1 + v 1 v ρ V ρ 2
where ρ is the dry density of the sample (g/cm3). The dynamic parameters listed above will be used subsequently to evaluate the findings of this study.

2.6. Experimental Program

The testing program was designed to facilitate a parametric analysis of the effect of the fibers in terms of fiber length, fiber content and fiber type on the dynamic behaviors of five different soil types investigated. An excessive number of Bender Element test results, from testing all possible combinations of soils with fiber types, lengths, and contents, were incorporated in the present research effort. However, a total of 48 Bender Element tests, 43 in fiber-reinforced soils, summarized in Table 3 and five in unreinforced soils, were sufficient for the purposes of the present study. This considerable reduction was accomplished (a) by testing all soils reinforced with content equal to 1.0% of fibers having length equal to 30 mm for fibrillated fibers and 18 mm for all the other fiber types for the investigation of the effect of soil and fiber type on the dynamic behavior of fiber-reinforced soils, and (b) by investigating the effect of fiber length and content for the three intermediate soils (CS1, CS2 and CS3) reinforced with the most frequently used monofilament (M) fiber. The fiber content was set equal to 0.5% by weight of dry soil in the investigation of the effect of fiber length, whereas the fiber length was kept equal to 18 mm in the investigation of the effect of fiber content on the dynamic behavior of fiber-reinforced soils. These constant values of fiber length and content were selected because they are representative of the values regularly used in fiber-reinforced soil research [16].
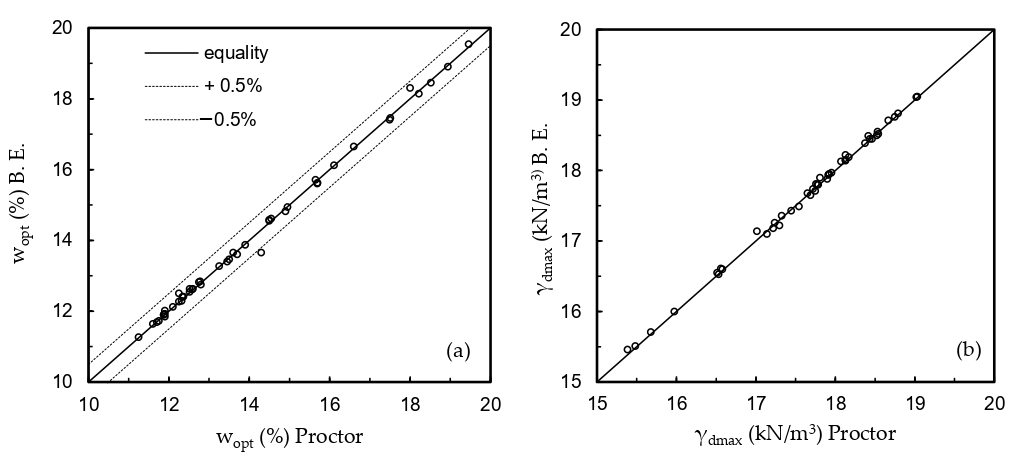
The fiber-reinforced soils in applications such as embankments and pavements are usually not saturated at both the construction and operation stages. Therefore, the approach followed in the present study to effectively simulate these conditions was to conduct Bender Element tests on the unreinforced and fiber-reinforced soil specimens in a dry condition (SP soil) or at their “as-compacted” water contents (CS1-CS4 soils). Also, it has been reported recently that the achievement of optimum moisture content in a test is a key factor that can affect measurements directly [37]. The quality of the compacted specimens was assured by comparing their compaction characteristics with those obtained by the standard compaction test [30] and reported in a preceding publication [35]. The comparison presented in Figure 3 confirms the good quality of the specimens for Bender Elements testing, as the deviation of their water contents is generally lower than ±0.5% from the optimum water contents, and their dry unit weight values were practically equal to the values of the maximum dry unit weight resulting from the compaction test.
The research team has also performed duplicate tests for a subgroup of soil specimens in order to address the problem of uncertainty during laboratory practice of the Bender Element Tests. A total of 15 specimens has been tested, with syntheses presented in Table 4, covering 31% of the total tests from the original laboratory testing program. The repeatability analysis of these duplicate tests was considered satisfactory, since only 4% of them had presented experimental Vs and Vp values differing by over 8%, in comparison with the respective data from the original laboratory testing program. This satisfactory performance may be attributed to the laboratory procedures applied by the research team for specimen preparation, which resulted in specimens with almost identical compaction characteristics (e.g., Figure 3).

3. Results and Discussion

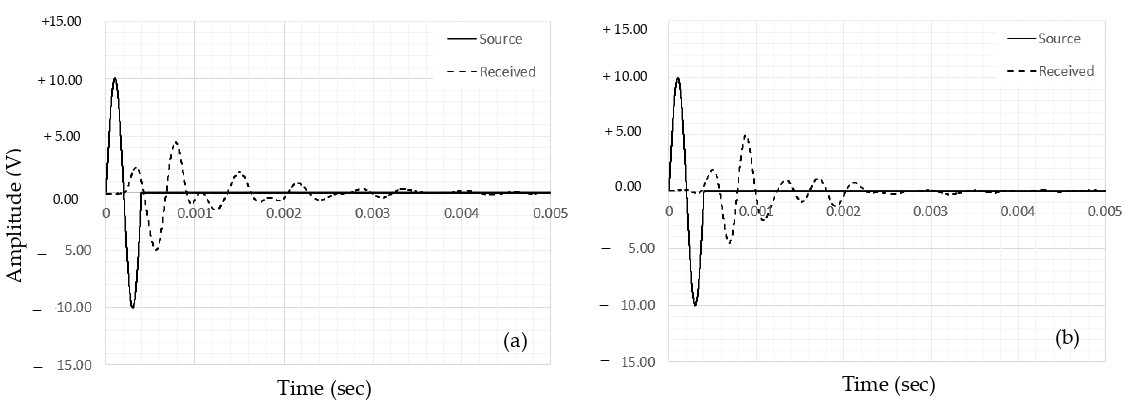
A typical experimental measurement of the wave propagation from the transmitter to the receiver piezoceramic element is depicted in Figure 4. It is observed that the quality of the wave propagation signals obtained in this research effort is satisfactory because they are clear and unaffected by external factors that tend to decrease their clarity. Based on these signals, the propagation times of the two waves, Δtp and Δts, were determined by applying the First Arrival method (time difference between the start of the wave at the transmitter and receiver) and the Peak-to-Peak method (time difference between the source and received first maximum peaks) and were used for the calculation of the wave propagation velocities, Vp and Vs, respectively, with Equations (1) and (2). The First Arrival method is generally the most frequently adopted method for result presentation, whereas the Peak-to-Peak method is much easier to use. Therefore, it was considered critical for the completeness of this study to obtain the values of wave propagation times by utilizing both methods and to compare the resulting dynamic parameters in the following sections.
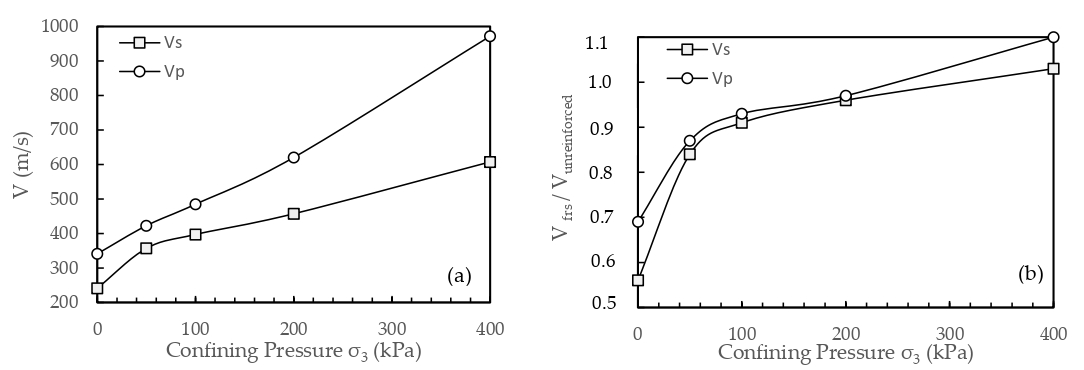
The confining pressure is an external loading factor that simulates the effect of the depth from the ground surface, and it directly affects the behavior of soils. For that reason, the dynamic parameters of each specimen in this experimental program were obtained for five different confining pressures, as has already been described in Section 2.3 and Section 2.4 for the cohesive and the non-cohesive soils, respectively. According to the international literature, an increase in confining pressure is associated with an increase in the propagation velocity of both primary (Vp) and shear waves (Vs) [2]. This phenomenon is also confirmed by the experimental measurements in the present study. As typically shown in Figure 5a, the velocities of both primary (Vp) and shear waves (Vs) increase significantly with an increase in the confining pressure. This increase is observed regardless of the method used to calculate the propagation velocities. Furthermore, for most cases of CS1, CS2, and CS3 soil specimens, the increase in the propagation velocities is also accompanied by an increase in the ratios of Vs and Vp velocities of fiber-reinforced soil to those of unreinforced soil (Figure 5b), indicating an improvement of the dynamic behavior of the soil due to fiber reinforcement with an increasing confining pressure. These observations can be attributed to the better confinement of the fiber-reinforced soil achieved by increasing the confining pressure, which leads to faster wave propagation due to a more effective interaction between the soil and the fibers.
In this experimental program, the dynamic parameters of the unreinforced soils were also measured to quantify the effect of fiber reinforcement on the dynamic behavior of soils. For the unreinforced soils used in this investigation, the ranges of the dynamic, small-strain stiffness parameters and Poisson’s ratio (ν) obtained for all confining pressures, are (a) Vs: 230–604.4 (m/s) and 193.5–591.5 (m/s), (b) Vp: 343–964.9 (m/s) and 240.3–1106.8 (m/s), (c) G0: 102.7–662.6 (MPa) and 63.1–679.1 (MPa), (d) E0: 225.2–1560 (MPa) and 45.66–1385.7 (MPa), and (e) ν: 0.01–0.44 for the First Arrival and Peak-to-Peak methods, respectively. Typical values of dynamic properties, small-strain stiffness parameters, and Poisson’s ratio (ν)for certain types of soils are reported by many researchers in the literature, while, at the same time, emphasizing the importance and influence of the relative density of the specimen [38,39,40]. The above-mentioned values of dynamic parameters are in good comparison with those reported in the literature, confirming the trustworthiness of the tests conducted in the present laboratory test program. For the fiber-reinforced soils tested in this investigation, the overall ranges of the dynamic parameters, small-strain stiffness parameters and Poisson’s ratio (ν) obtained for all confining pressures are (a) Vs: 92.7–734.9 (m/s) and 66.5–604.4 (m/s), (b) Vp: 135.6–964.9 (m/s) and 89.8–960.7 (m/s), (c) G0: 15.2–1017.5 (MPa) and 8.18–663.02 (MPa), (d) E0: 32.4–1646.8 (MPa) and 11.2–1387.99 (MPa), and (e) ν: 0.01–0.48 for the First Arrival and Peak-to-Peak methods, respectively. Taking into consideration the wide range of the dynamic parameters obtained in this research effort and their increase with the increasing confining pressure, along with the following analysis, it was decided to use the average values of the dynamic parameters resulting from the values obtained for all confining pressures applied in each unreinforced or fiber-reinforced soil specimen in the parametric analysis reported in the subsequent sections.
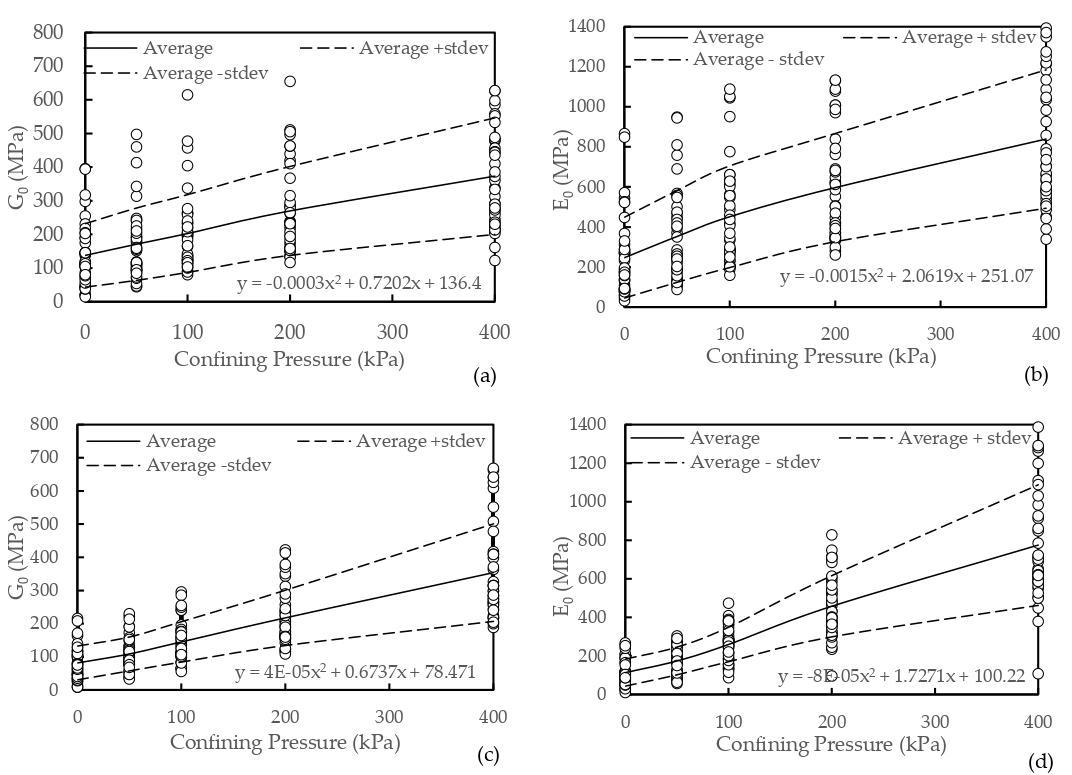
Since the small-strain stiffness parameters E0 and G0 are strongly affected by the confining pressure applied during the Bender Element Test, a more extensive analysis has been performed by the research team in order to quantify this trend and to compare the two adopted analysis methods. The total data obtained from the laboratory testing program are presented graphically, in accordance with five different confining pressures that were used. Figure 6 presents the small-strain stiffness parameters E0 and G0 of fiber-reinforced soils for the First Arrival and Peak-to-Peak methods. In each graph, the average value along with the standard deviation was calculated for each confining pressure. As a next step, a polynomial trendline, corresponding to the average line, was developed, and its formula is presented in each graph. This formula corresponds to a conventional small-strain stiffness relationship for the stiffness values E0 and G0 of the two adopted methods. The performance of each formula is considered satisfactory, since a wide percentage of the data for each graph is contained within the area of the standard deviation limits. More specifically, the performance percentages of Figure 6a, Figure 6b, Figure 6c and Figure 6d reach the values of 77%, 77%, 71%, and 66%, respectively. It is concluded that, for both methods, the small-strain stiffness parameters reach approximately 70% performance percentage.
The adoption of the appropriate method for the laboratory performance of Bender Element Tests is a factor of major importance. Both methods present repeatable results. Also, they can provide an experimental measurement at a very fast rate, with the Peak-to-Peak method indicating a slight advantage in terms of the determination of the sinusoidal wave peak time domain value. Furthermore, based on the analysis of Figure 6, it is observed that the First Arrival method presents larger standard deviation values, ranging from 7.94% to 218%, in comparison with the Peak-to-Peak method for the different confining pressures. Finally, by comparing the data of Figure 6, the Peak-to-Peak method generally presents lower values than the First Arrival method. This statement indicates an underestimation of the soil stiffness values in small strains, a factor that characterizes the Peak-to-Peak method in favor of safety in geotechnical design.

3.1. Fiber Length

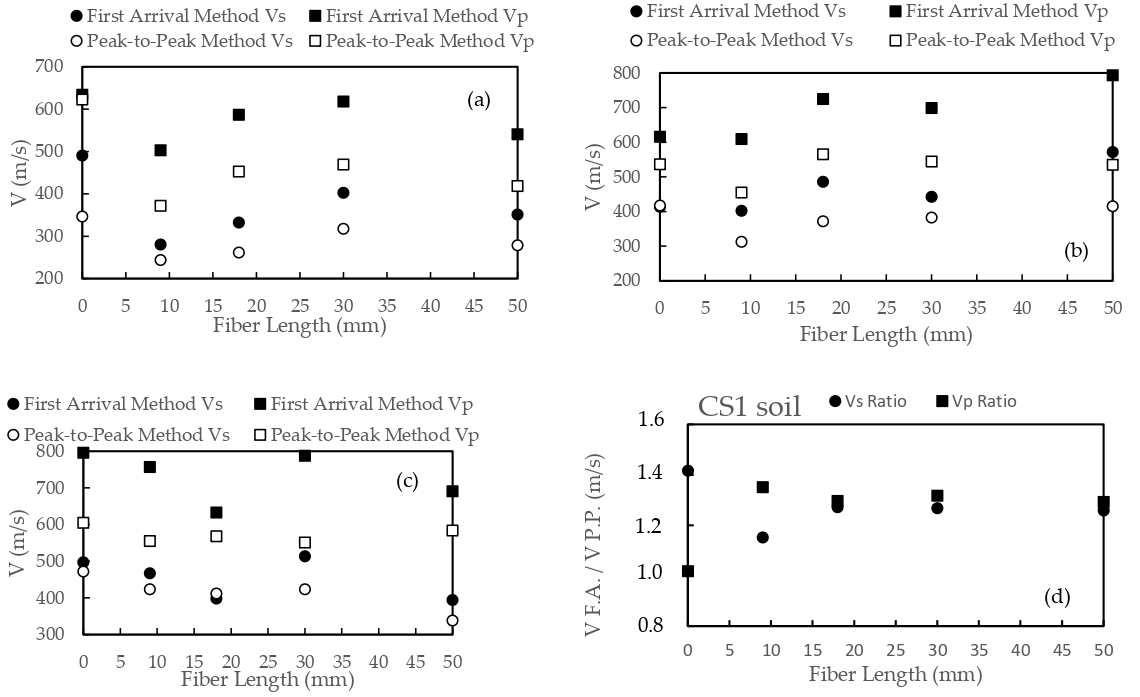
Presented in Table 4 are the average Vs, Vp, G0 and E0 values resulting from testing three different types of soils, reinforced with a content equal to 0.5% of monofilament fiber having lengths ranging from 9 mm to 50 mm, to study the effect of fiber length on the dynamic parameters of fiber-reinforced soils at very small strains. For comparison purposes, the corresponding average values for the unreinforced soils are also included in Table 5. Equations (4) and (5) indicate that the G0 and E0 values are proportional to the Vs and Vp values, respectively. Consequently, the values of the wave propagation velocities, Vs and Vp, are also plotted in Figure 7 as a function of fiber length for clarity reasons. It is observed that the values of the dynamic parameters obtained by applying the First Arrival method are generally greater than those obtained with the Peak-to-Peak method (Figure 7). The increase in fiber length up to 30 mm is accompanied by an increase in the dynamic parameters of fiber-reinforced CS1 soil obtained by applying both methods (Figure 7a,d). The ratios of the dynamic parameters between the two methods range from 1.02 to 1.42. The same behavior is generally observed for the CS2 soil reinforced with a fiber length up to 50 mm (Figure 7b). The effect of fiber length on the dynamic parameters is not clear in the CS3 soil (Figure 7c). By comparing the dynamic parameters of reinforced soils with those of unreinforced soils, the values of the reinforced soils that are greater than those of the corresponding unreinforced soils are highlighted in bold in Table 5. It is observed that the reinforced CS2 soil appears to indicate the optimum behavior by exhibiting generally larger values than the unreinforced soil for fiber lengths equal to or greater than 18 mm and all parameters obtained with the First Arrival method or the Vp and E0 parameters obtained with the Peak-to-Peak method. The superiority of the reinforced CS2 soil in comparison with the unreinforced soil can be attributed to the composition of this soil type, which favors cooperation with the fibers in terms of wave propagation in the soil. The synthesis of the CS2 soil appears to be the optimal combination with this particular type of fiber. A minor number of larger parameter values compared to those of the unreinforced soil is also observed for the reinforced CS3 soil (Table 5).

3.2. Fiber Content

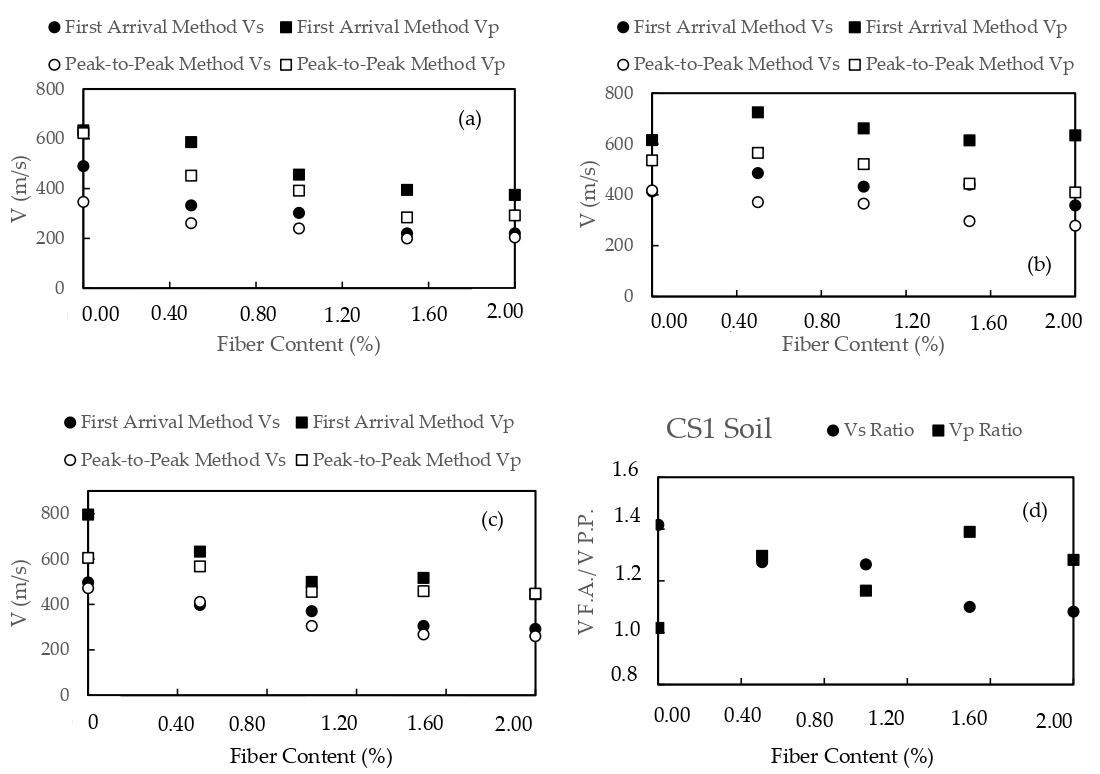
Fiber content is one of the key factors for the analysis of fiber-reinforced soil behavior in most research efforts. Presented in Table 6 are the average Vs, Vp, G0 and E0 values resulting from testing the three different types of soils, reinforced with monofilament fiber of length equal to 18 mm at contents ranging from 0.5% to 2.0%, to study the effect of fiber content on the dynamic parameters of fiber-reinforced soils at very small strains. For comparison purposes, the corresponding average values for the unreinforced soils are also included in Table 6. The values of the wave propagation velocities, Vs and Vp, are also plotted in Figure 8 as a function of fiber content for clarity reasons. As in the case of fiber length, it is observed that the values of the dynamic parameters obtained by applying the First Arrival method are generally greater than those obtained with the Peak-to-Peak method (Figure 8). The increase in fiber content is accompanied by a decrease in the dynamic parameters of all fiber-reinforced soils obtained by applying both methods (Figure 8). For example, in CS1 soil (Figure 8d), the ratios of the dynamic parameters between the two methods range from 1.01 to 1.41. The above-mentioned observation is in agreement with the extremely limited available information in the literature indicating that the increase of fiber content above 0.5% can lead to a significant decrease of the dynamic parameters at small strains [3,27]. The reported reduction in the maximum dry unit weight of the same fiber-reinforced soils with increasing fiber content [35] possibly indicates that the observed decrease of the dynamic parameters can be attributed to the reduction of compaction effectiveness due to the increased quantity of fibers in the composite material. More specifically, the increase in fiber content leads to a looser soil structure that does not favor the effective propagation of waves and results in reduced stiffness of the fiber-reinforced soil at very small strains. By comparing the parameter values of reinforced soils with those of unreinforced soils, it is observed that reinforced CS2 soil indicates, again, the optimum behavior with the inclusion of monofilament fibers by exhibiting generally larger values (highlighted in bold in Table 6) than the unreinforced soil for all parameters obtained with the First Arrival method at fiber contents up to 1.5%, and for the Vp and E0 parameters obtained with the Peak-to-Peak method at fiber contents equal to 0.5% and 0.5–1.0%, respectively. The general decrease with an increasing fiber content is supported by a previous research effort [35], where the increase in fiber content, even in CS2 soil, indicates a decrease in the maximum dry unit weight, γdmax, ranging from 2.3% to 9.9% in comparison with the unreinforced soil.

3.3. Soil Type and Fiber Type

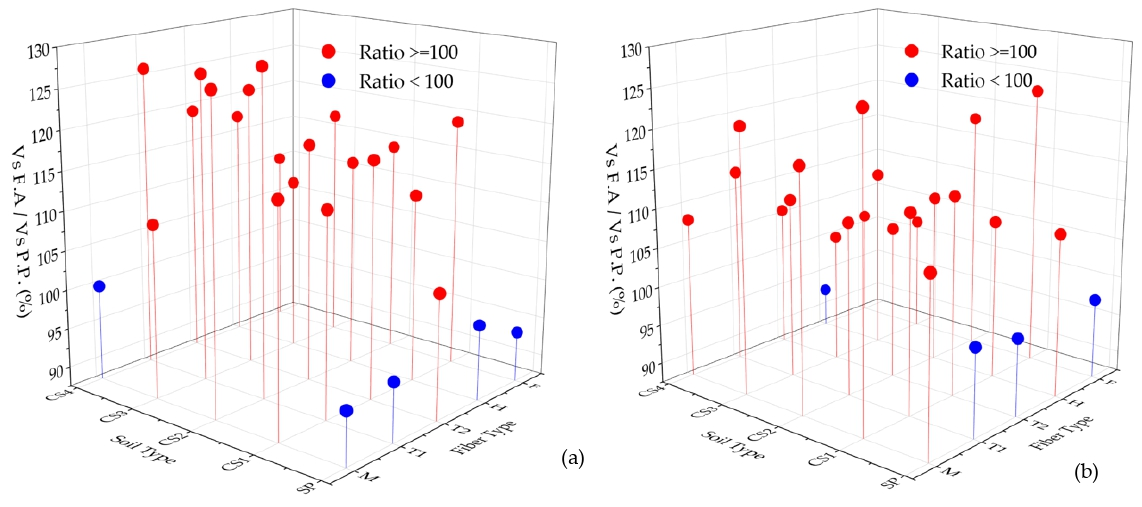
The study of soil and fiber types is a critical factor in evaluating the response of fiber-reinforced soil, as different geometric and mechanical characteristics of fibers can significantly affect stress transfer and interaction with the soil material. Presented in Table 7 are the average values of the dynamic parameters of all soil types reinforced with a content equal to 1% of all fiber types used in this research effort, keeping the fiber length constant and equal to 30 mm for the fibrillated fibers and 18 mm for all other fibers. The corresponding average values for the unreinforced soils are also included in Table 7 for comparison purposes. As shown in Figure 9, and it was also observed in the cases of fiber length and content, the values of the dynamic parameters obtained by applying the First Arrival method are generally greater than those obtained with the Peak-to-Peak method for the sand–clay mixtures (CS1–CS4 soils). On the contrary, the values of dynamic parameters obtained by applying both methods to the clean sand (SP soil) are generally comparable (Figure 9).
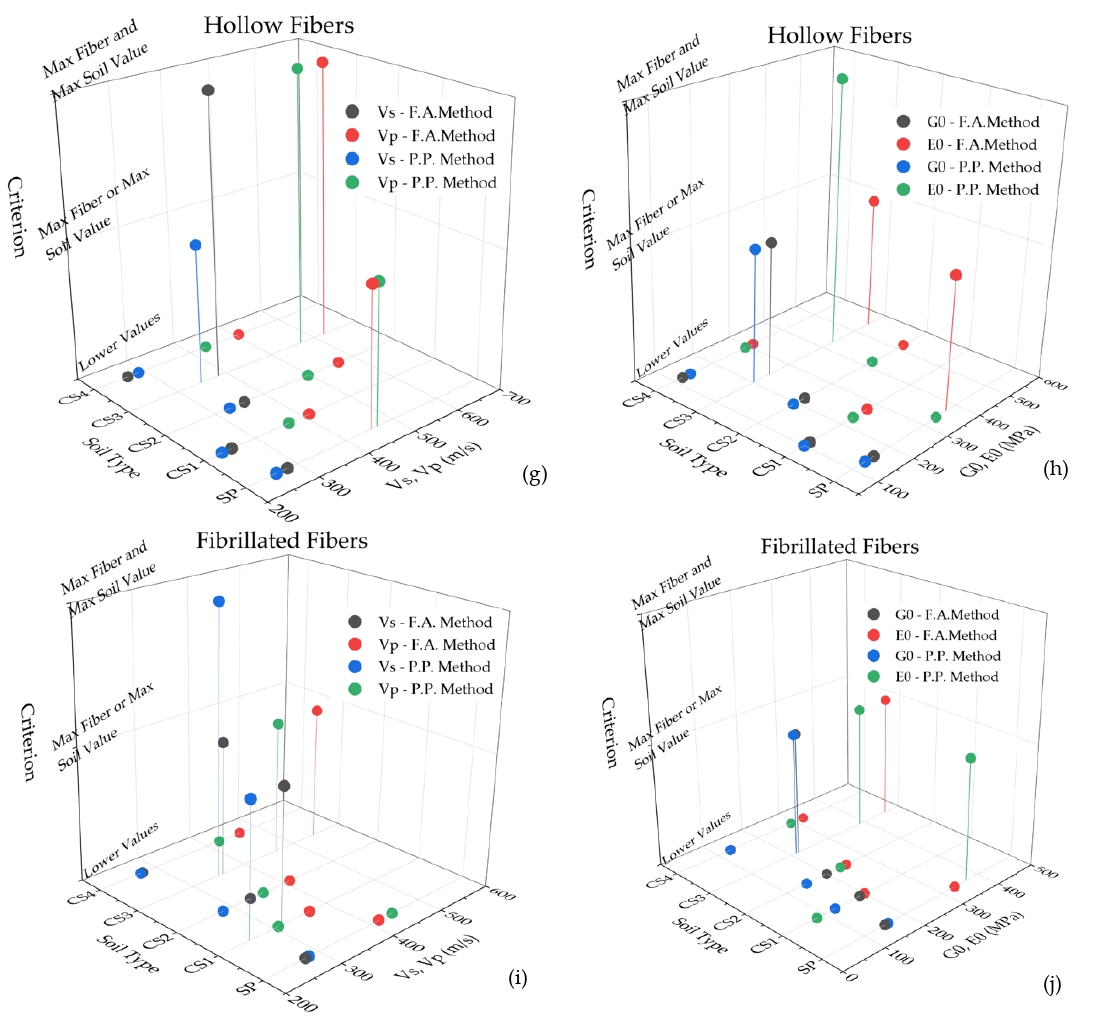
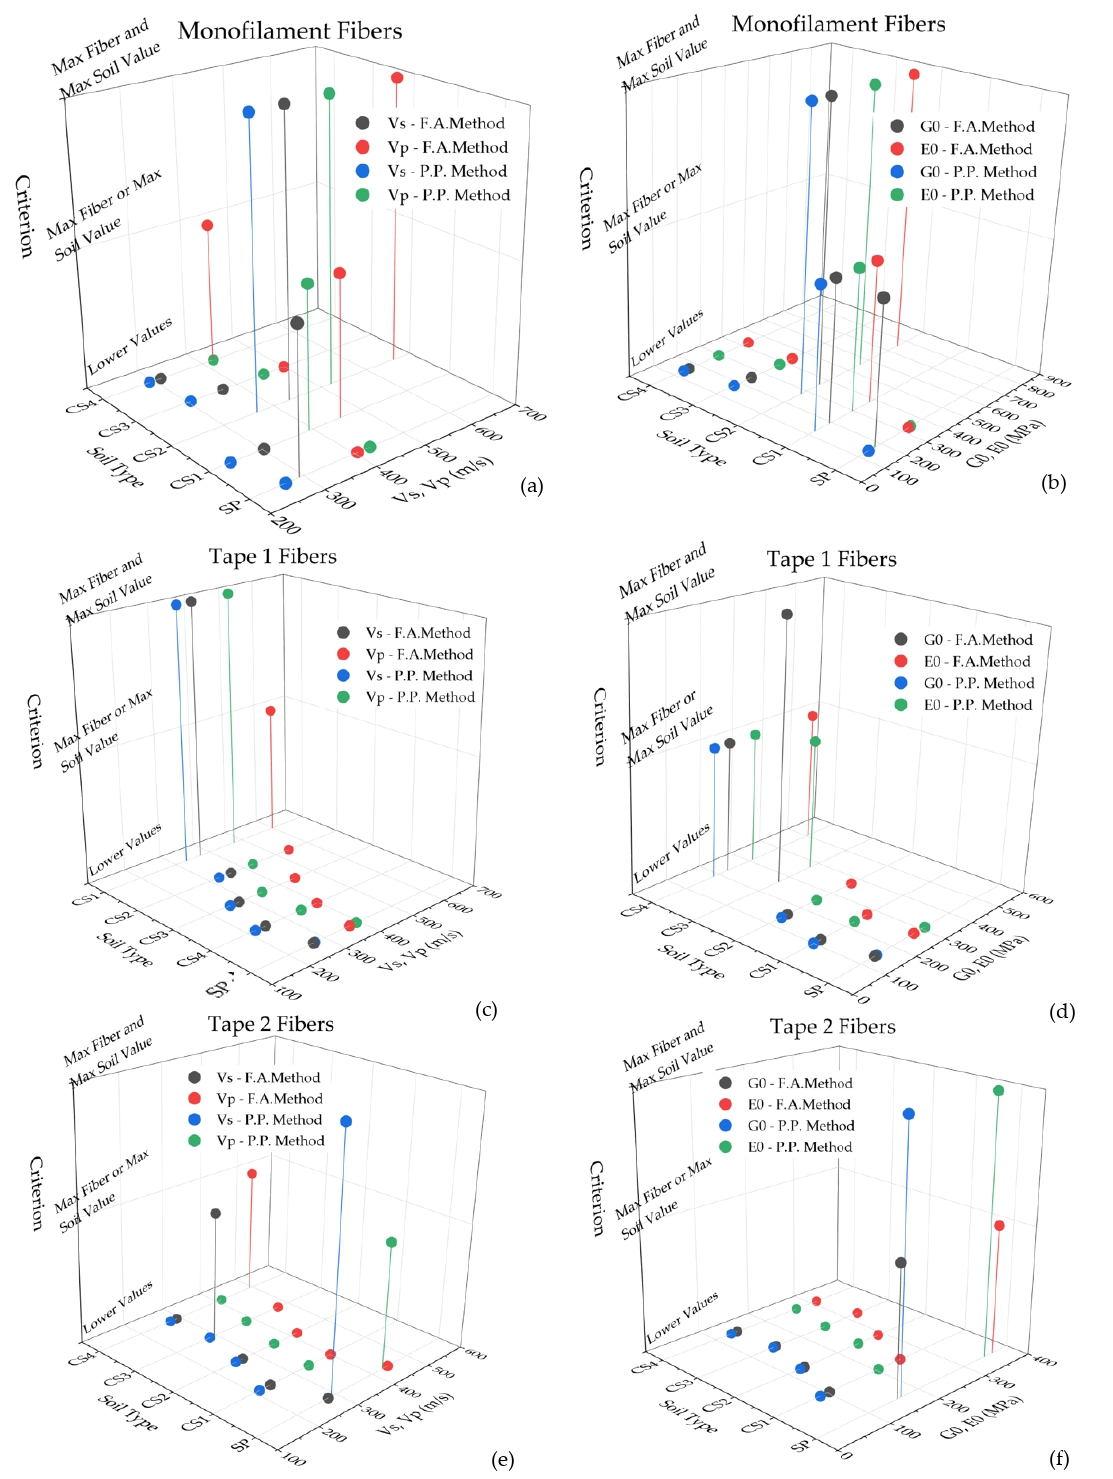
The criteria of best soil type performance for the same fiber and best fiber-type performance in the same soil, in terms of the greatest values of dynamic parameters shown in Table 7, were taken into consideration for the efficient evaluation of the effect of soil and fiber types on the dynamic behavior of fiber-reinforced soils at very small strains. Based on these criteria, the diagrams of Figure 10 were plotted, where the simultaneous satisfaction of both criteria places the points at the top level of the vertical axis, the satisfaction of one of the two criteria places the points at the intermediate level, and the points at the bottom level do not satisfy either of the two criteria. Optimum soil–fiber combinations are identified based on the results presented in Figure 10. More specifically, the best overall performance is achieved by the CS2 soil reinforced with monofilament fiber (Figure 10a,b), exhibiting generally maximum values of the dynamic parameters obtained by applying both methods in comparison with all the other soil–fiber combinations and greater values of the dynamic parameters than those of the unreinforced soil for the First Arrival method (highlighted in bold in Table 7). This optimum combination can be supported by a previous research effort [35], where CS2 soil presents better compaction characteristics in comparison with the other soil types. The specific clay content in this soil, along with the inclusion of monofilament fibers, enhances the particle packing of the specimen and the interlocking mechanisms between the grains and fibers. The superiority of the CS2 soil–monofilament fiber combination has also been noticed in the investigation of the effect of fiber length and content on the dynamic parameters of fiber-reinforced soils reported in the preceding sections. Furthermore, SP soil–tape 2 fiber (Figure 10e,f), CS1 soil–monofilament fiber (Figure 10a,b), CS3 soil–hollow (Figure 10g,h) or fibrillated fibers (Figure 10i,j), and CS4 soil–tape 1 fiber (Figure 10c,d) combinations present optimum performance by satisfying one or both of the above-mentioned criteria. Also, the CS4 soil reinforced with all fiber types exhibits an increase in Vs and G0 values (highlighted in bold in Table 7), obtained with the Peak-to-Peak method, in comparison with those of the unreinforced soil. It is noted that hollow fibers seem to present similar behavior to the other fiber types, despite their special characteristics. This extensive analysis indicates that the dynamic behavior of fiber-reinforced soils at very small strains is based on complex mechanisms involving the interaction between the soil and the fiber and depends on the combination of the soil and fiber particular characteristics.

4. Conclusions

Based on the results obtained and the observations made during this experimental investigation, and within the limitations of the range of parameters investigated, the following conclusions may be advanced:
  • The increase in confining pressure is accompanied by a clear, systematic, and significant increase in the propagation velocities of shear (Vs) and primary waves (Vp), indicating better activation of stress transfer mechanisms through fiber-reinforced soils. For the cohesive soils tested in this investigation, this tendency is generally accompanied by an improvement in Vs and Vp velocities of the fiber-reinforced soil compared to those of unreinforced soil;
  • The values of dynamic and small-strain stiffness parameters obtained by applying the First Arrival method are generally greater than those obtained with the Peak-to-Peak method for the cohesive soils (sand–clay mixtures). On the contrary, the values of dynamic and small-strain stiffness parameters obtained by applying both methods to the clean sand (SP soil) are comparable;
  • The effect of fiber length on the dynamic properties of monofilament fiber-reinforced soils depends on the soil type. For CS2 soil (70% sand–30% clay), longer fiber lengths (30 mm and 50 mm) contributed to an increase in the dynamic parameters, ranging from 7% to 55%, compared to those of the unreinforced soil, indicating a favorable interaction between long fiber lengths and this specific soil structure;
  • The dynamic parameters of monofilament fiber-reinforced soils decrease with an increasing fiber content. This behavior can possibly be attributed to the reduction in the compaction effectiveness due to the increased quantity of fibers in the composite material. Reinforced CS2 soil with fiber contents up to 1.5% exhibits generally larger values of dynamic and small-strain stiffness parameters (range: 5–32%) than the unreinforced soil;
  • The types of soil and fiber significantly affect the dynamic and small-strain stiffness parameters of fiber-reinforced soils at very small strains and result in specific soil–fiber combinations presenting optimum performance. The best overall performance is achieved by the CS2 soil reinforced with monofilament fiber, exhibiting generally maximum values of dynamic and small-strain stiffness parameters in comparison with all the other soil–fiber combinations and, in many cases, greater values of dynamic and small-strain stiffness parameters than those of the unreinforced soil. Also, the CS4 soil (25% sand–75% clay) reinforced with all fiber types presents an increase in Vs and G0 values ranging from 4% to 54% in comparison with those of the unreinforced soil;
  • This research effort systematically analyzes the dynamic behavior of fiber-reinforced soils at very small strains and provides a significant amount of experimental Bender Element measurements, enriching and supplementing the extremely limited available literature on this topic. This database could be very useful in practice in multiple seismic applications for the characterization of in situ soils according to the dynamic parameters. The results of this investigation can also be incorporated into correlations with the results of different laboratory testing devices. The correlation of small-strain and large-strain stiffness on the same specimen at the particular conditions of each test can possibly eliminate the need for additional resonant column tests. Also, these measurements can be utilized in the future as a guide or reference for the inclusion of other synthetic or natural fibers in soils, by comparing the dynamic behavior of fiber-reinforced soils and taking into consideration the environmental impact of each fiber type.

Author Contributions

Conceptualization, K.E.B. and I.N.M.; methodology, K.E.B. and I.N.M.; validation, K.E.B., E.S.B. and I.N.M.; formal analysis, K.E.B., E.S.B. and E.D.E.; investigation, K.E.B., E.S.B. and E.D.E.; resources, I.N.M.; writing—original draft preparation, K.E.B. and E.S.B.; writing—review and editing, K.E.B. and I.N.M.; visualization, K.E.B. and E.S.B.; supervision, I.N.M.; project administration, I.N.M. and K.E.B. All authors have read and agreed to the published version of the manuscript.

Funding

This research received no external funding.

Data Availability Statement

The original contributions presented in this study are included in the article. Further inquiries can be directed to the corresponding author.

Acknowledgments

Thanks are expressed to the company, Thrace Nonwovens and Geosynthetics S.A., for supplying the fibers and to the company, KEBE S.A. (Northern Greece Ceramics), for supplying the clay used in the present study.

Conflicts of Interest

The authors declare no conflicts of interest.

References

  1. Gabrys, K.; Sas, W.; Soból, E.; Głuchowski, A. Application of Bender Elements Technique in Testing of Anthropogenic Soil—Recycled Concrete Aggregate and Its Mixture with Rubber Chips. Appl. Sci. 2017, 7, 741. [Google Scholar] [CrossRef]
  2. Pantazopoulos, I.A.; Atmatzidis, D.K. Dynamic properties of microfine cement grouted sands. Soil Dyn. Earthq. Eng. 2012, 42, 17–31. [Google Scholar] [CrossRef]
  3. Heineck, K.S.; Coop, M.R.; Consoli, N.C. Effect of Microreinforcement of Soils from Very Small to Large Shear Strains. J. Geotech. Geoenvironmental Eng. 2005, 131, 1024–1033. [Google Scholar] [CrossRef]
  4. Karol, R.H. Chemical Grouting and Soil Stabilization; CRC Press Taylor and Francis Group: Boca Raton, FL, USA, 2003. [Google Scholar]
  5. Noorzad, R.; Zarinkolaei, S.T.G. Comparison of Mechanical Properties of Fiber-Reinforced Sand under Triaxial Compression and Direct Shear. Open Geosci. 2015, 7, 547–558. [Google Scholar] [CrossRef]
  6. Mirzababaei, M.; Arulrajah, A.; Horpibulsuk, S.; Aldava, M. Shear strength of a fibre-reinforced clay at large shear displacement when subjected to different stress histories. Geotext. Geomembr. 2017, 45, 422–429. [Google Scholar] [CrossRef]
  7. Shukla, S.K. Fundamentals of Fibre-Reinforced Soil Engineering; Springer Nature: Singapore, 2017. [Google Scholar]
  8. Gray, D.H.; Ohashi, H. Mechanics of Fiber Reinforcement in Sand. J. Geotech. Eng. 1983, 109, 335–353. [Google Scholar] [CrossRef]
  9. Consoli, N.C.; Montardo, J.P.; Prietto, P.; Pasa, G.S. Engineering Behavior of a Sand Reinforced with Plastic Waste. J. Geotech. Geoenviromental Eng. 2022, 128, 462–472. [Google Scholar] [CrossRef]
  10. Xiao, D.; Zhang, J.; Xu, W.; Wang, J.; Qiu, N.; Wu, J.; Ling, H.; Qu, B.; Yao, Z. 2024 Features of the Reinforcement–Soil Interfacial Effect in Fiber-Reinforced Soil Based on Pullout Tests. Constr. Mater. 2024, 4, 810–838. [Google Scholar] [CrossRef]
  11. Yetimoglu, T.; Salbas, O. A study on shear strength of sands reinforced with randomly distributed discrete fibers. Geotext. Geomembr. 2003, 21, 104–110. [Google Scholar] [CrossRef]
  12. Ahmand, F.; Bateni, F.; Azmi, M. Performance evaluation of silty sand reinforced with fibres. Geotext. Geomembr. 2009, 28, 93–99. [Google Scholar] [CrossRef]
  13. Gowthaman, S.; Nakashima, K.; Kawasaki, S. A state-of-the-art review on soil reinforcement technology using natural plant fiber materials: Past findings, present trends and future directions. Materials 2018, 11, 553. [Google Scholar] [CrossRef] [PubMed]
  14. Hejazi, S.M.; Sheikhzadeh, M.; Abtahi, S.M.; Zadhoush, A. A simple review of soil reinforcement by using natural and synthetic fibers. Constr. Build. Mater. 2012, 30, 100–116. [Google Scholar] [CrossRef]
  15. Zhu, H.-H.; Zhang, C.-C.; Tang, C.-S.; Shi, B.; Wang, B.-J. Modeling the pullout behavior of short fiber in reinforced soil. Geotext. Geomembr. 2014, 42, 329–338. [Google Scholar] [CrossRef]
  16. Evangelou, E.D.; Markou, I.N.; Verykaki, S.E.; Bantralexis, K.E. Mechanical behavior of fiber-reinforced soils under undrained triaxial loading conditions. Geotechnics 2023, 3, 874–893. [Google Scholar] [CrossRef]
  17. Bantralexis, K.E.; Vassou, A.G.; Markou, I.N. Strength prediction models for fiber-reinforced soils under effective stress triaxial compression testing. In E3S Web of Conferences; EDP Sciences: Les Ulis, France, 2025; Volume 644, p. 04002. [Google Scholar] [CrossRef]
  18. Liu, H.; Maghoul, P.; Shalaby, A.; Thomson, D. Ultrasonic characterization of frozen soils using a multiphase poromechanical approach. Comput. Geotech. 2023, 153, 105068. [Google Scholar] [CrossRef]
  19. Alnuaim, A.; Al-Mahbashi, A.M. Experimental Investigation for Shear Wave Velocity and Dynamic Characteristics of Unsaturated Sand–Clay Liners. Sustainability 2023, 15, 15681. [Google Scholar] [CrossRef]
  20. Aslmand, M.; Genes, M.C. Evaluation of Field Shear Wave Velocity in Deep Soil Mixing Based on Laboratory Studies. Tek. Dergi 2022, 33, 12335–12350. [Google Scholar] [CrossRef]
  21. Astuto, G.; Molina-Gόmez, F.; Bilotta, E.; Viana da Fonseca, A.; Flora, A. Some remarks on the assessment of P-wave velocity in laboratory tests for evaluating the degree of saturation. Acta Geotech. 2023, 18, 777–790. [Google Scholar] [CrossRef]
  22. Chan, C.-M. Bender Element Test in Soil Specimens: Identifying the Shear Wave Arrival Time. Electron. J. Geotech. Eng. 2011, 15, 1263–1276. [Google Scholar]
  23. Fernández Lavín, A.; Chamorro Zurita, C.; Ovando Shelley, E. An Alternative Method to Analyze Waveforms from Bender Element Tests in Soft Clays. Geotech. Geol. Eng. 2024, 42, 43–60. [Google Scholar] [CrossRef]
  24. Yamashita, S.; Kawaguchi, T.; Nakata, Y.; Mikami, T.; Fujiwara, T.; Shibuya, S. International round robin test on measurement of Gmax using bender elements. Soil Found. 2009, 49, 631–650. [Google Scholar] [CrossRef]
  25. Kuwano, R.; Jardine, R.J. On the applicability of cross-anisotropic elasticity to granular materials at very small strains. Géotechnique 2002, 52, 727–749. [Google Scholar] [CrossRef]
  26. Archer, A.; Heymann, G. Using small strain stiffness to predict the load settlement behaviour of shallow foundations on sand. J. S. Afr. Inst. Civ. Eng. 2015, 57, 28–35. [Google Scholar] [CrossRef]
  27. Li, H.; Senetakis, K. Dynamic properties of polypropylene fibre-reinforced silica quarry sand. Soil Dyn. Earthq. Eng. 2017, 100, 224–232. [Google Scholar] [CrossRef]
  28. Standard D2487-06; Standard Practice for Classification of Soils for Engineering Purposes (Unified Soil Classification System). ASTM: West Conshohocken, PA, USA, 2010.
  29. M 145-91; Classification of Soils and Soil-Aggregate Mixtures for Highway Construction Purposes. AASHTO: Washington, DC, USA, 2004.
  30. Standard D698-07; Standard Test Method for Laboratory Compaction Characteristics of Soil Using Standard Effort. ASTM: West Conshohocken, PA, USA, 2017.
  31. Fontana, F.; Rimoldi, P.; Scotto, M.; Vicari, M. Analysis of the generation of plastic debris and microplastics from geosynthetics. In Geosynthetics: Leading the Way to a Resilient Planet; CRC Press: Boca Raton, FL, USA, 2023; pp. 365–374. [Google Scholar]
  32. Yu, Y.; Battu, A.K.; Varga, T.; Denny, A.C.; Zahid, T.M.; Chowdhury, I.; Flury, M. Minimal impacts of microplastics on soil physical properties under environmentally relevant concentrations. Environ. Sci. Technol. 2023, 57, 5296–5304. [Google Scholar] [CrossRef] [PubMed]
  33. Monkul, M.M.; Özhan, H.O. Microplastic contamination in soils: A review from geotechnical engineering view. Polymers 2021, 13, 4129. [Google Scholar] [CrossRef] [PubMed]
  34. El Majid, A.; Baba, K.; Razzouk, Y. Expansive Soils Stabilized with Recycled Polypropylene Fibers: An Assessment Based on Laboratory and Life Cycle Data for Mechanical and Environmental Performance. Eng. Proc. 2025, 112, 28. [Google Scholar] [CrossRef]
  35. Evangelou, E.D.; Markou, I.N.; Christoforou, A.S. Compaction Characteristics of Fiber-Reinforced Soils. Int. J. Geosynth. Ground Eng. 2022, 8, 41. [Google Scholar] [CrossRef]
  36. Standard D8295-19; Standard Test Method for Determination of Shear Wave Velocity and Initial Shear Modulus Using Bender Elements. ASTM: West Conshohocken, PA, USA, 2019.
  37. Imoh, U.U.; Apata, A.C.; Bolorunduro, A.M.; Movahedi Rad, M. Mechanistic and comparative laboratory assessment of lime dosage and uniaxial geogrid on the strength and durability of classified lateritic subgrade. Sci. Rep. 2025, 15, 42901. [Google Scholar] [CrossRef] [PubMed]
  38. El-Sekelly, W.; Tessari, A.; Abdoun, T. Shear Wave Velocity Measurement in the Centrifuge Using Bender Elements. Geotech. Test. J. 2014, 37, 689–704. [Google Scholar] [CrossRef]
  39. Tarazona, S.F.M.; Moura, B.L.R.; Rodrigues, M.F.; Almeida, M.C.F.; Lmeida, M.d.S.S. Evaluation of the shear wave velocity (VS) of an artificial carbonate sand obtained with the use of bender elements test. DYNA 2021, 88, 211–219. [Google Scholar] [CrossRef]
  40. Ibrahim, A.; Noor, M.J.M.; Ibrahim, M.G.; Ahmand, M.N.; Ahmad, J. Maximum shear modulus evaluation based on continuous wavelet transform of bender element test. J. Phys. Conf. Ser. 2019, 1349, 012019. [Google Scholar] [CrossRef]
Figure 1. Image of the specimen compaction equipment.
Fibers 14 00077 g001
Figure 2. (a) Soil specimen placement in the chamber base; (b) Bender Elements chamber.
Fibers 14 00077 g002
Figure 3. Comparison of the compaction characteristics of specimens for Bender Elements testing (B.E.) with those resulting from the compaction test (Proctor), (a) optimum water content, wopt, and (b) maximum dry unit weight, γdmax.
Fibers 14 00077 g003
Figure 4. Typical experimental measurements for (a) P-Wave, and (b) S-Wave propagation obtained with Bender Elements (CS1 Soil—1% Hollow fiber of 18 mm).
Fibers 14 00077 g004
Figure 5. (a) Typical curves indicating the variation of Vs and Vp velocities with increasing confining pressure and (b) typical curves indicating the variation of the ratios of Vs and Vp velocities of fiber-reinforced soil to those of unreinforced soil with increasing confining pressure (CS3 soil—0.5% Monofilament fiber of 18 mm—Peak-to-Peak method).
Fibers 14 00077 g005
Figure 6. Graphical analysis of the total dataset of measurements for the two stiffness parameters G0 and E0, accompanied by conventional small-strain stiffness relationships. (a) G0, First Arrival method, (b) E0, First Arrival method, (c) G0, Peak-to-Peak method, (d) E0, Peak-to-Peak method.
Fibers 14 00077 g006
Figure 7. Effect of fiber length on the average values of wave propagation velocities of (a) CS1, (b) CS2 and (c) CS3 soil types reinforced with a content of monofilament fiber equal to 0.5%; (d) comparison between the 2 adopted methods.
Fibers 14 00077 g007
Figure 8. Effect of fiber content on the average values of wave propagation velocities of (a) CS1, (b) CS2 and (c) CS3 soil types reinforced with monofilament fiber of length equal to 18 mm, (d) comparison between the 2 adopted methods.
Fibers 14 00077 g008
Figure 9. Comparison of the ratio of average values of (a) Vp and (b) Vs wave propagation velocities obtained with the First Arrival and Peak-to-Peak methods for all combinations of fiber and soil types.
Fibers 14 00077 g009
Figure 10. Average values of dynamic parameters for all soil types reinforced with (a,b) monofilament fibers, (c,d) tape 1 fibers, (e,f) tape 2 fibers, (g,h) hollow fibers, and (i,j) fibrillated fibers in combination with the comparative criteria.
Fibers 14 00077 g010aFibers 14 00077 g010b
Table 1. Characteristics and classification of soils.
Soil DesignationMixing Proportions (%)
SP–CL
Characteristic Grain SizesAtterberg Limits
LL–PL
Soil Classification
USCS (AASHTO)
D90 (mm)D50 (mm)D10 (mm)
SP100–02.6200.8920.303-----SP (A-1-b)
CL *0–1000.0390.004<0.001446–21CL (A-7-6)
CS185–152.3080.6990.00726–17SC (A-2-4)
CS270–301.9610.5130.001429–17SC (A-2-6)
CS350–501.6660.131<0.001437–19SC (A-6)
CS425–751.0570.010<0.001445–20CL (A-7-6)
* This soil is used only for the production of the composite soils.
Table 2. Dimensions and mechanical properties of polypropylene fibers.
Fiber TypeDesignationDiameter/Thickness
(μm)
Width
(mm)
Length
(mm)
Tensile Stress at
Failure (N/mm2)
Elongation at
Failure (%)
MonofilamentM35-----9, 18, 30, 5057020.2
Tape 1T1431.131854123.3
Tape 2T2382.781855627.0
HollowH45-----1851354.2
FibrillatedF422.783041612.1
Table 3. Bender Elements laboratory testing program.
Soil TypeFiber TypeFiber Content (%)Fiber Length (mm)Examined Parameter
SP, CS1, CS2, CS3, CS4M, T1, T2, H, F118 or 30 *Soil Type, Fiber Type
CS1, CS2, CS3M0.59, 18, 30, 50Fiber Length
CS1, CS2, CS3M1.5, 218Fiber Content
* Fibrillated fibers.
Table 4. Bender Element duplicate tests program.
Soil TypeFiber TypeFiber Content (%)Fiber Length (mm)
CS1, CS2, CS3--
CS1, CS2, CS3M, H, F0.518 or 30 *
CS1M1.030
CS2M1.09
CS3M1.018
* Fibrillated fibers.
Table 5. Effect of fiber length on the average values of dynamic parameters of three soil types reinforced with a content of monofilament fiber equal to 0.5%.
Soil
Type
Fiber
Length
(mm)
First Arrival MethodPeak-to-Peak Method
Vs
(m/s)
Vp
(m/s)
G0
(ΜPa)
E0
(MPa)
Vs
(m/s)
Vp
(m/s)
G0
(ΜPa)
E0
(MPa)
CS10490.62634.00473.16616.44346.36622.70238.98599.26
9280.30 502.68165.03419.72243.36371.98128.51285.88
18332.20 586.86210.90523.34261.10452.52139.72348.48
30402.34 617.72329.70711.84317.24468.86207.75444.36
50351.02 540.44249.30554.34278.72418.20162.84352.82
CS20413.48615.58342.98720.08417.44536.08359.18523.56
9401.80609.10316.24694.56312.36454.68197.90417.80
18485.92724.78453.04982.84371.54565.36276.48608.84
30442.28698.50370.70853.52382.70544.52292.83587.00
50571.80793.48636.261118.6414.72535.16340.06505.11
CS30496.92795.70453.421057.5471.54604.88410.22492.13
9467.26756.46398.70926.04423.02554.90347.10545.64
18397.94632.94297.34693.10403.62549.08317.76535.34
30513.46787.58478.061073.52423.64550.90340.08526.16
50394.02690.60285.64715.44338.24583.58219.80529.10
Values with bold characters indicate an increase in the dynamic parameter value of the fiber-reinforced soil in comparison with the unreinforced soil.
Table 6. Effect of fiber content on the average values of dynamic parameters of three soil types reinforced with monofilament fiber of length equal to 18 mm.
Soil
Type
Fiber
Content
(%)
First Arrival MethodPeak-to-Peak Method
Vs
(m/s)
Vp
(m/s)
G0
(ΜPa)
E0
(MPa)
Vs
(m/s)
Vp
(m/s)
G0
(ΜPa)
E0
(MPa)
CS10.0490.62634.00473.16616.44346.36622.70238.98599.26
0.5332.20586.86210.90523.34261.10452.52139.72348.48
1.0303.04455.98192.14376.26239.84392.36126.42294.94
1.5219.72395.30101.08259.10199.72284.4884.74171.19
2.0220.20374.6099.68243.78203.70292.3690.30185.04
CS20.0413.48615.58342.98720.08417.44536.08359.18523.56
0.5485.92724.78453.04982.84371.54565.36276.48608.84
1.0432.48661.70359.72752.62365.92520.74275.50558.46
1.5440.38614.82365.62695.14296.66443.84175.50386.71
2.0358.88633.82235.16555.66279.42410.08149.94312.20
CS30.0496.92795.70453.421057.58471.54604.88410.22492.13
0.5397.94632.94297.34693.10403.62549.08317.76535.34
1.0371.18499.38251.66439.43305.96455.86174.80380.24
1.5305.36516.70168.26406.76268.50458.60135.22329.04
2.0292.50445.08146.72254.40260.86447.84236.24349.64
Values with bold characters indicate an increase in the dynamic parameter value of the fiber-reinforced soil in comparison with the unreinforced soil.
Table 7. Effect of soil and fiber types on the average values of dynamic parameters of soils reinforced with fiber content equal to 1%.
Soil
Type
Fiber
Type
First Arrival MethodPeak-to-Peak Method
Vs
(m/s)
Vp
(m/s)
G0
(ΜPa)
E0
(MPa)
Vs
(m/s)
Vp
(m/s)
G0
(ΜPa)
E0
(MPa)
SP0288.16462.60168.60397.60299.30486.64188.44452.16
M (18 mm)292.42406.00172.28330.62266.60430.64144.46341.62
T1 (18 mm)268.24372.36143.88274.12271.56391.80149.64311.76
T2 (18 mm)280.40443.64156.94365.84287.82429.20164.24347.42
H (18 mm)280.08452.18157.34370.58258.62465.38133.22338.62
F (30 mm)275.92417.24150.64334.68282.12444.14158.24366.90
CS10490.62634.00473.16616.44346.36622.70238.98599.26
M (18 mm)303.04455.98192.14376.26239.84392.36126.42294.94
T1 (18 mm)247.84396.24122.02273.40219.88349.74100.24230.78
T2 (18 mm)240.30401.00103.74251.30212.80341.2286.16204.88
H (18 mm)253.24411.42114.76273.22234.74368.8499.76232.40
F (30 mm)312.90367.36187.96200.40254.20307.88126.2681.30
CS20413.48615.58342.98720.08417.44536.08359.18523.56
M (18 mm)432.48661.70359.72752.62365.92520.74275.50558.46
T1 (18 mm)280.42446.54158.12370.40255.88347.36139.18251.66
T2 (18 mm)271.76418.34132.60289.58254.08355.16124.22246.06
H (18 mm)359.22567.16223.90521.52329.10497.42192.74422.48
F (30 mm)334.12410.72199.54250.96282.84358.48148.50235.28
CS30496.92795.70453.421057.58471.54604.88410.22492.13
M (18 mm)371.18499.38251.66439.43305.96455.86174.80380.24
T1 (18 mm)361.96540.82265.38573.82327.21427.64224.82371.82
T2 (18 mm)295.72471.38150.26326.78284.60382.46144.36253.24
H (18 mm)384.00622.58245.32543.90347.36567.30202.50431.20
F (30 mm)356.36542.72218.30459.20348.48463.02213.20386.44
CS40371.40676.88235.26571.16260.92630.22119.22313.92
M (18 mm)314.52621.94162.78429.34291.28423.08141.06294.08
T1 (18 mm)371.62598.86229.68504.40330.58475.94183.92310.32
T2 (18 mm)291.38491.76143.20311.84275.88412.52131.10267.24
H (18 mm)267.54507.74120.82313.34289.46433.60141.44291.26
F (30 mm)275.86465.58131.64322.20272.48423.86129.76288.58
Values with bold characters indicate an increase in the dynamic parameter value of the fiber-reinforced soil in comparison with the unreinforced soil.
Disclaimer/Publisher’s Note: The statements, opinions and data contained in all publications are solely those of the individual author(s) and contributor(s) and not of MDPI and/or the editor(s). MDPI and/or the editor(s) disclaim responsibility for any injury to people or property resulting from any ideas, methods, instructions or products referred to in the content.