Article

Impact of Use of Surfactants and a Pulse Sonicator on Length and Fiber Count Determinations for Natural and Synthetic Microfibers Using the OpTest Fiber Quality Analyzer


by
Chanel Angelique Fortier
and
Michael Santiago Cintron
*
United States Department of Agriculture, Agricultural Research Service, Southern Regional Research Center, New Orleans, LA 70124, USA
*
Author to whom correspondence should be addressed.
Fibers 2026, 14(5), 58; https://doi.org/10.3390/fib14050058
Submission received: 15 September 2025 / Revised: 14 April 2026 / Accepted: 23 April 2026 / Published: 12 May 2026

Abstract

There is growing concern about the ubiquitous presence of microfibers in waterways, atmosphere, and soil. Thus, the study of microfibers is of interest. Presently, there is no standard method for quantifying microfibers, so the objective of the current study was to employ a Fiber Quality Analyzer 360 (FQA) to examine microfibers with image analysis. In this study, two surfactants, Teric 169 and Surfonic LF-17, have been independently added to synthetic and natural microfiber suspensions to investigate their impact on arithmetic length and fiber count measurements. Herein, it has been observed that surfactants with pulsed sonication were shown to positively impact the synthetic microfibers suspensions, yielding statistically different higher fiber counts compared to the controls. However, the natural microfibers were found to produce fiber counts independent of the surfactant addition when compared to controls. In addition, the arithmetic lengths for polyester and nylon increased compared to a previous study, whereas the acrylic microfibers only changed marginally. Clearly, these results indicated that, with the pulsed sonication and surfactant addition pretreatment to water suspensions of microfibers, the FQA can be used to quickly and easily examine synthetic and natural microfibers in a single research study.

1. Introduction

Microplastics are gaining research importance in large part due to mounting evidence documenting their widespread pollution coupled with their resistance to biodegradation [1,2,3]. These small polymeric particles ranging in size from 1 µm to 5 mm can stem from the laundering and the wear and tear of clothes, as well as from bulk plastics [4,5]. Microplastics derived from synthetic textiles can also be described as microfibers [6]. While microfiber is a more general term that considers breakaway fibers originating from either synthetic or natural textiles, the general size limitations of microplastics are maintained [7].
The pervasive nature of synthetic microfibers has led to them being readily found in many areas of the environment [8], including in sediment [9,10], air [11,12,13,14,15], and fresh [16] and marine waters [17,18,19,20,21,22,23]. Another alarming fact is that microplastics have been found in food, bottled water, and tap water ingested by humans [24]. Complicating this problem is the lack of legislation for microplastics in food. Thus, a standard method to analyze microfibers is needed to protect the environment and human health [25].
Microplastics and microfibers mainly initiate from the wastewater of domestic washing machines [26] and are exposed to the air from clothes dryers [27]. Previous studies have revealed that microplastics and synthetic microfibers tend to degrade more slowly than natural microfibers, which have been shown to biodegrade in the ecosystem [28,29].
While additional research is needed to better understand the full impact of microfibers on the environment, there is increasing interest in adopting practices in textile and apparel production that will decrease the release of microfibers and microplastics [30,31,32,33]; thus, is it is imperative that fast and accurate methods for measuring microplastics and microfibers are established to help monitor the effects of yarn and fabric production limiting microfiber production.
There are many studies on the detection, characterization, and quantification of microfibers and microplastics [34,35,36]. Specific methods include visible identification [37,38], vibrational spectroscopy [39,40], filtration, electronic and optical microscopy [41], and liquid chromatography-tandem mass spectroscopy [42].
Formerly, different sampling protocols for studying microfibers can be found in the literature, specifically in large bodies of marine water. An initial study by Barrows and colleagues involved collecting samples using a 1 L grab container or a 335 micron neuston net tow off the coast of Maine [43]. When comparing these two sampling techniques, the commonly used neuston net was determined to undercount microplastics, while the grab technique was favored since it was determined to have collected three orders of magnitude more microplastic per volume of water with minimal contamination [43]. In a related study by this group, Miller and colleagues examined samples from the Hudson River and reported on the ubiquitous presence of anthropogenic pollution [44]. Both plastic and non-plastic microfibers stemming from textiles were acquired. Overall, their sampling protocol involved collecting surface samples followed by filtration to determine the number of microfibers. In a follow-up study, one-liter samples from open oceans and coastal sites have been collected and analyzed by citizens and professional scientists. These studies reported that microplastics were the predominant samples collected. However, microfibers that were non-synthetic and semi-synthetic were also collected, with microfibers previously being grossly under-reported when compared to global model predictions. To identify the types of samples collected, micro-Fourier Transform spectroscopy was used [45].
Some of the disadvantages of using vibrational spectroscopy to identify microfibers stem from the size and the existence of dye on the microfibers [46]. Specifically, attenuated total reflection-Fourier Transform infrared spectroscopy (ATR-FTIR) is limited by its dependence on intimate contact with the sample to generate an identifying signal, as microfibers may be too fine or short for adequate examination by ATR-FTIR. In terms of Raman spectroscopy, maintaining the sample in the same place throughout analysis may pose a challenge in microfiber identification. Further complicating vibrational spectroscopic analysis is the presence of dyes on microfibers, which may obscure the true identification of the textile polymers [46].
Quantifying anthropogenic microfibers was reported to be limited by the size and shape of natural and semisynthetic fibers that are commonly digested, leading to their underestimation in the literature [47]. To mitigate this issue, it is suggested that steps should be taken to minimize contamination and fully capture microfibers in samples through low-temperature studies and wearing colored laboratory coats (orange or pink) instead of white, as these are not commonly found in environmental samples.
There are numerous reports in the literature of quantifying microfibers released during laundering [48,49,50,51,52,53,54] with varying methodologies and sampling techniques. Specifically, Han and colleagues [55] developed a method to measure the number of cotton and polyester microfibers in water suspensions from domestic laundry, deriving a density function for their corresponding length distributions using spectrophotometry and kernel estimation. It was shown that absorbance values had a linear correlation with mass concentrations. Another study quantified microfiber release during domestic laundering by the installation of sustainable filtering systems which had a retention efficiency between 52% and 86%, depending on the number of washing cycles and filter arrangements [56]. Lupato and colleagues [57] reported on a standardized, validated, sensitive, fluorescence-based method to measure polyester-based microfibers. Automated static particle analysis has also been used to quantify and characterize microfibers and microplastics in washing effluents based on size distribution, shape analysis, and particle count, employing a high-resolution imaging and advanced image processing method [58]. McIlwraith et al. [49] found that when two technologies were used to measure the count, length, and weight of microfibers from laundering the Lint LUV-R captured 87% and the Cora Ball collected 26% by count of microfibers. In addition, the Lint LUV-R filter reduced the weight and average length of fibers in the washing machine effluent. Studies based on clothes dryer emissions of microfibers have been performed. Erdle and colleagues [59] measured microfibers emitted into the air by commercial clothes dryers using passive samplers at ten laundromats, observing that these locations are often unregulated and unaccounted for in microfiber mitigation strategies. Microfiber emission was also measured by placing a mesh over dryer vent exhausts during normal household use of clothes dryers through a participatory science approach [60]. This study required participants to record information about their dryer use by employing a mobile phone application over the course of three months. Using a microscope enabled by a Fourier Transform Infrared (FTIR) spectrometer, it was found that cellulosic material found on the vents made up the largest microfiber type measured followed by proteinaceous and polyester material. Primpke et al. [61] also used FTIR imaging to identify and calculate microfibers and microplastics. Moreover, Xu et al. [62] employed FTIR and Raman imaging for microplastic analysis. Given the different approaches used in these studies for quantifying microfibers, direct comparisons is challenging. There is a need to develop a standardized method of microfiber quantification.
Morphology is also a factor that should be considered when analyzing microfibers [41] especially since researchers determined that morphological classification was possible with microfibers and that the impact of this sampling protocol could be used to determine the sources, weathering stages, and ecological risks of microfibers [63,64,65]. Dreillard and colleagues used a sampling protocol which included filtration, optical and scanning emission microscopy, and image post-processing [41]. Using these techniques, the number and size of microfibers were determined. However, one limitation of this method was that it did not decipher between the mass belonging to microfibers from the mass derived from other compounds that may have been in the filtrate solutions. Also, any amorphous compound included in the filtration step is currently undefined. In another study, Yan and colleagues investigated the length, diameter, and surface roughness of microfibers through calculations using a digital microscope [66]. Both natural and synthetic fibers were analyzed through statistical analysis and Fourier Transform spectroscopy. Ultimately, three classifications were defined where type I consisted of synthetic cellulosic microfibers and type II and type III largely consisted of polymers.
In a series of recent examinations [28,29], researchers saw use of the Fiber Quality Analyzer for quantifying microfibers generated from accelerated laundering and home laundering studies. Use of the FQA allowed researchers to quickly determine the number of microfibers, their length and width distribution in their samples [29]. Moreover, it was reported that among the fabrics tested, cotton and rayon samples were found to shed more microfibers than polyester, according to the FQA. This observation was made using detergent in laundering for all samples with the statistical exception of rayon. Overall, this behavior was attributed to the creation of microfibers with 25–200 μm in length, which were present to a larger extent, from a count basis, than the microfibers with length > 200 μm [29]. However, despite the relative ease of use of the FQA, there was no validation presented of possible FQA detection bias among the various investigations.
In a series of studies [67,68], Santiago Cintron and colleagues have confirmed the importance of proper microfiber dispersion for detection of natural and synthetic samples by the FQA. For instance, in the initial study [67], they used a probe sonicator to disperse water suspensions of rayon and cotton microfiber samples prior to examinations with the FQA. This short sonicator step improved detection efficiency of the FQA for these two types of natural fibers compared to studies without the sonicator. Moreover, it was determined that the sonication step did not cause sample fragmentation since mean length results decreased by 5% on average for the sonicated samples [67]. A related study then explored the use of the probe sonicator in sample preparation and showed high detections for cotton, ramie, and viscose as natural microfibers [68]. Furthermore, in this study, the results showed an increase in microfiber counts with sonication for cotton, flax, and viscose at 116, 101, and 99%, respectively. Nevertheless, detection estimates for the synthetic microfibers such as acrylic, polyester, and polyamide ranged between 14% and 77%. It was observed that the synthetic microfibers were not well dispersed, even when using the pulsed sonication with the FQA. These results pointed to the need for additional sample preparation steps that can mitigate the detection bias seen for the synthetic microfibers samples of polyester, polyamide, and acrylic. In the current study, two surfactants were studied. One low-foaming surfactant was added at a time to microfiber suspensions, and the impact on FQA microfiber quantification was assessed. The addition of the surfactant to the sample preparation protocol was expected to improve microfiber wettability and dispersion capabilities [69]. The methodology used in the study was representative of environmental samples since it included microfibers dispersed in water suspensions which would be found in laundering as well as marine and fresh water studies, though the current method is simplified to avoid effects of contamination.

2. Materials and Methods

2.1. Microfiber Samples

Cotton samples were obtained from the Agricultural Marketing Service (AMS; as a CM-129 micronaire standard) (Washington, DC, USA). Acrylic and viscose were prepared using spinning slivers from Falls Farm, LLC (Young Harris, GA, USA). Nylon was obtained from an industry group (USA). Polyester (PET 2.6) DAK fibers at 2.6 dtex were acquired from (Alpek Polyester; Charlotte, NC, USA). Cotton, acrylic, viscose, polyester, and nylon samples were run through a Thomas Model 4 Wiley mill (Thomas Scientific, Swedesboro, NJ, USA) using a 30-mesh filter to generate microfibers. To separate the microfibers based on size, each microfiber type was individually passed through U.S. ASTM-grade stacked sieves, ranging in sizes of 100 (Advancetech Mentor, OH, USA), 200 (Advancetech), and 325 (W.S. Tyler Company, Mentor, OH, USA), while simultaneously being shaken for 15 min employing a Humboldt H-4330 (Humboldt Mfg. Co., Elgin, IL, USA) and a motorized device. PET 2.6 microfibers were collected from the 200-sized sieve. Cotton and acrylic microfibers were acquired from the 100-sized sieve. Nylon microfibers were collected from 100 plus 325 sieves. Viscose microfibers were collected from the 100 minus 325 sieves.

2.2. Cotton Fiber Scouring Procedure

To prepare the scoured cotton microfibers used in this study, cotton from three random places in the raw calibration fiber was used to generate 5 g of sample. Next, a fiber blender (Custom Scientific Instruments, Easton, PA, USA) was employed to blend the cotton fiber three times. The combined cotton sample was then placed in 750 mL of distilled water in a 1000 mL beaker. A 1% Triton aqueous solution (Fisher Scientific, Pittsburgh, PA USA) was then added to the beaker to maximize wettability of the cotton fiber. The sample beaker was then heated to 95 °C and stirred for 15 min. Afterwards, sodium hydroxide (50% solution, Fisher Scientific) was added to the sample beaker to obtain a 1.75% concentration. The sample was then allowed to stir at 95 °C for 2 h. Next, the fiber sample was rinsed three times by placing the cotton in beakers with approximately 750 mL of warm, distilled water. Following the rinsing step, 0.125% acetic acid solution was added to the fiber sample at room temperature while stirring for 15 min. The resulting cotton fibers were then rinsed with distilled water, squeezed to eliminate surplus water, and allowed to dry overnight. Following the drying step, the cotton sample was blended three times for a second time to obtain a more uniform sample.

2.3. Microfiber Protocol with FQA

Experiments with and without surfactants were carried out to determine the effect of the liquid surfactants on the suspension of microfibers using a 50 W probe sonicator (Fisher brand model 50, Fisher Scientific, Pittsburgh, PA, USA). Microfiber samples for cotton, acrylic, viscose, PET 2.6, and nylon were investigated with the FQA (OpTest Equipment INC., Hawkesbury, ON, Canada). For each microfiber investigation, all microfibers were allowed to condition overnight in a lab at 21 ± 1 °C and 65% relative humidity. Next, for each microfiber type, approximately 0.0020 g of microfiber was weighed in a 20 mL scintillation vial employing an analytical balance (Mettler Toledo XSR205DU, Mettler-Toledo, LLC, Columbus, OH, USA). The Teric 169 surfactant was selected for this study since it is routinely used with the Cottonscope instrument to help suspend raw cotton fibers that still contain surface waxes. This surfactant was originally acquired from Australia and there was difficulty in obtaining more of the surfactant due to export limits. Thus, a second surfactant was explored as well. Since the Surfonic LF-17 surfactant was more concentrated and more of it was present, it was selected as the second surfactant in this study. For the Teric 169 surfactant (Huntsman, Australia), the dilution was 5 mL surfactant in 1 gallon of deionized water. Then, the following amounts were taken from this dilution: 0 mL, 5 mL, and 10 mL. For the Surfonic LF-17 surfactant (Huntsman, USA), the dilution was 2 mL of surfactant in 1 gallon of deionized water. Then, the following amounts were taken from this dilution: 0 mL, 0.5 mL, 1 mL, 1.75 mL, 2.5 mL, and 3.5 mL. The concentrations of the surfactants used were chosen after optimization studies were performed to minimize the amount needed to carry out the experiments. For the 0 mL studies for both surfactants, 17 mL of filtered deionized was added to the vials following the addition of the microfibers. Both surfactants were chosen because they had low-foaming characteristics, as high-foaming surfactants could affect quantification studies with formation of bubbles that could result in overestimation of the microfiber samples. For studies with the surfactant added, the final volume of filtered deionized water in the vial was adjusted to 17 mL with the microfibers and detergent. Next, pulsed sonication was carried out on the vials for 5 min, where pulsing was stopped every 30 s to improve suspension of the microfibers and maintain the efficacy of the probe sonicator. After sonication, the suspended microfibers in the vial were quantitatively transferred to a dry 600 mL Nalgene plastic beaker (Nalge Nunc International, Rochester, NY, USA). Then, deionized water was added to the beaker to reach 600 mL. The suspended sample was then mixed for 3 min and analyzed using the FQA. To prepare for an FQA run, the FQA instrument was purged three times and degassed once. Also, a purge was run before each new microfiber suspension analysis. For the Teric 169 surfactant, each microfiber sample type was run in triplicate. For the Surfonic LF-17 surfactant, each microfiber sample type was run with five replicates. Both the arithmetic (Ln) and length weighted (Lw) mean lengths as well as fines were determined by the FQA instrument using the equations from the manufacturer. The mean fiber count and percent difference for microfiber samples were calculated from the FQA reports and Excel (Excel for Microsoft 365, Version 2304, Microsoft Corporation, Redmond, WA, USA).

2.4. Statistical Analysis

Statistical methods were performed using Microsoft Excel spreadsheets (Microsoft 365, Version 2304, Microsoft Corporation, Redmond, WA, USA) and FQA instrument reports. Subsequent data was entered into the JMP 17.0 software (SAS Institute Inc., Cary, NC, USA). One-way ANOVA analyses (alpha level of 0.05) were performed for each microfiber type at the various surfactant levels, (six groups, n = 30). Tukey’s honestly significance difference (HSD) with 0.05 alpha was also performed comparing the detergent level for each microfiber groups. For the connecting letters reports, groups not connected by the same letter are statistically different.

2.5. Microfiber Morphology Studies

Scanning electron microscopy (SEM) single-fiber studies of acrylic, cotton, nylon, polyester, and viscose were analyzed using a Quanta 3D FEG FIB/SEM (FEI Company, Hillsboro, OR, USA). The field emission gun was operated at an accelerating voltage of 15 kV, with ranges of magnification at 2550–2600× and 4800–4900× and a gun current of 6.3 pA. Each sample was mounted on stubs using double-sided tape and had a sputtered gold coating of 7.0 nm.

3. Results and Discussion

3.1. FQA Results of Fiber Count, Percent Difference, Arithmetic Mean Length, and Percent Fines

In recent studies employing accelerated laundering and home laundering with the Fiber Quality Analyzer (FQA), researchers have determined the number of microfibers released, as well as the length and width distribution from knitted fabrics comprising cotton, rayon, and polyester [29]. In that study, it was demonstrated that this FQA imaging and hydraulic-based system was relatively easy and fast to use, and originally gained its popularity in use from the pulp industry [29]. Moreover, it was reported that among the fibers tested, cotton and rayon were found to shed more microfibers than polyester, according to the FQA. This observation was noted using detergent in laundering for all samples with the statistical exception of rayon. Overall, this behavior was attributed to the creation of microfibers with 25–200 μm in length, which were present to a larger extent, from a count basis, than the microfibers with length > 200 μm [29].
Microfibers from PET 2.6, cotton, nylon, acrylic, and viscose were analyzed using an FQA imaging instrument with pulsed sonication. The FQA was used to measure the mean fiber counts, mean arithmetic lengths, and %fines of the microfiber samples. The studies herein were carried out to investigate whether the presence of surfactant affected the effectiveness of forming microfiber suspensions with man-made and natural textiles represented. Synthetic microfibers from polyester, polyamide (nylon), and acrylic have been shown to have difficulty in forming water suspensions due to their water resistance [68]. It has been suggested that the poor microfiber detection of these synthetic microfibers by the FQA system results from their reduced dispersion in water [68].
Table 1 shows the fiber count, arithmetic length, percent fines, and percent difference for polyester, cotton, acrylic, nylon, and viscose with addition of the Teric 169 surfactant, as measured by the FQA system. Only three concentrations of Teric 169 were tested (0, 5, and 10 mL), except for polyester in which only 0 and 5 mL of surfactant was investigated. Polyester samples were only measured at two concentrations since there was a limited amount of the Australian Teric 169 surfactant. In addition, the objective of the current study was to use a minimal amount of surfactant to suspend microfibers to limit the formation of foam due to the surfactant, which could be detected as microfibers after pulsed sonication. For the Teric 169 surfactant, no foam was observed once the microfiber sample was diluted to 600 mL with deionized water. After the FQA analysis was completed for the samples, polyester was observed to have the highest percentage difference in fiber counts, followed by nylon and acrylic. These results were not surprising since these synthetic microfibers were expected to have better suspension in the surfactant solution. Polyester and cotton have the same arithmetic length and were not statistically different in the absence of surfactant based on the standard deviation of these measurements. This result was probably due to the cotton being less dense and having greater fineness than polyester. In addition, cotton and viscose, which are natural cellulose-based microfibers, had relatively no change in their mean arithmetic length when compared to results with no surfactant used [68]. Moreover, the fiber count for cotton and viscose seemed to be independent of the surfactant present compared to results from previous reports where no surfactant was present [68]. In both the current study and previous study [68], cotton had the highest fiber counts of all the samples. This may stem from its fineness and high dispersibility. However, polyester (PET 2.6) and nylon (polyamide) had an increase in fiber counts in the presence of Teric 169 surfactant compared to no surfactant being present with pulsed sonication alone as part of the sample preparation. This suggests that the wettability of these fibers increased with the surfactant present. The FQA defines fines as the length below which can be considered as detected microfibers. In addition, the shorter the arithmetic length, the more fines are expected and the smaller the microfibers are projected to be.
Table 2 shows the fiber count, percent difference, arithmetic mean length, and percent fines for polyester, cotton, acrylic, nylon, and viscose with the Surfonic LF-17 surfactant. Again, minimal amounts of this surfactant were used to suspend microfibers to avoid foam formation which could lead to miscounting of the microfibers. No foam was observed once the sample was diluted with 600 mL of deionized water prior to FQA examination. For this part of the study, 0, 0.5, 1, 1.75, 2.5, and 3.5 mL of this surfactant was studied with the microfiber samples. As was observed with the Teric 169 surfactant, polyester (PET 2.6) had the highest percentage difference in fiber counts in the presence of the Surfonic LF-17 surfactant. When comparing the two surfactants, this finding suggests that the Teric 169 surfactant promoted better suspension and detectability of the polyester microfibers compared to no surfactant being present. Acrylic and nylon microfibers had the highest percentage fines, followed by viscose. This fact may be related to acrylic and nylon having a lower mean fiber length measurement. Cotton and polyester exhibited the longest arithmetic mean lengths (Ln) in the presence of Surfonic LF-17 surfactant, while acrylic, nylon, and viscose had the shortest arithmetic mean lengths. It is of interest that the PET 2.6 microfibers had one of the longer mean lengths in this study compared to a previous finding, revealing that in the absence of detergent, polyester yielded the shortest mean lengths [68]. This result was due to the fiber used in this study having a different fineness. Cotton microfibers also had long arithmetic mean lengths.

3.2. FQA Statistical Results—Connecting Letter Reports

Table 3 shows the connecting letter report for polyester, cotton, acrylic, nylon, and viscose while varying the Surfonic LF-17 surfactant levels. As depicted in Table 3, arithmetic lengths for cotton across the six levels were not statistically different. This was true for nylon and viscose as well. For polyester, the fiber count was statistically different for 0 to 0.5 mL levels, but for concentrations 1, 1.75, and 2.5 mL of the surfactant, these were not statistically different. Also, 1.75, 2.5, and 3.5 mL were not statistically different. However, 1 and 3.5 mL concentrations were statistically different. For the cotton fiber count groups 0, 1, 1.75, and 2.5 mL, these groups were not statistically different. Yet, for cotton fiber count groups 0.5, 1, 1.75, and 2.5 mL, these groups were also not statistically different. However, for cotton fiber count groups 0, 0.5, and 3.mL, these groups were statistically different. The acrylic fiber count groups across surfactant levels 0.5, 1, 1.75, 2.5, and 3.5 shared a connecting letter with level 0 and were thus not statistically different. The nylon fiber count groups 0, 0.5, 1, and 1.75 were not statistically different from each other but were statistically different from levels 2.5 and 3.5. Conversely, nylon levels 2.5 and 3.5 shared a letter and were not statistically from each other. Viscose had levels 0, 1, and 2.5 mL of surfactant with connecting letters and were not statistically different from each other. Viscose also had 0.5 and 3.5 surfactant levels that were not statistically different from each other. Finally, viscose had 1.75 and 2.5 mL surfactant levels which did not have connecting letters and were thus statistically different from each other.

3.3. XY Scatter Graphs Depicting Fiber Counts as a Function of Surfactant Added

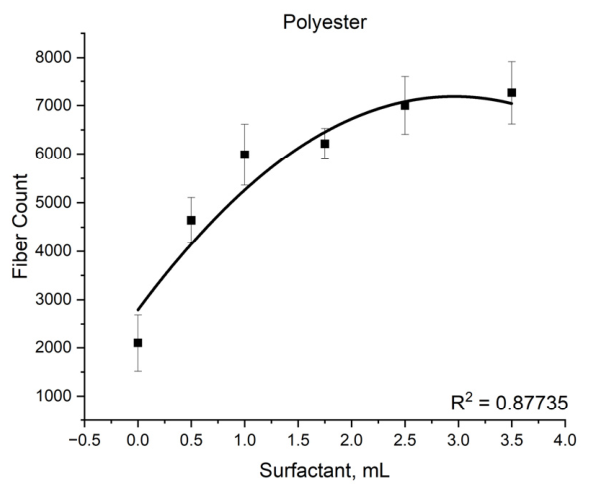
In the current study, Figure 1 shows the plotted fiber count and corresponding Surfonic LF-17 surfactant amounts for polyester. This graph depicts a polynomial 2 fit trend line and r-squared value of 0.87735. This dependence is not surprising since the surfactant increased the wettability of the polyester sample in the water suspensions, causing more microfibers to be detected by the FQA. In addition, this result had been expected since the detection % was only 14 for polyester in the absence of surfactant, as reported previously [68].
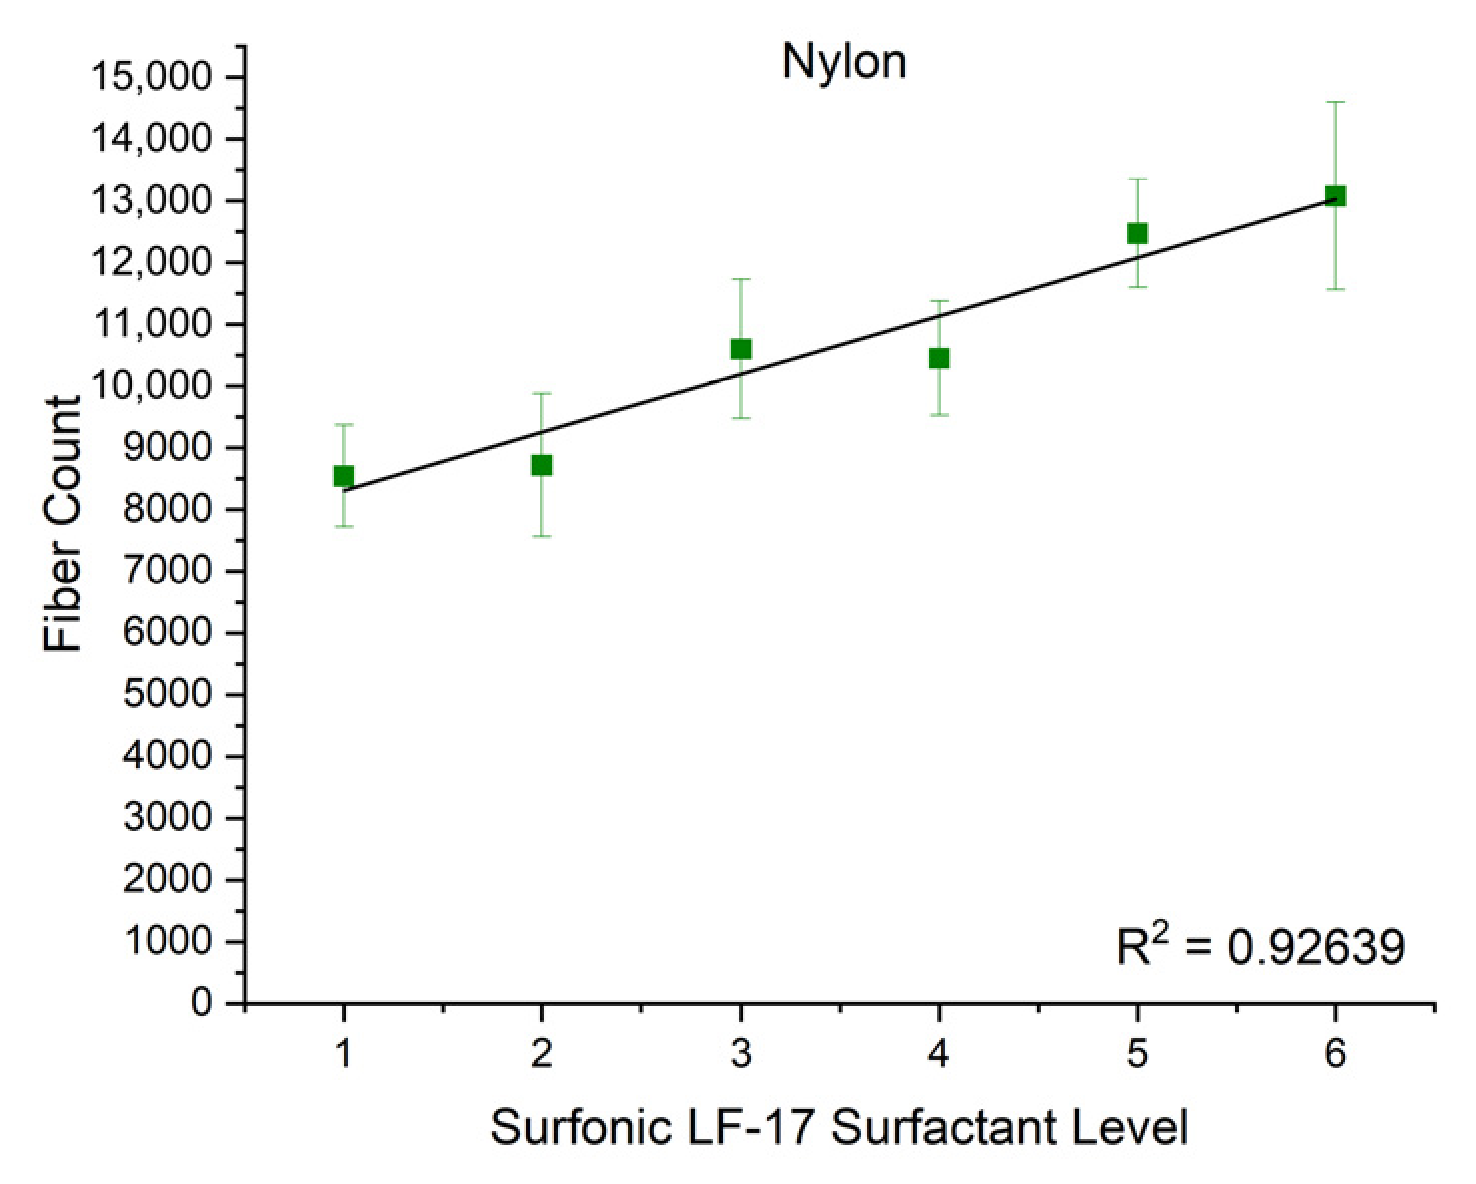
Figure 2 represents nylon microplastics fiber count as a function of Surfonic LF-17 surfactant added. This sample was demonstrated to have the only linear trend with a high r-squared value of 0.92639. Clearly, the nylon microplastics were directly affected by the surfactant added, as shown in Figure 3, increasing its detectability by the FQA instrument. This was in sharp contrast to a previous report where polyamide (nylon) and polyester were reported to be undercounted by the FQA instrument where no surfactant was present [68].
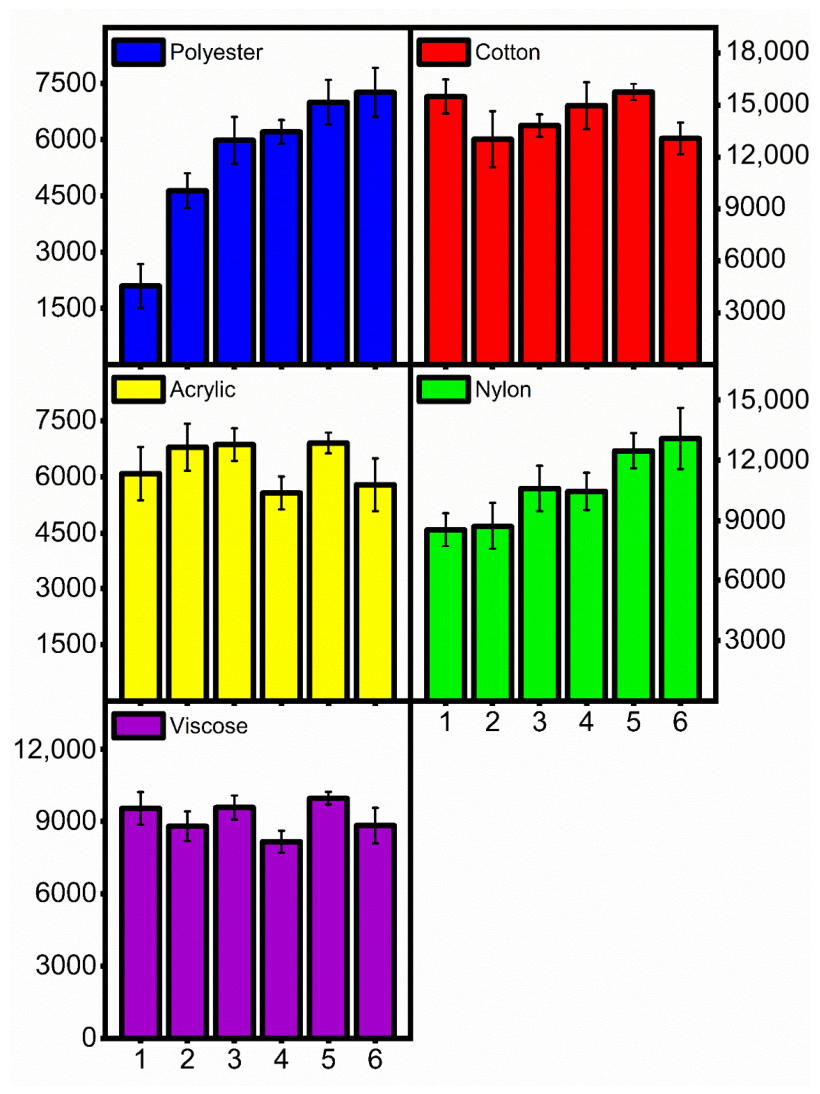
The increase in fiber counts was observed from the first addition of surfactant, where a statistically different amount was observed in the connecting letters report, as noted in Table 3. Moreover, the benefit of adding more detergent to increase the fiber count seemed to taper off at surfactant amount 2.5 mL, as observed in the column histogram plot of polyester in the top left of Figure 3. Based on the standard deviations for the arithmetic lengths for polyester, no apparent trend was observed as Surfonic amounts increased across the six levels.
Other fibers that were observed to have increased fiber counts in the presence of surfactant included acrylic and nylon, as shown in Table 2 and Figure 3, where all three fiber types were synthetic compared to the control. This result was expected, since acrylic, polyamide (nylon), and polyester had the lowest detection percent in a previous study by Santiago Cintron and colleagues in the absence of surfactant with pulsed sonication at 77, 43, and 14, respectively [68].
In contrast, the natural fibers, cotton and viscose, decreased in fiber counts with the addition of surfactant, as shown in Table 2 and Figure 3. Both cotton and viscose decreased in fiber counts with the initial introduction of Surfonic LF-17 surfactant with no clear trend across the six levels, as shown in Figure 3. This was to be expected since, in the absence of surfactant, a detection percent of 116 and 99 was previously observed for cotton and viscose, respectively [68]. Moreover, cotton having such a high detection percentage was attributed to its variability in fineness of the sample [68].

3.4. Morphology Results

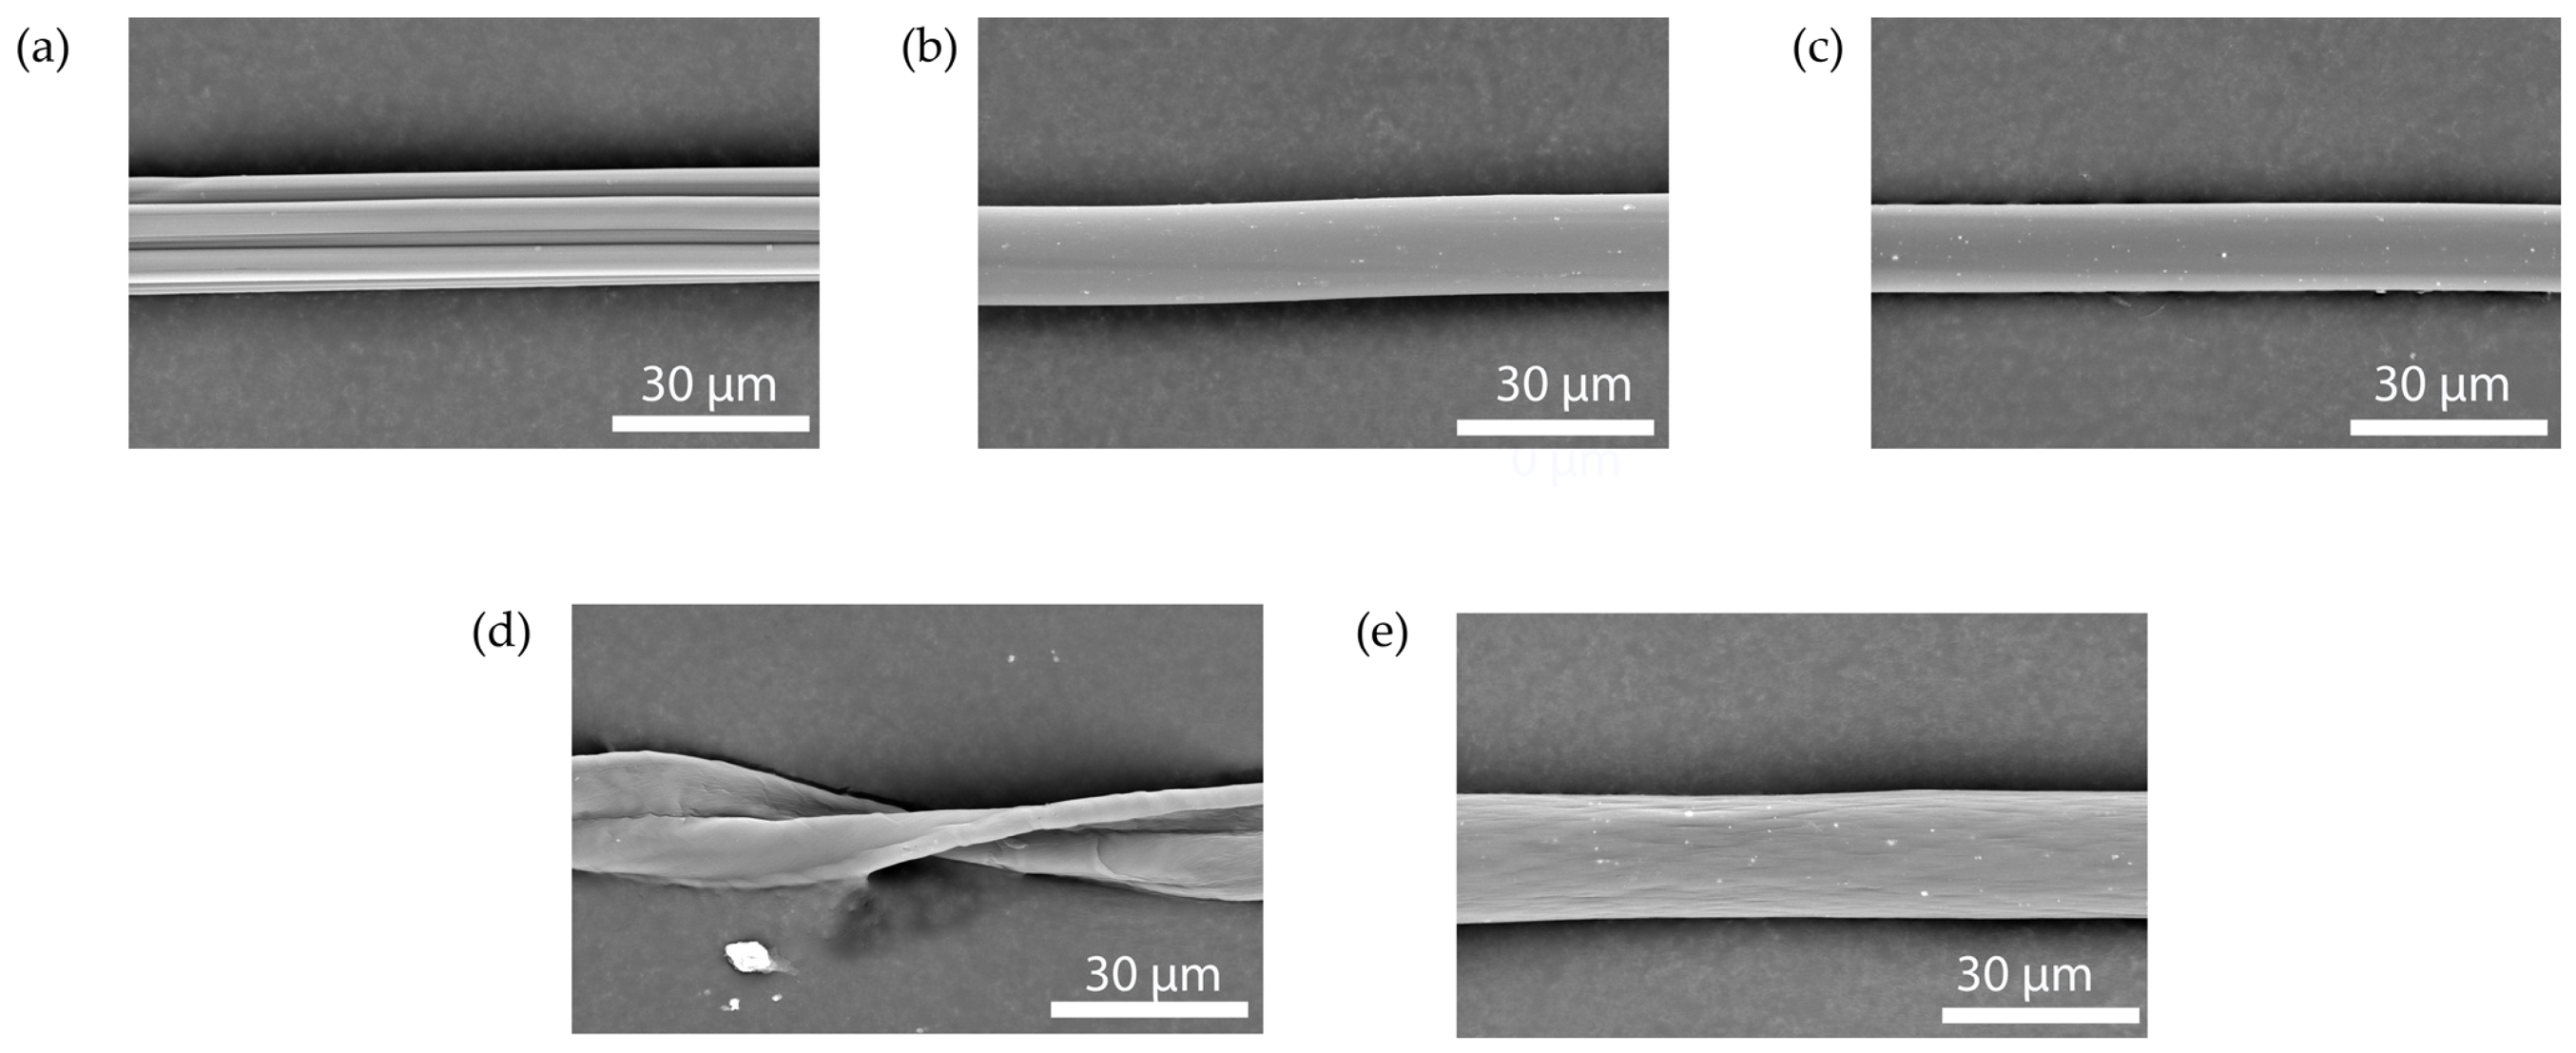
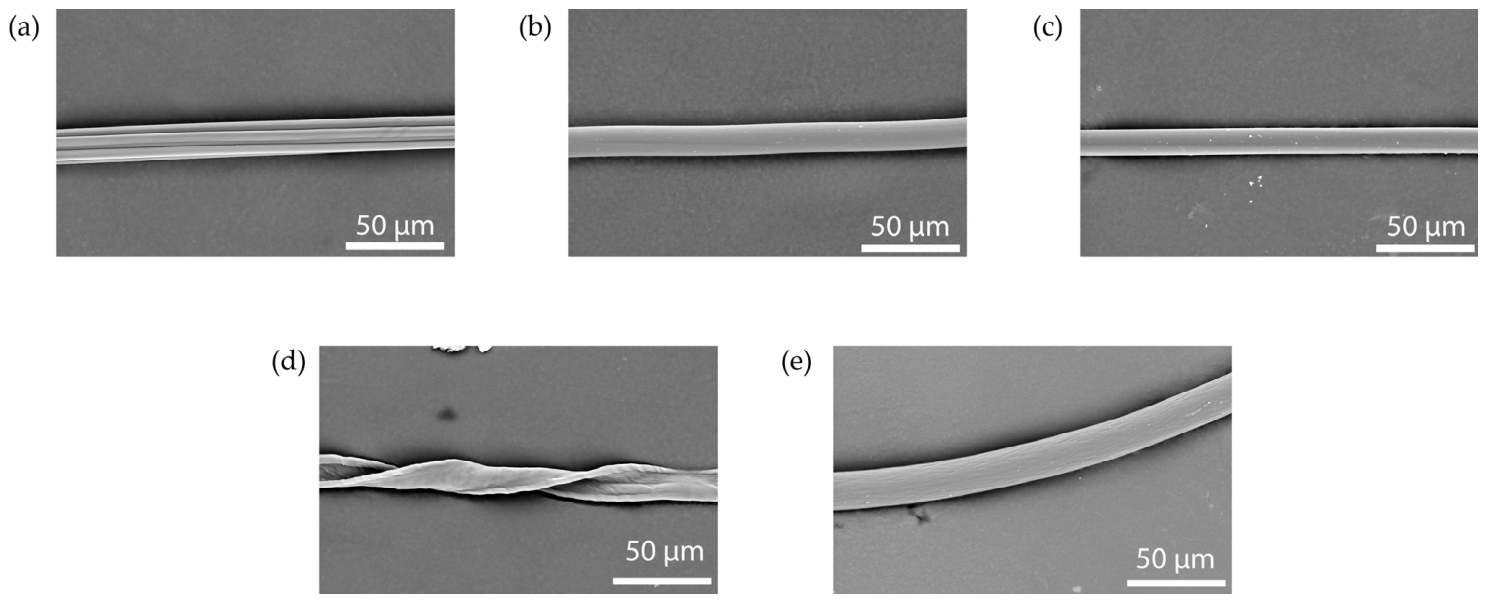
Figure 4 shows the morphology of five single-fiber SEM images of viscose, polyester, nylon, cotton, and acrylic with a magnification range of 2550–2600×. As expected, the synthetic fibers of polyester, nylon, and acrylic showed no twist that had been observed in the cotton sample [70]. The viscose sample, which usually has properties like cotton since it is cellulose-based, showed multiple fused layers in the micrograph. Figure 5 depicts the same five fiber samples at a higher magnification range of 4800–4900×, confirming the observations shown in Figure 4; the synthetic fibers showed single fibers, while the cotton single fiber showed its characteristic twist nature as expected [70]. In previous experiments with Dreillard et al., it was demonstrated that a 100% polyester fleece jacket showed a sharp increase in the number of microfibers per kg of fabric by nearly 300% in the presence of detergent compared to the control where it was washed only once in the absence of detergent [41]. In that study, it was concluded that this effect may have been due to insoluble compounds on the surface of the filter which was confirmed by SEM imaging. However, other researchers have reported that detergent did not greatly influence the emission of synthetic microfibers [71] nor even reduce their emissions [72]. Thus, more studies are needed to reach a definitive conclusion in a standard method.

4. Conclusions

The purpose of this study was to investigate the effects of surfactants on microfiber suspensions analyzed with pulsed sonication and the FQA imaging system. Specifically, this analysis was carried out to address the previous limitation of examining man-made microfibers with the FQA. Two liquid surfactants were studied, Teric 169 and Surfonic LF-17. These surfactants were chosen due to their availability in our lab and their low-foaming characteristics during FQA analysis. Both cellulose-based microfibers, including cotton and viscose, and synthetic microfibers, like PET 2.6, nylon, and acrylic, were examined. It was observed that adding surfactants to the synthetic microfiber samples (polyester, acrylic, and nylon) enhanced their detectability and wettability compared to previous studies where their suspensions in water were difficult. Moreover, the natural microfibers, cotton and viscose, were well suspended within the water and seemed independent of adding surfactant. Knowing the effect of surfactants in the present study on the microfibers investigated is beneficial to the scientific community, since there currently exist competing reports by previous researchers. Thus, the sample preparation used in this study before FQA analysis seemed sufficient. Another aim of this study was to examine the arithmetic mean lengths of the microfibers after sonication and surfactant addition. Cotton and polyester had the highest arithmetic length means. This may not be a surprise because cotton has been previously shown to produce long fibers. However, polyester microfibers have been previously demonstrated to generate short arithmetic mean lengths with and without sonication in the absence of surfactant. The percent arithmetic fines are present in the samples at a smaller length than the maximum fine length of 0.2 mm. This parameter seems to be highest for the microfibers having the lowest arithmetic mean length, as represented by acrylic, nylon, and viscose. This result is plausible, since the textiles with the shortest arithmetic mean lengths would have the most particles that are smaller than the maximum fine length, which may lead to skewed fiber length average values. Future studies may investigate the effect of fines on length, weighted length, and weight-weighted average fiber lengths for natural and synthetic microfibers and compare these values to arithmetic mean lengths for the same microfibers. Overall, the use of the FQA imaging device proved to yield information toward the development of a standard method to study natural and synthetic microfibers in water suspensions where sonication and detergents are employed. Having a standard method that is quick and easy to use would be advantageous to further understand complex laundering and environmental studies, for example, with less contamination concerns.

Author Contributions

Conceptualization, C.A.F. and M.S.C.; methodology, C.A.F. and M.S.C.; formal analysis, C.A.F. and M.S.C.; investigation, C.A.F. and M.S.C.; resources, M.S.C.; writing—original draft preparation, C.A.F.; writing—review and editing, M.S.C.; visualization, C.A.F. and M.S.C.; supervision, M.S.C. All authors have read and agreed to the published version of the manuscript.

Funding

This research received no external funding.

Institutional Review Board Statement

The findings and conclusions in this publication are those of the author(s) and should not be construed to represent any official USDA or U.S. Government determination or policy.

Informed Consent Statement

Mention of trade names or commercial products in this publication is solely for the purpose of providing specific information and does not imply recommendation or endorsement by the US Department of Agriculture (USDA). USDA is an equal opportunity provider and employer.

Data Availability Statement

The raw data supporting the conclusions of this article will be made available by the authors on request.

Conflicts of Interest

The authors declare no conflicts of interest.

Abbreviations

The following abbreviations are used in this manuscript:
PETPolyester

References

  1. Ahamed, A.; Singh, P.; Dhanesh, T. Plastic and Microplastic in the Environment: Management and Health Risks; John Wiley & Sons Ltd.: Hoboken, NJ, USA, 2022. [Google Scholar]
  2. Coe, J.M.; Rogers, D. Marine Debris: Sources, Impacts, and Solutions; Springer Science & Business Media: Berlin/Heidelberg, Germany, 1996. [Google Scholar]
  3. Weis, J.S.; De Falco, F.; Cocca, M. Polluting Textiles; Routledge: London, UK, 2022. [Google Scholar]
  4. De Falco, F.; Cocca, M.; Avella, M.; Thompson, R.C. Microfiber Release to Water, Via Laundering, and to Air, via Everyday Use: A Comparison between Polyester Clothing with Differing Textile Parameters. Environ. Sci. Technol. 2020, 54, 3288–3296. [Google Scholar] [CrossRef] [Scilit] [PubMed]
  5. Acharya, S.; Rumi, S.S.; Hu, Y.; Abidi, N. Microfibers from synthetic textiles as a major source of microplastics in the environment: A review. Text. Res. J. 2021, 91, 2136–2156. [Google Scholar] [CrossRef] [Scilit]
  6. Rathinamoorthy, R.; Balasaraaswathi, S.R. Characterization of microfibers released from chemically modified polyester fabrics-a step towards mitigation. Sci. Total Environ. 2023, 866, 161317. [Google Scholar] [CrossRef] [Scilit] [PubMed]
  7. Frias, J.P.; Nash, R. Microplastics: Finding a consensus on the definition. Mar. Pollut. Bull. 2019, 138, 145–147. [Google Scholar] [CrossRef] [Scilit]
  8. Peller, J.R.; Eberhardt, L.; Clark, R.; Nelson, C.; Kostelnik, E.; Iceman, C. Tracking the distribution of microfiber pollution in a Southern Lake Michigan watershed through the analysis of water, sediment, and air. R. Soc. Chem. 2019, 21, 1549–1559. [Google Scholar] [CrossRef] [Scilit]
  9. Hope, J.A.; Coco, G.; Thrush, S.F. Effects of Polyester Microfibers on Microphytobenthos and Sediment-Dwelling Infauna. Environ. Sci. Technol. 2020, 54, 7970–7982. [Google Scholar] [CrossRef] [Scilit]
  10. Reineccius, J.; Appelt, J.-S.; Hinrichs, T.; Kaiser, D.; Stern, J.; Prien, R.D.; Waniek, J.J. Abundance and characteristics of microfibers detected in sediment trap material from the deep subtropical North Atlantic Ocean. Sci. Total Environ. 2020, 738, 140354. [Google Scholar] [CrossRef] [Scilit]
  11. Dris, R.; Gasperi, J.; Mirande, C.; Mandin, C.; Guerrouache, M.; Langlois, V.; Tassin, B. A first overview of textiles fibers, including microplastics, in indoor and outdoor environments. Environ. Pollut. 2017, 221, 453–458. [Google Scholar] [CrossRef] [Scilit]
  12. Kaya, A.T.; Yurtsever, M.; Bayraktar, S.C. Ubiquitous exposure to microfiber pollution in the air. Eur. Phys. J. Plus 2018, 133, 488. [Google Scholar] [CrossRef] [Scilit]
  13. Vianello, A.; Jensen, R.L.; Liu, L.; Vollertsen, J. Simulating human exposure to indoor airborne microplastics using a breathing thermal maniken. Sci. Rep. 2019, 9, 8670. [Google Scholar] [CrossRef] [Scilit] [PubMed]
  14. Liu, K.; Wang, X.; Fang, T.; Xu, P.; Zhu, L.; Li, D. Source and potential risk assessment of suspended atmospheric microplastics in Shanghai. Sci. Total Environ. 2019, 675, 462–471. [Google Scholar] [CrossRef] [Scilit]
  15. Prata, J.C.; Castro, J.L.; da Costa, J.P.; Duarte, A.C.; Cerqueira, M.; Rocha-Santos, T. An easy method for processing and identification of natural and synthetic microfibers and microplastics in indoor and outdoor air. MethodsX 2020, 7, 100762. [Google Scholar] [CrossRef] [Scilit]
  16. Biswal, T. Effect of Microfiber Pollutants in Freshwater Ecosystems, 1st ed.; CRC Press: Boca Raton, FL, USA, 2024. [Google Scholar]
  17. Koelmans, A.A.; Gouin, T.; Thompson, R.; Wallace, N.; Arthur, C. Plastics in the marine environment. Environ. Toxicol. Chem. 2014, 33, 5–10. [Google Scholar] [CrossRef] [Scilit]
  18. Fowler, C.W. Marine debris and northern fur seals: A case study. Mar. Pollut. Bull. 1987, 18, 326–335. [Google Scholar] [CrossRef] [Scilit]
  19. Colton, J.B., Jr.; Burns, B.R.; Knapp, F.D. Plastic Particles in Surface Waters of the Northwestern Atlantic: The abundance, distribution, source, and significance of various types of plastics are discussed. Science 1974, 185, 491–497. [Google Scholar] [CrossRef] [Scilit]
  20. Carpenter, E.J.; Smith, K., Jr. Plastics on the Sargasso Sea Surface. Science 1972, 1240–1241. [Google Scholar] [CrossRef] [Scilit]
  21. Browne, M.A.; Crump, P.; Niven, S.J.; Teuten, E.; Tonkin, A.; Galloway, T.; Thompson, R. Accumulation of Microplastic on Shorelines Worldwide: Sources and Sinks. Environ. Sci. Technol. 2011, 45, 9175–9179. [Google Scholar] [CrossRef] [Scilit] [PubMed]
  22. Carpenter, E.J.; Anderson, S.J.; Harvey, G.R.; Miklas, H.P.; Peck, B.B. Polystyrene spherules in coastal waters. Science 1972, 178, 749–750. [Google Scholar] [CrossRef] [Scilit] [PubMed]
  23. Desforges, J.-P.W.; Galbraith, M.; Dangerfield, N.; Ross, P.S. Widespread distribution of microplastics in subsurface seawater in NE Pacific Ocean. Mar. Pollut. Bull. 2014, 79, 94–99. [Google Scholar] [CrossRef] [Scilit] [PubMed]
  24. Myszograj, M. Microplastics in Food and Drinking Water-Environmental Monitoring Data. Civ. Environ. Eng. Rep. 2020, 30, 201–209. [Google Scholar] [CrossRef] [Scilit]
  25. Thompson, R.C.; Moore, C.J.; Vom Saal, F.S.; Swan, S.H. Plastics, the environment and human health: Current consensus and future trends. Philos. Trans. R. Soc. B Biol. Sci. 2009, 364, 2153–2166. [Google Scholar] [CrossRef] [Scilit]
  26. Choi, S.; Kim, J.; Kwon, M. The Effect of the Physical and Chemical Properties of Synthetic Fabrics on the Release of Microplastics during Washing and Drying. Polymers 2022, 14, 3384. [Google Scholar] [CrossRef] [Scilit]
  27. Kapp, K.J.; Miller, R.Z. Electric clothes dryers: An underestimated source of microfiber pollution. PLoS ONE 2020, 15, e0239165. [Google Scholar] [CrossRef] [Scilit]
  28. Zambrano, M.C.; Pawlak, J.J.; Daystar, J.; Ankeny, M.; Venditti, R.A. Impact of dyes and finishes on the microfibers released on the laundering of cotton knitted fabrics. Environ. Pollut. 2021, 272, 115998. [Google Scholar] [CrossRef] [Scilit]
  29. Zambrano, M.C.; Pawlak, J.J.; Daystar, J.; Ankeny, M.; Cheng, J.J.; Venditti, R.A. Microfibers generated from the laundering of cotton, rayon and polyester based fabrics and their aquatic biodegradation. Mar. Pollut. Bull. 2019, 142, 394–407. [Google Scholar] [CrossRef] [Scilit] [PubMed]
  30. Liu, J.; Liang, J.; Ding, J.; Zhang, G.; Zeng, X.; Yang, Q.; Zhu, B.; Gao, W. Microfiber pollution: An ongoing major environmental issue related to the sustainable development of textile and clothing industry. Environ. Dev. Sustain. 2021, 23, 11240–11256. [Google Scholar] [CrossRef] [Scilit]
  31. Geyer, R.; Gavigan, J.; Jackson, A.M.; Saccomanno, V.R.; Suh, S.; Gleason, M.G. Quantity and fate of synthetic microfiber emissions from apparel washing in California and strategies for their reduction. Environ. Pollut. 2022, 298, 118835. [Google Scholar] [CrossRef] [Scilit]
  32. Wang, M.; Yang, J.; Zheng, S.; Jia, L.; Yong, Z.Y.; Yong, E.L.; See, H.H.; Li, J.; Lv, Y.; Fei, X. Unveiling the microfiber release footprint: Guiding control strategies in the textile production industry. Ecotoxicol. Public Health 2023, 57, 21038–21049. [Google Scholar] [CrossRef] [Scilit] [PubMed]
  33. Ramasamy, R.; Subramanian, R.B. Synthetic textile and microfiber pollution: A review on mitigation strategies. Environ. Sci. Pollut. Res. 2021, 28, 41596–41611. [Google Scholar] [CrossRef] [Scilit]
  34. Napper, I.; Barrett, A.; Thompson, R. The efficiency of devices intended to reduce microfibre release during clothes washing. Sci. Total Environ. 2020, 738, 140412. [Google Scholar] [CrossRef] [Scilit]
  35. Bucci, K.; Tulio, M.; Rochman, C. What is known and unknown about the effects of plastic pollution: A metal-analysis and systematic review. Ecol. Appl. 2020, 30, e02044. [Google Scholar] [CrossRef] [Scilit]
  36. Napper, I.; Thompson, R. Release of synthetic microplastic fibres from domestic washing machines: Effects of fabric type and washing conditions. Mar. Pollut. Bull. 2016, 112, 39–45. [Google Scholar] [CrossRef] [Scilit]
  37. Shim, W.J.; Hong, S.H.; Eo, S.E. Identification methods in microplastic analysis: A review. Anal. Methods 2017, 9, 1384–1391. [Google Scholar] [CrossRef] [Scilit]
  38. Kavya, A.N.L.; Sundarrajan, S.; Ramakrishna, S. Identification and characterization of micro-plastics in the marine environment: A mini review. Mar. Pollut. Bull. 2020, 160, 111704. [Google Scholar] [CrossRef] [Scilit] [PubMed]
  39. Tripathy, B.; Dash, A.; Das, A.P. Detection of environmental microfiber pollutants through vibrational spectroscopic techniques: Recent advances of environmental monitoring and future prospects. Crit. Rev. Anal. Chem. 2024, 54, 1925–1935. [Google Scholar] [CrossRef] [Scilit]
  40. Pramanik, D.D.; Kay, P.; Goycoolea, F.M. A rapid and portable fluorescence spectroscopy staining method for the detection of plastic microfibers in water. Sci. Total Environ. 2024, 908, 168144. [Google Scholar] [CrossRef] [Scilit]
  41. Dreillard, M.; Barros, C.D.F.; Rouchon, V.; Emonnot, C.; Lefebvre, V.; Moreaud, M.; Guillaume, D.; Rimbault, F.; Pagerey, F. Quantification and morphological characterization of microfibers emitted from textile washing. Sci. Total Environ. 2022, 832, 154973. [Google Scholar] [CrossRef] [Scilit]
  42. Tian, Y.; Chen, Z.; Zhang, J.; Wang, Z.; Zhu, Y.; Wang, P.; Zhang, T.; Pu, J.; Sun, H.; Wang, L. An innovative evaluation method based on polymer mass detection to evaluate the contribution of microfibers from laundry process to municipal wastewater. J. Hazard. Mater. 2021, 407, 124861. [Google Scholar] [CrossRef] [Scilit]
  43. Barrows, A.P.W.; Neumann, C.A.; Berger, M.L.; Shaw, S.D. Grab vs. neuston tow net: A microplastic sampling performance comparison and possible advances in the field. Anal. Methods 2017, 9, 1446–1453. [Google Scholar] [CrossRef] [Scilit]
  44. Miller, R.Z.; Watts, A.J.R.; Winslow, B.O.; Galloway, T.S.; Barrows, A.P.W. Mountains to the sea: River study of plastic and non-plastic microfiber pollution in northeast USA. Mar. Pollut. Bull. 2017, 124, 25–251. [Google Scholar] [CrossRef] [Scilit] [PubMed]
  45. Barrows, A.P.W.; Cathey, S.E.; Petersen, C.W. Marine environment microfiber contamination: Global patterns and the diversity of microparticle origins. Environ. Pollut. 2018, 237, 275–284. [Google Scholar] [CrossRef] [Scilit]
  46. Zhu, X.; Nguyen, B.; You, J.B.; Karakolis, E.; Sinton, D.; Rochman, C. Identification of Microfibers in the Environment Using Multiple Lines of Evidence. Environ. Sci. Technol. 2019, 53, 11877–11887. [Google Scholar] [CrossRef] [Scilit] [PubMed]
  47. Athey, S.; Erdle, L. Are we underestimating anthropogenic microfiber pollution? A critical review of occurrence, methods, and reporting. Environ. Toxicol. Chem. 2022, 41, 822–837. [Google Scholar] [CrossRef] [Scilit] [PubMed]
  48. Sheikhi, M.; Lupato, S.; Bianco, C.; Sethi, R.; Tiraferri, A. Plastic microfibers from household textile laundering: A critical review of their release and impact reduction. Crit. Rev. Environ. Sci. Technol. 2024, 54, 1501–1525. [Google Scholar] [CrossRef] [Scilit]
  49. McIlwraith, H.; Lin, J.; Erdle, L.; Mallos, N.; Diamond, M.; Rochman, C. Capturing microfibers-marketed technologies reduce microfiber emissions from washing machines. Mar. Pollut. Bull. 2019, 139, 40–45. [Google Scholar] [CrossRef] [Scilit]
  50. Cai, Y.; Yang, T.; Mitrano, D.; Heuberger, M.; Hufenus, R.; Nowack, B. Systematic study of microplastic fiber release from 12 different polyester textiles during washing. Environ. Sci. Technol. 2020, 54, 4847–4855. [Google Scholar] [CrossRef] [Scilit]
  51. Galvão, A.; Aleixo, M.; De Pablo, H.; Lopes, C.; Raimundo, J. Microplastics in wastewater: Microfiber emissions from common household laundry. Environ. Sci. Pollut. Res. 2020, 27, 26643–26649. [Google Scholar] [CrossRef] [Scilit]
  52. Gaylarde, C.; Baptiste-Neto, J.; Da Fonseca, E. Plastic microfibre pollution: How important is clothes’ laundering? Heliyon 2021, 7, e07105. [Google Scholar] [CrossRef] [Scilit]
  53. Vassilenko, E.; Watkins, M.; Chastain, S.; Mertens, J.; Posacka, A.; Patankar, S.; Ross, P. Domestic laundry and microfiber pollution: Exploring fiber shedding from consumer apparel textiles. PLoS ONE 2021, 16, e0250346. [Google Scholar] [CrossRef] [Scilit] [PubMed]
  54. Mishra, S.; Dash, D.; Das, A. Detection, characterization and possible biofragmentation of synthetic microfibers released from domestic laundering wastewater as an emerging source of marine pollution. Mar. Pollut. Bull. 2022, 185, 114254. [Google Scholar] [CrossRef] [Scilit]
  55. Han, Q.; Wu, X.; Ding, X. A novel approach for rapid quantification and length distribution of microfibers released during domestic laundry. J. Hazard. Mater. 2025, 489, 137638. [Google Scholar] [CrossRef] [Scilit]
  56. Belzagui, F. Sustainable filtering systems to reduce microfiber emissions from textiles during household laundering. Polymers 2023, 15, 3023. [Google Scholar] [CrossRef] [Scilit]
  57. Lupato, S.; Granetto, M.; Tiraferri, A.; Sethi, R. Sensitive quantification and morphological analysis of microfibers in laundry wastewater: Standardization and validation of a fluorescence-based method. J. Hazard. Mater. 2025, 495, 138947. [Google Scholar] [CrossRef] [Scilit]
  58. Cabigliera, S.; Gabellini, P.; Cantagalli, D.; Ciattini, S.; Chelazzi, D.; Cincinelli, A.; Cioni, R.; Martellini, T. First application of automated static particle analysis for quantification of textile microplastics/microfibers in washinhg effluents. Chemosphere 2025, 387, 144655. [Google Scholar] [CrossRef] [Scilit] [PubMed]
  59. Erdle, L.; Stevack, K.; Parzanini, C.; Atrs, M.; Rochman, C. Exposure to cotton and polyester microfibers leads to different fatty acid profiles and chemical contaminants concentrations in juvenile rainbow trout (Oncorhynchus mykiss). Environ. Toxicol. Chem. 2025, vgaf093. [Google Scholar] [CrossRef] [Scilit] [PubMed]
  60. Arienzo, M.; Collins, M.; Justice Frey, E.; Movius, M.; Patten, L.; DePauw, A.; Kozloski, R. A participatory science, approach to quantify microfiber emissions from clothes dryers. Environ. Toxicol. Chem. 2025, vgaf222. [Google Scholar] [CrossRef] [Scilit]
  61. Primpke, S.; Dias, P.; Gerdts, G. Automated identification and quantification of microfibres and microplastics. Anal. Methods 2019, 11, 2138–2147. [Google Scholar] [CrossRef] [Scilit]
  62. Xu, J.-L.; Thomas, K.; Luo, Z.; Gowen, A. FTIR and Raman imaging for microplastics analysis: State of the art, challenges, and prospects. TrAC Trends Anal. Chem. 2019, 119, 115629. [Google Scholar] [CrossRef] [Scilit]
  63. Cohen, N.; Radian, A. Microplastic textile fibers accumulate in sand and are potential sources of micro(nano) plastic pollution. Environ. Sci. Technol. 2022, 56, 17635–17642. [Google Scholar] [CrossRef] [Scilit]
  64. Schellenberger, S.; Liagkouridis, I.; Awad, R.; Khan, S.; Plassmann, M.; Peters, G.; Benskin, J.P.; Cousins, I.T. An outdoor aging study to investigate the release of per- and polyfluoroalkyl substances (PFAS) from functional textiles. Environ. Sci. Technol. 2022, 56, 3471–3479. [Google Scholar] [CrossRef] [Scilit]
  65. Wu, P.; Li, J.; Lu, X.; Tang, Y.; Cai, Z. Release of tens of thousands of microfibers from discarded face masks under simulated environmental conditions. Sci. Total Environ. 2022, 806, 150458. [Google Scholar] [CrossRef] [Scilit]
  66. Yan, R.; Li, J.; Li, J.; Liu, Y.; Xu, Z.; Ge, X.; Lu, X.; Yadav, K.K.; Obaidullah, A.J.; Tang, Y. Deciphering morphology patterns of environmental microfibers: Insights into source apportionment. Water Res. 2024, 259, 121814. [Google Scholar] [CrossRef] [Scilit] [PubMed]
  67. Santiago Cintron, M.; Delhom, C.D. Evaluation of the OpTest Fiber Quality Analyzer for quantifying cotton and rayon microfibers. Fibers 2024, 12, 81. [Google Scholar] [CrossRef] [Scilit]
  68. Santiago Cintron, M.; Fortier, C.A.; Nam, S. Evaluation of Length and Fiber Count Determinations for Natural and Synthetic Microfibers Using the OpTest Fiber Quality Analyzer. Microplastics 2024, 3, 730–741. [Google Scholar] [CrossRef] [Scilit]
  69. Carney Almroth, B.; Åström, L.; Roslund, S.; Petersson, H.; Johansson, M.; Persson, N.-K. Quantifying shedding of synthetic fibers from textiles; a source of microplastics released into the environment. Environ. Sci. Pollut. Res. 2018, 25, 1191–1199. [Google Scholar] [CrossRef] [Scilit]
  70. Dochia, M.; Sirghie, C.; Kozlowski, R.M.; Roskwitalski, Z. Cotton Fibres. In Handbook of Natural Fibres; Kozlowski, R.M., Ed.; Woodhead Publishing: Cambridge, UK, 2012; Volume 1, pp. 11–23. [Google Scholar]
  71. Pirc, U.; Vidmar, M.; Mozer, A.; Kržan, A. Emissions of microplastic fibers from microfiber fleece during domestic washing. Environ. Sci. Pollut. Res. 2016, 23, 22206–22211. [Google Scholar] [CrossRef] [Scilit]
  72. Cesa, F.S.; Turra, A.; Checon, H.H.; Leonardi, B.; Baruque-Ramos, J. Laundering and textile parameters influence fibers release in household washings. Environ. Pollut. 2020, 257, 113553. [Google Scholar] [CrossRef] [Scilit]
Figure 1. XY scatter graph depicting fiber count as a function of Surfonic LF-17 surfactant levels (0, 0.5.1, 1.75, 2.5, and 3.5 mL) for polyester microfibers with a polynomial 2 r-squared fit (black curved trace). The y-error bars represent the standard deviation of five replicates.
Fibers 14 00058 g001
Figure 2. XY scatter graph depicting fiber count as a function of Surfonic LF-17 surfactant levels (0, 0.5.1, 1.75, 2.5, and 3.5 mL) for nylon. Linear r-squared fit (black trace) with y-error bars representing the standard deviation of five replicates.
Fibers 14 00058 g002
Figure 3. Column histogram graphs for five microfiber samples detected with fiber counts on the FQA instrument at six statistical Surfonic LF-17 surfactant levels (1–6): polyester (top left), cotton (top right), acrylic (middle left), nylon (middle right), and viscose (bottom left). The y-error bars represent the standard deviation of five replicates for each microfiber type.
Fibers 14 00058 g003
Figure 4. ESEM images of single fibers at 2550–2600× magnification for (a) viscose, (b) polyester, (c) nylon, (d) cotton, and (e) acrylic fibers.
Fibers 14 00058 g004
Figure 5. ESEM images of single fibers at 4800–4900× magnification for (a) viscose, (b) polyester, (c) nylon, (d) cotton, and (e) acrylic fibers.
Fibers 14 00058 g005
Table 1. Fiber count, percent difference, arithmetic mean length, and percent fines for Teric 169 surfactant at three levels (0, 5, and 10) for five microfiber types (PET 2.6, cotton, acrylic, nylon, and viscose). Average measurements based on three replicates with each weighing 2 mg are reported.
Surfactant
Level, mL
Teric 1690510
Fiber Count 2203 ± 2305640 ± 755-
PET 2.6(%) Diff.-156-
LN (mm)0.59 ± 0.020.60 ± 0.01-
(%) Fines8.3%8.7%-
Fiber Count 13,399 ± 158513,951 ± 115015,234 ± 116
Cotton(%) Diff.-414
LN (mm)0.61 ± 0.020.61 ± 0.020.60 ± 0.00
(%) Fines6.2%7.5%8.5%
Fiber Count 5886 ± 5626307 ± 4837268 ± 433
Acrylic(%) Diff.-723
LN (mm)0.51 ± 0.020.55 ± 0.020.51 ± 0.02
(%) Fines14%15%16%
Fiber Count 7334 ± 312811,235 ± 37512,215 ± 1070
Nylon(%) Diff.-5367
LN (mm)0.51 ± 0.020.50 ± 0.020.50 ± 0.02
(%) Fines13%13%12%
Fiber Count 9011 ± 15998660 ± 6809161 ± 380
Viscose(%) Diff.-−42
LN (mm)0.49 ± 0.010.51 ± 0.010.52 ± 0.03
(%) Fines11%10%11%
Table 2. Fiber count, percent difference, arithmetic mean length, and percent fines for Surfonic LF-17 surfactant at five levels (0, 0.5, 1, 1.75, 2.5, and 3.5) for five microfiber types (PET 2.6, cotton, acrylic, nylon, and viscose) based on five replicates with each weighing 2 mg are reported.
Surfactant (mL)Surfonic
LF-17
00.511.752.53.5
Fiber Count 2099 ± 5874640 ± 4615985 ± 6256212 ± 3137001 ± 5967266 ± 651
PET 2.6(%) Diff.-121185196234246
LN (mm)0.59 ± 0.020.61 ± 0.010.60 ± 0.020.62 ± 0.010.61 ± 0.020.62 ± 0.01
(%) Fines7.3%5.4%5.4%5.3%6.2%5.7%
Fiber Count 15,501 ± 98413,031 ± 162112,819 ± 233614,971 ± 1354 15,761 ± 47713,082 ± 912
Cotton(%) Diff.-−16−17−32−16
LN (mm)0.59 ± 0.020.61 ± 0.010.60 ± 0.010.60 ± 0.020.59 ± 0.020.60 ± 0.01
(%) Fines6.6%7.1%6.8%7.1%6.6%7.3%
Fiber Count 6090 ± 6386794 ± 6286865 ± 3895575 ± 4406908 ± 2485796 ± 704
Acrylic(%) Diff.-1213−813−5
LN (mm)0.51 ± 0.020.51 ± 0.020.54 ± 0.010.54 ± 0.000.53 ± 0.010.54 ± 0.02
(%) Fines14%15%13%14%14%13%
Fiber Count 8544 ± 8258719 ± 116210,600 ± 113010,451 ± 92612,472 ± 87413,079 ± 1518
Nylon(%) Diff.-224224653
LN (mm)0.50 ± 0.030.53 ± 0.020.52 ± 0.040.51 ± 0.020.52 ± 0.030.50 ± 0.02
(%)Fines14%11%11%11%11%12%
Fiber Count 9544 ± 6798802 ± 6189578 ± 5038162 ± 4379964 ± 2608852 ± 735
Viscose(%) Diff.-−80.4−144−7
LN (mm)0.51 ± 0.010.50 ± 0.020.51 ± 0.020.52 ± 0.020.51 ± 0.010.51 ± 0.01
(%) Fines10%10%10%10%11%10%
Table 3. Connecting letters report for polyester, cotton, acrylic, nylon, and viscose microfibers with six Surfonic LF-17 surfactant levels (0, 0.5, 1, 1.75, 2.5, and 3.5 mL). Fiber count and arithmetic groups not connected by the same letter are statistically different.
Surfactant (mL)Surfonic00.511.752.53.5
LF-17
PET 2.6Fiber CountDCBABABA
LNCCBCBCABA
CottonFiber CountABABABABB
LNAAAAAA
AcrylicFiber CountABCABABCABC
LNBBABABAAB
NylonFiber CountCCBCBCABA
LNAAAAAA
ViscoseFiber CountABBCABCABC
LNAAAAAA
Disclaimer/Publisher’s Note: The statements, opinions and data contained in all publications are solely those of the individual author(s) and contributor(s) and not of MDPI and/or the editor(s). MDPI and/or the editor(s) disclaim responsibility for any injury to people or property resulting from any ideas, methods, instructions or products referred to in the content.