Article

Acoustic Characterization and Modeling of Silicone-Bonded Cocoa Crop Waste Using a Model Based on the Gaussian Support Vector Machine

by
Virginia Puyana-Romero
1,2,
Gino Iannace
3,
Lilian Gisselle Cajas-Camacho
1,
Christiam Garzón-Pico
1 and
Giuseppe Ciaburro
3,*
1
Department of Sound and Acoustic Engineering, Universidad de Las Américas, Quito 170125, Ecuador
2
Laboratory of Phonetics and Acoustics, Institute of Applied Linguistics, Universidad de Cádiz, 11002 Cádiz, Spain
3
Department of Architecture and Industrial Design, Università degli Studi della Campania Luigi Vanvitelli, Borgo San Lorenzo, 81031 Aversa, Italy
*
Author to whom correspondence should be addressed.
Fibers 2022, 10(3), 25; https://doi.org/10.3390/fib10030025
Submission received: 9 December 2021 / Revised: 15 February 2022 / Accepted: 3 March 2022 / Published: 6 March 2022
(This article belongs to the Special Issue Natural Fiber Competitiveness and Sustainability)

Abstract

:
The sustainable management of waste from agricultural crops represents an urgent challenge. One possible solution considers waste as possible secondary raw materials for specific uses. Among these, the use of agricultural waste as a product for the assembly of panels for the sound absorption of living environments represents a particularly suitable solution. In this study, the acoustic properties of the cocoa pod husk were evaluated, using silicone as a binder. Different proportions of materials and thicknesses were evaluated. A Support Vector Machine (SVM)-based model with a Gaussian kernel was then used to predict the acoustic performance of composite materials. The results obtained suggest the adoption of this material for the acoustic correction of living environments and this methodology for the prediction of the acoustic behavior of materials.

1. Introduction

For the application of theories that aim to achieve sustainable agricultural derivatives, it is necessary to consolidate the theoretical principles into feasible recommendations applicable to agricultural practices and the associated productive chain [1,2]. For this, it is important to know which the detrimental effects generated by the different production processes are to minimize their consequences in the different links of the chain. Numerous investigations are being developed that aim to study the risks not only during the production phase, but also by employing an analysis of the life cycle of the products. The application of this knowledge must be carried out in such a way that the local economic systems and the conservation of the environment are boosted, to close a circle that in parallel contributes to generating an increase in the consumption and competitiveness of eco-friendly products [3,4,5]. An important part of implementing the principles that theorize about sustainability lies in the way in which the wastes generated in the early stages of collection, handling, and extraction of agricultural products are treated. Ideally, these wastes should come to be considered as products in themselves. Therefore, specific uses must arise for these secondary raw materials so that they do not become waste products [6]. These new uses drive the application and consolidation of the concepts of “circular economy” and “wealth-generating waste” for a healthier society that is more aware of environmental problems [7].
An example of a crop that generates a lot of waste is cocoa. The fruit from which cocoa is extracted (Theobroma cacao L.), commonly called cob, has an oval shape, between 10 and 30 cm long and 7 to 12 cm wide (Figure 1) [8,9]. It consists of a rough bark almost 4 cm thick [10], filled with an edible mucilaginous pulp, of a white-pink color, which surrounds 30 to 50 seeds, normally arranged in five rows [9]. Approximately 10% of the wet weight of the fruit is used, and the rest is discarded [10]. The cocoa pod husk is the residue that is obtained after extracting the cocoa pulp and the seeds and represents between 47 and 63% of the total waste [10].
The annual world cocoa production in 2021 was approximately 5 million tons, and annual growth from 2019 to 2025 is estimated at 7.3% [11]. This production is expected to generate 16 million biomass not suitable for chocolate production, considering as mentioned above that much of the weight of the cocoa fruit is discarded [12]. Currently, Ecuador is the fourth largest cocoa producer in the world, with 300,000 tons per year [13], and the first producer of “Fine Aroma Cocoa”, with a production of approximately 60% of the global volume of the international market [13].
The cocoa pod husk is a raw material that can be used in various ways [6]. The ignorance of these uses among farmers leads to inappropriate waste management that generates problems of bad odors and deterioration of the landscape [14]. In Ecuador, a large part of the organic waste that accumulates in landfills comes from cocoa [15]. The accumulation of this type of waste contributes to the spread of Phytophora spp., a parasite that generates great economic losses among farmers and producers due to the rotting of the cocoa pod [16]. Cocoa pod husk is an available, abundant, and sustainable resource of bioproducts [17]. The most widespread uses of cocoa pod husk are as fertilizer for the soil [18,19] and as animal feed [20,21,22,23]. Once dry, the cocoa pod husk has approximately 4% potassium, and, taking advantage of this component, the cocoa shell ash allows the production of potassium hydroxide that has been used to make soap [24]. It can be treated to obtain pectin, a natural product that is used by the food, cosmetic, and pharmaceutical industries for its gelatinizing, thickening, and stabilizing properties [14,25]. The cocoa pod husk is a source of protein, that can be used in the production of the hydrolase enzyme [26], an enzyme with multiple uses in the pharmaceutical industry [27,28], for food technology applications [29,30,31] and as laundry detergent [32,33]. Cocoa pod husk has been used as an absorbent for removing Pb and Cu [34] from aqueous solutions [35], and also for removing methylene blue (after being treated with sodium hydroxide) [35,36]. At present, oil reserves are decreasing, and there is growing social concern about the environmental repercussions of both the extraction processes and the consumption of their derivative products. Therefore, some researchers look to organic cocoa waste as a source for the production of biofuels and other biopolymers [37]: for example, they can be also used as activated carbon and catalyst in biodiesel production [38,39]. The ground and pressed cocoa pod husk can be transformed into bio-pellets [40], having similar combustion characteristics and ash content in comparison to other biomass products.
According to Titiloye et al. [41], cocoa pod husk has a moisture content of 10%. The contents of protein, starch, and reducing sugars are 8%, 3%, and 2%, respectively [42]. The compositional analysis of the dry, ash-free basis reveals a weight percentage of cellulose, hemicellulose, and lignin of 30%, 12%, and 34%, respectively; the remaining percentage corresponds to extractives. Ash (Si, K, P, Mg, Ca, Al, Mn, Fe, Na) represents a 10–15 weight percent of the cocoa pod husk [41,43].
The environmental impact of the construction sector must raise awareness around the world [44,45,46]. With the aim of generating construction materials that are more respectful with the environment, some research studies are considering a different path, the use of materials from organic waste recycling [47]. Some studies use organic products that have conventionally been used in the food industry or as decorative elements—whether grown by means of conventional agriculture, or in cultivation farms built for construction purposes—applying novel methods of production; other studies use biological growth procedures to generate raw construction materials. These type of materials has been defined by Hebel et al. as cultivated building materials [48]. Examples of these cultivated materials are corn cob panels used for thermal insulation [49], bamboo fiber used as a reinforcing material in concrete beams [50], or biopolymers made of lignin and natural fiber for various construction applications [51], among them, as a facade material [48].
Acoustic quality is a factor that is increasingly being cared for in new buildings, given the growing demand and social requirements [52]. To obtain acoustic comfort inside the enclosures, acoustic absorbent materials are usually used, which reduce the reflected sound energy, and therefore, the reverberation. Most of these materials are obtained from synthetic materials, such as rock wool and glass wool [53], which have a high environmental impact. Natural fibers have been considered in research for the sound absorption of rooms. They have optimal characteristics as construction materials, as they are light, have a minimal impact on health, there is a great availability of them in nature, and they have a low environmental impact both in their obtaining and in the elaboration of the products [54]. For example, Glè et al. [55,56] studied the sound absorption properties of hemp fibers, leading to the conclusion that the particles size is associated with the sounds absorption at low-frequency; Tang et al. [57] evaluated the sound absorption of corn husk fibers arranged in different layers, finding out that the acoustic absorption peak gradually moves to lower frequency direction when increasing the number of layers; Oldham et al. [58] evaluated the sound absorption of different type of fibrous materials, and with different treatments, finding that jute fibers have similar sound absorption to mineral wool fibers.
Recent research has combined raw materials from agricultural product waste with artificial materials (e.g., fiberglass with carbon fibers polymers), for different purposes, seeking a compromise between sustainability and good performance [59,60]. Some of these materials used as binders increase their durability over time and prevent the disaggregation of the particles that make them up [61]. Furthermore, the properties of different materials have been characterized using mathematical algorithms to predict their sound absorption without the need to perform acoustic measurements. For example, a support vector machine algorithm has been used to characterize the acoustic properties of corn stalk fibers tied with clay [62]; artificial neural networks were calculated to assess sound absorbent properties of asphalts [63], and the performance of different algorithms compared in [64] to evaluate the sound absorption of giant reeds shredded.
The present research aims to evaluate the acoustic properties of cocoa pod husk as an acoustic material, using silicone as a binder. Different proportions of materials and thickness were evaluated. A Support Vector Machine (SVM) with Gaussian kernel was used to predict the acoustic performance of composite materials. The article is organized as follows. Section 2 describes in detail the materials and methodologies used in the study: first, the methodologies used to assemble the samples from the waste material of the cocoa cultivation are described. Subsequently, the measurements of the acoustic behavior of the material carried out with the impedance tube technique were described. Then, the algorithms used to elaborate the simulation model based on the SVM were described. Section 3 reports and discusses in detail the results obtained from the measurements of the sound absorption coefficient and subsequently the results obtained through the numerical simulation. Finally, Section 4 summarizes the results obtained from this study and discusses the possible uses of the developed technology in real cases.

2. Materials and Methods

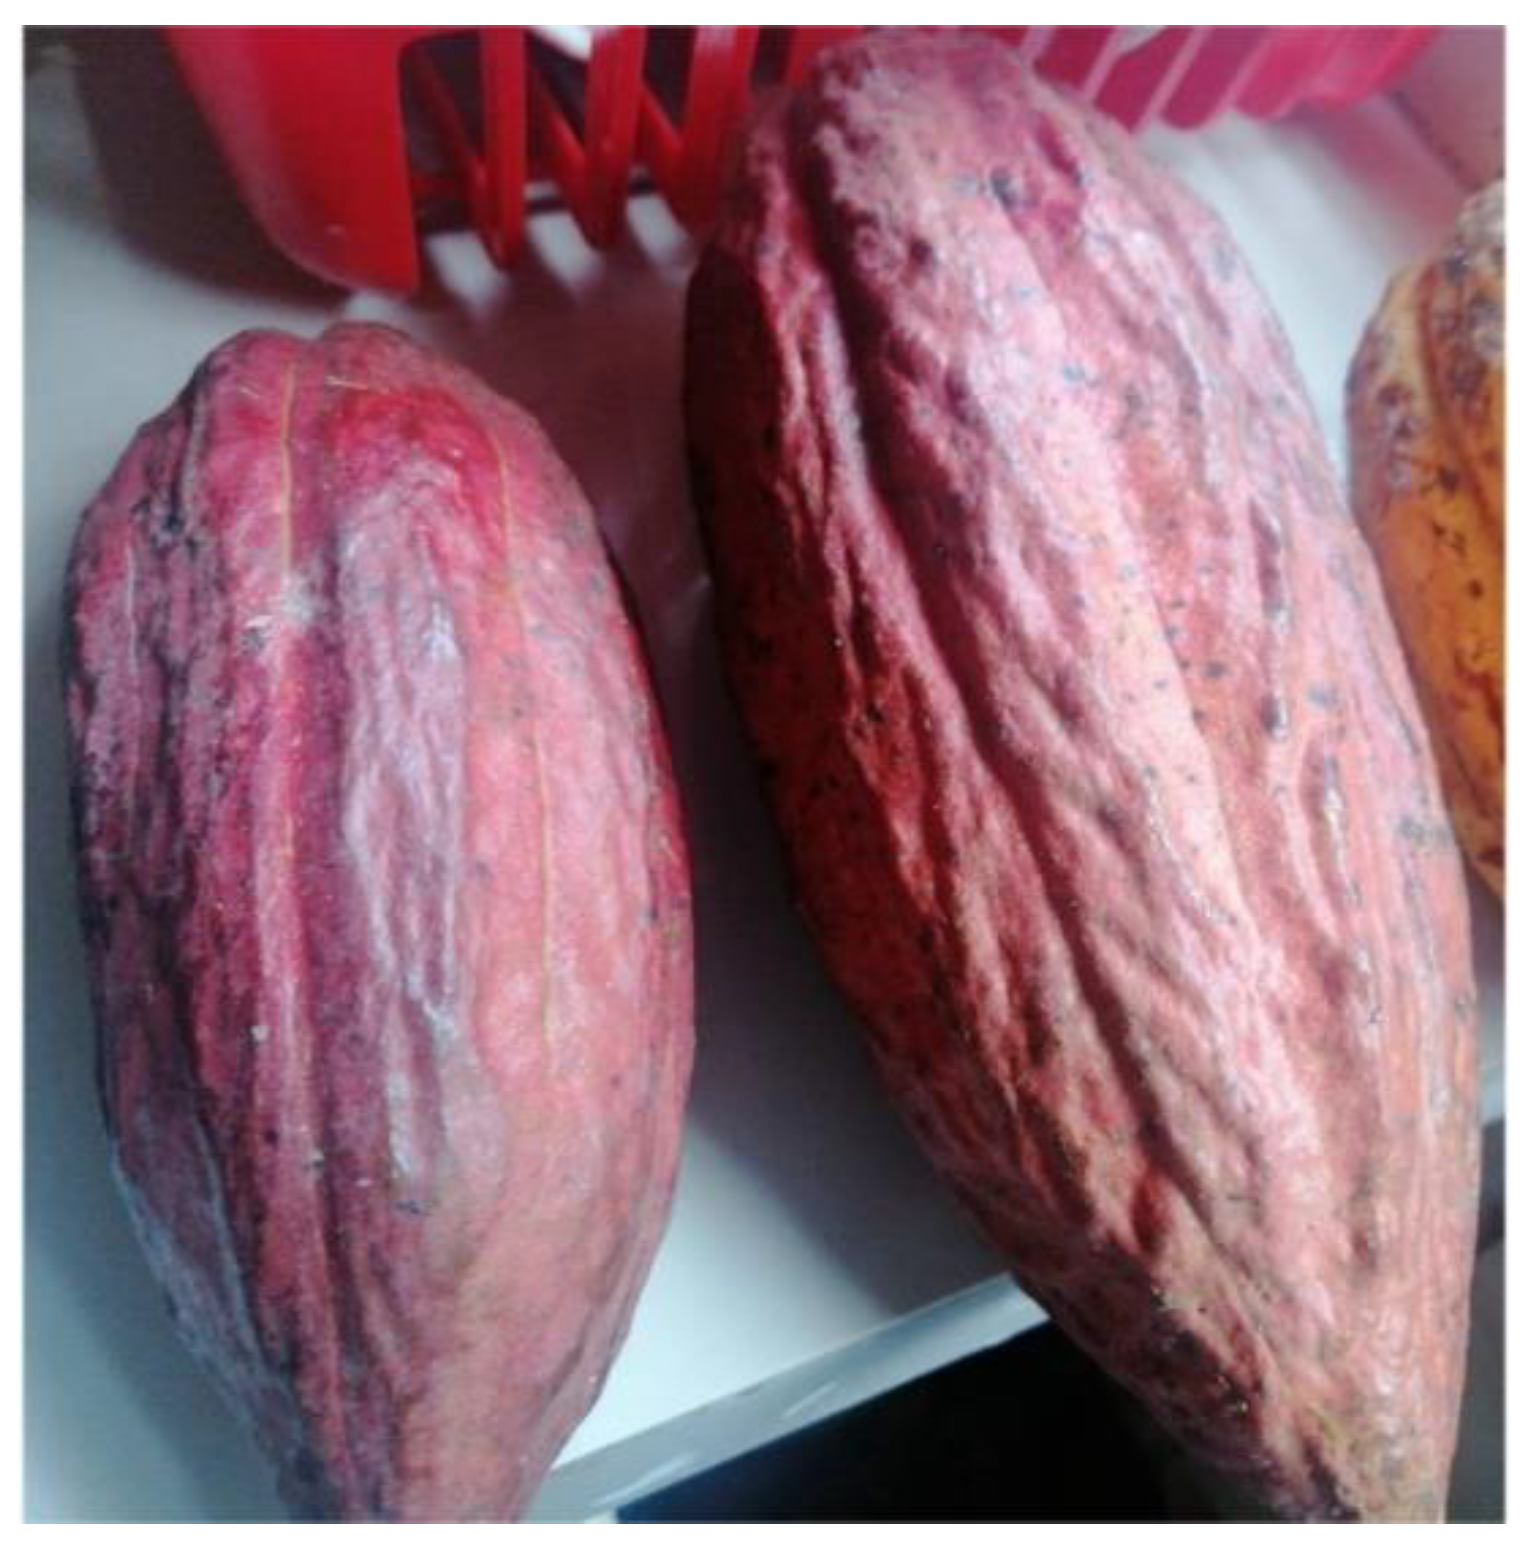
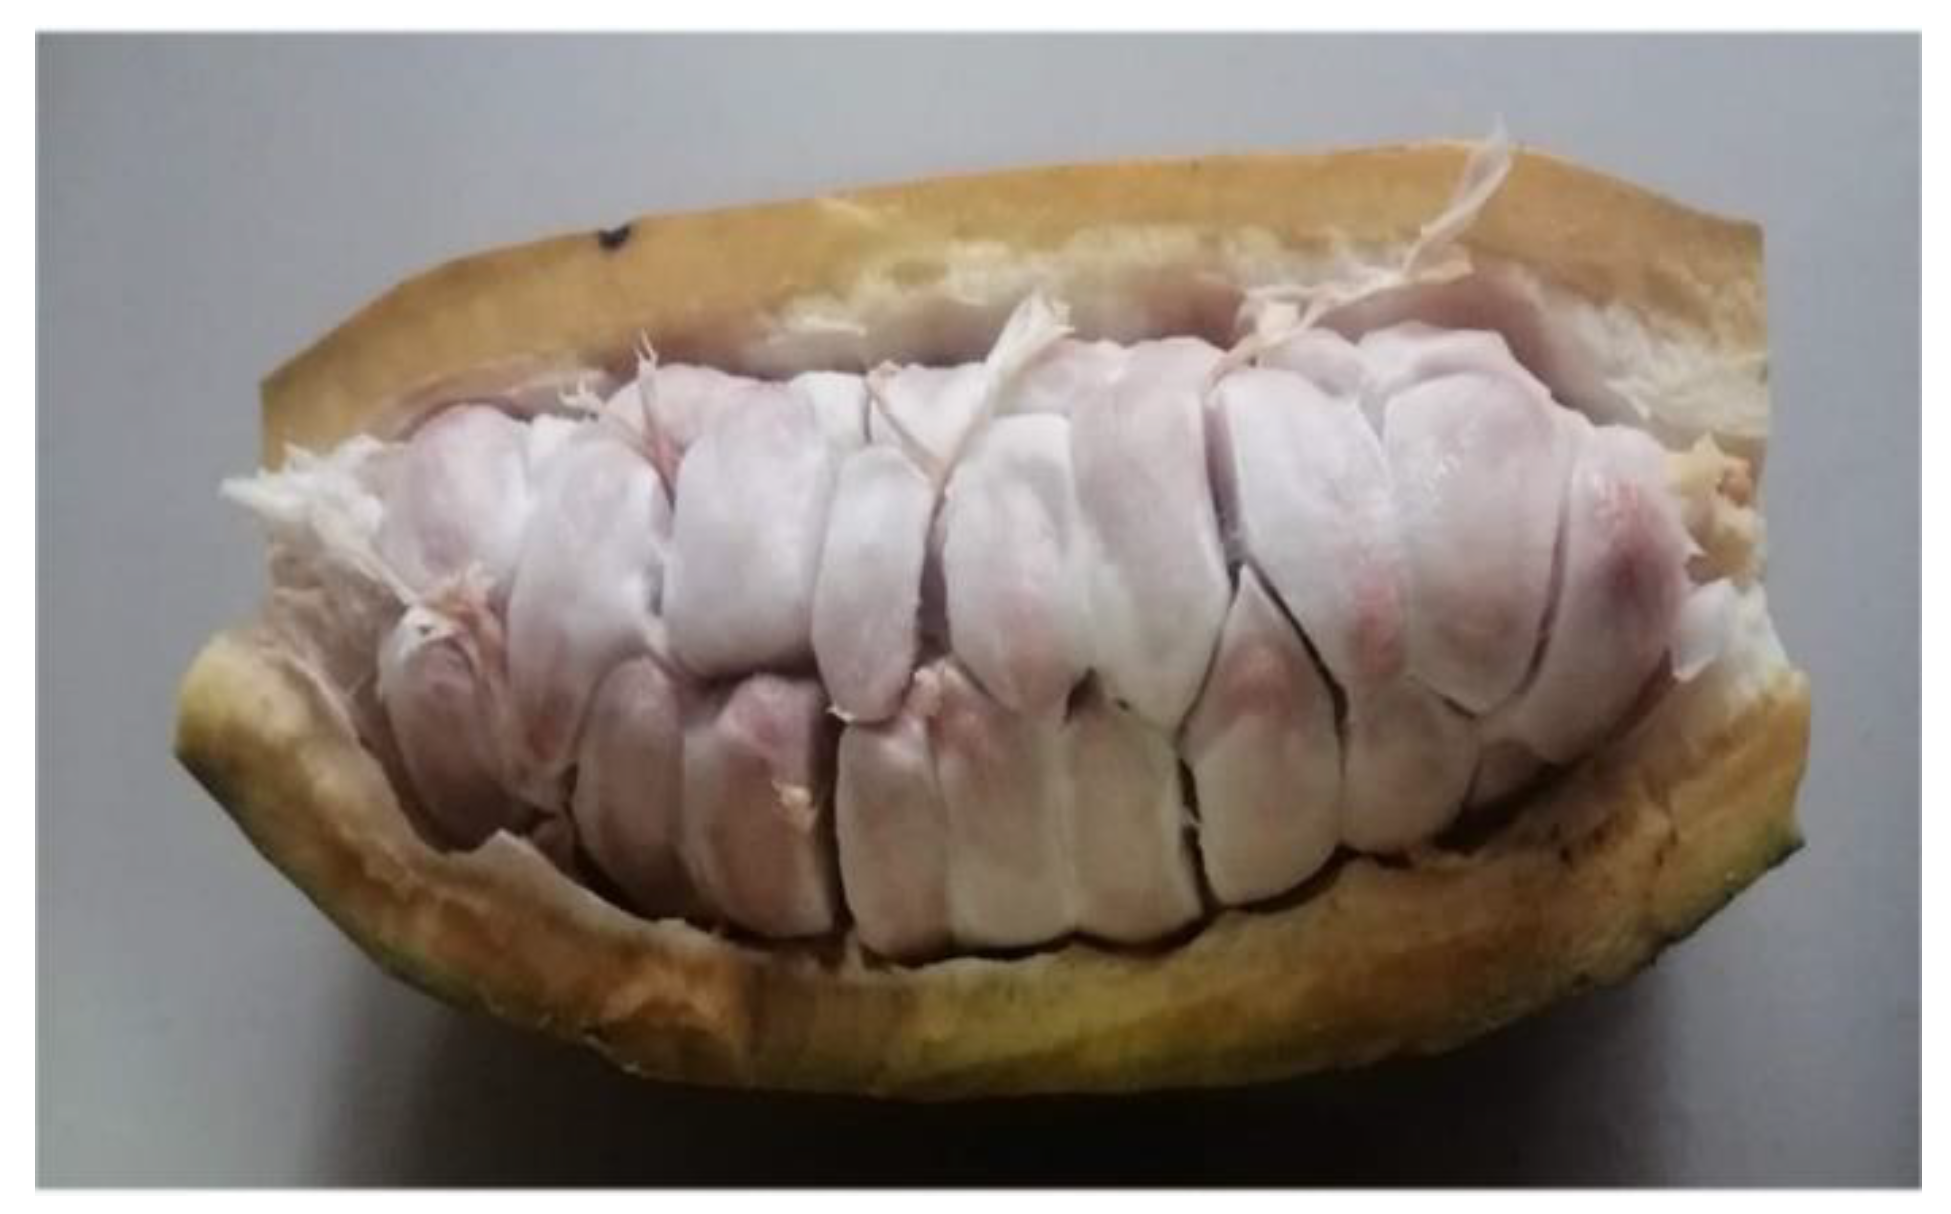
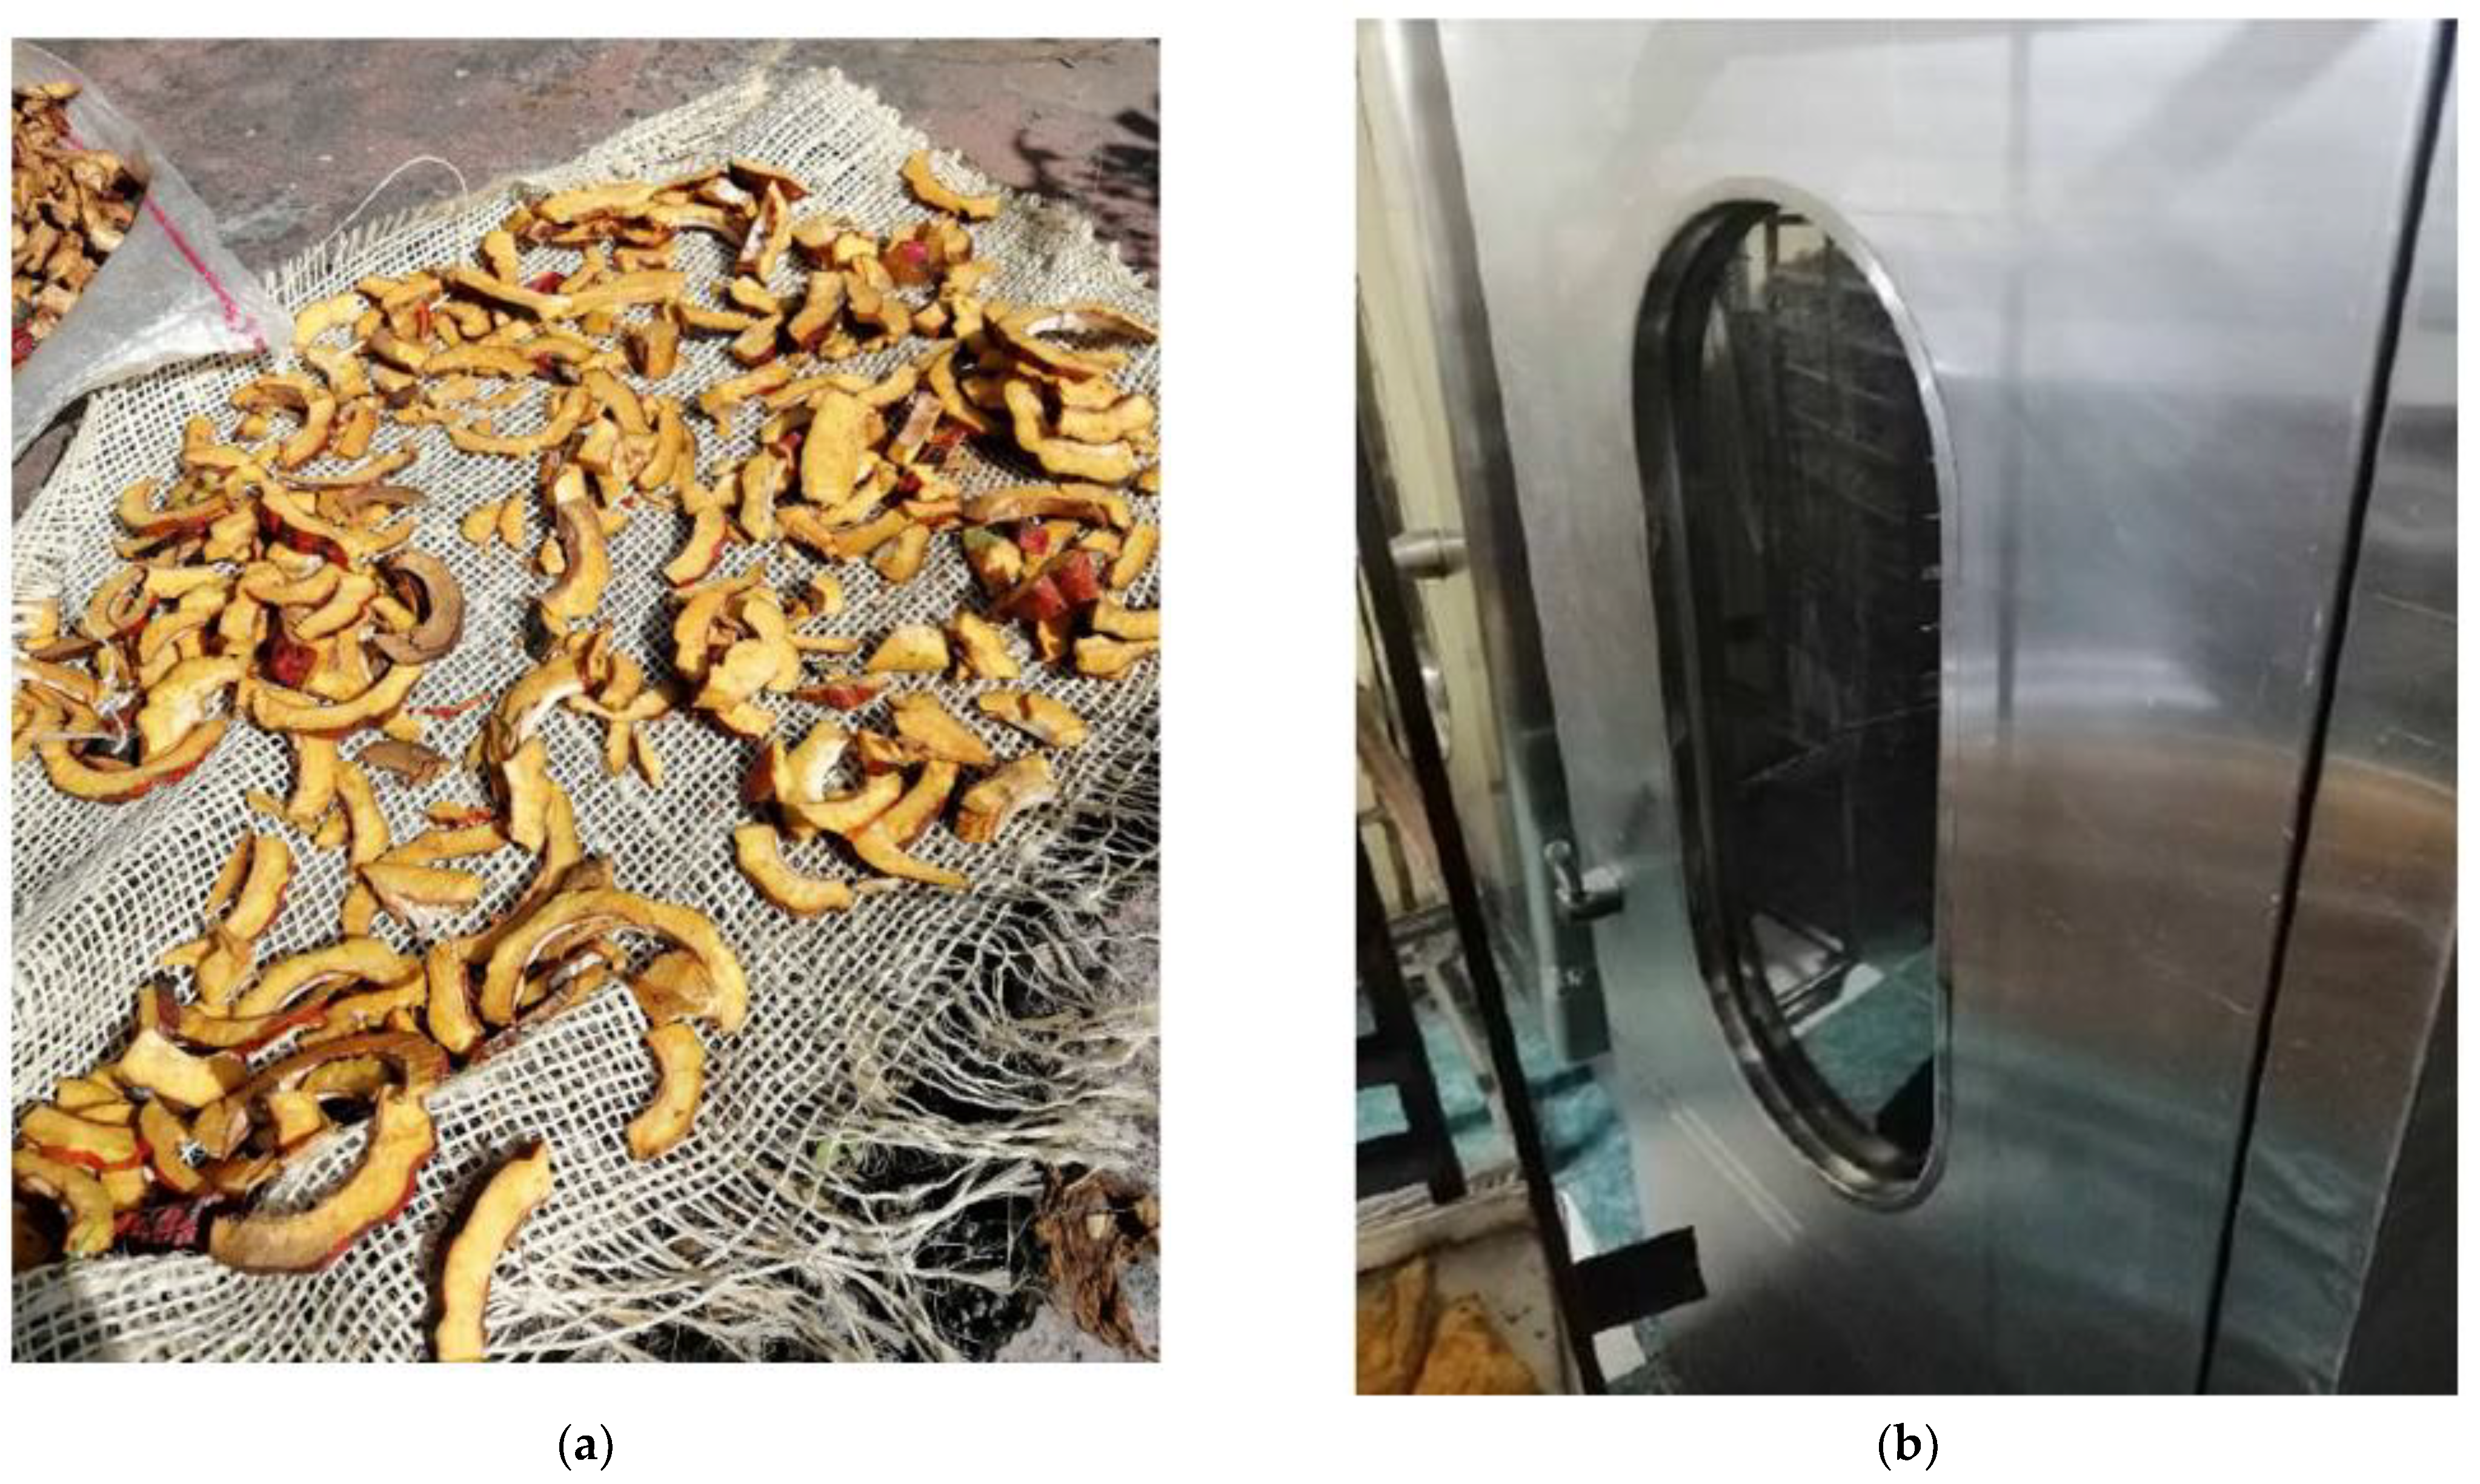
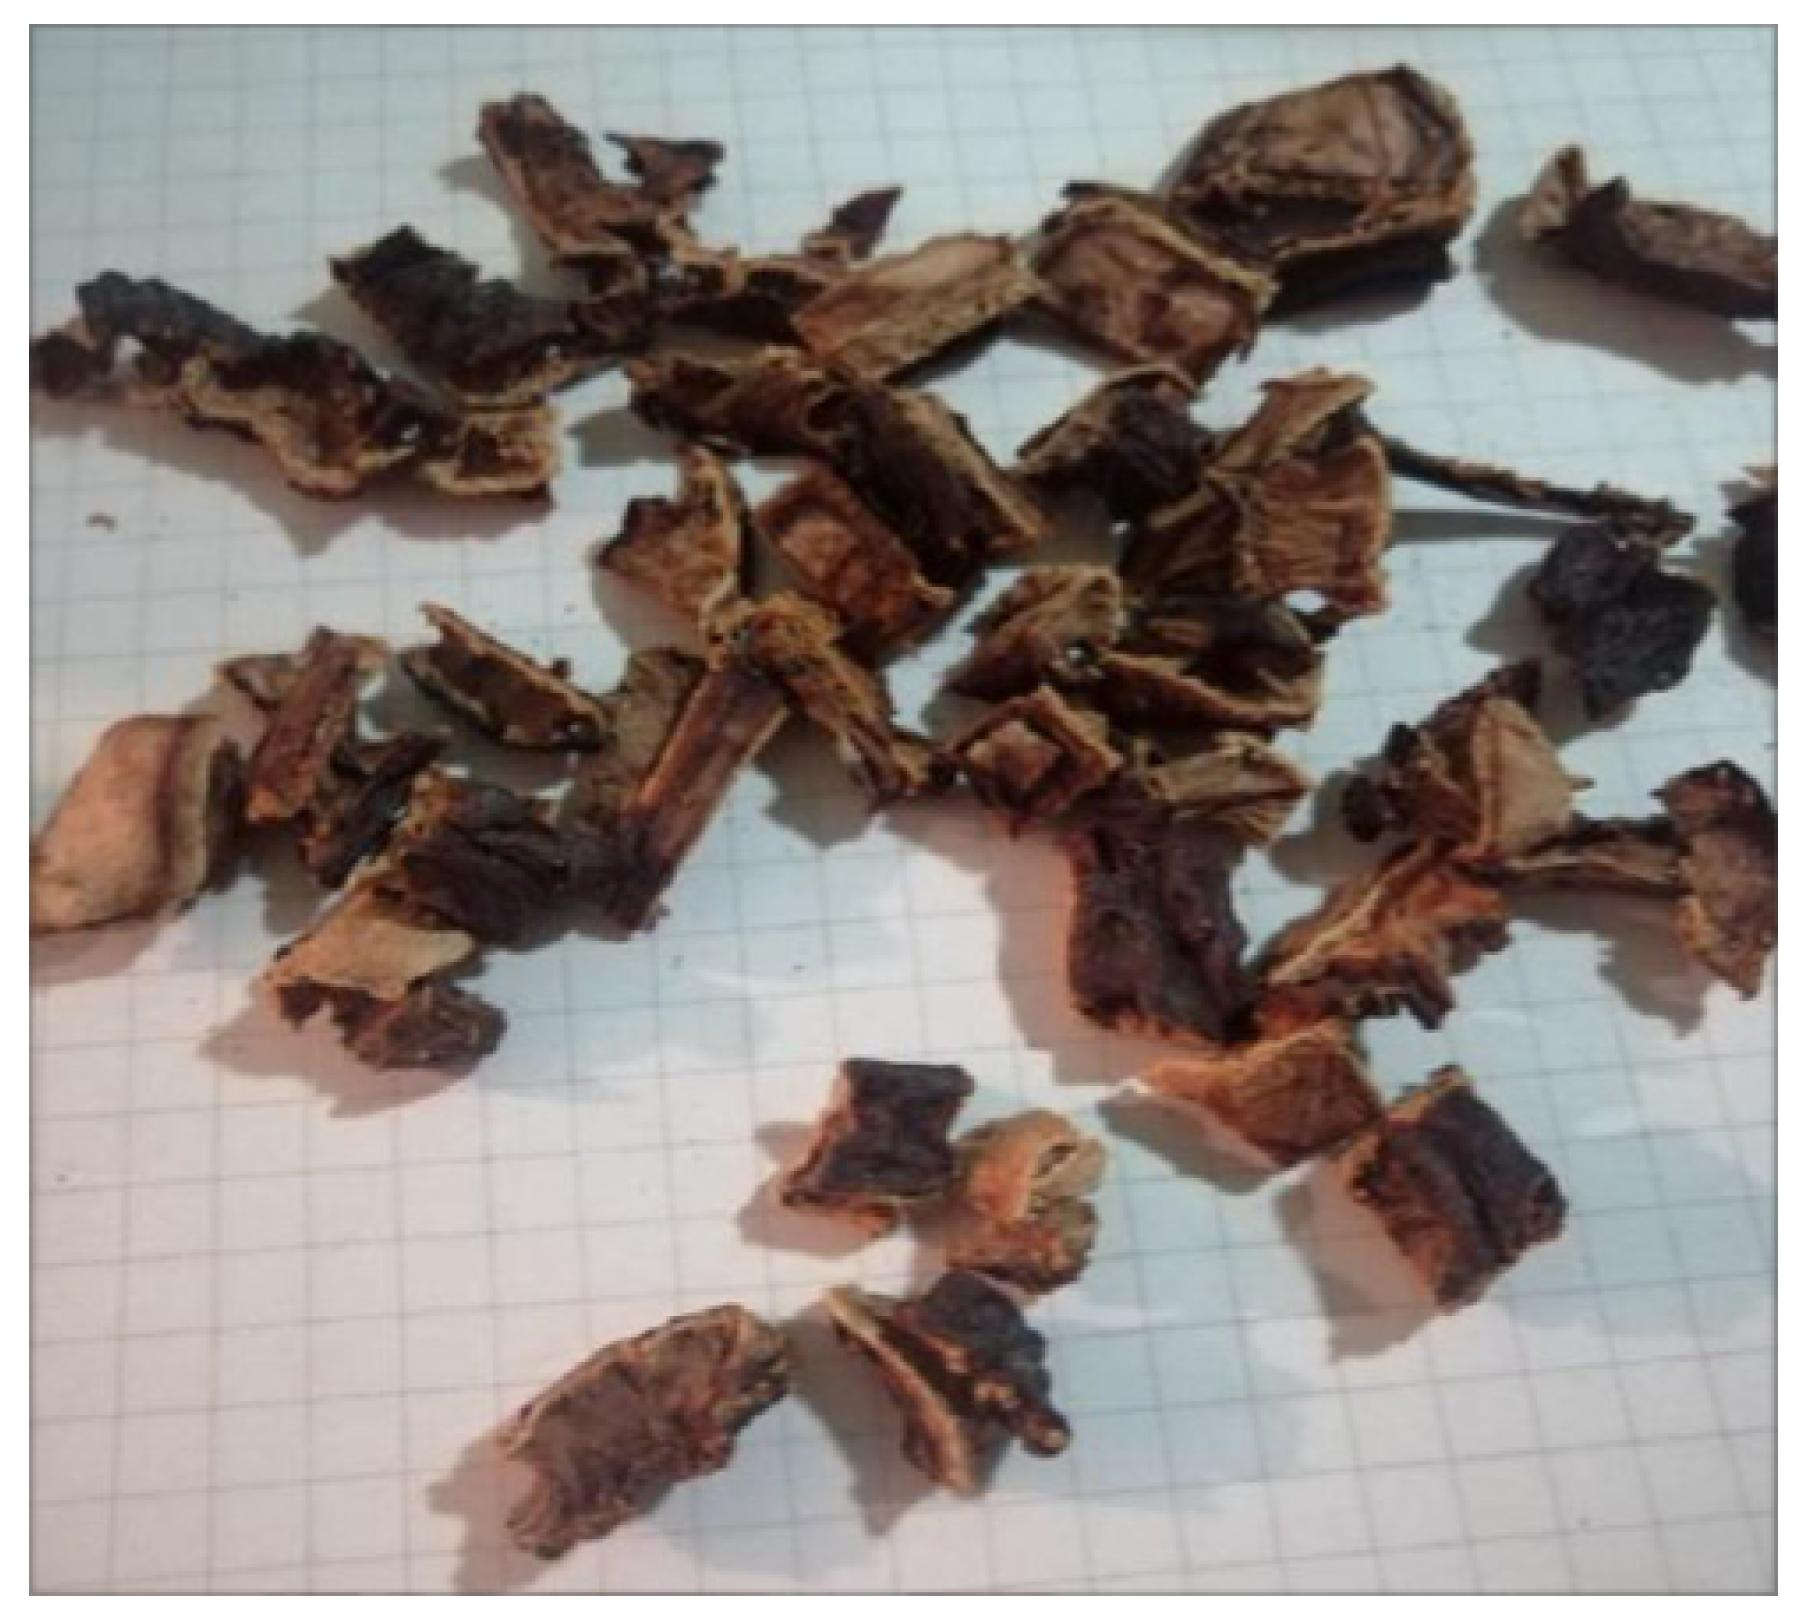
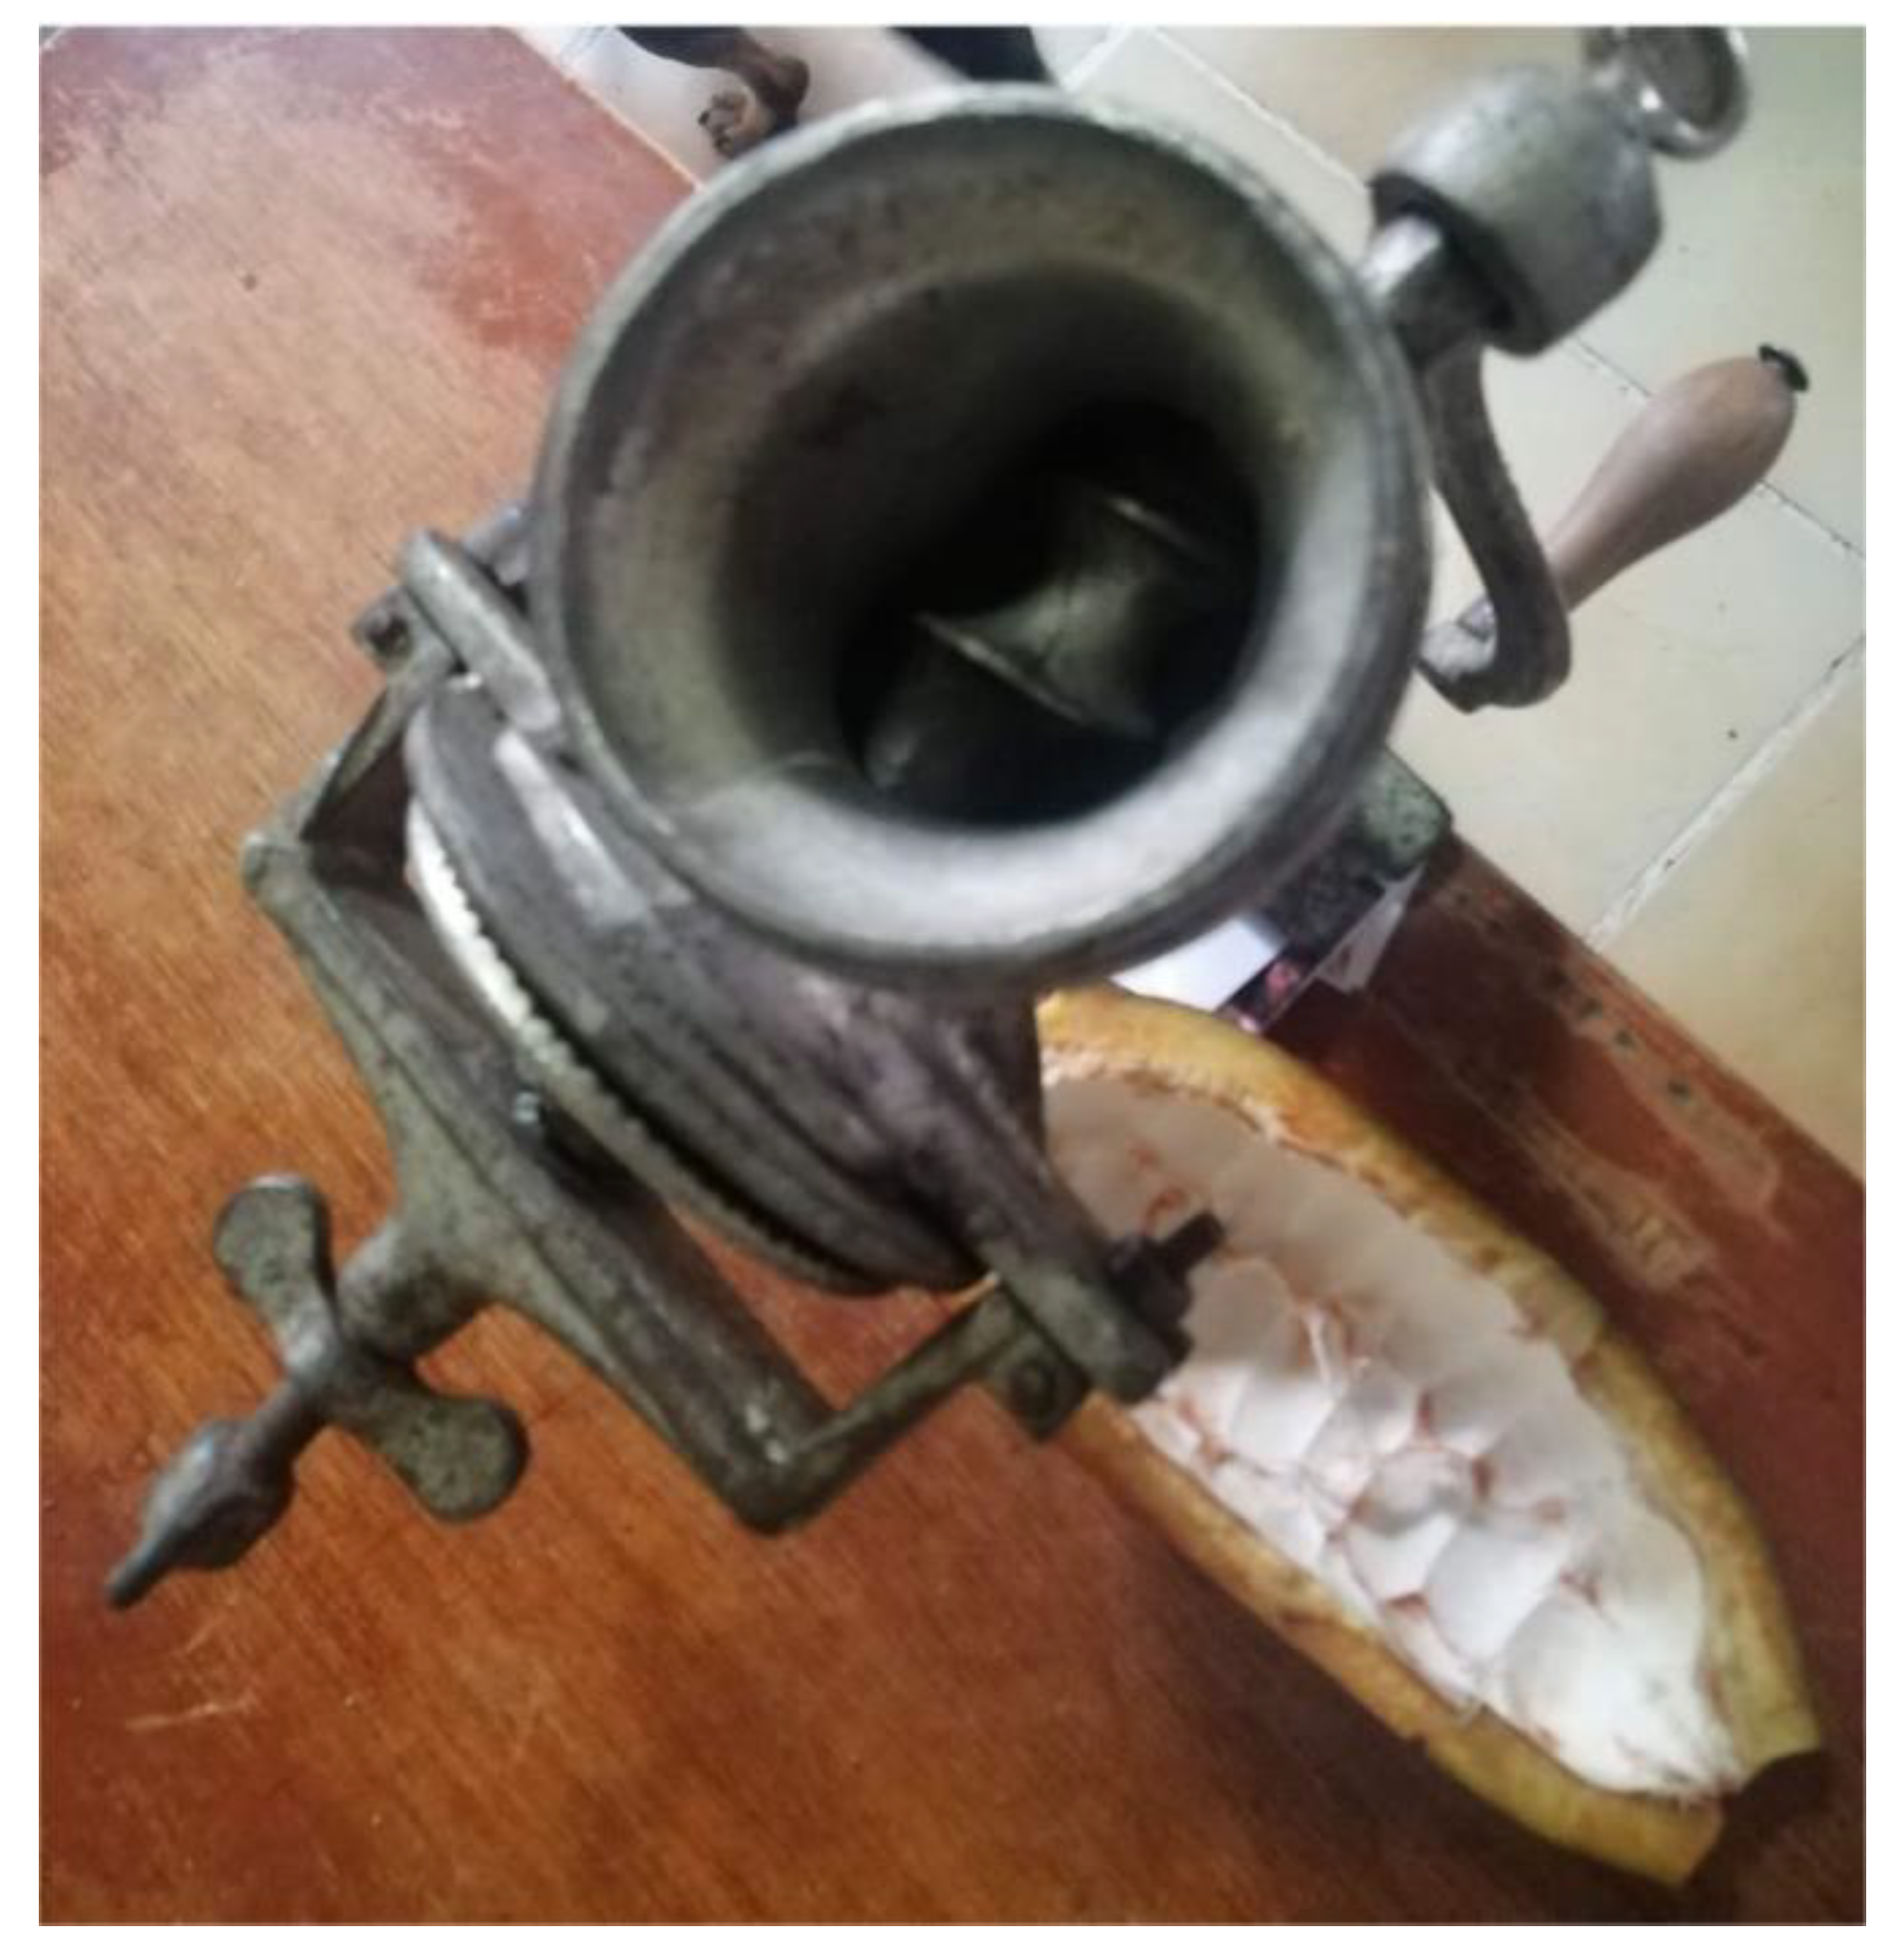
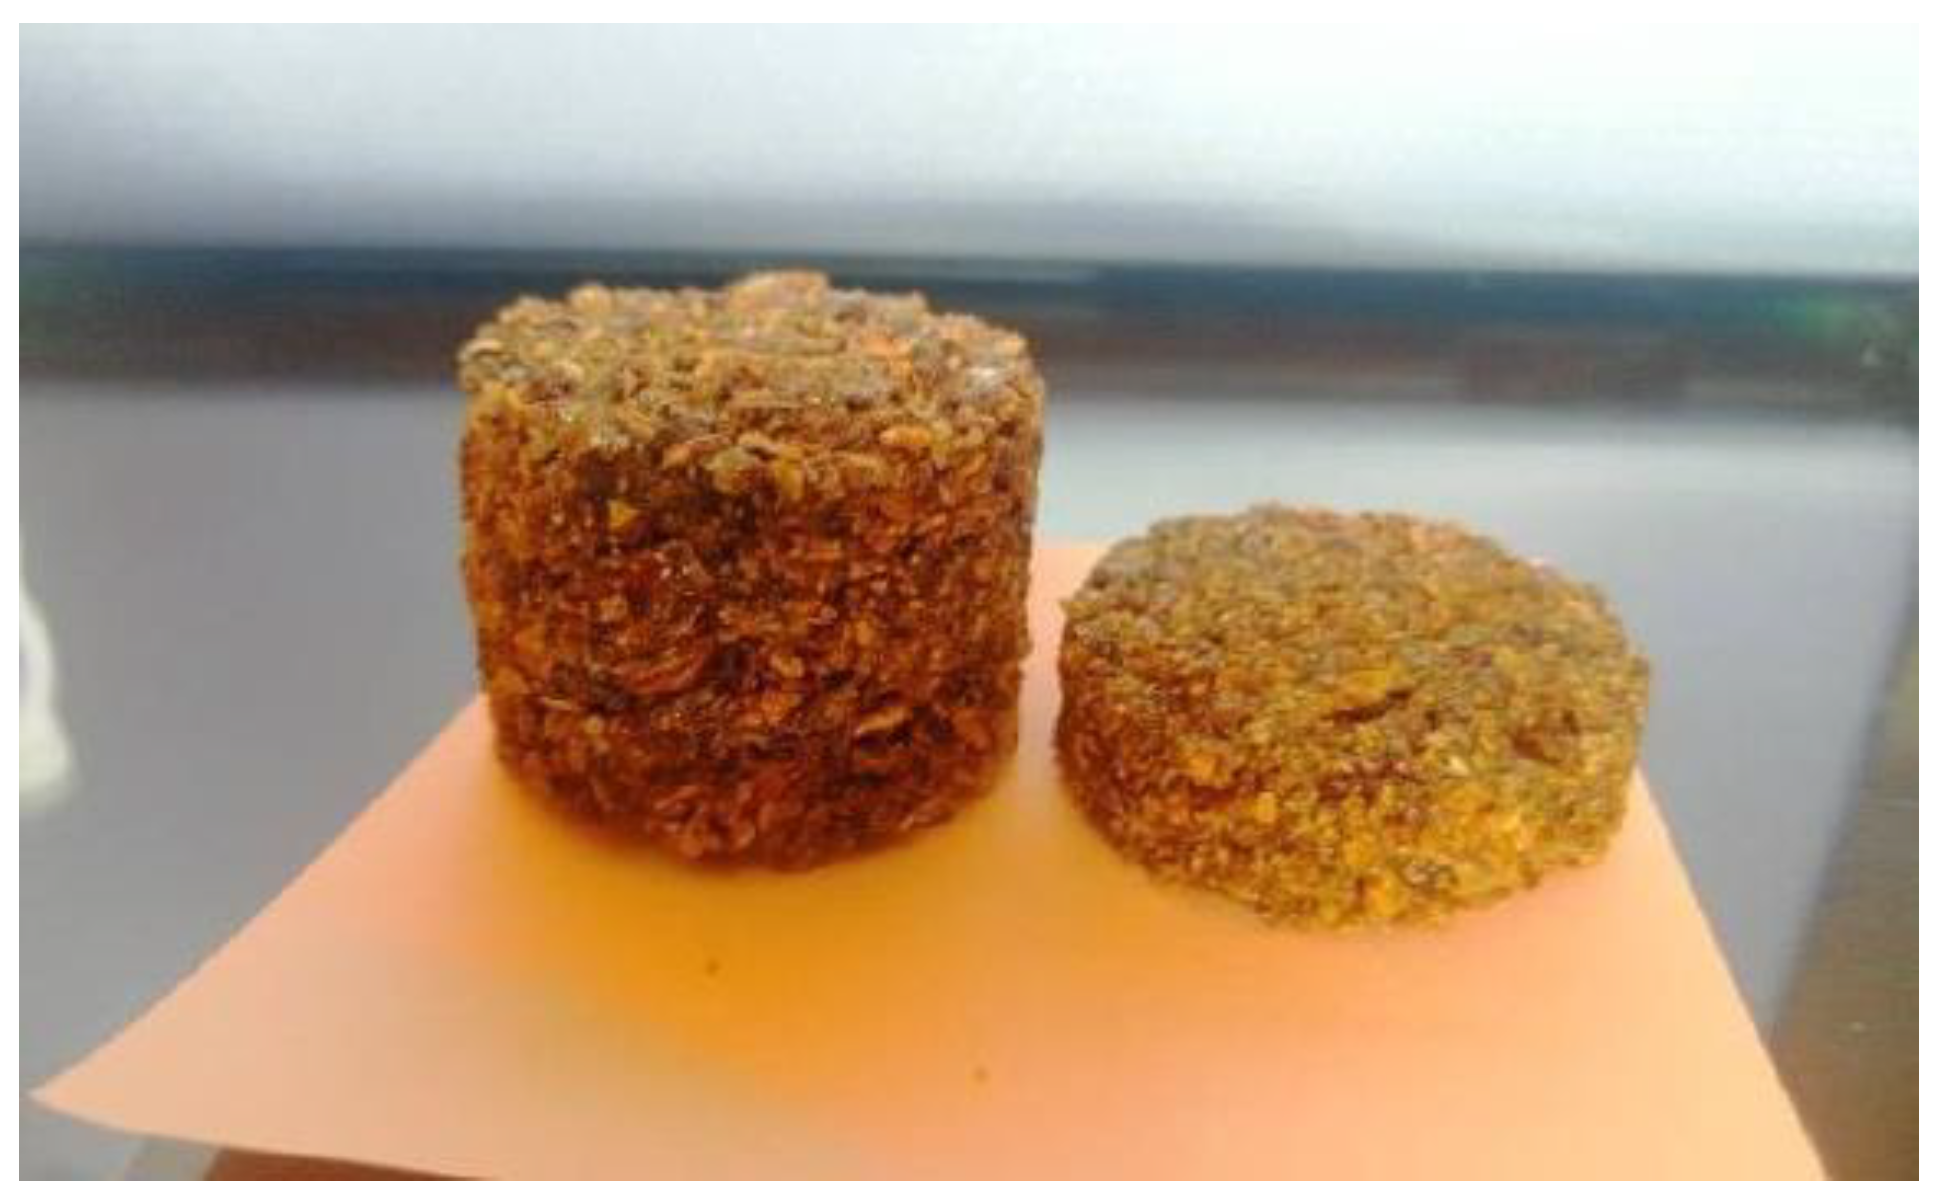
2.1. Characterization of the Cocoa Pod Husk Used in the Study

Two types of cocoa are mainly grown in Ecuador: cocoa “Arriba” and cocoa CCN-51. These varieties are sown and cultivated in the following provinces: Esmeraldas, Manabí, Los Ríos, Guayas, El Oro, Pichincha, Cotopaxi, Bolívar, Chimborazo, Santo Domingo de los Tsachilas, Cañar, Azuay, and in part of the Oriente [65]. The CCN-51 cocoa, whose pod has a reddish coloration during its growth and maturation, is tolerant to diseases [66] and has high productivity. The trees of the CCN-51 cocoa plantations, planted in a 3 m × 3 m grid, generate an annual production that varies between 45–60 quintals per hectare [65].
Clonal cocoa CCN-51 appeared for the first time in 1965 called Castro Naranjal Collection (CCN-51), by Eng. Agr. Homero Castro Zurita, as a highly pest-resistant and highly productive variety [65]. By ministerial agreement, in 2005 this variety of cocoa was declared by the Ecuadorian Ministry of Agriculture and Livestock as high productivity good due to its contribution to 25% of national exports [65]. The cob is ripe and ready to harvest when it turns yellow and/or reddish. At that time, the pulp that surrounds the seed is no longer adhered to the walls of the husk (Figure 2).
After a cocoa flower is pollinated and its ovules are fertilized, six months must pass for it to become a physiologically mature pod, ready for harvesting [67].
The type of cocoa used in this research is CCN-51 and comes from the province of Santo Domingo de los Tsachilas, Ecuador. For this research, 4 cocoa cobs were collected, from 21 to 27 cm in length. Only the cocoa pod husk was used, after the extraction of the cocoa seeds for the pre-fermentation and further fermentation processes. It was cut into thin slices of 1–2.5 cm thick (Figure 3) [68]. The cocoa pod slices were naturally dried in the open air for two days.
After this, they were cut into pieces of approximately 2 cm and were subjected to a process of drying in the oven [69] until constant moisture content. The pieces of cocoa pod husk were introduced in an oven for 6 h approximately at 60 °C. During this process, the weight loss was calculated, comparing the initial with the final weight [62]. The final moisture content was slightly smaller than the one obtained by Kilama et al. [70] and Velazquez-Araque and Cárdenas [71], probably because our experiment was done a few days after the harvest, and there could already be a decrease in the moisture of the cocoa pod husk [72].
The cocoa pod pieces resulting after finishing the drying process had decreased in volume and had brown-reddish color (Figure 4). Subsequently, manual mill for cereals and grains was used to reduce the particle size, with the disk that grinds the medium-sized (Figure 5) [61]. The mean particle size was 1 mm.
A binder was used to agglomerate the particulate material, silicone rubber, with different percentages of cocoa pod particles by weight (90%, 75%, 50%, 25%). Silicone rubbers are elastomers composed of silicone, which forms a polymer together with carbon, hydrogen and oxygen. A bicomponent silicone rubber (specific weight 1.12 g/cm3; Viscosity: 9.000 mPa.s; Hardening time: 18 h) was used for the realization of the specimens. To make the samples, 2 wooden molds with different depths were built, into which the mass composed of cocoa pod husk with silicone was poured. Subsequently, samples of the panels (Figure 6) with a diameter slightly smaller than that of the impedance tube were extracted to carry out the measurements and obtain the absorption coefficients.
Samples were made with two thicknesses, 10 mm and 25 mm. Consequently, the acoustic features of 8 different samples were evaluated.

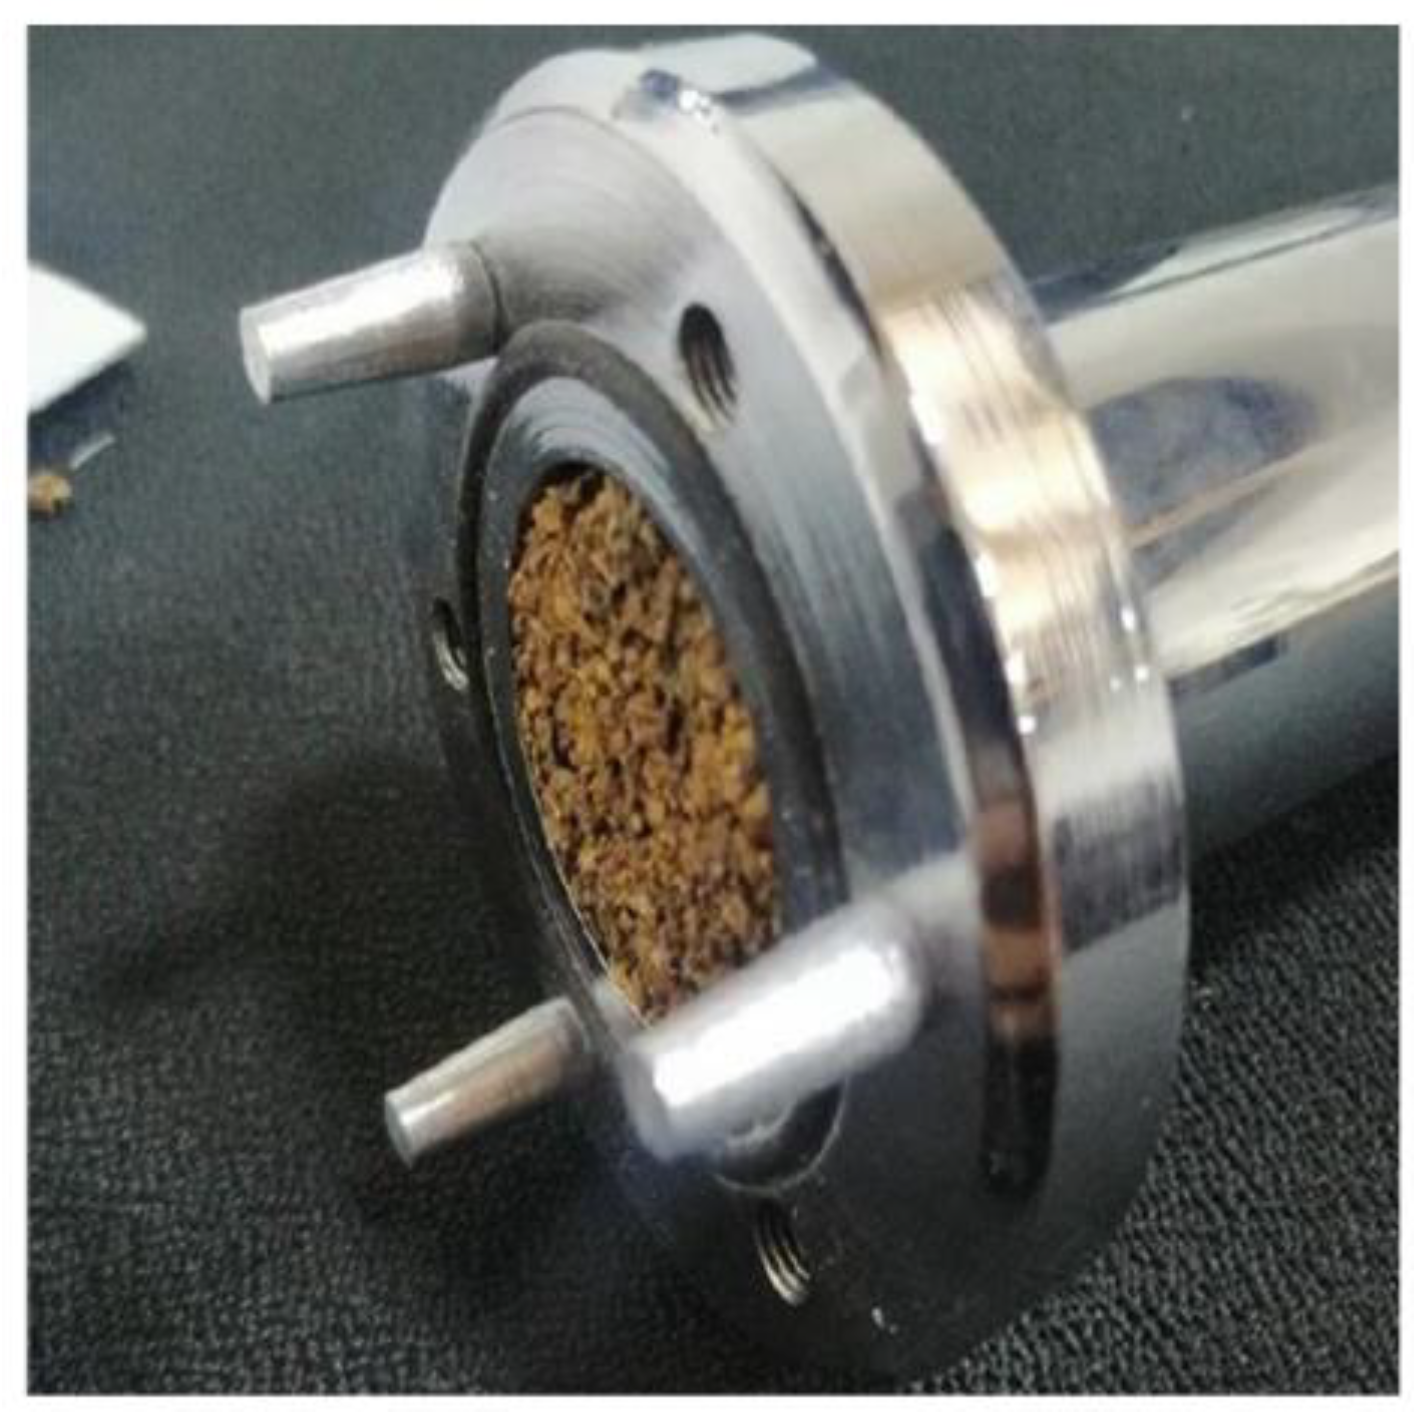
2.2. Acoustic Absorption Measurement Procedure

There are several ways to measure the sound absorption of a material. The most widely used are the measurement of the reverberation time in a reverberation chamber [73], and the measurement of the absorption coefficient in the Kundt tube. This last method is the one used in the present research work and consists of determining the absorption coefficient from the surface impedance of the material under normal incidence. It is important to carry out these measurements in a normalized way to obtain comparable values with data obtained in other investigations, being able to make comparisons between materials and the performance of each one. For this reason, the ISO 10534-2: 1998 standard, “Determination of the acoustic absorption coefficient and acoustic impedance in impedance tubes”, was used as a basis for the measurements [74].
The impedance ACUPRO Spectronics was used to measure the sound absorption of the samples (frequency range 50 Hz–5700 Hz), set up with two microphones. The inside diameter of the tube is 34.9 mm, the outside diameter is 41.3 mm, and its length is 1200 mm. It was located at 250 mm in height. The JBL 2426J speaker was integrated into the impedance tube. It allows a maximum sound pressure level within the tube of 150 dB. The loudspeaker is mechanically isolated, so it does not have structural vibrations. The DT9837A interface manages the audio inputs, outputs, and outputs, and transforms the electrical signal into digital. The interface has four input channels for the conversion and corresponding data recording and one output channel for sending the signal from the computer. The signal reproduced by the loudspeaker is captured by the microphones and is sent from the ACUPRO system to the interface, to later be amplified and sent with the necessary voltage amplitude to the computer. The ACUPRO software was used for processing the data. It is based on the international standards ISO 10534-2 [74] and ASTM E 1050-98 [75], which define the procedure to determine the sound absorption coefficient and impedance using the transfer function method. The software was configured to estimate the average of 150 measurements for the calculation of each absorption coefficient. To homogenize possible results differences due to material irregularities, 6 measurements were conducted, extracting, and inserting the sample each time. It was verified that the sound pressure level of the background noise was less than 30 dB to avoid measurement interferences. The absorption coefficients were calculated from 50 Hz until 5700 Hz in steps of 7.5 Hz. Figure 7 shows the sample holder of the impedance tube.

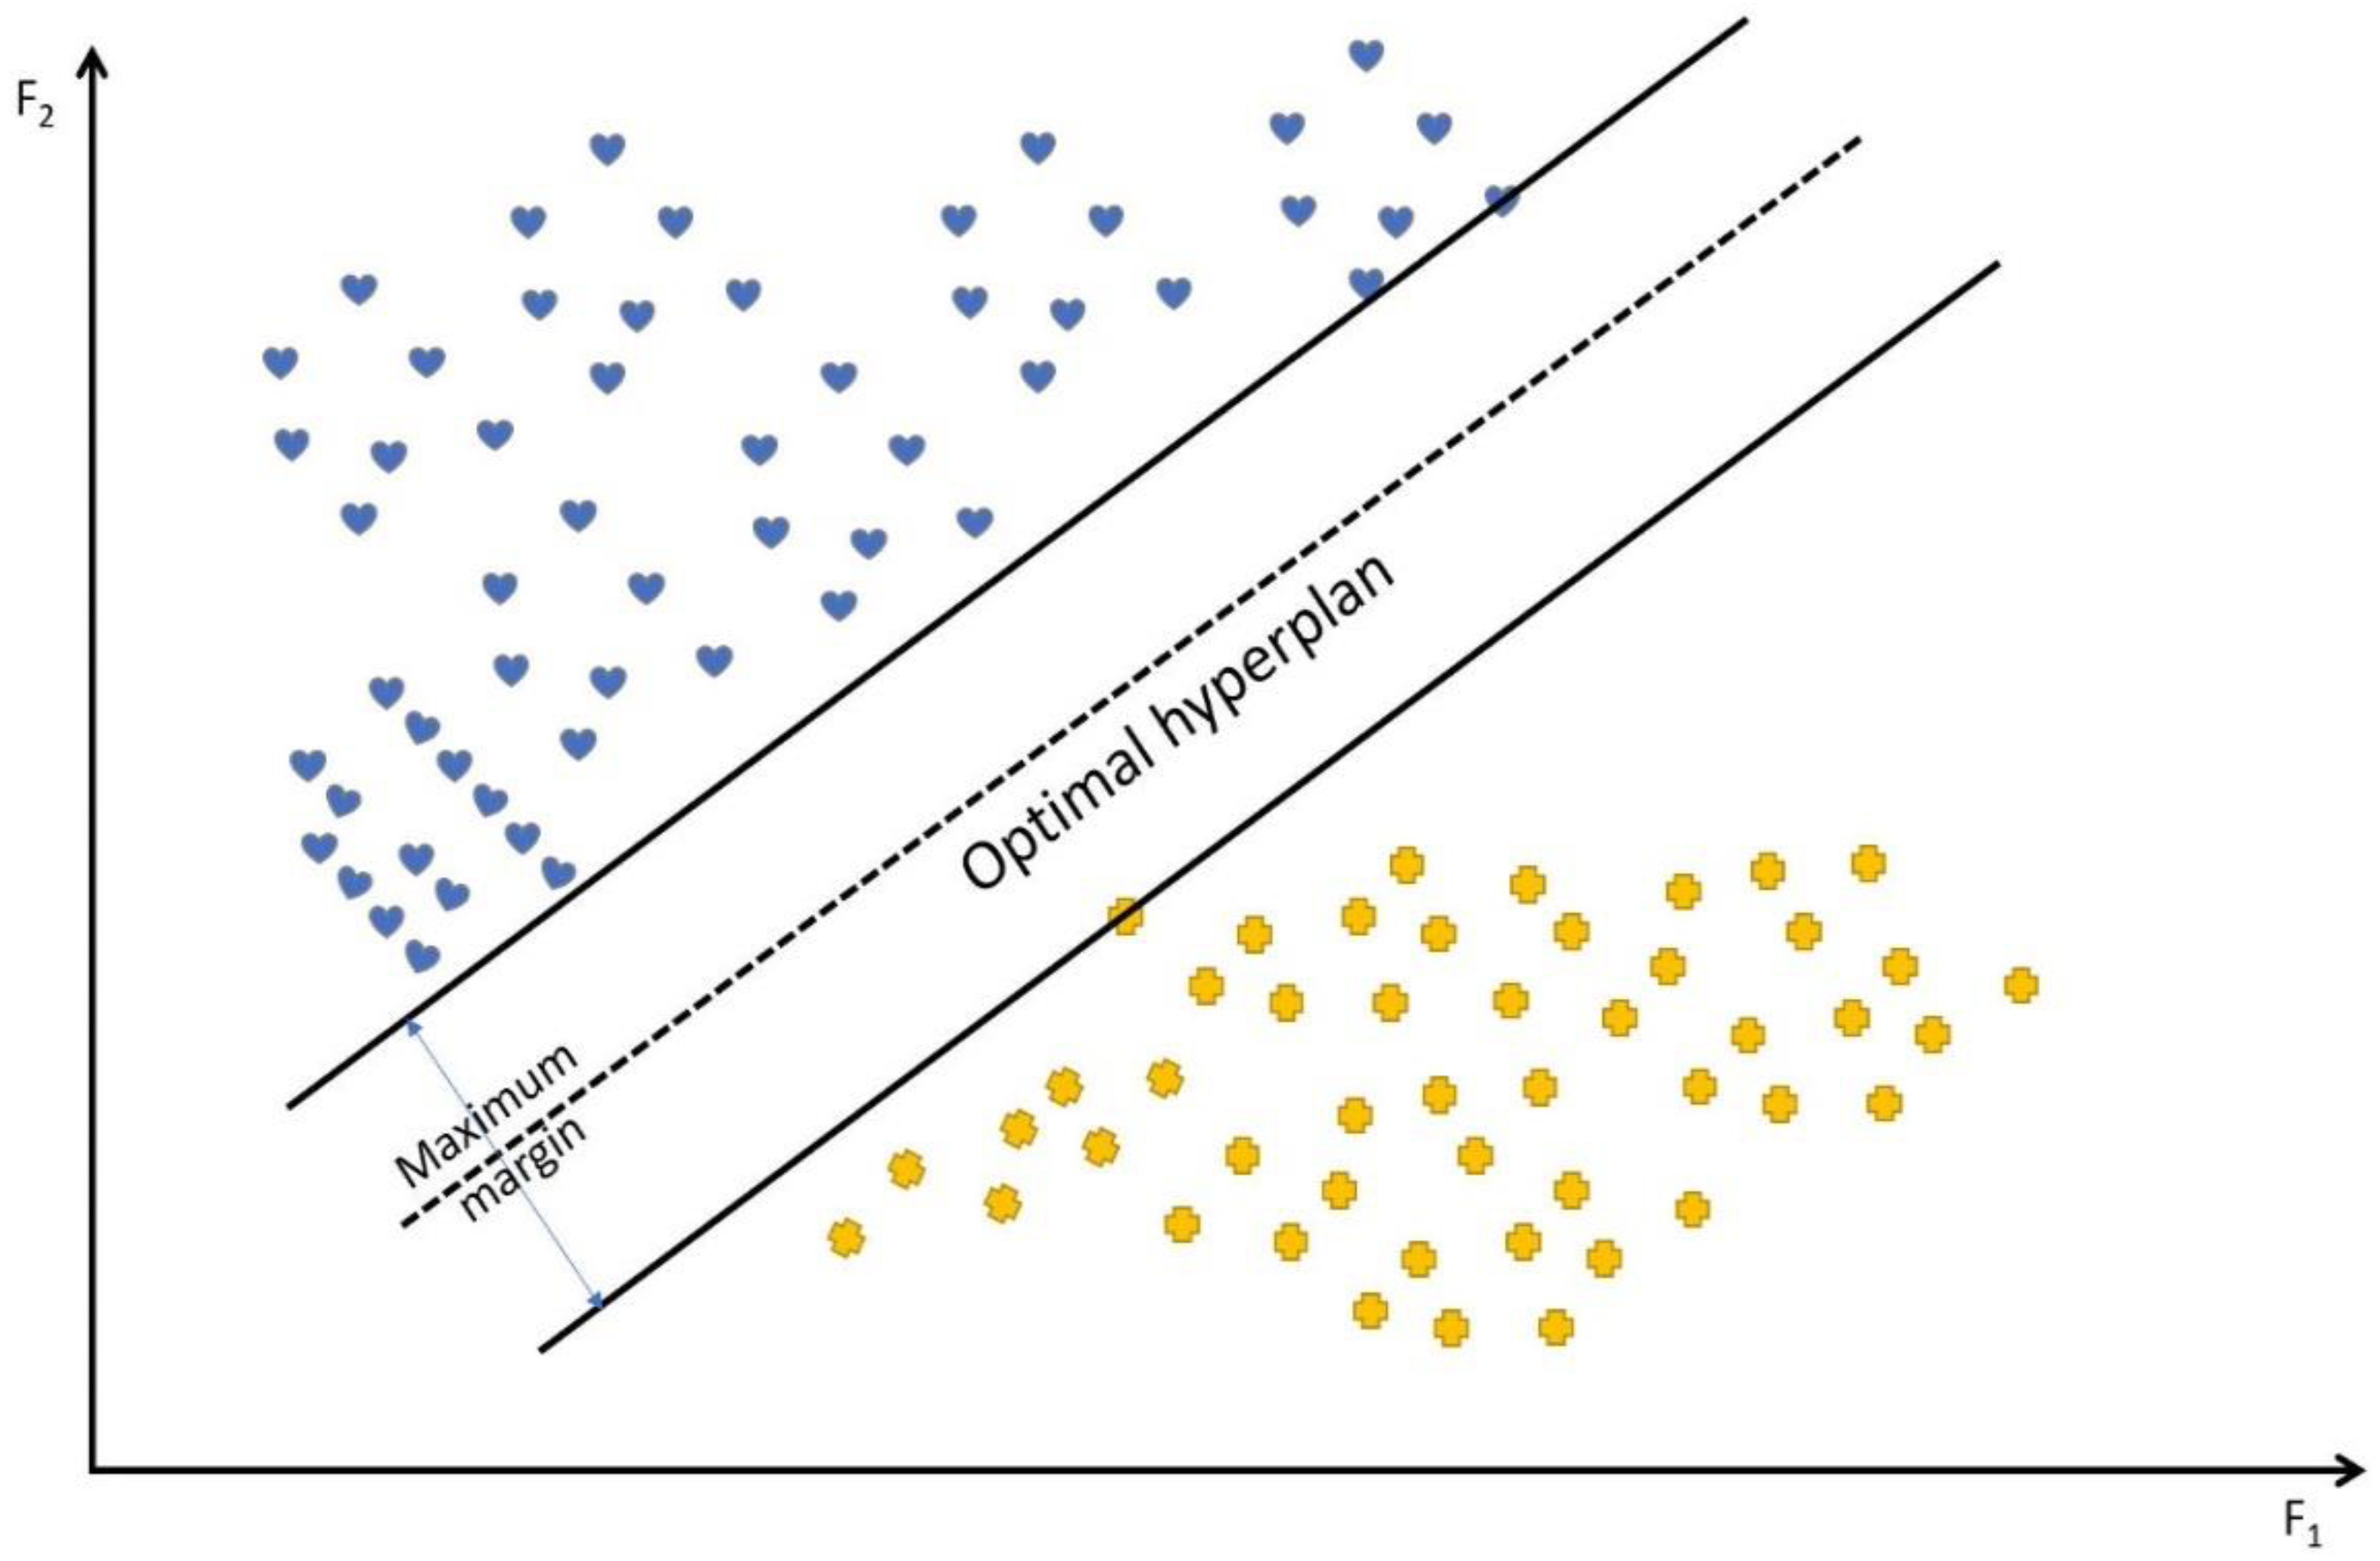
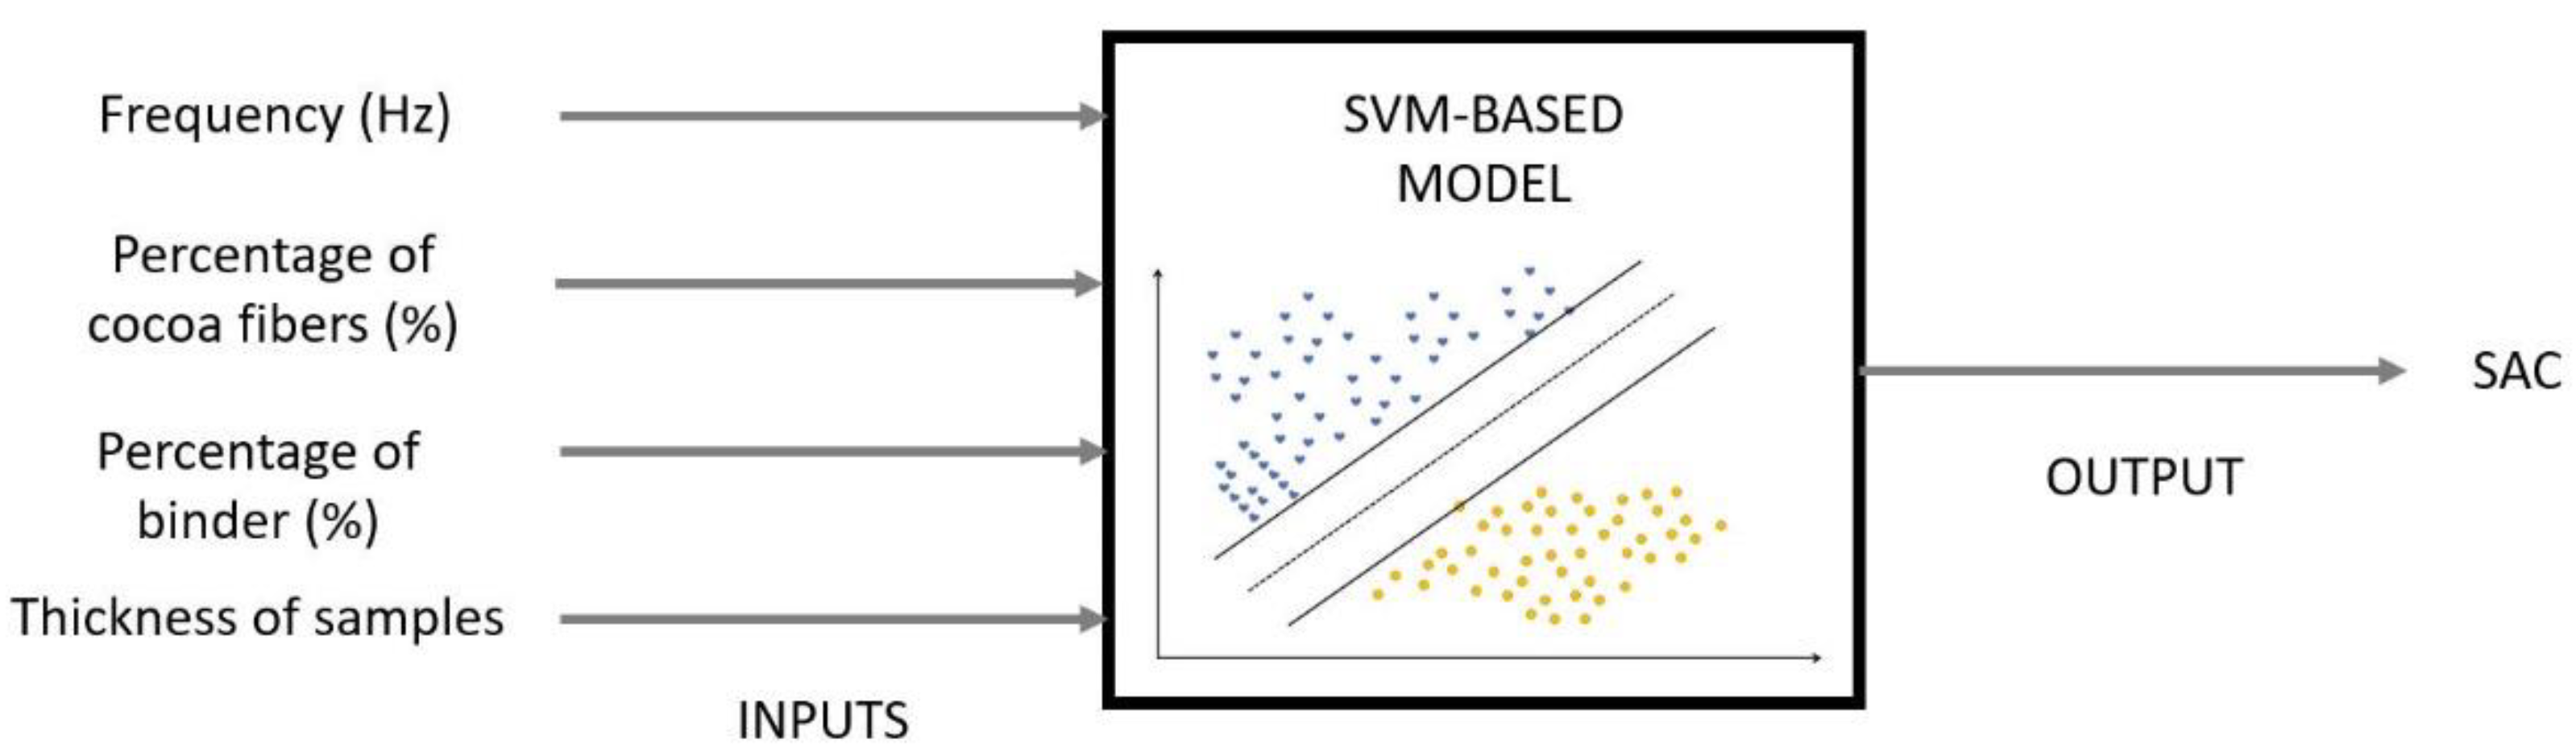
2.3. Support Vector Machine (SVM)-Based Method

The Support Vector Machine (SVM) developed by Vapnik [76] comprises a set of supervised learning methods that allow the classification of certain patterns. Supervised learning occurs when the user provides a set of data labelled with the class it belongs to. In the classification, the assignment of an object or a pattern to a specific class already known a priori is carried out. Usually, the input for a classification problem is represented by a set of data called training set while the goal is to find a method that is capable of generalizing, to classify new input data not present in the training phase. A classifier can solve this problem using an algorithm that allows determining the model that best approximates the relationship between the data attributes and the various classes.
Each learning algorithm needs a training data set T, which consists of N data belonging to C classes (Equation (1)).
T = { x n ;   y n }       n = 1 , N ;   x n   R d   ;   y n C ,
Here:
  • xn are the components of a d-dimensional vector containing the data attributes
  • yn are the components of a one-dimensional vector containing the data classes
  • d represents the number of classes
  • T represents the set of data
  • C represents the set of classes
The mapping function yn = f (x), which associates to each data its class of belonging is not known, therefore the purpose of a supervised learning algorithm is precisely to find this function. Each learning process is divided into two phases:
  • training phase in which the algorithm analyses a training data extracted from the entire set of available data, to build a model that approximates the mapping function.
  • testing phase, where the model created is tested on a different set of data to evaluate its performance.
Once the model has been created, its validation is carried out in which quality and performance are assessed. The validation phase is carried out on a set of data called test set, different from the one used for training. This phase foresees a comparison between the data classes predicted by the model with the current ones; therefore, such classes must be known a priori. However, two well-known problems can be encountered during model development: underfitting and overfitting. The first occurs when the model created is too simple and fails to classify well the training set and consequently not even the test set. The concept of overfitting is very important especially for supervised learning techniques (SVM): it occurs when the complexity of the model is very high, adapting optimally to the training set. This leads to an extremely low training error, but the classifier is unable to generalize, that is, to classify well the data belonging to the test set. The problem of overfitting can occur in cases where the training set is limited or when training has been carried out for too long.
The use of automatic learning algorithms provides at first to find the best criterion to separate the classes and subsequently, once the optimal separator has been found, the test phase can be carried out in which each sample will be assigned a class. The distribution of the data in the plan can be different. We may be faced with linearly separable data and linearly non-separable data. In the first case, a line (D = 2) or a hyperplane (D > 2) can be drawn that separates the data belonging to one class from the data belonging to the other.
In the case of linearly separable data, to solve the classification problem, it is necessary to find a hyperplane that separates the positive from the negative half-space. The hyperplanes that divide the classes are potentially infinite. At first glance, it may seem that all the solutions are good, but it emerges that by keeping the margin between the two classes as large as possible, the risk of overfitting will be lower with a consequent reduction of incorrect classifications on data that are not part of the training set. Therefore, the goal is to find the optimal hyperplane that will be the one able to reduce the wrong classifications (Figure 8).
In the case of a linearly separable training dataset, a hyperplane is defined by all the points that satisfy the equation 𝐰 ⋅ 𝐱 = 0, characterized by an inner product and in which w is a vector perpendicular to the hyperplane. We are looking for the parameters of the hyperplane (w; b), so that the distance between the hyperplane and the observations are maximized. We will call the Euclidean distance between the point xi and the hyperplane as the geometric margin. The geometric margin of a single observation xi is calculated through Equation (2).
δ i = y i   ( w · x i + b ) w ,
Given the training set T, the geometric margin of a hyperplane (w; b) with respect to T is the smallest of the geometric margins with respect to the individual observations of the training set, as returned by Equation (3).
δ = min i = 1 m δ i ,
In the search for the optimal separation hyperplane, our goal should be to maximize the geometric margin of training and then position the hyperplane in such a way that its distance from the nearest points is maximized. However, this is difficult to do directly as this optimization problem is a non-convex problem. The solution to this problem will be a linear decision surface with the greatest possible margin. The objective function is clearly a convex function, which implies the possibility of finding its maximum. The general optimization problem consists of a quadratic objective function and linear constraints and can therefore be solved directly with the use of quadratic programming. As programming is often computationally inefficient when dealing with large datasets, solving this optimization problem is addressed using Lagrangian methods [77].
To also use the classification with hyperplanes for data that require separating non-linear functions, it is necessary to resort to the technique of feature spaces (Figure 8). This method, which is the basis of the SVM theory, consists of mapping the initial data in a space of greater dimension: The data are mapped in a space in which they become linearly separable and in which it will be possible to find a hyperplane that separates them [78]. To do this, the input data are scaled together, and to make this calculation simple, which becomes very complicated in large spaces, a function called kernel is used which directly returns the scalar product of the images. To generalize the problem, even in the non-linear case, in which the kernel functions will be used, a Lagrangian formulation is required, thanks to which the data will appear only in the form of a scalar product [79].
To do this, it is sufficient to use the so-called Kernel function which is defined as the scalar product between two vectors in the transformed space and which can be calculated without much computational capacity. We then define an appropriate mapping function with Equation (4).
ϕ :   n m   ,     m     n ,
In the transformed space, the shape functions defined by Equation (5) are called Kernel functions:
K ( x , z ) = ϕ ( x ) · ϕ ( z ) ,
In Equation (5), the vectors x and z belong to the original space. The process of mapping data from the original input space to the future space is called a Kernel trick. The Kernel trick is a rather universal approach; its application is not limited to use only in support vector machines. In general, any classifier that depends only on the dot product of the input data can capitalize on this technique [80].
Like in the case of classification, derived algorithms for solving a regression problem will allow generalizing towards a non-linear hypothesis space by simply replacing the internal products with a kernel function. The regression problem is to find a function that approximates the mapping from an input domain to real numbers based on a training sample: The objective function, therefore, will be aimed at minimizing the l2 norm of the coefficient vector of the regression function, while the error is set in the constraints [81].
To obtain an estimate of the sound absorption coefficient from the measured data, the Gaussian Kernel function was used. The Gaussian Kernel function is probably the most used Kernel function and is defined by Equation (6).
K ( x , z ) = e x p ( x z 2 ) ,
The Gaussian Kernel maps the input space into a space of infinite size. Thanks to this property, it is very flexible and allows for the fitting of a very wide variety of decision edges. The Gaussian kernel is often referred to as a Radial Basis Function (RBF) [82].

3. Results and Discussion

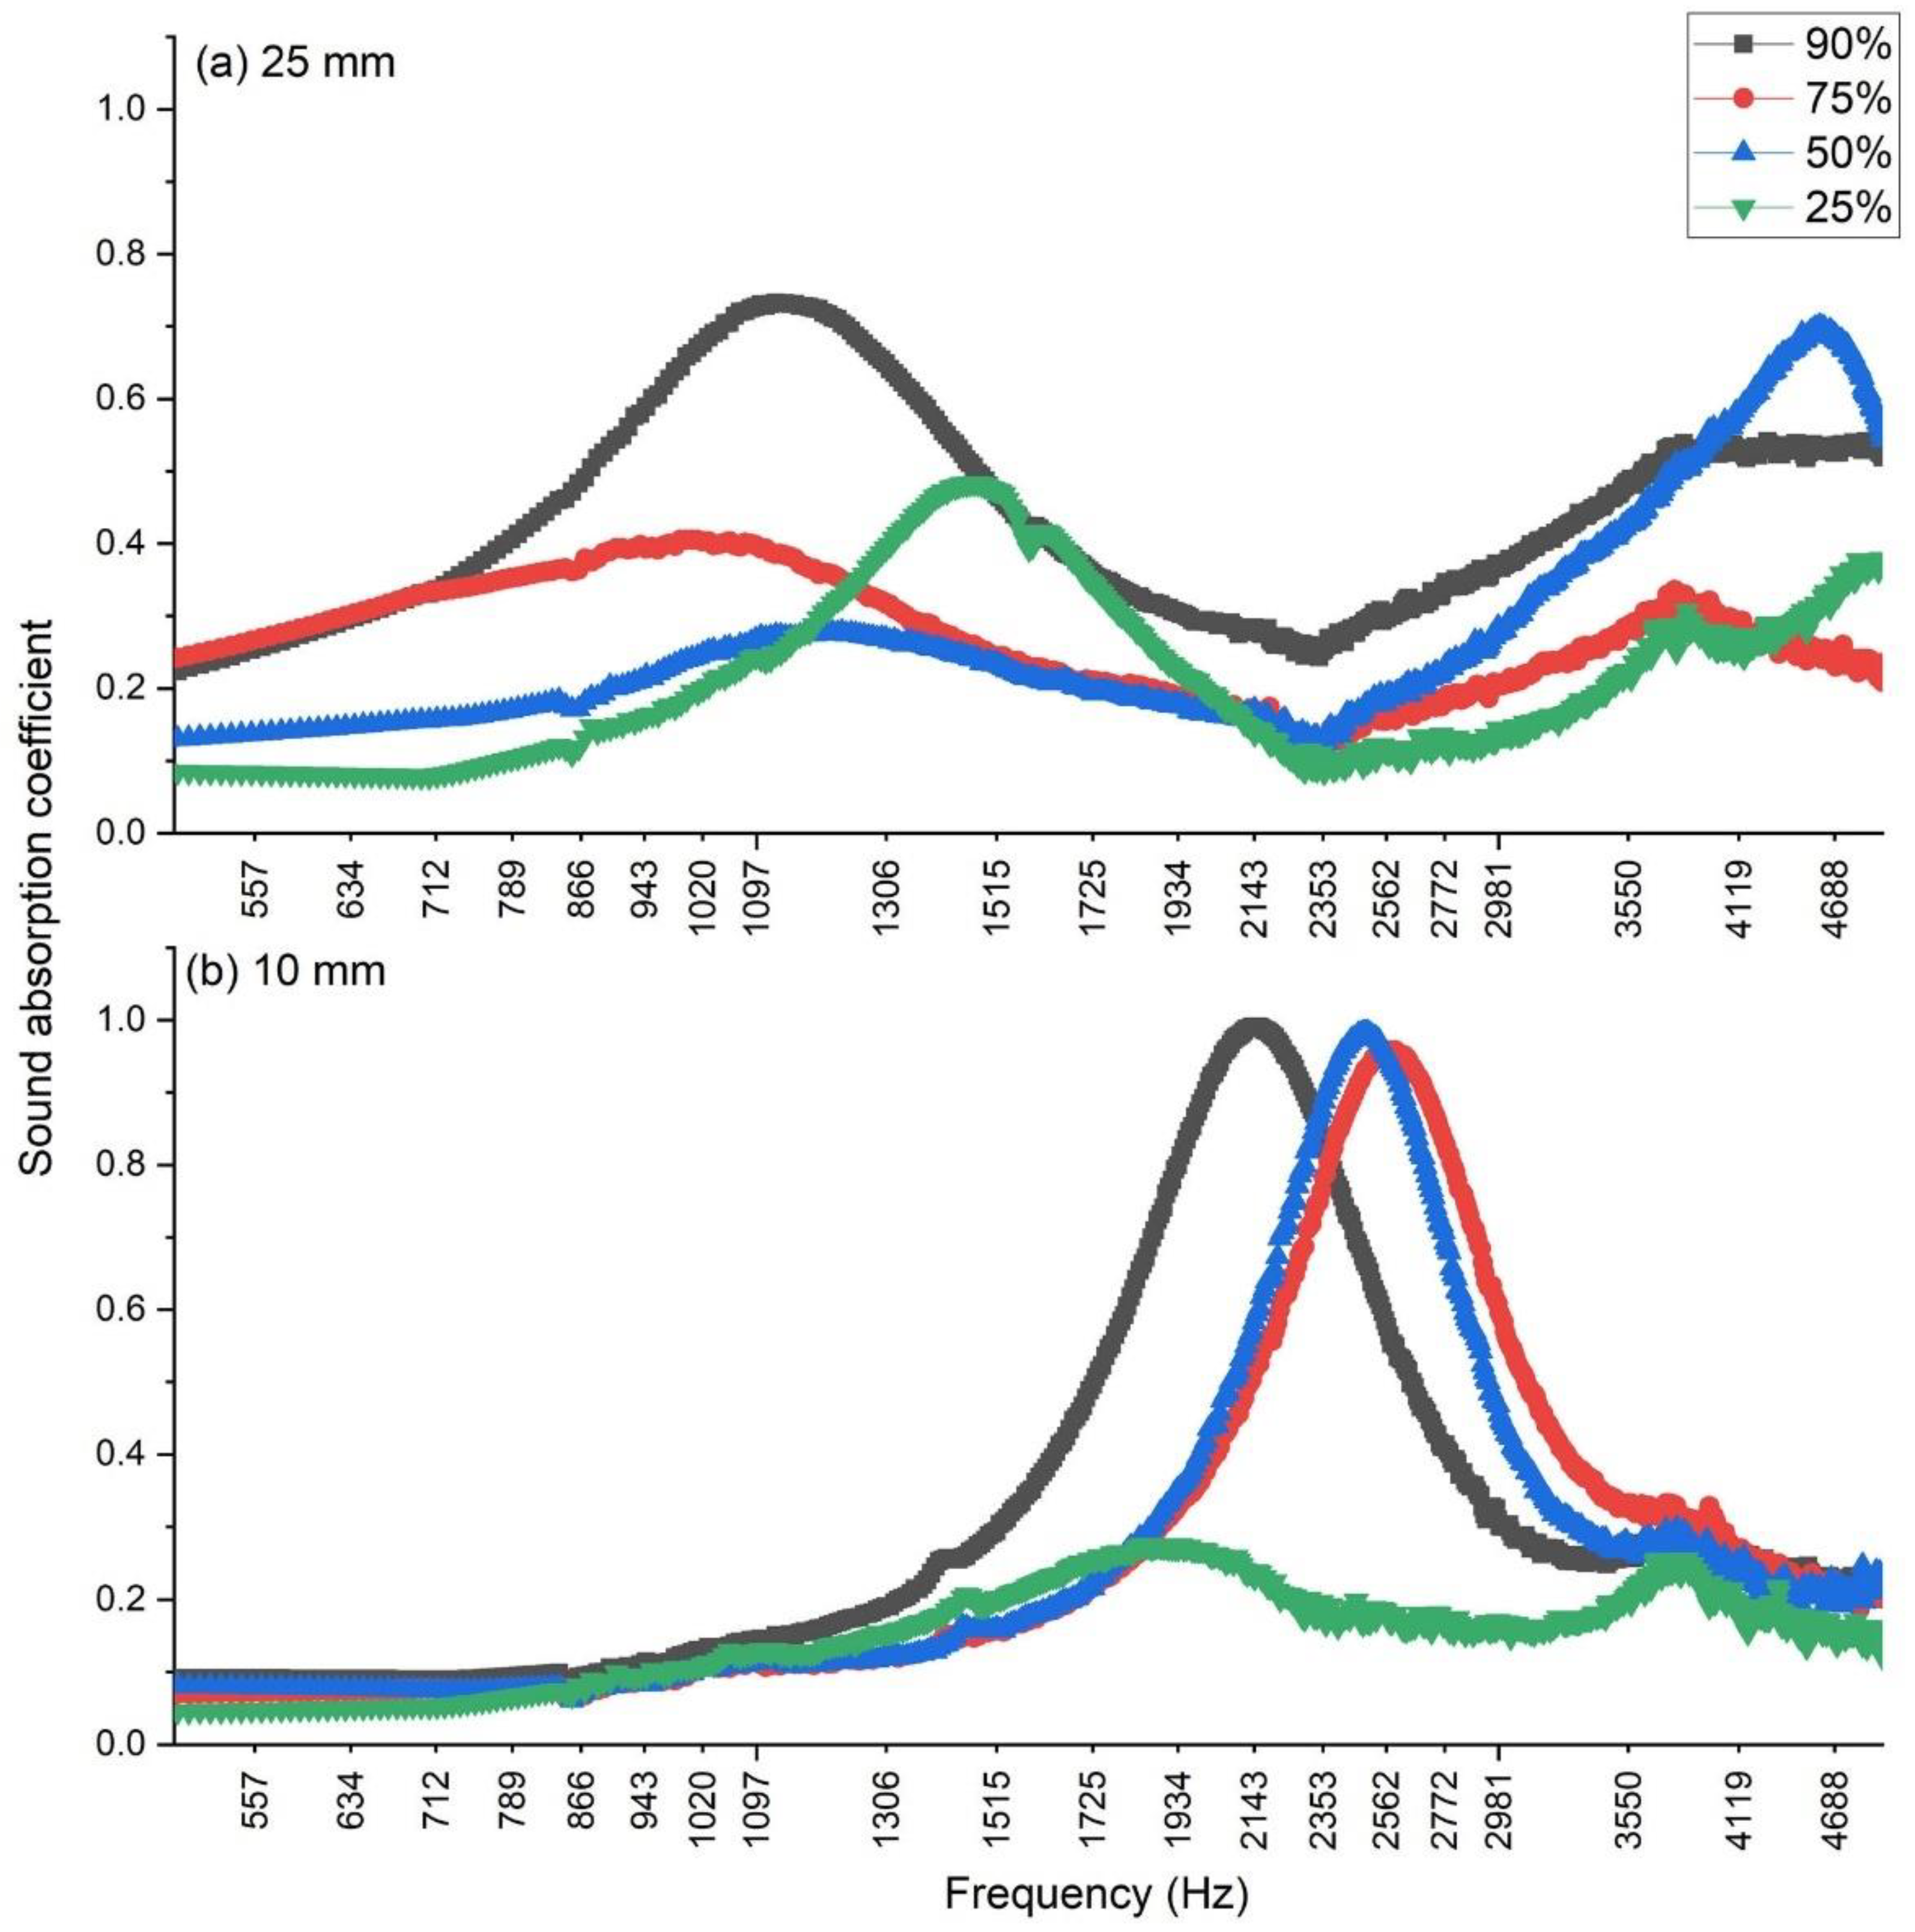
3.1. Measurements Results

Samples of different thicknesses and percentages of the binder were used to characterize the acoustic absorption of the cocoa pod husk. When a percentage of silicone below 10% was used, it was difficult to get the cocoa pod husk to mix with the silicone, and particles of material remained unbounded. To avoid this, samples with at least 10% of silicone were made. Samples with four different percentages of binder (10%, 25%, 50%, and 75%) and two different thicknesses (10 mm and 25 mm) were assembled. For each sample, sound absorption measurements were conducted using the impedance tube. Figure 9 shows the results of the sound absorption measurements in a range of frequencies from 500 Hz to 5000 Hz. The results are reported in two graphics, one for each sample thickness, considering the percentage of cocoa pod husk of each sample.
In relation to the percentage of silicone, from the analysis of Figure 9 can be assumed that 90% of cocoa pod husk returns a sample with better sound-absorbing characteristics at the lower frequencies. This trend is confirmed for the thickness of 10 and 25 mm. For the sample of 10 mm and 90% of cocoa pod husk, the sound absorption coefficient is higher than for the samples with 75% and 50% of cocoa (red and blue curves) from 860 Hz until 2350 Hz. At 2143 Hz, a peak can be observed in the curve, with a sound absorption coefficient close to one. For that sample thickness, increasing the percentage of silicone leads to a shift of the sound absorption peaks toward the high frequencies (75% of cocoa pod husk, 2550 Hz; 50%, 2452 Hz). Note that there is some heterogeneity in the size of the particles that make up the proportion of the cocoa pod husk as the particles that come from the grinding and filtering process are irregular in shape and do not have the same size. That may be the reason why the behavior of the samples with 75 and 50% of cocoa pod husk is very similar. For all the percentages of binder considered, there is a small secondary peak very close to 3832 Hz, with an absorption coefficient ranging from 0.22 to 0.32. For the sample with just 25% of cocoa pod husk, there is a drop in the absorption coefficient values throughout the whole frequency range under study. The absorption coefficients of this sample are only slightly above those of the samples with 75 and 50% of cocoa pod husk from 943 Hz to 1790 Hz. Consequently, increasing the percentage of binder improves the performance at high frequencies, but just until a proportion of 50% of cocoa pod husk.
For the 25 mm sample, the absorption coefficients are all below 0.8. The sample with 90% of cocoa pod husk is the one with better acoustic behavior for the range of frequencies from 712 until 3600 Hz. It presents a peak of 0.74 at 1140 Hz, and decreases until 2353 Hz, with an absorption coefficient of 0.26. Above this frequency, the absorption increases until 3720 Hz and remains almost constant until 5000 Hz. The sample with 75% of cocoa pod husk has similar behavior to the previous one until 712 Hz.
However, the peak of the bell is flatter, leading to a maximum absorption coefficient of 0.39 at 1020 Hz Above that frequency, as it happens to the sample with 90% of cocoa, the absorption coefficient decreases until 2560, and increases again until 3720 Hz. The sample with 50% of cocoa pod husk has worse performance than the ones with a higher percentage of cocoa until approximately 2143 Hz. Above this frequency, its absorption coefficient increases, reaching 0.62 at 4440 Hz. Therefore, when the percentage of silicone increases, the acoustic performance worsens, and, in general, the absorption coefficients decrease and are displaced to the right.
Not only the percentage of silicone but also the thickness of the sample influences the acoustic performance of the material. For the samples of 10 mm with a content of 50% of cocoa pod husk or higher, the absorption peaks happen between 2143 to 2550 Hz and are very closed to one. The thicker sample shows a shift of the acoustic absorption coefficient peaks toward lower frequencies, as occurs with some fiber composite materials [59,62]. Two remarkable peaks can be observed for the samples with 50% of cocoa pod husk or higher: one at the lower frequencies (between 1020 Hz and 1200 Hz) and another at the higher frequencies (between 3832 and 4440 Hz). For the thinner sample, the secondary peak is very flat and with a small absorption coefficient. With 25% of cocoa and 75% of silicone, the behavior is probably more similar to the one of the silicones itself. With this proportion of binder, for the 25 mm sample, the coefficients are quite low for all the frequencies and slightly higher at 1450 Hz (with a sound absorption coefficient of 0.48). A similar peak, but lower, appears for the 10 mm sample at 1840 Hz (absorption coefficient of 0.26).
Figure 9 shows the trend of the sound absorption coefficients for the two specimens of different thickness as the percentage of fibers contained in the specimen varies. Barring uncertainties due to the artisanal nature of the specimen assembly process, Figure 9 shows that the peaks of the curves flatten as the cocoa fiber content decreases. This is because the pores of the material decrease and therefore its sound absorption capacity. In a porous material, absorption occurs by transforming the sound energy into heat due to the friction that the sound waves encounter inside the pores.
To have a term of comparison of the acoustic performance of the material based on the cocoa pod husk particles made, the values of the sound absorption coefficient of different natural and fibers were compared (Table 1).
Table 1 shows that the behavior of the material object of this study is comparable with the other fibers. At low frequencies, although the thickness of the specimen is lower than the others, the sound absorption coefficient is higher (125 Hz). At medium frequencies, the performance of cocoa fibers is comparable to that of other materials. As it happens in other studies [84], the performance of synthetic fibers is slightly higher for the same thickness. At high frequencies, the other natural fibers return higher values of the sound absorption coefficient, even if this is partly due to the greater thickness of the specimens. The performance of the cocoa–silicone composite material, although is not the best among the natural and synthetic fibers analyzed, is quite good, and the transformation of waste from the cocoa production into a construction material for room acoustic applications can justify its use.

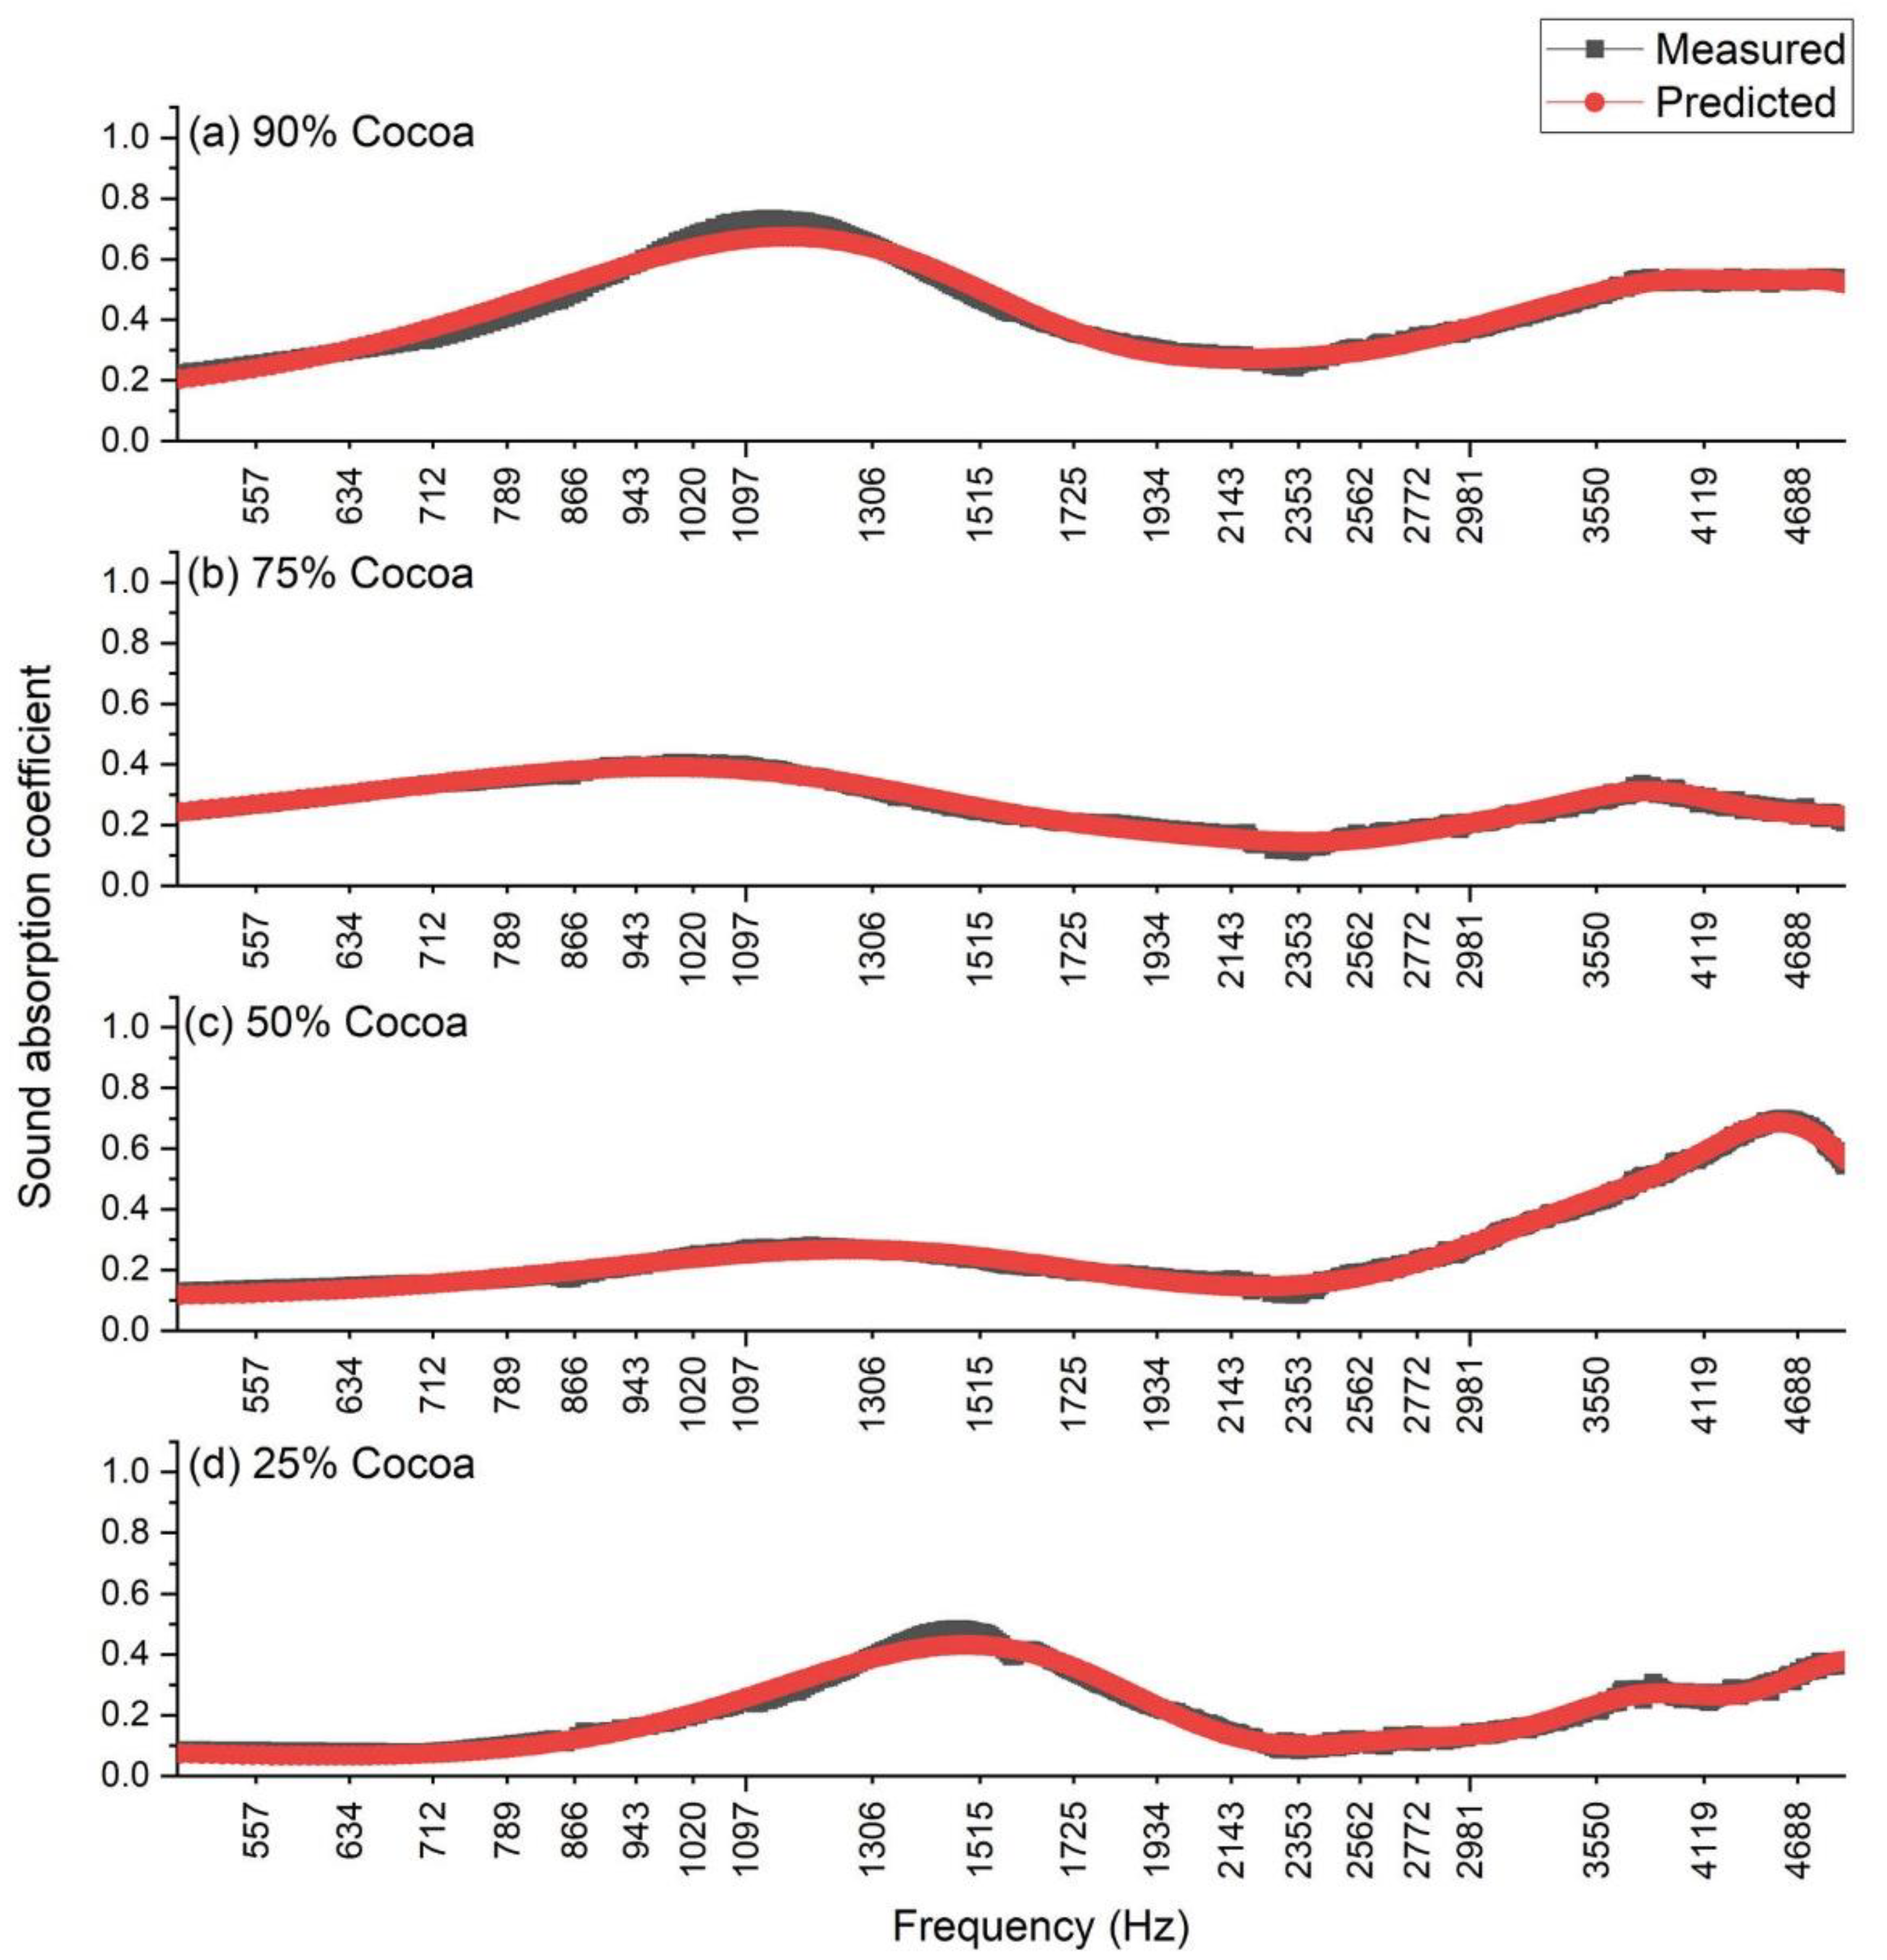
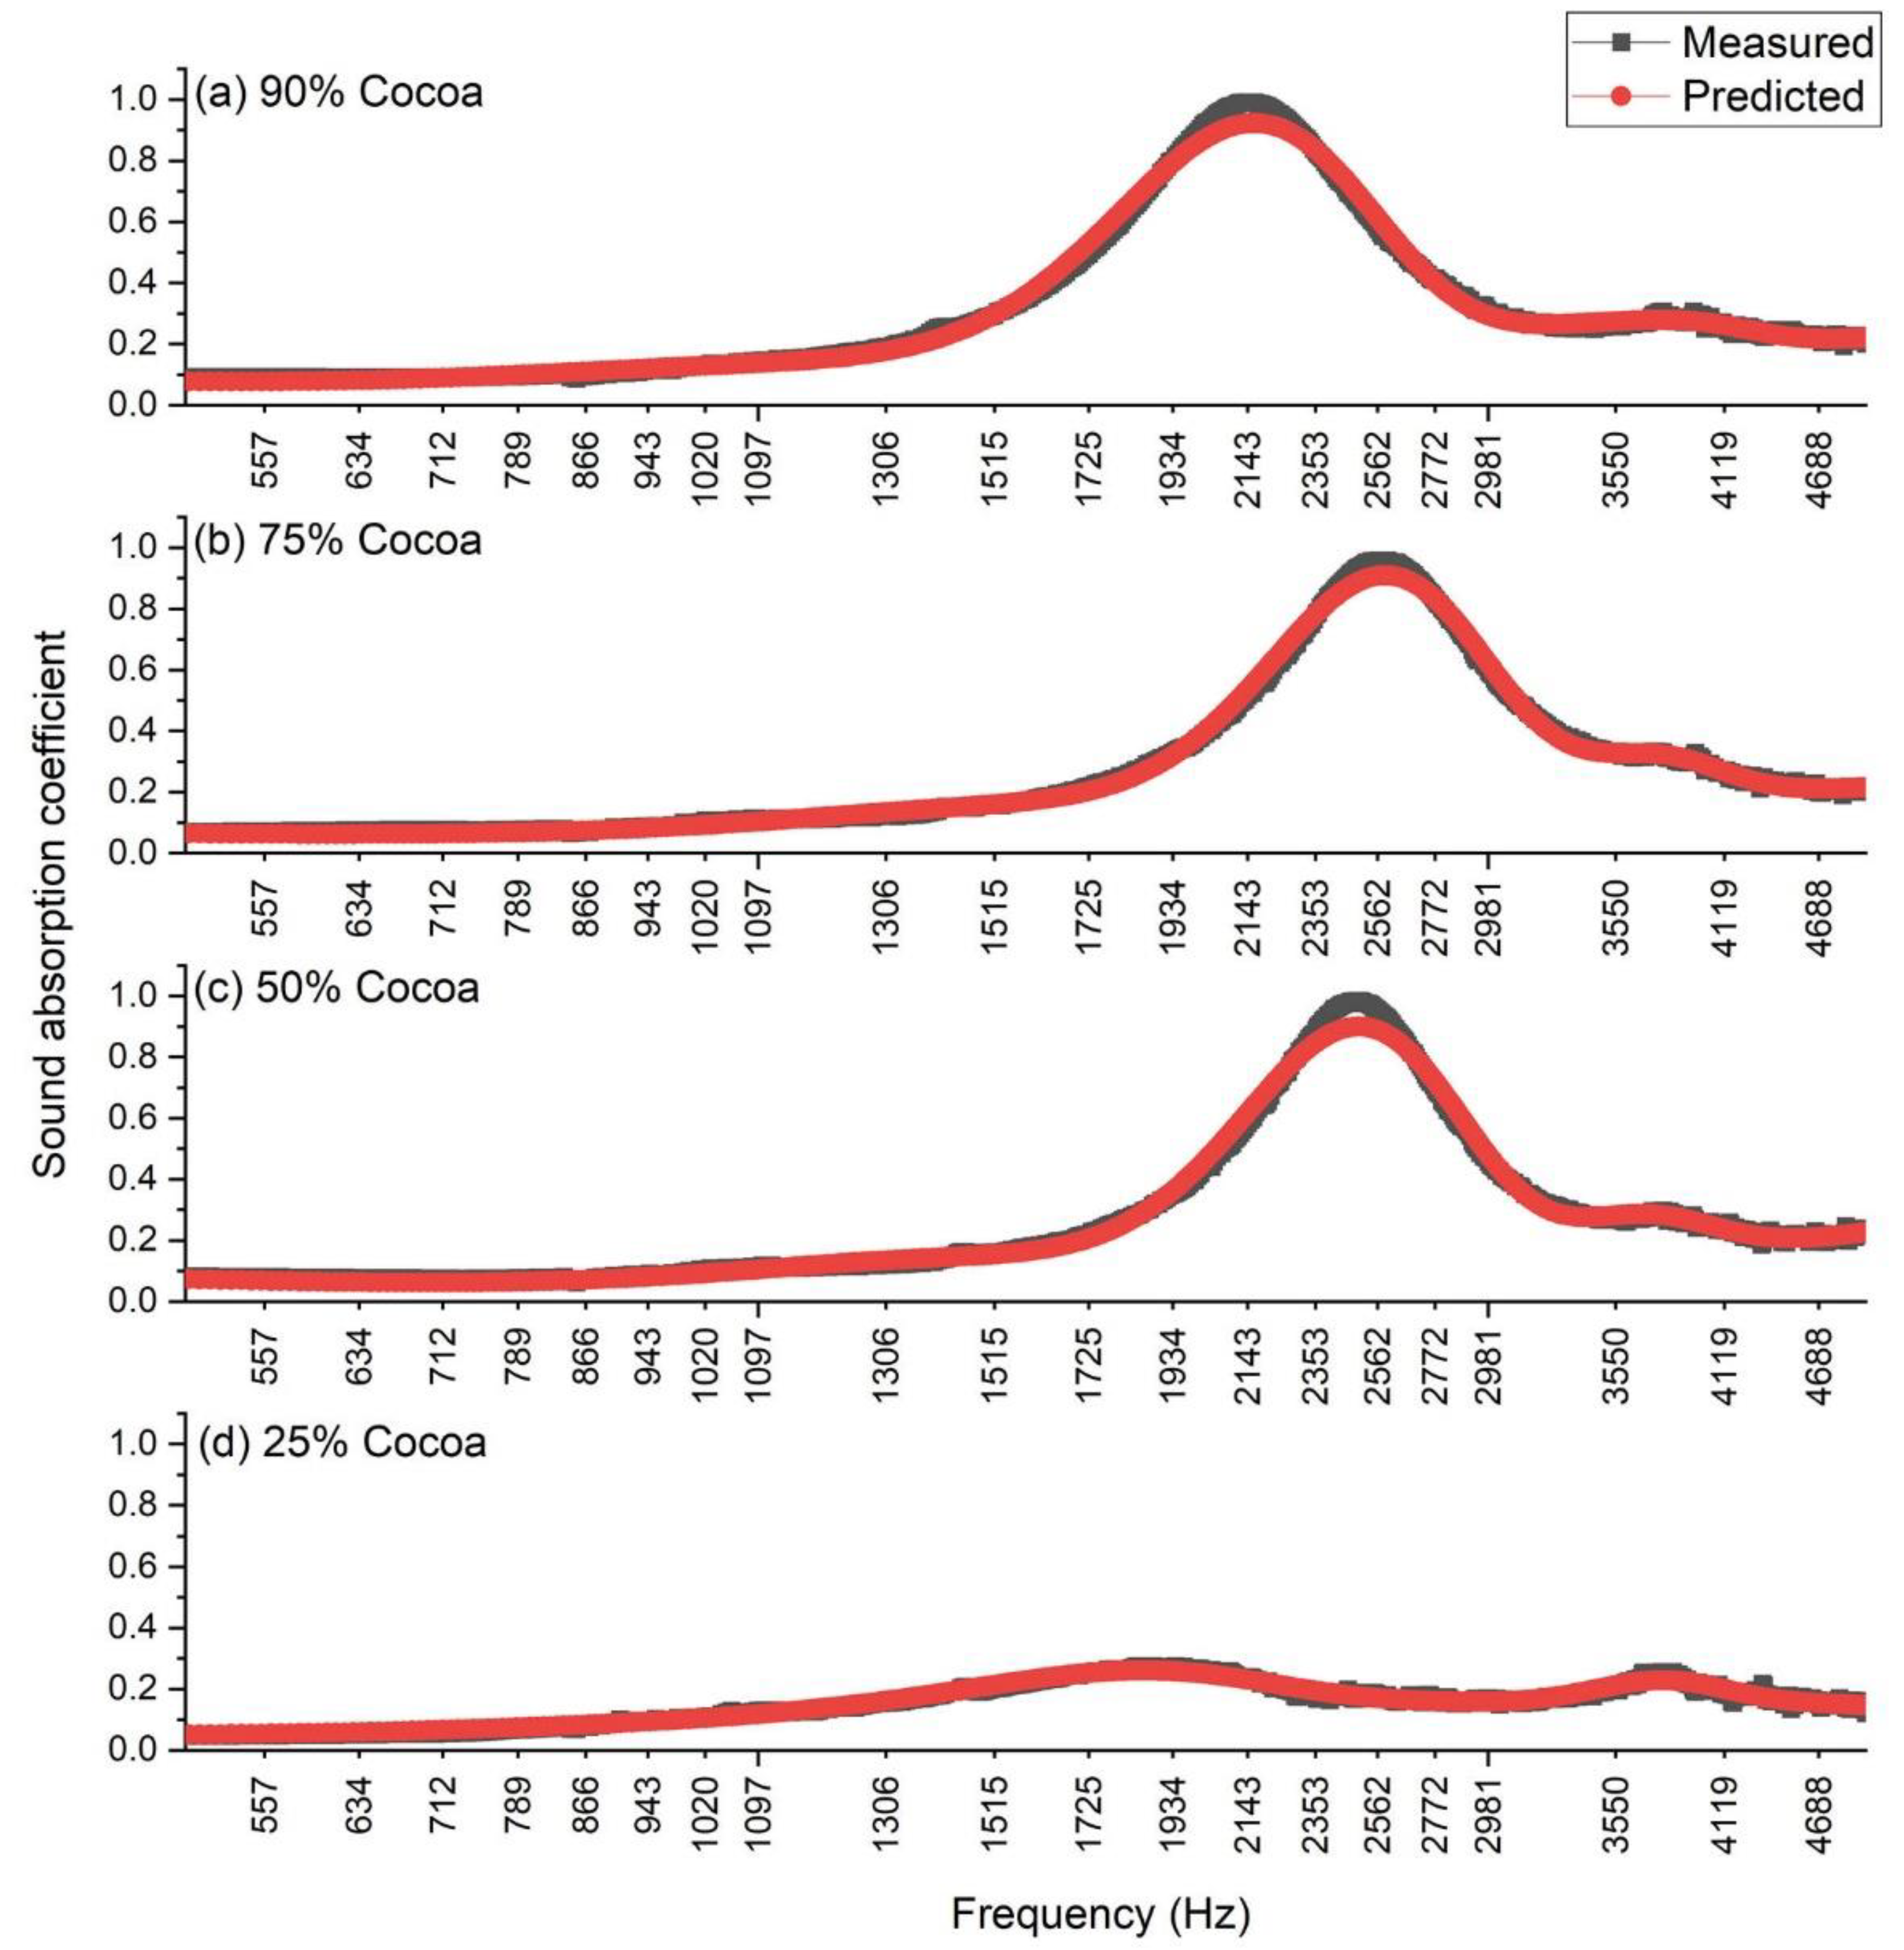
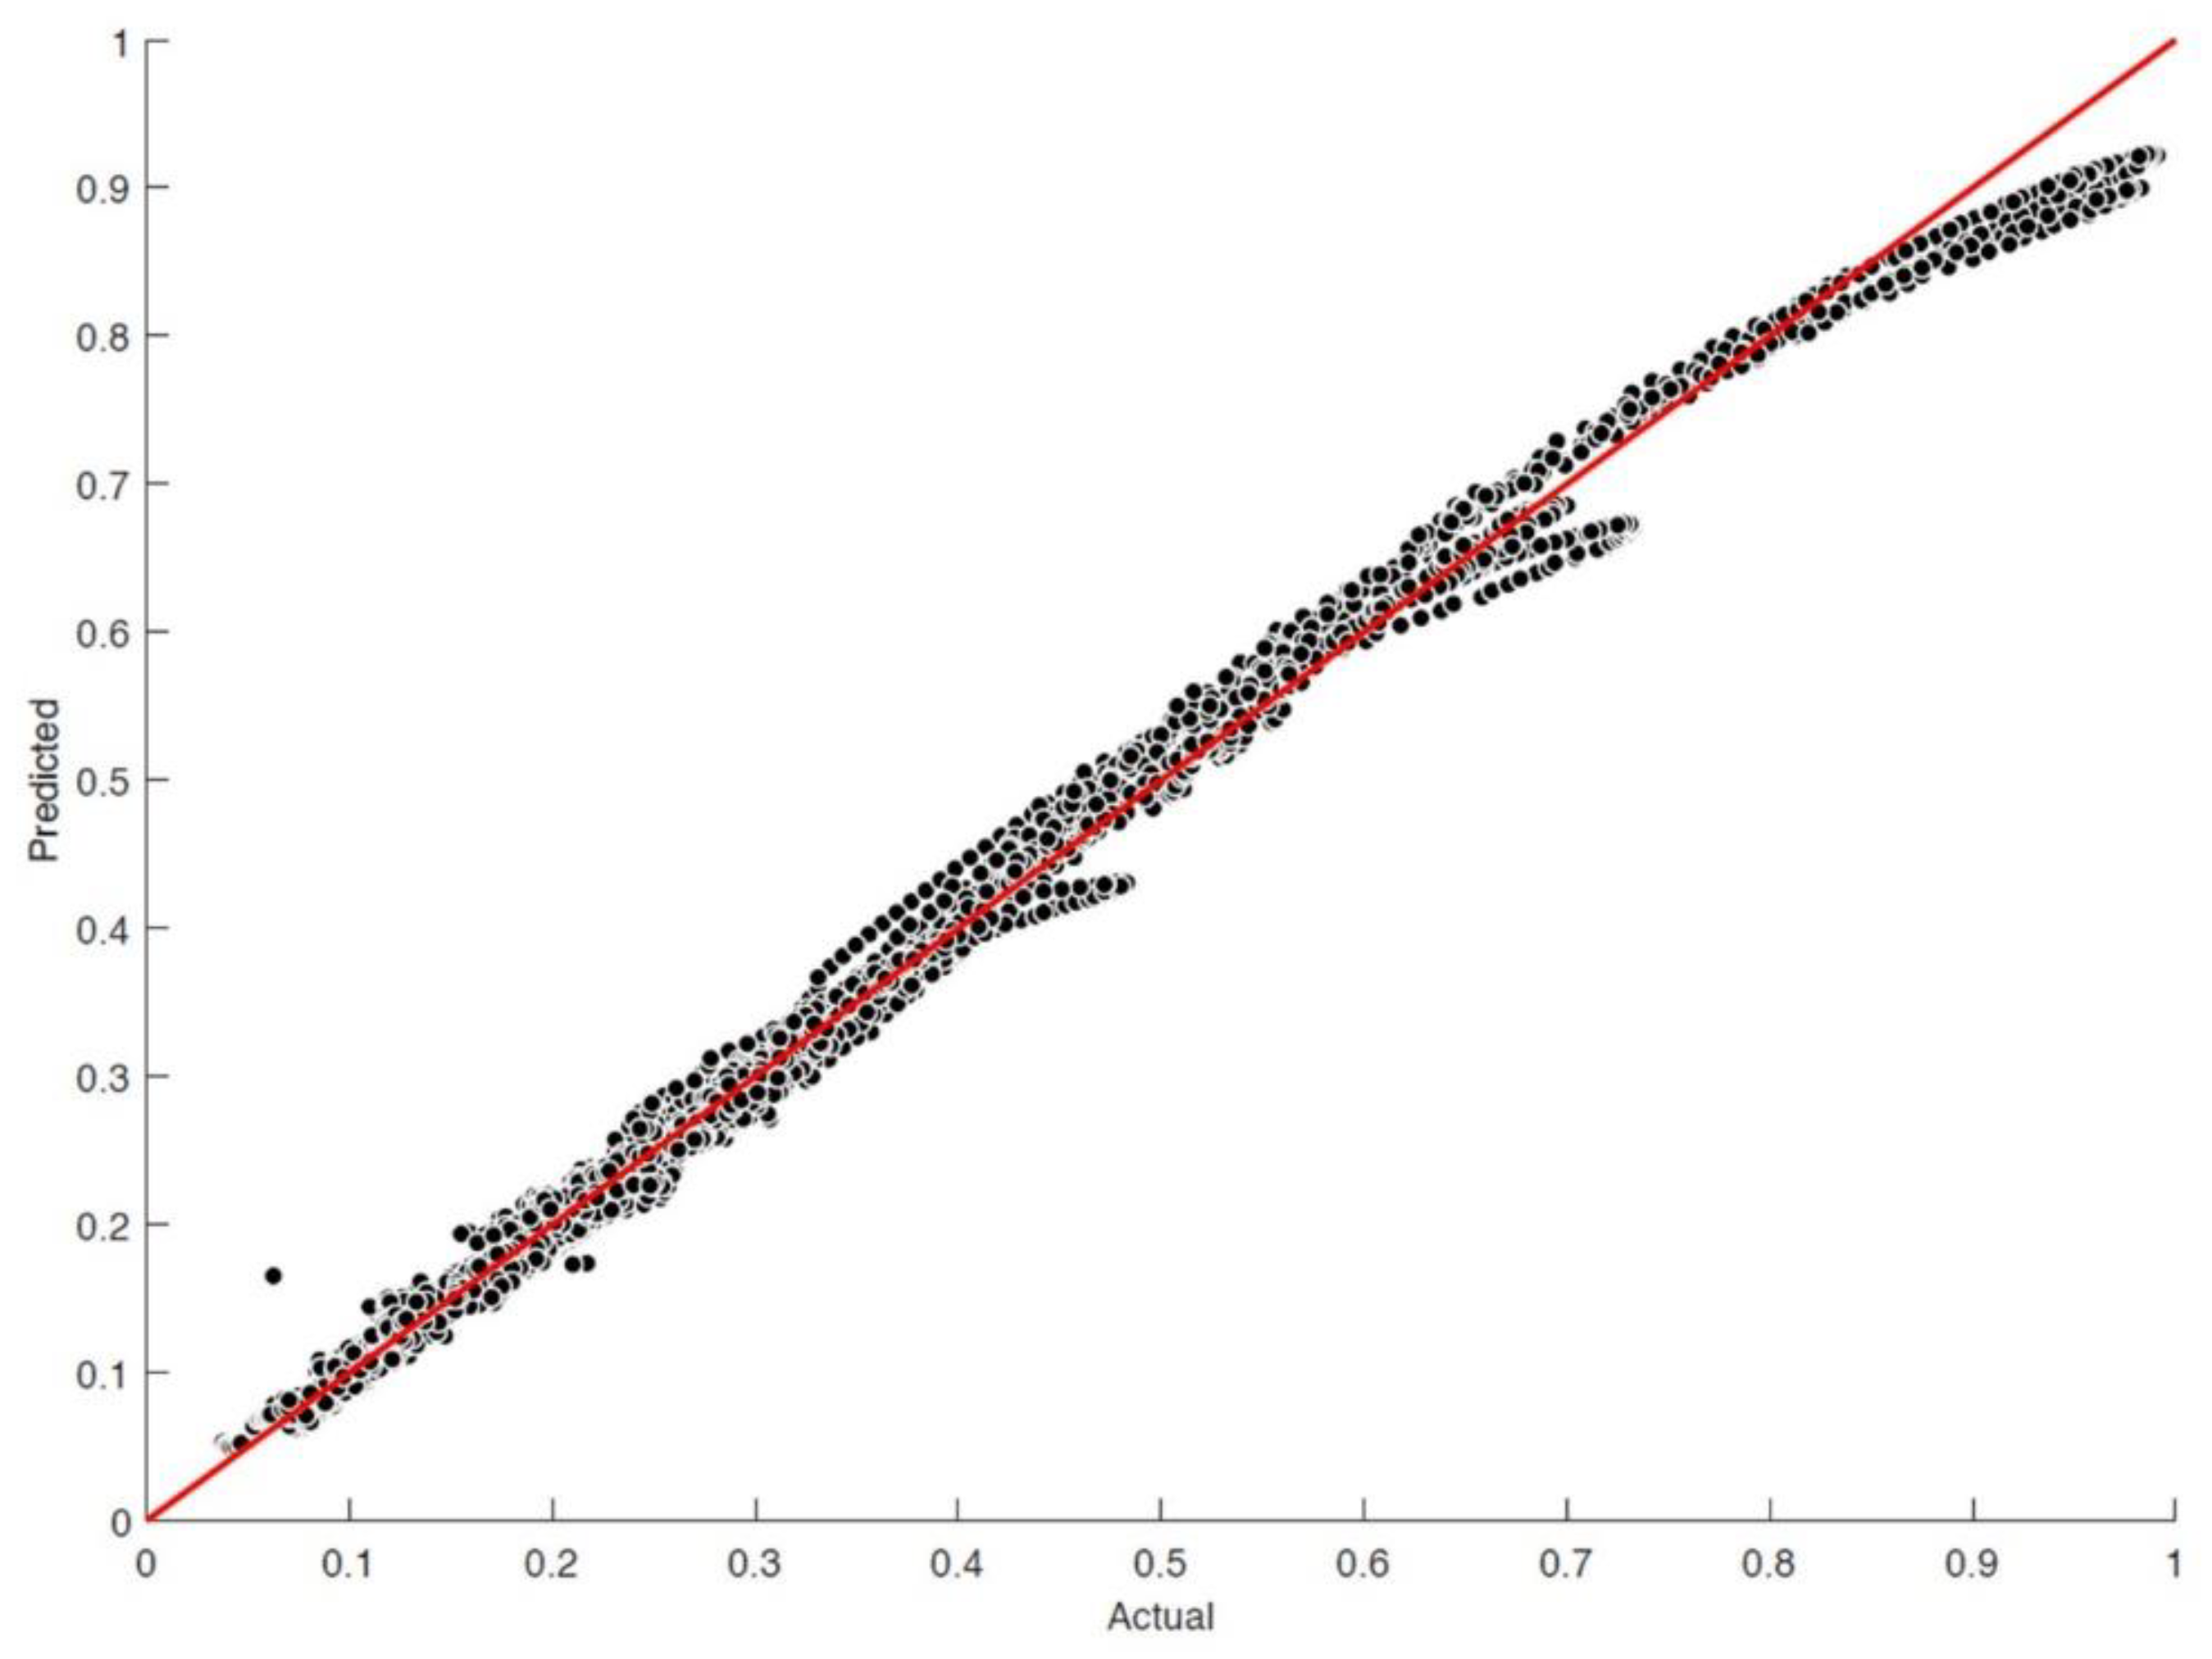
3.2. Gaussian Support Vector Machine Model

The data collected through the Kundt tube measurements were subsequently reorganized to use them as input to be sent to the regression model. Four input variables (predictors) and one output variable (response) have been identified (Figure 10).
The predictors were set as frequency, percentage of cocoa, percentage of binder, thickness of the specimen. The variable response is the sound absorption coefficient. A total of 26,062 records were collected equally distributed on the different settings of the samples.
To obtain a model capable of adequately generalizing the acoustic behavior of the cocoa-based material, the data collected from the measurements were subjected to a cross validation process. In the method called K-Fold [85], the data set available at the beginning of the experiment is divided into K groups, of which K-1 are used for training and the remaining group for the generalization test. This procedure is repeated for all the K groups chosen, changing the group chosen for generalization each time. This has the advantage that all examples are used, at least once, for both training and testing. The real error is estimated as the average of the errors. The dataset was divided into five equal parts, trained on four and tested on the rest. The analysis was iterated by permuting the parts of the dataset allowing to evaluate the model on all available data. Table 2 shows the parameters of the developed model.
The SVM-based model was compared with a model based on linear regression, four evaluation metrics were adopted to make a more rigorous comparison: mean square error (MSE), root mean square error (RMSE), average absolute error (MAE), and R-squared. MSE measures the variability present between real data and those returned by the model. Variability is the amount of dispersion present in the data. MSE examines how measures are distributed or concentrated around a central trend measure [86]. The mean square error (MSE) is defined by Equation (7).
M S E = 1 N   i = 1 N ( x i x ^ i ) 2 ,
In Equations (7)–(9), the variables are defined as follows:
  • x i is the true value.
  • x ^ i is the predicted value.
  • N is the number of the observation.
Mean squared error (RMSE) measures the error rate per square root of the MSE. RMSE is the most easily interpretable statistic since it has the same units as the quantity plotted on the vertical axis [87]. The mean square error (RMSE) is defined by Equation (8).
R M S E = 1 N   i = 1 N ( x i x ^ i ) 2 ,
Mean absolute error (MAE) measures the mean of errors in a series of predictions, regardless of their direction. This descriptor calculates the average of the absolute differences between prediction and actual observation where all individual differences have the same weight [88]. The mean absolute error (MAE) is defined by Equation (9).
M A E = 1 N   i = 1 N | x i x ^ i | ,
Finally, for the performance evaluation of the developed model, the correlation between the variables was evaluated. The correlation coefficient returns values in a range of −1 to +1; both extreme values represent perfect relationships between variables, while 0 represents no relationship. A positive relationship indicates that records that get high values in one variable tend to have high values in the second variable. If there are low values on one variable, low values are on the second variable [89].
In Table 3, the results of evaluation metrics of predicting models (Gaussian SVM vs. Linear Regression) are shown. We can see that the results obtained with the SVM-based model returns significantly higher performance than simple linear regression: This confirms the non-linear nature of the system. Furthermore, the correlation coefficient tells us that the model can return values of the sound absorption coefficient very close to those obtained with measurements with the Kundt tube.
Figure 11 shows the sound absorption coefficient trend (500–5000 Hz) between the measured value with the impedance tube and the simulated with the model based on SVM (25 mm thick sample).
Figure 12 shows the sound absorption coefficient trend (500–5000 Hz) between the measured value with the impedance tube and the simulated with the model based on SVM (10 mm thick sample).
Figure 11 and Figure 12 validate the results returned by the evaluation metrics used for performance estimation. In fact, the simulated curves rely on those obtained from the measurements. The simulated curves with different percentages of cocoa shell fragments have the same peak frequency as those measured, even if the simulation model seems to slightly undersize this value. The trends of the curves are also confirmed by showing a softening of the slopes due to the optimization effect operated by the algorithms used in the training phase of the model. The simulated data curves, therefore, show a more consistent trend, operating a correction effect in correspondence with anomalies due to uncertainties of the measurements.
To obtain a visual confirmation of the adaptability of the model to the measured values, we can analyze how the values predicted by the model are distributed with respect to the actual ones (Figure 13). This is a typical scatter diagram in which the values obtained from the measurements are shown on the horizontal axis, while the corresponding values obtained from the prediction made by the model are shown on the vertical axis. Each point returns the actual and predicted SAC values.
In Figure 13, a straight line is also drawn (in red) corresponding to the ideal solution in which at each observation the value of the returned SAC is identical, such as, the predicted value is perfectly equal to the measured one. Therefore, the more the points are placed in proximity to the straight line, the more the model was able to predict the acoustic behavior of the material [90,91,92,93]. Figure 13 shows that the points are arranged around the line representing the ideal condition. Furthermore, it is possible to note that the distribution of the points seems to be equally arranged above and below the line: However, while the points above the line are very close to it, those below the line are a little further away. This fact confirms the trend, already highlighted above, that the SVM-based model seems to underestimate the peaks of the sound absorption coefficient.

4. Conclusions

In this study, a simulation model of the acoustic properties of samples assembled with cocoa crop waste was developed. Initially, the methodologies for assembling samples of different thicknesses were presented starting from shredded cocoa shells with the use of a silicone-based binder. Subsequently, measurements of the sound absorption coefficient were carried out using the normal impedance tube method. The procedure for measuring the acoustic properties of the material was presented and the results analyzed in detail. A model for predicting the acoustic properties of the samples assembled using an algorithm based on the Support Vector Machines with a Gaussian kernel was then implemented.
Four evaluation metrics were applied to evaluate the performance of the SVM-based model. The results were compared with those obtained with linear regression, showing significantly higher values for the SVM-based model. A model for the prediction of the acoustic absorption coefficient allows to evaluate the acoustic performance of a material for each possible configuration, resulting in a considerable saving of resources and avoiding the need for further acoustic measurements.

Author Contributions

Conceptualization, G.C., G.I., L.G.C.-C. and V.P.-R.; data curation, G.C., G.I., L.G.C.-C. and V.P.-R.; formal analysis, G.C., G.I., L.G.C.-C. and V.P.-R.; investigation, G.C., G.I. and V.P.-R.; methodology, G.C., G.I., L.G.C.-C. and V.P.-R.; resources G.C., G.I., L.G.C.-C. and V.P.-R.; software, G.C., G.I., L.G.C.-C. and V.P.-R.; supervision, G.C., G.I., L.G.C.-C. and V.P.-R.; validation, G.C., G.I., L.G.C.-C. and V.P.-R.; visualization, G.C., G.I., L.G.C.-C. and V.P.-R.; writing—original draft, G.C., G.I., L.G.C.-C., C.G.-P. and V.P.-R.; writing—review and editing, G.C., G.I., L.G.C.-C., C.G.-P. and V.P.-R. All authors have read and agreed to the published version of the manuscript.

Funding

This research received funding from the VII Call for Research Projects of the Universidad de Las Américas (Ecuador). Project Reference: SOA.DNS.20.02.

Institutional Review Board Statement

Not applicable.

Informed Consent Statement

Not applicable.

Data Availability Statement

The data that support the findings of this study are available on request to the corresponding author.

Conflicts of Interest

The authors declare no conflict of interest.

References

  1. Ortiz-R, O.O.; Gallardo Villamizar, A.R.; Rangel, J.M. Applying Life Cycle Management of Colombian Cocoa Production. Food Sci. Technol. 2014, 34, 62–68. [Google Scholar] [CrossRef] [Green Version]
  2. Wirén-Lehr, S. Sustainability in Agriculture—An Evaluation of Principal Goal Oriented Concepts to Close the Gap between Theory and Practice. Agric. Ecosyst. Environ. 2001, 84, 115–129. [Google Scholar] [CrossRef]
  3. Mattsson, B.; Cederberg, C.; Blix, L. Agricultural Land Use in Life Cycle Assessment (LCA): Case Studies of Three Vegetable Oil Crops. J. Clean. Prod. 2000, 8, 283–292. [Google Scholar] [CrossRef]
  4. Carof, M.; Colomb, B.; Aveline, A. A Guide for Choosing the Most Appropriate Method for Multi-Criteria Assessment of Agricultural Systems According to Decision-Makers’ Expectations. Agric. Syst. 2013, 115, 51–62. [Google Scholar] [CrossRef]
  5. Ramírez Cando, L.J.; Spugnoli, P. A Review of Life Cycle Assessment: Agroproducts Modeling. Granja Rev. Cienc. Vida 2016, 24, 5–15. [Google Scholar] [CrossRef]
  6. Panak Balentic, J.; Ackar, Đ.; Jokic, S.; Jozinovic, A.; Babic, J.; Milicevic, B.; Subari, D.; Pavlovic, N. Cocoa Shell: A By-Product with Great Potential for Wide Application. Molecules 2018, 23, 1404. [Google Scholar] [CrossRef] [PubMed] [Green Version]
  7. Daud, Z.; Tun, U.; Onn, H.; Sari, A.; Kassim, M.; Tun, U.; Onn, H.; Aripin, A.M.; Tun, U.; Onn, H.; et al. Chemical Composition and Morphological of Cocoa Pod Husks and Cassava Peels for Pulp and Paper Production. Aust. J. Basic Appl. Sci. 2013, 7, 406–411. [Google Scholar]
  8. Graziani de Farinas, L.; Ortiz de Bertorelli, L.; Angulo, J.; Parra, P. Características Físicas Del Fruto de Cacaos Tipos Criollo, Forastero y Trinitario de La Localidad de Cumboto, Venezuela. Agron. Trop. 2002, 52, 343–362. [Google Scholar]
  9. Braudeau, J. El Cacao: Técnicas Agricolas y Producciones Tropicales; Técnicas Agrícolas y Producciones Tropicales; Blume: Madrid, Spain, 1970. [Google Scholar]
  10. Castillo, E.; Alvarez, C.; Contreras, Y. Physicochemical Characterization of the Fruit Shell of a Cocoa Clone (Theobroma cacao L.) Harvested in Caucagua, Miranda State. Venezuela. Rev. Investig. Pedagógica Exp. Libert. 2018, 45, 154–175. [Google Scholar]
  11. Voora, V.; Bermúdez, S.; Larrea, C. Global Market Report: Cocoa; International Institute for Sustainable Development: Winnipeg, MB, Canada, 2019. [Google Scholar]
  12. Prabhakaran Nair, K.P. The Agronomy and Economy of Important Tree Crops of the Developing World; Elsevier: London, UK, 2010. [Google Scholar] [CrossRef]
  13. Ministerio de Cultura y Patrimonio de Ecuador. EC Ministerio de Cultura y Patrimonio. 2017; Acuerdo Ministerial No. DM-2017-063; Ministerio de Cultura y Patrimonio de Ecuador: Quito, Ecuador, 2017.
  14. Barazarte, H.; Sangronis, E.; Unai, E. La cáscara de cacao (Theobroma cacao L.): Una posible fuente comercial de pectinas. Arch. Latinoam. Nutr. 2008, 58, 64–70. [Google Scholar]
  15. Gavilanes-Terán, I.; Paredes, C.; Pérez-Espinosa, A.; Ángeles Bustamante, M.; Gálvez-Sola, L.; Jara-Samaniego, J. Opportunities and Challenges of Organic Waste Management from the Agroindustrial Sector in South America: Chimborazo Province Case Study. Commun. Soil Sci. Plant Anal. 2015, 46 (Suppl. S1), 137–156. [Google Scholar] [CrossRef]
  16. Ramírez Gil, J. Pérdidas Económicas Asociadas a La Pudrición de La Mazorca Del Cacao Causada Por Phytophthora spp., y Moniliophthora Roreri (Cif y Par) Evans et Al., En La Hacienda Theobroma, Colombia. Rev. Protección Veg. 2016, 31, 42–49. [Google Scholar]
  17. Ouattara, L.Y.; Kouassi, E.K.A.; Soro, D.; Soro, Y.; Yao, K.B.; Adouby, K.; Drogui, A.P.; Tyagi, D.R.; Aina, P.M. Cocoa Pod Husks as Potential Sources of Renewable High-Value-Added Products: A Review of Current Valorizations and Future Prospects. BioResources 2021, 16, 1998. [Google Scholar] [CrossRef]
  18. Fidelis, C.; Rajashekhar Rao, B.K. Enriched Cocoa Pod Composts and Their Fertilizing Effects on Hybrid Cocoa Seedlings. Int. J. Recycl. Org. Waste Agric. 2017, 6, 99–106. [Google Scholar] [CrossRef] [Green Version]
  19. Campos Filho, P.C.; Carvalho Silva, R.; Ferreira de Sousa, D.; da Cunha e Silva, S.L.; da Conceicao, A.O.; Pungartnik, C.; Brendel, M. Use of Theobroma Cacao Pod Husk-Derived Biofertilizer Is Safe as It Poses Neither Ecological nor Human Health Risks. J. Fertil. Pestic. 2017, 8, 3. [Google Scholar] [CrossRef] [Green Version]
  20. Nortey, T.N.; Kpogo, D.V.; Kpogo, A.L.; Naazie, A.; Oddoye, E.O. Cocoa Pod Husk Is a Potential Feed Ingredient in Laying Hen Diets. Livest. Res. Rural Dev. 2015, 27. [Google Scholar]
  21. Oduro-Mensah, D.; Ocloo, A.; Nortey, T.; Antwi, S.; Okine, L.K.; Adamafio, N.A. Nutritional Value and Safety of Animal Feed Supplemented with Talaromyces Verruculosus-Treated Cocoa Pod Husks. Sci. Rep. 2020, 10, 13163. [Google Scholar] [CrossRef]
  22. Adeyeye, S.A.; Ayodele, S.O.; Oloruntola, O.D.; Agbede, J.O. Processed Cocoa Pod Husk Dietary Inclusion: Effects on the Performance, Carcass, Haematogram, Biochemical Indices, Antioxidant Enzyme and Histology of the Liver and Kidney in Broiler Chicken. Bull. Natl. Res. Cent. 2019, 43, 54. [Google Scholar] [CrossRef]
  23. Magistrelli, D.; Malagutti, L.; Galassi, G.; Rosi, F. Cocoa Husks in Diets of Italian Heavy Pigs. J. Anim. Sci. 2012, 90 (Suppl. S4), 230–232. [Google Scholar] [CrossRef] [Green Version]
  24. Jayeola, C.O.; Adebowale, B.A.; Yahaya, L.E.; Ogunwolu, S.O.; Olubamiwa, O. Production of Bioactive Compounds From Waste. Ther. Probiot. Unconv. Foods 2018, 317–340. [Google Scholar] [CrossRef]
  25. Vriesmann, L.C.; de Oliveira Petkowicz, C.L. Cacao Pod Husks as a Source of Low-Methoxyl, Highly Acetylated Pectins Able to Gel in Acidic Media. Int. J. Biol. Macromol. 2017, 101, 146–152. [Google Scholar] [CrossRef] [PubMed]
  26. Yusof, F.; Khanahmadi, S.; Amid, A.; Mahmod, S.S. Cocoa Pod Husk, a New Source of Hydrolase Enzymes for Preparation of Cross-Linked Enzyme Aggregate. Springerplus 2016, 5, 57. [Google Scholar] [CrossRef] [PubMed] [Green Version]
  27. Chen, J.C.; Tsai, S.W. Enantioselective synthesis of (S)-ibuprofen ester prodrug in cyclohexane by Candida rugosa lipase immobilized on Accurel MP1000. Biotechnol. Prog. 2000, 16, 986–992. [Google Scholar] [CrossRef] [PubMed]
  28. Gotor-Fernández, V.; Brieva, R.; Gotor, V. Lipases: Useful biocatalysts for the preparation of pharmaceuticals. J. Mol. Catal. B Enzym. 2006, 40, 111–120. [Google Scholar] [CrossRef]
  29. Rajendran, A.; Palanisamy, A.; Thangavelu, V. Lipase applications in food industry. Indian J. Biotechnol. 2007, 6, 141–158. [Google Scholar]
  30. Mehta, A.; Guleria, S.; Sharma, R.; Gupta, R. The Lipases and Their Applications with Emphasis on Food Industry. In Microbial Biotechnology in Food and Health; Elsevier Inc.: Amsterdam, The Netherlands, 2021; pp. 143–164. [Google Scholar] [CrossRef]
  31. Holsinger, V.H.; Kligerman, A.E. Applications of lactase in dairy foods and other foods containing lactose. Food Technol. 1991, 45, 92–94. [Google Scholar]
  32. Emtenani, S.; Asoodeh, A.; Emtenani, S. Molecular Cloning of a Thermo-Alkaliphilic Lipase from Bacillus Subtilis DR8806: Expression and Biochemical Characterization. Process Biochem. 2013, 48, 1679–1685. [Google Scholar] [CrossRef]
  33. Hasan, F.; Shah, A.A.; Javed, S.; Hameed, A. Enzymes Used in Detergents: Lipases. Afr. J. Biotechnol. 2010, 9, 4836–4844. [Google Scholar] [CrossRef]
  34. Njoku, V.O.; Oguzie, E.E.; Duru, C.; Bello, O.S. Cocoa Pod Husk as a Low Cost Biosorbent for the Removal of Pb(II) and Cu(II) from Aqueous Solutions Cocoa Pod Husk as a Low Cost Biosorbent for the Removal of Pb(II) and Cu(II) from Aqueous Solutions. Aust. J. Basic Appl. Sci. 2011, 5, 101–110. [Google Scholar]
  35. Pua, F.L.; Sajab, M.S.; Chia, C.H.; Zakaria, S.; Rahman, I.A.; Salit, M.S. Alkaline-Treated Cocoa Pod Husk as Adsorbent for Removing Methylene Blue from Aqueous Solutions. J. Environ. Chem. Eng. 2013, 1, 460–465. [Google Scholar] [CrossRef]
  36. Tsai, W.; Hsu, C.; Lin, Y.; Tsai, C.; Chen, W.; Chang, Y. Enhancing the Pore Properties and Adsorption Performance of Cocoa Pod Husk (CPH)-Derived Biochars via Post-Acid Treatment. Processes 2020, 8, 144. [Google Scholar] [CrossRef] [Green Version]
  37. Vásquez, Z.S.; De Carvalho, D.P.; Pereira, G.V.M.; Vandenberghe, L.P.S.; De Oliveira, P.Z.; Tiburcio, P.B.; Rogez, H.L.G.; Góes, A.; Soccol, C.R. Biotechnological Approaches for Cocoa Waste Management: A Review. Waste Manag. 2019, 90, 72–83. [Google Scholar] [CrossRef] [PubMed]
  38. Iannace, G.; Puyana-Romero, V.; Ciaburro, G. Corn plants as temporary acoustic barrier to limit the effects of noise pollution. In INTER-NOISE and NOISE-CON Congress and Conference Proceedings; Institute of Noise Control Engineering: Washington, DC, USA, 2021; Volume 263, pp. 2164–2171. [Google Scholar]
  39. Rachmat, D.; Mawarani, L.J.; Risanti, D.D. Utilization of Cacao Pod Husk (Theobroma cacao L.) as Activated Carbon and Catalyst in Biodiesel Production Process from Waste Cooking Oil. In IOP Conference Series: Materials Science and Engineering; IOP Publishing: Bristol, UK, 2018. [Google Scholar]
  40. Syamsiro, M.; Saptoadi, H.; Tambunan, B.H. Experimental investigation on combustion of bio-pellets from Indonesian cocoa pod husk. Asian J. Appl. Sci. 2011, 4, 712–719. [Google Scholar] [CrossRef] [Green Version]
  41. Titiloye, J.O.; Abu, M.S.; Odetoye, T.E. Thermochemical Characterisation of Agricultural Wastes from West Africa. Ind. Crop. Prod. 2013, 47, 199–203. [Google Scholar] [CrossRef]
  42. Adamafio, N.A.; Afeke, I.K.; Wepeba, J.; Ali, E.K.; Quaye, F.O. Biochemical Composition and in Vitro Digestibility of Cocoa Pod Husk, Cassava Peel and Plantain Peel. Ghana J. Sci. 2004, 44, 29–38. [Google Scholar]
  43. Martínez-Ángel, J.D.; Villamizar-Gallardo, R.A.; Ortíz-Rodríguez, O.O. Characterization and Evaluation of Cocoa (Theobroma Cacao L.) Pod Husk as a Renewable Energy Source. Agrociencia 2015, 49, 329–345. [Google Scholar]
  44. Yao, F.; Liu, G.; Ji, Y.; Tong, W.; Du, X.; Li, K.; Martek, I. Evaluating the environmental impact of construction within the industrialized building process: A monetization and building information modelling approach. Int. J. Environ. Res. Public Health 2020, 17, 8396. [Google Scholar] [CrossRef]
  45. European Commission. Strategy for the Sustainable Competitiveness of the Construction Sector and Its Enterprises: Commision to the European Parliament and the Council; Publications Office of the European Union: Luxembourg, 2012. [Google Scholar]
  46. European Commission. of the R. A Roadmap for Moving to a Competitive Low Carbon Economy in 2050: Communication from the Commission to the European Parliament, the Council, the European Economic and Social Committee and the Committee of the Regions; Publications Office of the European Union: Luxembourg, 2011. [Google Scholar]
  47. MacDougall, C. Natural Building Materials in Mainstream Construction: Lessons from the U.K. J. Green Build. 2008, 3, 3–14. [Google Scholar] [CrossRef]
  48. Hebel, D.E.; Heisel, F. Cultivated Building Materials: Industrialized Natural Resources for Architecture and Construction; Birkhäuser: Berlin, Germany; Boston, MA, USA, 2017. [Google Scholar] [CrossRef]
  49. Sahat, S.; Ahmad, N.F.A.; Razali, S.N.A.M.; Kaamin, M.; Mokhtar, M.; Hamid, N.B.; Nyadiman, N. Effectiveness of Corn Cob as a Thermal Isolation Material. In AIP Conf. Proccedings; AIP Publishing LLC: Melville, NY, USA, 2018; p. 020127. [Google Scholar]
  50. Dewi, S.M.; Wijaya, M.N. The Use of Bamboo Fiber in Reinforced Concrete Beam to Reduce Crack. In AIP Conference Prceedigns: Green Construction and Engineering Education for Sustainable Future; AIP Publishing LLC: Melville, NY, USA, 2017; p. 020003. [Google Scholar] [CrossRef] [Green Version]
  51. Eisenreich, N.; Eyerer, P. Arboform®—A Thermoplastic, Processable Material from Lignin and Natural Fibers. In Chemical Modification, Properties, and Usage of Lignin; Springer: Boston, MA, USA, 2002. [Google Scholar] [CrossRef]
  52. Asdrubali, F.; Schiavoni, S.; Horoshenkov, K.V. A review of sustainable materials for acoustic applications. Build. Acoust. 2012, 19, 283–311. [Google Scholar] [CrossRef]
  53. Iannace, G.; Ciaburro, G.; Trematerra, A. Modelling Sound Absorption Properties of Broom Fibers Using Artificial Neural Networks. Appl. Acoust. 2020, 163, 107239. [Google Scholar] [CrossRef]
  54. Berardi, U.; Iannace, G. Predicting the Sound Absorption of Natural Materials: Best-Fit Inverse Laws for the Acoustic Impedance and the Propagation Constant. Appl. Acoust. 2017, 115, 131–138. [Google Scholar] [CrossRef]
  55. Glé, P.; Gourdon, E.; Arnaud, L. Modelling of the Acoustical Properties of Hemp Particles. Constr. Build. Mater. 2012, 37, 801–811. [Google Scholar] [CrossRef]
  56. Yang, T.; Hu, L.; Xiong, X.; Petr, M.; Noman, M.T.; Mishra, R.; Militky, J. Sound Absorption Properties of Natural Fibers: A Review. Sustainability 2020, 12, 8477. [Google Scholar] [CrossRef]
  57. Tang, X.; Zhang, X.; Zhang, H.; Zhuang, X.; Yan, X. Corn Husk for Noise Reduction: Robust Acoustic Absorption and Reduced Thickness. Appl. Acoust. 2018, 134, 60–68. [Google Scholar] [CrossRef]
  58. Oldham, D.J.; Egan, C.A.; Cookson, R.D. Sustainable Acoustic Absorbers from the Biomass. Appl. Acoust. 2011, 72, 350–363. [Google Scholar] [CrossRef]
  59. Putra, A.; Or, K.H.; Selamat, M.Z.; Nor, M.J.M.; Hassan, M.H.; Prasetiyo, I. Sound absorption of extracted pineapple-leaf fibres. Appl. Acoust. 2018, 136, 9–15. [Google Scholar] [CrossRef]
  60. Yahya, K.; Haron, Z.; Shaikh Abdul Hamid, S.N.; Mohd Fasli, N.; Taiwo, E.M. The Potential of Pinepple Leaf Fibre as an Acoustic Absorber. In Proceedings of the AICCE’19, Penang, Malaysia, 21–22 August 2019; pp. 919–932. [Google Scholar]
  61. Iannace, G.; Umberto, B.; Bravo-Moncayo, L.; Ciaburro, G.; Puyana-Romero, V. Organic Waste as Absorbent Materials. In INTER-NOISE and NOISE-CON Congress and Conference Proceedings, InterNoise20; Institute of Noise Control Engineering: Washington, DC, USA, 2020. [Google Scholar]
  62. Ciaburro, G.; Puyana-romero, V.; Iannace, G.; Andres, W.; Iannace, G. Characterization and Modeling of Corn Stalk Fibers Tied with Clay Using Support Vector Regression Algorithms Characterization and Modeling of Corn Stalk Fibers Tied with Clay Using Support Vector Regression Algorithms. J. Nat. Fibers 2021, 1–16. [Google Scholar] [CrossRef]
  63. Ciaburro, G.; Iannace, G.; Ali, M.; Alabdulkarem, A.; Nuhait, A. An Artificial Neural Network Approach to Modelling Absorbent Asphalts Acoustic Properties. J. King Saud Univ.-Eng. Sci. 2021, 33, 213–220. [Google Scholar] [CrossRef]
  64. Ciaburro, G.; Iannace, G.; Puyana-Romero, V.; Trematerra, A. A Comparison between Numerical Simulation Models for the Prediction of Acoustic Behavior of Giant Reeds Shredded. Appl. Sci. 2020, 10, 6881. [Google Scholar] [CrossRef]
  65. Chávez Cruz, G.; Olaya Cum, R.L.; Maza Iñiguez, J.V. Cost of Production of Clonal Cacao CCN-51 in the Parish Bella-Maria, Ecuador. Univ. Soc. 2018, 10, 179–185. [Google Scholar]
  66. Alvarado Valarezo, J.; Castro Bravo, J.; Guerrero Martínez, Á.; Nolivos Álvarez, I. Sistema Experto Para Decisiones de Riego En Cultivos de Cacao CCN51. Artículos Tesis Grado-FIEC 2012. Available online: http://www.dspace.espol.edu.ec/xmlui/handle/123456789/20806?show=full (accessed on 4 March 2022).
  67. Teas, Cocoa and Coffee: Plant Secondary Metabolites and Health; Crozier, A.; Ashihara, H.; Tomás-Barbéran, F. (Eds.) John Wiley & Sons: Hoboken, NJ, USA, 2017. [Google Scholar]
  68. Cajas Camacho, L.G. La Cáscara de Cacao Como Material Acústico: Evaluación de las Propiedades Absorbentes de Muestras con Distinta Densidad y Espesor. Bachelor’s Thesis, Universidad de las Américas, Quito, Ecuador, 2019. [Google Scholar]
  69. Ray, D.; Sarkar, B.K.; Rana, A.K.; Bose, N.R. Effect of alkali treated jute fibres on composite properties. Bull. Mater. Sci. 2001, 24, 129–135. [Google Scholar] [CrossRef]
  70. Kilama, G.; Lating, P.O.; Byaruhanga, J.; Biira, S. Quantification and Characterization of Cocoa Pod Husks for Electricity Generation in Uganda. Sustain. Soc. 2019, 9, 2–11. [Google Scholar] [CrossRef] [Green Version]
  71. Velazquez-Araque, L.; Cárdenas, J. A Preliminary Study of Pelletized Ecuadorian Cocoa Pod Husk for Its Use as a Source of Renewable Energy. In Proceedings of the 20th World Mult-Conference on Systems, Cybernetics and Informatics (WMSCI 2016), Orlando, FL, USA, 5–8 July 2016; pp. 29–33. [Google Scholar]
  72. Barreiro, A.; Sandoval, A.J. Kinetics of Moisture Adsorption during Simulated Storage of Whole Dry Cocoa Beans at Various Relative Humidities. J. Food Eng. 2020, 273, 109869. [Google Scholar] [CrossRef]
  73. ISO 354:2003(En); Acoustics—Measurement of Sound Absorption in a Reverberation Room. International Organization for Standardization: Geneva, Switzerland, 2003.
  74. ISO 10534-2; Acoustics—Determination of Sound Absorption Coefficient and Impedance in Impedance Tubes-Part 2: Transfer-Function Method. International Organization for Standardization: Geneva, Switzerland, 1998.
  75. ASTM E1050-98; Standard Test Method for Impedance and Absorption of Acoustical Materials Using a Tube, Two Microphones, and a Digital Frequency Analysis System. ASTM International: West Conshohocken, PA, USA, 1998. [CrossRef]
  76. Vapnik, V. The Nature of Statistical Learning Theory; Springer Science & Business Media: Berlin/Heidelberg, Germany, 1999. [Google Scholar]
  77. Mangasarian, O.L.; Musicant, D.R. Lagrangian support vector machines. J. Mach. Learn. Res. 2001, 1, 161–177. [Google Scholar]
  78. Amari, S.I.; Wu, S. Improving support vector machine classifiers by modifying kernel functions. Neural. Netw. 1999, 12, 783–789. [Google Scholar] [CrossRef]
  79. Platt, J. Sequential Minimal Optimization: A Fast Algorithm for Training Support Vector Machines; Technical Report MSR-TR-98–14; Microsoft Research: Redmond, WA, USA, 1999. [Google Scholar]
  80. Fan, R.E.; Chen, H.P.; Li, J.C. Working Set Selection Using Second Order Information for Training Support Vector Machines. J. Mach. Learn. Res. 2005, 6, 1871–1918. [Google Scholar]
  81. Huang, T.M.; Kecman, V.; Kopriva, I. Kernel Based Algorithms for Mining Huge Data Sets: Supervised, Semi-Supervised, and Unsupervised Learning; Springer: New York, NY, USA, 2006. [Google Scholar]
  82. Fan, R.E.; Chen, H.P.; Li, J.C. A Study on SMO-Type Decomposition Methods for Support Vector Machines. IEEE Trans. Neural Netw. Learn. Syst. 2006, 17, 893–908. [Google Scholar]
  83. Berardi, U.; Iannace, G. Acoustic characterization of natural fibers for sound absorption applications. Build. Environ. 2015, 94, 840–852. [Google Scholar] [CrossRef]
  84. Bengio, Y.; Grandvalet, Y. No unbiased estimator of the variance of k-fold cross-validation. J. Mach. Learn. Res. 2004, 5, 1089–1105. [Google Scholar]
  85. Weidong, Y.; Yan, L.I. Sound Absorption Performance of Natural Fibers and Their Composites. Sci. China Technol. Sci. 2015, 55, 2278–2283. [Google Scholar] [CrossRef]
  86. Köksoy, O. Multiresponse robust design: Mean square error (MSE) criterion. Appl. Math. Comput. 2006, 175, 1716–1729. [Google Scholar] [CrossRef]
  87. Chai, T.; Draxler, R.R. Root mean square error (RMSE) or mean absolute error (MAE)?—Arguments against avoiding RMSE in the literature. Geosci. Model Dev. 2014, 7, 1247–1250. [Google Scholar] [CrossRef] [Green Version]
  88. Willmott, C.J.; Matsuura, K. Advantages of the mean absolute error (MAE) over the root mean square error (RMSE) in assessing average model performance. Clim. Res. 2005, 30, 79–82. [Google Scholar] [CrossRef]
  89. Cameron, A.C.; Windmeijer, F.A. An R-squared measure of goodness of fit for some common nonlinear regression models. J. Econom. 1997, 77, 329–342. [Google Scholar] [CrossRef]
  90. Iannace, G.; Ciaburro, G. Modelling sound absorption properties for recycled polyethylene terephthalate-based material using Gaussian regression. Build. Acoust. 2021, 28, 185–196. [Google Scholar] [CrossRef]
  91. Copas, J.B. Using regression models for prediction: Shrinkage and regression to the mean. Stat. Methods Med. Res. 1997, 6, 167–183. [Google Scholar] [CrossRef]
  92. Ciaburro, G.; Iannace, G. Numerical simulation for the sound absorption properties of ceramic resonators. Fibers 2020, 8, 77. [Google Scholar] [CrossRef]
  93. Poldrack, R.A.; Huckins, G.; Varoquaux, G. Establishment of best practices for evidence for prediction: A review. JAMA Psychiatry 2020, 77, 534–540. [Google Scholar] [CrossRef]
Figure 1. Cocoa pods used in the study.
Fibers 10 00025 g001
Figure 2. Ripe cocoa cob used in the study.
Fibers 10 00025 g002
Figure 3. Drying process. (a) Natural dried in the open air; (b) Oven used.
Fibers 10 00025 g003
Figure 4. Pieces of cocoa pod husk dried.
Fibers 10 00025 g004
Figure 5. Manual mill for grains used to get the disaggregated particles.
Fibers 10 00025 g005
Figure 6. Samples of 25 mm (left) and 10 mm (right) of cocoa pod husk 90% mixed with silicon 10%.
Fibers 10 00025 g006
Figure 7. Sample housed in the impedance tube.
Fibers 10 00025 g007
Figure 8. Identification of a separation hyperplane, the two symbols represent different classes.
Fibers 10 00025 g008
Figure 9. Sound absorption coefficients of the samples of cocoa pod husk tied with silicone. Results for four different percentages of cocoa pod husk particles (90%, 75%, 50%, and 25%): (a) sample of 25 mm of thickness; (b) sample of 10 mm of thickness.
Fibers 10 00025 g009
Figure 10. Architecture of the sound absorption coefficient prediction model based on support vector machine.
Fibers 10 00025 g010
Figure 11. Sound absorption coefficient trend (500–5000 Hz) between the measured value with the impedance tube and the simulated with the model based on SVM (25 mm thick sample): (a) sample with 90% of cocoa fibers; (b) sample with 75% of cocoa fibers; (c) sample with 50% of cocoa fibers; (d) sample with 25% of cocoa fibers.
Fibers 10 00025 g011
Figure 12. Sound absorption coefficient trend (500–5000 Hz) between the measured value with the impedance tube and the simulated with the model based on SVM (10 mm thick sample): (a) sample with 90% of cocoa fibers; (b) sample with 75% of cocoa fibers; (c) sample with 50% of cocoa fibers; (d) sample with 25% of cocoa fibers.
Fibers 10 00025 g012
Figure 13. Predicted versus actual value.
Fibers 10 00025 g013
Table 1. Sound absorption coefficient of different natural fibers [83] and fiberglass (from authors measurement) compared to cocoa specimen.
FiberThickness (mm)Frequency (Hz)
12525050010002000
Cocoa250.130.140.200.650.30
Wood300.050.100.100.200.40
Hemp300.010.150.250.510.70
Kenaf400.080.180.320.700.94
Sheep Wool400.100.140.360.730.94
Coconut500.100.200.340.670.79
Fiberglass250.180.200.360.700.84
Table 2. Support vector machine-based model parameters.
Model TypeFine Gaussian SVM
Kernel functionGaussian
Kernel scale0.56
Box constraint0.1445
Epsilon0.0144
Number of iterations2524
Bias0.2779
Gap6.832 × 10−4
DeltaGradient0.0021
Table 3. Performance evaluation metrics of predicting models.
ModelMSERMSEMAER-Squared
Linear regression0.0320.1780.1290.15
Fine Gaussian SVM0.00020.0170.0120.99
Publisher’s Note: MDPI stays neutral with regard to jurisdictional claims in published maps and institutional affiliations.

