Abstract
The aim of this work is to explore the manufacturing of insulation structures using fused filament deposition of biosourced materials. The approach considers printing of Polylactic acid (PLA) and PLA-flax (PF) structures using varied infill density and printing temperatures. Differential Scanning Calorimetry and Thermal Gravimetry analysis are performed to study thermal behaviour of PLA and PF and derive weight content of fibres within PF. Thermal measurements show a strong dependence of thermal conductivity with infill density and slightly improved thermal insulation of PF compared to PLA. Moreover, both PF and PLA show a hydrophobic behaviour unlike conventional green concretes based on hemp or flax. In addition, both scanning electron and optical microscopies show marked morphological changes induced by the laying down process for PF. This latter exhibits a more complex and tortuous microstructure compared to PLA marked by the presence of inter-filament porosity. This work concludes with superior hygrothermal properties of PLA and PF compared to other biosourced materials such as hemp or flax concrete. This work also concludes with the beneficial role of flax fibres that provides better hygrothermal properties to the printed structures as well as on the need to optimize the infill characteristics including density and cell morphology density.
1. Introduction
Additive manufacturing (AM) refers to a set of technologies that are used to process materials layer by layer based on a digitalized model using a wide spectrum of raw materials [1,2]. One of the main features of AM is its ability to manufacture complex shapes with a limited dependence on production tooling as it shortens the fabrication cycle to one single step, i.e., the conversion of a CAD (Computer-Aided Design) model to a set of machine instructions [3]. Another feature of AM is the wide spectrum of materials that can be printed, such PLA [2,4] or ABS [5], wax [6], metal [7,8], plaster [9], ceramics [10,11], and glass [12,13]. AM also allows the customization of parts, which makes it a perfect technology for manufacturing small production series. AM covers various applications areas ranging from prototyping, architectural design, industrial, and engineering [14,15,16]. It can be stated that AM has reached a mature state in many applications including civil engineering [17,18,19]. For instance, it has been considered a key technology to design new generation of cementitious materials using crafting technology [20,21,22]. In this work, a particular AM process based Fused Deposition Modelling (FDM) is considered to design a new generation of insolation materials for civil engineering applications. The motivation behind this is that this technology can handle polymeric materials with intrinsically low thermal conductivity. In addition, among the feedstock materials in FDM, biosourced materials can bring a better environmental footprint compared to classical synthetic insulators, which are known for their recyclability issues. Moreover, AM allows us to control with great precision the shape of the printed structure as well as the quantity of air occluded [23]. These two characteristics are key parameters in the design of elements for efficient building isolation [24,25].
FDM, or Fused Filament Fabrication (FFF), is considered as a candidate technology for the processing of insulation materials due to its simplicity and low cost. Among the biosourced materials that can be used for 3D printing of insulation panels, polylactic acid (PLA) reinforced by natural fillers shows promising properties. For instance, the mechanical stability of 3D printed PLA-hemp has been studied by the research group [23], for which the mechanical performance was demonstrated to be strongly dependent on the microstructural organization especially the quality of the PLA-hemp bond. Moreover, Le Duigou et al. [26] highlighted a limited mechanical performance, especially under tensile conditions of 3D structures reinforced by wood fibres, which was explained by a lack of interfacial performance and a process-induced porosity.
The literature analysis shows that the use of natural fillers such as wood particles, hemp, or flax fibre is still challenging due to the quality of interface between the matrix and the fibres and the possible generation of defects during the processing [23,27]. However, if these difficulties are overcome, the use of reinforcing material such as flax in PLA filament would result in a substantial improvement of the performance taking advantage of the genuine high stiffness and strength of flax fibres. This study explores another aspect that has not been described yet in the literature in relation to the transfer properties of traditional materials such as hemp concrete used in civil engineering applications. In this work, the evaluation of the thermal and transfer properties of both PLA and PLA Flax (PF) materials are performed to evaluate the potential of these two candidate materials as feedstocks for the design of insulation materials. Even if the literature work on mechanical properties of these materials is substantial, there is a lack of information regarding their hygrothermal properties as well as the composition and fibre content in PF. For this purpose, two types of studies are conducted at the filament and 3D printed structure scales. The first one aims at looking at the phase change, melt, and degradation temperatures and energies of raw materials. The second focuses on thermal and transfer performance of 3D printed PF and PLA with respect to infill density and printing temperature.
2. Materials and Methods
Commercially available ECOFIL PLA and NANOVIA PLA/Flax PF filaments (diameter = 1.75 mm) are used as feedstock materials. Physical and chemical properties of the two feedstock materials are shown in Table 1.

Table 1.
Properties of considered feedstock materials [25].
The printing process is undertaken using a commercial 3D printer (Creality CR10) using the set of parameters detailed in Table 2. Three types of samples are printed according to the characterisation geometry constrains. Indeed, for each characterisation protocol detailed hereafter, the sample form and dimensions are adjusted to meet the standard of measurement using the devices selected. For instance, thermal conductivity requires parallelipipedic samples of 15 cm × 15 cm × 3 cm at least. For temperature and relative humidity measurements, samples of 10 cm × 10 cm × 8 cm are considered. In addition to the printed specimens, the as-received filaments of 1.75 mm in diameter are cut into small specimens to determine their thermal properties and morphological characteristics. The same is performed on printed filaments of 0.4 mm in diameter extruded at the considered printing temperatures. The motivation behind this is to provide a statement on the role of the defects generated prior the printing process, namely during the wire fabrication. These effects can be related to both morphology and thermal history.

Table 2.
Printing parameters used for the experimental characterisation campaign.
The main varied parameters are the printing temperature and the infill. The first parameter is believed to influence the cohesiveness of the filaments and thus would affect transfer properties through the process-induced porosity. The second parameter determines the airiness of the samples and would have a direct effect on thermal and transfer performance. Figure 1 illustrates the infill rates for 10% and 30%. The layup of −45°/+45° is considered for the core and an external frame is added to add mechanical stability. This layup is chosen according to a previous work [28] where θ corresponds to a printing angle of 0°, which allows an optimal connectivity between the frame and the core filaments.
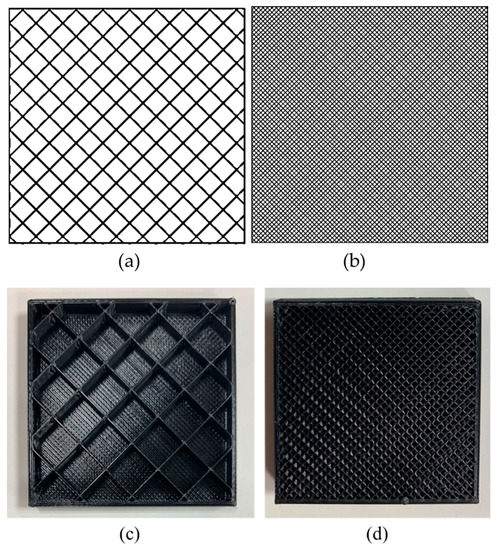
Figure 1.
Schematic representation of the layups used for printing PLA and PF samples at an infill of (a) 10% and (b) 30% and related rendering for 3D printed PLA samples with a scale of 0.3 (45 × 45 × 9 mm) with (c) PLA-10% and (d) PLA-30% infill.
For large samples, only two replicates are used, whereas for the other geometries up to five samples are considered per printing condition. A former study by the authors shows that the reproducibility of the results does not require a large number of replicates due to the local control of the material laying down [29].
Table 3 shows the density and airiness of the printed PLA and PF samples for two levels of infills printed at 200 °C. The air content is obtained from a volumetric calculation based on the total apparent volume, the filament density measured by helium pycnometer and the infill rate of 10% and 30%. The densities of the studied samples are measured from the weight and apparent volume data.

Table 3.
Densities and air content of the studied materials.
A lambda meter EP500e device is used to measure thermal conductivity of printed structures. The measurement is based on a guarded hot plate that exploits Fourier’s law of thermal conduction in steady state in accordance with ISO 8302, EN 1946-2 standards. The measurements are performed under a temperature gradient of 15 °C and adjusting the hot face temperature to the following levels: 10 °C, 23 °C, and 40 °C. This device measures the thickness of the sample (e [m]) and its surface area (A [m2]), the temperature difference between the two sides of the sample (ΔT [K]), as well as the unidirectional heat flux (Q [W]) through the sample, which is equivalent to the electrical power for heating (P = U·I [W]).
The temperature and relative humidity evolution are obtained by using a climatic chamber (Figure 2a,b). The aim is to evaluate the hygrothermal behaviour of the printed samples during different cycles of heat and humidity variations (Figure 2b). Printed specimens are drilled to place temperature and relative humidity sensors from Ahlborn (Figure 2c) which measure temperature and relative humidity with an accuracy of 0.1 °C and 2%, and within the ranges −30 °C to +100 °C and 5% to 98%, respectively. The measurements are performed at two depths 2.5 cm and 5 cm from the exposed face (Figure 2c). The remaining faces are isolated with an impermeable tape in order to achieve unidirectional transfer conditions.
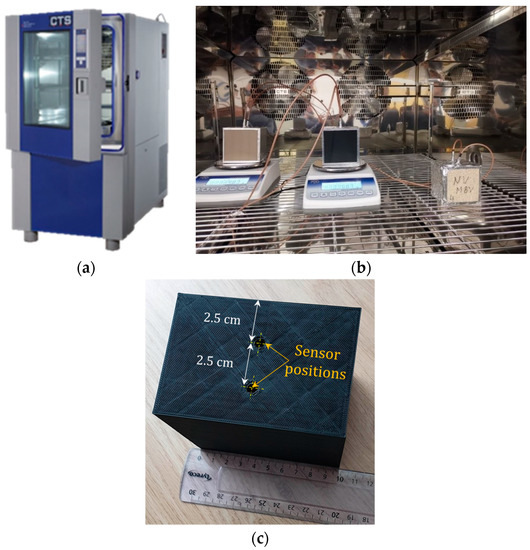
Figure 2.
Hygrothermal behaviour analysis using climatic chamber: (a) Overview of the climatic chamber, (b) samples inside the climatic chamber (PF-10% infill on the left, PLA-10% infill in the middle, and hemp concrete on the right), and (c) a zoomed view on a sample printed using an infill of 10% and a printing temperature of 200 °C with sensor positions.
Temperature and humidity cycling were conducted according to the scheme shown in Figure 3. Prior to cycling, all samples were subjected to equilibrium conditions at a temperature of 23 °C and a relative humidity of 50% in order to stabilize their initial state. The cycling scheme considers large variations in chamber temperature between 5 °C and 35 °C with a typical period of 48 h. The same square profile is adopted for humidity in the range 10–80%.
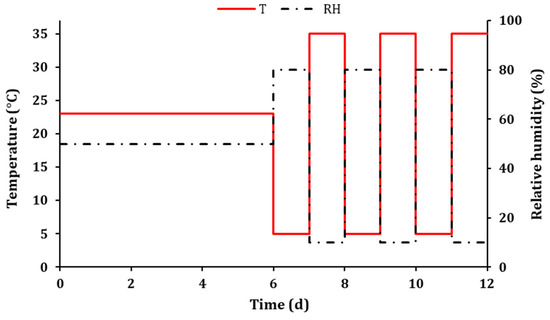
Figure 3.
Temperature and relative humidity cycling applied to PLA and PF printed samples using an infill of 10% in the climatic chamber.
Furthermore, samples of the as-received filaments are tested by Differential Scanning Calorimetry (DSC)/Thermogravimetric Analysis (TGA). A DSC3+ Device (Mettler-Toledo, Viroflay, France) is used for such a purpose in order to characterize their crystallization, melting, and thermal degradation behaviour. This device is equipped with a scale to weigh the samples during the heating stage. It allows the recording of the mass variation during the heating according to TGA technique. Two thermocouples placed in the oven and under the crucible containing the sample allows the monitoring of the oven and sample temperatures and provides the heat released during the imposed thermal kinetics according to the DSC technique. The scale provides the weight information ranging from few mg to 5 g with and accuracy of 0.1 µg. The thermocouple measurement range allows temperatures as high as 1600 °C to be sensed with an accuracy of 10−4 °C and a heat release measurement accuracy of the order of 0.2 mW. The combined TGA-DSC technique is used to derive the fibre content in PLA-Flax filaments. Tests are carried out using the following temperature profile: isotherm stage at 25 °C maintained for 5 min followed by a heating stage form 25 °C up to 450 °C with a heating rate of 5 °C/min. In fact, service temperatures for insulators in construction sector would not require temperatures above 50 °C in the most extreme cases. The heating stage is conducted up to 450 °C for two main reasons: at around 150 °C, PLA matrix melts and flax fibres are supposed to be thermally stable. The use of a large end temperature ensures to reach the temperature of flax component degradation to check if there are any thermal instabilities at the printing temperatures considered in this study. These would, for instance, affect the in-service properties. The second reason is related to the procedure set to measure the weight content of flax within the PF filament exploiting the weight loss information as described in the next section.
The experiments were also carried out on extruded filaments at different printing temperatures (200 °C, 210 °C, and 220 °C) in order to characterize their possible structure modifications with respect to the printing temperature.
Finally, microstructure observations of the studied filaments are carried out using two complementary techniques: optical and electron scanning microscopies.
A CMOS based numerical microscope VHX 7000 (Keyence) allowing for a typical magnification of ×6000 within the optical wavelength limit. The observations are performed with a resolution of 2880 × 2160 pixels where the physical dimension of the pixel varies depending on the magnification between 0.7 µm and 5 µm. In order to capture roughness and waviness information, the following magnifications are used: E20 ×20, E20 ×80, E100 ×100, E100 ×300, E500 ×1000, and E500 ×1500. Other observations of the printed structures are made using Scanning Electron Microscopy (SEM) FEI Quanta 200 ESEM/FEG under environmental mode. The observations are carried out with a voltage of 11 kV and a pressure of 1.2 mbar, which are set as reference parameters. The analysis mainly focuses on process-generated defects, nature and characteristics of the layout, and layups, which are all related to the process conditions. Several magnifications are used between ×57 and ×400 with a typical resolution of 2048 × 1887 pixels and a pixel size between 0.17 µm and 1 µm. target resolution is a scale reaching 3 nm. This technique was used in order to check a possible apparent modification in the filaments texture.
3. Results and Discussions
3.1. DSC-TGA Analysis and Fibre Rate Determination
Thermal analysis is conducted on both as-received wires and extruded filaments at different printing temperatures. Figure 4 illustrates the possible deviation of thermal behaviour of as-received PF with respect to different sampling taken from a large number of spools. This figure depicts a good reproducibility of the phase change enthalpies recorded for seven samples within a large temperature interval. However, some differences are observed in the degradation phases for high temperatures (typically from 300 °C to 450 °C), which reflect possible variations in the filament composition. The observed variations have to be narrowed down to the variability of the flax fibres that are used as a reinforcement in PLA.
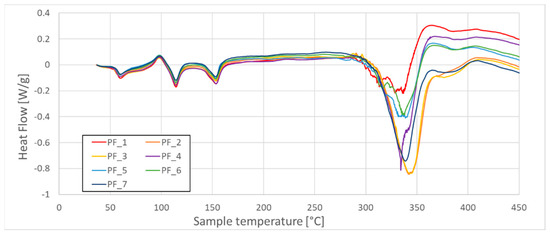
Figure 4.
Heat flow (HF) of seven as-received samples of PLA-Flax (PF) filaments taken from different spools.
The comparison between Heat Flow (HF) curves for PLA and PLA-Flax as-received filaments is shown in in Figure 5. One has to mention that the two filaments are provided by two different suppliers. The manufacturers of these filaments do not provide complete chemical composition of PLA involved in PF matrix with respect to PLA used alone. Some differences can be expected, especially in terms of additive materials used to improve the printability of PLA. For instance, Figure 5 shows that the PF sample degrades faster after 300 °C than its PLA counterpart. Despite this difference, the results of DSC show that PLA and PF have similar thermal behaviour along a large temperature interval with the exception of enthalpy relaxation stage and thermal degradation, as shown in Figure 5. The thermal analysis highlights that PLA-Flax has two heat release peaks which do not exist for PLA. The first peak is located between cold crystallization and the melt stages in a temperature range between 105 °C and 120 °C. This peak reflects a relaxation phase of the cold crystallization. The second peak is located beyond 150 °C and is related to the melting of PLA phase. A third peak located in the high temperature range corresponds to the thermal degradation of the flax fibres within PLA. This degradation is more effective for temperatures between 360 °C and 410 °C. The mass loss corresponding to temperature range where fibre degradation within PF filament is witnessed is exploited to estimate the fibre weight content in the PF filament. Indeed, the change in the slope of the PF curve within this temperature range does not exist for PLA, which demonstrates that the thermal modifications observed are to be associated with the flax fibre degradation. Based on this rational, the determination of the average fibre content in PF is performed based on seven replicates coming from different filament spools. The obtained fibre rate is 20 ± 0.55%.
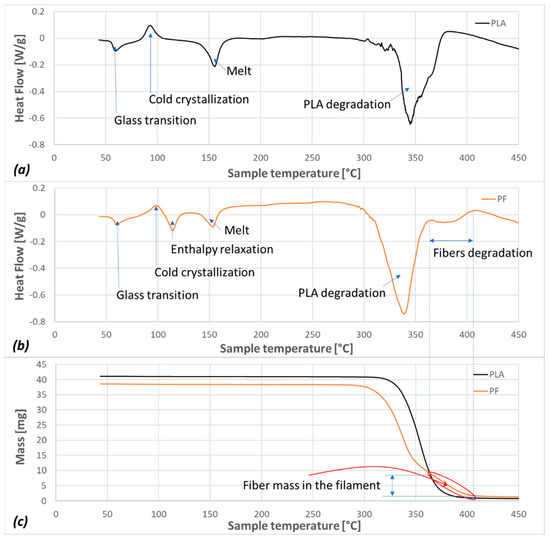
Figure 5.
Heat flow (HF) of as-received PLA (a), PF (b), and mass loss (c) of PLA and PF filaments during DSC/TGA tests.
Figure 6 shows the results of thermal analysis of the as-received PLA and PF filaments as well as the extruded ones PLA-T °C and PF-T °C, where T °C refers to the temperature of extrusion (three values are used: 200 °C, 210 °C, and 220 °C). The extruded filaments are obtained by printing a line of 10 cm long on the printing plate heated at 50 °C as suggested by the filament providers. All the filaments are cut to fit the sample holders prior testing using TGA-DSC. The results of thermal analysis of extruded PLA and PF filaments is shown in Figure 6. Noticeable changes in the thermal behaviour reflecting filament structure modifications are highlighted near the glass transition. When the extrusion temperature is varied from 200 °C to 220 °C, a slight reduction in the glass transition is observed within the temperature range (50–70 °C). The enthalpy values, as well as the characteristic temperatures related to the phase changes, are given in Table 4. These values highlight the decrease in the energy needed for this phase change and modification of the glass transition with the increase in the extrusion temperature. However, the largest reduction is obtained between as-received and extruded filaments.
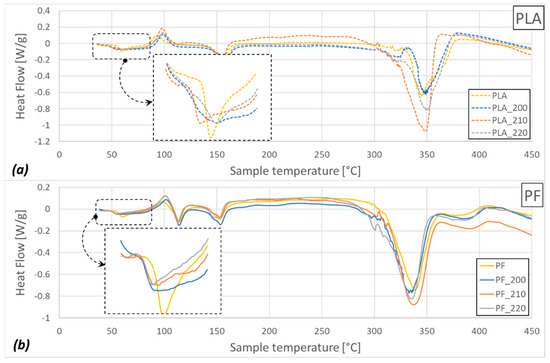
Figure 6.
Heat flow (HF) of (a) PLA and (b) PF for different printing temperatures (200 °C, 210 °C, and 220 °C).

Table 4.
Enthalpies and characteristic temperatures of the glass transition of PLA and PF for the as-received PLA and PF filaments and extruded ones at three printing temperatures (200 °C, 210 °C, and 220 °C) namely under the nomenclature PLA and PF followed by the printing temperature.
3.2. Morphology of Extruded Filaments
Hypothesis of filament jaggedness and porosity created during the printing process within filaments reinforced by natural fibres is checked through optical microscopy observations of as-received and extruded filaments at different printing temperatures. Figure 7 shows the surface morphologies of as received PLA and PF filaments. As-received PLA filament exhibits a smooth surface state and the cross-section view reveals no particular porosity that might be induced during processing (Figure 7a). However, the as received PF filament exhibit a slightly jagged surface morphology and traces of flax fibre extremities are visible from the surface view (Figure 7b).
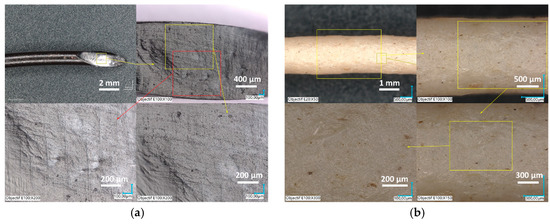
Figure 7.
Surface state of the as-received filaments observed by digital microscopy: (a) PLA and (b) PF.
Figure 8 provides more quantitative results about the PF and PLA filament morphologies using surface profile analysis.
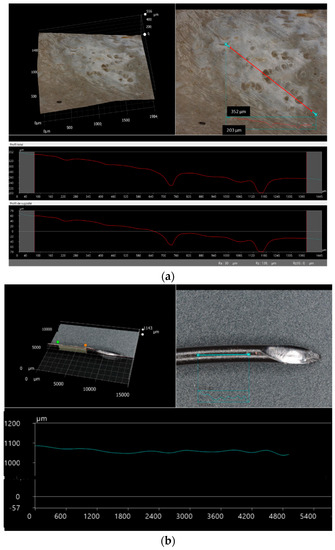
Figure 8.
Surface roughness of as-received (a) PF and (b) PLA filaments measured using optical microscopy.
Along particular areas where surface porosity is observed, Figure 8a shows a significant surface state variability close to flax fibre clusters in PF filaments.
The presence of surface porosity is thus highlighted close to these areas, which seems to be genuine to the filament production process. The porosity average size is of the order of 60 µm based on the roughness profiles recorded from the surface. This porosity can be explained by the lack of cohesion between PLA matrix and flax fibres. Besides the presence of the porosity, there is a wide variation in surface waviness, which indicates a possible effect of flax fibre filling irregularly the filament core. Figure 8b shows an opposite situation for PLA filament where flatness of the surface demonstrates the absence of surface porosity and a regular filament shape.
When the filament is heated at the printing temperatures (200 °C, 210 °C, and 220 °C), two different situations occur depending on the tested material (Figure 9). For instance, the surface roughness of PLA decreases, leading to a more regular and smooth topography (Figure 9d–f). The smooth aspect of extruded PLA filament is more obvious for high printing temperatures, which can be read from the intensity of the light reflection on the surface of the filament. By opposition to the PLA case, the PF filament exhibits a higher jaggedness after extrusion at high temperature (Figure 9a–c). These results indicate clearly that the morphology of the PF filaments is also altered during the printing process. A minor compensation of such alternation can occur during the laying down process where the PF filaments are forced into an elongated shape which might reduce the jaggedness.
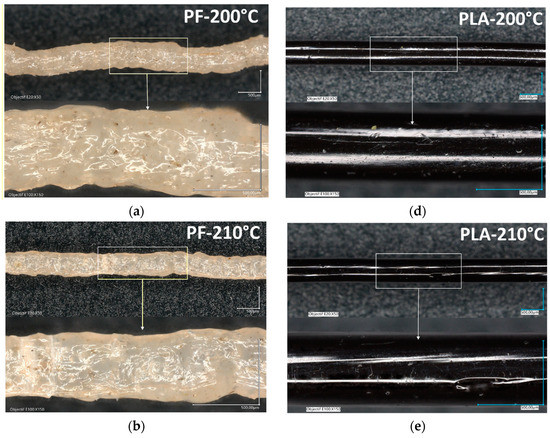
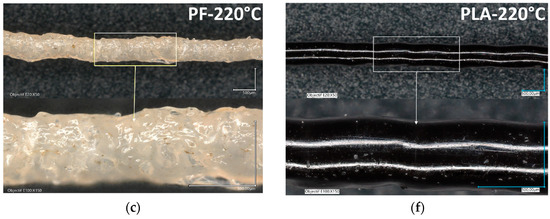
Figure 9.
Filament morphology of PLA and PF after extrusion at high temperatures. (a–c) PF filament at 200 °C, 210 °C et 220 °C, respectively. (d–f) PLA after extrusion at the same extrusion temperatures.
The differences of surface morphology of extruded PLA and PF have couples of consequences on the morphology of printed materials. To explore furthermore the microstructural arrangement of printed structures, SEM micrographs are shown in Figure 10 and Figure 11 for both PLA and PF. Figure 10a,b shows the typical arrangement of PLA filaments crossing at a sequence of −45°/+45° for samples printed at 200 °C. Figure 10a shows the presence of inter-filament porosity, which is induced by the laying down process. This is a well-known consequence of the discontinuities created by adding sequentially filaments with elliptical cross-section [29]. The presence of such porosity is supposed to promote the transfer properties as the amount of pore connectivity is significant. A quantitative evaluation of the porosity size from SEM micrographs shows a typical value of 117 ± 49 µm. This value is, in fact, underestimated if compared to X-ray microtomography results by the authors, which report values six times larger than the SEM-based evaluation [28]. This difference is due to the fact that SEM does not capture the real 3D extent of the porosity within the printed structure. The extent of the connected porosity within the core of the specimen is limited at the specimen edges. As shown in Figure 10b, the presence of an external frame with two successive layers balances the role of open porosity. Indeed, in the case of PLA, and according to the geometry of the tested samples in Figure 1, the frame structure is more cohesive and act as a barrier against the full percolation of the core porosity. The presence of inter-filament porosity is still detected at the frame but this one is limited to typical sizes of 49 ± 12 µm and its extension is limited to the plane of construction. The average cross-section shape factor for the filament composing the frame is 0.42 ± 0.00, which is smaller than the theoretical value of 0.5 obtained by dividing the layer height by the nozzle size. The cohesiveness of printed PLA is enhanced by increasing the printing temperature to 210 °C as shown in Figure 10c,d. The amount of inter-filament porosity is decreased as a consequence of the reduction in the necking effect during the laying down process of the filaments [29]. This is also evidenced from the decrease in the inter-filament porosity which if found as low as 96 ± 7 µm. The shape factor of the PLA filament cross-section is also reduced to 0.36 ± 0.05, which demonstrates a tendency towards filament flatness. Figure 10e shows a contrasted microstructural arrangement for PF printed at 200 °C. Flax fibres within the PF filaments have a typical diameter of 27 ± 8 µm for the thinnest ones and a typical length larger than 680 µm in average. Besides the presence of inter-filament porosity of a typical size of 170 µm, intra-filament porosity contributes to the airiness of the structure with two major populations, one with a typical size of 40 ± 9 µm and the second close to 126 ± 28 µm. Figure 10f demonstrates that even the presence of the external frame does not guarantee the isolation of the core porosity from the external surfaces. As shown from the tilt view, the presence of surface porosity is evidenced, which may contribute to the transfer properties of PF compared to PLA. Even with a higher printing temperature (210 °C), Figure 10g,h show the persistence of the intra-filament porosity while decreasing the amount of inter-filament porosity. These results demonstrate the differences in microstructural arrangement between PLA and PF as originating from the differences in the nature and amount of defects produced prior or during the printing process.
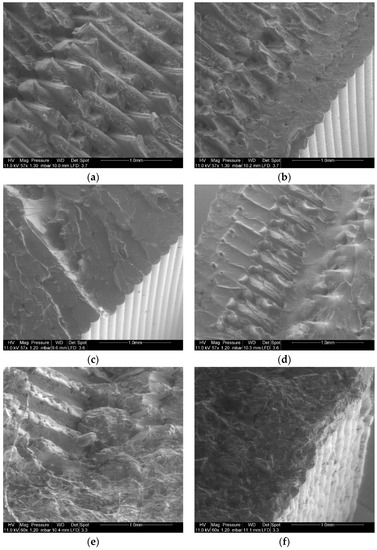
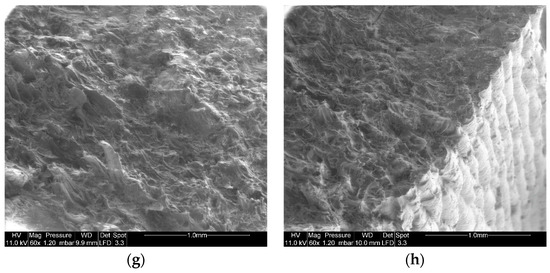
Figure 10.
SEM micrographs showing the differences in microstructural arrangement between PLA and PF printed samples. (a) PLA printed at 200 °C layup view, (b) PLA printed at 200 °C edge view, (c) PLA printed at 210 °C layup view, (d) PLA printed at 210 °C edge view, (e) PF printed at 200 °C layup view, (f) PF printed at 200 °C edge view, (g) PF printed at 210 °C layup view, and (h) PF printed at 210 °C edge view.
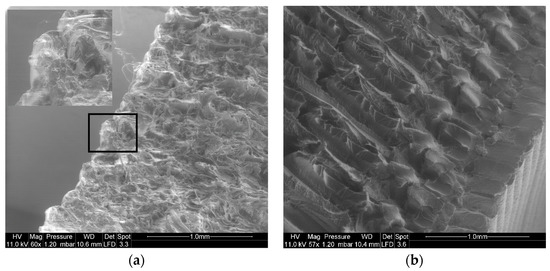
Figure 11.
SEM micrographs showing the morphology of 3D printed PLA and PF at 200 °C. (a) PF, (b) PLA.
Figure 11 shows SEM micrographs of PLA and PF printed structures proving that the morphology of the core and the surface roughness of the printed materials are both affected in different ways. In the case of PF (Figure 10a), the observed fractured surfaces do not allow distinguishing the layups as the topography of the exposed surface is rough with pulled out flax fibres. In addition, the layering of the structure visible at the edge of the specimen seems jagged although the average layer height is almost constant. The surface rough aspect of the PF 3D printed material can be an additional factor against improvement of ultimate performance as the surface defects can act as stress concentrators and induce instable cracking. For the case of PLA (Figure 10b), the −45°/+45° layups are noticeable even if the stretching of individual filament alter the smooth aspect of the fractured surface. Additionally, the topography of the top surface shows a regular layer height and a smooth aspect of the two-filament thick external frame. This smooth morphology helps to keep a higher elongation at break as shown in a previous work [25].
3.3. Thermal Conductivity Behaviour
Thermal conductivity results of 3D printed PLA and PF at 200 °C are discussed and compared to a reference material [30], namely hemp concrete, known for its good thermal insulation properties and used as an insulator in many construction applications.
The results of thermal conductivity at three imposed temperatures (10 °C, 23 °C, and 40 °C) are shown in Figure 12 for printed PLA and PF at two infill levels (10% and 30%).
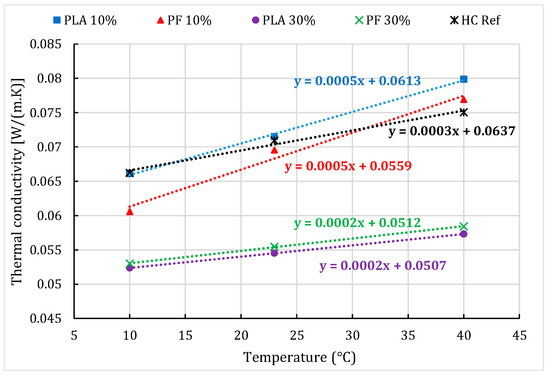
Figure 12.
Thermal conductivity the reference hemp concrete (HC Ref) and the printed PLA and PF at 200 °C at two infills (10% and 30%).
All tested samples have a low thermal conductivity ranging between 0.05 W·m−1·K−1 and 0.08 W·m−1·K−1 and the thermal conductivities of the printed structures are relatively identical to those of the reference hemp concrete (HC_Ref). With these values, the tested materials demonstrate a good thermal resistance and, thus, a good thermal insulation capacity. However, the thermal conductivity of both PLA and PF for a filling rate of 10% is more sensitive to the imposed temperature compared to an infill of 30% as we can clearly notice based on the coefficient of their slopes presented in Figure 12. The difference between PLA and PF behaviour is more evident for the samples printed with an infill of 10% than for the 30%. Moreover, the samples printed with an infill of 30% exhibit the lowest thermal conductivity regardless of the type of the filament.
It can be concluded that thermal conductivity is inversely proportional to the density of the print according to the results shown in Table 3 and Figure 12. This proportionality can be related to the amount of nearly closed airy cells in the prints, which are illustrated through the trajectory patterns in Figure 1. The air has a typical thermal conductivity lower than PLA and PF dense materials. The number of air cells is an important factor acting on the improvement of the thermal isolation of the printed specimens. The infill rate of 30% provides a larger number of cavities than 10%, these air cavities separated by the cell wall printed with PLA or PF act as barriers and then slow down the heat transfer through the printed specimens. This allows us to conclude that the number of cavities is more important than the air amount in the sample. This statement should be further investigated in a future work by considering other infill rates different in a boarder range in order to determine the optimal infill rate and thus the number of air cells to achieve the most efficient insulating printed structure.
3.4. Temperature and Relative Humidity Evolutions
The experimental conditions corresponding to an infill of 10% are selected as a candidate condition that offers a good compromise between material consumption and isolation performance (with respect to hemp concrete according to Figure 12). The results of thermal and humidity cycling in the climatic chamber of both PL and PF printed at 200 °C with an infill of 10% are shown in Figure 13 and Figure 14 for the two considered depths. The temperature results collected from the sensors are shown in Figure 13. The temperature variations at the two depths during the cycling are almost the same for PLA and PF. The temperature responses recorded follow closely the climatic chamber excitation (Figure 13). This result can be explained by a rapid thermal kinetics compared to hemp concrete. However, deviations can be observed on the temperature amplitudes between PLA and PF. If sensor uncertainty and/or contact thermal resistance at the drilled positions are neglected, even these small variations indicate thermal exchange more important for PF than PLA. This result might be surprising knowing the thermal insulation of natural fibres. These changes can be also interpreted in terms of water uptake and possible modification of the thermal properties of flax fibres. However, another explanation can be related to the role of defects especially the presence of intra-filament porosity revealed as main difference between PLA and PF by SEM (Figure 10). The differences lead to a more permeable cell wall in PF in comparison to PLA and thus to higher thermal conductivity.
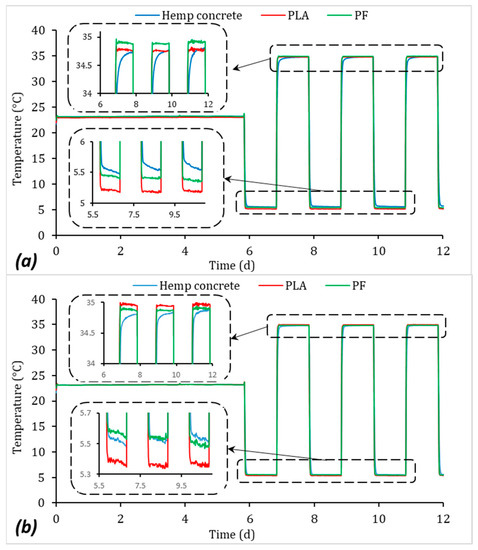
Figure 13.
Temperature evolution within the studied samples (infill 10%) at a depth of (a) 2.5 cm and (b) 5 cm.
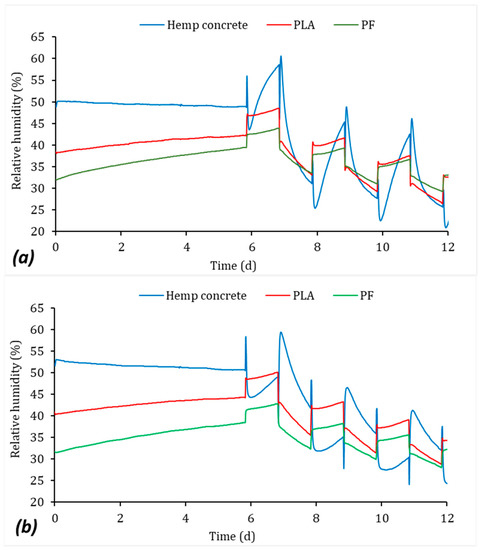
Figure 14.
Relative humidity evolution within the studied samples (infill 10%) at a depth of (a) 2.5 cm and (b) 5 cm.
Figure 14 exhibits the relative humidity evolution in the studied materials at the same depths. The results show that despite six days of preconditioning at a relative humidity of 50%, PLA and PF demonstrate the same hydric behaviour, which does not stabilise during the preconditioning period. During the period of preconditioning, it appears for the PLA sample that the sensor at deeper location (5 cm) responds faster than the one nearer to the surface (2.5 cm). A possible explanation is the presence of the cohesive external frame that may delay the transfer between the core of the specimen and the skin. A further exploration of the effect of frame thickness is needed, which is beyond the limits of this work. In addition, there is almost a steady water uptake for both materials, which is confirmed at both sensor positions. This water uptake contrasts with the stable behaviour of hemp concrete during the preconditioning step with the exception of the presence of disturbances in form of peaks at the set points. These peaks are due to the sensitivity of hemp concrete to the thermodiffusion phenomenon, where the heat transfer affects the mass transfer for this material [31,32,33].
With regard to the cycling behaviour, the response of printed PLA and PF materials to the applied hydric solicitations appears to be slower compared to that of hemp concrete. This can be explained by the low water vapor permeability of these two materials (PLA and PF) compared to the one of hemp concrete, which is known by its high water vapor permeability [30]. It can be concluded that the printed materials exhibit promising mass transfer kinetics compared to hemp concrete and can be stated as good thermal insulators with a low vapor permeability. These results promote printed PLA and PF as candidates for insulation envelopes for both indoor and outdoor applications.
4. Conclusions
This study concludes with the high potential of PLA and PF 3D printed materials as candidates for insulation materials by 3D printing. Based on thermal degradation kinetics of PLA and PLA-flax fibre materials determined by DSC-TGA, the weight content of flax fibre is determined as 20% in the as-received PLA-flax filament. The effect of extrusion of PLA and PF is found to negatively affect the glass transition of raw materials. However, changing the extrusion temperature from 200 °C to 220 °C does not lead to significant effect. The presence of flax fibres in PLA filament has two main drawbacks: porosity and rough surface state. Both drawbacks are demonstrated to have a direct effect on the layups and surface state of the printed materials. Regarding the thermal properties, PLA and PF demonstrate low thermal conductivity compared to hemp concrete with a nearly linear increase with the temperature increase. Hygrothermal solicitation response of printed PLA and PF concludes on a slow water exchange kinetics which contrasts with the fast kinetics observed for hemp concrete. The delayed response of PF is more important than PLA, which promote this material as a candidate for 3D printing insulators for construction applications.
Author Contributions
Conceptualization, A.E.A.H., S.G. and S.B.; methodology, A.E.A.H. and S.G.; validation, A.E.A.H., S.G. and S.B.; formal analysis, Y.E.B., F.B. and A.E.A.H.; investigation, Y.E.B., F.B., A.E.A.H. and S.G.; resources, A.E.A.H., S.G. and S.B.; data curation, Y.E.B., F.B., A.E.A.H. and S.G.; writing—original draft preparation, Y.E.B., F.B. and A.E.A.H.; writing—review and editing, A.E.A.H., S.B. and F.B.; visualization, Y.E.B., A.E.A.H. and S.G.; supervision, A.E.A.H., S.G. and S.B.; project administration, S.G.; funding acquisition, A.E.A.H. and S.G. All authors have read and agreed to the published version of the manuscript.
Funding
This research was funded by INTERREG VA FCE Program, FLOWER project, grant number 23.
Data Availability Statement
Raw data used to produce the results of the study are available from the authors upon request.
Acknowledgments
The authors would like to thank Egle CONFORTO, responsible of the electron microscopy platform of the LaSIE laboratory of La Rochelle University for the technical assistance in SEM acquisition and the Energy saving certificate program of the Ministry of Ecological and Solidarity Transition “SmartReno support” 2019–2021 and the Madur CPER FEDER program for their support to this study.
Conflicts of Interest
The authors declare no conflict of interest.
References
- Pham, D.T.; Gault, R.S. A comparison of rapid prototyping technologies. Int. J. Mach. Tools Manuf. 1998, 38, 1257. [Google Scholar] [CrossRef]
- Yan, X.; Gu, P. A review of rapid prototyping technologies and systems. Comput.-Aided Des. 1996, 28, 307. [Google Scholar]
- Quan, Z.; Wu, A.; Keefe, M.; Qin, X.; Yu, J.; Suhr, J.; Byun, J.-H.; Kim, B.-S.; Chou, T.-W. Additive manufacturing of multi-directional preforms for composites: Opportunities and challenges. Mater. Today 2015, 18, 503. [Google Scholar]
- Lee, C.-Y.; Liu, C.-Y. The influence of forced-air cooling on a 3D printed PLA part manufactured by fused filament fabrication. Addit. Manuf. 2019, 25, 196. [Google Scholar] [CrossRef]
- Hart, K.R.; Wetzel, E.D. Fracture behavior of additively manufactured acrylonitrile butadiene styrene (ABS) materials. Eng. Fract. Mech. 2017, 177, 1. [Google Scholar] [CrossRef] [Green Version]
- Wang, J.; Sama, S.R.; Lynch, P.C.; Manogharan, G. Design and topology optimization of 3D-printed wax patterns for rapid investment casting. Procedia Manuf. 2019, 34, 683. [Google Scholar] [CrossRef]
- Tapia, G.; Elwany, A. A review on process monitoring and control in metal-based additive manufacturing. J. Manuf. Sci. Eng. 2014, 136, 060801. [Google Scholar] [CrossRef]
- Frazier, W.E. Metal additive manufacturing: A review. J. Mater. Eng. Perform. 2014, 23, 1917. [Google Scholar] [CrossRef]
- Song, L.; Jiang, Q.; Shi, Y.-E.; Feng, X.-T.; Li, Y.; Su, F.; Liu, C. Feasibility investigation of 3D printing technology for geotechnical physical models: Study of tunnels. Rock Mech. Rock Eng. 2018, 51, 2617. [Google Scholar]
- Chappell, W.J.; Reilly, C.; Halloran, J.; Katehi, L.P.B. Ceramic synthetic substrates using solid freeform fabrication. IEEE Trans. Microw. Theory Tech. 2003, 51, 752. [Google Scholar] [CrossRef]
- Tang, H.-H.; Yen, H.-C. Slurry-based additive manufacturing of ceramic parts by selective laser burn-out. J. Eur. Ceram. Soc. 2015, 35, 981. [Google Scholar] [CrossRef]
- Kotz, F.; Arnold, K.; Bauer, W.; Schild, D.; Keller, N.; Sachsenheimer, K.; Nargang, T.M.; Richter, C.; Helmer, D.; Rapp, B.E. Three-dimensional printing of transparent fused silica glass. Nature 2017, 544, 337. [Google Scholar] [CrossRef] [PubMed]
- Grant, A. In referees we trust. Phys. Today 2017, 70, 24. [Google Scholar] [CrossRef]
- Praveena, B.A.; Lokesh, N.; Abdulrajak, B.; Santhosh, N.; Praveena, B.L.; Vignesh, R. A comprehensive review of emerging additive manufacturing (3D printing technology): Methods, materials, applications, challenges, trends and future potential. Mater. Today Proc. 2021, in press. [Google Scholar]
- Pajonk, A.; Prieto, A.; Blum, U.; Knaack, U. Multi-material additive manufacturing in architecture and construction: A review. J. Build. Eng. 2022, 45, 103603. [Google Scholar] [CrossRef]
- Vafadar, A.; Guzzomi, F.; Rassau, A.; Hayward, K. Advances in metal additive manufacturing: A review of common processes, industrial applications, and current challenges. Appl. Sci. 2021, 11, 1213. [Google Scholar] [CrossRef]
- Vespalec, A.; Novák, J.; Kohoutková, A.; Vosynek, P.; Podroužek, J.; Škaroupka, D.; Zikmund, T.; Kaiser, J.; Paloušek, D. Interface Behavior and Interface Tensile Strength of a Hardened Concrete Mixture with a Coarse Aggregate for Additive Manufacturing. Materials 2020, 13, 5147. [Google Scholar] [CrossRef]
- Federowicz, K.; Kaszyńska, M.; Zieliński, A.; Hoffmann, M. Effect of curing methods on shrinkage development in 3D-printed concrete. Materials 2020, 13, 2590. [Google Scholar] [CrossRef] [PubMed]
- Chen, Y.; Zhang, Y.; Pang, B.; Liu, Z.; Liu, G. Extrusion-based 3D printing concrete with coarse aggregate: Printability and direction-dependent mechanical performance. Constr. Build. Mater. 2021, 296, 123624. [Google Scholar] [CrossRef]
- Chen, Y.; He, S.; Gan, Y.; Çopuroğlu, O.; Veer, F.; Schlangen, E. A review of printing strategies, sustainable cementitious materials and characterization methods in the context of extrusion-based 3D concrete printing. J. Build. Eng. 2022, 45, 103599. [Google Scholar] [CrossRef]
- Amran, M.; Abdelgader, H.S.; Onaizi, A.M.; Fediuk, R.; Ozbakkaloglu, T.; Rashid, R.S.M.; Murali, G. 3D-printable alkali-activated concretes for building applications: A critical review. Constr. Build. Mater. 2022, 319, 126126. [Google Scholar] [CrossRef]
- Souza, M.T.; Ferreira, I.M.; de Moraes, E.G.; Senff, L.; de Oliveira, A.P.N. 3D printed concrete for large-scale buildings: An overview of rheology, printing parameters, chemical admixtures, reinforcements, and economic and environmental prospects. J. Build. Eng. 2020, 32, 101833. [Google Scholar] [CrossRef]
- Guessasma, S.; Belhabib, S.; Nouri, H. Microstructure and mechanical performance of 3D printed wood-PLA/PHA using fused deposition modelling: Effect of printing temperature. Polym. Test. 2019, 77, 1778. [Google Scholar] [CrossRef] [PubMed] [Green Version]
- Guessasma, S.; Zhang, W.; Zhu, J.; Belhabib, S.; Nouri, H. Challenges of additive manufacturing technologies from an optimisation perspective. Int. J. Simul. Multidiscip. Des. Optim. 2016, 6, A9. [Google Scholar] [CrossRef] [Green Version]
- Belarbi, Y.E.; Guessasma, S.; Belhabib, S.; Benmahiddine, F.; Hamami, A.E.A. Effect of printing parameters on mechanical behaviour of PLA-flax printed structures by fused deposition modelling. Materials 2021, 14, 5883. [Google Scholar] [CrossRef]
- Le Duigou, A.; Castro, M.; Bevan, R.; Martin, N. 3D printing of wood fibre biocomposites: From mechanical to actuation functionality. Mater. Des. 2016, 96, 106. [Google Scholar] [CrossRef]
- Guessasma, S.; Belhabib, S.; Nouri, H. Understanding the microstructural role of bio-sourced 3D printed structures on the tensile performance. Polym. Test. 2019, 77, 105924. [Google Scholar] [CrossRef]
- Guessasma, S.; Belhabib, S.; Nouri, H. Effect of printing temperature on microstructure, thermal behavior and tensile properties of 3D printed nylon using fused deposition modeling. J. Appl. Polym. Sci. 2020, 138, 50162. [Google Scholar] [CrossRef]
- Guessasma, S.; Belhabib, S.; Nouri, H. Significance of pore percolation to drive anisotropic effects of 3D printed polymers revealed with X-ray μ-tomography and finite element computation. Polymer 2015, 81, 29. [Google Scholar] [CrossRef]
- Guessasma, S.; Belhabib, S.; Nouri, H.; Hassana, O.B. Anisotropic damage inferred to 3D printed polymers using fused deposition modelling and subject to severe compression. Eur. Polym. J. 2016, 85, 324. [Google Scholar] [CrossRef]
- Benmahiddine, F.; Bennai, F.; Cherif, R.; Belarbi, R.; Tahakourt, A.; Abahri, K. Experimental investigation on the influence of immersion/drying cycles on the hygrothermal and mechanical properties of hemp concrete. J. Build. Eng. 2020, 32, 101758. [Google Scholar] [CrossRef]
- Belarbi, R.; Qin, M.; Aït-Mokhtar, A.; Nilsson, L.-O. Experimental and theoretical investigation of non-isothermal transfer in hygroscopic building materials. Build. Environ. 2008, 43, 2154. [Google Scholar] [CrossRef]
- Trabelsi, A.; Belarbi, R.; Abahri, K.; Qin, M. Assessment of temperature gradient effects on moisture transfer through thermogradient coefficient. Build. Simul. 2012, 5, 107. [Google Scholar] [CrossRef]
Publisher’s Note: MDPI stays neutral with regard to jurisdictional claims in published maps and institutional affiliations. |
© 2022 by the authors. Licensee MDPI, Basel, Switzerland. This article is an open access article distributed under the terms and conditions of the Creative Commons Attribution (CC BY) license (https://creativecommons.org/licenses/by/4.0/).