Article

Influence of Laser Colour Marking on the Corrosion Properties of Low Alloyed Ti

1
Laboratory for Metals, Corrosion and Anticorrosion Protection, Slovenian National Building and Civil Engineering Institute, Dimičeva 12, SI-1000 Ljubljana, Slovenia
2
Department for Optoelectronics, Jožef Stefan Institute, Jamova 39, SI-1000 Ljubljana, Slovenia
3
Laboratory for Welding LAVAR, Faculty of Mechanical Engineering, University of Ljubljana, Aškerčeva 6, SI-1000 Ljubljana, Slovenia
*
Author to whom correspondence should be addressed.
Coatings 2019, 9(6), 375; https://doi.org/10.3390/coatings9060375
Submission received: 7 May 2019 / Revised: 3 June 2019 / Accepted: 6 June 2019 / Published: 9 June 2019
(This article belongs to the Special Issue Anticorrosion Protection of Nonmetallic and Metallic Coatings)

Abstract

:
In the field of surface treatment, laser colour marking can be used to produce coloured marks on the surfaces of metals. Laser colour markings can be applied to various materials, but on titanium alloys a wide spectra of vivid colours can be achieved. This study presents an analysis of the corrosion properties of laser treated surfaces that were exposed to aggressive environments. Different samples were prepared with laser light of various power intensities and processing speeds. The samples were prepared on low alloyed Ti. Electrochemical, spectroscopic and microstructural analyses were conducted in order to study the properties of the laser treated surfaces. Corrosion testing showed different effects of laser power and production speed on the properties of the laser treated surfaces. It was shown that a high intensity and slow processing rate affect the surfaces by forming oxides that are relatively stable in a corrosive environment of 0.1 M NaCl. Spectroscopic investigations including scanning electron microscopy (SEM) and X-ray photoelectron spectroscopy (XPS) analyses showed the differences in chemical structure of the surface layer formed after laser treatment. Similarly, microstructural investigations showed different effects on the surface and sub-surface layer of the laser treated samples.

Graphical Abstract

1. Introduction

The aims of this study were to study the properties of laser treated Ti surfaces and to study the effect on corrosion resistivity in a 0.1 M NaCl solution.
The marking of surfaces is widely used in industry in order to distinguish industrial products from each other or to provide certain information to the customers through bar codes or similar marks [1,2]. Some producers use marking to distinguish their original parts. Marking can be completed on plastics and different metals [3,4,5,6,7,8,9,10,11,12]. On certain metals and/or alloys, like stainless steels, nickel alloys, chrome plated steel, aluminium and titanium alloys, marks of different colours can be obtained [5,6,7,8,9,10,11,12]. This effect is generally used in the automotive, electronics, telecommunications and pharmaceutical industries for general consumer goods and high-end products, for decorative purpose and advertising, in the production of jewellery and even art [12,13,14,15,16,17,18,19,20].
There are various technologies used to produce markings, including printing, plasma treatment [11,21], electrochemical treatment, magnetron sputtering, micro-arc oxidation [22,23], anodising [1,8,24], cold spray [17] and laser induced oxidation [1,2,9,25]. The most important advantages of laser induced oxidation are that the process is non-contact and that the marking of smaller surfaces can be made fast at relatively low cost. The produced markings are very sharp, reproducible and precise. Another benefit is that the process enables flexible change of marking colours on the fly with respect to laser processing parameters [6,13,14,15,16].
Titanium and its alloys have several specific properties, like good strength to weight ratio, high strength, good chemical stability, high temperature stability, biocompatibility, corrosion resistance and resistance to fatigue and wear, and can be heat treated or surface treated in order to achieve particular hardness and strength [11,26].
Laser induced oxidation of metals is a gaseous high-temperature corrosion process, where thin layers of oxides or other more complex oxidation formations are formed. With this process, different colours can be produced on the titanium surface. During laser oxidation, titanium oxides are formed at the surface if the marking is carried out in an oxidative atmosphere. Titanium oxides are not expensive, biocompatible, non-toxic and mechanically and chemically stable [16]. On the surfaces, there are thin layers present in the form of anatase, brookite, rutile or in the amorphous phase [6,13,16]. In the white light spectrum, they are highly transparent and exhibit a wide spectrum of vivid colours as a result of the interference between white light and the borders between different phases. The obtained colours depend on the thickness of the oxide layer, refractive index and the interference between light and incidence angle [6,13,15,27]. There are many laser parameters, such as pulse duration, pulse repetition rate, pulse energy, focal position of laser beam and processing parameters, such as scanning speed, hatching distance, laser fluence and scanning strategy, that change the properties of the produced compounds and the thickness of the oxide layers. Among these parameters, the produced colours, i.e., layer thickness and its composition, are directly affected by scanning speed, while the reproducibility of colours is highly sensitive to hatching distance at constant laser parameters. Researchers have also noted that other parameters, such as material surface temperature and laser fluence, have an influence on the produced colour but are hard to control if the size and shape of the product is changing [6,13,14,15,16,28].
The reactions and their product compositions are based on thermodynamic data and kinetic coefficients. Since laser induced oxidation is usually done in an air atmosphere (mixture of gases), the processes are non-isothermal and thus the oxidation results are usually very complex. Different authors have reported that observed layers consisted of different titanium oxides, namely, TiO, TiO2, Ti2O and Ti2O3 [6,7,12,16]. Adams et al. [29] performed the analysis using nanosecond fibre laser marking of titanium grade 2. They reported that the surface coating is made of three layers, TiO2 (top), TiO (middle) and a bottom layer, which is an inhomogeneous mixture of Ti, O and N, from which only the two top layers are optically transparent. Researchers have proposed two- and three-layer models of coatings, where the three-layer model is made of (TiO2/TiO/Ti6O + TiOxN1−x) [6,16]. Some authors also pointed out a TiN phase and its influence on the mechanical properties of the surface [13]. Antonzcak et al. [16] studied the presence of nitrogen compounds and the existence of nonstoichiometric factors (TiN0.26, TiN0.22O0.78 and TiO0.892) using X-ray photoelectron spectroscopy (XPS) and X-ray diffraction (XRD) analyses. They showed that the top layer of the coating is not made of pure TiO2 [16].
Perez del Pino et al. [7] reported that they obtained a coating layer thickness of between 0.1 and 10 µm, and that the thickness depends on the laser fluence. Adams et al. [29] showed that the visually transparent part of the coating layer is made of TiO2 and TiO, and its thickness is between 10 and 120 nm.
Analysis of the morphology showed that rapid heating and cooling of the surface during laser marking causes high temperature gradients, which cause the formation of a channel micro-crack network [13]. The micro-cracks have an influence on the diffusion rate of oxygen, they change the reaction speed and composition of the produced layer and its effect on corrosion resistance [15,30], and could cause the delamination problems if laser marking is done with inappropriate fluence. However, the adhesion between the oxide layer and the titanium surface is good, as stated by Akman et al. [13]. The scanning speed also has an influence on the grain size, which becomes larger if the scanning speed is smaller. Akman et al. [13] also showed that laser surface treatment has an influence on the scratch hardness, which becomes higher if the scanning speed is smaller. Antonzak et al. [16] showed that the values of the roughness parameters become smaller if the laser fluence increases. Such a layer hardens, thus as reported, the durability of titanium is reduced [31]. So far, corrosion testing has been performed on martensitic and austenitic stainless steels in Ringers’ solution in order to study the degradation of identification marks on surgical tools and prostheses [32].
In this study, different microstructural and spectroscopic investigations have been used to evaluate the effect of laser on Ti-based materials. XPS was used to study the surface properties of treated materials and the influence of the laser power and the scan rate of the laser. Electrochemical techniques, such as potentiodynamic and electrochemical impedance spectroscopy were used in order to study electrochemical properties of newly formed oxide films, as well as their stability in slightly saline solution simulating road conditions.

2. Materials and Methods

2.1. Preparation of Samples

Samples from low alloyed Ti were prepared in a shape of discs of Φ = 16 mm, cut from 1.5-mm-thick foil. Composition is given in Table 1. The studied Ti alloy is suited for automotive and other industrial applications [33]. It exhibits superior oxidation resistance at elevated temperatures compared to other commercially pure Ti [33].
Ti sheets were treated by shot-peening process using stainless steels beads (appearance of Fe and Cr). The samples were ultrasonically cleaned in ethanol for 3 min prior to laser treatment and prior to the measurements. Laser induced colour marking was done using a Speedy 400 flexx engraving machine (Trotec, Marchtrenk, Austria). The deflection of the laser beam on the desired surface of the substrate was completed using a CNC- computed numeric control) table. The colour marking was completed using a Yb glass fibre laser with a wavelength of 1064 nm, an average output power of up to 30 W, a peak power output of up to 15 kW, a pulse energy of 1 mJ, a pulse duration between 4 and 200 ns and beam quality factor M2 ≤ 1.5 (YLPN, IPG, Burbach, Germany-1-4x200-30-M). The constant colour marking parameters were a pulse repetition rate (PRR) at 35 kHz and defocus at −2 mm, with an air atmosphere present during marking that was done at 500 dpi. During the marking, the fibre laser power and marking speed changes according to Table 2.

2.2. Microstructural Examination

Samples for metallographic investigation were etched in a solution of 100 mL of H2O, 2 mL of HF and 5 mL of conc. HNO3 for 2 min. Shortly afterwards, an optical microscopy study was conducted at different magnifications. The number of inclusions was estimated at scans with a magnification of 20×.

2.3. Electrochemical Measurements

The test solution was 0.1 M NaCl. A three-electrode corrosion cell was used, with a volume of 350 cm3. The working electrode was embedded in a Teflon holder, and had an exposed area of 0.785 cm2. Reference 600+ (Gamry, Warminster, PA, USA) was used for electrochemical measurements. The short electrochemical tests were performed after 1-h stabilisation at open circuit potential (OCP) and included measuring of corrosion potential (1 h), electrochemical impedance spectroscopy (after 1.33 h) followed by potentiodynamic tests. Electrochemical impedance spectroscopy (EIS) measurements at 10 rms, seven points per decade and from 65 kHz to 1 mHz were conducted at open circuit potential. At the end of short-term measurements, the potentiodynamic measurements were performed starting from −0.25 V vs. OCP, and progressing in the anodic direction up to +2.0 V at a scan rate of 1 mV/s. For long-term experiments, EIS was conducted after 24 h and then weekly (1 week, 2 weeks and 3 weeks). All potentials are reported with respect to the saturated calomel electrode (SCE) scale. At least three measurements were performed in order to fulfil the statistical requirements for electrochemical testing [34]. After estimating the mean values of the logarithmic results of corrosion resistance, the measurement that had the closest value to the mean value from the set was chosen to be presented in the graphs.

2.4. Surface Analysis

X-ray photoelectron spectroscopic (XPS) analyses were performed on a PHI-TFA XPS (TFA XPS, Physical Electronics Inc., Chanhassen, MN, USA) instrument equipped with an Al-monochromatic X-ray source. The analysis area was 400 µm in diameter and I XPSHI the analysis depth was ~5 nm, which shows very high surface sensitivity of this method. In order to obtain the subsurface chemical composition, Ar-ion sputtering was performed in addition to XPS analyses. Signals of Ti 2p, O 1s, C 1s, Fe 2p, Si 2p and N 1s were collected during XPS depth profile analyses. An Ar-ion beam of 4 keV scanning over a 3 mm × 3 mm region on the surface was employed for depth profiling. The sputtering rate was estimated to be 1 nm/min measured on a reference sample of known thickness. By XPS depth profiling, a subsurface region of ~25 nm was analysed.
Scanning electron microscopy (SEM) was performed on a low vacuum JEOL 5500 LV scanning electron microscope (JEOL, Akishima, Japan), equipped with Oxford Inca (EDX) energy dispersive spectroscopy (Oxford Instrument Analytical, Abingdon, UK), in order to examine the alloy composition by using an accelerating voltage of 20 kV.

3. Results and Discussion

3.1. Light Mictroscopy and Microstructural Examination

The optical image of the studied surfaces is presented in Figure 1.
The colours were characteristic for high-temperature titanium oxides. The surface of the low alloyed Ti was mechanically treated after rolling the sheet metal (Figure 1a) by a shot peening process. The surface appearance of the laser marked Ti surface (laser 65_3) was lightly cracked (Figure 1b), as observed in a rectangle in Figure 1b. There was a significant number of impurities observed on the surface (Figure 1b). In the case of a higher production speed of a laser (Figure 1c), the surface layer was not completely melted. Traces of the original surface and minor cracks in all directions were visible (white rectangle in Figure 1c). When the laser beam with high power passed, multiple tiny cracks were formed on the surface (depicted in white rectangles in Figure 1d,e), which extended transversely to the direction of the laser beam passage. The cracks were more intensive when the power of the laser was increased and when the processing speed was lowered. The surface of the colour marked samples looked wavy, but this was not visible in the cross section (Figure 2). Cracking is, according to the literature, related to α-Ti phase formation, which is capable of dissolving ~33 at % oxygen and 23 at % nitrogen. This is reported as an oxygen-rich metallic layer, namely, Ti(O) interstitial solid [16].
Laser marked surfaces were metallographically examined in the cross section of the prepared surfaces on disc electrodes. The results are presented in Figure 2.
Low alloyed Ti has a typical microstructure with crystal grains oriented in all directions equally. The mechanical treatment induced the recrystallization layer, which is observed on low alloy Ti and is approximately 11 µm thick. When the surface is laser treated, the heat, produced by the laser, affects the microstructure in the upper layers to some extent. Cross-sectional examination of laser treated surfaces showed that the intensity (power) affects the depth of the changed microstructure. In addition, the effect varies with the production speed of the laser, where the depths of the affected microstructure in µm are presented in Figure 2f. The most affected microstructure, thus, was the microstructure below a surface of low alloyed Ti treated with 100% laser power and lowest production speed (laser_100_3).
The crystal grains became smaller in the range of 1–5 µm, whereas original crystal grains at a depth of 100 to 200 µm were 10–20 µm.

3.2. Electrochemical Measurements in 0.1 M NaCl Solution

Potentiodynamic measurements were made on low alloyed Ti surfaces and laser treated surfaces after 3 h immersion in 0.1 M NaCl. The results are presented in Figure 3. The electrochemical parameters, deduced from the curves, are presented in Table 2.
In the case of low alloyed Ti, it is clearly shown that the Ti surface exhibits passive behaviour, as observed from low passive current densities in the passive region. The breakdown potential, Eb, for low alloyed Ti is at 1.22 V and was estimated at a potential at which transpassive region with slow and steeper increase of a current density is observed (Figure 3). The current density in the pseudo passive region for non-treated low alloyed Ti is the highest among the tested samples. Samples treated with 100% laser at the highest marking speed (6%), lowest power (65%) and 3% marking speed have the second highest current density in the passive region whereas the corrosion current density is increased. Surfaces that were treated with the highest power of 100% and a smaller marking speed exhibited the smallest corrosion current density in the anodic region. Furthermore, the smallest corrosion current density jcorr was measured for 100% power and 4% marking speed at 16.7 nA·cm−2. The breakdown potential is not affected to a great extent. The passivity region ΔE (EbEcorr) in Table 3 shows that the width of a passive region is wider for laser treated surfaces.
In Figure 4 the representative impedance measurements are presented in the form of a Nyquist and Bode plot for low alloyed Ti and laser treated Ti surface (laser_100_3) after 1.33 h immersion time during short term experiments. For short term experiments, the total impedance at lowest measured frequency, |Z|, for low alloyed Ti and surface treated Ti (sample Ti laser_100_3) was 2.01 and 1.98 MΩ·cm2, respectively.
The impedance spectra for short term experiments were fitted with the equivalent circuit presented in Figure 4. Equivalent circuit consists of parallel combination of resistance and capacitance elements (RQ) that are in series with Re, electrolyte resistance. The circuit represents just one of possible equivalent circuits that are adequate to fit the impedance spectra. This model was chosen on the basis of Pan et al. to describe a bi-layer structure of oxide film on titanium in a saline environment [35]. The film, that forms on Ti based alloy, also exhibits a two layer structure with a dense inner layer of TiO2 and porous outer layer.
The high frequency parameters R1 and Q1 represent the properties of the outer porous and passive film/solution interface reactions. The symbol Q signifies the possibility of a non-ideal capacitance (CPE, constant phase element). A CPE is usually used to describe non-ideal capacitive behaviour due to uneven current distribution or surface inhomogeneity providing the exponent n is close to unity. The impedance of the CPE is given by [36]:
Q = ZCPE(ω) = [C(jω)n]−1
for n = 1, the Q element reduces to a capacitor with a capacitance C and, for n = 0, to a simple resistor. The values of parameter n around 0.5 indicate the diffusion process through the pores of oxide film.
The process in the low frequency range describes the capacitance of the barrier layer (Q2) at the electrolyte/dense passive film interface. R2 is the charge transfer resistance. The values of fitted parameters of the equivalent circuit at initial immersion time for low alloyed Ti and laser treated Ti surface are presented in Table 4.
The parameter Re has a value from 15 to 87 Ω·cm2 and is ascribed to electrolyte resistance. R1 values are smaller than R2 values as large values for R2 are observed for tested materials, showing that the oxide film on Ti alloy and laser treated surfaces has a large resistance. It is seen that R1 is less than 1 kΩ·cm2. These values show that the porous layer formed has a very low resistance. CPE, denoted as Q1 and Q2 were recalculated using equation C1 = [R11−n × Q1]1/n [37] in order to compare capacitance values for Ti alloy. C1 is attributed to the properties of outer oxide layer, while C2 is in general increasing with the power of laser treatment and could be attributed to more compact inner dense layer.
In order to observe the long-term stability of films on Ti surfaces in corrosive solutions, electrochemical impedance measurements on low alloyed Ti and surface treated Ti were conducted after 24 h and subsequently every week in 3 week exposure time. The impedance magnitude at the measured low frequency limit, |Z|f0 (f ˂ 0.001 Hz) is presented in Figure 5. It is in the order of MΩ·cm2 at initial time and steadily increases in the case of laser treated surfaces, or decreases in the case of low alloyed Ti surface and Ti sample treated with low power and high production speed (Ti_laser_65_3). The total impedance of the low alloyed Ti and laser treated Ti surfaces at different immersion times during long term experiment is presented in Figure 5.
It can be observed that the total impedance of low alloyed Ti decreases with exposure time. The laser marked surfaces with the smallest power (Ti-laser-65-3) also experienced the total impedance decrease over exposure time. For all other observed laser treated surfaces, it can be observed that total impedance increases with time, pointing at the fact that the stable passive film was formed, which with exposure to aggressive electrolyte increases the corrosion stability of the laser treated films.

3.3. XPS Analysis

XPS analyses were performed on three samples: Non-treated low alloyed Ti sample, non-treated low alloyed Ti sample after exposure to 0.1 M NaCl solution for 3 weeks and laser marked Ti surface with 100% power and 3% production speed of a laser (sample Ti_laser_100_3), subsequently exposed to 0.1 M NaCl solution for 3 weeks. The surface of the last sample had a blue colour, as shown in Figure 1e.
XPS survey spectra were acquired on the surface of these samples and at the depth of 25 nm. XPS survey spectra are presented in Figure 6.
Survey spectra for low alloyed Ti and that after exposure to the corrosive environment were similar (Figure 6a). No obvious difference in the survey spectra can be observed. Signals of O 1s, Ti 2p and Cr 2p, Fe 2p, Si 2p, Si 2s, as well as C 1s and Ca 2p, were present on the surface of low alloyed Ti (Figure 6a). This shows that surface treatment of low alloyed Ti sample yields Fe and Cr elements on the surface. At the surface of laser marked surface (Ti-laser_100_3) and exposed to corrosive environment only O, Ti and C were present with minor traces of N (Figure 6a).
In the subsurface region, at the depth of ~25 nm, Ti and Cr/Fe were present on low alloyed Ti samples, on laser marked surface only Ti and O were present (Figure 6b).
Figure 7 shows high energy resolution Ti 2p spectra of low alloyed Ti before exposure to 0.1 M NaCl solution and of laser marked Ti surface Ti-100-3 before exposure to 0.1 M NaCl solution at the surface and at a depth of 25 nm. The Ti 2p3/2 peak on the surface of both samples is at 458–459 eV what is assigned to Ti(4+) oxidation state in the surface TiO2 oxide. After sputtering at depth of 25 nm on the laser non-marked sample Ti 2p3/2 peak was at 454 eV (Figure 7a) showing metallic phase of Ti. On the laser marked sample at depth of 25 nm Ti 2p3/2 peak showed many subpeaks ranging from 454 to 459 eV (Figure 7b) presenting different Ti-oxidation states from Ti(0) to Ti(4+). Such mixed spectrum of Ti oxidation states is a typical result of ion sputtering of TiO2 when the reduction of Ti(4+) state is a consequence of preferential sputtering of oxygen from TiO2 oxide [38]. However, also in this case, TiO2 was present at depth of 25 nm which was the maximum depth reached during depth profiling.
Figure 8 shows the XPS depth profiles of four analysed samples presenting changes in chemical composition with a depth of up to ~25 nm. In Figure 8a,b, no curves for Cr are presented (~10 at %) although Cr was present in the surface layer, as proved by analyses after XPS depth profiling (Figure 6b). From Figure 6a, it follows that low alloyed Ti sample was covered by a ~10 nm thick mixed TiO2/FeCr oxide layer (Figure 7a). On the surface, some traces of Ca and Si were also found. Beneath the surface oxide layer, a Ti–(Fe/Cr) layer was present. In the subsurface region oxygen and carbon concentrations did not decrease to 0% but they persist at significantly high level. We explained the presence of O and C as adsorption of O- and C-based species from residual vacuum atmosphere to fresh and very reactive Ti surface which was exposed during Ar bombardment. In addition, the relatively rough sample surface produced by shot peening induced shadowing effects for Ar ion bombardment resulting in not complete and non-uniform removal of adsorbed layer of O and C species. The adsorption effect of C and O was observed for all four samples being larger for laser non-treated samples (more metallic composition) than for laser treated samples containing less reactive surface oxide layer (described below).
The low alloyed Ti sample after exposure to the corrosive environment of 0.1 M NaCl had a similar surface composition as the surface low alloyed Ti before exposure. Low alloyed Ti after exposure was also covered by a ~10 nm thick mixed TiO2/FeCr-oxide layer. On the surface, some N and Si were also present. The origin of C in the subsurface region is the same as described above. Beneath the surface oxide layer, a Ti–(Fe/Cr) layer was present. The concentration of Fe/Cr steel phase in the subsurface region was higher than on the low alloyed Ti before exposure, which may be related to the exposure with the 0.1 M NaCl solution.
The surface and subsurface region of the laser marked sample (Ti-Laser_100_3) after exposure to the corrosive environment were substantially different from the samples of low alloyed Ti before and after exposure, which was related to different treatments. The laser marked surface of a sample was covered by a thicker TiO2 layer when compared to low alloyed Ti samples. This thicker TiO2 layer was related to the laser treatment. A notable difference in the laser treated sample with respect to low alloyed Ti samples was that no Fe and Cr, as well as no Si, were found on the TiO2 surface layer. After exposure to 0.1 M NaCl, the laser treated surface was very similar to the surface before exposure to the corrosive environment.
XPS analysis showed that low alloyed Ti samples were different from the laser marked Ti surface. The main difference was in the chemical structure of the surface oxide film. This was a 10 nm thick layer of Ti–(Fe/Cr) oxides for the low alloyed Ti surface. This oxide layer did not change much with exposure to the aggressive 0.1 M NaCl solution. The TiO2 layer on the laser treated sample was thicker (at least 25 nm what was the largest depth reached by depth profiling) and did not contain elements like Fe, Cr and Si introduced by surface modification of the low alloyed Ti sample.
The more expressed corrosion resistance evidenced from Figure 5 for the laser treated Ti surface over the non-treated surface can be explained by the presence of Fe and Cr over Ti in the oxide film present on the non-treated surface of low alloyed Ti sample.
Comparing the results of XPS analysis, it can be concluded that mainly TiO2 film of thicknesses more than 25 nm improves corrosion properties of laser treated surfaces, since TiO2 film, of protective nature, is formed by laser treatment.

4. Conclusions

Microstructural, electrochemical and surface analyses were performed on laser marked low alloyed Ti surfaces in order to study the effect of laser treatment on the microstructural, physical and corrosion properties of such surfaces in a corrosive environment.
  • The depth of microstructural changes in the cross-sections of laser treated surfaces was related to the laser power and production speed of the laser. It was the highest for 100% power and the lowest production speed of the laser.
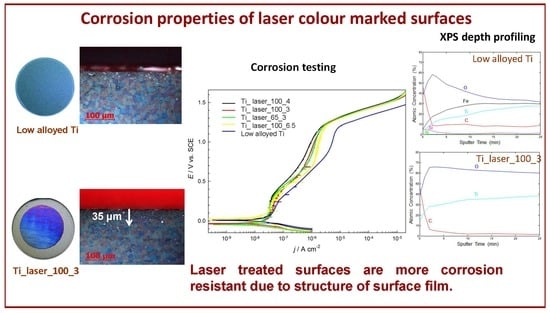
  • Corrosion properties were studied by potentiodynamic measurements and electrochemical impedance spectroscopy. It was found that laser treated surfaces exhibited lower current densities in the passive region, while the stability of such surfaces is enhanced in long-term exposure in an aggressive environment.
  • XPS analysis showed that the low alloyed Ti surface was different from the laser marked surface.
  • A mixture of Ti and Fe/Cr oxides of thickness of 10 nm was found on low alloyed Ti surfaces, however mainly pure TiO2 oxide layer was detected on laser marked surfaces. TiO2 oxide was thicker (25 nm) than those on laser non-treated surface (about 10 nm).
  • Different constitution and thickness of oxide layer of low alloyed Ti surface (Cr and Fe presence in TiO2 surface film) and laser marked surfaces (thick TiO2) affected long-term corrosion susceptibility. Low alloyed Ti surfaces were less stable than laser marked surfaces.

Author Contributions

Conceptualization, T.K. and D.K.; Investigation, J.K., D.K. and T.K.; Writing—Original Draft Preparation, T.K. and D.K.; Supervision, A.L.; Writing—Review and Editing, T.K., D.K., A.L. and J.K.

Funding

This research was funded by the Slovenian Research Agency (research core Funding No. P2-0270, P2-0082 and P2-0273, and Project No. L2-8181).

Acknowledgments

The help of the laboratory staff, Viljem Kuhar and Rok Tomšič, is hereby gratefully acknowledged.

Conflicts of Interest

The authors declare no conflict of interest.

References

  1. Ng, T.; Yeo, S. Aesthetic laser marking assessment using luminance ratios. Opt. Lasers Eng. 2001, 35, 177–186. [Google Scholar] [CrossRef]
  2. Zheng, H.; Lim, G.C. Laser-effected darkening in TPEs with TiO2 additives. Opt. Lasers Eng. 2004, 41, 791–800. [Google Scholar] [CrossRef]
  3. Liu, C.; Lu, Y.; Xiong, Y.; Zhang, Q.; Cao, Z. Recognition of laser-marked quick response codes on polypropylene surfaces. Polym. Degrad. Stab. 2018, 147, 115–122. [Google Scholar] [CrossRef]
  4. Zelenska, K.; Zelensky, S.E.; Poperenko, L.V.; Kanev, K.; Mizeikis, V.; Gnatyuk, V.A. Thermal mechanisms of laser marking in transparent polymers with light-absorbing microparticles. Opt. Laser Technol. 2016, 76, 96–100. [Google Scholar] [CrossRef]
  5. Fujimoto, S.; Tsujino, K.; Shibata, T. Growth and properties of Cr-rich thick and porous oxide films on Type 304 stainless steel formed by square wave potential pulse polarisation. Electrochim. Acta 2001, 47, 543–551. [Google Scholar] [CrossRef]
  6. Antonczak, A.J.; Stepak, B.; Koziol, P.E.; Abramski, K.M. The influence of process parameters on the laser-induced coloring of titanium. Appl. Phys. A 2014, 115, 1003–1013. [Google Scholar] [CrossRef]
  7. Del Pino, A.P.; Serra, P.; Morenza, J. Oxidation of titanium through Nd: YAG laser irradiation. Appl. Surf. Sci. 2002, 197, 887–890. [Google Scholar] [CrossRef]
  8. Diamanti, M.V.; Del Curto, B.; Pedeferri, M. Interference colors of thin oxide layers on titanium. Color Res. Appl. 2018, 33, 221–228. [Google Scholar] [CrossRef]
  9. Veiko, V.; Odintsova, G.; Gorbunova, E.; Ageev, E.; Shimko, A.; Karlagina, Y.; Andreeva, Y. Development of complete color palette based on spectrophotometric measurements of steel oxidation results for enhancement of color laser marking technology. Mater. Des. 2016, 89, 684–688. [Google Scholar] [CrossRef]
  10. Penide, J.; Quintero, F.; Riveiroa, A.; Fernández, A.; del Val, J.; Comesaña, R.; Lusquiños, F.; Pou, J. High contrast laser marking of alumina. Appl. Surf. Sci. 2015, 336, 118–128. [Google Scholar] [CrossRef]
  11. Durdu, S.; Usta, M.; Berkem, A.S. Bioactive coatings on Ti6Al4V alloy formed by plasma electrolytic oxidation. Surf. Coat. Technol. 2016, 301, 85–93. [Google Scholar] [CrossRef]
  12. O’Hana, S.; Pinkerton, A.J.; Shoba, K.; Gale, A.W.; Li, L. Laser surface colouring of titanium for contemporary jewellery. Surf. Eng. 2008, 24, 147–153. [Google Scholar] [CrossRef] [Green Version]
  13. Akman, E.; Cerkezoglu, E. Compositional and micro-scratch analyses of laser induced colored surface of titanium. Opt. Lasers Eng. 2016, 84, 37–43. [Google Scholar] [CrossRef]
  14. Amara, E.; Haid, F.; Noukaz, A. Experimental investigations on fiber laser color marking of steels. Appl. Surf. Sci. 2015, 351, 1–12. [Google Scholar] [CrossRef]
  15. Antończak, A.J.; Kocoń, D.; Nowak, M.; Kozioł, P.; Abramski, K.M. Laser-induced colour marking—Sensitivity scaling for a stainless steel. Appl. Surf. Sci. 2013, 264, 229–236. [Google Scholar] [CrossRef]
  16. Antończak, A.J.; Skowroński, Ł.; Trzcinski, M.; Kinzhybalo, V.V.; Łazarek, Ł.K.; Abramski, K.M. Laser-induced oxidation of titanium substrate: Analysis of the physicochemical structure of the surface and sub-surface layers. Appl. Surf. Sci. 2015, 325, 217–226. [Google Scholar] [CrossRef]
  17. Astarita, A.; Genna, S.; Leone, C.; Minutolo, F.M.C.; Squillace, A.; Velotti, C. Study of the laser marking process of cold sprayed titanium coatings on aluminium substrates. Opt. Laser Technol. 2016, 83, 168–176. [Google Scholar] [CrossRef]
  18. Qi, J.; Wang, K.; Zhu, Y. A study on the laser marking process of stainless steel. J. Mat. Process. Technol. 2003, 139, 273–276. [Google Scholar] [CrossRef]
  19. Salou, L.; Hoornaert, A.; Louarn, G.; Layrolle, P. Enhanced osseointegration of titanium implants with nanostructured surfaces: An experimental study in rabbits. Acta Biomater. 2015, 11, 494–502. [Google Scholar] [CrossRef]
  20. Veiko, V.; Karlagina, Y.; Moskvin, M.; Mikhailovskii, V.; Odintsova, G.; Olshin, P.; Pankin, D.; Romanov, V.; Yatsuk, R. Metal surface coloration by oxide periodic structures formed with nanosecond laser pulses. Opt. Lasers Eng. 2017, 96, 63–67. [Google Scholar] [CrossRef]
  21. Teng, K.; Delplancke, J.-L.; Zhang, J.; O’Keefe, T.J. Electrochemical characterization of copper deposited on plasma and thermally modified titanium surfaces. Metall. Mater. Trans. B 1998, 29, 749–754. [Google Scholar] [CrossRef]
  22. Wang, H.-Y.; Zhu, R.-F.; Lu, Y.-P.; Xiao, G.-Y.; Ma, X.-N.; Li, Y. Structures and properties of layered bioceramic coatings on pure titanium using a hybrid technique of sandblasting and micro-arc oxidation. Appl. Surf. Sci. 2013, 282, 271–280. [Google Scholar] [CrossRef]
  23. Zhao, B.; Zhao, B.H.; Zhang, W.; Wang, D.N.; Feng, W.; Liu, Y.; Lin, Z.; Du, K.Q.; Deng, C.F. Effect of Zn content on cytoactivity and bacteriostasis of micro-arc oxidation coatings on pure titanium. Surf. Coat. Technol. 2013, 228, S428–S432. [Google Scholar] [CrossRef]
  24. Diamanti, M.V.; Del Curto, B.; Masconale, V.; Pedeferri, M. Production and anodic colouring of newly-designed titanium jewels. Colour Des. Creat. 2010, 16, 1–9. [Google Scholar]
  25. Lavisse, L.; Grevey, D.; Langlade, C.; Vannes, B. The early stage of the laser-induced oxidation of titanium substrates. Appl. Surf. Sci. 2002, 186, 150–155. [Google Scholar] [CrossRef]
  26. Banerjee, D.; Williams, J. Perspectives on titanium science and technology. Acta Mater. 2013, 61, 844–879. [Google Scholar] [CrossRef]
  27. Li, Z.; Zheng, H.Y.; Teh, K.M.; Liu, Y.C.; Lim, G.C.; Seng, H.L.; Yakovlev, N.L. Analysis of oxide formation induced by UV laser coloration of stainless steel. Appl. Surf. Sci. 2009, 256, 1582–1588. [Google Scholar] [CrossRef]
  28. Kasman, S. Impact of parameters on the process response: A Taguchi orthogonal analysis for laser engraving. Measurement 2013, 46, 2577–2584. [Google Scholar] [CrossRef]
  29. Adams, D.; Murphy, R.D.; Saiz, D.J.; Hirschfeld, D.A.; Rodriguez, M.A.; Kotula, P.G.; Jared, B.H. Nanosecond pulsed laser irradiation of titanium: Oxide growth and effects on underlying metal. Surf. Coat. Technol. 2014, 248, 38–45. [Google Scholar] [CrossRef]
  30. Kung, K.-C.; Lee, T.-M.; Lui, T.-S. Bioactivity and corrosion properties of novel coatings containing strontium by micro-arc oxidation. J. Alloys Compd. 2010, 508, 384–390. [Google Scholar] [CrossRef]
  31. Dong, H.; Li, X.Y. Oxygen boost diffusion for the deep-case hardening of titanium alloys. Mat. Sci. Eng. A 2000, 280, 303–310. [Google Scholar] [CrossRef]
  32. Valete, S.; Steyer, P.; Richard, L.; Forest, B.; Donnet, C.; Audoarrd, E. Influence of femtosecond laser marking on the corrosion resistance of stainless steels. Appl. Surf. Sci. 2006, 25, 4696–4701. [Google Scholar] [CrossRef]
  33. Calvert, K.; Kosaka, Y. Evaluation of titanium alloys after High temperature air exposure. In Proceedings of the 13th World Conference on Titanium, San Diego, CA, USA, 16–20 August 2015; The Minerals, Metals & Materials Society: Pittsburgh, PA, USA, 2016. [Google Scholar]
  34. Tait, W.S. An Introduction to Electrochemical Corrosion Testing for Practicing Engineers and Scientists; Ohio State University: Columbus, OH, USA, 1994. [Google Scholar]
  35. Pan, J.; Thierry, D.; Leygraf, C. Electrochemical impedance spectroscopy study of passive oxide film on titanium for implant application. Electrochim. Acta 1996, 41, 1143–1153. [Google Scholar] [CrossRef]
  36. Raistrick, I.D.; MacDonald, J.R.; Francschetti, D.R. Impedance Spectroscopy Emphasizing Solid Materials and Systems; MacDonald, J.R., Ed.; John Wiley & Sons: New York, NY, USA, 1987. [Google Scholar]
  37. Kek-Merl, D.; Lappalainen, J.; Tuller, H.L. Electrical properties of nanocrystalline CeO2 thin films deposited by in situ pulsed laser deposition. J. Electrochem. Soc. 2006, 153, J15–J20. [Google Scholar] [CrossRef]
  38. Hashimonto, S.; Tanaka, A. Alteration of Ti 2p XPS spectrum for titanium oxide by low-energy Ar ion bombardment. Surf. Interface Anal. 2002, 34, 262–265. [Google Scholar] [CrossRef]
Figure 1. Prepared laser colour marking of low alloyed Ti for the samples presented in Table 1. (a) low alloyed Ti; (b) sample Ti_laser_65_3; (c) sample Ti_laser_100_6.5; (d) sample Ti_laser_100_4; (e) sample Ti_laser_100_3.
Coatings 09 00375 g001
Figure 2. Microstructural investigation of laser marked surfaces in a cross-sectional view on low alloyed Ti foil (a), on a sample Ti_laser_65_3 (b), on a sample Ti_100_6.5 (c), on a sample Ti laser_100_4 (d), on a sample Ti_laser_100_3 and (e) the effect on the changed heat affected zone in cross section (f).
Coatings 09 00375 g002
Figure 3. Potentiodynamic polarisation curves for Ti and laser treated Ti surfaces in 0.1 M NaCl solution at a scan rate of 1 mV/s.
Coatings 09 00375 g003
Figure 4. Nyquist and Bode plot for low alloyed Ti and laser treated surface (Ti Laser_100_3) in 0.1 M NaCl after 1.33 h immersion time at short term experiment.
Coatings 09 00375 g004
Figure 5. Total impedance |Z| of Ti surfaces in 0.1 M NaCl during 3-week exposure.
Coatings 09 00375 g005
Figure 6. XPS survey spectra of low alloyed Ti before and after exposure to 0.1 M NaCl solution and laser marked Ti surface Ti-100-3 before and after exposure to 0.1 M NaCl solution; (a) at the surface and (b) at a depth of 25 nm.
Coatings 09 00375 g006
Figure 7. High energy resolution Ti 2p spectra of (a) low alloyed Ti before exposure to 0.1 M NaCl solution and (b) laser marked Ti surface Ti-100-3 before exposure to 0.1 M NaCl solution at the surface and at a depth of 25 nm.
Coatings 09 00375 g007
Figure 8. XPS depth profiles for (a) low alloyed Ti surface, (b) low alloyed Ti surface after exposure to corrosive environment, (c) laser marked Ti- Laser_100_3 sample before and (d) laser marked Ti-Laser_100_3 sample after exposure to corrosive environment. Sputtering rate was ~1 nm/min.
Coatings 09 00375 g008
Table 1. Chemical composition of low alloyed Ti, analysed by energy-dispersive X-ray spectroscopy (EDS, Inca, Oxford, UK).
ElementSiAlCrFeTi
Content (wt %)0.480.41.272.81balance
Table 2. Parameters of fibre laser colour marking.
SampleSpeed [%]Speed [mm/s]Average Power [%]Average Power [W]PRR [kHz]Observed Colour
(a) Low alloyed TiNatural grey
(b) Ti_laser_65-33606519.535Brown
(c) Ti_laser_100-6.56.513010030Yellow
(d) Ti_laser_100-448010030Light blue
(e) Ti_laser_100-336010030Blue
Table 3. Electrochemical parameters from potentiodynamic curves.
SampleEcorr/Vjcorr */nA·cm−2Eb/VΔE/V
Low alloyed Ti0.01127.0 ± 2.21.171.16
Ti Laser 100_6.50.03047.9 ± 1.01.221.19
Ti Laser 100_40.00916.1 ± 0.61.221.21
Ti Laser 100_3−0.03328.5 ± 0.51.221.25
Ti Laser 65_3−0.04429 ± 91.221.27
*Average value of corrosion current densities.
Table 4. Values of fitted parameters of the equivalent circuit as a function of applied potential at 1 h immersion time. Units: R[Ω·cm2], Q−1·cm−2sn] and C[F·cm−2].
Sample ReQ1C1n1R1Q2C2n2R2Chi2
low alloyed Ti871.86 × 10−513.6 × 10−60.9413106.887 × 10−631.7 × 10−60.7491.38 × 1070.0007
Laser 65_3292.38 × 10−512.6 × 10−60.90410433.028 × 10−64.76 × 10−60.8921.38 × 1070.003
Laser 100_6.5131.31 × 10−513.1 × 10−615411.108 × 10−539.4 × 10−60.7544.4 × 1060.0008
Laser 100_4302.09 × 10−515.2 × 10−60.9297011.97 × 10−665.0 × 10−60.51.67 × 1070.002
laser 100_3151.02 × 10−610.2 × 10−615521.24 × 10−563.9 × 10−60.7791.31 × 1070.00057

