Article

The Corrosion Inhibition of AA6082 Aluminium Alloy by Certain Azoles in Chloride Solution: Electrochemistry and Surface Analysis

1
Faculty of Chemistry and Chemical Engineering, University of Maribor, Smetanova ulica 17, Maribor 2000, Slovenia
2
Faculty of Natural Sciences, University of Tirana, Boulevard “Zogu I”, Tirana 1001, Albania
*
Author to whom correspondence should be addressed.
Coatings 2019, 9(6), 380; https://doi.org/10.3390/coatings9060380
Submission received: 15 May 2019 / Revised: 30 May 2019 / Accepted: 10 June 2019 / Published: 13 June 2019
(This article belongs to the Special Issue Anticorrosion Protection of Nonmetallic and Metallic Coatings)

Abstract

:
The corrosion inhibition effect of five azole compounds on the corrosion of an AA6082 aluminium alloy in 5 wt.% NaCl solution at 25 and 50 °C was investigated using weight loss and electrochemical measurements. Only 2-mercaptobenzothiazole (MBT) showed a corrosion inhibition effect at both temperatures and was further studied in detail, including with the addition of potassium iodide as a possible intensifier. Surface analysis of the MBT surface layer was performed by means of attenuated total reflectance Fourier transform infrared spectroscopy, X-ray photoelectron spectroscopy, and time-of-flight secondary ion mass spectrometry techniques. The hydrophobicity of the MBT surface layer was also investigated.

1. Introduction

The AA6xxx series aluminium alloys (also known as Al–Mg–Si alloys) are heat-treatable wrought alloys, which, in addition to their high thermal and electrical conductivity and low specific weight, possess moderately high strength [1,2]. These properties, combined with their good formability and high resistance to general corrosion, make these alloys very suitable for industrial use, especially in the automotive and aerospace industries [3,4]. However, intergranular corrosion is one of the most reported forms of corrosion for AA6xxx series aluminium alloys [5,6,7,8,9,10,11]. The authors reported a close connection between the amount of Cu present in the alloys and their susceptibility to intergranular corrosion. The Cu content is also related to the pitting corrosion susceptibility of these alloys in chloride-containing solutions [3]. Due to the fact that the AA6082 aluminium alloy is used to fabricate hot extruded automotive parts [3,4], the corrosion resistance of this alloy in chloride-containing solutions has been reported in several studies. Cicolin et al. [12] reported that an increase in chloride concentration (from 0.01 to 1.00 M NaCl) made the AA6082 aluminium alloy more susceptible to pitting than to intergranular corrosion. The same behaviour was also observed when increasing the solution’s pH or the amount of dissolved oxygen. The effect of pH on the stress corrosion cracking of the AA6082 aluminium alloy in a 0.3 M NaCl solution was also studied by Panagopoulos et al. [13]. The authors reported higher corrosion susceptibility in basic and acid solutions, while a higher resistance was observed for neutral solutions. Trdan and Grum [14] used electrochemical measurements to study the influence of laser shock peening (LSP) treatment on the corrosion resistance of AA6082-T651 aluminium alloy immersed in a 0.6 M NaCl solution. The passivity region of the AA6082-T651 aluminium alloy samples increased after LSP treatment. Moreover, the LSP-treated samples showed a repassivation ability.
Recently, we reported on the influence of chloride concentration (1 and 5 wt.% NaCl solution) and temperature (25 and 50 °C) on the corrosion behaviour of the AA6082 aluminium alloy in chloride-containing solutions [15]. A corrosion rate increase was observed when increasing the chloride concentration and temperature. Both general and pitting corrosion were more pronounced at the highest temperature (50 °C). Moreover, the corrosion of the AA6082 aluminium alloy samples under the above-mentioned conditions followed kinetic-controlled processes [15].
Surface modification by either laser shock peening without ablative coating [14] or polyvinyl alcohol fibrous coating [16], as well as by the application of a titania coating [17], was employed to mitigate the corrosion of AA6082 aluminium alloys in chloride-containing solutions. In addition, sodium molybdate dehydrate was used by Panagopoulos et al. [18] as a corrosion inhibitor for the AA6082 aluminium alloy in a 0.01 M NaCl solution. Although a large number of organic compounds and natural products have been employed as corrosion inhibitors for aluminium alloys in acid, basic, and chloride-containing solutions [19,20,21], the literature is scarce regarding the use of organic compounds as corrosion inhibitors for the AA6082 aluminium alloy. Azole compounds, mainly derivatives of imidazole and benzotriazole, have shown good corrosion inhibition effects in chloride-containing solutions, mostly for copper [22,23,24,25,26,27,28,29,30,31] and, in a few cases, for steel [32,33,34,35]. Moreover, several azole compounds have been used as corrosion inhibitors, mostly for pure aluminium and the AA2024 aluminium alloy in chloride-containing solutions [36,37,38,39,40]. Hitherto, to the best of our knowledge, there have been no reports in the literature on the use of azole compounds as corrosion inhibitors for the AA6082 aluminium alloy in chloride-containing solutions.
In this work, electrochemical impedance spectroscopy (EIS) measurements were first used to evaluate the effectiveness of five azole compounds, i.e., 2-mercaptobenzothiazole (MBT), 2-mercaptobenzoxazole (MBO), 2-mercaptobenzimidazole (MBI), benzotriazole (BTA), and 3-amino-1H-1,2,4-triazole (3-AT), as corrosion inhibitors for the AA6082 aluminium alloy during 10 h of immersion in 5 wt.% NaCl solution at 50 °C, with and without the addition of KI as a possible intensifier. The corrosion inhibition effectiveness of the above-mentioned compounds was tested at 50 °C, a common temperature employed in the automotive industry. According to the international standard ISO 9227 [41], the neutral salt spray tests should be performed at 35 ± 2 °C. However, the same standard states that the cooper-accelerated acetic salt spray tests should be performed at 50 ± 2 °C. In this work, the inhibition effect of the studied azole compounds in the corrosion of AA6082 aluminium alloy samples in 5 wt.% NaCl solution was first studied at 50 °C to simulate an even more corrosive environment and test the worst-case scenario. Next, only the compounds found to show a corrosion inhibition effect at 50 °C were tested at 25 °C [41], with and without the addition of KI, using electrochemical techniques (including open circuit potential, potentiodynamic curve, and EIS measurements) and the weight loss method. The adsorption of the effective azole compound was confirmed by attenuated total reflectance Fourier transform infrared spectroscopy (ATR-FTIR), X-ray photoelectron spectroscopy (XPS), and time-of-flight secondary ion mass spectrometry (ToF-SIMS) measurements. Finally, contact angle measurements were performed on AA6082 aluminium alloy samples immersed in 5 wt.% NaCl solution at 25 °C.

2. Materials and Methods

2.1. Sample Preparation

The AA6082 aluminium alloy with the composition given in Table 1 was supplied by Rocholl GmbH, Aglasterhausen, Germany. Rectangle-shaped samples (50 by 20 by 1 mm) were used for the weight loss measurements, while disc-shaped samples (diameter 15 mm) were used for the electrochemical and surface characterization measurements [15,22,28,33].
Prior to performing weight loss tests, the samples were first cleaned ultrasonically in a 50 vol.% acetone/50 vol.% ultrapure water bath and then dried under a stream of air. The samples used for the electrochemical measurements were first ground with different SiC papers (320, 500, 800, 1000, 2400, and 4000 grit), supplied by Struers (Ballerup, Denmark), and then rinsed with ultrapure water (resistivity of 18.2 MΩ cm at 25 °C) obtained by means of the Milli-Q system (Millipore Corporation, Burlington, MA, USA). Finally, the samples were ultrasonically cleaned in a 50 vol.% acetone/50 vol.% ultrapure water bath and then dried under a stream of air.

2.2. Solution Preparation

All the solutions used in this study were prepared using ultrapure water. The 97 wt.% pure 2-mercaptobenzothiazole (MBT), 95 wt.% pure 2-mercaptobenzoxazole (MBO), 98 wt.% pure 2-mercaptobenzimidazole (MBI), and 99 wt.% pure benzotriazole (BTA) were supplied by Sigma-Aldrich (St. Louis, MO, USA), while the 95 wt.% pure 3-amino-1H-1,2,4-triazole (3-AT) was supplied by ACROS Organics (Morris County, NJ, USA). The chemical structures of these compounds are given in Figure 1.
Acetone, NaCl, and KI (for analysis, ACS quality) were supplied by Carlo Erba Reagents (Milan, Italy). The AA6082 aluminium alloy samples were immersed in 5 wt.% NaCl solution containing a) 0.3 mM MBT, b) 1.0 mM MBO, c) 1.0 mM MBI, d) 10.0 mM 3-AT, e) 1.0 mM BTA, and f) 10.0 mM BTA. The choice of the concentrations for the MBT, MBO, and MBI is related to their solubility limit in 5 wt.% NaCl solution. A concentration of 1 mM for these compounds is close to the 0.1 wt.% concentration that is commonly used for corrosion tests in industry [42].

2.3. Weight Loss Measurements

The AA6082 aluminium alloy samples were weighed before immersion in the tested solutions. After seven days of immersion, the samples were first rinsed with ultrapure water, and then a fibre-bristle brush was used to remove the corrosion products from their surface. Before weighing the samples again, they were rinsed once more with ultrapure water and dried under a stream of air. Dixon’s and Grubb’s statistical tests [43] were used to remove any outliers, and an average value of at least six replicate measurements was reported.

2.4. Electrochemical Measurements

The AA6082 aluminium alloy samples immersed in 5 wt.% NaCl solution with each of the azole compounds were subjected to electrochemical measurements under stagnant conditions at 25 and 50 °C. The working electrode consisted of the AA6082 aluminium alloy sample (prepared as described above) embedded in a Teflon holder (PAR, Cambridge, UK) with a 1 cm2 area exposed to the solution [15,22,28,33]. A saturated calomel electrode, SCE (0.244 V vs. SHE, the standard hydrogen electrode), and a graphite rod were used as the reference and the counter electrode, respectively. A Gamry 600TM potentiostat/galvanostat controlled by a Gamry Framework electrochemical program (Gamry Instruments, Warminster, PA, USA) was used to perform all the electrochemical measurements. The results obtained were analysed using the Gamry EChem Analyst 6.30 software.
The EIS spectra were recorded at the open circuit potential (Eoc), in the frequency range from 1 MHz to 10 mHz, using a signal with a 10 mV (peak to peak) amplitude and 10 points/decade [15,22,28,33]. The EIS measurements were performed in sequence after 1, 3, 5, 7, and 10 h of immersion in 5 wt.% NaCl solution with and without different azole compounds. The Eoc was determined from the time of immersion in sequence before each of the EIS measurements and just before the potentiodynamic curve measurements. The potentiodynamic curves were recorded after 11 h of immersion, starting from −0.250 V vs. Eoc and continuing in the anodic direction with a potential scan rate of 0.1 mV s−1. At least three replicate measurements were performed for all the electrochemical techniques and a representative curve is given in each case.

2.5. Surface Analysis

The samples prepared with the same procedure as the electrochemical measurements were subjected to surface analysis after immersion in 5 wt.% NaCl solution with and without the presence of the azole compounds. The ATR-FTIR, XPS, ToF-SIMS, and contact angle measurements were used to characterize the surface of the AA6082 aluminium alloy samples after immersion. The ATR-FTIR and contact angle measurements were performed after 31 days of immersion, while for the XPS (PHI 5600, Physical Electronics, Inc., Chanhassen, MN, USA) and ToF-SIMS (ToF-SIMS 5, ION-TOF, Münster, Germany) measurements, a 1 h immersion time was used. A Shimadzu IRAffinity-1 (Kyoto, Japan) spectrometer was used for the ATR-FTIR measurements. The instrumental setup for the XPS and ToF-SIMS measurements were the same as reported previously [44]. The hydrophobicity of the AA6082 aluminium alloy samples after immersion in 5 wt.% NaCl solutions containing the most effective azole compound (higher corrosion inhibition effectiveness) with and without the addition of 0.1 wt.% KI was tested using an OCA 35 Dataphysic contact angle analyser (Filderstadt, Germany), with the respective software (SCA 20). The average value of at least three replicate contact angle measurements obtained at different spots of the sample’s surface was reported (outliers were checked with Dixon’s and Grubb’s statistical tests, and any present outliers were removed from the calculation of the average value [43]).

3. Results and Discussion

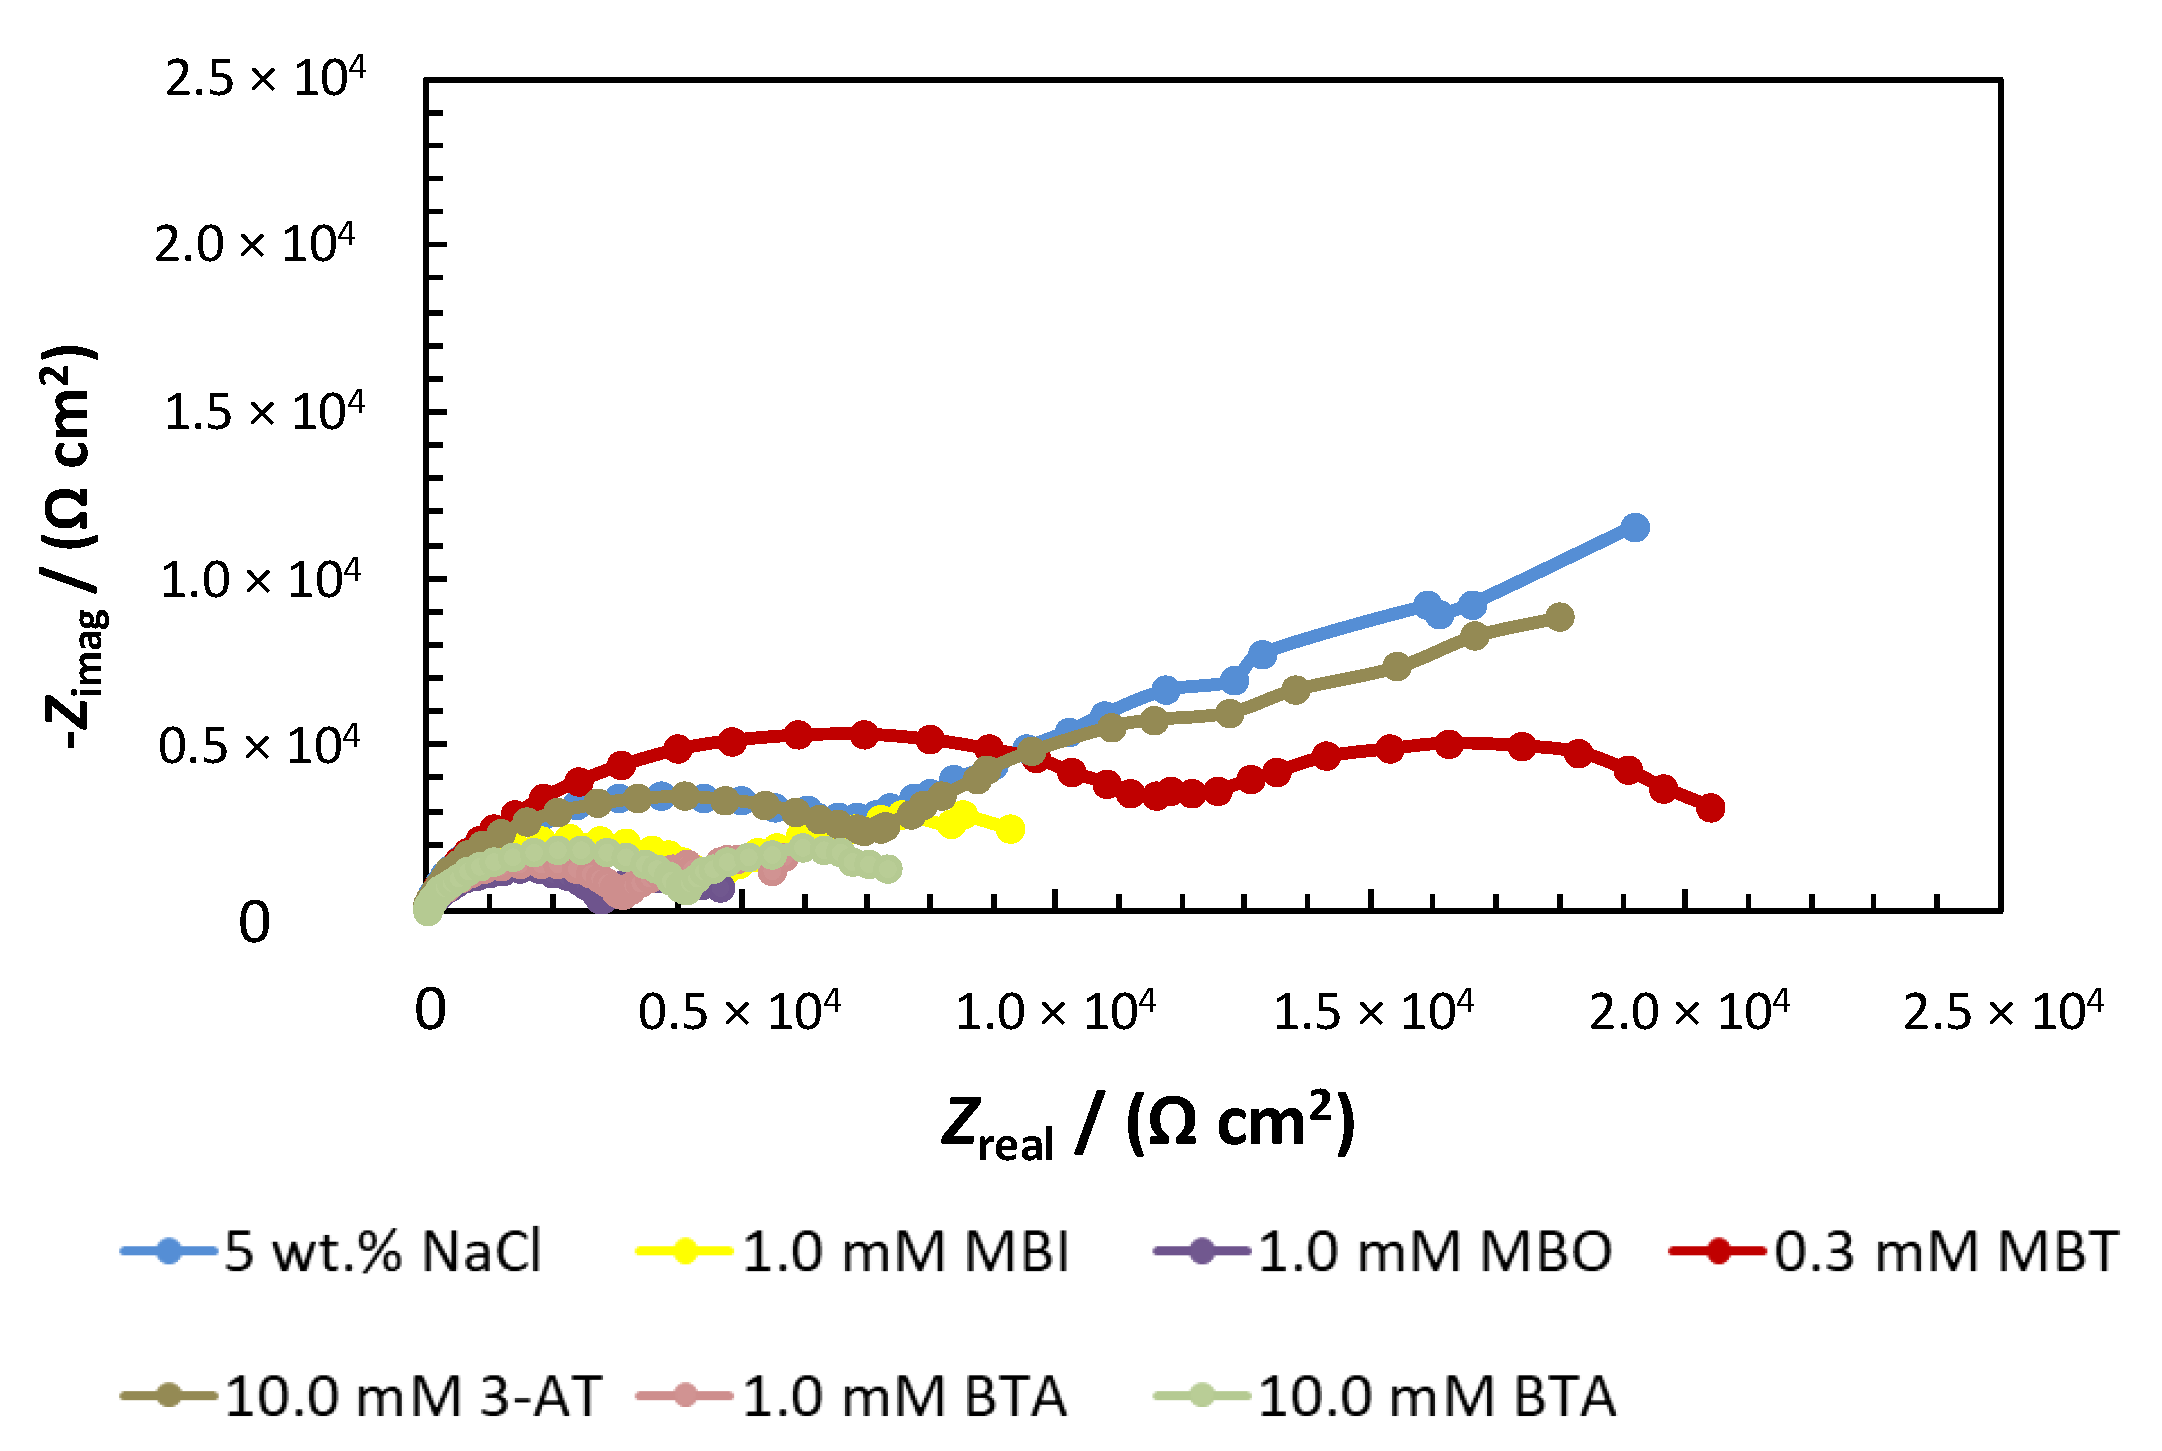
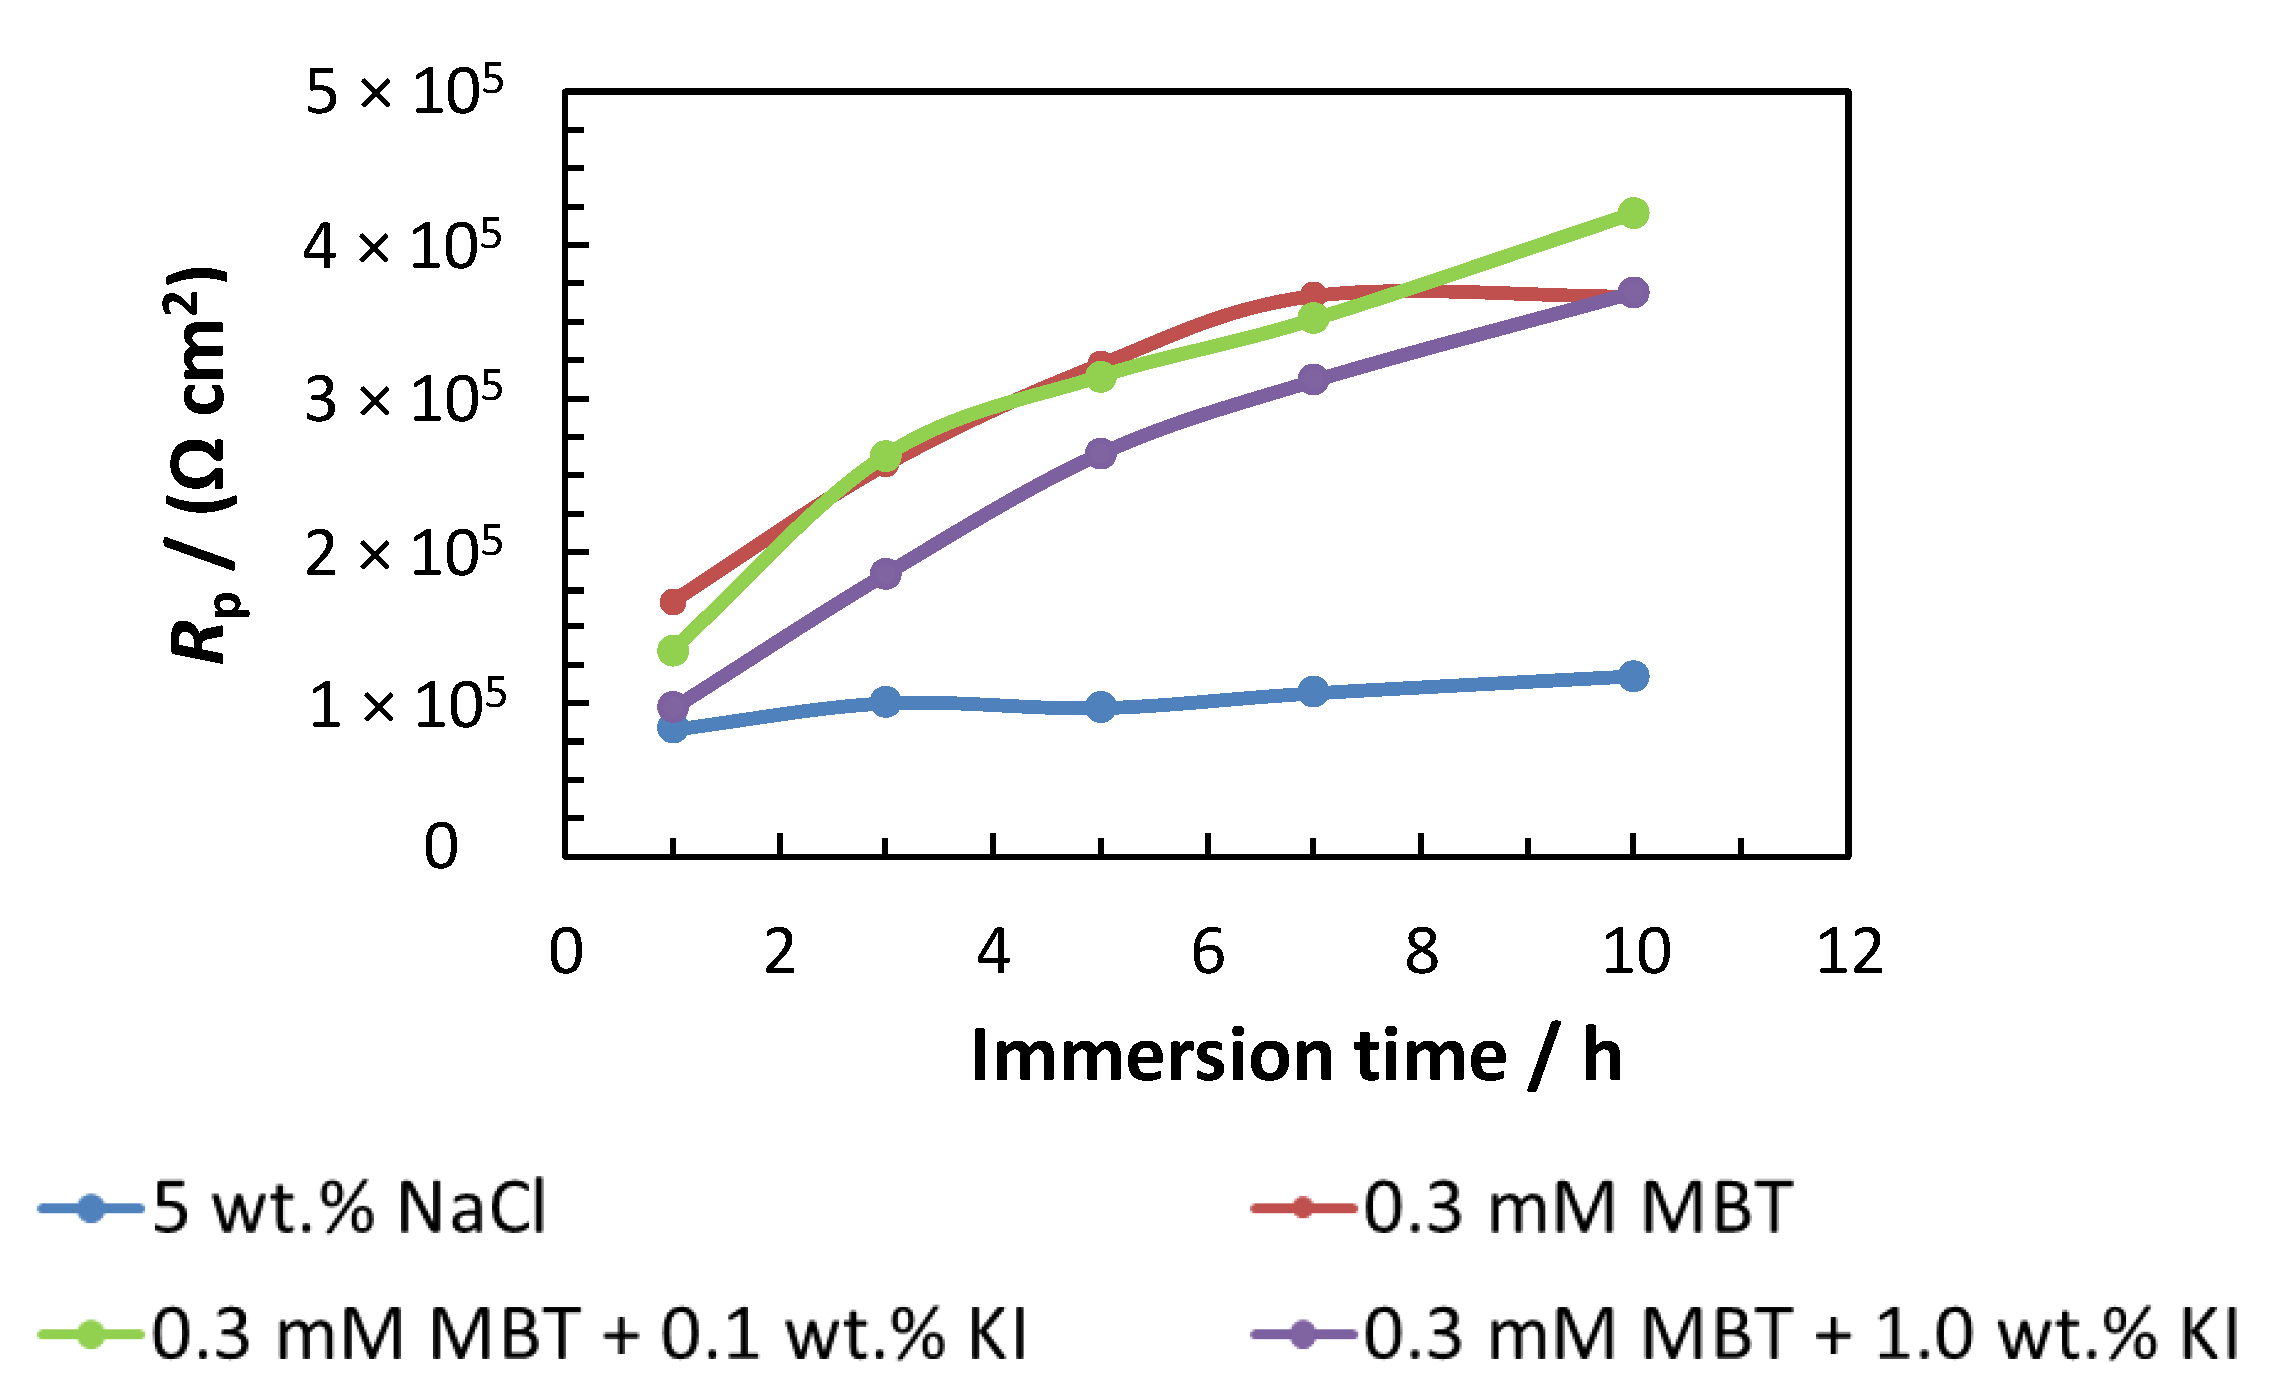
3.1. Electrochemical Measurements

The AA6082 aluminium alloy samples immersed in 5 wt.% NaCl solution containing the MBI, MBO, MBT, 3-AT, and BTA azole compounds, as described above, were first tested by means of EIS measurements at 50 °C to simulate the worst-case corrosion scenario and to select the best candidates for lower temperature studies. The Nyquist plots of the AA6082 aluminium alloy samples immersed in 5 wt.% NaCl solution with different amounts of the studied azole compounds (Figure 2) obtained at 50 °C indicated that only MBT and 3-AT showed a corrosion inhibition effect. However, the parameters obtained from the EIS fitting procedure showed that the addition of MBT and 3-AT resulted in only a slight increase in the corrosion resistivity of the AA6082 aluminium alloy samples (the corrosion inhibition effectiveness calculated based on fitted Rp values as described below was found to be lower than 25%). For all the other azole compounds lower Rp values were obtained compared with the non-inhibited system indicating that these compounds are not corrosion inhibitors for the AA6082 aluminium alloy.
Next, the corrosion inhibition effectiveness of MBT and 3-AT was further tested at 25 °C. No significant corrosion inhibition effect was found for 10.0 mM 3-AT in 5 wt.% NaCl solution at 25 °C, the main reason being the lower corrosion rate of the base aluminium alloy, which becomes similar to the corrosion rate of the alloy in the solution with the addition of 3-AT. However, MBT at 0.3 mM showed a corrosion inhibition effect at 25 °C. Due to the latter, MBT was electrochemically tested in detail, including open circuit potential, EIS, and potentiodynamic curve measurements, as presented below.

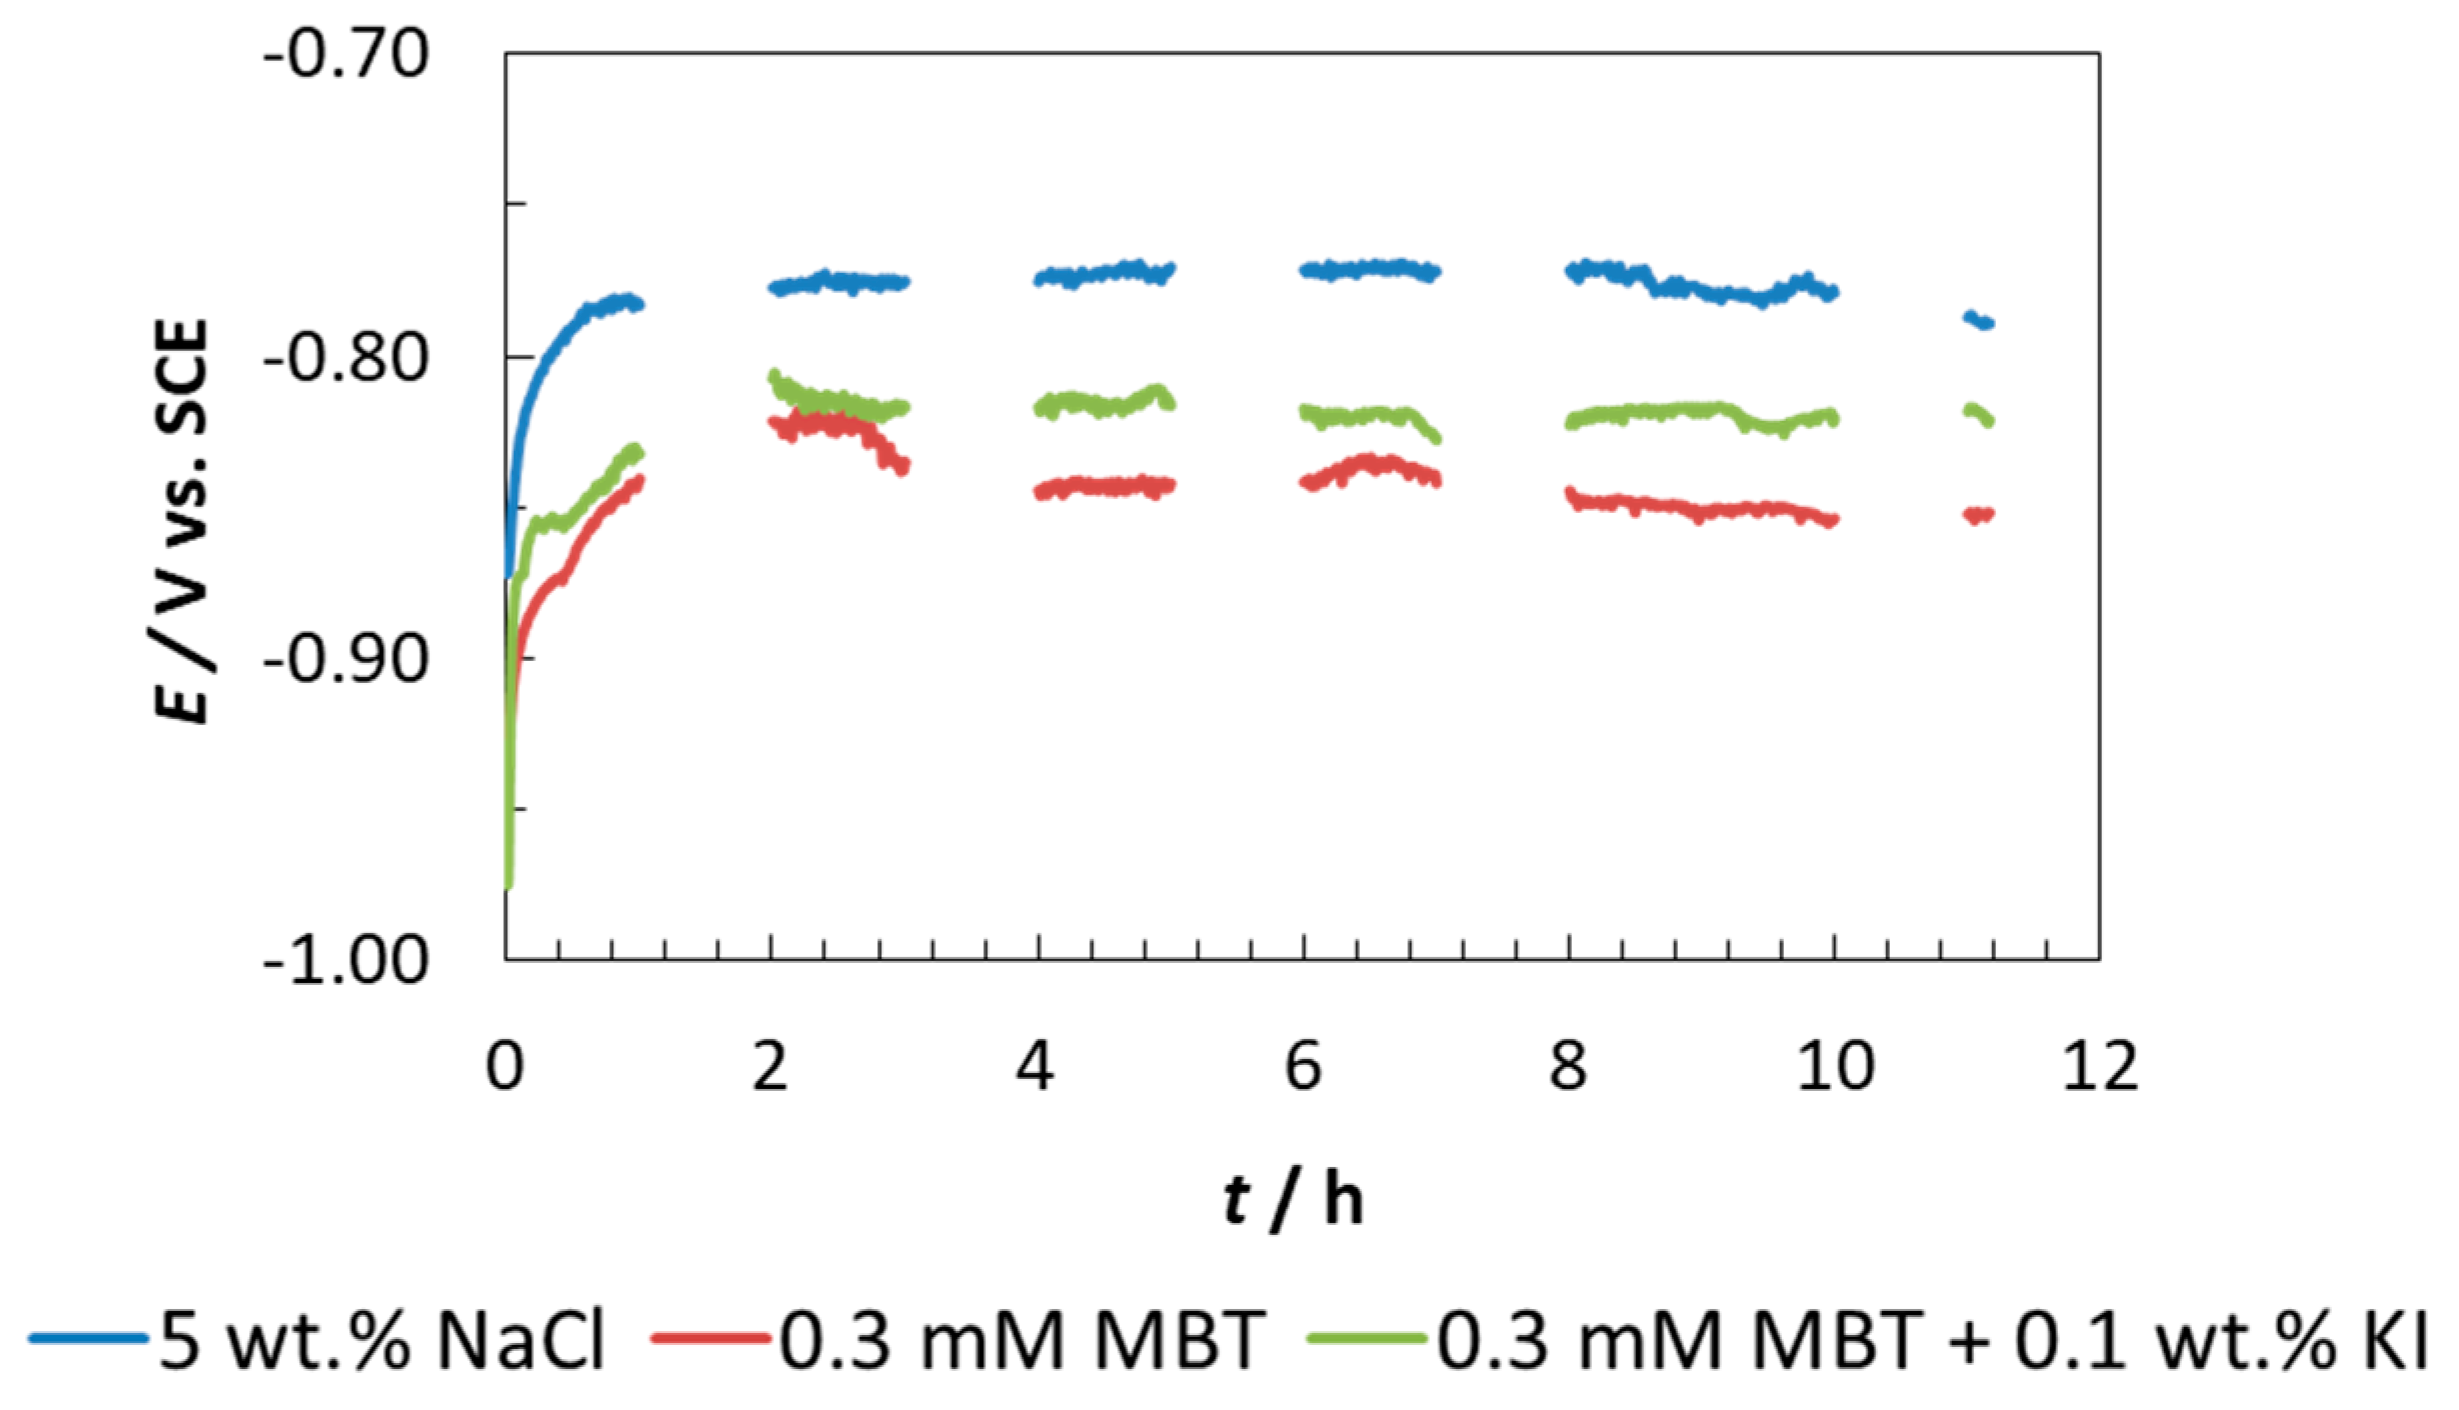
3.1.1. Open Circuit Potential Measurements

The open circuit potential (Eoc) of the AA6082 aluminium alloy samples immersed in 5 wt.% NaCl solution containing 0.3 mM MBT or a combination of 0.3 mM MBT and 0.1 wt.% KI was measured at 25 °C in sequence before each EIS measurements (starting from the moment of immersion) and just before the potentiodynamic curve was recorded. The last measured Eoc for each of the systems was considered to be the corrosion potential (Ecorr). The open circuit potential values obtained for each system are presented in Figure 3 as a function of the immersion time.
Figure 3 shows that for the non-inhibited AA6082 aluminium alloy samples immersed in 5 wt.% NaCl solution the Eoc moved to more positive potentials from the moment of immersion until the first hour, and then no significant changes were observed (a steady state was achieved). For this system, Ecorr was found to be −0.789 V. The addition of 0.3 mM MBT to 5 wt.% NaCl solution resulted in a shift of the Eoc to slightly more negative potentials compared with the non-inhibited system. The Eoc was first transferred to more positive potentials in the first hour of immersion and then slightly shifted to more negative potentials from the first to the third hour of immersion. For the inhibited system, a steady state was reached after 3 h of immersion. The Ecorr for this system was found to be −0.852 V.
The steady state for the AA6082 aluminium alloy samples immersed in 5 wt.% NaCl solution containing 0.3 mM MBT with the addition of 0.1 wt.% KI was also achieved after 1 h of immersion. No significant shift was observed when comparing the open circuit potential curves for the inhibited system with and without the addition of 0.1 wt.% KI. This is reflected also in the Ecorr value, which was −0.821 V for the inhibited system containing 0.1 wt.% KI.
The shift to more negative potentials when 0.3 mM MBT or a combination of 0.3 mM MBT and 0.1 wt.% KI were added to 5 wt.% NaCl solution indicates that MBT primarily inhibits the cathodic reaction of the corrosion couple, i.e., the reduction of the dissolved oxygen in the solution and the hydrogen evolution (which is most likely not intensive since for the 5 wt.% NaCl solution containing 0.3 mM MBT the pH was 5.07, while no significant change of the pH (pH = 5.11) was measured when 0.1 wt.% KI was added to the solution).

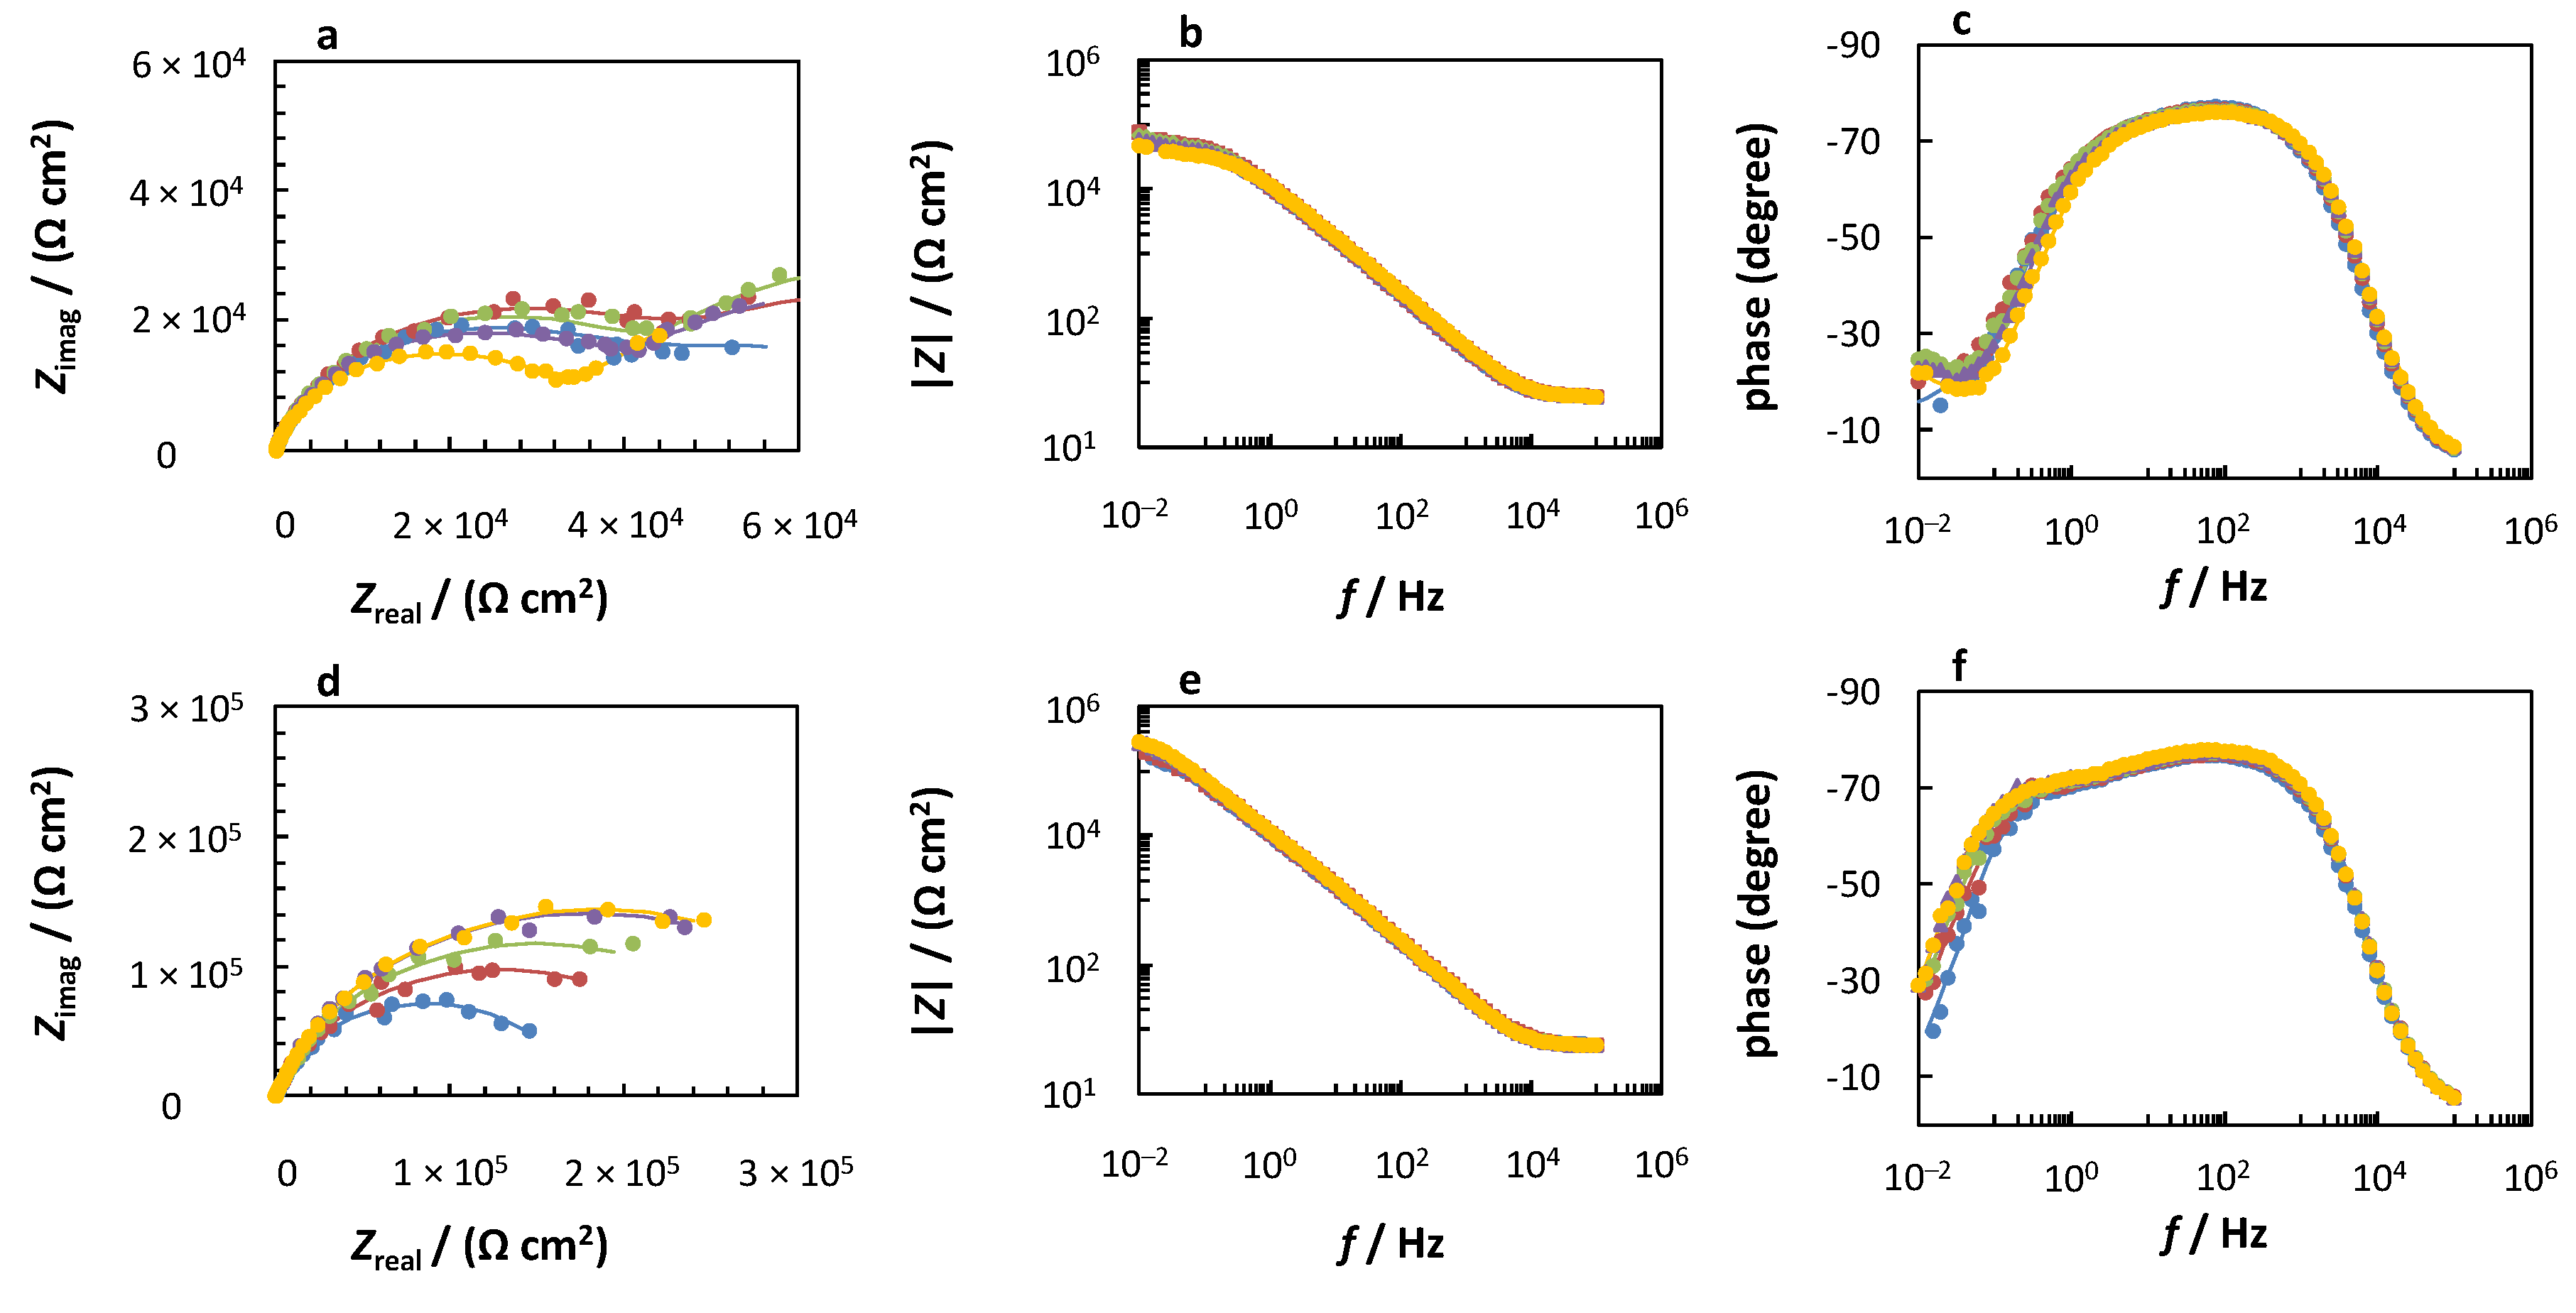
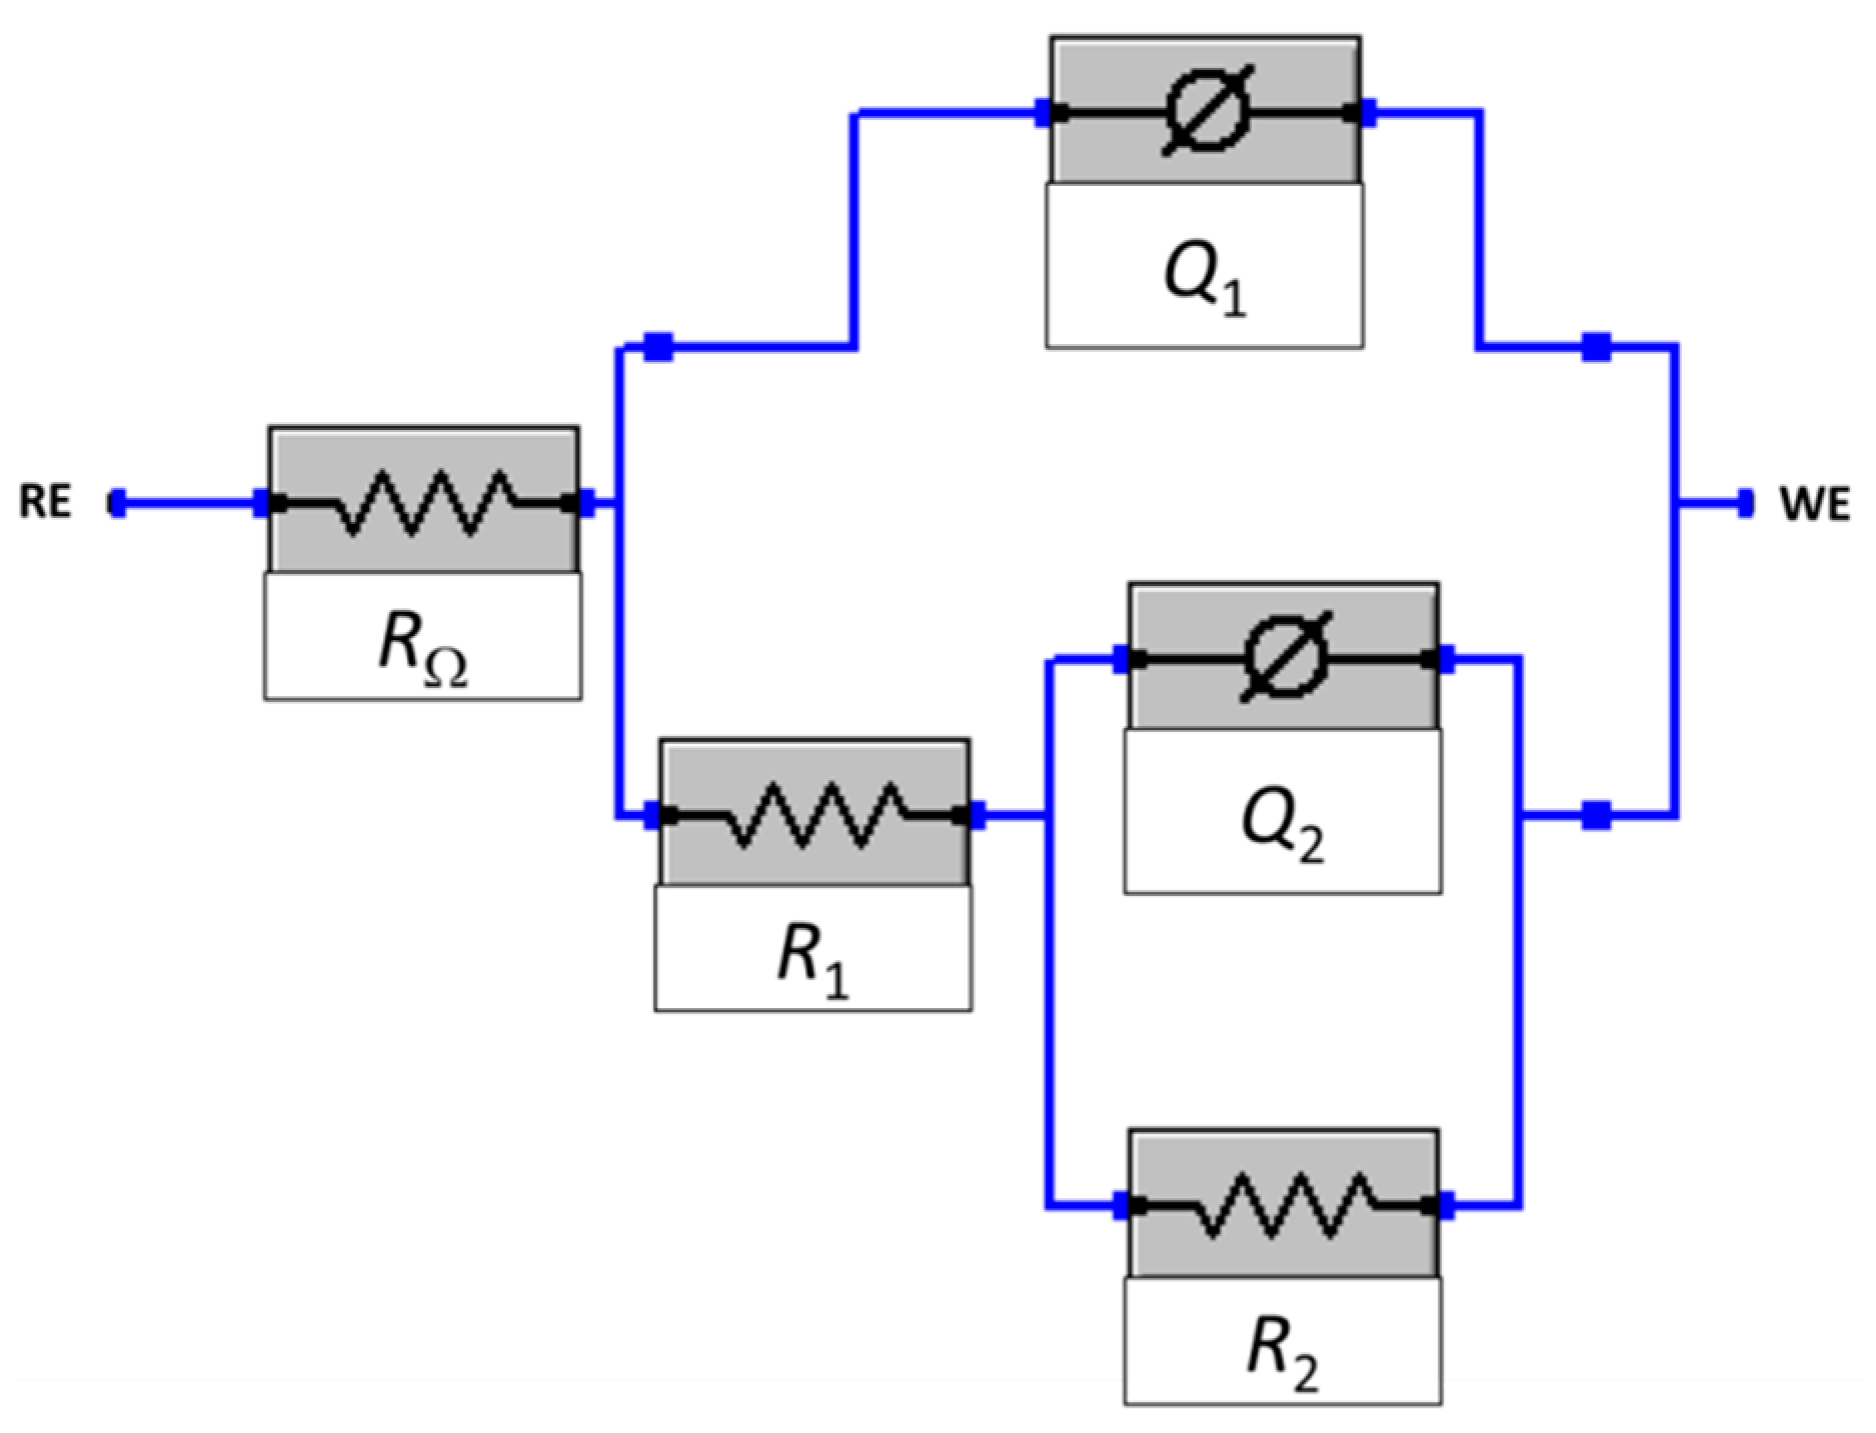
3.1.2. EIS Measurements

Figure 4 presents the EIS response of the AA6082 aluminium alloy samples after 1–10 h of immersion at 25 °C in 5 wt.% NaCl solution (Figure 4a–c), in 5 wt.% NaCl solution containing 0.3 mM MBT (Figure 4d–f), and in 5 wt.% NaCl solution containing 0.3 mM MBT with the addition of 0.1 wt.% KI (Figure 4g–i). The two distinctive patterns observed in the Bode modulus plot (Figure 4b,e) in the high and middle frequency regions and the respective behaviour of the systems associated with those patterns have previously been described in detail [15,22,28,33].
Several equivalent electrical circuit (EEC) models were taken into consideration to fit the EIS spectra obtained. Figure 5 presents the nested R(Q1(R1(Q2(R2))) EEC model selected to fit the EIS response as the error of the fitting procedure (χ2) using this EEC was the lowest among all EECs tested. The same EEC model was used previously to fit the EIS response of AA6082 aluminium alloy samples, under the same conditions, without the addition of azole compounds and intensifiers [15]. A combination of resistances and constant phase elements (represented by Q, which describes the non-ideal capacitance C) was used to describe the two relaxation processes in this EEC model. The uncompensated resistance (R) is largely influenced by the solution resistance. The processes occurring at the surface layer (a combination of the oxide layer and the adsorbed inhibitor) are described by the surface layer resistance (R1) and capacitance (represented by Q1). The charge-transfer resistance (R2) and double-layer capacitance (represented by Q2) describe the processes occurring at the metal/solution interface.
Table 2 shows the average values of the parameters obtained from the fitting procedure using the nested R(Q1(R1(Q2(R2))) EEC model presented in Figure 5. The capacitance values (Cx) were calculated from the respective non-ideal capacitance (Qx) and resistance (Rx) values as C x = ( ( R x   Q x ) 1 / n x ) / R x . The thickness of the surface layer (d) is inversely proportional to the surface layer capacitance (C1) [33].
The C1 values of the AA6082 aluminium alloy samples immersed in 5 wt.% NaCl solution decreased with an increase in immersion time for both systems, i.e., with and without the addition of 0.1 wt.% KI (Table 2). This resulted in an increase in the surface layer thickness with increasing immersion time, as more of the inhibitor is adsorbed on the surface of the AA6082 aluminium alloy samples.
The polarization resistance (Rp) values, calculated as the sum of all resistances (Table 2), excluding R, are presented in Figure 6 as a function of the immersion time. The Rp values obtained for the AA6082 aluminium alloy samples immersed in a 5 wt.% NaCl solution, containing 0.3 mM MBT, with and without the addition of 0.1 wt.% KI, at 25 °C, are compared with the Rp values of the same samples, under the same conditions, immersed only in 5 wt.% NaCl solution, as reported previously [15]. A higher Rp value indicates the lower susceptibility of the AA6082 aluminium alloy sample to general corrosion. Figure 6 shows that at all immersion times a more resistive system is obtained with the addition of 0.3 mM MBT compared with the system containing no corrosion inhibitor. For the system containing 0.3 mM MBT, a continuous increase in Rp values is observed for up to 7 h of immersion, and then after 10 h of immersion the resistivity of the system does not significantly change (Figure 6). The same trend in the change of Rp values with increasing immersion time was found for the system containing 0.3 mM MBT with the addition of 0.1 wt.% KI for up to 7 h of immersion. However, the resistivity of this system increased from 7 to 10 h of immersion. For this system, the highest Rp value was obtained after 10 h of immersion. Table 2 and Figure 6 show that the addition of 0.1 wt.% KI to the inhibited system has no significant influence on the Rp values obtained from fitting the EIS response from the first to the seventh hour of immersion, while only a slight increase of the the Rp value is observed after 10 h of immersion. The increase of the KI concentration from 0.1 to 1.0 wt.% did not further improve the corrosion resistance of the AA6082 aluminium samples immersed in 5 wt.% NaCl solution containing 0.3 mM MBT. Figure 6 shows that lower Rp values compared to both the inhibited systems with and without 0.1 wt.% KI addition were obtained from the first to the seventh hour of immersion.
The corrosion inhibition effectiveness of the inhibited systems, with or without the addition of 0.1 and 1.0 wt.% KI, after 10 h of immersion at 25 °C were calculated from the Rp values presented in Table 2. The corrosion inhibition effectiveness for the system containing 0.3 mM MBT was 67.76%, while the addition of 0.1 wt.% KI to the 0.3 mM MBT slightly increased the corrosion inhibition effectiveness to 71.92%. The non-significant difference in the Rp values of the inhibited samples with and without 1.0 wt.% KI addition is also reflected in the corrosion inhibition effectiveness value. The corrosion inhibition effectiveness of the samples immersed in 5 wt.% NaCl solution containing 0.3 mM MBT with 1.0 wt.% KI addition was 68.01%.

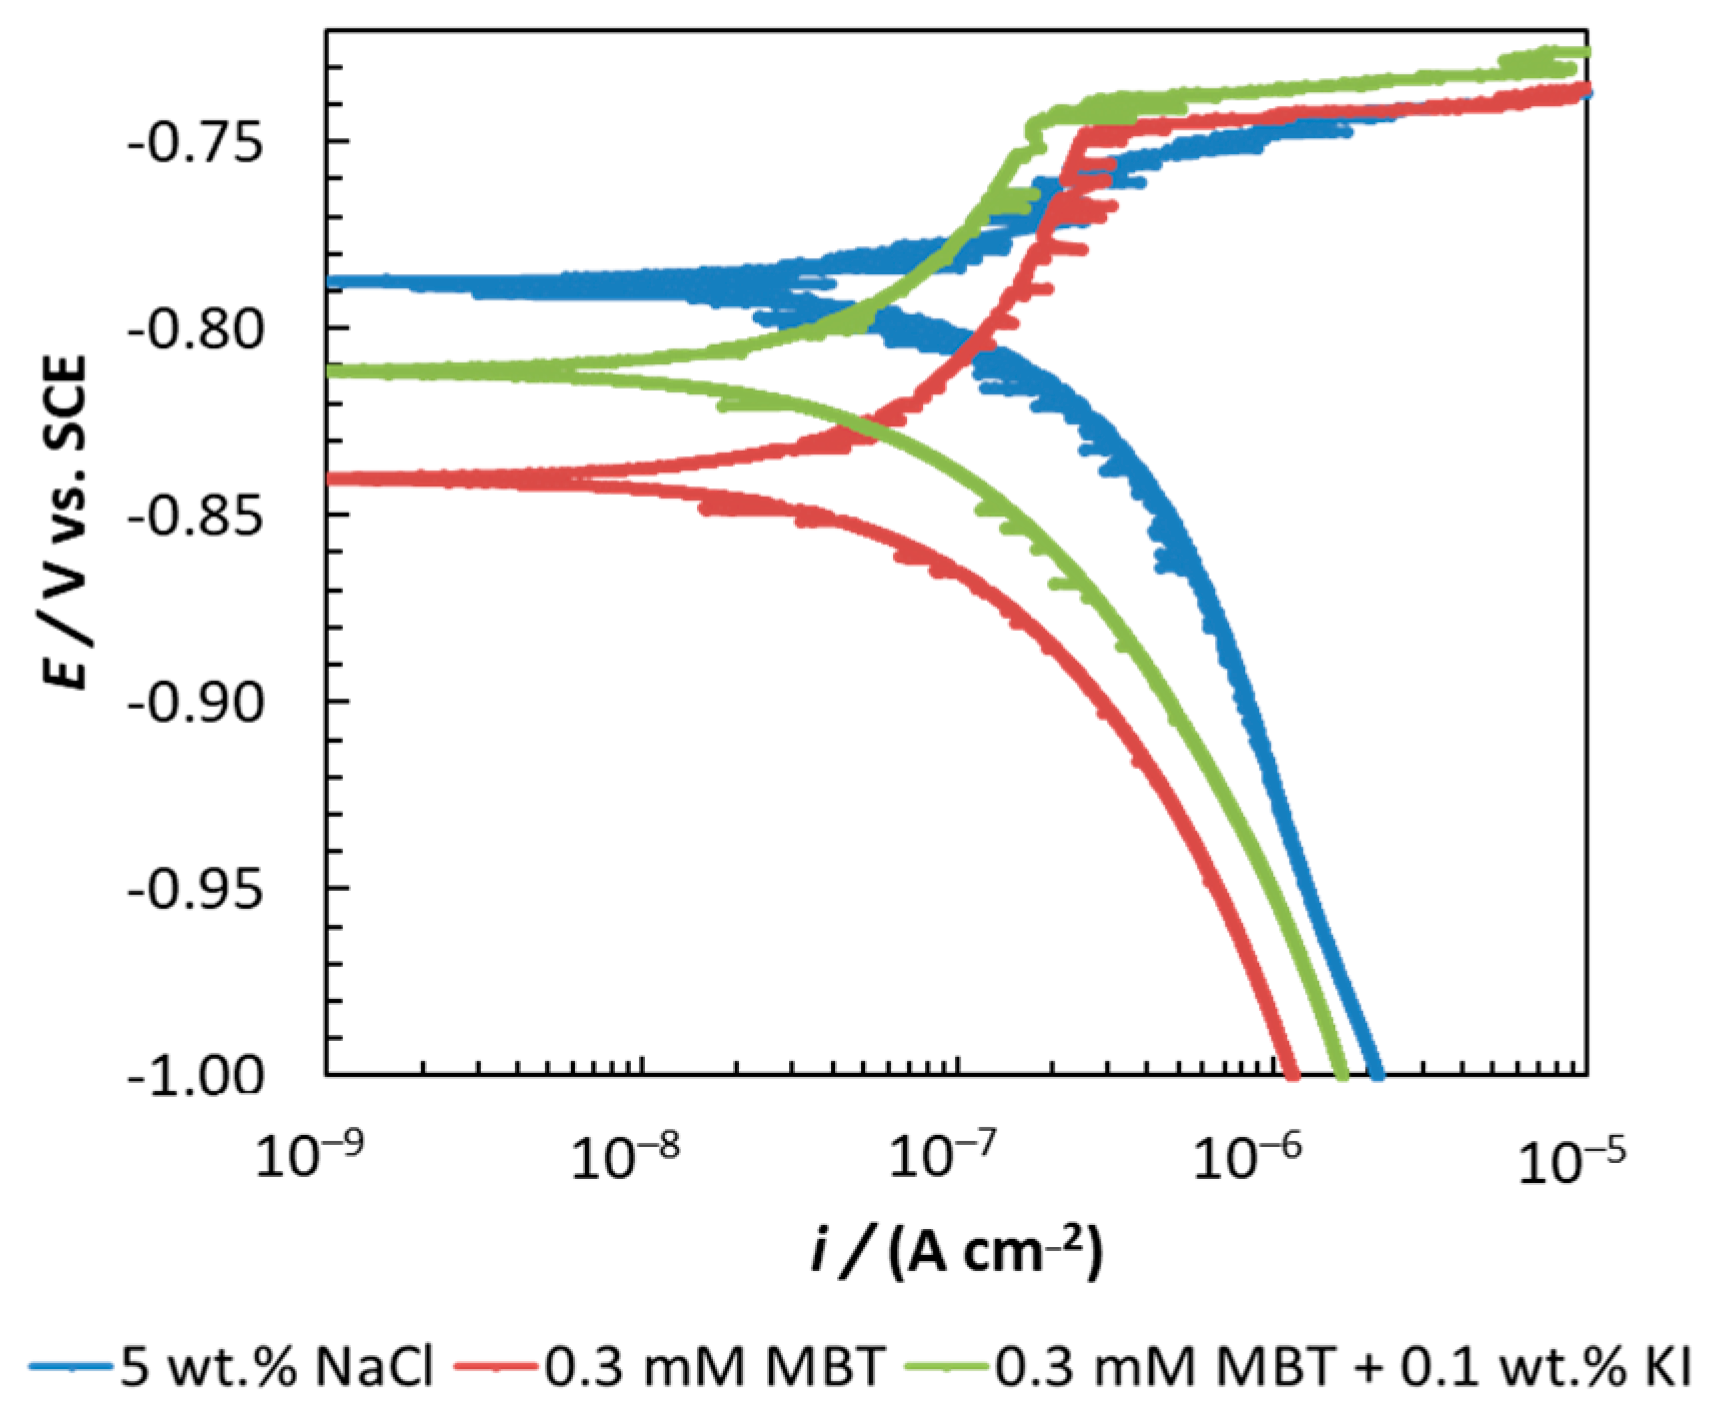
3.1.3. Potentiodynamic Curve Measurements

The potentiodynamic curves of the AA6082 aluminium alloy samples after 11 h of immersion in 5 wt.% NaCl solution with or without 0.3 mM MBT or 0.3 mM MBT and the addition of 0.1 wt.% KI are presented in Figure 7. The same as found in the open circuit potential measurements for Ecorr, the Eoc of the AA6082 aluminium alloy samples shifted to more negative potentials upon the addition of 0.3 mM MBT or 0.3 mM MBT and 0.1 wt.% KI. The latter explains that 0.3 mM MBT and a combination of 0.3 mM MBT and 0.1 wt.% KI primarily inhibit the cathodic reaction of the corrosion couple, acting as a cathodic-type corrosion inhibitor (the same was concluded above by means of open circuit potential measurements). Figure 7 shows that for the inhibited samples (both with and without the addition of KI), the corrosion current density shifted to lower values compared with the non-inhibited sample. For the non-inhibited samples, the breakdown potential, Ebd (the potential at which a sudden increase in the current density is observed), is not clearly expressed, whereas for both additions, the Ebd is expressed. Moreover, based on the increased EbdEoc potential difference upon the addition of either 0.3 mM MBT or a combination of 0.3 mM MBT and 0.1 wt.% KI, the localized corrosion of the AA6082 aluminium alloy samples was mitigated compared with the non-inhibited sample [45].

3.2. Weight Loss Measurements

The AA6082 aluminium alloy samples were immersed for 7 days at 25 °C in 5 wt.% NaCl solution containing 0.3 mM MBT, with and without the addition of KI as an intensifier. After the immersion time and cleaning procedure as described above, the AA6082 aluminium alloy samples showed a higher mass than before immersion, due to the inability to remove the corrosion products from the surface of the AA6082 aluminium alloy samples, even though corrosion products were visible on the surface. A cleaning procedure in acids was not performed as this could also remove the base aluminium alloy, resulting in misleading results. Similar strongly attached corrosion products were also found when the samples were immersed for 30 days and 180 days at 25 °C or 7 days at 50 °C. Therefore, for the present corrosion inhibition research weight loss measurements are not appropriate for evaluating the corrosion effectiveness of the tested corrosion inhibitors.

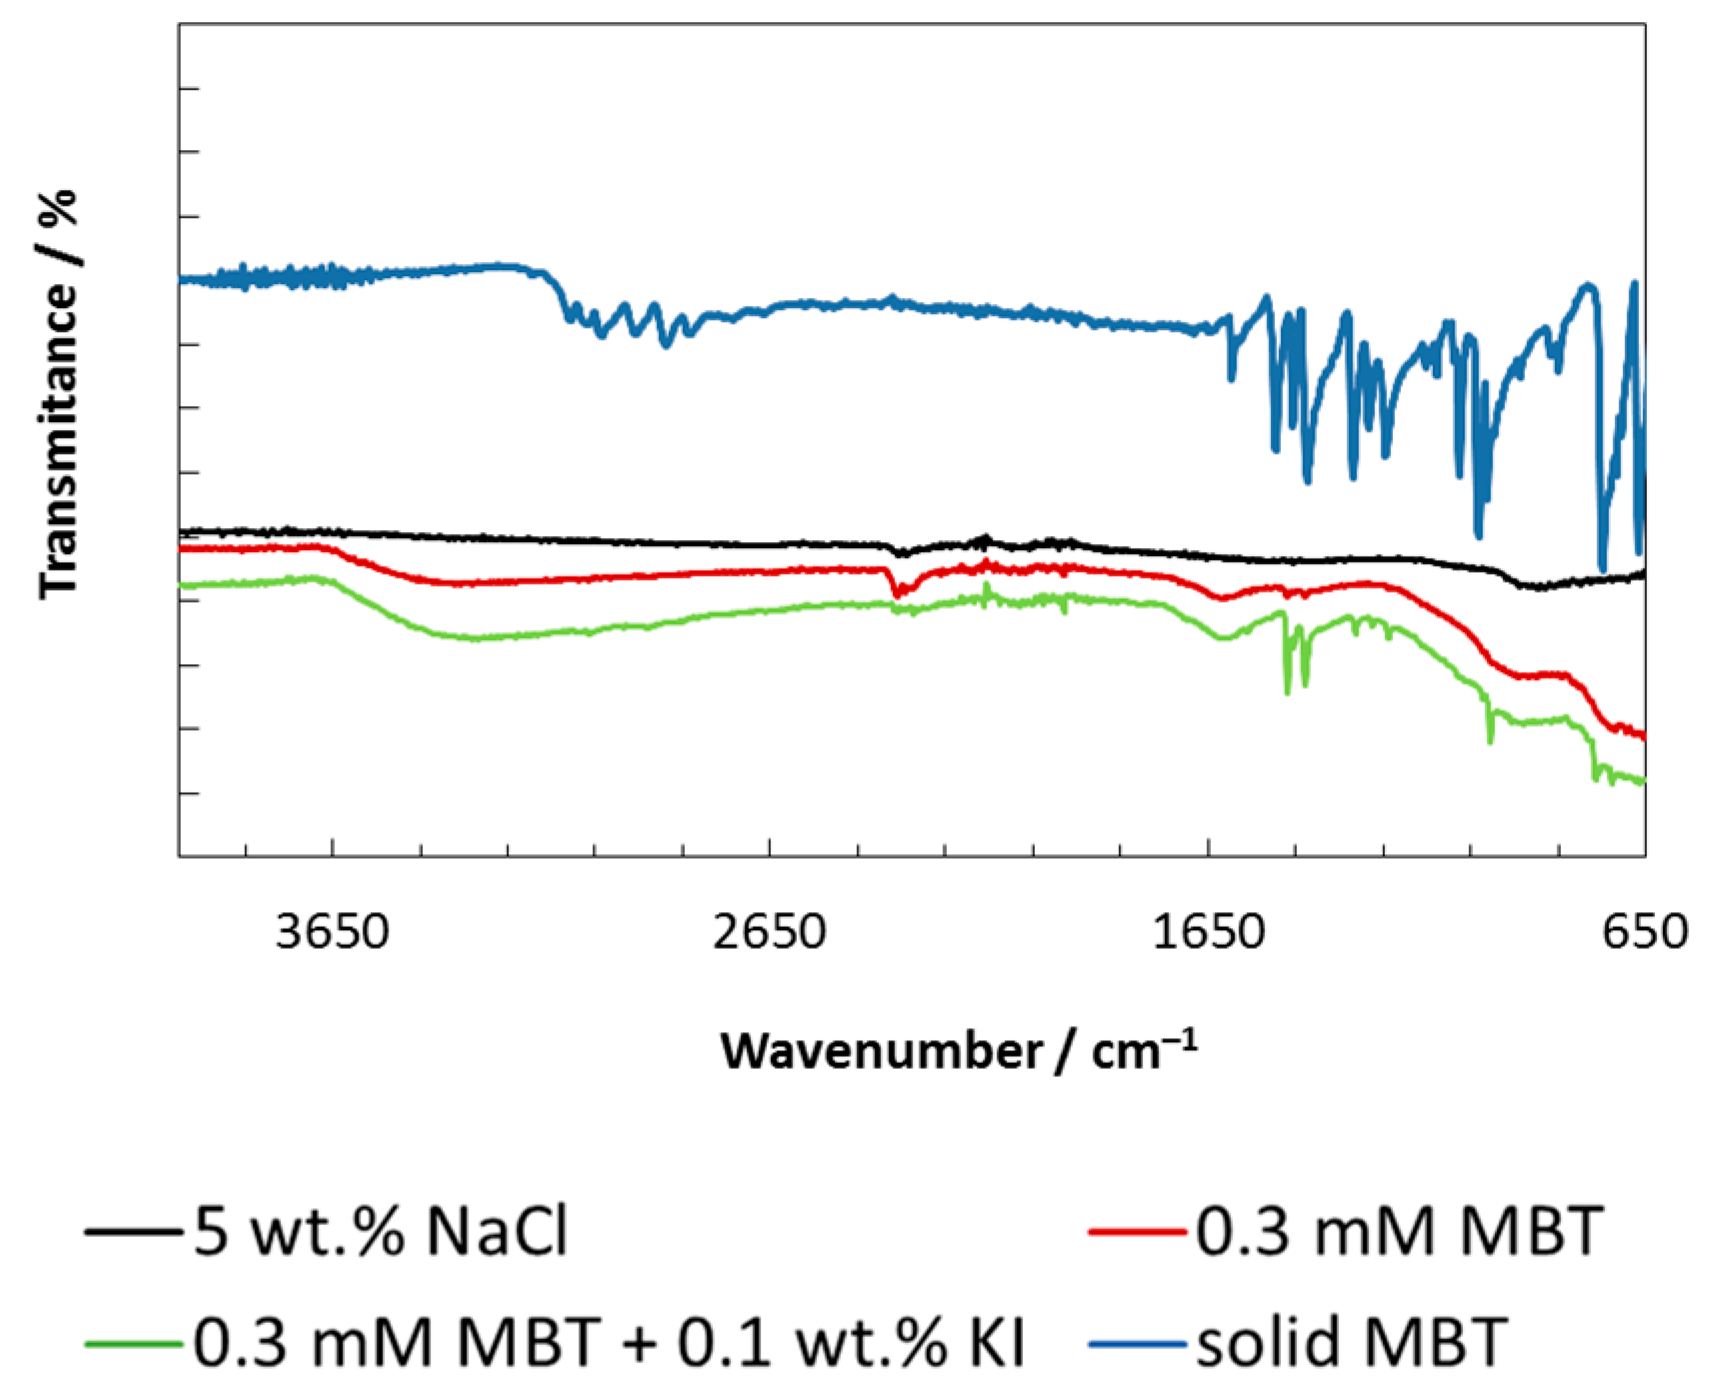
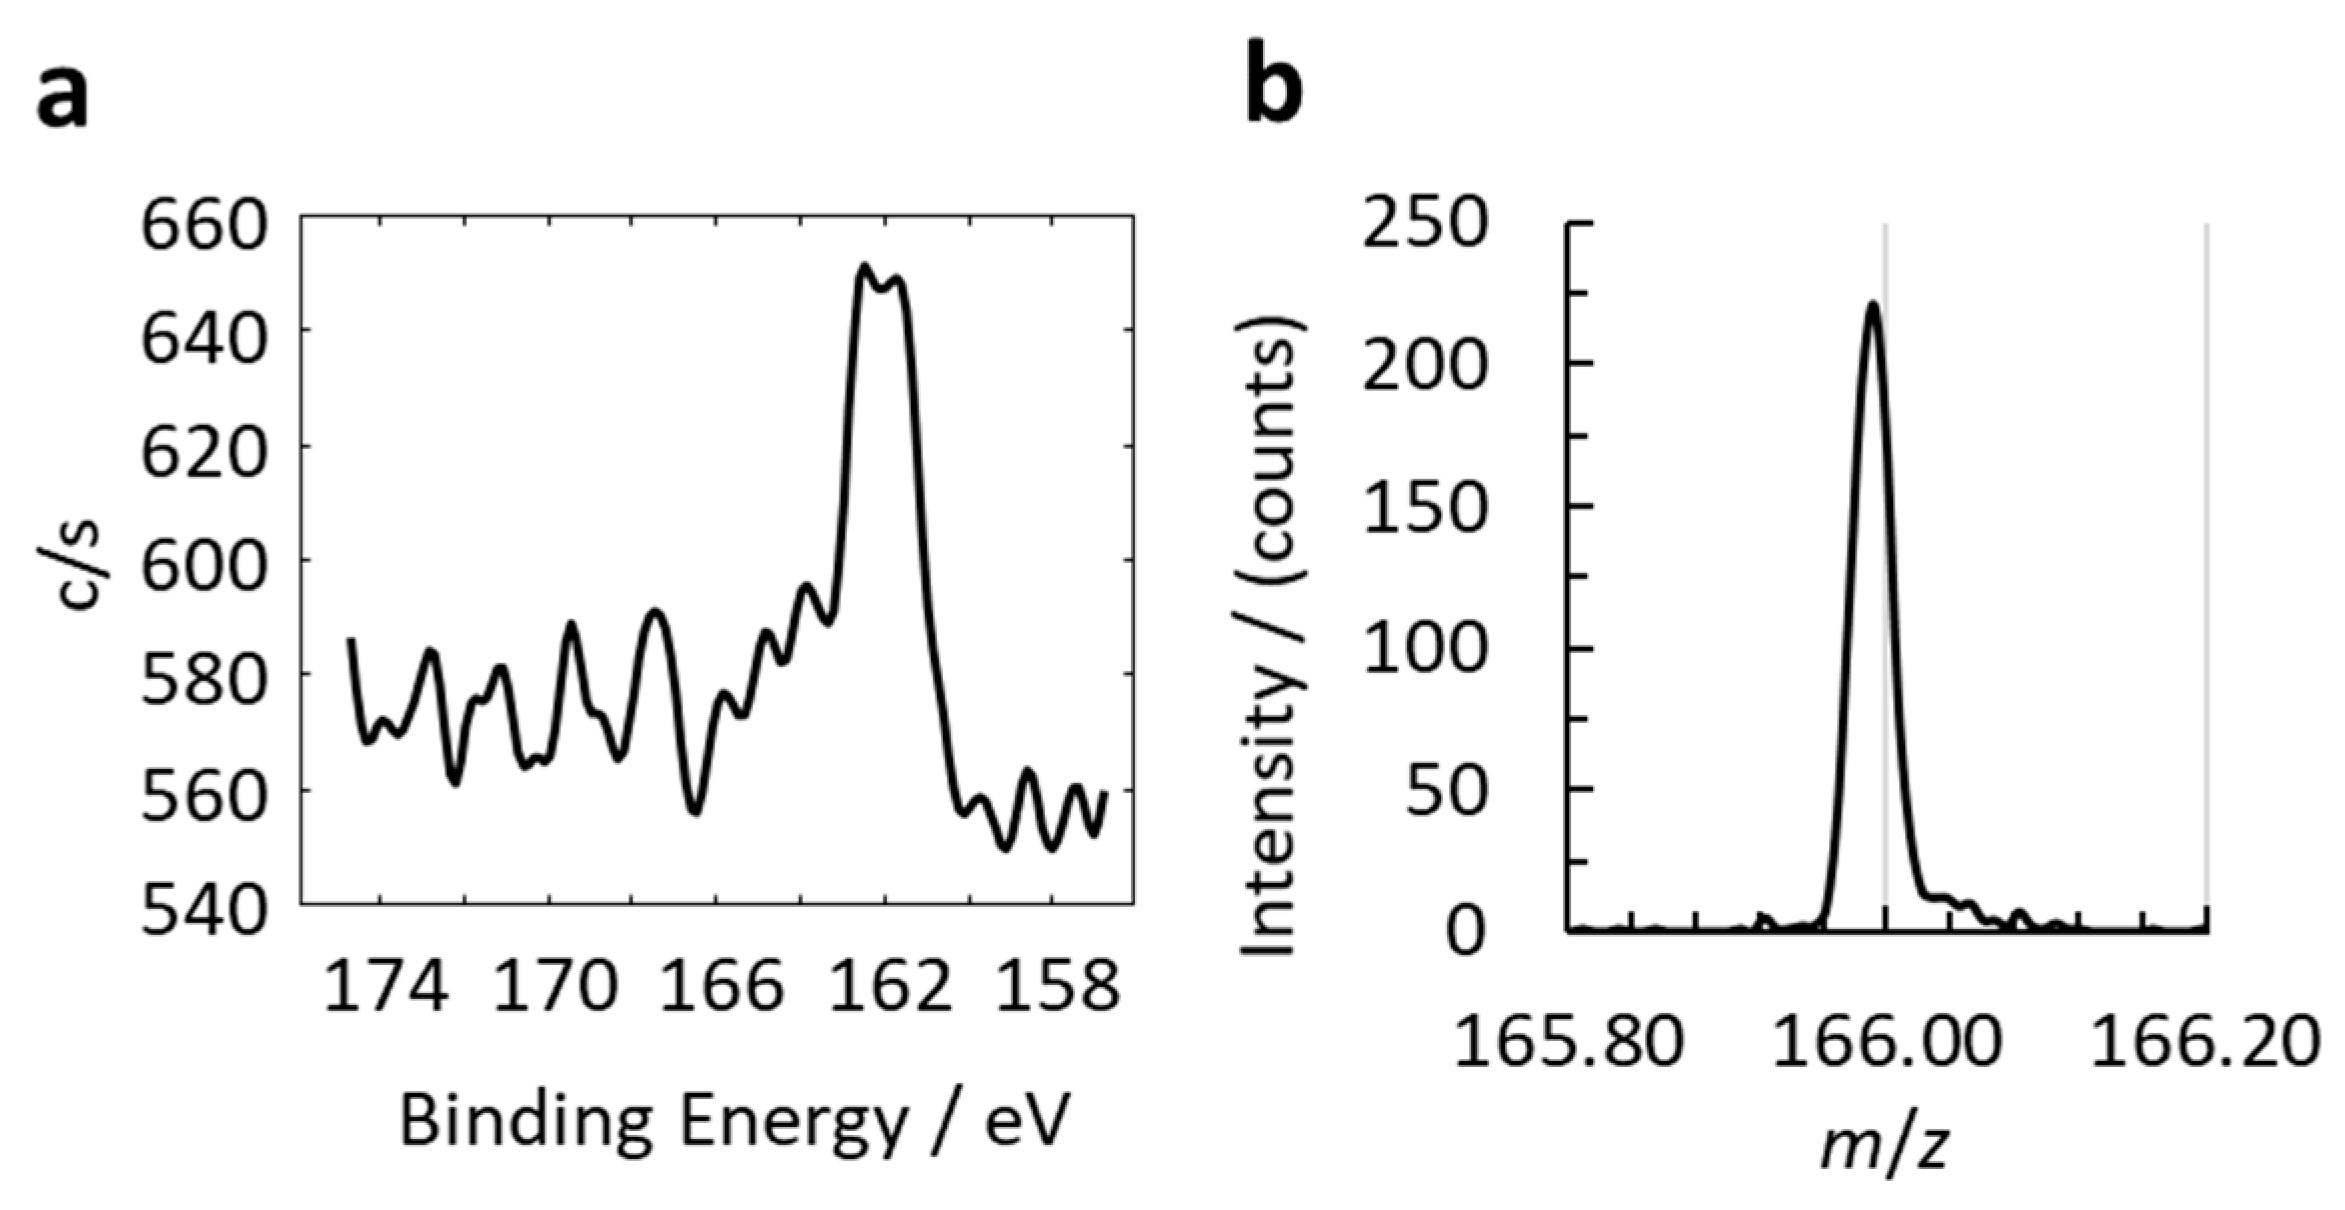
3.3. Surface Analysis

The AA6082 aluminium alloy samples prepared as described in Section 2.1 were subjected to surface characterization, including ATR-FTIR, XPS, ToF-SIMS, and contact angle measurements.
ATR-FTIR spectra are presented in Figure 8. In the spectra for the non-inhibited and the inhibited (with and without the addition of KI) samples, two peaks were observed at 2360 and 2336 cm−1, which are connected with the asymmetric stretching of CO2 [46]. Several other peaks were found in the inhibited samples. It was previously reported [47] that the peak at 1463 cm−1 is attributed to the C–N stretching vibrations. Rai et al. [48] attributed the peak at 1428 cm−1 to the vibrations of the C–N–H group in MBT. The peak observed at 1318 cm−1 has been previously attributed to the aromatic C–H in-plane bending modes [49,50]. Li et al. [51] reported that the peak at 1242 cm−1 is attributable to C–C stretching vibrations, while the peak at 1011 cm−1 is attributable to the bending C–C–C vibrations. Meanwhile, Rai et al. [48] attributed the peak at 1015 cm−1 not only to the C–C–C bending vibrations, but also to the C–S stretching vibrations. In addition, the ATR-FTIR spectra of the pure solid MBT chemical (powder) is also presented in Figure 8 for comparison. All the peaks presented above for the inhibited samples are also found in the spectra of the pure solid MBT. Because no characteristic peaks related to the adsorption of organic compounds were observed for the non-inhibited AA6082 aluminium alloy sample, and because of the peaks found on the inhibited samples, it can be concluded that MBT was adsorbed on the aluminium alloy samples. Moreover, the addition of 0.1 wt.% KI increased the amount of the adsorbed MBT on the surface as more signal was obtained for the latter compared to the system containing only MBT.
In order to confirm the adsorption of MBT with even more confidence, XPS and ToF-SIMS measurements were performed. A clear indication that MBT molecules were adsorbed on the surface is the high-resolution S 2p peak present for the inhibited samples (Figure 9a). Therefore, S-containing species are on the surface (in the present case, the S signal can only originate from the MBT molecule). Moreover, the negative ion ToF-SIMS spectra analysis confirmed the presence of C7H4NS2 at a mass-to-charge (m/z) ratio of 165.98 (Figure 9b), representing the parent ion molecule of MBT after the removal of one proton ((M–H) ion).
The influence of the adsorption of MBT on the hydrophobicity of the non-inhibited AA6082 aluminium alloy samples immersed for 1 h in 5 wt.% solution with and without the addition of 0.1 wt.% KI was studied using contact angle measurements. The average contact angles and the respective shapes of the drops for each of the tested systems at 25 °C are presented in Table 3. The highest contact angle (the most hydrophobic nature) was observed for the ground AA6082 aluminium alloy samples immersed in 5 wt.% NaCl solution (the average value for three replicate measurements was 102.5°). A significantly more hydrophilic nature was observed for the ground AA6082 aluminium alloy samples immersed in 5 wt.% NaCl solution containing 0.3 mM MBT. The average contact angle value measured for the samples immersed in the system containing 0.3 mM MBT was found to be 45.9°. Only a slight increase in the average contact angle value (51.6°) was measured for the ground AA6082 aluminium alloy samples immersed in a 5 wt.% solution containing 0.3 mM MBT with the addition of 0.1 wt.% KI. Therefore, it can be concluded that the addition of MBT renders the AA6082 aluminium alloy samples more hydrophilic. The latter suggests that the MBT surface layer does not act as a barrier for a corrosion medium, but rather forms an adsorbed layer that mitigates the oxidation (and consequently corrosion) of the AA6082 aluminium alloy samples.

4. Conclusions

The corrosion inhibition effect of five azole compounds (i.e., 2-mercaptobenzothiazole (MBT), 2-mercaptobenzoxazole (MBO), 2-mercaptobenzimidazole (MBI), benzotriazole (BTA), and 3-amino1H-1,2,4-triazole (3-AT)) on the corrosion of AA6082 aluminium alloy samples immersed in 5 wt.% NaCl solution at 25 and 50 °C was investigated. A 5 wt.% NaCl solution at a temperature of 50 °C is usually employed in automotive corrosion tests to represent a highly corrosive environment.
The EIS measurements indicated that only MBT and 3-AT showed a corrosion inhibition effect at 50 °C. These compounds were afterwards tested at 25 °C, at which only MBT showed a corrosion inhibition effect and was, therefore, analysed further. It was shown that the corrosion of the AA6082 aluminium alloy samples in 5 wt.% NaCl solution with 0.3 mM MBT at 25 °C is only under kinetic control. EIS measurements showed that for the AA6082 aluminium alloy samples immersed in 5 wt.% NaCl solution containing 0.3 mM MBT, the surface layer (comprising the oxide layer and the adsorbed inhibitor) increased with an increase in immersion time. The susceptibility of the AA6082 aluminium alloy samples to general corrosion under these conditions decreased with increasing immersion time. Potentiodynamic curve measurements showed that the addition of MBT lowered the corrosion current density of the AA6082 aluminium alloy samples. MBT acted as a cathodic-type corrosion inhibitor by mainly inhibiting the cathodic reaction of the corrosion couple. The inhibited samples showed lower susceptibility to localized (pitting) corrosion. The addition of KI as a possible intensifier did not significantly further influence the samples’ general and localized corrosion resistance, as determined by the EIS and potentiodynamic curve measurements.
The adsorption of MBT on the surface of the AA6082 aluminium alloy samples was proven by attenuated total reflectance Fourier transform infrared spectroscopy measurements, X-ray photoelectron spectroscopy, and time-of-flight secondary ion mass spectrometry. Contact angle measurements showed a significant decrease in the hydrophobicity of the samples upon the addition of 0.3 mM MBT, suggesting that the corrosion inhibition effect of MBT is not due to the formation of a barrier layer, but to a adsorbed layer that mitigates the oxidation of the base alloy.
In this study, MBT was, therefore, shown to be a corrosion inhibitor for AA6082 aluminium alloy in 5 wt.% NaCl solution. An appropriate agent that can increase the solubility of this compound will be needed to further increase its corrosion inhibition effectiveness. Furthermore, some other intensifier should be employed to increase the performance of MBT. Therefore, future studies should be oriented towards corrosion inhibitor formulation design based on MBT as a corrosion inhibitor in such mixtures.

Author Contributions

Conceptualization, M.F.; Methodology, M.F. and K.X.; Software, M.F. and K.X.; Validation, M.F. and K.X.; Formal Analysis, M.F. and K.X.; Investigation, K.X. and M.F.; Resources, M.F.; Data Curation, K.X. and M.F.; Writing—Original Draft Preparation, K.X. and M.F.; Writing—Review and Editing, K.X. and M.F.; Visualization, M.F. and K.X.; Supervision, M.F.; Project Administration, M.F.; Funding Acquisition, M.F.

Funding

This research was funded by the Slovenian Research Agency (P2-0032).

Conflicts of Interest

The authors declare no conflict of interest.

References

  1. Davis, J.R. Corrosion: Understanding the Basics; ASM International: Novelty, OH, USA, 2000. [Google Scholar]
  2. Revie, R.W. Uhlig’s Corrosion Handbook, 3rd ed.; John Willey & Sons Inc.: New York, NY, USA, 2011. [Google Scholar]
  3. Davis, J.R. Corrosion of Aluminium and Aluminium Alloys; ASM International: Novelty, OH, USA, 1999. [Google Scholar]
  4. Poznak, A.; Freiberg, D.; Sanders, P. Chapter 10—Automotive wrought aluminium alloys. In Fundamentals of Aluminium Metallurgy; Lumley, R.N., Ed.; Woodhead Publishing: Sawston, UK, 2018; pp. 333–386. [Google Scholar]
  5. Larsen, M.H.; Walmsley, J.C.; Lunder, O.; Mathiesen, R.H.; Nisancioglu, K. Intergranular corrosion of copper-containing AA6xxx AlMgSi aluminum alloys. J. Electrochem. Soc. 2008, 155, C550–C556. [Google Scholar] [CrossRef]
  6. Zhan, H.; Mol, J.M.C.; Hannour, F.; Zhuang, L.; Terryn, H.; de Wit, J.H.W. The influence of copper content on intergranular corrosion of model AlMgSi(Cu) alloys. Mater. Corros. 2008, 59, 670–675. [Google Scholar] [CrossRef]
  7. Svenningsen, G.; Lein, J.E.; Bjørgum, A.; Nordlien, J.H.; Yu, Y.; Nisancioglu, K. Effect of low copper content and heat treatment on intergranular corrosion of model AlMgSi alloys. Corros. Sci. 2006, 48, 226–242. [Google Scholar] [CrossRef]
  8. Zou, Y.; Liu, Q.; Jia, Z.; Xing, Y.; Ding, L.; Wang, X. The intergranular corrosion behavior of 6000-series alloys with different Mg/Si and Cu content. Appl. Surf. Sci. 2017, 405, 489–496. [Google Scholar] [CrossRef]
  9. Kairy, S.K.; Rometsch, P.A.; Diao, K.; Nie, J.F.; Davies, C.H.J.; Birbilis, N. Exploring the electrochemistry of 6xxx series aluminium alloys as a function of Si to Mg ratio, Cu content, ageing conditions and microstructure. Electrochim. Acta 2016, 190, 92–103. [Google Scholar] [CrossRef]
  10. Liang, W.J.; Rometsch, P.A.; Cao, L.F.; Birbilis, N. General aspects related to the corrosion of 6xxx series aluminium alloys: Exploring the influence of Mg/Si ratio and Cu. Corros. Sci. 2013, 76, 119–128. [Google Scholar] [CrossRef]
  11. Deepa, P.; Padmalatha, R. Corrosion behaviour of 6063 aluminium alloy in acidic and in alkaline media. Arab. J. Chem. 2017, 10, S2234–S2244. [Google Scholar] [CrossRef] [Green Version]
  12. Cicolin, D.; Trueba, M.; Trasatti, S.P. Effect of chloride concentration, pH and dissolved oxygen, on the repassivation of 6082-T6 Al alloy. Electrochim. Acta 2014, 124, 27–35. [Google Scholar] [CrossRef]
  13. Panagopoulos, C.N.; Georgiou, E.; Giannakopoulos, K.I.; Orfanos, P.G. Effect of pH on stress corrosion cracking of 6082 Al alloy. Metals 2018, 8, 578. [Google Scholar] [CrossRef]
  14. Trdan, U.; Grum, J. Evaluation of corrosion resistance of AA6082-T651 aluminium alloy after laser shock peening by means of cyclic polarisation and EIS methods. Corros. Sci. 2012, 59, 324–333. [Google Scholar] [CrossRef]
  15. Xhanari, K.; Finšgar, M. Electrochemical analysis of AA6082 aluminium alloy in chloride media. Int. J. Electrochem. Sci. 2017, 12, 5845–5853. [Google Scholar] [CrossRef]
  16. Firouzi, A.; Del Gaudio, C.; lamastra, F.R.; Montesperelli, G.; Bianco, A. Electrospun polymeric coatings on aluminum alloy as a straightforward approach for corrosion protection. J. Appl. Polym. Sci. 2015, 132, 41250. [Google Scholar] [CrossRef]
  17. Mori, S.; Lamastra, F.R.; Kaciulis, S.; Soltani, P.; Montesperelli, G. Low-temperature titania coatings for aluminium corrosion protection. Corros. Eng. Sci. Technol. 2018, 53, 44–53. [Google Scholar] [CrossRef]
  18. Panagopoulos, C.N.; Georgiou, E.P.; Gavras, A.G. Corrosion and wear of 6082 aluminum alloy. Tribol. Int. 2009, 42, 886–889. [Google Scholar] [CrossRef]
  19. Xhanari, K.; Finšgar, M. Organic corrosion inhibitors for aluminium and its alloys in acid solutions: A review. RSC Adv. 2016, 6, 62833–62857. [Google Scholar] [CrossRef]
  20. Xhanari, K.; Finšgar, M. Organic corrosion inhibitors for aluminum and its alloys in chloride and alkaline solutions: A review. Arab. J. Chem. 2016, in press. [Google Scholar] [CrossRef]
  21. Xhanari, K.; Finsgar, M.; Knez Hrncic, M.; Maver, U.; Knez, Z.; Seiti, B. Green corrosion inhibitors for aluminium and its alloys: A review. RSC Adv. 2017, 7, 27299–27330. [Google Scholar] [CrossRef]
  22. Xhanari, K.; Finsgar, M. The first electrochemical and surface analysis of 2-aminobenzimidazole as a corrosion inhibitor for copper in chloride solution. New J. Chem. 2017, 41, 7151–7161. [Google Scholar] [CrossRef] [Green Version]
  23. Finšgar, M. 2-mercaptobenzimidazole as a copper corrosion inhibitor: Part I. Long-term immersion, 3D-profilometry, and electrochemistry. Corros. Sci. 2013, 72, 82–89. [Google Scholar] [CrossRef]
  24. Finšgar, M. Electrochemical analysis of 4-methyl-2-phenyl-imidazole adsorbed on Cu. Int. J. Electrochem. Sci. 2016, 11, 6775–6790. [Google Scholar] [CrossRef]
  25. Finšgar, M.; Merl, D.K. 2-Mercaptobenzoxazole as a copper corrosion inhibitor in chloride solution: Electrochemistry, 3D-profilometry, and XPS surface analysis. Corros. Sci. 2014, 80, 82–95. [Google Scholar] [CrossRef]
  26. Finšgar, M.; Merl, D.K. An electrochemical, long-term immersion, and XPS study of 2-mercaptobenzothiazole as a copper corrosion inhibitor in chloride solution. Corros. Sci. 2014, 83, 164–175. [Google Scholar] [CrossRef]
  27. Finšgar, M.; Lesar, A.; Kokalj, A.; Milošev, I. A comparative electrochemical and quantum chemical calculation study of BTAH and BTAOH as copper corrosion inhibitors in near neutral chloride solution. Electrochim. Acta 2008, 53, 8287–8297. [Google Scholar] [CrossRef]
  28. Finšgar, M.; Xhanari, K. Electrochemical and surface analysis of 2-phenylimidazole adsorbed on copper from chloride solution. Coatings 2018, 8, 234. [Google Scholar] [CrossRef]
  29. Huang, H.; Wang, Z.; Gong, Y.; Gao, F.; Luo, Z.; Zhang, S.; Li, H. Water soluble corrosion inhibitors for copper in 3.5 wt % sodium chloride solution. Corros. Sci. 2017, 123, 339–350. [Google Scholar] [CrossRef]
  30. Curkovic, H.O.; Stupnisek-Lisac, E.; Takenouti, H. The influence of pH value on the efficiency of imidazole based corrosion inhibitors of copper. Corros. Sci. 2010, 52, 398–405. [Google Scholar] [CrossRef]
  31. Petrović Mihajlović, M.B.; Radovanović, M.B.; Tasić, Ž.Z.; Antonijević, M.M. Imidazole based compounds as copper corrosion inhibitors in seawater. J. Mol. Liquids 2017, 225, 127–136. [Google Scholar] [CrossRef]
  32. Mennucci, M.M.; Banczek, E.P.; Rodrigues, P.R.P.; Costa, I. Evaluation of benzotriazole as corrosion inhibitor for carbon steel in simulated pore solution. Cem. Concr. Compos. 2009, 31, 418–424. [Google Scholar] [CrossRef]
  33. Finšgar, M.; Petovar, B.; Xhanari, K.; Maver, U. The corrosion inhibition of certain azoles on steel in chloride media: Electrochemistry and surface analysis. Corros. Sci. 2016, 111, 370–381. [Google Scholar] [CrossRef]
  34. Sabet Bokati, K.; Dehghanian, C.; Yari, S. Corrosion inhibition of copper, mild steel and galvanically coupled copper-mild steel in artificial sea water in presence of 1H-benzotriazole, sodium molybdate and sodium phosphate. Corros. Sci. 2017, 126, 272–285. [Google Scholar] [CrossRef]
  35. Abd El Haleem, S.M.; Abd El Wanees, S.; Bahgat, A. Environmental factors affecting the corrosion behaviour of reinforcing steel. VI. Benzotriazole and its derivatives as corrosion inhibitors of steel. Corros. Sci. 2014, 87, 321–333. [Google Scholar] [CrossRef]
  36. Sherif, E.-S.M. Electrochemical investigations on the corrosion inhibition of aluminum by 3-amino-1,2,4-triazole-5-thiol in naturally aerated stagnant seawater. J. Ind. Eng. Chem. 2013, 19, 1884–1889. [Google Scholar] [CrossRef]
  37. Zor, S.; Saǧdinç, S. Experimental and theoretical study of sulfathiazole as environmentally friendly inhibitor on aluminum corrosion in NaCl. Prot. Met. Phys. Chem. Surf. 2014, 50, 244–253. [Google Scholar] [CrossRef]
  38. Harvey, T.G.; Hardin, S.G.; Hughes, A.E.; Muster, T.H.; White, P.A.; Markley, T.A.; Corrigan, P.A.; Mardel, J.; Garcia, S.J.; Mol, J.M.C.; et al. The effect of inhibitor structure on the corrosion of AA2024 and AA7075. Corros. Sci. 2011, 53, 2184–2190. [Google Scholar] [CrossRef]
  39. Lamaka, S.V.; Zheludkevich, M.L.; Yasakau, K.A.; Montemor, M.F.; Ferreira, M.G.S. High effective organic corrosion inhibitors for 2024 aluminium alloy. Electrochim. Acta 2007, 52, 7231–7247. [Google Scholar] [CrossRef]
  40. Coelho, L.B.; Cossement, D.; Olivier, M.-G. Benzotriazole and cerium chloride as corrosion inhibitors for AA2024-T3: An EIS investigation supported by SVET and ToF-SIMS analysis. Corros. Sci. 2018, 130, 177–189. [Google Scholar] [CrossRef]
  41. ISO 9227:2006(E) Corrosion Tests in Artificial Atmospheres—Salt Spray Tests; ISO: Geneva, Switzerland, 2006.
  42. Finšgar, M.; Jackson, J. Application of corrosion inhibitors for steels in acidic media for the oil and gas industry: A review. Corros. Sci. 2014, 86, 17–41. [Google Scholar] [CrossRef] [Green Version]
  43. Massart, D.L.; Vandeginste, B.G.M.; Buydens, L.M.C.; Jong, S.D.; Lewi, P.J.; Smeyers-Verbeke, J. Handbook of Chemometrics and Qualimetrics: Part A; Elsevier Science: Amsterdam, The Netherlands, 1997; p. 112. [Google Scholar]
  44. Kovač, J.; Finšgar, M. Analysis of the thermal stability of very thin surface layers of corrosion inhibitors by time-of-flight secondary ion mass spectrometry. J. Am. Soc. Mass Spectrom. 2018, 29, 2305–2316. [Google Scholar] [CrossRef]
  45. Finšgar, M.; Milošev, I. Corrosion behaviour of stainless steels in aqueous solutions of methanesulfonic acid. Corros. Sci. 2010, 52, 2430–2438. [Google Scholar] [CrossRef]
  46. Gerakines, P.A.; Schutte, W.A.; Greenberg, J.M.; van Dishoeck, E.F. The infrared band atrengths of H2O, CO and CO2 in laboratory simulations of astrophysical ice mixtures. Astron. Astrophys. 1995, 296, 810–818. [Google Scholar]
  47. Güllüoğlu, M.T.; Erdogdu, Y.; Karpagam, J.; Sundaraganesan, N.; Yurdakul, Ş. DFT, FT-Raman, FT-IR and FT-NMR studies of 4-phenylimidazole. J. Mol. Struct. 2011, 990, 14–20. [Google Scholar] [CrossRef]
  48. Rai, A.K.; Singh, R.; Singh, K.N.; Singh, V.B. FTIR, Raman spectra and ab initio calculations of 2-mercaptobenzothiazole. Spectrochim. Acta Part A Mol. Biomol. Spectrosc. 2006, 63, 483–490. [Google Scholar] [CrossRef] [PubMed]
  49. Sudha, S.; Karabacak, M.; Kurt, M.; Cinar, M.; Sundaraganesan, N. Molecular structure, vibrational spectroscopic, first-order hyperpolarizability and HOMO, LUMO studies of 2-aminobenzimidazole. Spectrochim. Acta Part A Mol. Biomol. Spectrosc. 2011, 84, 184–195. [Google Scholar] [CrossRef] [PubMed]
  50. Erdogdu, Y.; Eskioǧlu, B.; Güllüoǧlu, M.T. Theoretical investigations on the molecular structure and vibrational spectral analysis of 4-methyl 2-phenylimidazole. Opt. Spectrosc. 2012, 113, 596–606. [Google Scholar] [CrossRef]
  51. Li, X.; Tang, Z.; Zhang, X. Molecular structure, IR spectra of 2-mercaptobenzothiazole and 2-mercaptobenzoxazole by density functional theory and ab initio Hartree–Fock calculations. Spectrochim. Acta Part A Mol. Biomol. Spectrosc. 2009, 74, 168–173. [Google Scholar] [CrossRef] [PubMed]
Figure 1. Structures of the five azole compounds used in this study.
Coatings 09 00380 g001
Figure 2. The Nyquist plots of the AA6082 aluminium alloy samples immersed at 50 °C in 5 wt.% NaCl solution containing different concentrations of five azole compounds.
Coatings 09 00380 g002
Figure 3. The influence of the immersion time on the open circuit potential values of the AA6082 aluminium alloy samples immersed in 5 wt.% NaCl solution with and without 0.3 mM MBT or a combination of 0.3 mM MBT and 0.1 wt.% KI at 25 °C. The discontinuous parts of the curves indicate the moments when the EIS measurements were performed.
Coatings 09 00380 g003
Figure 4. The measured electrochemical impedance spectroscopy (EIS) spectra (dotted) and the respective fitting (in continuous lines) for the AA6082 aluminium alloy samples immersed for 1–10 h, at 25 °C, in (ac) 5 wt.% NaCl solution, (df) 5 wt.% NaCl solution containing 0.3 mM MBT, and (gi) 5 wt.% NaCl solution containing 0.3 mM MBT with the addition of 0.1 wt.% KI.
Coatings 09 00380 g004aCoatings 09 00380 g004b
Figure 5. The R(Q1(R1(Q2(R2))) equivalent electrical circuit (EEC) model used to fit the EIS response of the AA6082 aluminium alloy samples immersed in 5 wt.% NaCl solution with and without 0.3 mM MBT or a combination of 0.3 mM MBT and 0.1 wt.% KI.
Coatings 09 00380 g005
Figure 6. The variation of Rp values with increasing immersion time for the AA6082 aluminium alloy samples immersed for 1–10 h at 25 °C in 5 wt.% NaCl solution with or without 0.3 mM MBT or 0.3 mM MBT and the addition of either 0.1 or 1.0 wt.% KI.
Coatings 09 00380 g006
Figure 7. Potentiodynamic curves for the AA6082 aluminium alloy samples after 11 h of immersion at 25 °C in 5 wt.% NaCl solution containing 0.3 mM MBT or a combination of 0.3 mM MBT and 0.1 wt.% KI.
Coatings 09 00380 g007
Figure 8. ATR-FTIR spectra of the AA6082 aluminium alloy samples immersed for 31 days in 5 wt.% NaCl solution with the addition of 0.3 mM MBT or a combination of 0.3 mM MBT and 0.1 wt.% KI. The ATR-FTIR spectra of the pure solid MBT is given also for comparison.
Coatings 09 00380 g008
Figure 9. High-resolution (a) S 2p XPS spectra and (b) time-of-flight secondary ion mass spectrometry (ToF-SIMS) measurements for the MBT adsorbed on AA6082 aluminium alloy.
Coatings 09 00380 g009
Table 1. Chemical composition of AA6082 aluminium alloy as specified by the supplier.
ElementSiFeCuMnMgCrZnTiAl
Content (wt.%)0.900.350.070.450.900.040.050.02balance
Table 2. The parameters obtained from fitting the EIS response of the AA6082 aluminium alloy samples immersed in 5 wt.% NaCl solution containing 0.3 mM MBT or a combination of 0.3 mM MBT and 0.1 wt.% KI, after 1–10 h of immersion, at 25 °C. In addition, the fitted parameters from the EIS spectra of the AA6082 aluminium samples in 5 wt.% NaCl solution, previously reported in [15], are given for comparison. Units: χ2 [×10−3], RΩ [Ω cm2], R1, R2, and Rp [kΩ cm2], Q1 and Q2 [μΩ−1 cm−2 sn], and C1 and C2 [μF cm−2].
Immersion Time [h]χ2RQ1n1R1C1Q2n2R2C2Rp
5 wt.% NaCl solution
10.845.90217.000.6939.70581.5017.20.8643.3016.4656.16
30.985.84276.000.8548.00440.1616.80.8652.3016.45100.30
50.615.69396.000.9946.40401.8416.50.8650.8015.9697.20
70.225.65340.000.8458.70593.7615.30.8648.1014.56106.80
10 0.245.60325.000.8373.00607.6214.70.8645.0013.77118.00
5 wt.% NaCl solution containing 0.3 mM MBT
11.265.7416.180.8728.5914.495.660.84138.035.41166.62
31.105.7214.790.8822.2912.685.470.75233.975.95256.26
51.025.6814.350.8823.5212.395.240.76297.876.03321.39
70.915.6713.950.8821.7911.925.210.75344.606.33366.39
100.865.5813.490.8917.2511.205.310.76348.756.45366.00
5 wt.% NaCl solution containing 0.3 mM MBT with the addition of 0.1 wt.% KI
12.525.4714.890.8821.2612.706.240.84113.005.83134.26
31.685.5612.710.8910.529.876.070.69251.307.34261.82
51.305.5912.280.8914.119.915.860.72299.307.33313.41
71.155.5911.900.9012.269.505.910.70338.508.01350.76
101.285.6011.580.9012.849.325.850.70407.408.52420.24
5 wt.% NaCl solution containing 0.3 mM MBT with the addition of 1.0 wt.% KI
12.935.0517.90.8714.8614.805.500.8781.804.8696.66
32.455.0315.60.887.6511.796.230.76177.206.43184.85
52.505.0214.50.895.9410.656.480.74257.207.74263.14
72.495.0314.00.895.8410.336.740.74305.208.72311.04
102.485.0413.30.905.359.806.890.73363.509.69368.85
Table 3. Average contact angle values (out of three replicate measurements) and the shape of the respective drop (one example) for the ground AA6082 aluminium alloy samples immersed for 1 h in 5 wt.% NaCl solution containing 0.3 mM MBT or a combination of 0.3 mM MBT and the addition of 0.1 wt.% KI at 25 °C.
MediumAverage Contact Angle [°]Shape of the Drops on the Sample
5 wt.% NaCl solution 102.5 Coatings 09 00380 i001
5 wt.% NaCl solution containing 3 mM MBT45.9 Coatings 09 00380 i002
5 wt.% NaCl solution containing 3 mM MBT + 0.1 wt.% KI51.6 Coatings 09 00380 i003

