Article

Anti-Icing Performance of a Coating Based on Nano/Microsilica Particle-Filled Amino-Terminated PDMS-Modified Epoxy

1
Key Laboratory of Advanced Ship Materials and Mechanics, School of Aerospace and Civil Engineering, Harbin Engineering University, Harbin 150001, China
2
Institute of Petro-chemistry, Heilongjiang Academy of Science, Harbin 150040, China
3
Ice Sports Equipment Lab, Harbin Finance University, Harbin 150030, China
*
Authors to whom correspondence should be addressed.
Coatings 2019, 9(12), 771; https://doi.org/10.3390/coatings9120771
Submission received: 8 September 2019 / Revised: 18 November 2019 / Accepted: 18 November 2019 / Published: 20 November 2019
(This article belongs to the Special Issue Anti-Icing Coatings and Surfaces)

Abstract

:
Coatings with anti-icing performance possess hydrophobicity and low ice adhesion strength, which delay ice formation and make ice removal easier. In this paper, the anti-icing performance of nano/microsilica particle-filled amino-terminated PDMS (A-PDMS)-modified epoxy coatings was investigated. In the process, the influence of the addition of A-PDMS on the hydrophobicity and ice adhesion strength was investigated. Furthermore, the influences of various weight ratios of nanosilica/microsilica (Rn/m) on the hydrophobicity and ice adhesion strength of the coating were investigated. Hydrophobicity was evaluated by contact angle (CA) and contact angle hysteresis (CAH) tests. Ice adhesion strength was measured by a centrifugal adhesion test. The addition of A-PDMS markedly increased hydrophobicity and decreased ice adhesion. The size combination of particles obviously affects hydrophobicity but has little effect on ice adhesion. Finally, X-ray photoelectron spectroscopy (XPS) and scanning electron microscopy (SEM) were used to reveal the anti-icing mechanism of the coatings.

1. Introduction

Ice accumulation causes harm and economic problems in various applications, such as electric power, ships and aircraft. In recent years, anti-icing coatings have attracted much interest from many researchers [1,2,3,4]. The anti-icing performance of coatings can lower the ice adhesion strength and delay freezing. The former makes ice removal easy, while the latter delays ice formation and reduces ice accumulation.
Hydrophobicity is a good property for delaying the formation of ice because a hierarchical surface can increase the ice nucleation free energy barrier and reduce heat exchange [1,5]. Many researchers have fabricated textured coatings with excellent hydrophobicity based on epoxy [6,7,8]. Fan [9] prepared a superhydrophobic coating by spraying carbon nanotubes and epoxy. It showed an excellent anti-icing ability at −10 °C. Penga [10] also created a SiO2/epoxy/PVDF coating with anti-icing properties.
Textured surfaces can also reduce ice adhesion strength by decreasing contact angle hysteresis (CAH) and reducing the ice-solid contact area. Many studies have used nanoparticle-filled coatings to reduce ice adhesion strength [11,12,13,14]. Kulinich [14] prepared a series of coatings filled with nanoparticles and showed that the ice adhesion strength on the coating was ~5.7 times lower than that on bare polished aluminium. Zheng [15] reported a bioepoxy coating with a low ice adhesion strength of 0.1 MPa prepared by introducing dual-scale SiO2 nanoparticles (5–15 nm and 200 nm). However, there are no reports on nano/microparticle-filled coatings for anti-icing applications.
In this work, we prepared a mixed-size nano/microstructure coating by a one-step spray-coating method, which is simple, convenient and easy to implement in engineering. Both the freezing delay property and ice adhesion strength were studied. In this study, the nano/microsilica particles were modified by a silane coupling agent. Then, the mixed nano/microsilica particles and A-PDMS/epoxy solution were sprayed on specimens. We mainly investigated the particle size combination effect on ice adhesion strength and icing delay time. Ice types (rime ice, normal ice and glaze ice) and temperature effects on ice adhesion strength were also investigated. In the process, ice adhesion strength was tested using a centrifuge adhesion test in a refrigerated centrifuge. X-ray photoelectron spectroscopy (XPS) and scanning electron microscopy (SEM) were used to analyse the chemical composition and surface structure, respectively.

2. Materials and Methods

2.1. Materials

Bisphenol A epoxy resin (E-54, viscosity: 8000 cps, epoxy equivalent weight: 179−189 g/mol, average molar mass: 368 g/mol) was purchased from Wuxi BLUE-STAR Petrochemical (Wuxi, China). A-PDMS (8040A, viscosity: 2000 cps) was purchased from Dow Corning (Midland, MI, USA). Nanosilica (30 ± 7 nm) and microsilica (5 μm) were purchased from Aladdin (Shanghai, China). APTES (KH-550, viscosity: 1.6 cps) was obtained from the Institute of Petro-chemistry of Heilongjiang Academy of Science (Harbin, China). Polyamide curing agent (low molecular weight 200#, viscosity: 10,000 cps) was obtained from the Institute of Petro-chemistry of Heilongjiang Academy of Science, China.

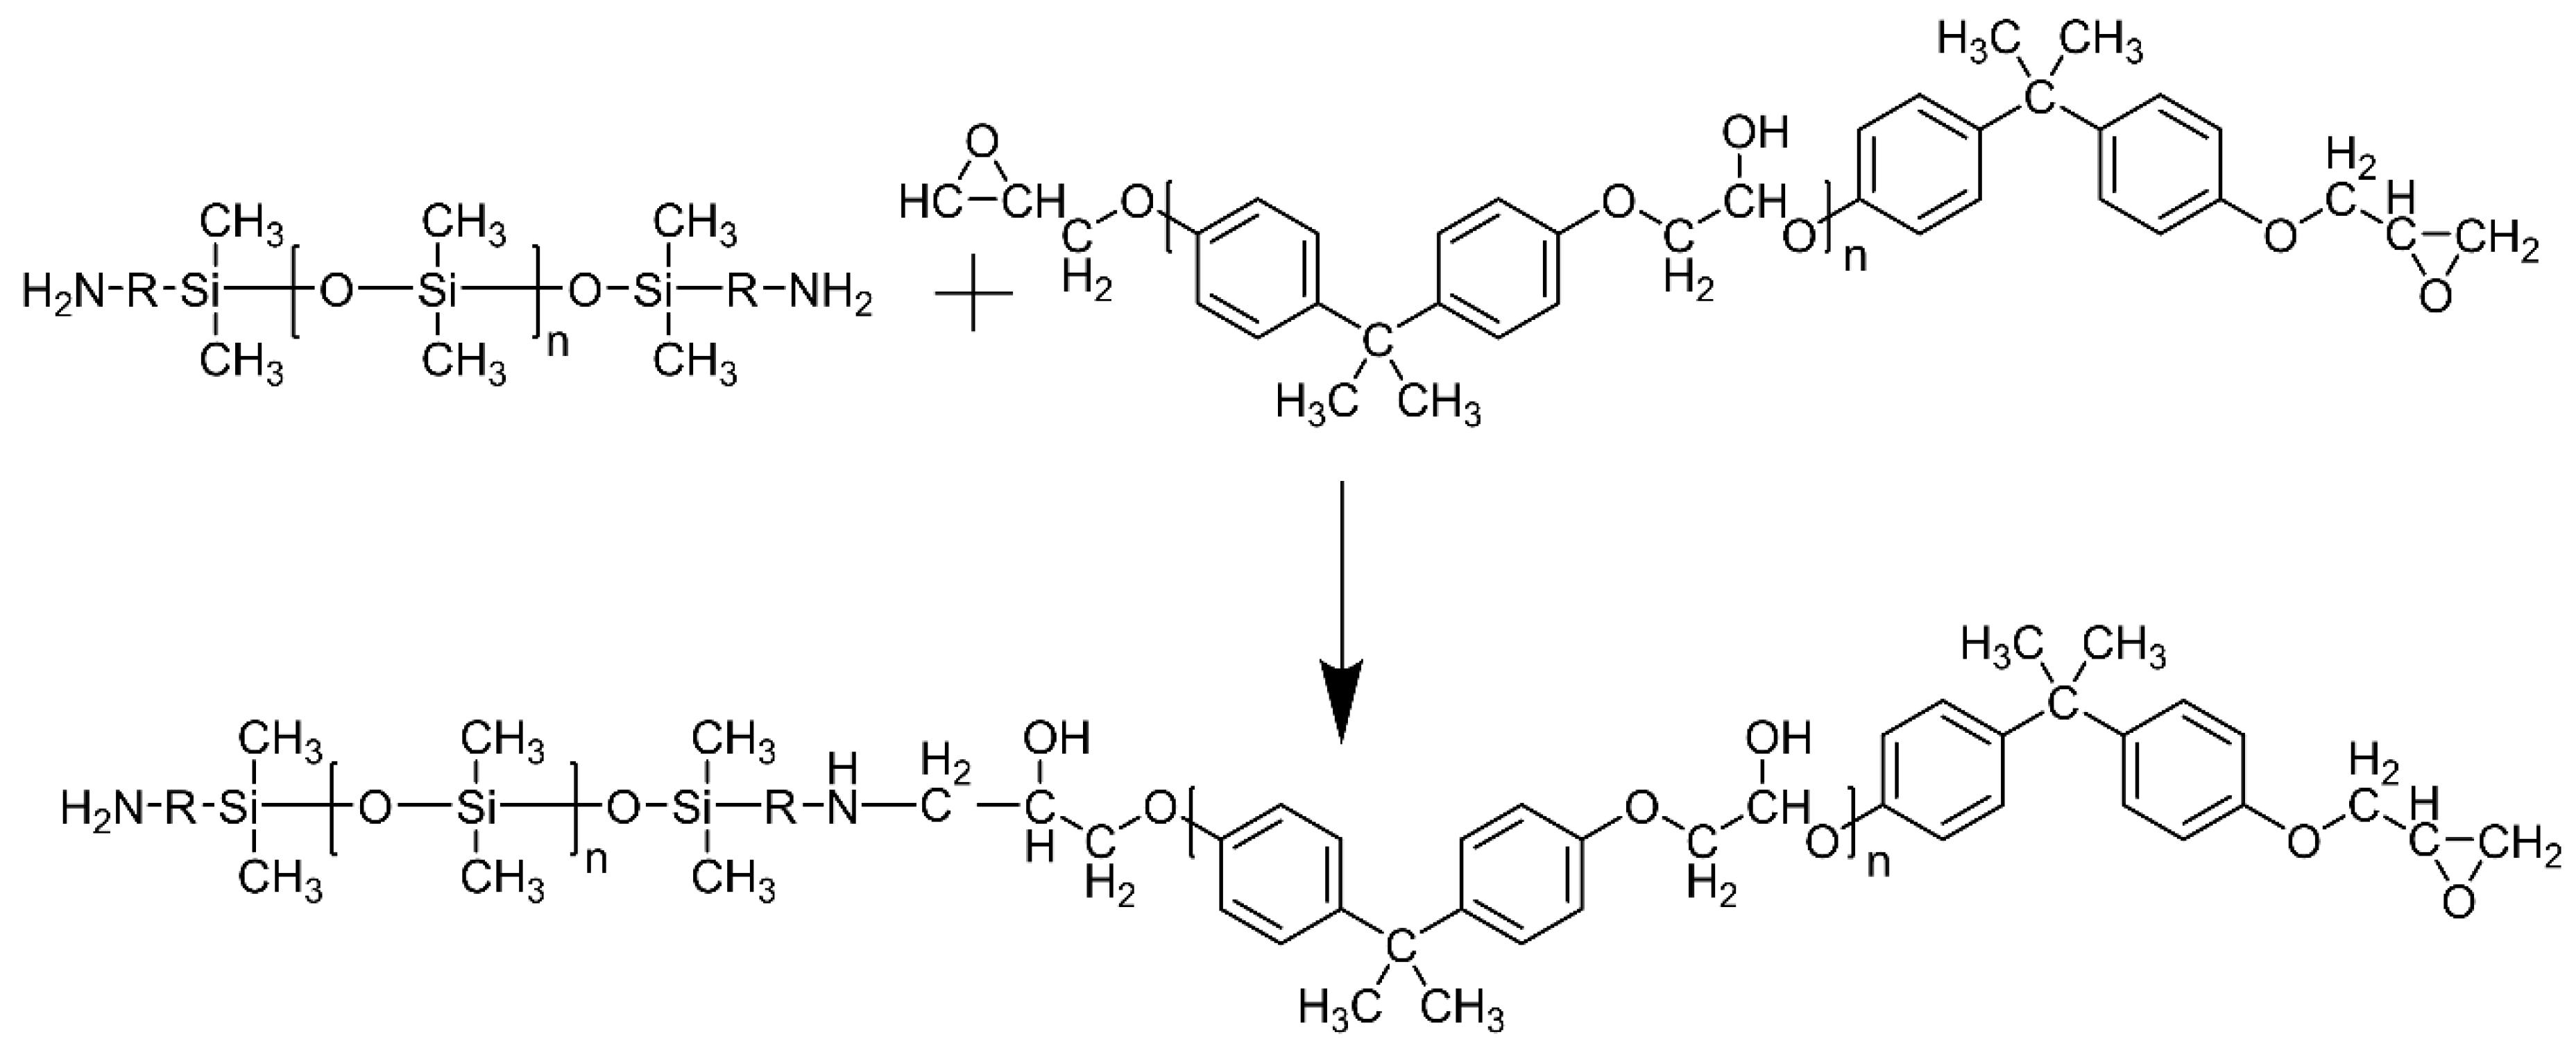
2.2. A-PDMS-Modified Epoxy Coating

In this work, A-PDMS was used as a low surface energy additive. A-PDMS and epoxy are compatible due to the amino groups of A-PDMS reacting with the epoxy groups of the epoxy resin. The chemical reaction is shown in Scheme 1.
The detailed process was as follows: Epoxy (0.5 g), polyamide (0.5 g) and various additions of A-PDMS (5–40 phr (parts per hundreds of resin)) were mixed together with efficient stirring by an electric mechanical mixer at a speed of 50 rpm for 30 min. The mixture was uniformly applied to the substrate (5 cm × 4 cm × 0.2 cm, aluminium alloy) and then dried in an oven at 40 °C for 2 h to flow flat. Finally, the coated substrate was cured at 80 °C for 3 h or at room temperature for 24 h.

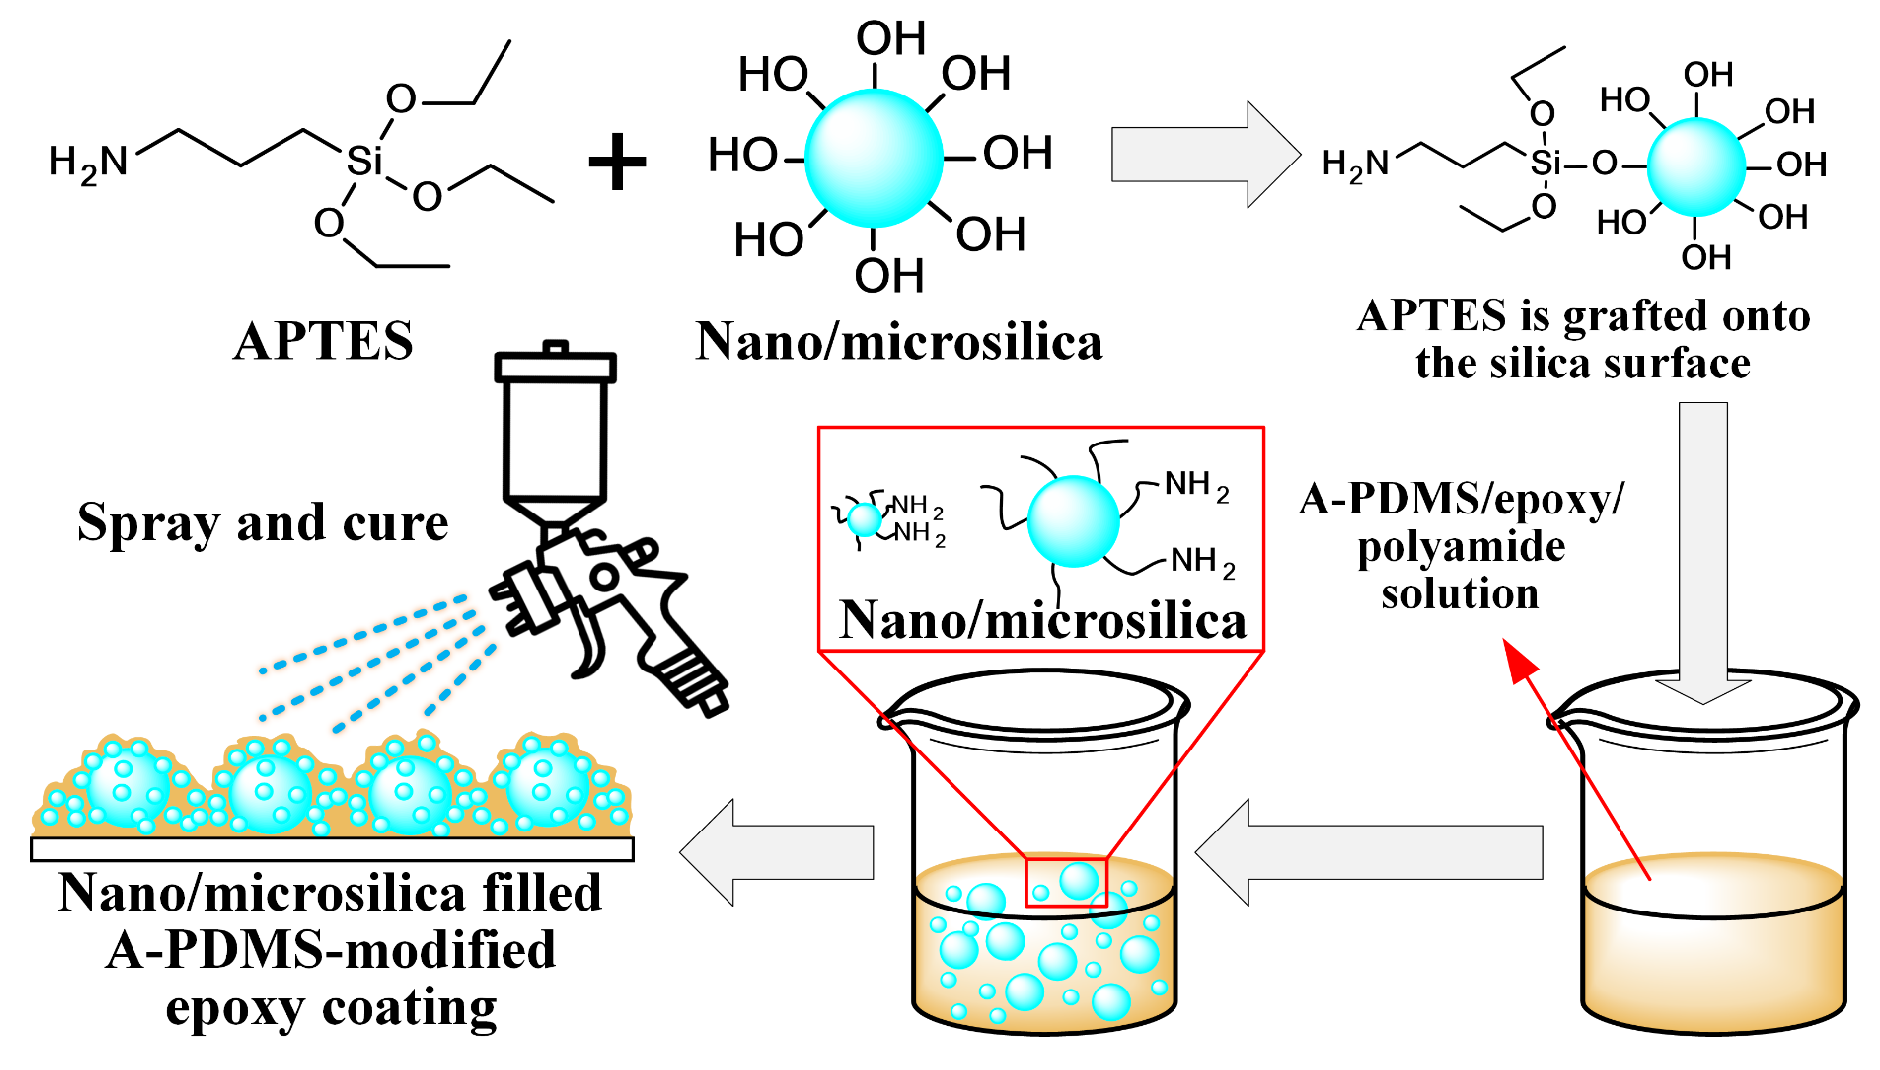
2.3. One-Step Spray Coating of Nano/Microsilica Filled A-PDMS-Modified Epoxy Coating

Scheme 1 shows the preparation procedure of the silica particle-filled A-PDMS-modified epoxy coating. First, the nanosilica or microsilica was treated by APTES to reduce particle agglomeration and improve its miscibility with the epoxy resin. The reaction scheme of silica particles and APTES is shown in Figure 1: the –C2H5 groups of APTES react with –OH groups of the silica surface, and the APTES molecule is grafted onto the silica surface. The detailed process is as follows: 4 g of microsilica particles (~5 μm) or 4 g of nanosilica particles (~30 nm) were added to alcohol (80 g). Then, APTES (5% weight of silica) was added. The suspension was ultrasonically stirred for 30 min, followed by magnetic stirring at approximately 500 rpm for 2 h at 70 °C.
A-PDMS (25 phr), epoxy resin (0.5 g) and polyamide curing agent (0.5 g) were added to alcohol (10 g) and toluene (10 g). Then, the APTES-treated silica/alcohol suspension was subsequently added. The mixture was ultrasonically stirred for 30 min at room temperature until the suspension homogenized. The suspension was directly sprayed onto a steel substrate (5 cm × 4 cm × 0.2 cm) by a spray gun at a pressure of 2–3 kg cm−2 at 15~20 cm. The nozzle diameter was 1.5 mm. The stroke speed of the spray gun was approximately 0.1 m/s. The spray cycles were approximately 3~5 times. The coated substrate was dried in a drying oven at 40 °C for 2 h to remove residual solvent. Finally, coated substrates were cured at 80 °C for 3 h or at room temperature for 24 h.

2.4. CA, CAH and Sliding Angle (SA) Measurements

CA, CAH and SA measurements were performed using a contact angle meter (YAKE-360A, Chengde Yike Instrument Factory, Chengde, China). The apparent contact angle is the angle between the apparent solid surface and the tangent to the liquid-fluid interface. For a smooth surface, the apparent contact angle is close to the intrinsic contact angle. Deionized water was used with a volume of approximately 10 μL for CA and CAH measurements. Drop images were recorded and analysed with Dropsnake software. The contour of the drop was determined using a piecewise polynomial fit method, and then the CA was evaluated. The CAH was measured by increasing and reducing the volume of the drop through a syringe and a needle. The injection and withdrawal speeds were slow to keep the three-phase contact line in equilibrium. The advancing contact angles (θadv) were measured when the contact line was expanding. Similarly, the receding contact angles (θrec) were measured when the contact line was withdrawing. CAH is defined as the difference between θadv and θrecadv−θrec). All measurements were measured at 4 locations on a sample at room temperature. SA was measured by inclining the coating surface. Once the drop (approximately 20 μL) slid, the SA was recorded.

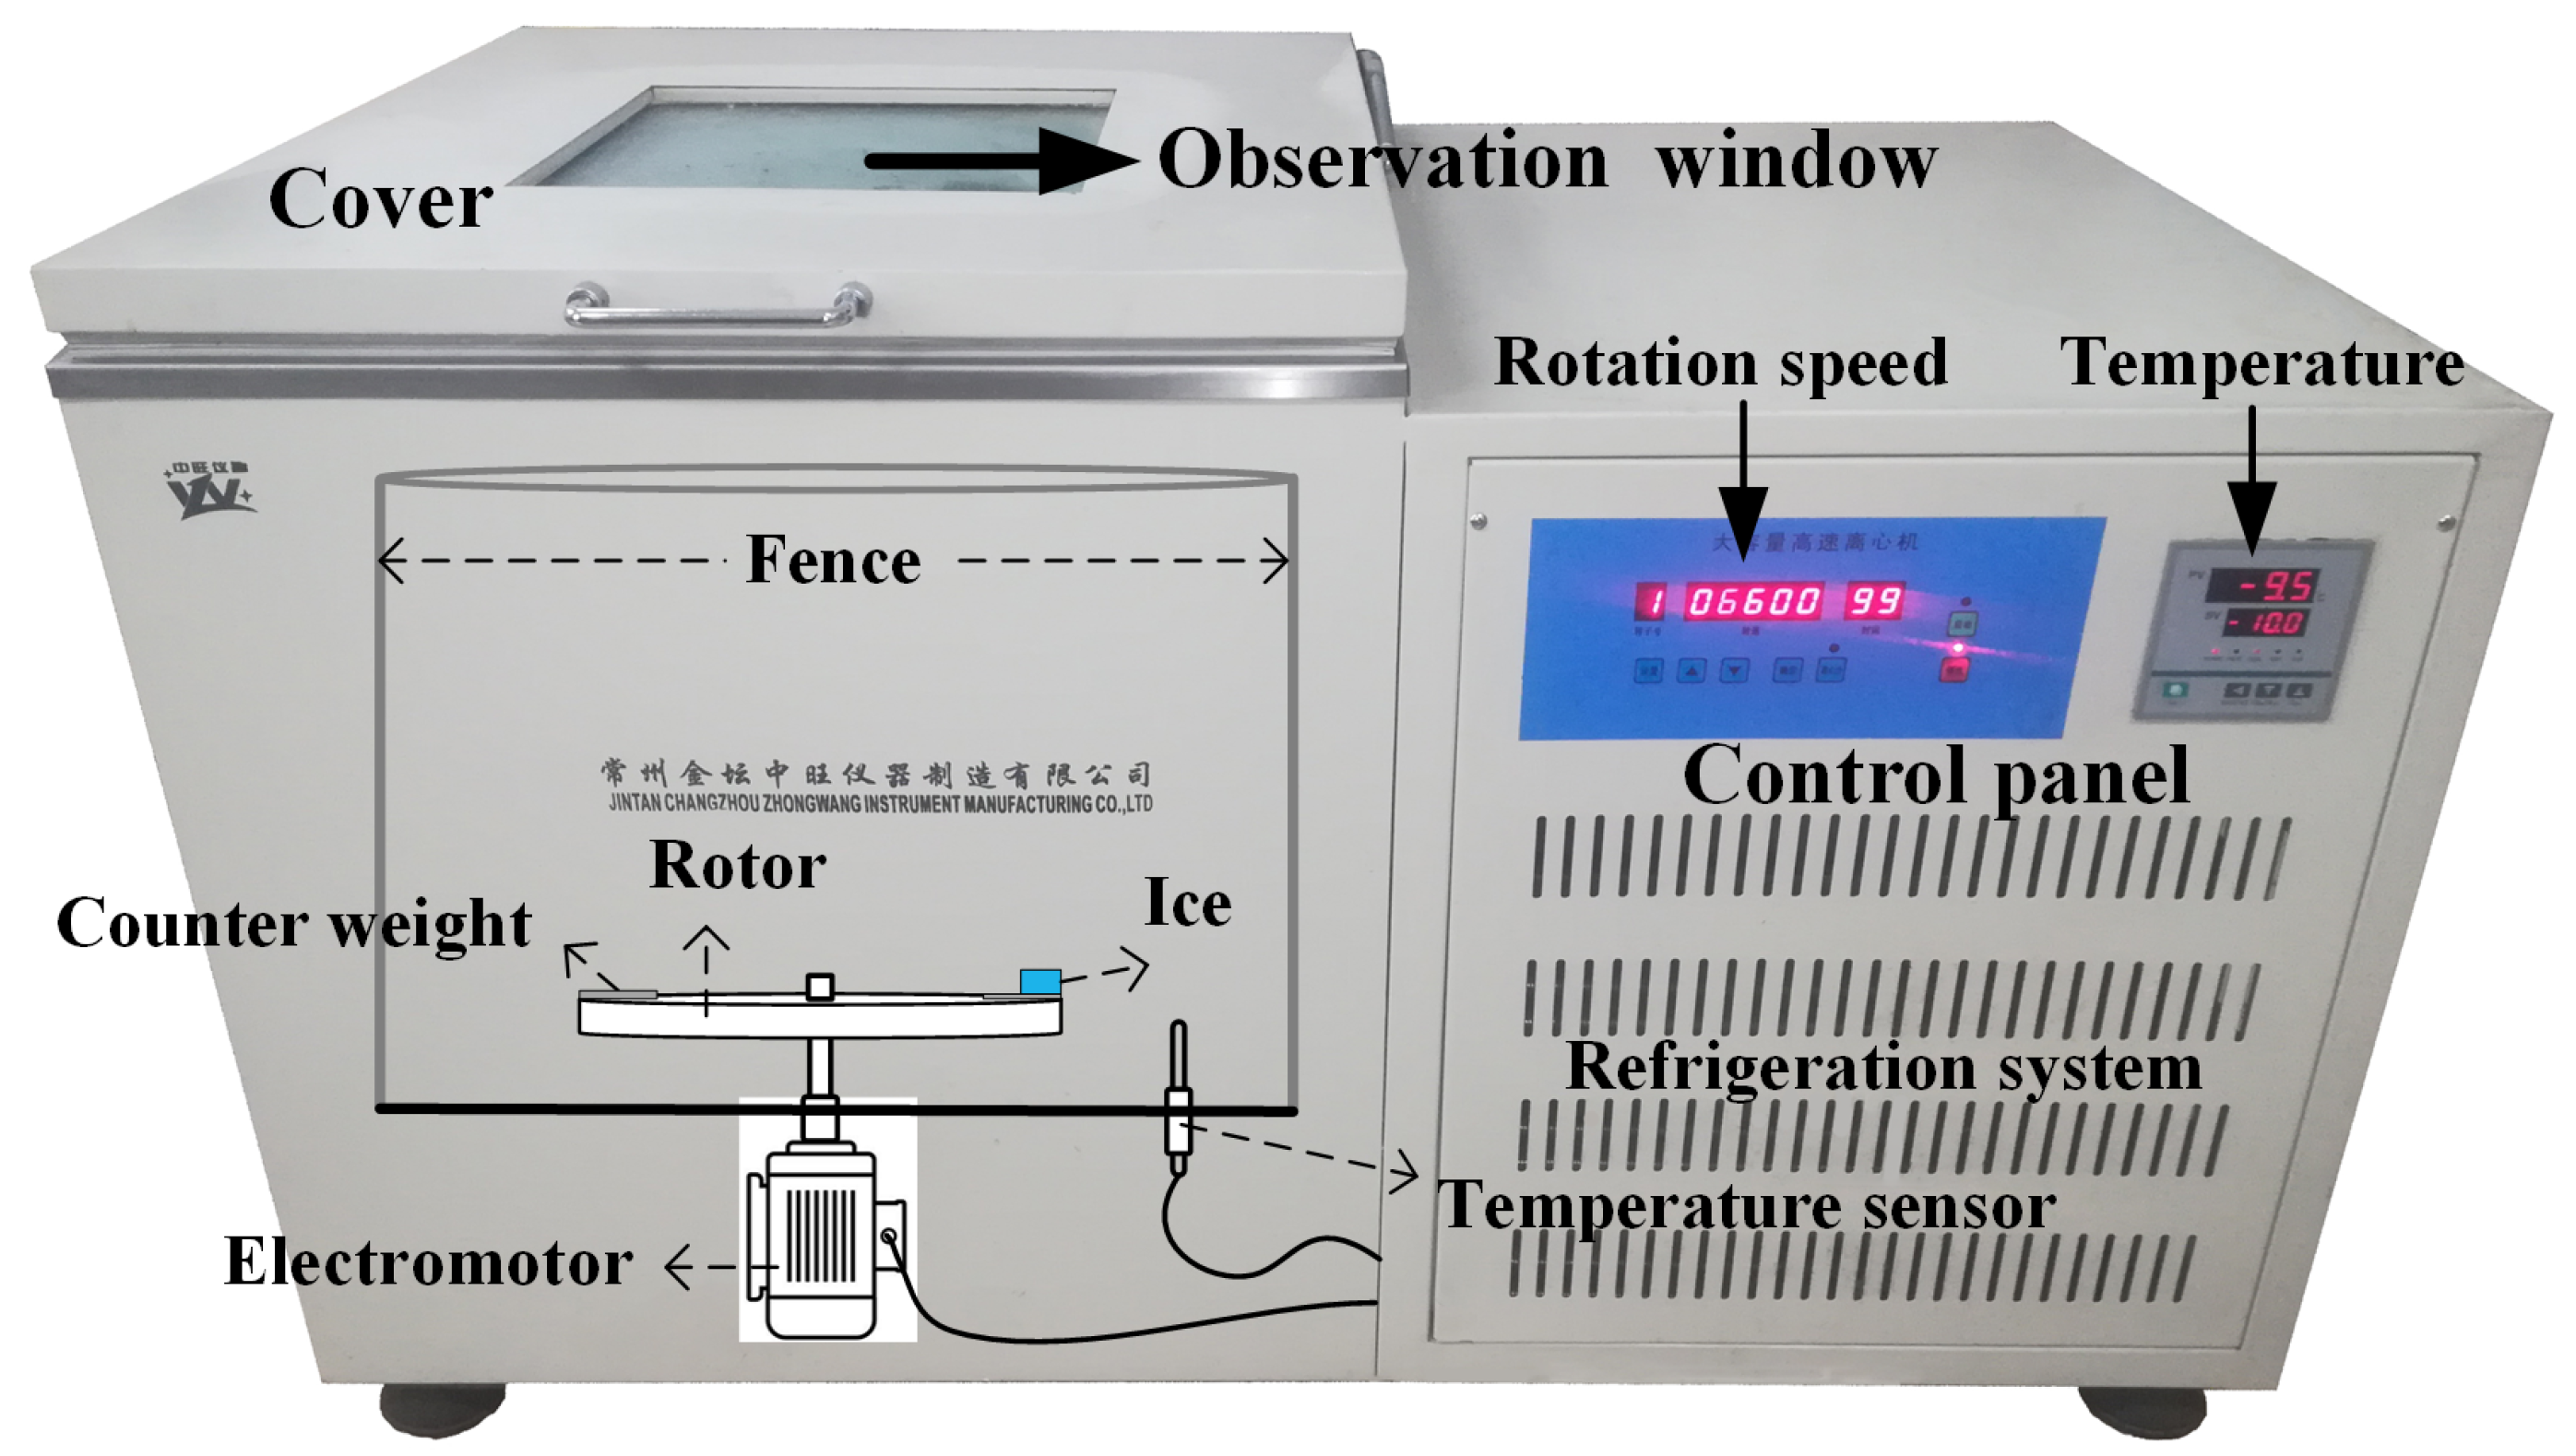
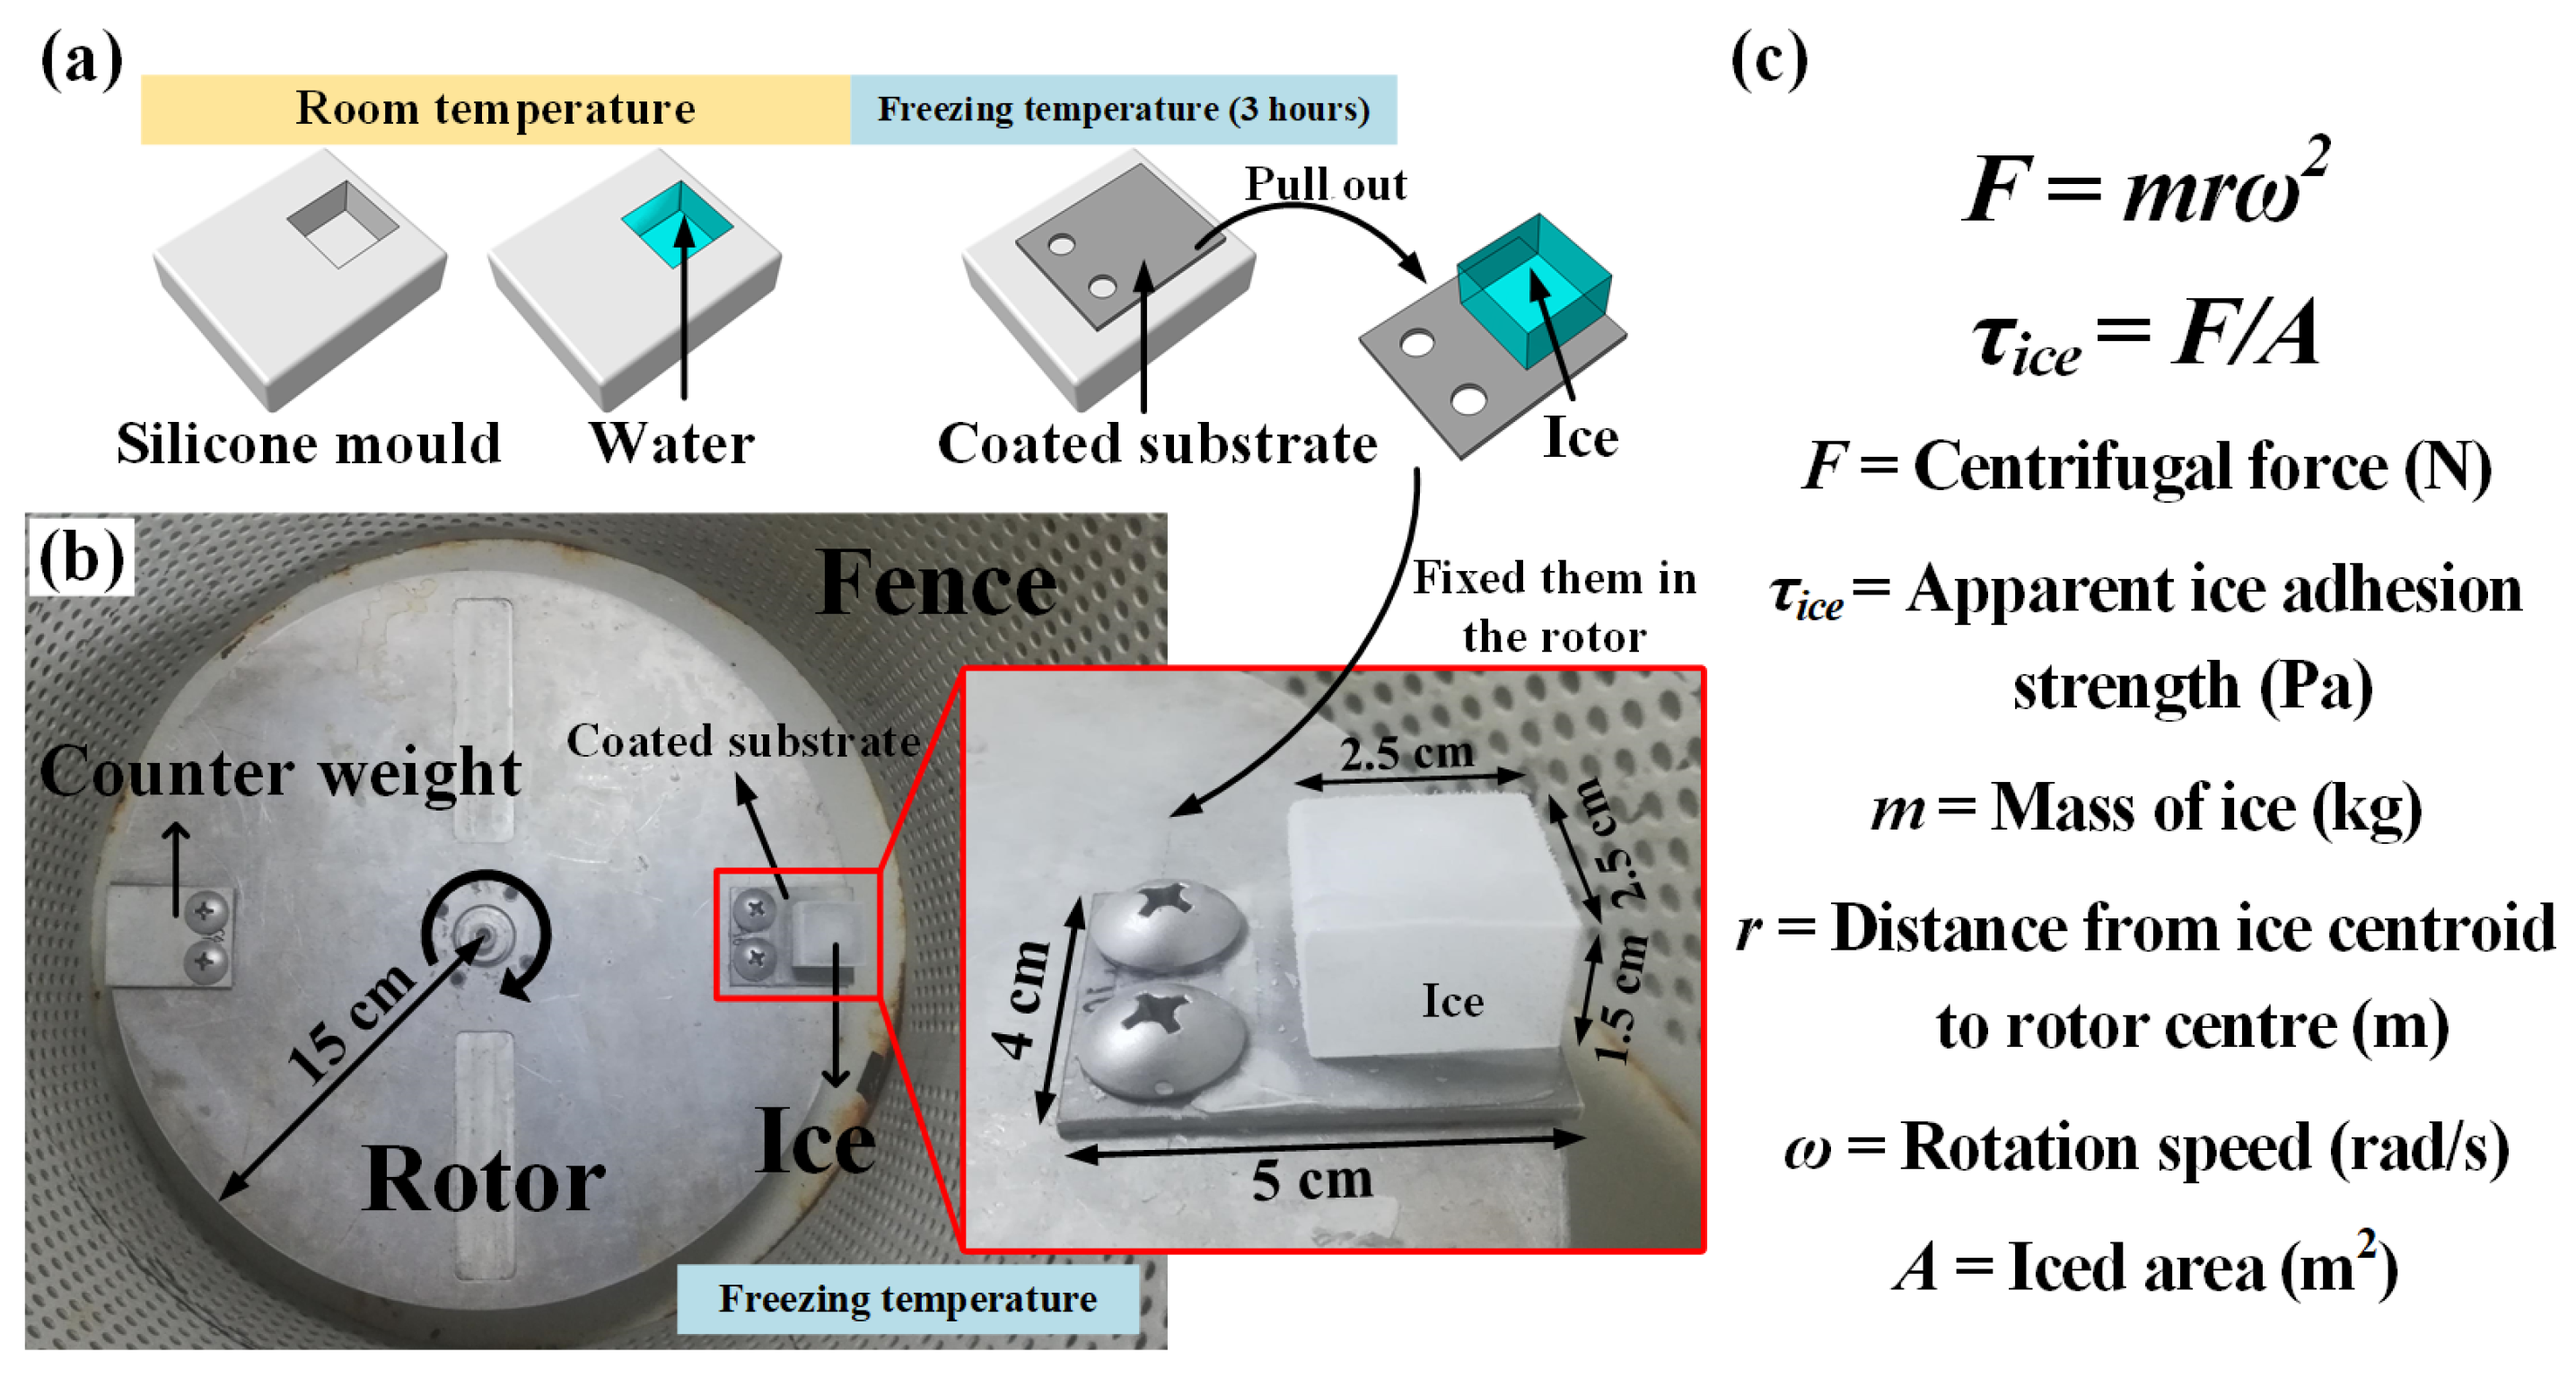
2.5. Ice Adhesion Strength Test

The ice adhesion strength (τice) was measured using a homemade refrigerated centrifuge (max rotation speed: 20,000 rpm, lowest temperature: −30 °C) (see Figure 2), and the centrifuge test is similar to those previously reported [14,16]. The rotor and electromotor are inside. All ice adhesion strength tests were performed inside this apparatus.
Figure 3 shows a schematic description of the ice formation and ice adhesion strength tests. First, a silicone mould with a cuboid cavity (2.5 cm × 2.5 cm × 1.5 cm) was filled with deionized water. The water was taken from the ice-water mixture at an initial temperature of 1~2 °C. Then, the substrate (4 cm × 5 cm × 0.2 cm) was placed upside down on the silicone mould and in full contact with the water. Next, they were frozen for 3 h at a desired temperature. After freezing, the substrate with ice was pulled out from the silicone mould.
The substrate covered with glaze ice was bolted to a rotor (disc-shaped, radius 15 cm) inside the refrigerated centrifuge. The inside temperature of the refrigerated centrifuge was set to the desired temperature for 30 min of heat preservation, and then the motor was started. When the centrifugal force overcame τice, the ice detached from the coated substrate and impacted the fence of the rotor. At the same time, the rotation speed was recorded. The τice can be calculated by the following formulas τice = F/A and F = mrω2, where τice is the apparent ice adhesion strength (Pa), F is the centrifugal force (N), A is the iced area (m2), m is the mass of ice (kg), r is the distance from the ice centroid to the rotor centre (m), and ω is the speed of rotation when the ice detached (rad/s, 1 rpm = π/30 rad/s). 5 similar samples were prepared for every coating to obtain the average and standard deviation of τice.

2.6. Scanning Electron Microscopy (SEM), X-ray Photoelectron Spectroscopy (XPS) and Surface Roughness

The surface morphology of the samples was observed using SEM (JSM-IT300, JEOL Ltd., Tokyo, Japan) at a voltage of 15 kV. The chemical composition of the surface was investigated using an XPS apparatus (AXIS ULTRA DLD, Kratos Ltd., Kyoto, Japan). Characterization was performed with a monochromatic AI X-ray source. The surface roughness of the samples was obtained by an optical profilometer (Bruker ContourGT, Billerica, MA, USA). Areal roughness parameters (Sa and Sq) were calculated according to the ISO 25178 standard [17].

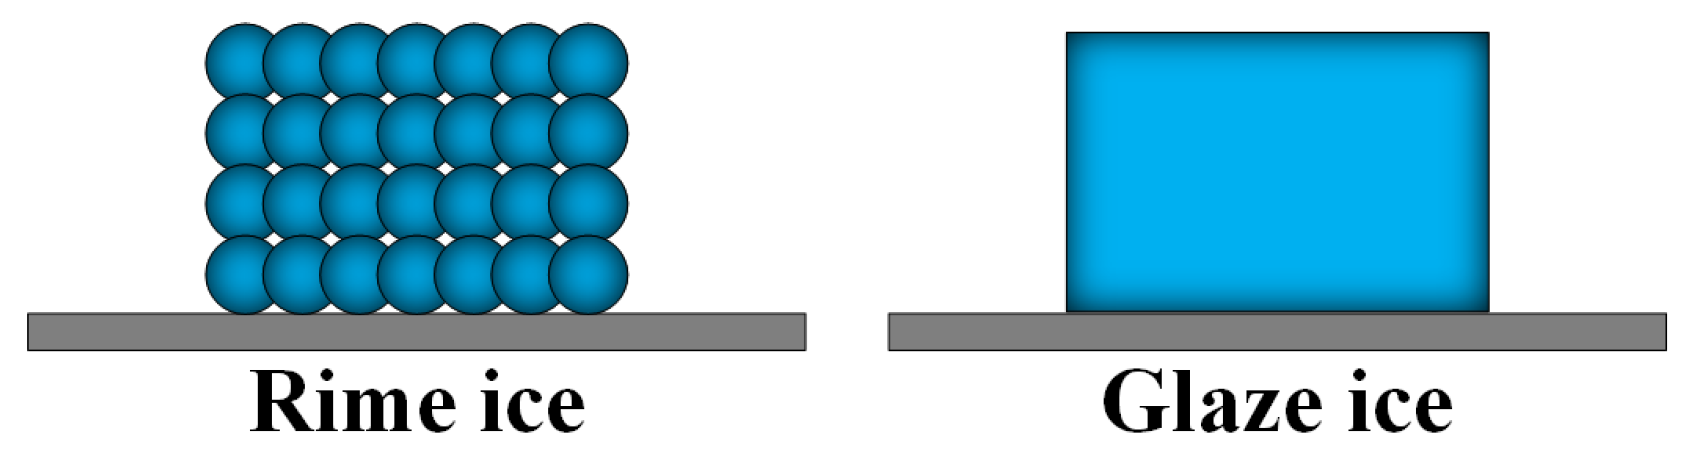
2.7. Formation of Rime Ice, Normal Ice and Glaze Ice

The formation of three types of ice are described as follows. Substrates were coated, ultrasonically cleaned in acetone, and then weighed before icing. The substrates were placed in a refrigerator at the desired temperature (−10 °C). When the temperature was stable, a freeze drizzle was sprayed on the substrates by a spray gun at a specified pressure (600 kPa for rime ice, 300 kPa for normal ice, 80 kPa for glaze ice). The water was taken from an ice-water mixture at an initial temperature of 1~2 °C. When the thickness of the ice reached approximately 1 cm on a 4 cm × 3 cm iced area, the icing process was finished, and the substrates with rime ice were weighed. Rime ice is rough and opaque, formed by supercooled drops rapidly freezing on a sub-zero surface. Glaze ice is transparent and homogeneous and resembles that of a beverage ice cube in appearance. Normal ice is semi-transparent, between the transparency of glaze ice and rime ice. Then, the substrate with ice was bolted to the rotor. The ice adhesion strength tests for the 3 types of spray ice were the same as those for the mould ice described in Section 2.5.

3. Results and Discussion

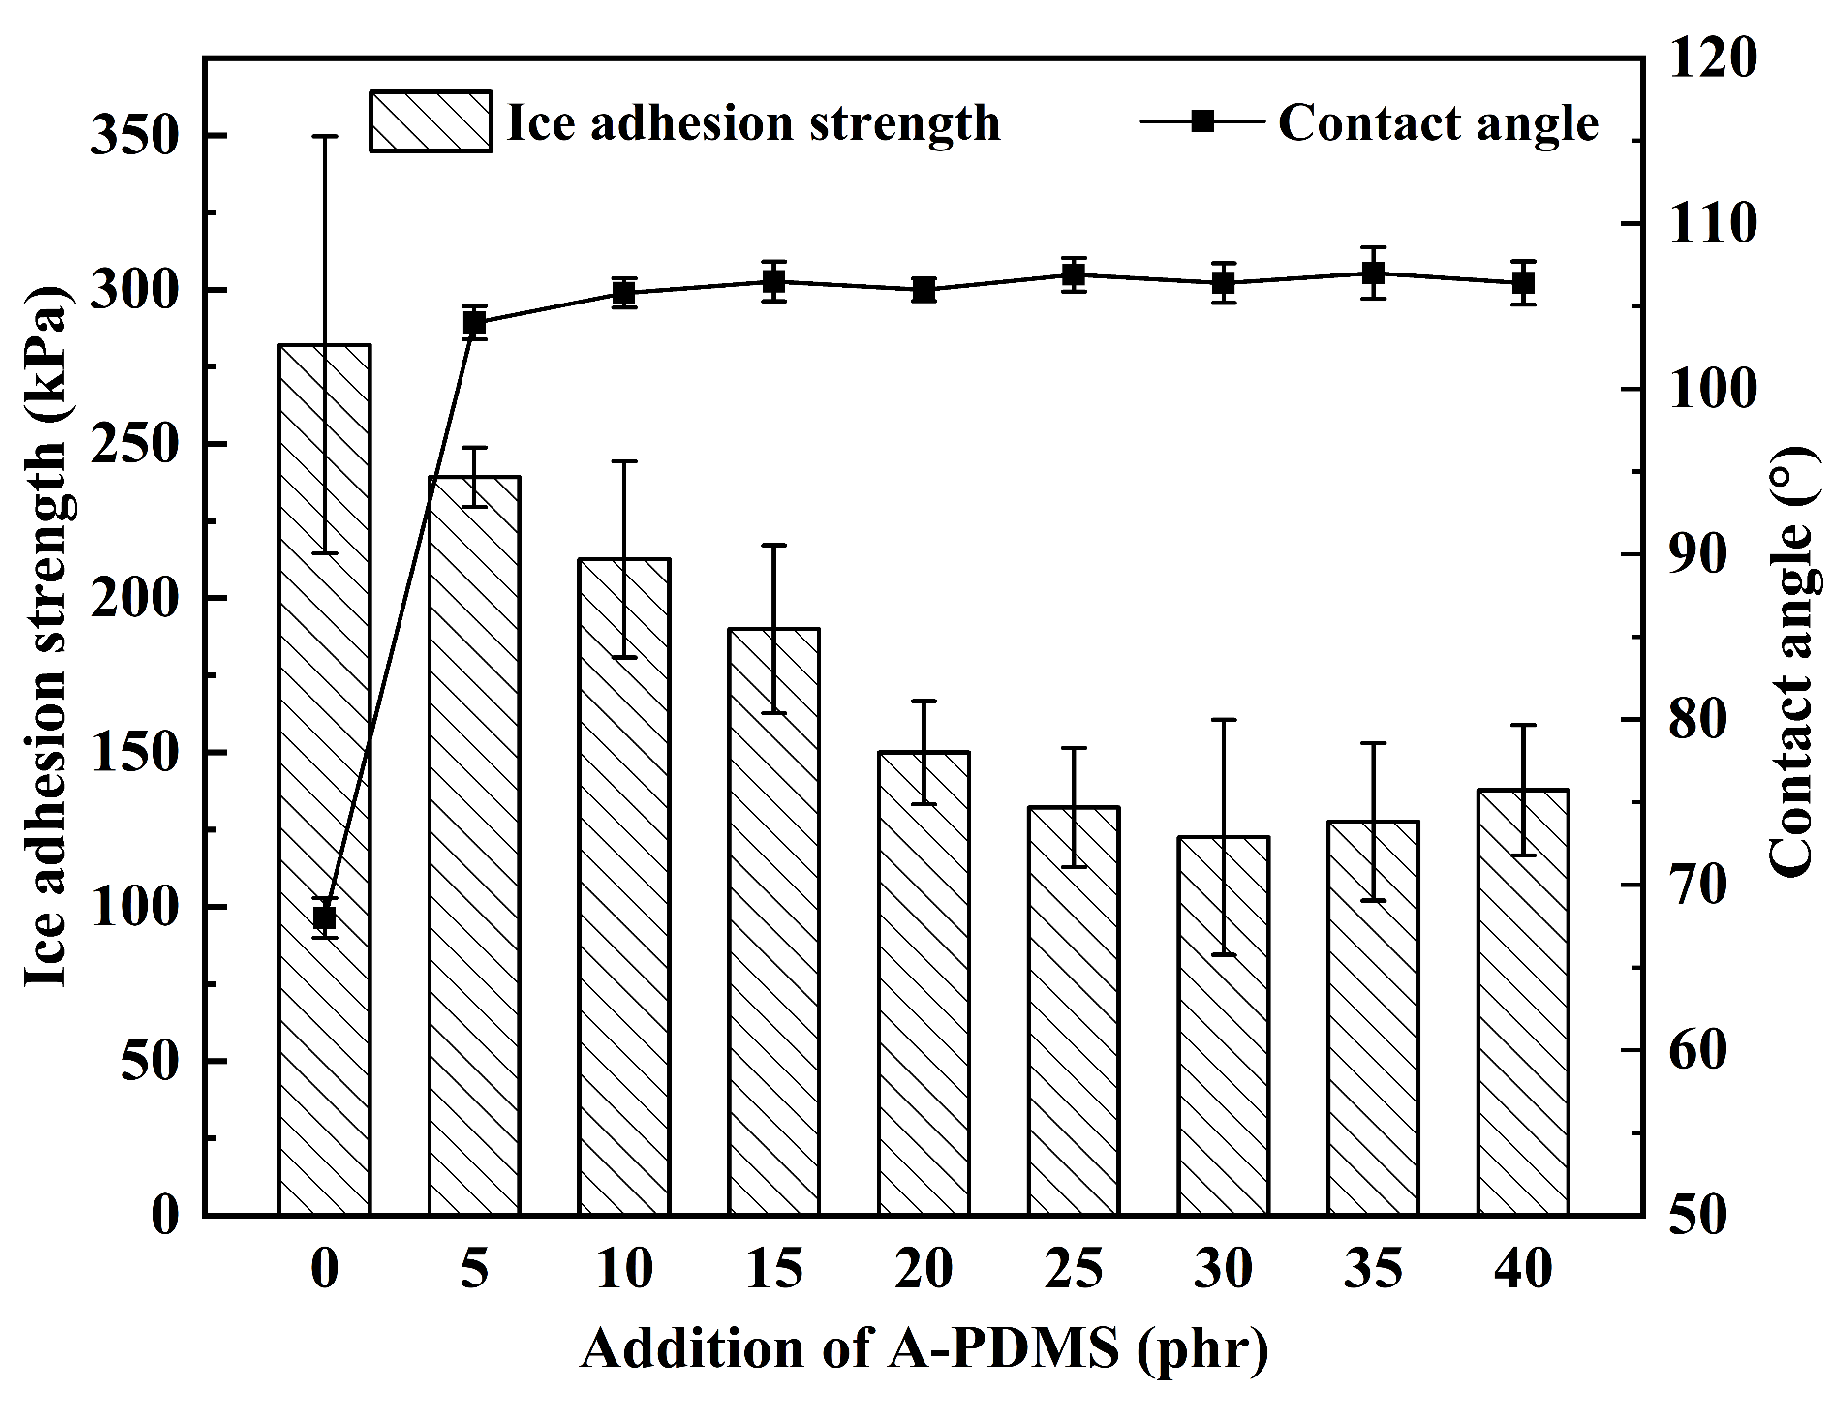
3.1. A-PDMS-Modified Epoxy Coating without Particles

The τice and CA of A-PDMS-modified epoxy coatings without particles are shown in Figure 4. Figure 4 shows that the CA increased with increasing amounts of A-PDMS. When the addition of A-PDMS exceeded 15 phr, the CA was approximately 106° and remained stable. This value is similar to that obtained with modified epoxy in other studies (such as fluorinated epoxy, 105.3°) [8]. The CA of the pure epoxy coating was approximately 68°. These results indicate that the A-PDMS-modified epoxy coating is hydrophobic when the addition of A-PDMS exceeds 5 phr. τice decreased with an increase in the A-PDMS addition from 0 to 25 phr and stayed almost constant from 25 to 40 phr. The τice of the pure epoxy coating was 282.1 with a standard deviation of 67.5 kPa. When the addition of A-PDMS was 25 phr, τice dropped to 132.2 with a standard deviation of 19.3 kPa. This result was attributed to the increase in A-PDMS, which reduced the surface energy of the coating and thus, decreased the τice. When the phr of A-PDMS exceeds 15, the CA almost unchanged. It indicates that the A-PDMS was saturated. The dissociative A-PDMS may disturb icing process and decrease CAH. Thus the τice was reduced. For the silica-filled coating in the next sections, a 25 phr addition of A-PDMS to the matrix is chosen. Thus, for the silica-filled surface, the intrinsic contact angle was approximately 106.9° (CA of A-PDMS-modified epoxy with 25 phr A-PDMS).

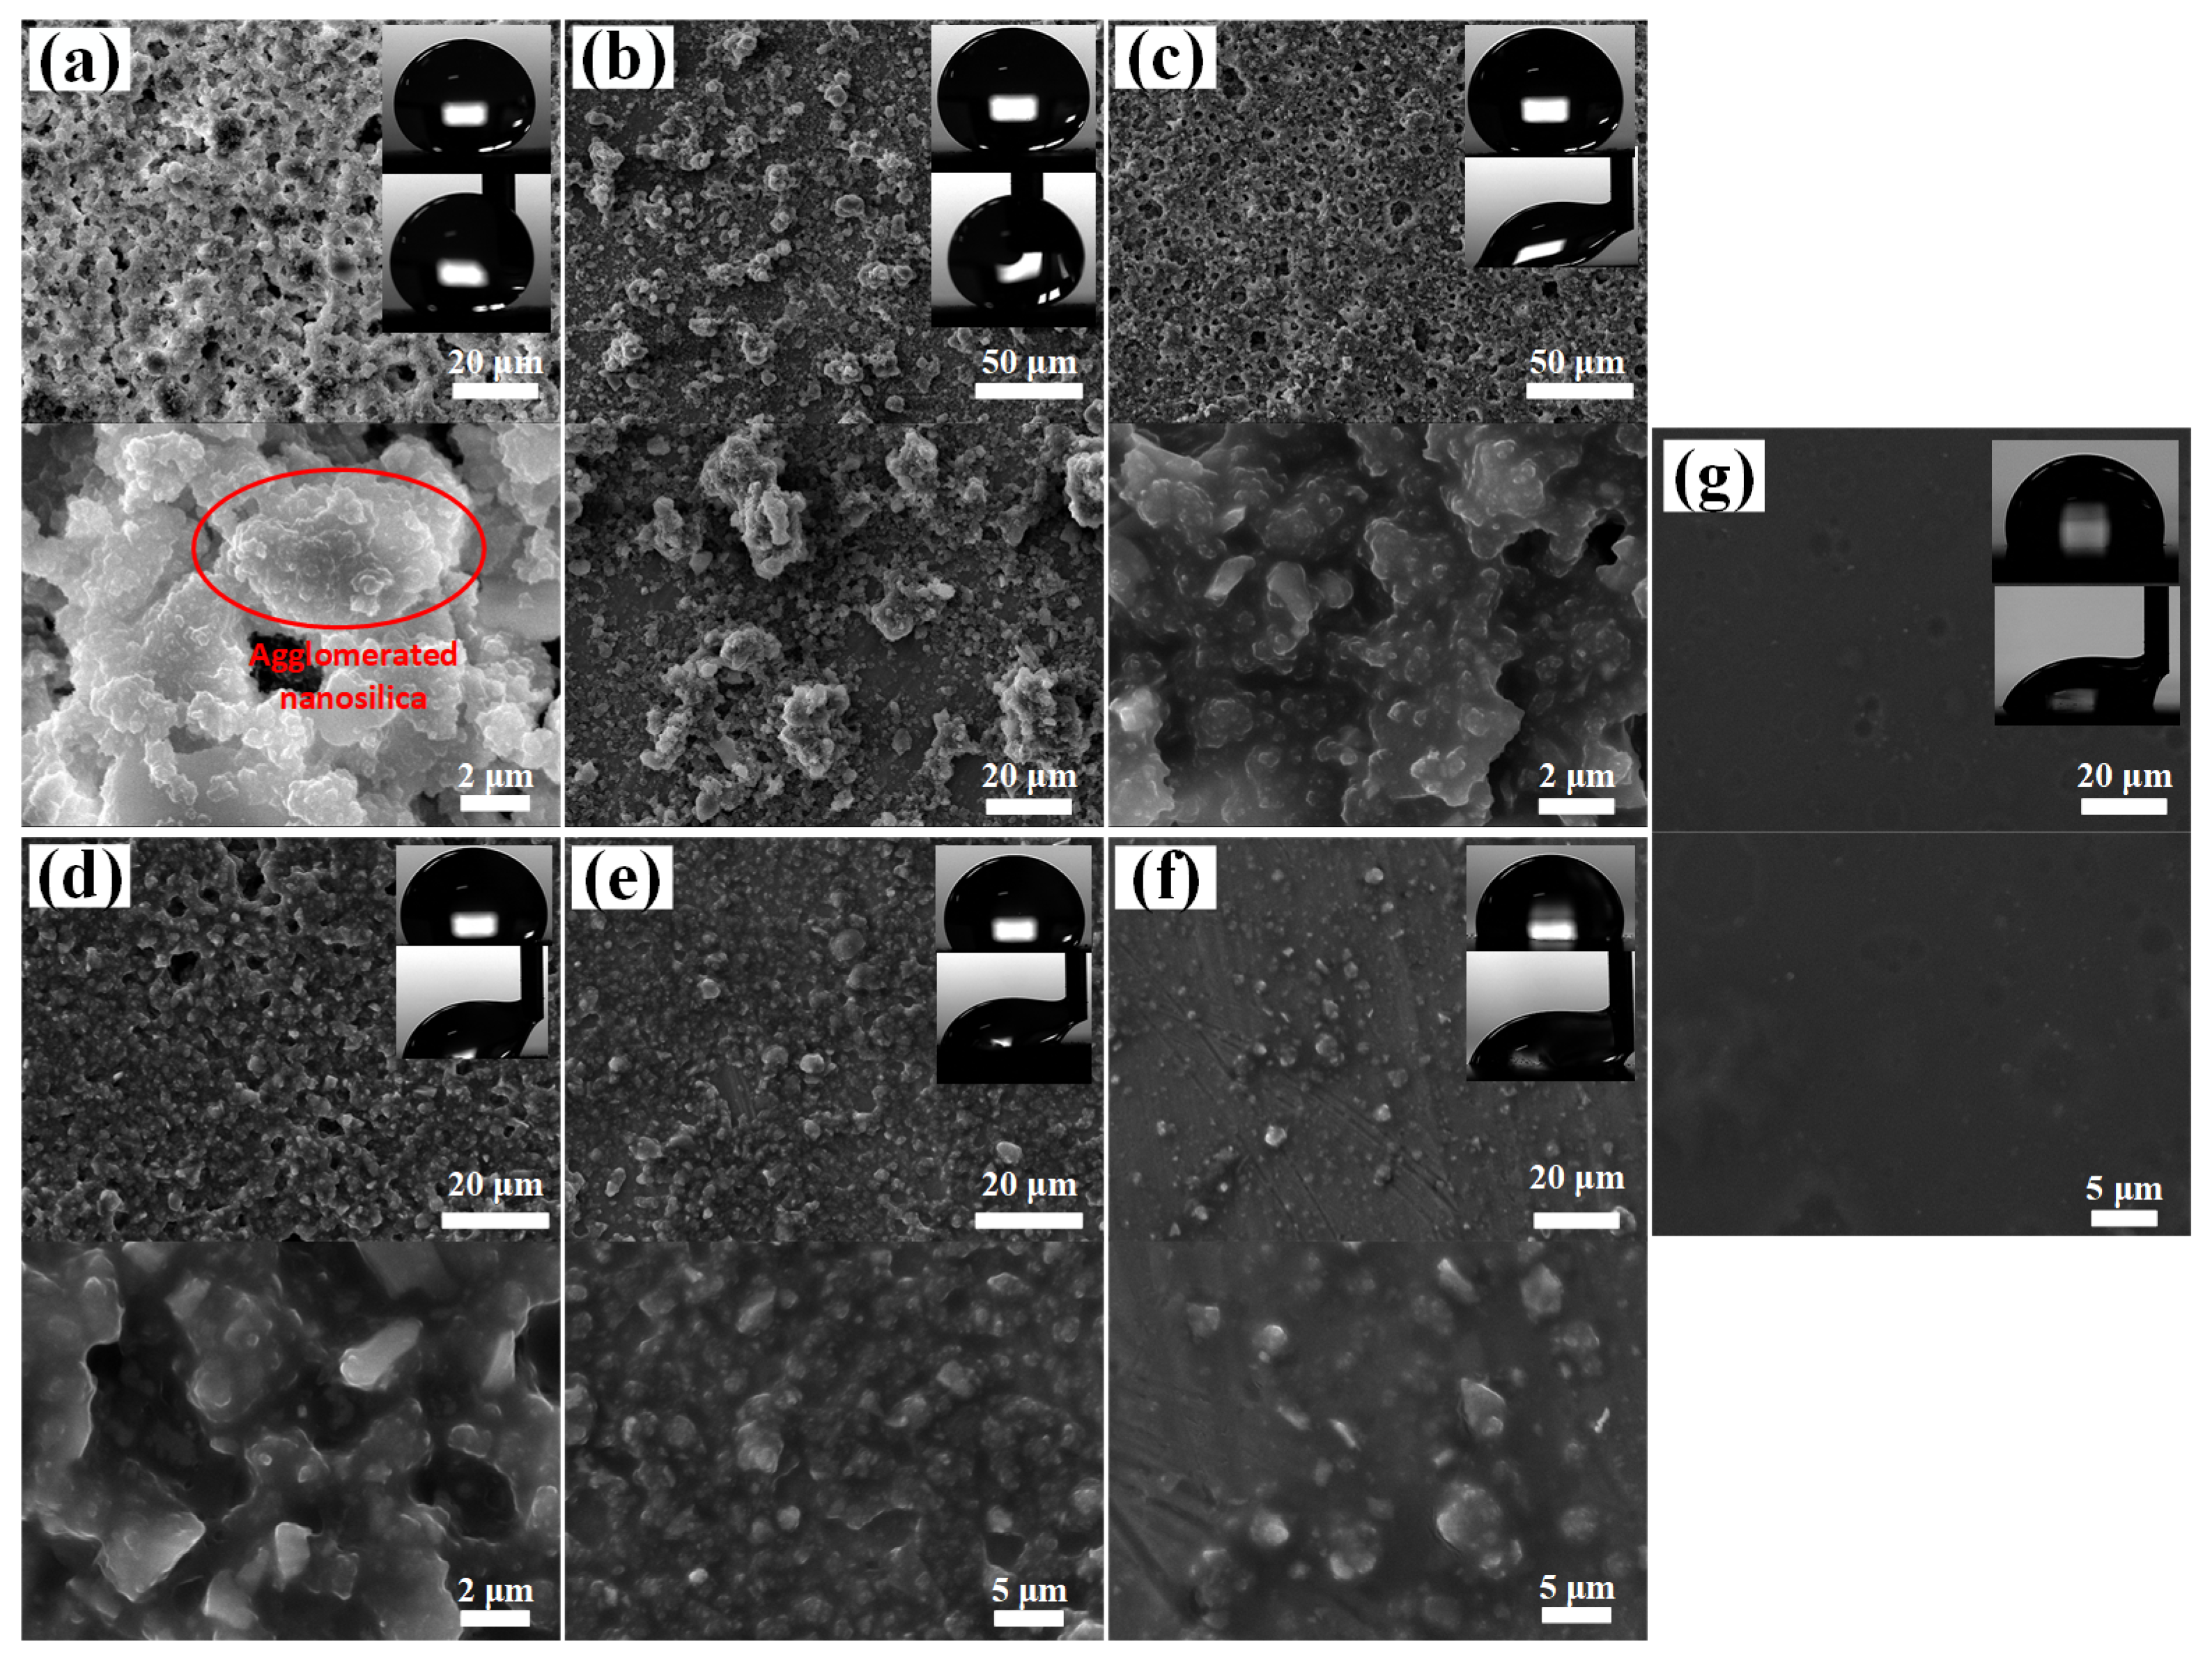
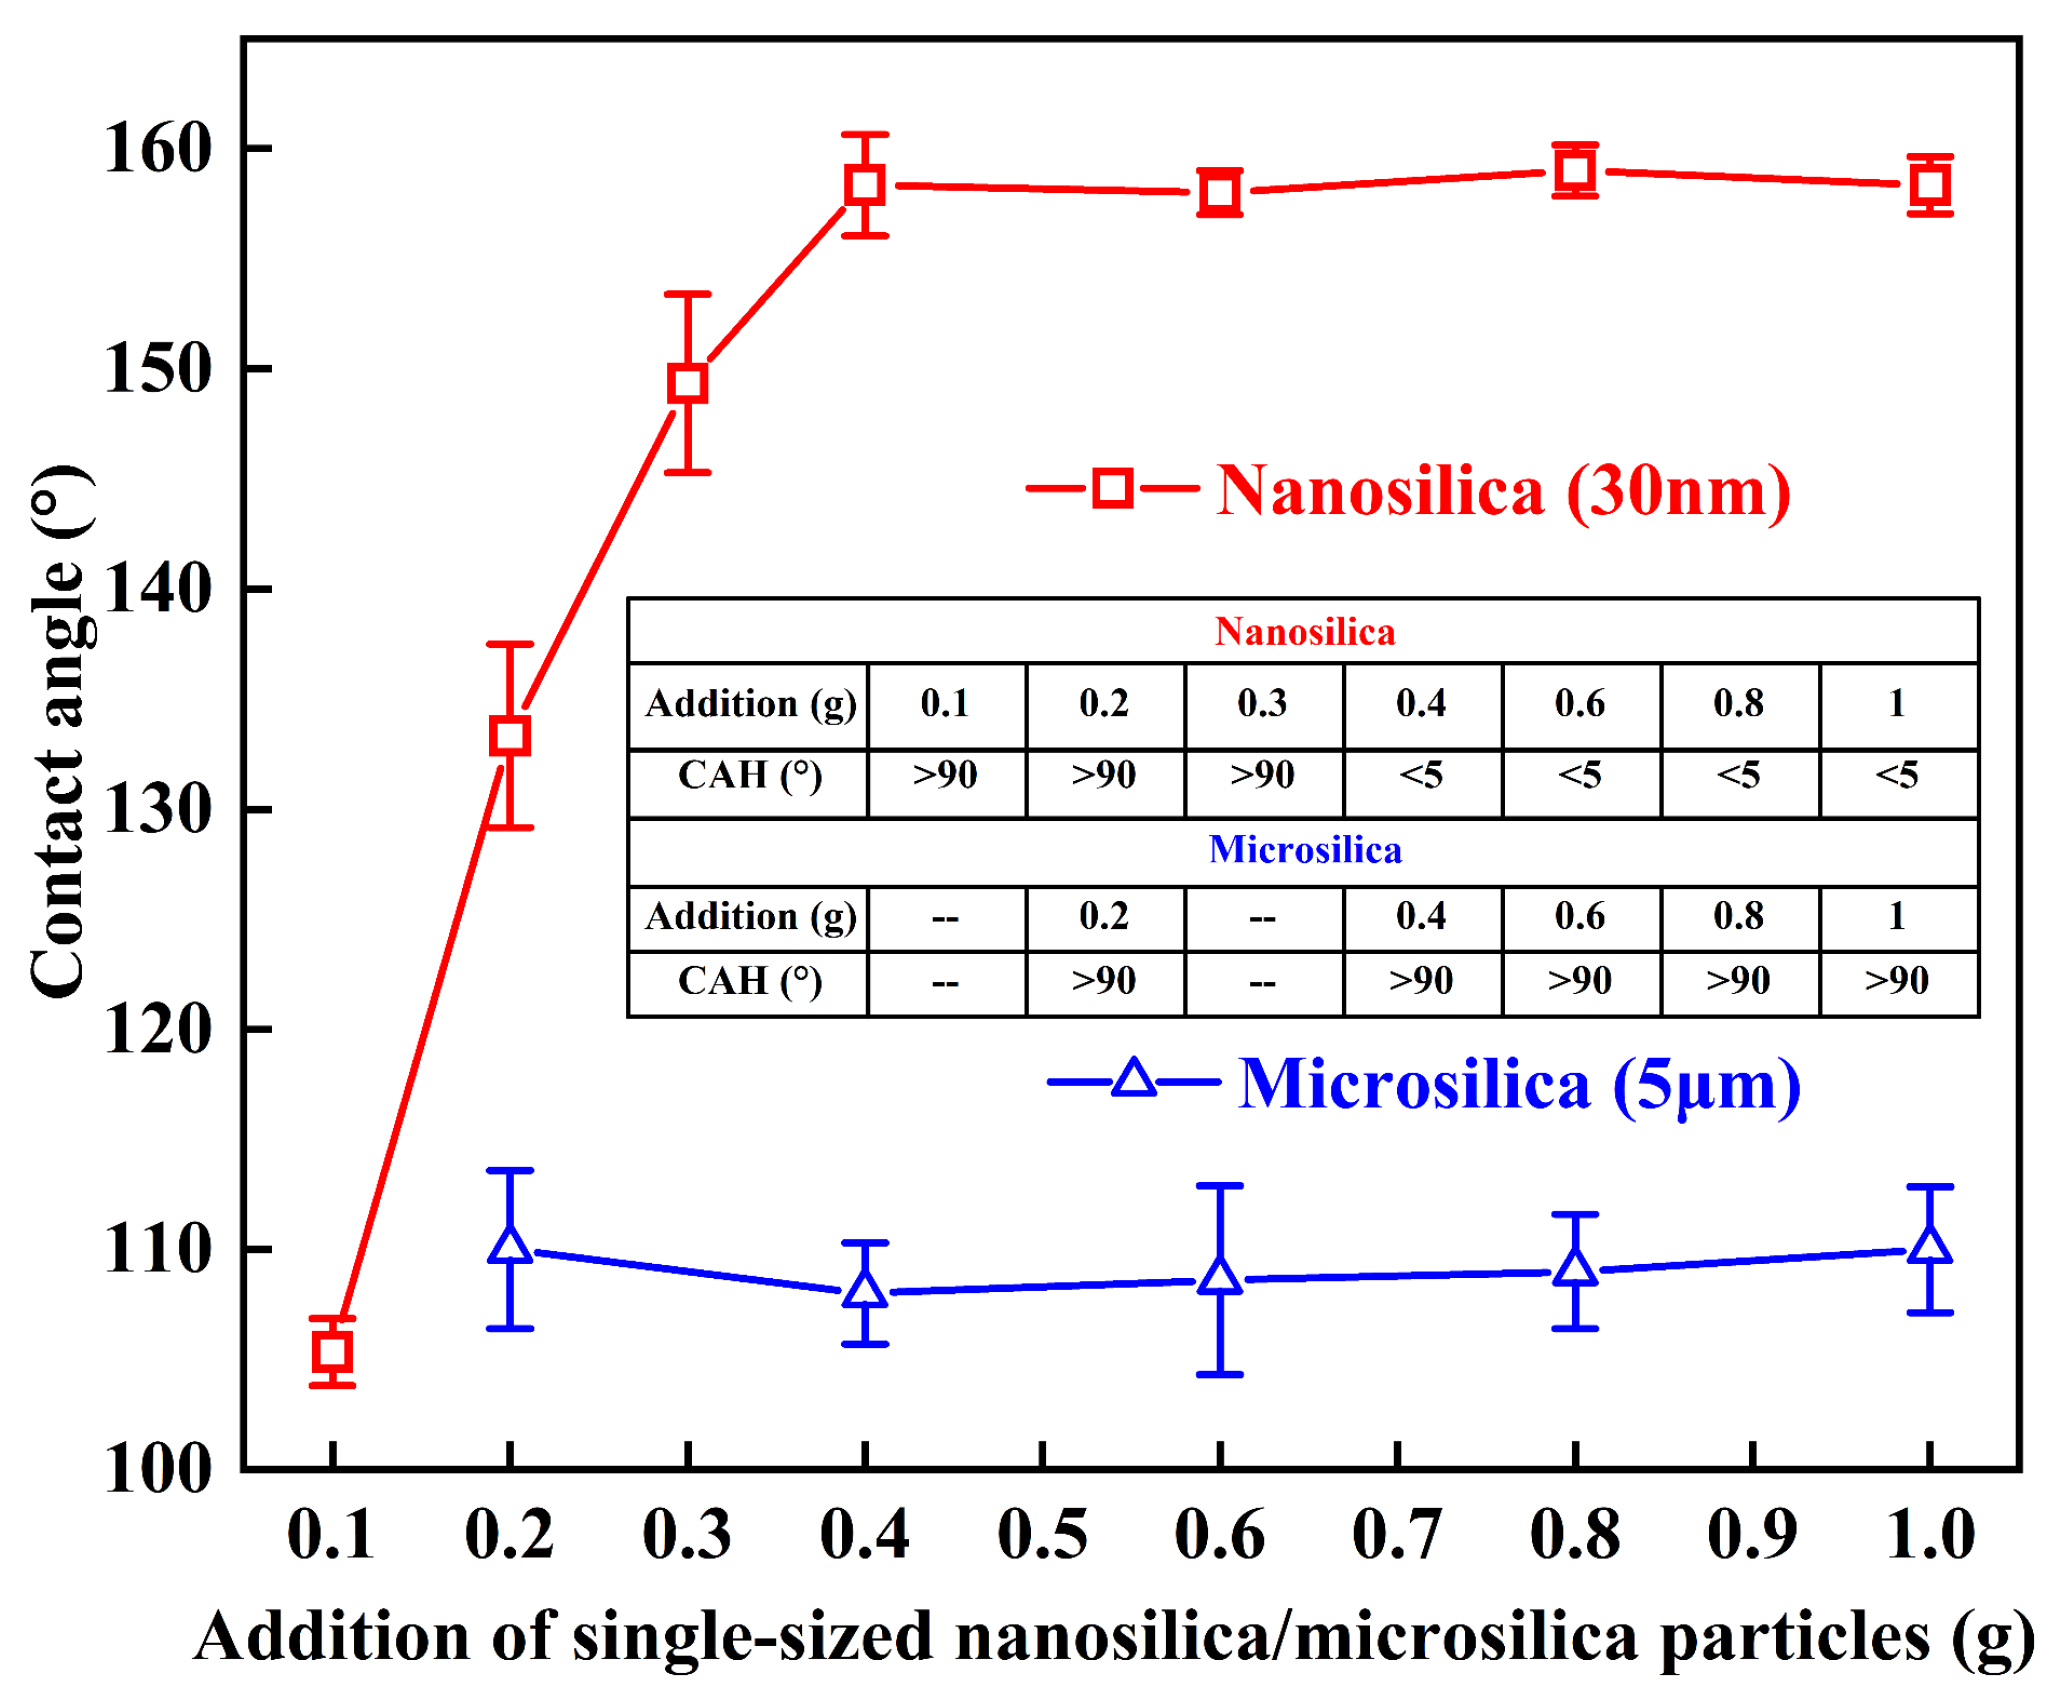
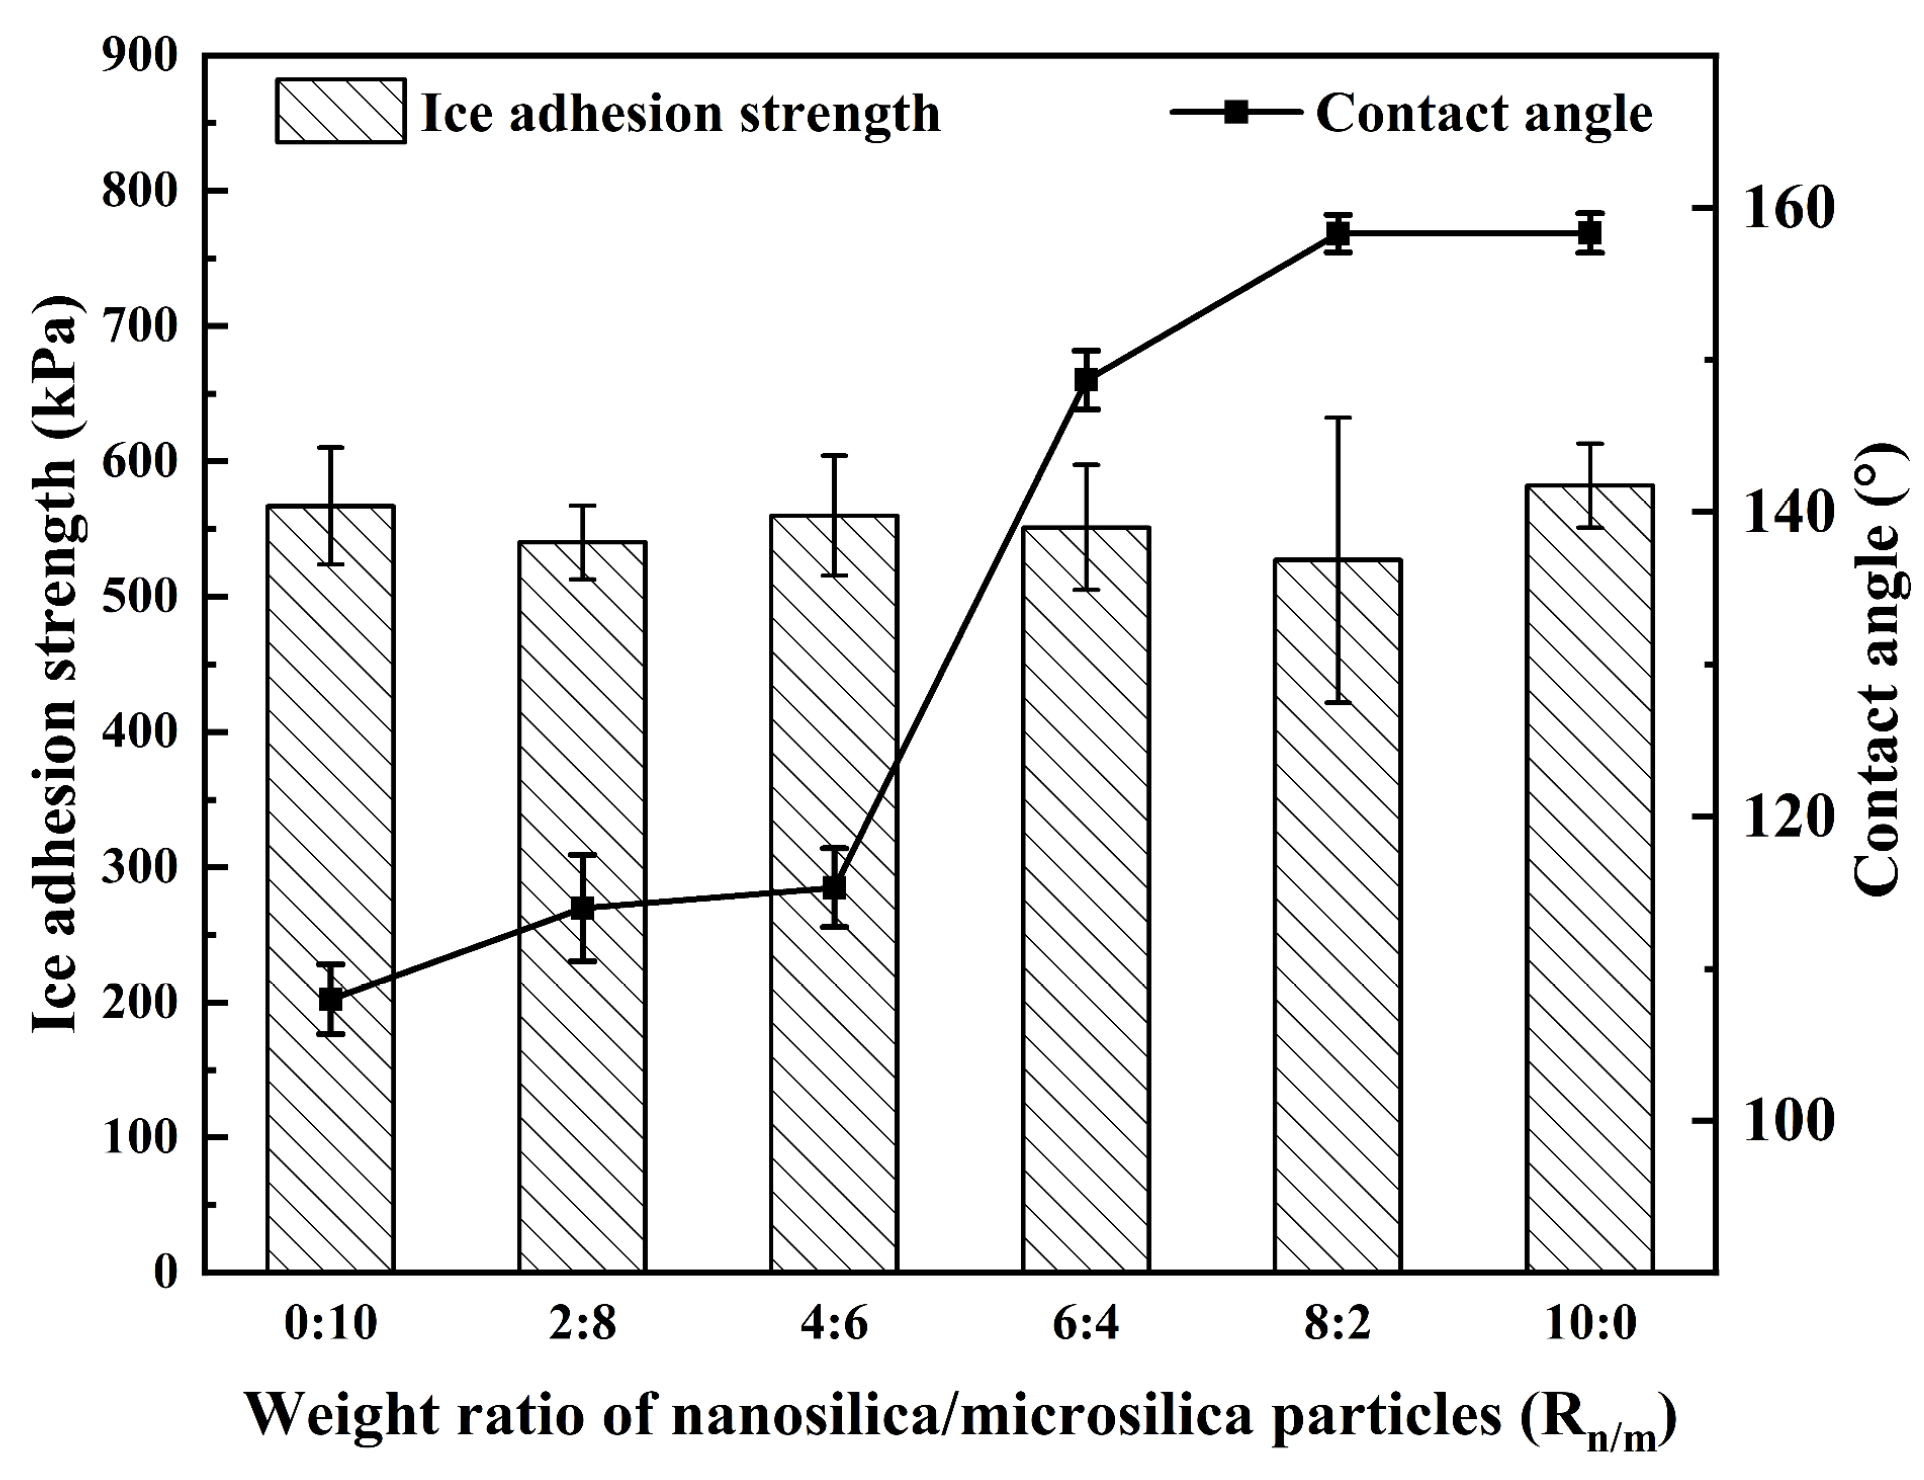
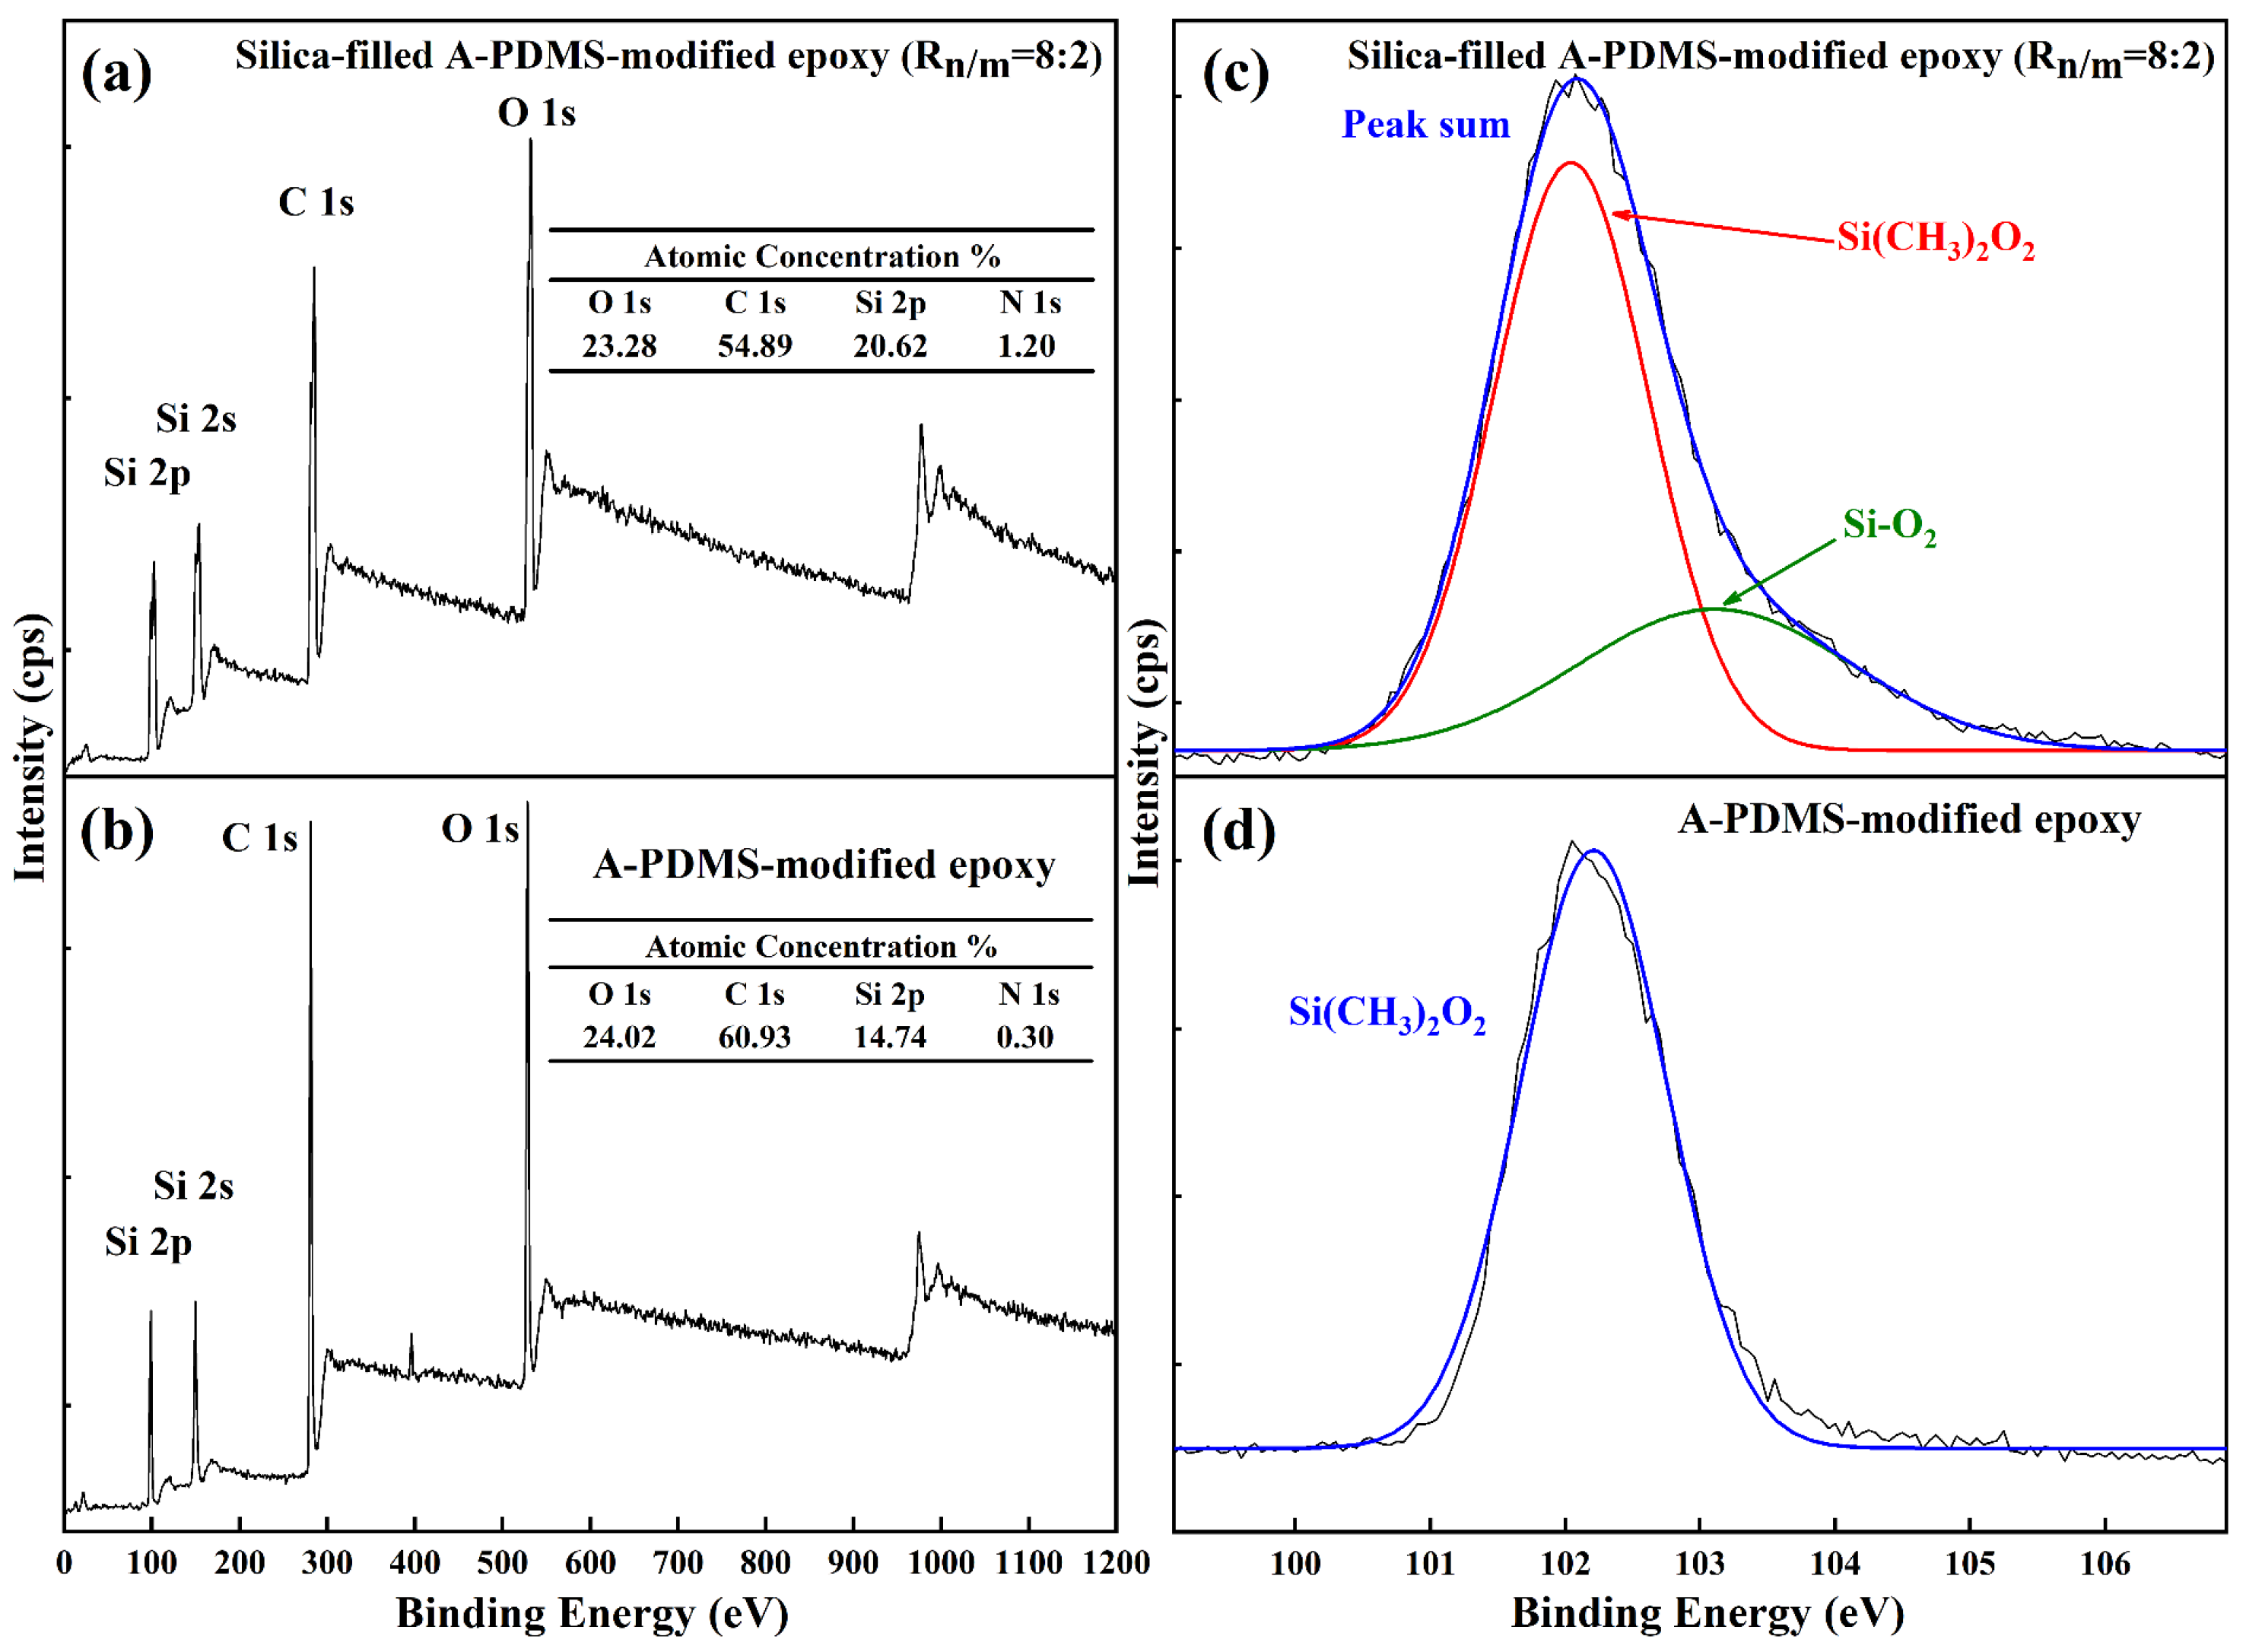
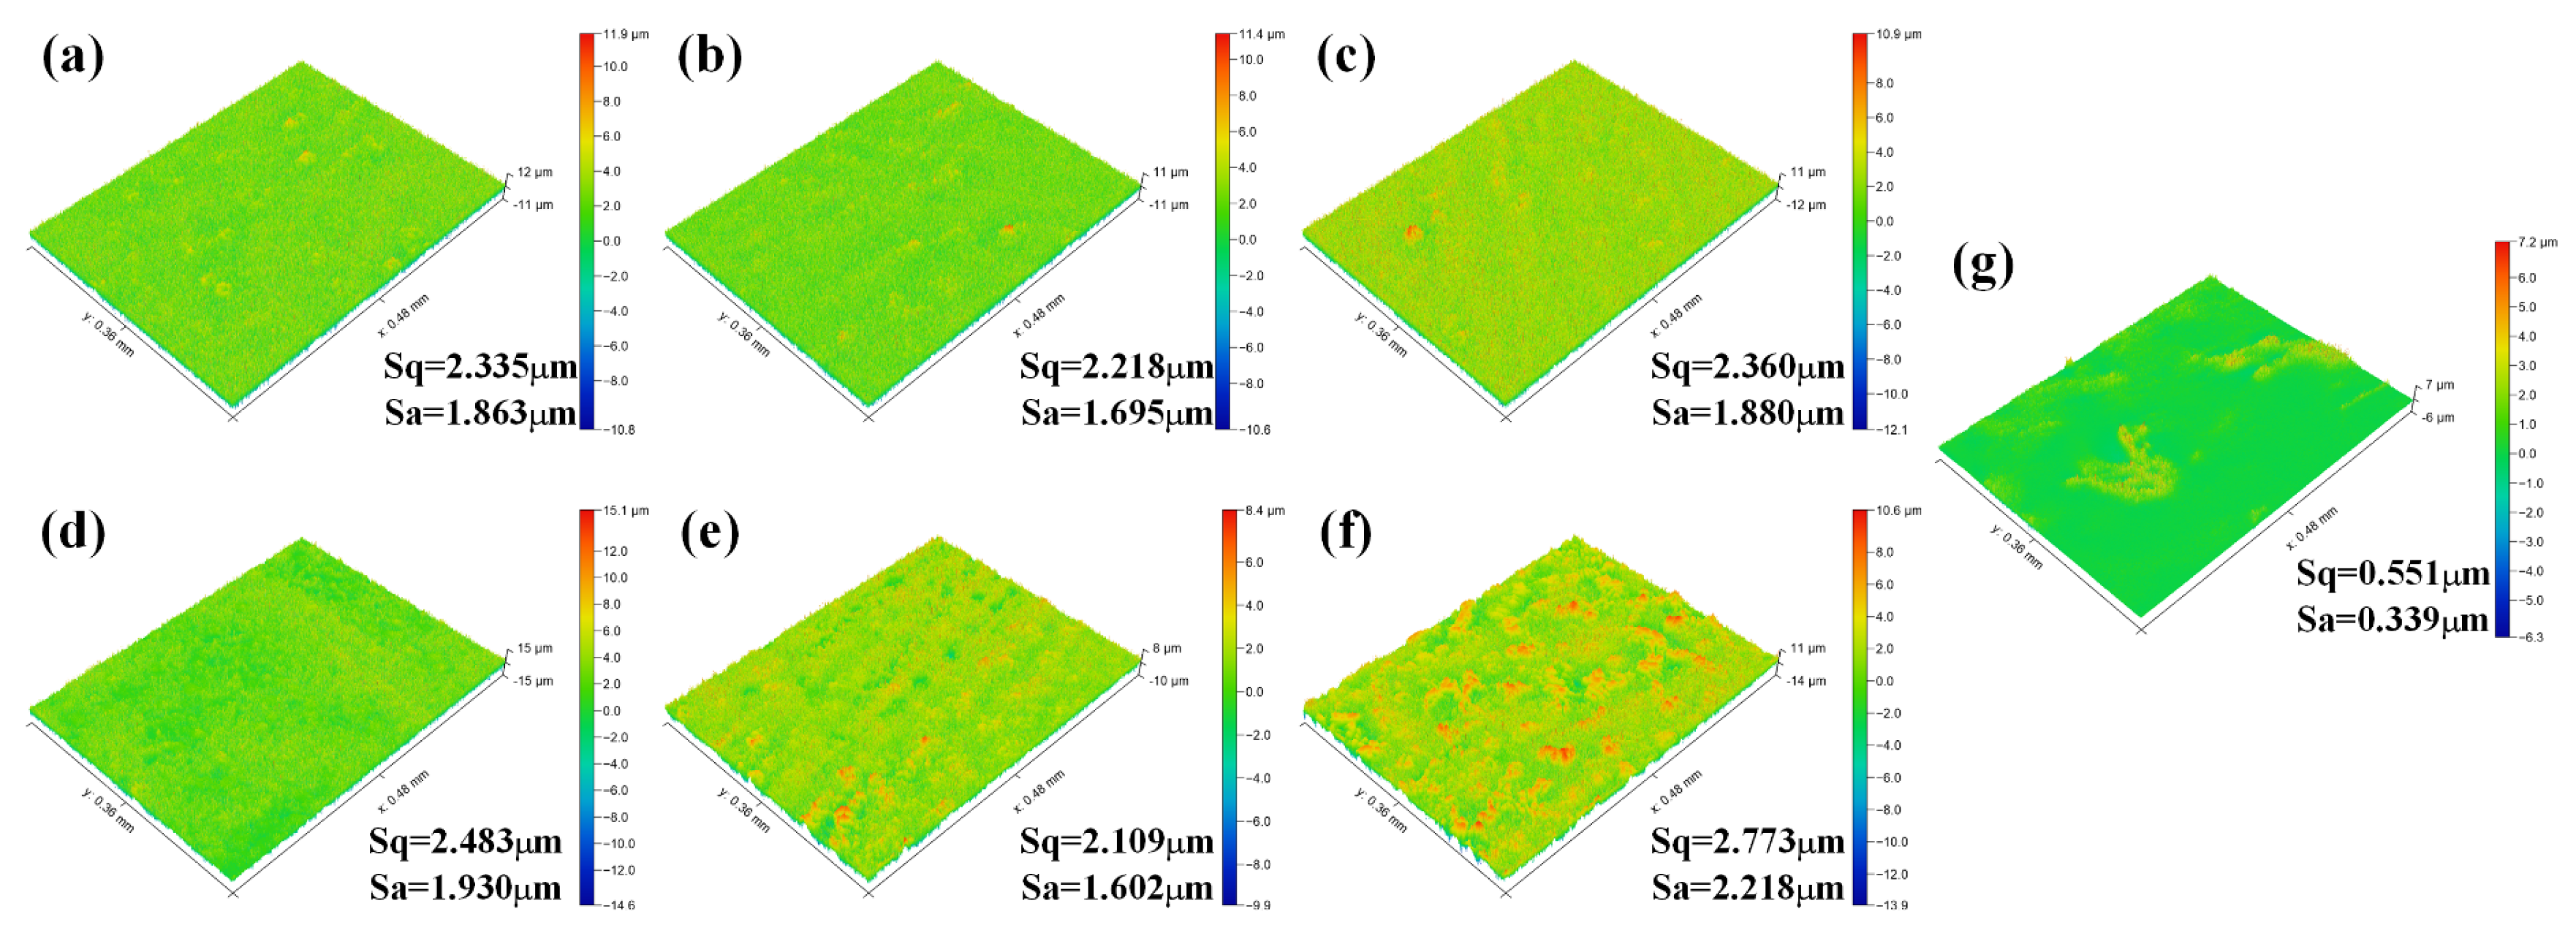
3.2. Nano/Microsilica-Filled A-PDMS-Modified Epoxy Coating

In the section, the CA and ice adhesion strength of nano/microsilica-filled A-PDMS-modified epoxy were studied. To obtain a suitable total mass (Mtotal) of the nano/microsilica-filled coating, we first increased the addition of single-sized silica (nanoscale) until the coating showed a superhydrophobic performance. The addition of nanosilica was regarded as Mtotal when the coating reached a superhydrophobic state. Then, microsilica was used to partially substitute nanosilica at various Rn/m (total mass was Mtotal). The influence of the addition of single-sized nanosilica (in addition to microsilica) on the CA was studied for a given epoxy amount (0.5 g), and the results are shown in Figure 5.
The apparent CA increased upon the addition of nanosilica. When the addition of nanosilica reached 0.4 g, the apparent CA was more than 155°, and the CAH was less than 5°. This can be explained as follows: aggregation of enough nanosilica particles on the surface led to a micro/nano dual-scale structure. This micro/nano hierarchical structure and low surface energy resulted in the superhydrophobic performance of the coating. However, the apparent CA did not obviously change with increasing content of microsilica particles. A possible explanation for this might be that, compared with the high specific surface area of nanosilica, the specific surface area of microsilica was too low to effectively increase surface roughness. For the A-PDMS-modified epoxy coating with nano/microsilica, the Mtotal was determined to be 0.4 g as described above. Then, we changed the Rn/m from 10:0 to 0:10 to obtain various rough coatings. The τice and CA of the rough nano/microsilica-filled A-PDMS-modified epoxy coating on various Rn/m are shown in Figure 6.
The CAH results and failure modes of all coatings are shown in Table 1. When Rn/m was 0:10, 2:8 and 4:6, the CA was lower than 120°, and the CAH was more than 30°. When the Rn/m reached 8:2 and 10:0, the CA was more than 155°, and the CAH dropped below 5°, which showed superhydrophobic properties.
In Figure 6, τice was independent of Rn/m and CA. τice was more than 500 kPa for various Rn/m, including superhydrophobic coatings (when Rn/m was 10:0 and 8:2). From Table 1, adhesive failure (failure of the bond between the ice and coating surface, namely, little to no ice left on the coating after the test), cohesive failure (ice fracture) and mixed failure (both adhesive failure and cohesive failure, where some broken ice is left on the coating after the test) were observed in all cases. Cohesive failure and mixed failure were in the majority for silica-filled coatings, which verified the mechanical interlocking between the ice and coatings and underestimated the true τice. Compared with A-PDMS-modified epoxy coatings with no silica (25 phr of A-PDMS, 132.2 kPa with a standard deviation of 19.3 kPa), the τice of all nano/microsilica-filled coatings (including superhydrophobic coatings) were much larger (>500 kPa). This showed that the superhydrophobic coating sometimes cannot reduce τice. These findings are consistent with those of other studies [18].
The wide-scan XPS spectra of the superhydrophobic coating (Rn/m = 8:2) and A-PDMS-modified epoxy are shown in Figure 7a,b. The figures show that the Si 2s, Si 2p, C 1s, and O 1s peaks were detected at approximately 154, 102, 285, and 533 eV, respectively, on both surfaces. This indicates that the main elements of the epoxy, A-PDMS and silica were detected. Figure 7c,d shows the high-resolution XPS spectrum for the Si 2p of the nano/microsilica-filled A-PDMS-modified epoxy coating (Rn/m = 8:2) and A-PDMS-modified epoxy, respectively. The detailed analysis of Si 2p peaks shows two subpeaks at 102.2 and 103.3 eV, which are attributed to Si-O2 (coming from the silica) and Si(CH3)2O2 (mainly coming from the A-PDMS) structures on the nano/microsilica-filled A-PDMS-modified epoxy coating. According to the photoelectron intensity and subpeak area for the Si 2p peak of the nano/microsilica-filled A-PDMS-modified epoxy coating in Figure 8, the composition of the Si 2p peak is slightly influenced by the silica. In addition, X-rays may penetrate the A-PDMS-modified epoxy film to reach the buried silica, thus increasing the signal strength of silica. It is worth mentioning that the primary component on the surface of the superhydrophobic coating is A-PDMS-modified epoxy, not silica. Namely, the silica was fully covered by the A-PDMS-modified epoxy, which is responsible for the hydrophobicity of the coating.
Figure 8 shows the SEM images of the nano/microsilica-filled A-PDMS-modified epoxy coating (Figure 8a–e) and the A-PDMS-modified epoxy coating without particles (Figure 8g). Figure 9 shows the 3D-surface profiles and the surface roughness of those coatings. From Figure 8a,b, the two surfaces were hierarchically rough and exhibited superhydrophobic performance, with CAs greater than 155° and CAHs less than 5°. The Sa were 1.8963 and 1.695 μm. The surface topography formation of the two surfaces can be explained as follows. For single-sized nanosilica coatings (Rn/m was 10:0, Figure 8a) the silica particles agglomerated to large sizes (approximately several microns). In contrast, the micron-size structure of the surface with an Rn/m of 8:2, was provided by the microsilica directly (Figure 8b). From Figure 8c–f, all coatings were rough with a high CAH. From Figure 8g, the A-PDMS-modified epoxy coating was smooth with a CA of 106.2° (Sa = 0.339 μm). Compared with that of the A-PDMS-modified epoxy coating with no particles, the τice of all nano/microsilica-filled coatings (including superhydrophobic coatings) was much greater. This result may be due to the rough surface increasing the mechanical interlocking between the ice and coatings. For all silica-filled coating the roughness Sa are all larger than 1.6 μm (see Figure 9).
It seems possible that the water-coated contact state transformed from a Cassie state to a Wenzel state during the freezing process. To prove the transition of wetting from the Cassie state to the Wenzel state, the sliding angle (SA) of the superhydrophobic surface was measured at various temperatures (room temperature (22 °C), 10, 5 and 1 °C). The drop was distilled water to prevent icing. The results are shown in Table 2.
As shown in Table 2, when the temperature was 22 °C, the surface showed an SA of 5° ± 2°. When the temperature was reduced to 1 °C, the SA increased to 37° ± 6°. These results indicate that the drop would transform to the Wenzel state when the temperature decreased. Previous research has demonstrated that the CA of a superhydrophobic surface would decrease to a value less than 90° when the temperature drops to below 0 °C [15]. Both our results and other research [15] showed that the drop may transform from the Cassie state to the Wenzel state in the freezing process. Consequently, the mechanical interlocking occurred between the ice and coatings formed during the freezing process, which resulted in the high ice adhesion strength of the coating.

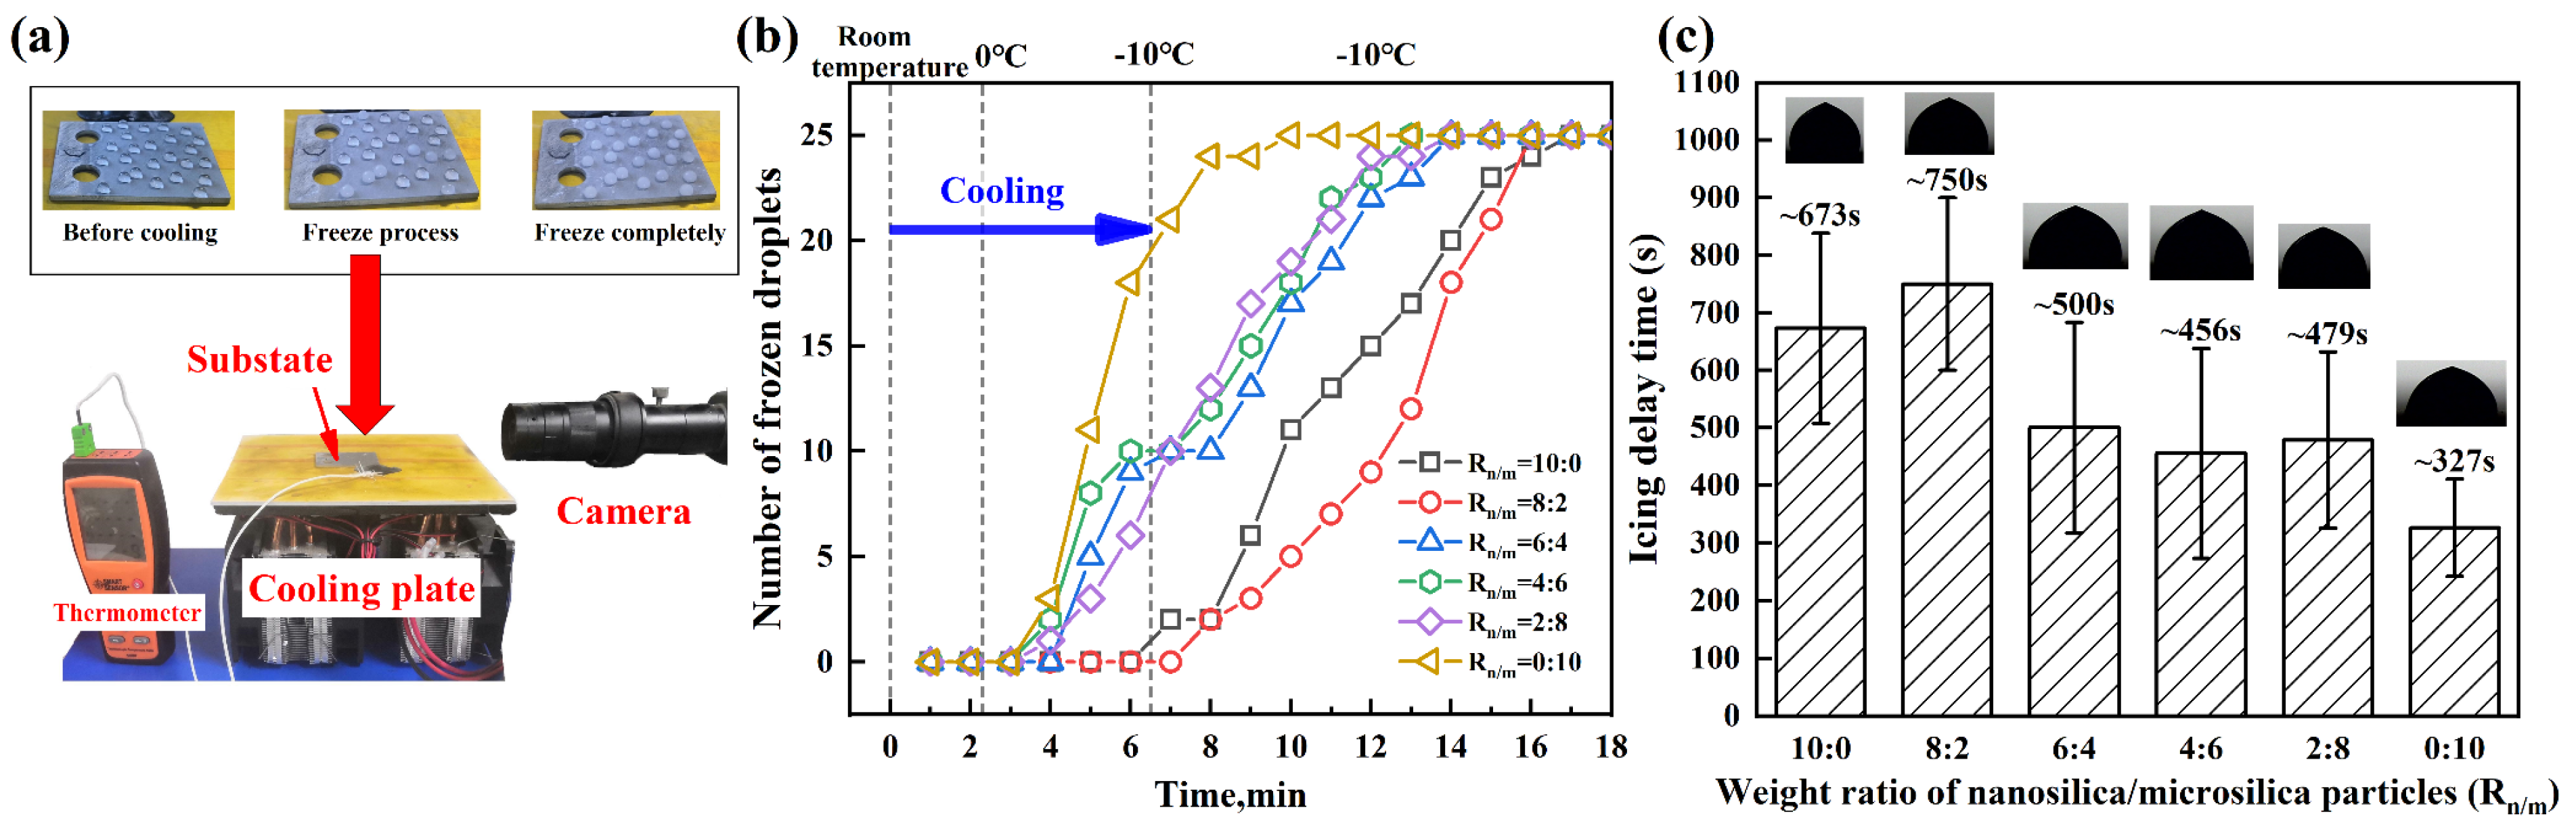
3.3. Icing Delay Test

Icing delay tests were used to evaluate the anti-icing property of silica-filled A-PDMS-modified epoxy coatings. These coated substrates were placed on a cooling plate (base on Peltier plate, see Figure 10a) under room temperature conditions (at ~21 °C and ~16% relative humidity). 25 distilled Water droplets (~20 μL) were placed on the substrates by a pipette. Then the substrate surface was cooled to a temperature of approximately −10 °C. Cooling rate was ~10 °C /min from room temperature to 0 °C. Cooling rate was ~2.5 °C /min from 0 to −10 °C. A camera was used to photograph the droplets. When the droplets changed from transparent to non-transparent and a peak formed on the top of the drop, it indicated that the droplet was completely frozen, and the icing delay time was recorded. Figure 10a,b shows the statistics of freezing for 25 droplets deposited onto the silica-filled coating and the means and standard deviations of icing delay time of the silica-filled coatings respectively.
For all coatings, the variation in the average freezing time was high as the supercooled droplet freezing is stochastic. This result similar to the previous researches [19,20]. For Rn/m = 0:10, 2:8, 4:6, and 6:4, the icing delay time was approximately 327, 479, 456, and 500 s, respectively. For those four coatings the first droplet froze within 5 min (see Figure 10b). For Rn/m = 8:2 and 10:0 (CA > 150°, CAH < 5°), the average icing delay time was increased to approximately 673 s and 750 s. For those two super superhydrophobic surface, none of the droplet frozen within 6 min. In some researches, the superhydrophobic surface can delay icing for thousands of seconds [5]. This is due to their excellent hydrophobic property reducing the true contact area between the surface and drop and reducing the heat exchange. Meantime, the superhydrophobic surface increase the energetic barrier that reduce the possibility of ice nucleation. However, superhydrophobic coating cannot completely prevent ice from forming on the surface due to the metastable state of droplet can be easily disturb by any small perturbation.

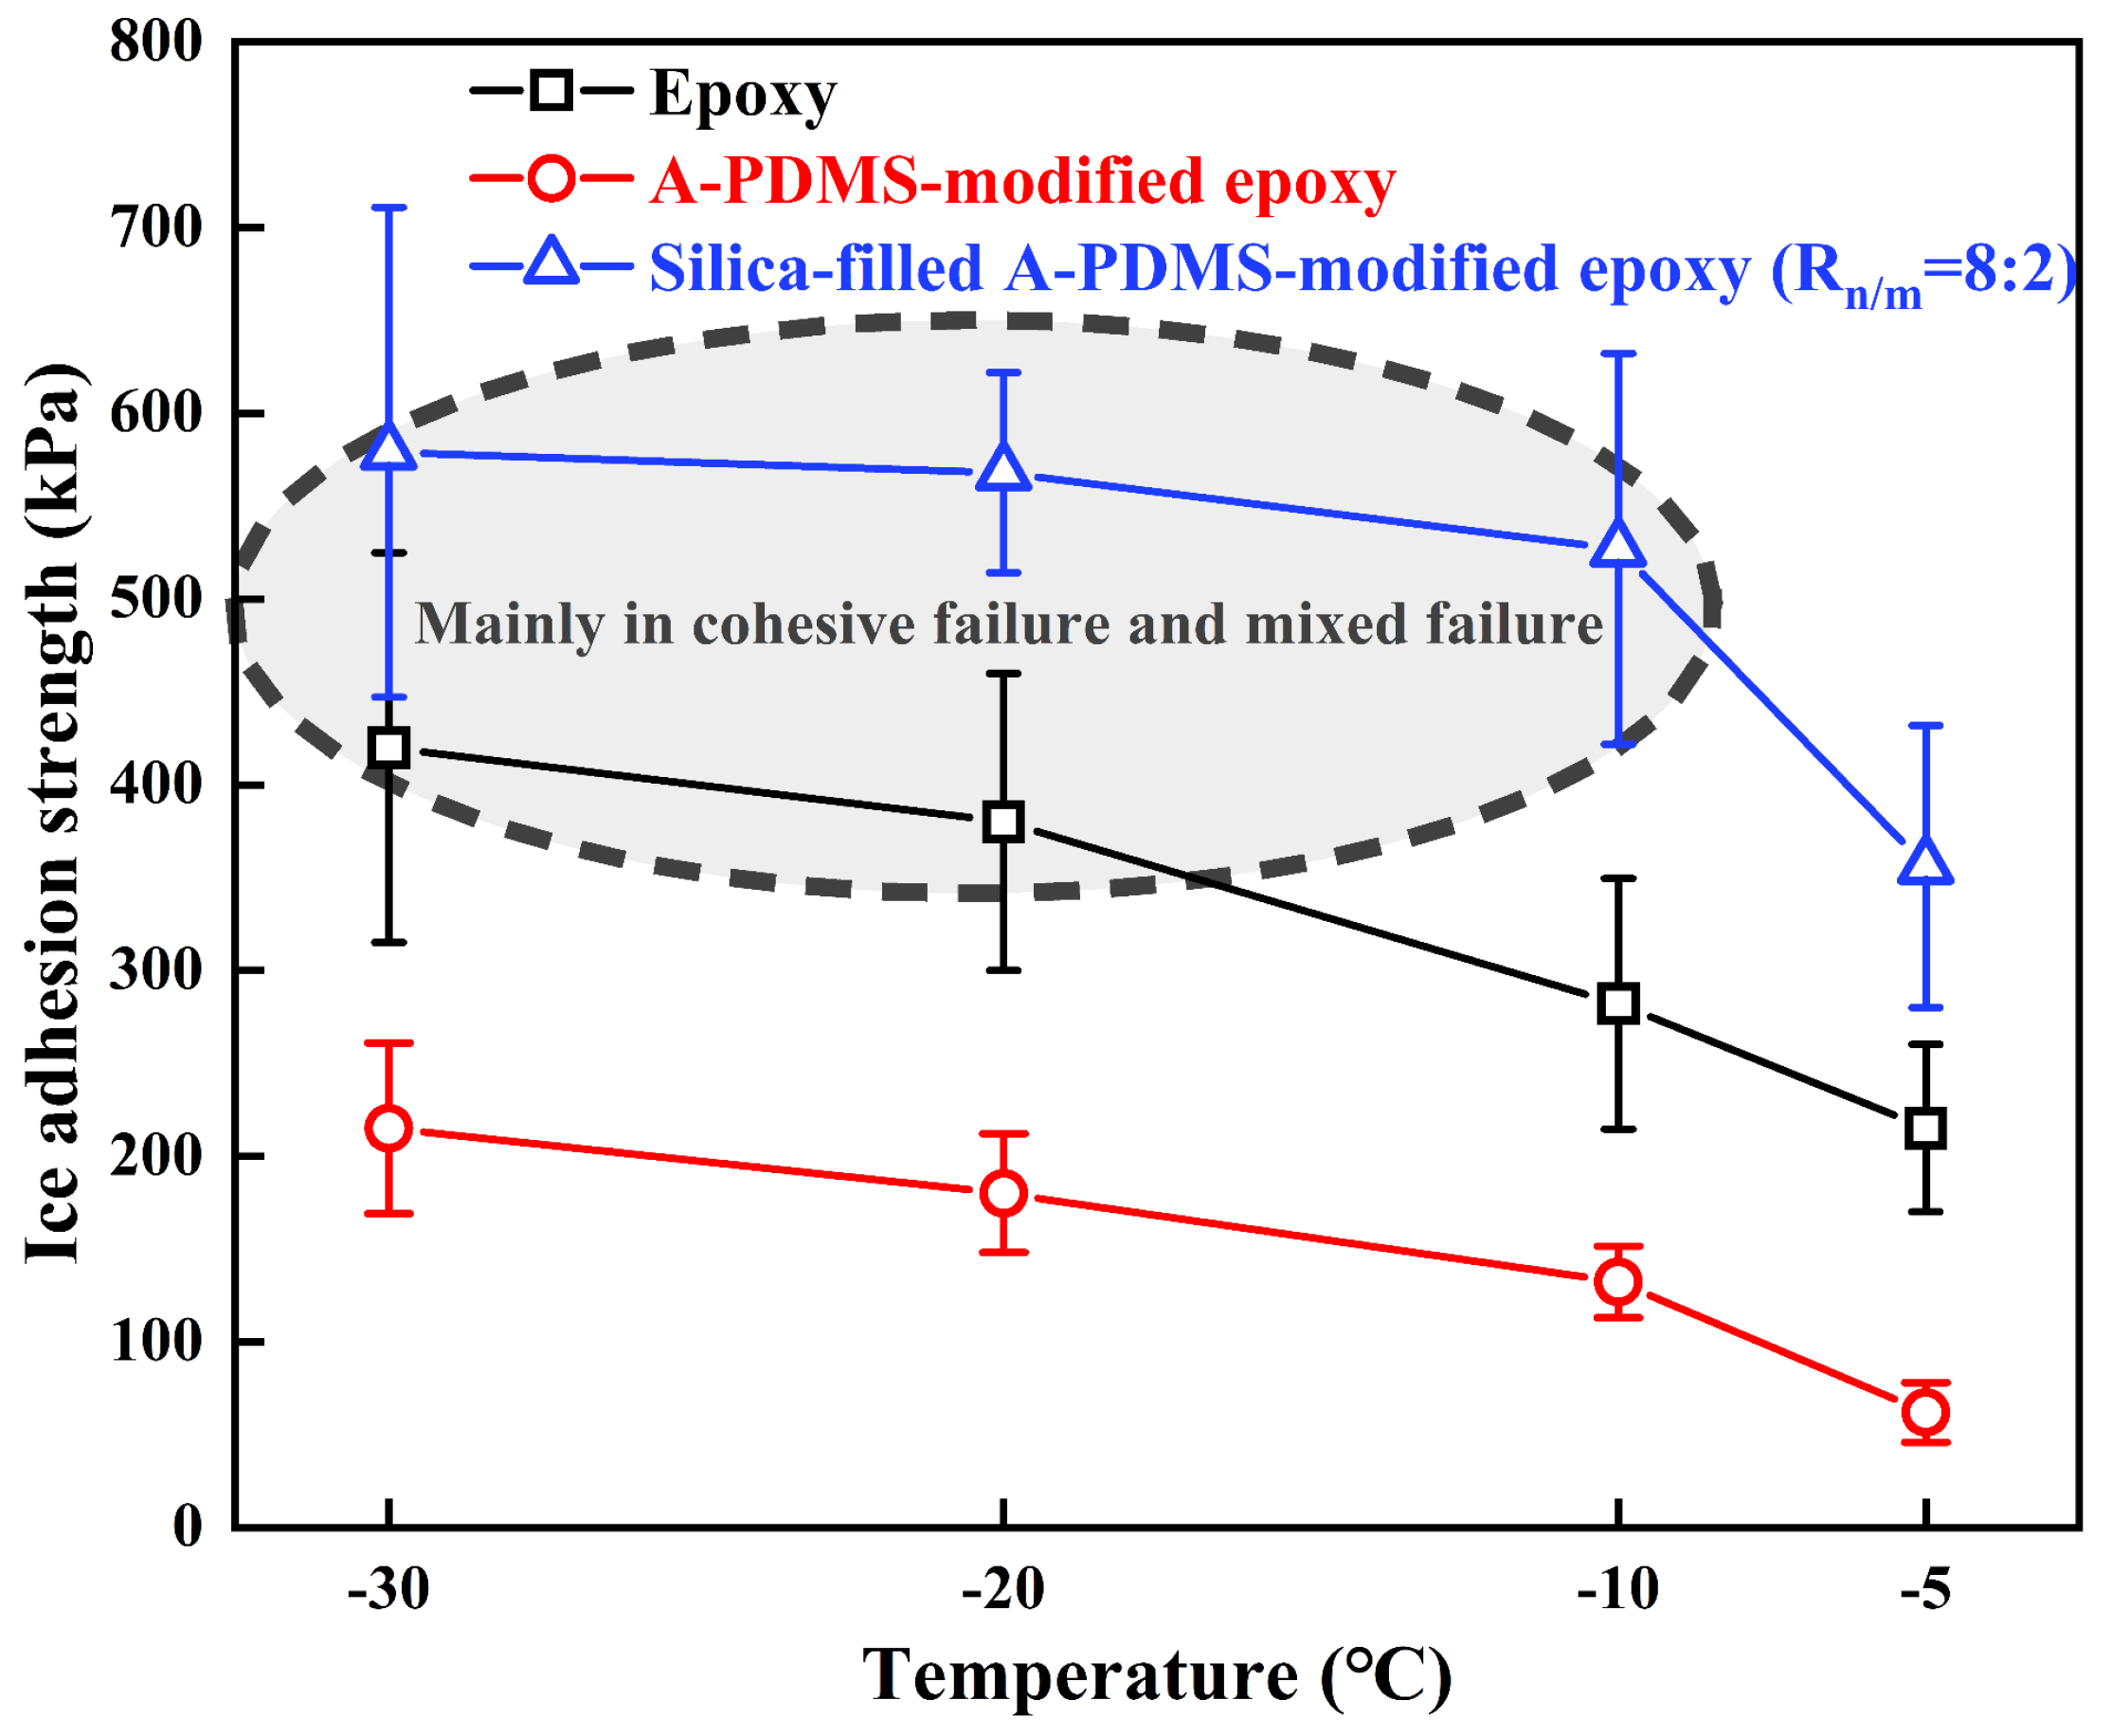
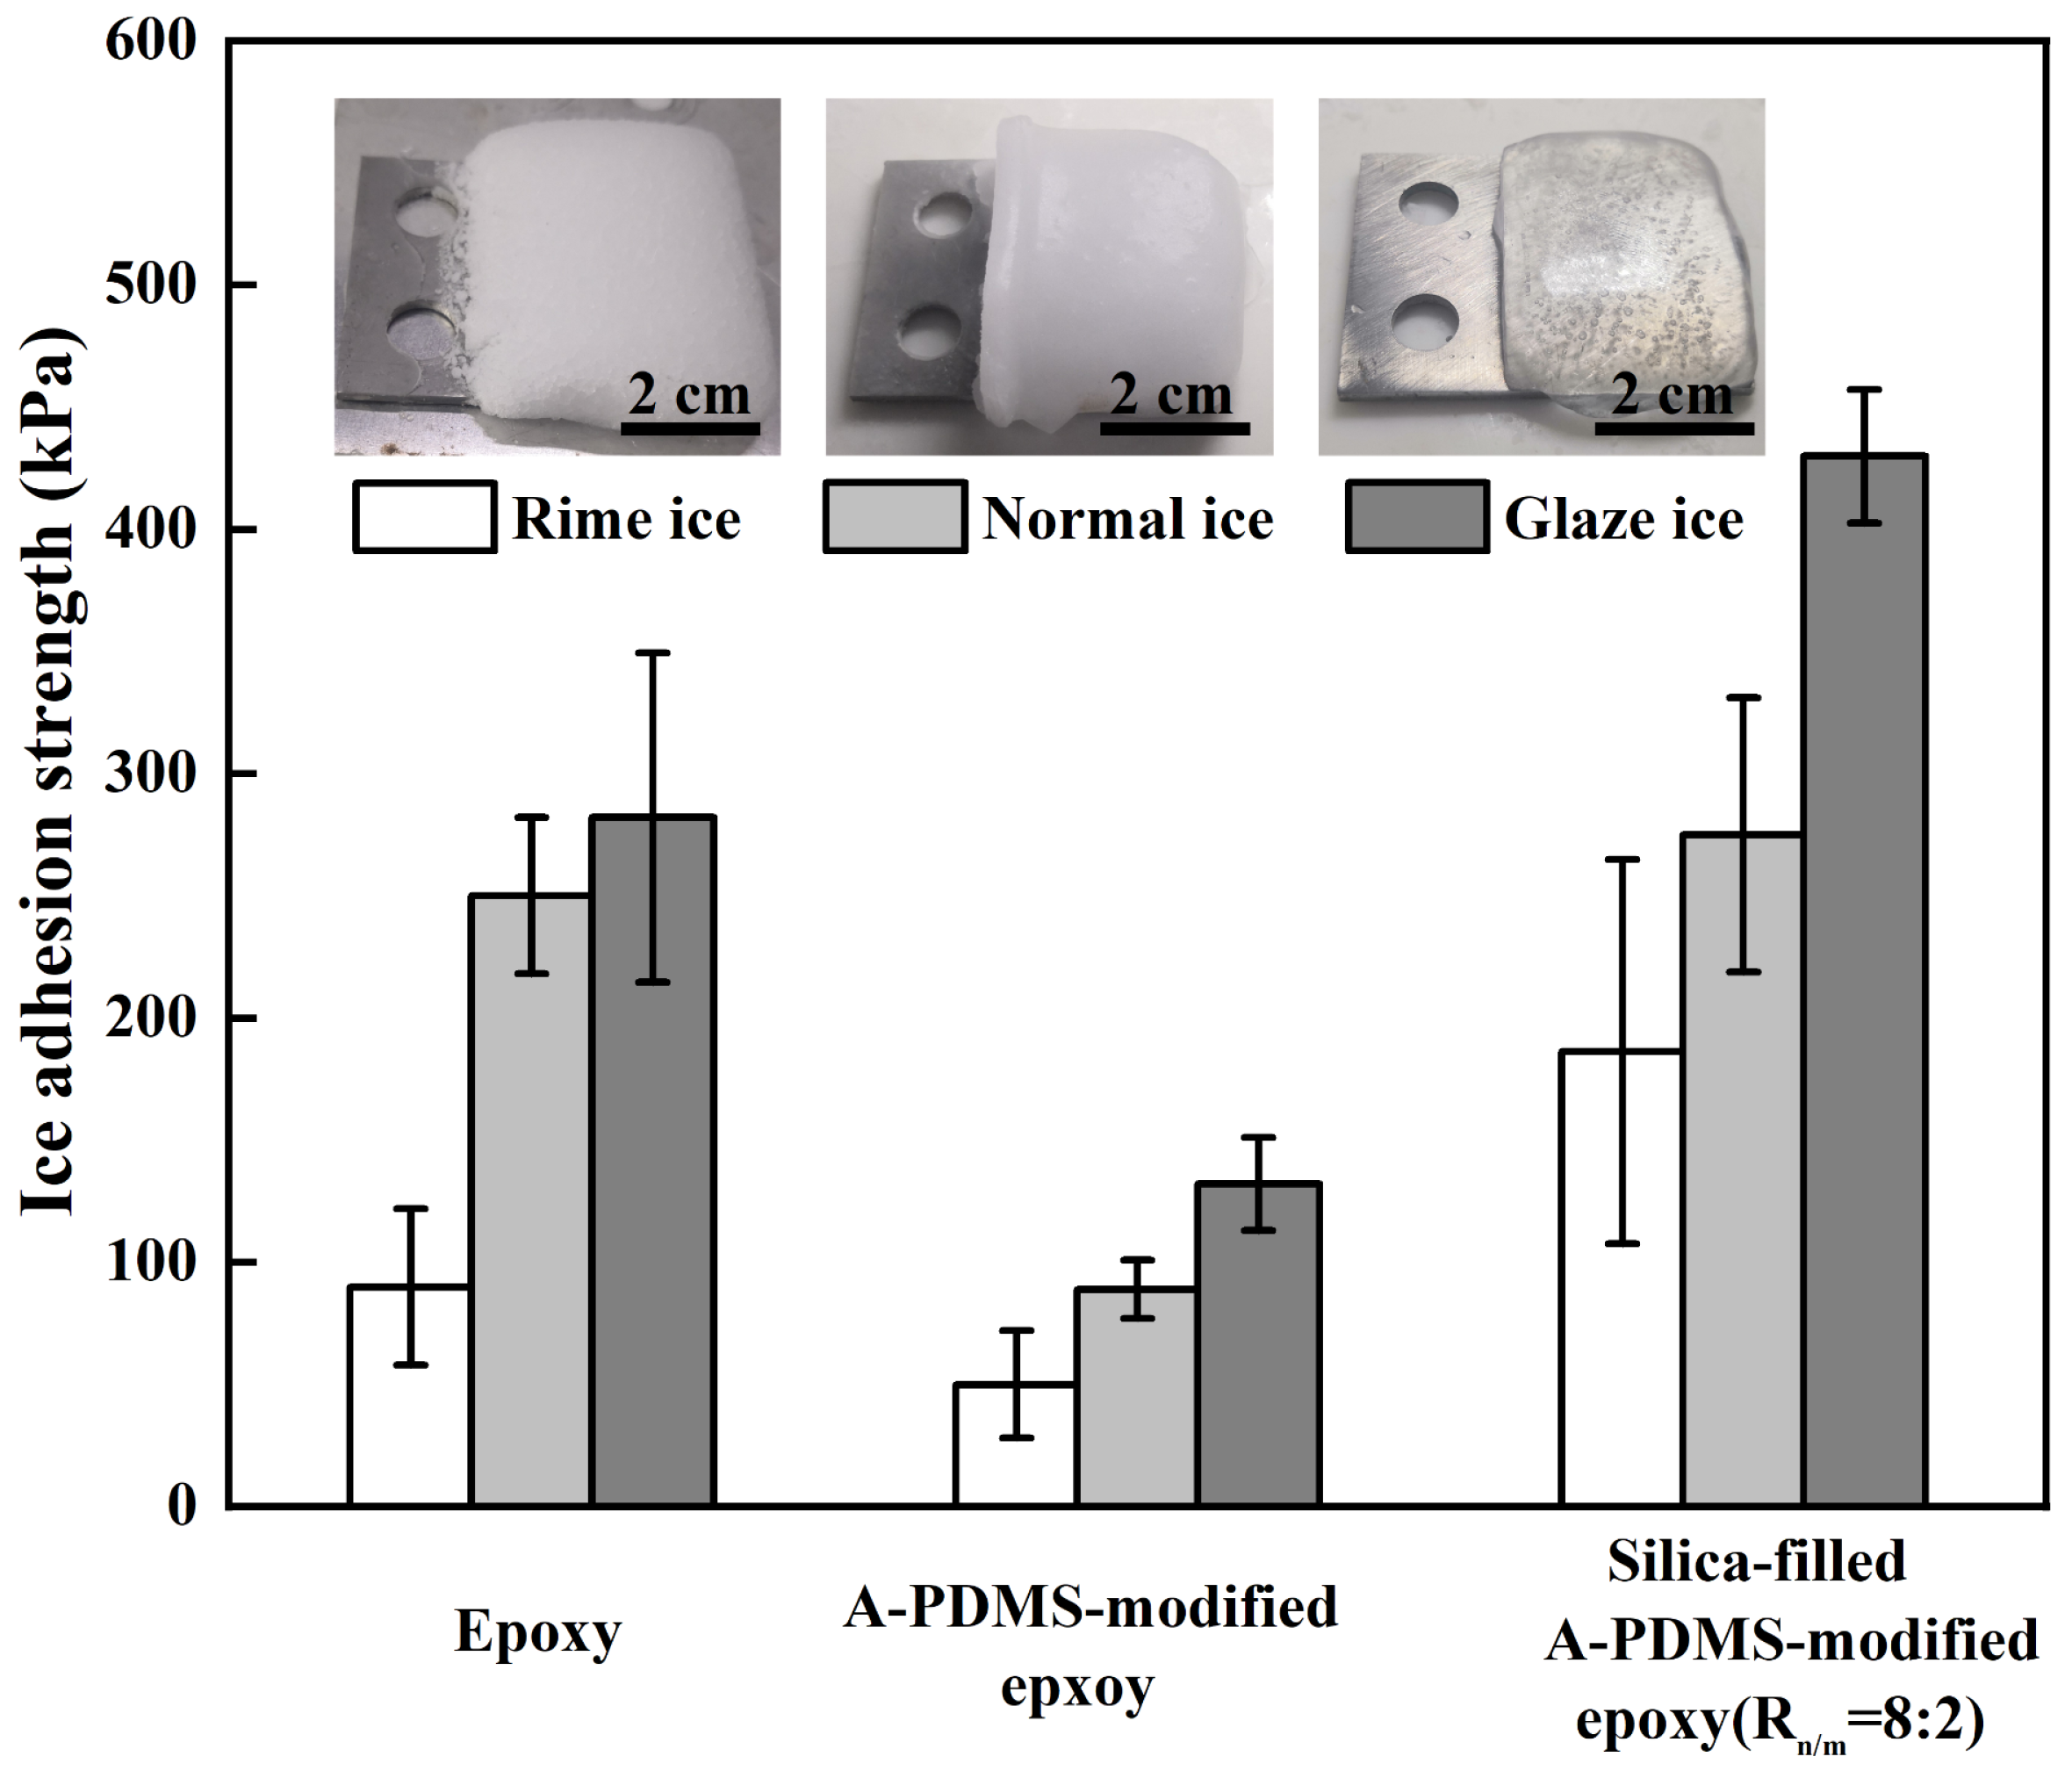
3.4. The Influences of Temperature and Ice Type on Ice Adhesion Strength

The effect of temperature (freezing and ambient temperature, from −5 °C to −30 °C) on the ice adhesion strength of different coatings was investigated. The results are shown in Figure 11. For all coatings, τice increased with decreasing temperature. The failure modes tended toward cohesive failure and mixed failure for the epoxy coating and nano/microsilica-filled A-PDMS-modified epoxy coating (Rn/m = 8:2) when the temperature decreased. The rankings of τice of the three surfaces were the same despite different temperatures: nano/microsilica-filled A-PDMS-modified epoxy coating (Rn/m = 8:2) > epoxy > A-PDMS-modified epoxy. This indicated that a mechanical interlock between the ice and nano/microsilica-filled A-PDMS-modified epoxy coating (Rn/m = 8:2, superhydrophobic) dominated τice at different temperatures.
The effect of ice type (rime ice, normal ice and glaze ice) on the ice adhesion strength (−10 °C) of epoxy, A-PDMS-modified epoxy and nano/microsilica-filled A-PDMS-modified epoxy coatings (Rn/m = 8:2) were compared.
The ice adhesion strength results of rime ice, normal ice and glaze ice on various surfaces and the photographs of rime ice, normal ice and glaze ice are shown in Figure 12. In terms of ice type, τice of rime ice was lower than that of normal ice and glaze ice for all coatings. This may be because when the freezing drizzle fell on the subzero coating, the water drops rapidly froze. It caused inhomogeneous porosity at the ice-coating interface, as shown in Figure 13. In contrast, the ice-coating interface for glaze ice was uniform in the freezing process. Compared with the τice of nano/microsilica-filled A-PDMS-modified epoxy (Rn/m = 8:2) in Figure 6, the τice of spray glaze ice was much lower. The possible explanation is as follows. For ice cuboids, the initial temperature of the substrate was room temperature. It was a long time until the water was frozen. During the process, mechanical interlocks can be sufficiently established. For the spray glaze ice, the temperature of the coated substrate has dropped to sub-zero before the water contacted the substrate. When water contacted the substrate, the water would be frozen faster than that in the case of ice cuboids. Mechanical interlocks cannot be completely established. Thus, the ice adhesion of spray glaze ice was lower than that of ice cuboids.

4. Conclusions

In this work, we developed a mixed-size nano/microstructure coating based on nano/microsilica-filled A-PDMS-modified epoxy by using a one-step spray-coating method. The influence of the addition of A-PDMS on the hydrophobicity and τice of the A-PDMS-modified epoxy coating was investigated. Ice adhesion strength tests indicated that the τice of the A-PDMS-modified epoxy coating (~130 kPa) was much smaller than that of the epoxy coating due to a low surface energy.
The particle size combination (Rn/m) effect on ice adhesion strength and hydrophobicity was investigated. It was found that the particle size combination obviously affects hydrophobicity. Under a suitable combination of nano/microsilica, the CA exceeded 150°. However, there was no significant correlation between τice and Rn/m. The τice of all nano/microsilica-filled coatings was much greater than that of coatings with no silica due to mechanical interlocking between the ice- and nano/microsilica-filled coatings.
Furthermore, nano/microsilica-filled A-PDMS-modified epoxy demonstrated a longer icing delay time when Rn/m = 8:2 and 10:0. The ice adhesion strength test at different temperatures indicated that the mechanical interlock between the ice- and nano/microsilica-filled A-PDMS-modified epoxy coating occurred at different temperatures.

Author Contributions

Conceptualization, J.Z. and R.Z.; Data curation, Q.X.; Formal analysis, Q.X.; Methodology, T.H. and C.W.; Resources, C.W. and H.Q.; Writing – original draft, Q.X. and T.H.

Funding

This research was funded by the National Natural Science Foundation of China under Grant No. 11772098.

Conflicts of Interest

The authors declare no conflict of interest.

References

  1. Lv, J.; Song, Y.; Jiang, L.; Wang, J. Bio-Inspired strategies for anti-icing. ACS Nano 2014, 8, 3152–3169. [Google Scholar] [CrossRef] [PubMed]
  2. Bormashenko, E. Physics of pre-wetted, lubricated and impregnated surfaces: A review. Philos. Trans. A Math. Phys. Eng. Sci. 2018, 377, 20180264. [Google Scholar] [CrossRef] [PubMed]
  3. Rykaczewski, K.; Anand, S.; Subramanyam, S.B.; Varanasi, K.K. Mechanism of frost formation on lubricant-impregnated surfaces. Langmuir 2013, 29, 5230–5238. [Google Scholar] [CrossRef] [PubMed]
  4. Zhu, L.; Xue, J.; Wang, Y.; Chen, Q.; Ding, J.; Wang, Q. Ice-Phobic coatings based on silicon-oil-infused polydimethylsiloxane. ACS Appl. Mater. Interfaces 2013, 5, 4053–4062. [Google Scholar] [CrossRef] [PubMed]
  5. Guo, P.; Zheng, Y.; Wen, M.; Song, C.; Lin, Y.; Jiang, L. Icephobic/Anti-Icing Properties of Micro/Nanostructured Surfaces. Adv. Mater. 2012, 24, 2642–2648. [Google Scholar] [CrossRef] [PubMed]
  6. Zhang, J.; Zhang, W.; Lu, J.; Zhu, C.; Lin, W.; Feng, J. Aqueous epoxy-based superhydrophobic coatings: Fabrication and stability in water. Prog. Org. Coat. 2018, 121, 201–208. [Google Scholar] [CrossRef]
  7. Wu, Y.; Zhao, M.; Guo, Z. Robust, Heat-Resistant and multifunctional superhydrophobic coating of carbon microflowers with molybdenum trioxide nanoparticles. J. Colloid Interface Sci. 2017, 506, 649–658. [Google Scholar] [CrossRef] [PubMed]
  8. Li, J.-H.; Weng, R.; Di, X.-Q.; Yao, Z.-W. Gradient and weather resistant hybrid super-hydrophobic coating based on fluorinated epoxy resin. J. Appl. Polym. Sci. 2014, 131, 40955. [Google Scholar] [CrossRef]
  9. Zhang, F.; Qian, H.; Wang, L.; Wang, Z.; Du, C.; Li, X.; Zhang, D. Superhydrophobic carbon nanotubes/epoxy nanocomposite coating by facile one-step spraying. Surf. Coat. Technol. 2018, 341, 15–23. [Google Scholar] [CrossRef]
  10. Peng, W.; Gou, X.; Qin, H.; Zhao, M.; Zhao, X.; Guo, Z. Creation of a multifunctional superhydrophobic coating for composite insulators. Chem. Eng. J. 2018, 352, 774–781. [Google Scholar] [CrossRef]
  11. Sarkar, D.K.; Farzaneh, M. Superhydrophobic coatings with reduced ice adhesion. J. Adhes. Sci. Technol. 2009, 23, 1215–1237. [Google Scholar] [CrossRef]
  12. Wu, X.; Zheng, S.; Daniel, A.B.-A.; Vadim, V.S.; Chen, Z. Transparent icephobic coatings using bio-based epoxy resin. Mater. Des. 2018, 140, 516–523. [Google Scholar] [CrossRef]
  13. Cheng, T.; He, R.; Zhang, Q.; Zhan, X.; Chen, F. Magnetic particle-based super-hydrophobic coatings with excellent anti-icing and thermoresponsive deicing performance. J. Mater. Chem. A 2015, 43, 21637–21646. [Google Scholar] [CrossRef]
  14. Kulinich, S.A.; Farzaneh, M. Ice adhesion on super-hydrophobic surfaces. Appl. Sur. Sci. 2009, 255, 8153–8157. [Google Scholar] [CrossRef]
  15. Zheng, S.; Daniel, A.B.-A.; Wu, X.; Zhan, X.; Huang, Y.; Zeng, X.; Zhang, Q.; Chen, Z. Durable waterborne hydrophobic bio-epoxy coating with improved anti-icing and self-cleaning performance. ACS Sustain. Chem. Eng. 2018, 7, 641–649. [Google Scholar] [CrossRef]
  16. Guerin, F.; Laforte, C.; Farinas, M.-I.; Perron, J. Analytical model based on experimental data of centrifuge ice adhesion tests with different substrates. Cold Reg. Sci. Technol. 2016, 121, 93–99. [Google Scholar] [CrossRef]
  17. ISO 25178-2: 2012 Geometrical Product Specifications (GPS)-Surface Texture: Areal-Part 2: Terms, Definitionsand Surface Texture Parameters; ISO: Geneva, Switzerland, 2012.
  18. Chen, J.; Liu, J.; He, M.; Li, K.; Cui, D.; Zhang, Q.; Zeng, X.; Zhang, Y.; Wang, J.; Song, Y. Superhydrophobic surfaces cannot reduce ice adhesion. Appl. Phys. Lett. 2012, 101, 111603. [Google Scholar] [CrossRef]
  19. Vali, G. Repeatability and randomness in heterogeneous freezing nucleation. Atmos. Chem. Phys. 2008, 8, 5017–5031. [Google Scholar] [CrossRef]
  20. Boinovich, L.B.; Emelyanenko, A.M.; Emelyanenko, K.A.; Modin, E.B. Modus operandi of protective and anti-icing mechanisms underlying the design of longstanding outdoor icephobic coatings. ACS Nano 2019, 13, 4335–4346. [Google Scholar] [CrossRef] [PubMed]
Scheme 1. Reaction scheme of A-PDMS and epoxy resin.
Coatings 09 00771 sch001
Figure 1. Reaction schemes of APTES-modified silica and the preparation procedure of the silica-filled A-PDMS-modified epoxy coating.
Coatings 09 00771 g001
Figure 2. Photograph of the refrigerated centrifuge. Rotor and electromotor are inside. All ice adhesion strength tests were performed inside this apparatus.
Coatings 09 00771 g002
Figure 3. Schematic description of ice formation and centrifuge ice adhesion strength test. (a) Silicone mould was filled with deionized water. Substrate was placed upside down on the silicone mould and fully contacted with water. Temperature was set to desired temperature. After freezing, the substrate with ice was pulled out; (b) Substrate with ice was bolted to the discal rotor of centrifuge setup; (c) Formula for calculating the ice adhesion strength (τice).
Coatings 09 00771 g003
Figure 4. Ice adhesion strength (τice) (−10 °C) and CA of A-PDMS-modified epoxy coatings. The error bar is one standard deviation.
Coatings 09 00771 g004
Figure 5. CAs of silica-filled A-PDMS-modified epoxy coatings with various additions of single-sized nanosilica and single-sized microsilica. The error bar is one standard deviation. CAH values of the coating with nanosilica and microsilica (inset).
Coatings 09 00771 g005
Figure 6. Ice adhesion strength (τice) and CA of nano/microsilica-filled A-PDMS-modified epoxy coating on various Rn/m. The error bar is one standard deviation.
Coatings 09 00771 g006
Figure 7. The wide-scan XPS spectrum of the (a) nano/microsilica-filled A-PDMS-modified epoxy coating (Rn/m = 8:2) and the (b) A-PDMS-modified epoxy with no silica. Atomic concentrations are shown in the insets. (c) High-resolution XPS spectrum of Si 2p of the nano/microsilica-filled A-PDMS-modified epoxy coating (Rn/m = 8:2) and the (d) A-PDMS-modified epoxy with no silica.
Coatings 09 00771 g007
Figure 8. SEM images of the nano/microsilica-filled A-PDMS-modified epoxy coatings: (a) Rn/m =10:0; (b) Rn/m = 8:2; (c) Rn/m = 6:4; (d) Rn/m = 4:6; (e) Rn/m = 2:8; (f) Rn/m = 0:10. (g) A-PDMS-modified epoxy coating. Sessile and moving water drops are shown in the insets.
Coatings 09 00771 g008
Figure 9. 3D-Surface profiles and roughness parameters (Sa and Sq) of the nano/microsilica-filled A-PDMS-modified epoxy coatings: (a) Rn/m = 10:0; (b) Rn/m = 8:2; (c) Rn/m = 6:4; (d) Rn/m = 4:6; (e) Rn/m = 2:8; (f) Rn/m = 0:10. (g) A-PDMS-modified epoxy coating without silica.
Coatings 09 00771 g009
Figure 10. Freezing statistics experiment. (a) Scheme of freezing delay experimental set-up. (b) Statistics of freezing for 25 droplets deposited onto the coatings (c) Icing delay time of silica-filled coating with one standard deviation. The water drops were approximately 20 μL.
Coatings 09 00771 g010
Figure 11. Ice adhesion strength of epoxy, A-PDMS-modified epoxy and nano/microsilica-filled A-PDMS-modified epoxy coatings (Rn/m = 8:2) at different temperatures. The error bar is one standard deviation.
Coatings 09 00771 g011
Figure 12. Ice adhesion strength of epoxy, A-PDMS-modified epoxy and nano/microsilica-filled A-PDMS-modified epoxy for three ice types (rime ice, normal ice and glaze ice) at −10 °C. The insets are photographs of rime ice, normal ice and glaze ice. The scale bar is approximately 2 cm, and the error bar is one standard deviation.
Coatings 09 00771 g012
Figure 13. Sketch of the microstructure of rime ice and glaze ice.
Coatings 09 00771 g013
Table 1. Overview of CA (average with ± one standard deviation), CAH and failure modes of various coatings.
CoatingsCA (°)CAH (°)Frequency of Failure Modes
Adhesive FailureCohesive FailureMixed Failure
Epoxy68.0 ± 1.2>303-2
Epoxy + 5 phr of A-PDMS105.0 ± 1.1>305--
Epoxy + 10 phr of A-PDMS105.8 ± 0.9>305--
Epoxy + 15 phr of A-PDMS106.5 ± 1.2>305--
Epoxy + 20 phr of A-PDMS106.0 ± 0.7>304-1
Epoxy + 25 phr of A-PDMS106.9 ± 1.0>305--
Epoxy + 30 phr of A-PDMS106.4 ± 1.2>305--
Epoxy + 35 phr of A-PDMS107.0 ± 1.5>305--
Epoxy + 40 phr of A-PDMS106.4 ± 1.3>305--
Epoxy + 25 phr of A-PDMS + silica (Rn/m = 0:10)108.1 ± 2.3>90-23
Epoxy + 25 phr of A-PDMS + silica (Rn/m = 2:8)114.0 ± 3.5>90-14
Epoxy + 25 phr of A-PDMS + silica (Rn/m = 4:6)115.3 ± 2.6>90-32
Epoxy + 25 phr of A-PDMS + silica (Rn/m = 6:4)148.7 ± 1.9>90122
Epoxy + 25 phr of A-PDMS + silica (Rn/m = 8:2)158.3 ± 1.2<5113
Epoxy + 25 phr of A-PDMS + silica (Rn/m = 10:0)158.3 ± 1.3<5-32
Table 2. SA of nano/microsilica-filled A-PDMS-modified epoxy coating (Rn/m = 8:2) at various temperatures (average with ± one standard deviation).
Temperature (°C)221051
SA (°)5 ± 210 ± 323 ± 737 ± 6

