1.Introduction
Semiconductor materials are of long standing research interest due to their practical applications as photocatalysts for environmental remediation, with specific focus on titanium dioxide owing to its durability and high performance. Titanium dioxide has been used consistently as the photocatalyst of choice to address a variety of environmental problems, and has been shown to be particularly effective when utilised as a thin film coating, specifically in self-cleaning glass [
1], antimicrobial applications [
2], and for water-splitting to produce hydrogen [
3]. A multitude of approaches are used to produce TiO
2 thin films, including sol-gel [
4] and hydrothermal routes [
5], as well as vapour deposition methods, such as chemical vapour deposition (CVD) [
6], physical vapour deposition (PVD) [
7] and more recently, aerosol-assisted CVD [
8] and electric field assisted CVD [
9].
Of all the deposition methods mentioned, sol-gel remains one of the most popular routes for producing TiO
2 thin films due to its low cost, experimental simplicity and easy scale-up ability. Sol-gel also enables direct control of particle homogeneity during the particle growth phase, and as a result it is a particularly popular strategy for simple modification of thin films for the properties listed above. There has been a great variety of research focused on process modification that encourages specific morphological control within the resulting thin films [
10]. Typically, sol-gel methods have been modified with the addition of block co-polymer templating agents [
11] or non-ionic surfactants, such as Triton X-100 [
12]. Previously we have reported the use of Brij
® surfactants in a non-aqueous sol-gel process to produce TiO
2 thin films with an increased average particle size and increased surface roughness, whereby such structural changes led to an increase in the photocatalytic activity of produced TiO
2 thin films [
13]. The use of such non-ionic surfactants in sol-gel processing is a commonplace strategy for the direct control of particle size and shape during the growth phase for the enhancement of resulting properties [
14,
15]. Due to their amphiphilic nature, surfactants act as pore-directing agents that can enable the production of highly porous materials with specific pore size and structure. A wide variety of surfactants have been used in sol-gel processing for TiO
2 thin film production including Brij
® surfactants [
14,
16], Triton™ X-100 [
17], Pluronic triblock copolymers [
14,
15] and Tween
® 20 [
18], which has been used in this investigation in comparison with Tween
® 40.
This paper focuses on the use of Tween® 20, 40 surfactants in a modified non-aqueous sol-gel method to investigate the effect of surfactant type and concentration on the subsequent microstructure and functional properties of TiO2 thin films.
3. Results and Discussion
The TiO
2 thin films produced by the surfactant-assisted sol-gel method described were transparent, covering the entire surface of the area of glass that was dipped and showed evidence of birefringence. All films produced exhibited good adherence to the substrate after annealing, and passed the scotch tape test. The average thickness of TiO
2 thin films produced varied within the range of 42–220 nm, whereby the thinnest film at 42 nm was a one layer sample produced from a sol-gel solution that did not contain any added surfactant, and the thickest film, 220 nm was a three layer sample produced from a sol-gel solution with 0.003 mol·dm
−3 of Tween
® 20 surfactant added. The thickness of films produced was found to vary depending on the surfactant and concentrations used during processing, as well as the number of layers. The thin film thicknesses are shown in
Table 2, where it can be seen that on average the thickness of the film increases with consecutive number of dips, as expected as this increases the number of layers of TiO
2 on the surface. Single layer samples varied between 70–200 nm, two layer samples were within the thickness range of 110–210 nm, and three layer samples varied between 130–220 nm.
Table 2.
Samples prepared via sol-gel using different types and concentrations of Tween® surfactant, and annealed at 500 °C for 15 min. A = no surfactant; B = Tween® 60 (6 × 10⁻⁴ mol·dm−3); C = Tween® 60 (4 × 10⁻⁴ mol·dm−3); D = Tween® 60 (2 × 10⁻⁴ mol·dm−3); E = Tween® 40 (6 × 10⁻⁴ mol·dm−3); F = Tween® 40 (4 × 10⁻⁴ mol·dm−3); G = Tween® 20 (6 × 10⁻⁴ mol·dm−3); H = Tween® 20 (4 × 10⁻⁴ mol·dm−3). Numbers in sample name represent number of layers. Particle sizes marked with asterisks (*) denote agglomeration within the thin film. Contact angle measurements are given with standard deviation values.
| Sample name | Contact angle (°) before UV | Contact angle (°) after UV | Average particle size with average deviation (nm) | Average root mean square roughness (nm) | Average thin film thickness (nm) | Photocatalytic half-life for Rz (min) | Indirect band gap (eV) ±0.05 |
|---|
| A1 | 38.06 ± 9 | 14 ± 1 | 130 ± 30 | 9 | 42 | 11 | 2.9 |
| A2 | 49.59 ± 5 | 6.94 ± 1 | 130 ± 28 | 11 | 78 | 16.5 | 3.1 |
| A3 | 39.17 ± 2 | 7.42 ± 5 | 40 ± 32 | 17 | 91 | 9.5 | 3.2 |
| B1 | 48.81 ± 2 | 4.69 ± 2 | 55 ± 33 | 318 | 180 | – | 3.2 |
| B2 | 51.97 ± 1 | 8.67 ± 8 | 28 ± 21 | 196 | 170 | 5 | 3.2 |
| B3 | 62.21 ± 1 | 7.78 ± 1 | 28* ± 21 | 209 | 210 | – | 3.0 |
| C1 | 45.42 ±3 | 4.2 ± 2 | 39 ± 40 | 296 | 200 | – | 3.2 |
| C2 | 36.66 ± 1 | 6.3 ± 4 | 29 ± 37 | 135 | 110 | 3 | 3.2 |
| C3 | 61.72 ± 7 | 55.5 ± 1 | 46 ± 17 | 254 | 190 | – | 3.2 |
| D1 | 37 ± 1 | 6.31 ± 2 | 40 ± 33 | 293 | 110 | – | 3.2 |
| D2 | 36.61 ± 2 | 3.23 ± 1 | 25 ± 21 | 350 | 160 | 4 | 3.2 |
| D3 | 47.3 ± 7 | 4.55 ± 2 | 40 ± 28 | 366 | 180 | – | 3.1 |
| E1 | 33.71 ± 9 | 7.94 ± 1 | 41 ± 39 | 144 | 120 | – | 3.15 |
| E2 | 36.82 ± 4 | 3.83 ± 1 | 35 ± 37 | 191 | 210 | 3 | 3.15 |
| E3 | 34.35 ± 9 | 4.55 ± 2 | 26 ± 18 | 181 | 220 | – | 3.15 |
Furthermore, the addition of surfactant was found on average to produce thicker thin films. For example, the three layer sample without surfactant, A3 had a thickness of 130 nm, whereas three layer samples produced with surfactant ranged in thickness depending on the type and concentration used; 180–220 nm, as shown in
Table 2. The addition of surfactant increases the viscosity of the original sol-gel solution, and further increasing the surfactant concentration causes additional viscosity within the sol-gel, so the resulting thin films are thicker [
12].
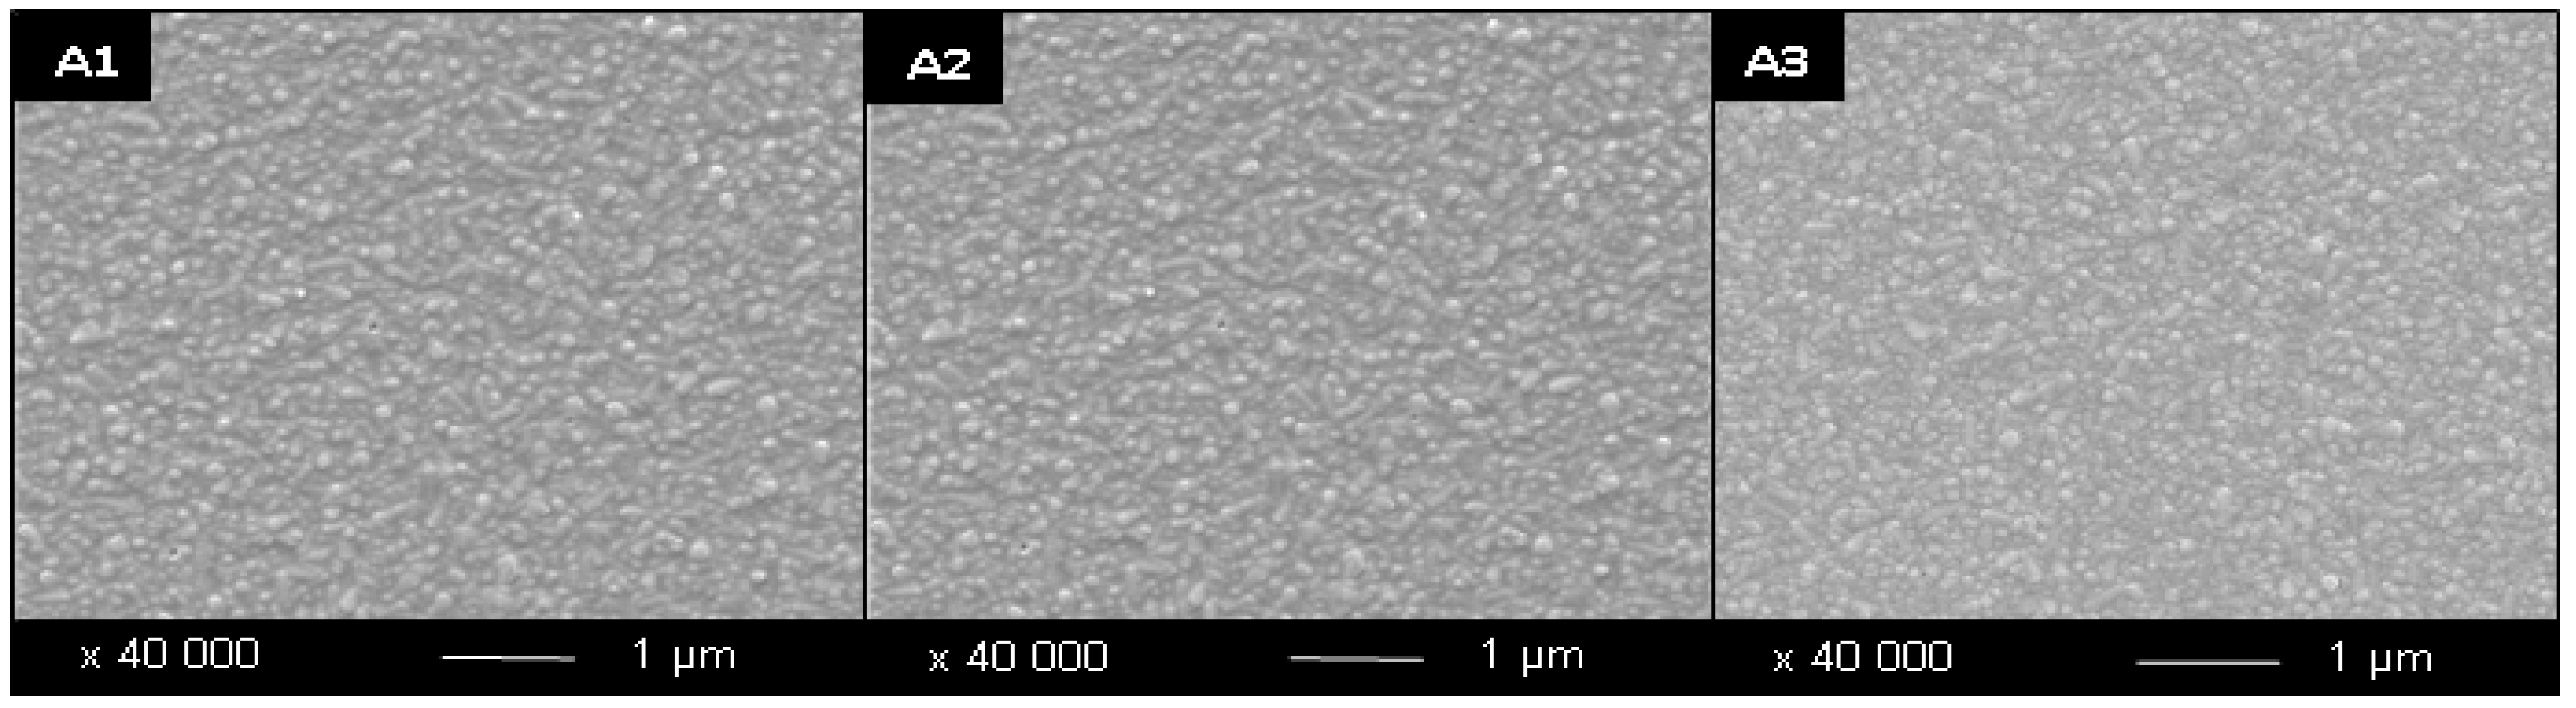
The thin film microstructure can be analysed using the SEM images, whereby it was found that all variants explored; the addition of different surfactants, variation in the number of dips, and the annealing temperature, all influenced the morphology of the TiO
2 thin films produced as shown in
Figure 1,
Figure 2 and
Figure 3. These variations within the sol-gel processing used were also found to significantly affect the photocatalytic and wetting properties of the thin films. Surfactant addition was found to alter the morphology of the TiO
2 thin films produced, as seen in the SEM images in
Figure 1,
Figure 2 and
Figure 3. In comparison to the thin films produced without surfactant, as in
Figure 1, those films produced with the addition of Tween
® surfactants (
Figure 2 and
Figure 3) show less agglomeration, greater particle definition and exhibited a wider particle size range within samples.
Figure 1.
SEM Images of samples prepared via sol-gel. A = no surfactant; numbers represent number of layers. Samples were annealed at 500 °C/15 min.
Figure 1.
SEM Images of samples prepared via sol-gel. A = no surfactant; numbers represent number of layers. Samples were annealed at 500 °C/15 min.
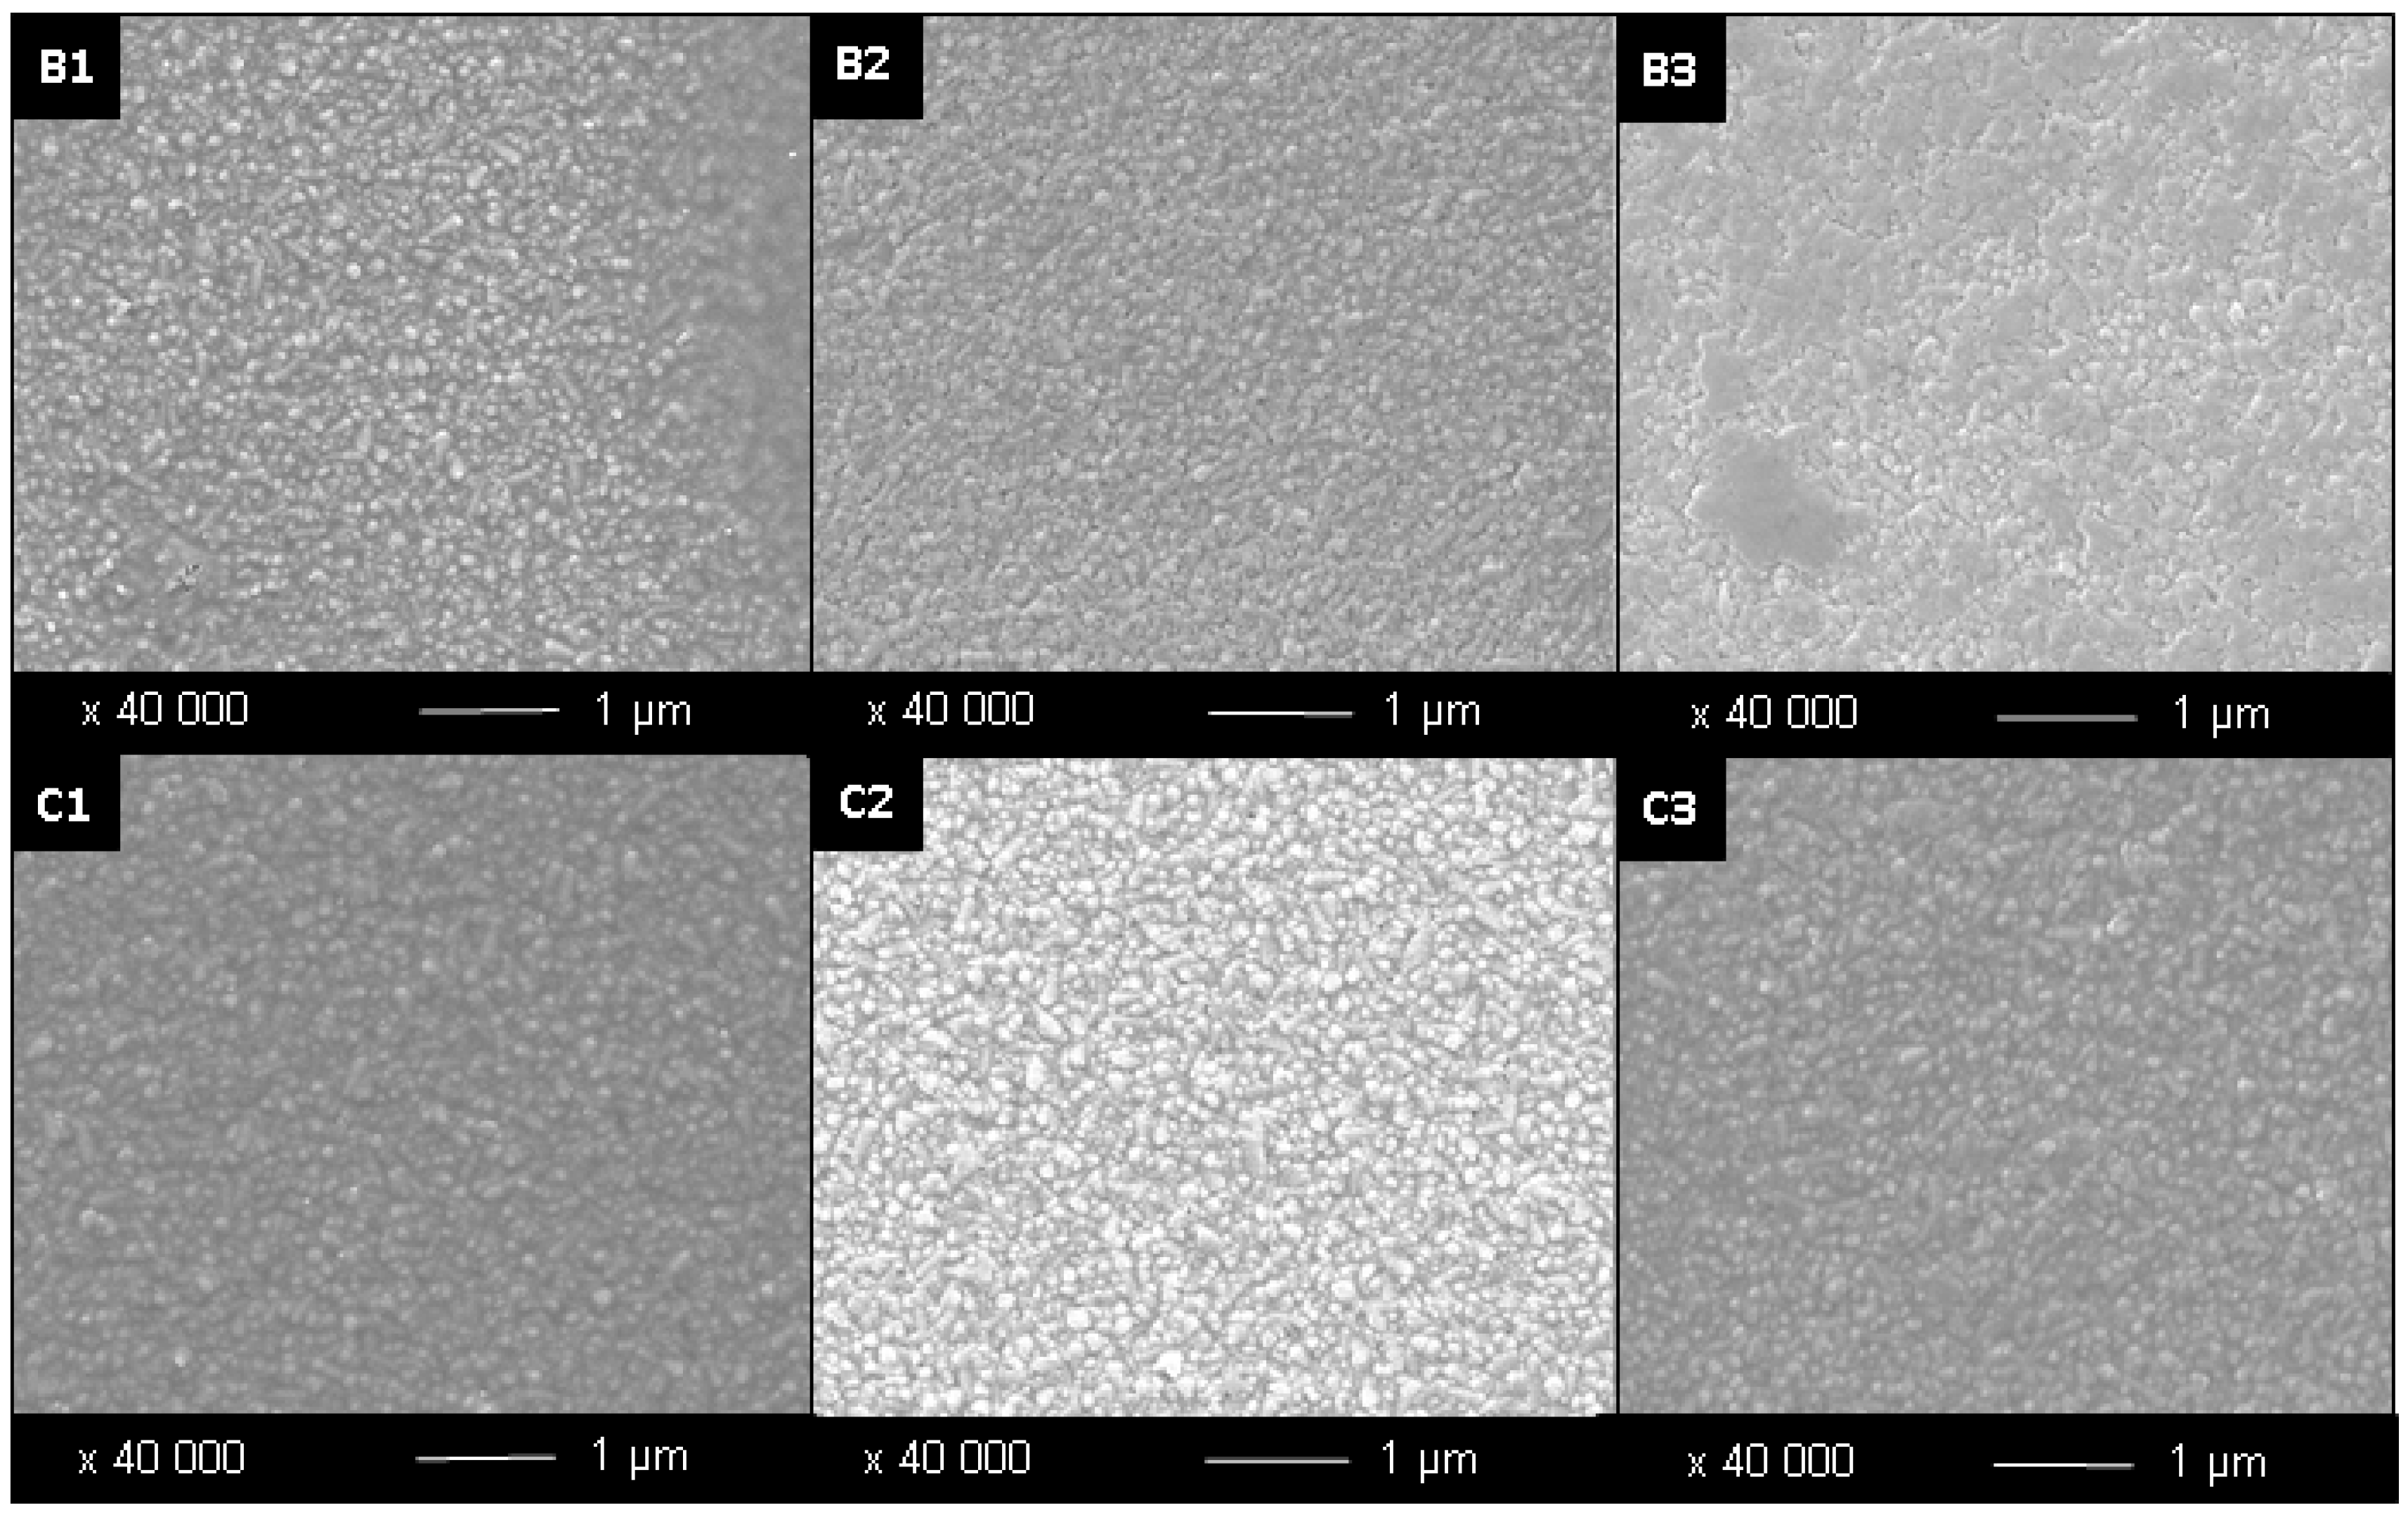
Figure 2.
SEM Images of samples prepared by sol-gel with decreasing concentration of Tween® 40 surfactant. B = 0.0006 mol·dm−3; C = 0.0003 mol·dm−3; numbers represent number of layers. Samples were annealed at 500 °C/15 min.
Figure 2.
SEM Images of samples prepared by sol-gel with decreasing concentration of Tween® 40 surfactant. B = 0.0006 mol·dm−3; C = 0.0003 mol·dm−3; numbers represent number of layers. Samples were annealed at 500 °C/15 min.
Figure 3.
SEM Images of samples prepared by sol-gel with decreasing concentration of Tween® 20 surfactant. D = 0.0006 mol·dm−3; E = 0.0003 mol·dm−3; numbers represent number of layers. Samples were annealed at 500 °C/15 min.
Figure 3.
SEM Images of samples prepared by sol-gel with decreasing concentration of Tween® 20 surfactant. D = 0.0006 mol·dm−3; E = 0.0003 mol·dm−3; numbers represent number of layers. Samples were annealed at 500 °C/15 min.
3.1. Surfactant Influence on the Morphology of Thin Films
The addition of Tween
® surfactants was found to exhibit a range of effects on the morphology of the thin films produced, depending on the concentration and type of surfactant used. Surfactant addition was found to decrease average particle size, from 130 nm for two layer samples produced without surfactant, to as low as 25 nm for two layer samples produced with Tween
® 20 surfactant at the higher concentration of 6 × 10
−4 mol·dm
−3. The smaller particle sizes as listed in
Table 2 are attributable to the role of the surfactant during the sol-gel growth phase, whereby the surfactant orients itself around growing titania particles restricting their growth to produce smaller particles. In addition, the samples produced with the addition of surfactant show greater particle definition and less agglomeration compared to the samples produced without surfactant (
Figure 1,
Figure 2 and
Figure 3) whereby the particles are also more angular due to the surfactant restricting their growth in a random way. This reduced particle size and enhanced particle definition increases the resulting surface area to volume ratio within the TiO
2 thin film sample. This leads to improved functional properties, such as improved photocatalytic activity, which has been shown for Brij
® type surfactants in a previous study [
13]. For example, samples produced without surfactant showed a photocatalytic half-life for the degradation of resazurin ink ranging from 9.5 to 16.5 min for the three-layer and two-layer sample respectively. Those samples produced with Tween
® surfactant exhibited half-lives ranging from 3 to 5 min for two layer samples. This decrease in half-life is attributable to the reduced average particle size, as well as the increased surface roughness of surfactant enhanced thin films as shown in
Table 2, which both result in an overall increased surface area to volume ratio. This enables better adsorption of the resazurin dye to the thin film surface, and a greater surface area upon which the photocatalytic reaction can occur.
3.2. Influence of Surfactant Addition on Average Surface Roughness of Thin Films
Surfactant addition has been found to increase the root mean square surface roughness of thin films by up to 180 nm, as sample A2 (produced without surfactant) has an average root mean square surface roughness of 11 nm, compared with sample B2 (produced with 0.006 mol·dm−3 of Tween® 40) which has an average surface roughness of 196 nm. This large increase in surface roughness is a result of the morphological changes within the thin film that have been described, whereby the particles produced with surfactant are smaller and also more angular in shape due to the surfactant obstruction during the sol-gel growth phase.
In addition, when the concentration of the surfactant is decreased from 6 × 10
−4 mol·dm
−3 to 4 × 10
−4 mol·dm
−3, as in samples D to E, the root mean square surface roughness decreases, whereby sample D2 exhibits the highest surface roughness of 350 nm, and E2 has a surface roughness of 191 nm. Further root mean square surface roughness values are given in
Table 2. This increased surface roughness in the samples with increased concentration of surfactant can be explained by the effect of the surfactant as it surrounds the titania particles during the growth phase. When the surfactant concentration is reduced, as from sample D2 to E2, the growing particles are less restricted in their growth, meaning they can grow larger and more spherical, as can be seen in the SEM images D2 to C2 in
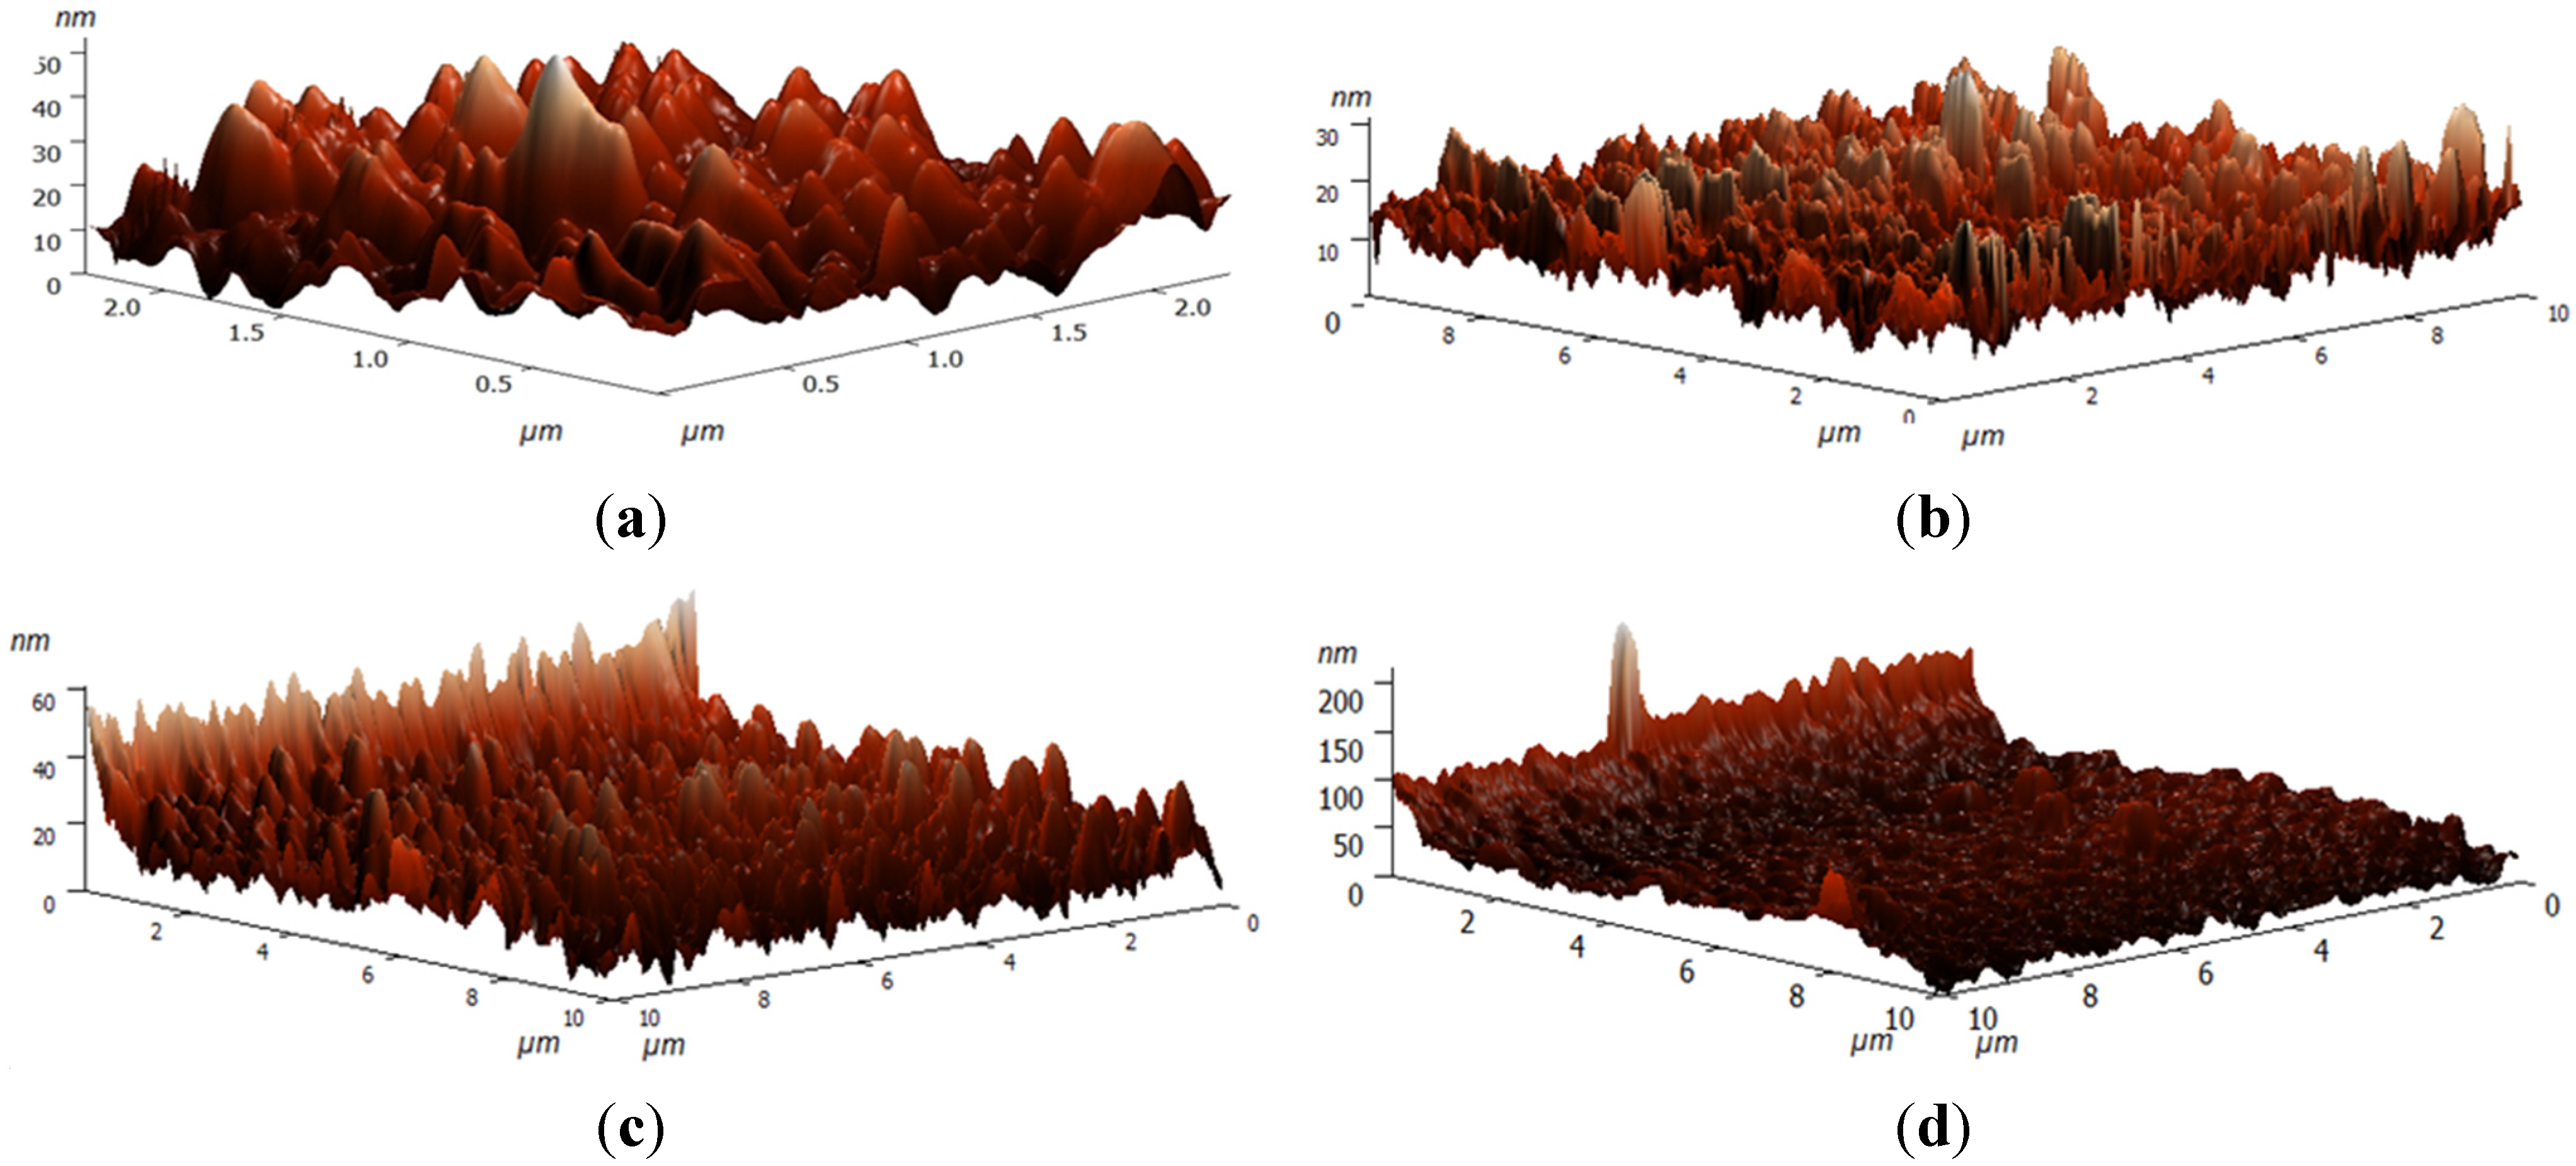
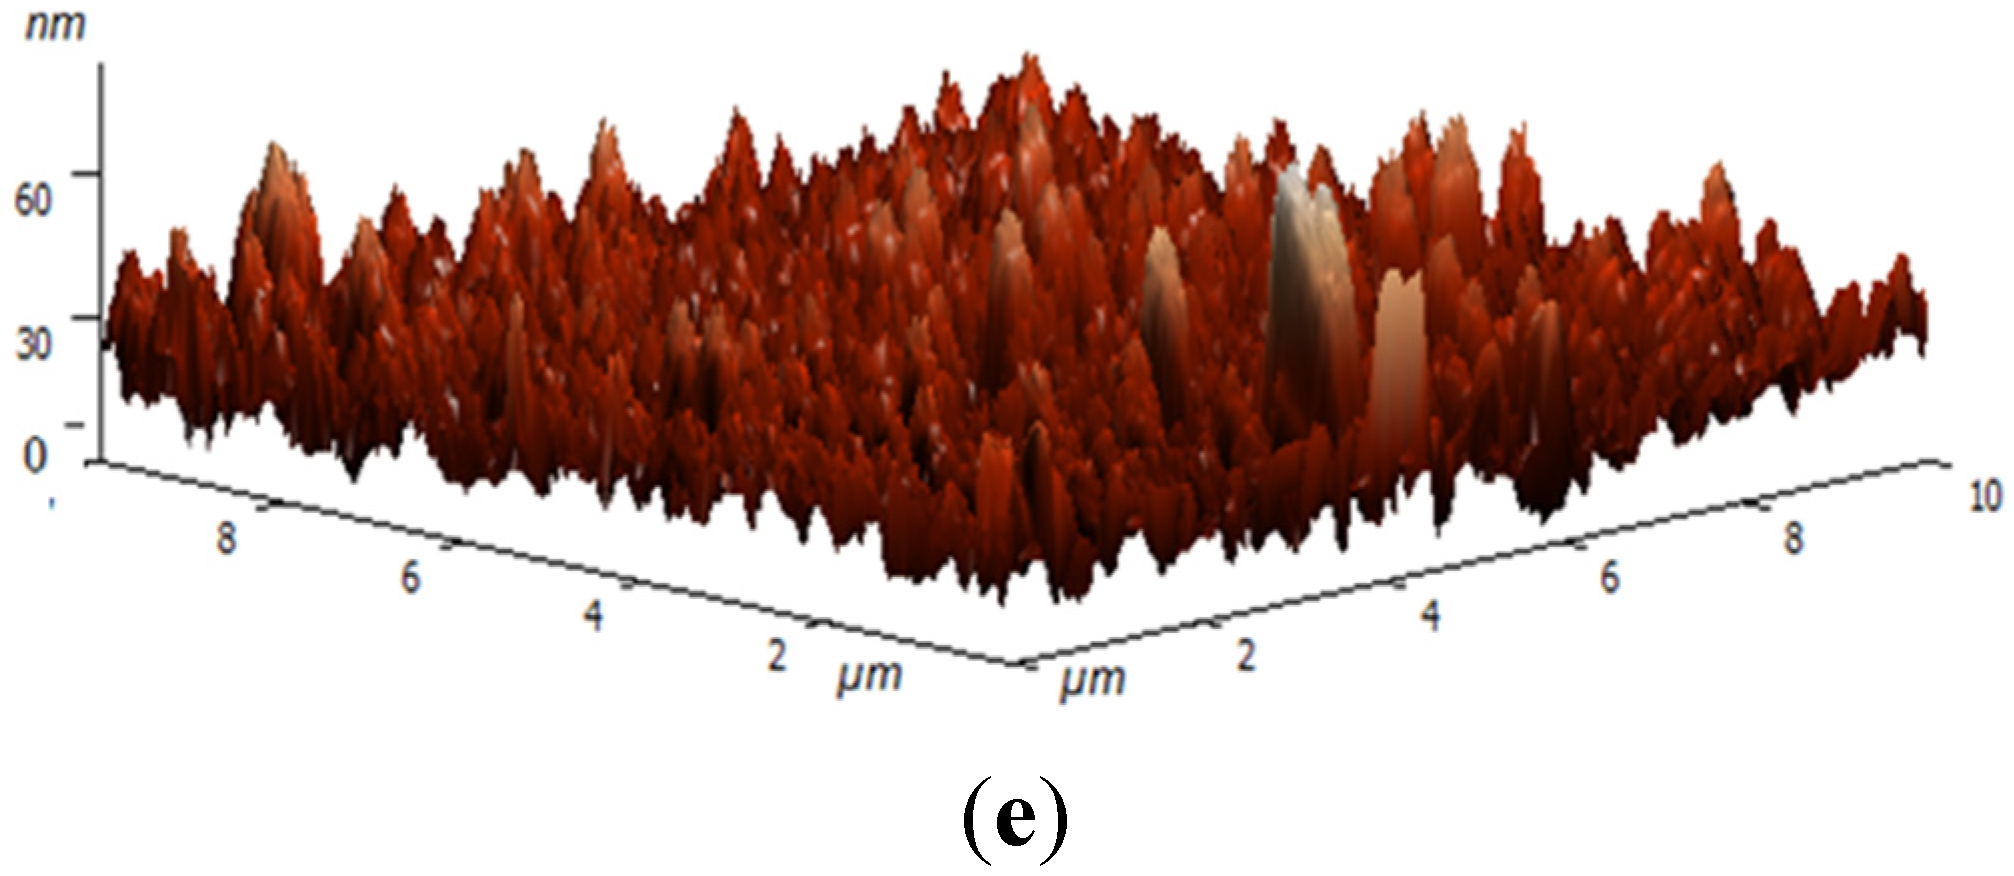
Figure 3. This is reflected in the particle sizes, whereby sample D2 has an average particle size of 25 nm and E2 has an average particle size of 35 nm. However, it should be noted the role of agglomeration between particles present in sample D2, which also has had an effect to increase the surface roughness of the thin film. Those samples produced without surfactant have a reduced root mean square surface roughness in the range of 9–17 nm. There is no significant change in surface roughness depending on which surfactant type is used, however generally it is found that an increased concentration of surfactant increases the surface roughness. A 3D representation of the thin film surface roughness of samples produced with different surfactant types and concentrations are shown in
Figure 4.
Figure 4.
AFM 3D representation of thin film surface. (a) A2 (no surfactant); (b) B2 (Tween® 40, 0.006 mol·dm−3); (c) C2 (Tween® 40, 0.003 mol·dm−3); (d) D2 (Tween® 20, 0.006 mol·dm−3); (e) E2 (Tween® 20, 0.003 mol·dm−3).
Figure 4.
AFM 3D representation of thin film surface. (a) A2 (no surfactant); (b) B2 (Tween® 40, 0.006 mol·dm−3); (c) C2 (Tween® 40, 0.003 mol·dm−3); (d) D2 (Tween® 20, 0.006 mol·dm−3); (e) E2 (Tween® 20, 0.003 mol·dm−3).
3.3. Influence of Number of Layers on Thin Film Morphology
As previously discussed, by increasing the number of consecutive dips and thereby the number of layers within the TiO
2 thin film samples, the average thickness was increased as expected. It has been found that by increasing the number of layers within TiO
2 sol-gel, the crystallite size decreases, as the individual single layer thickness increases, owing to the mechanism of growth as additional layers adhere to previous layers [
22]. The addition of surfactant produces individual thicker layers, due to the increased viscosity of the sol as the surfactant coordinates around titania particles. As a result, the samples produced with surfactant are on average much thicker, with the increased concentrations of surfactant producing thicker. The addition of surfactant also made individual layers thicker, due to the increased viscosity within the thin film aiding the “sticking” of subsequent layers to the initial layers, which in turn resulted in thicker films overall. Thickness measurements were made using side-on SEM images, and are listed in
Table 2. For example, sample A1 produced without surfactant and one layer, has a thickness of 42 nm, and can be compared to the one layer samples produced with addition of surfactant; B1, C1, D1 and E1 which have average thin film thicknesses of 180, 200, 110 and 120 nm respectively. In addition, as the thin film thicknesses increases with the number of layers, the particle size is also found to increase, whereby the smaller crystallites formed in the increasingly thicker layers bind together to form agglomerated particles, as specifically observed in samples C3 and D3, whereby the average particle size is 46 and 40 nm respectively. Agglomeration is also found to occur between the TiO
2 layers, whereby the initial layers can act as particle nucleation sites, for example sample B3 shows increased agglomeration owing to the higher concentration of Tween
® 40 surfactant used, as seen in
Figure 2.
The effect of number of layers on the root mean square surface roughness of the thin films does not have a consistent trend between samples, as seen in
Table 2. Typically increasing the number of layers would be expected to increase the surface roughness of samples due to irregular adhesion between layers where different sized particles are placed on top of one another. However, most samples show a decrease in surface roughness from one layer to three layers, e.g. Sample B1 (318 nm), sample B2 (196 nm), and sample B3 (209 nm). This is likely to be the result of particles agglomerating between layers as they adhere to one another, leading to a smoother top surface overall.
3.4. Crystalline Phase Identification of TiO2 Thin Films
A typical XRD diffraction pattern of the TiO
2 thin films deposited on F:SnO
2 coated glass substrate is shown in
Figure 5. The thin films deposited were thinner than the F:SnO
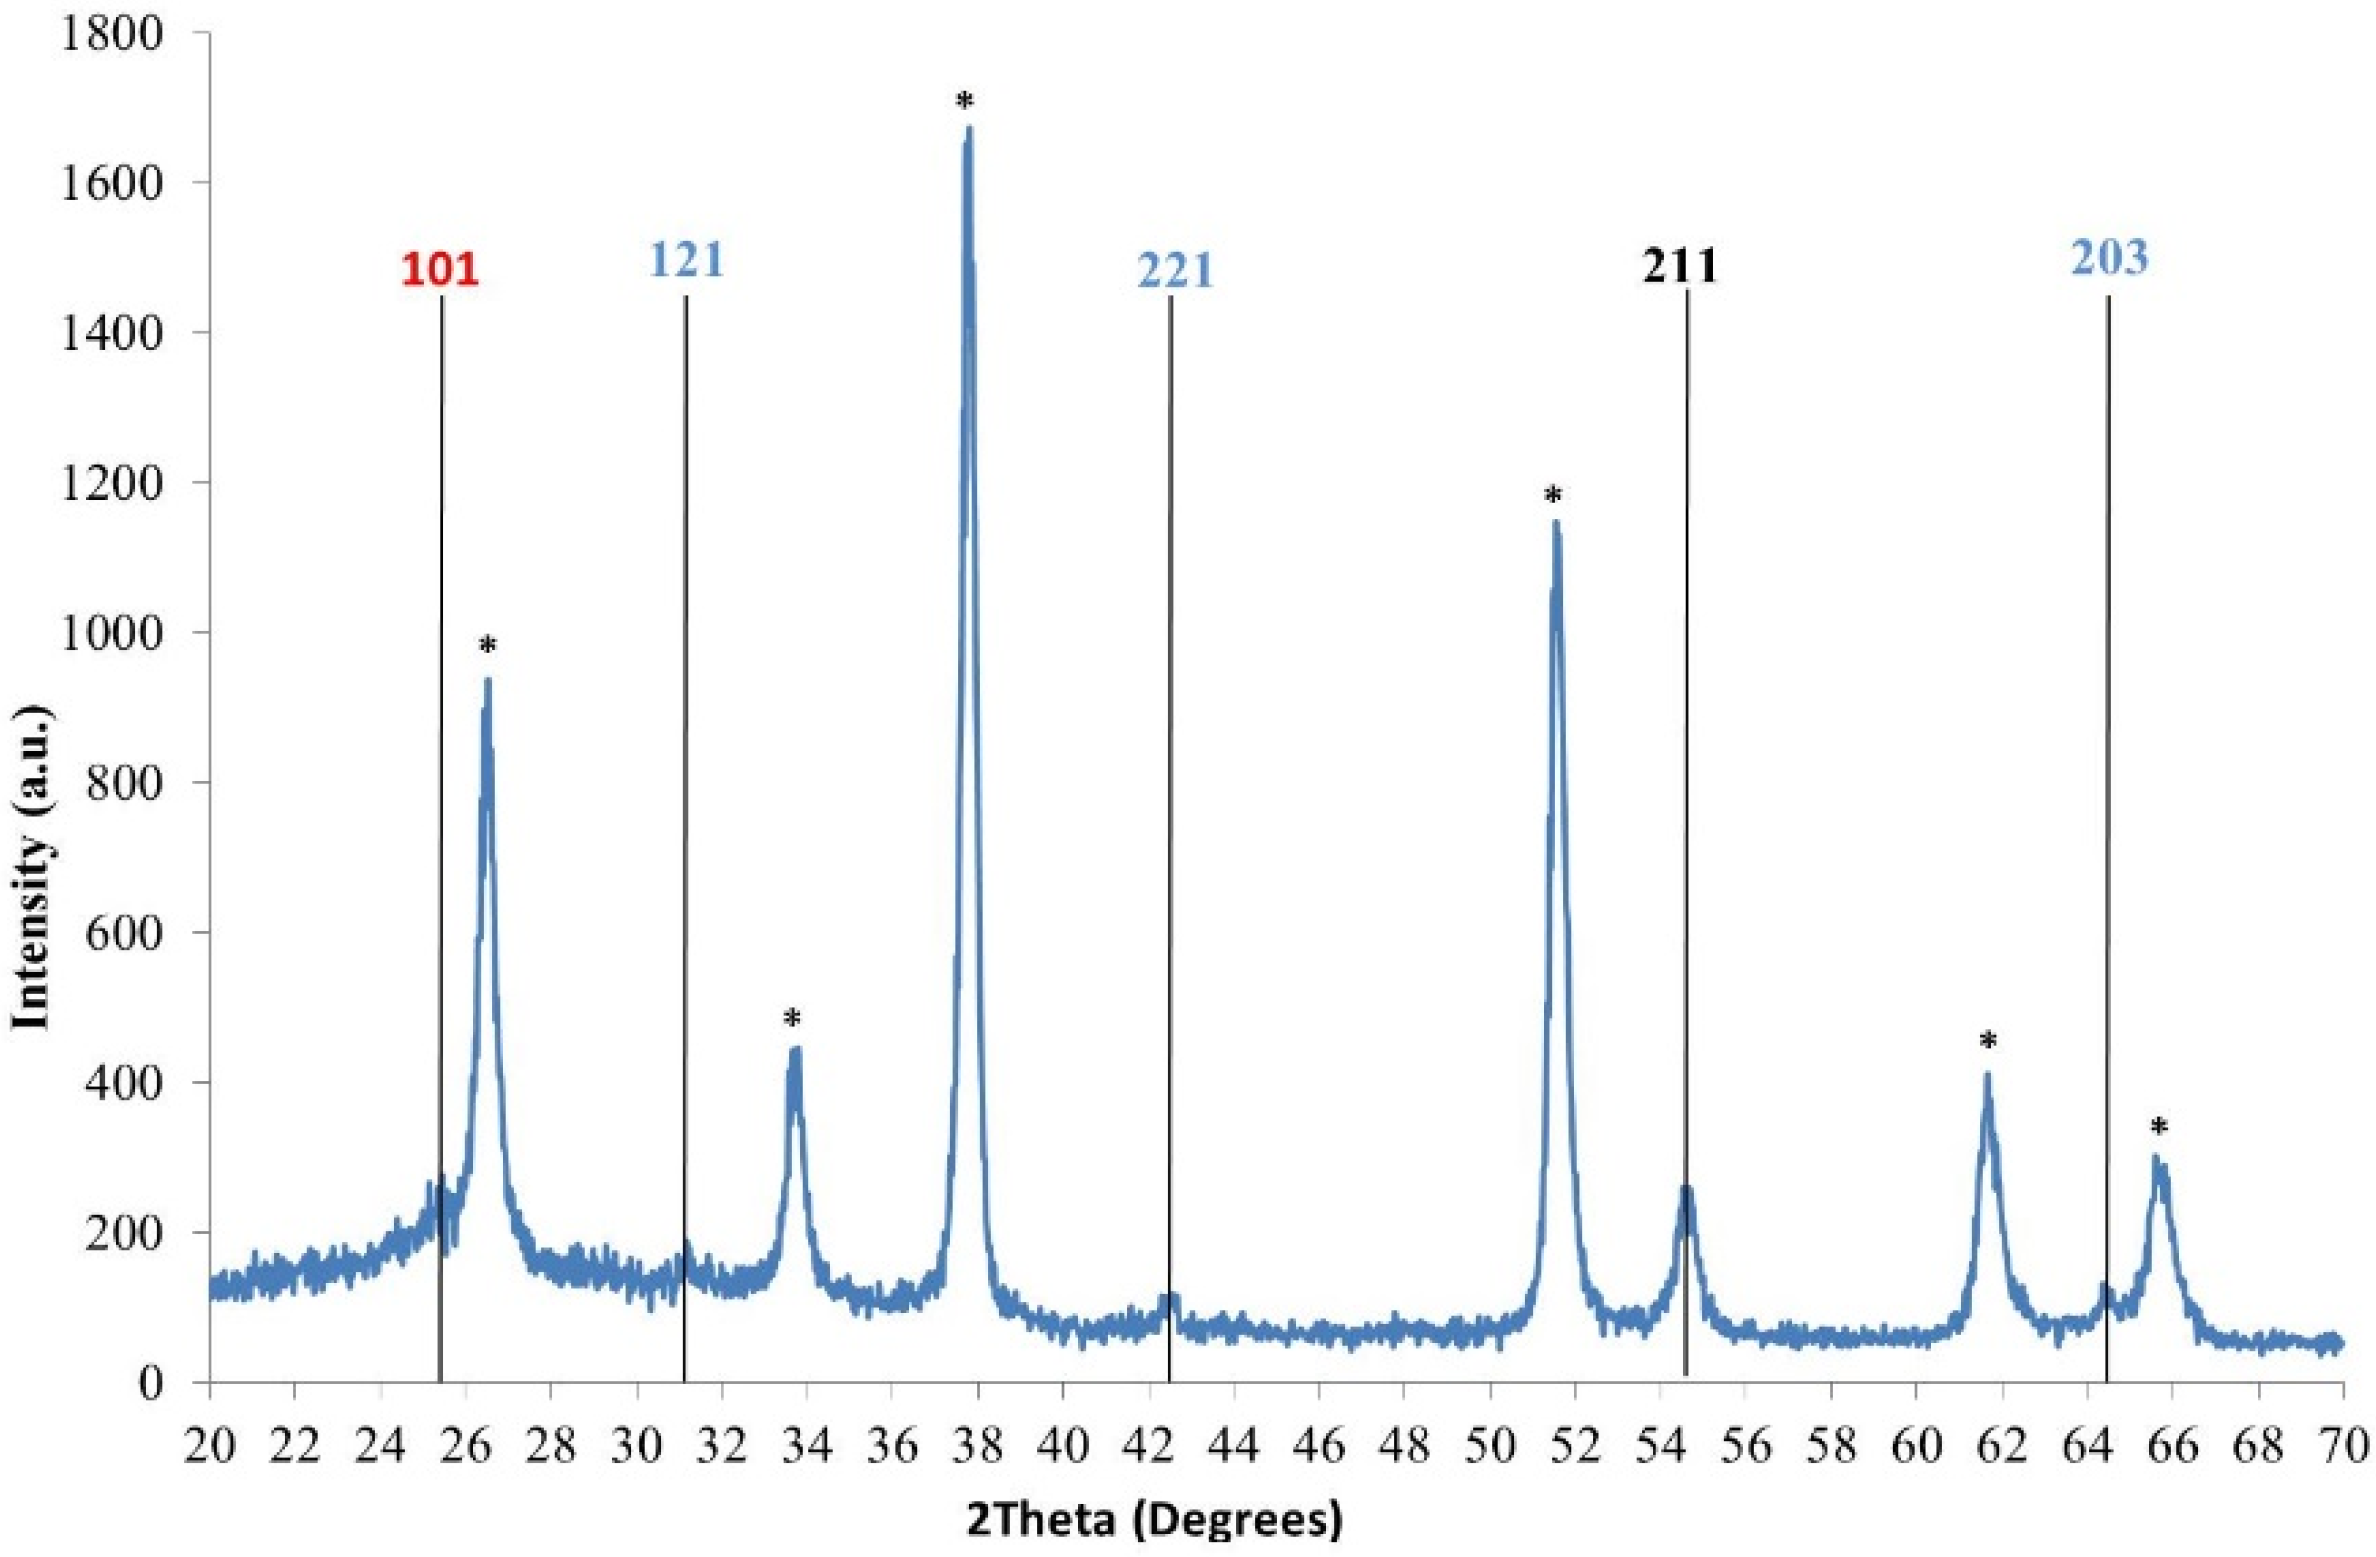
2 layer (~400 nm) so breakthrough to the substrate was observed for all samples. The samples showed peaks representing a mixture of anatase, the preferred crystal phase in the [101] plane, as well as rutile, which is the more thermodynamically stable phase and was present in the [211] plane. The presence of the brookite phase was also observed in the [121], [221] and [203] planes. This mixture of phases is commonly observed in the production of TiO
2 derived thin films [
2,
8], and it is believed that the sol-gel method described herein has resulted in the production of largely amorphous TiO
2 thin films which cannot be detected by XRD. For further determination of the TiO
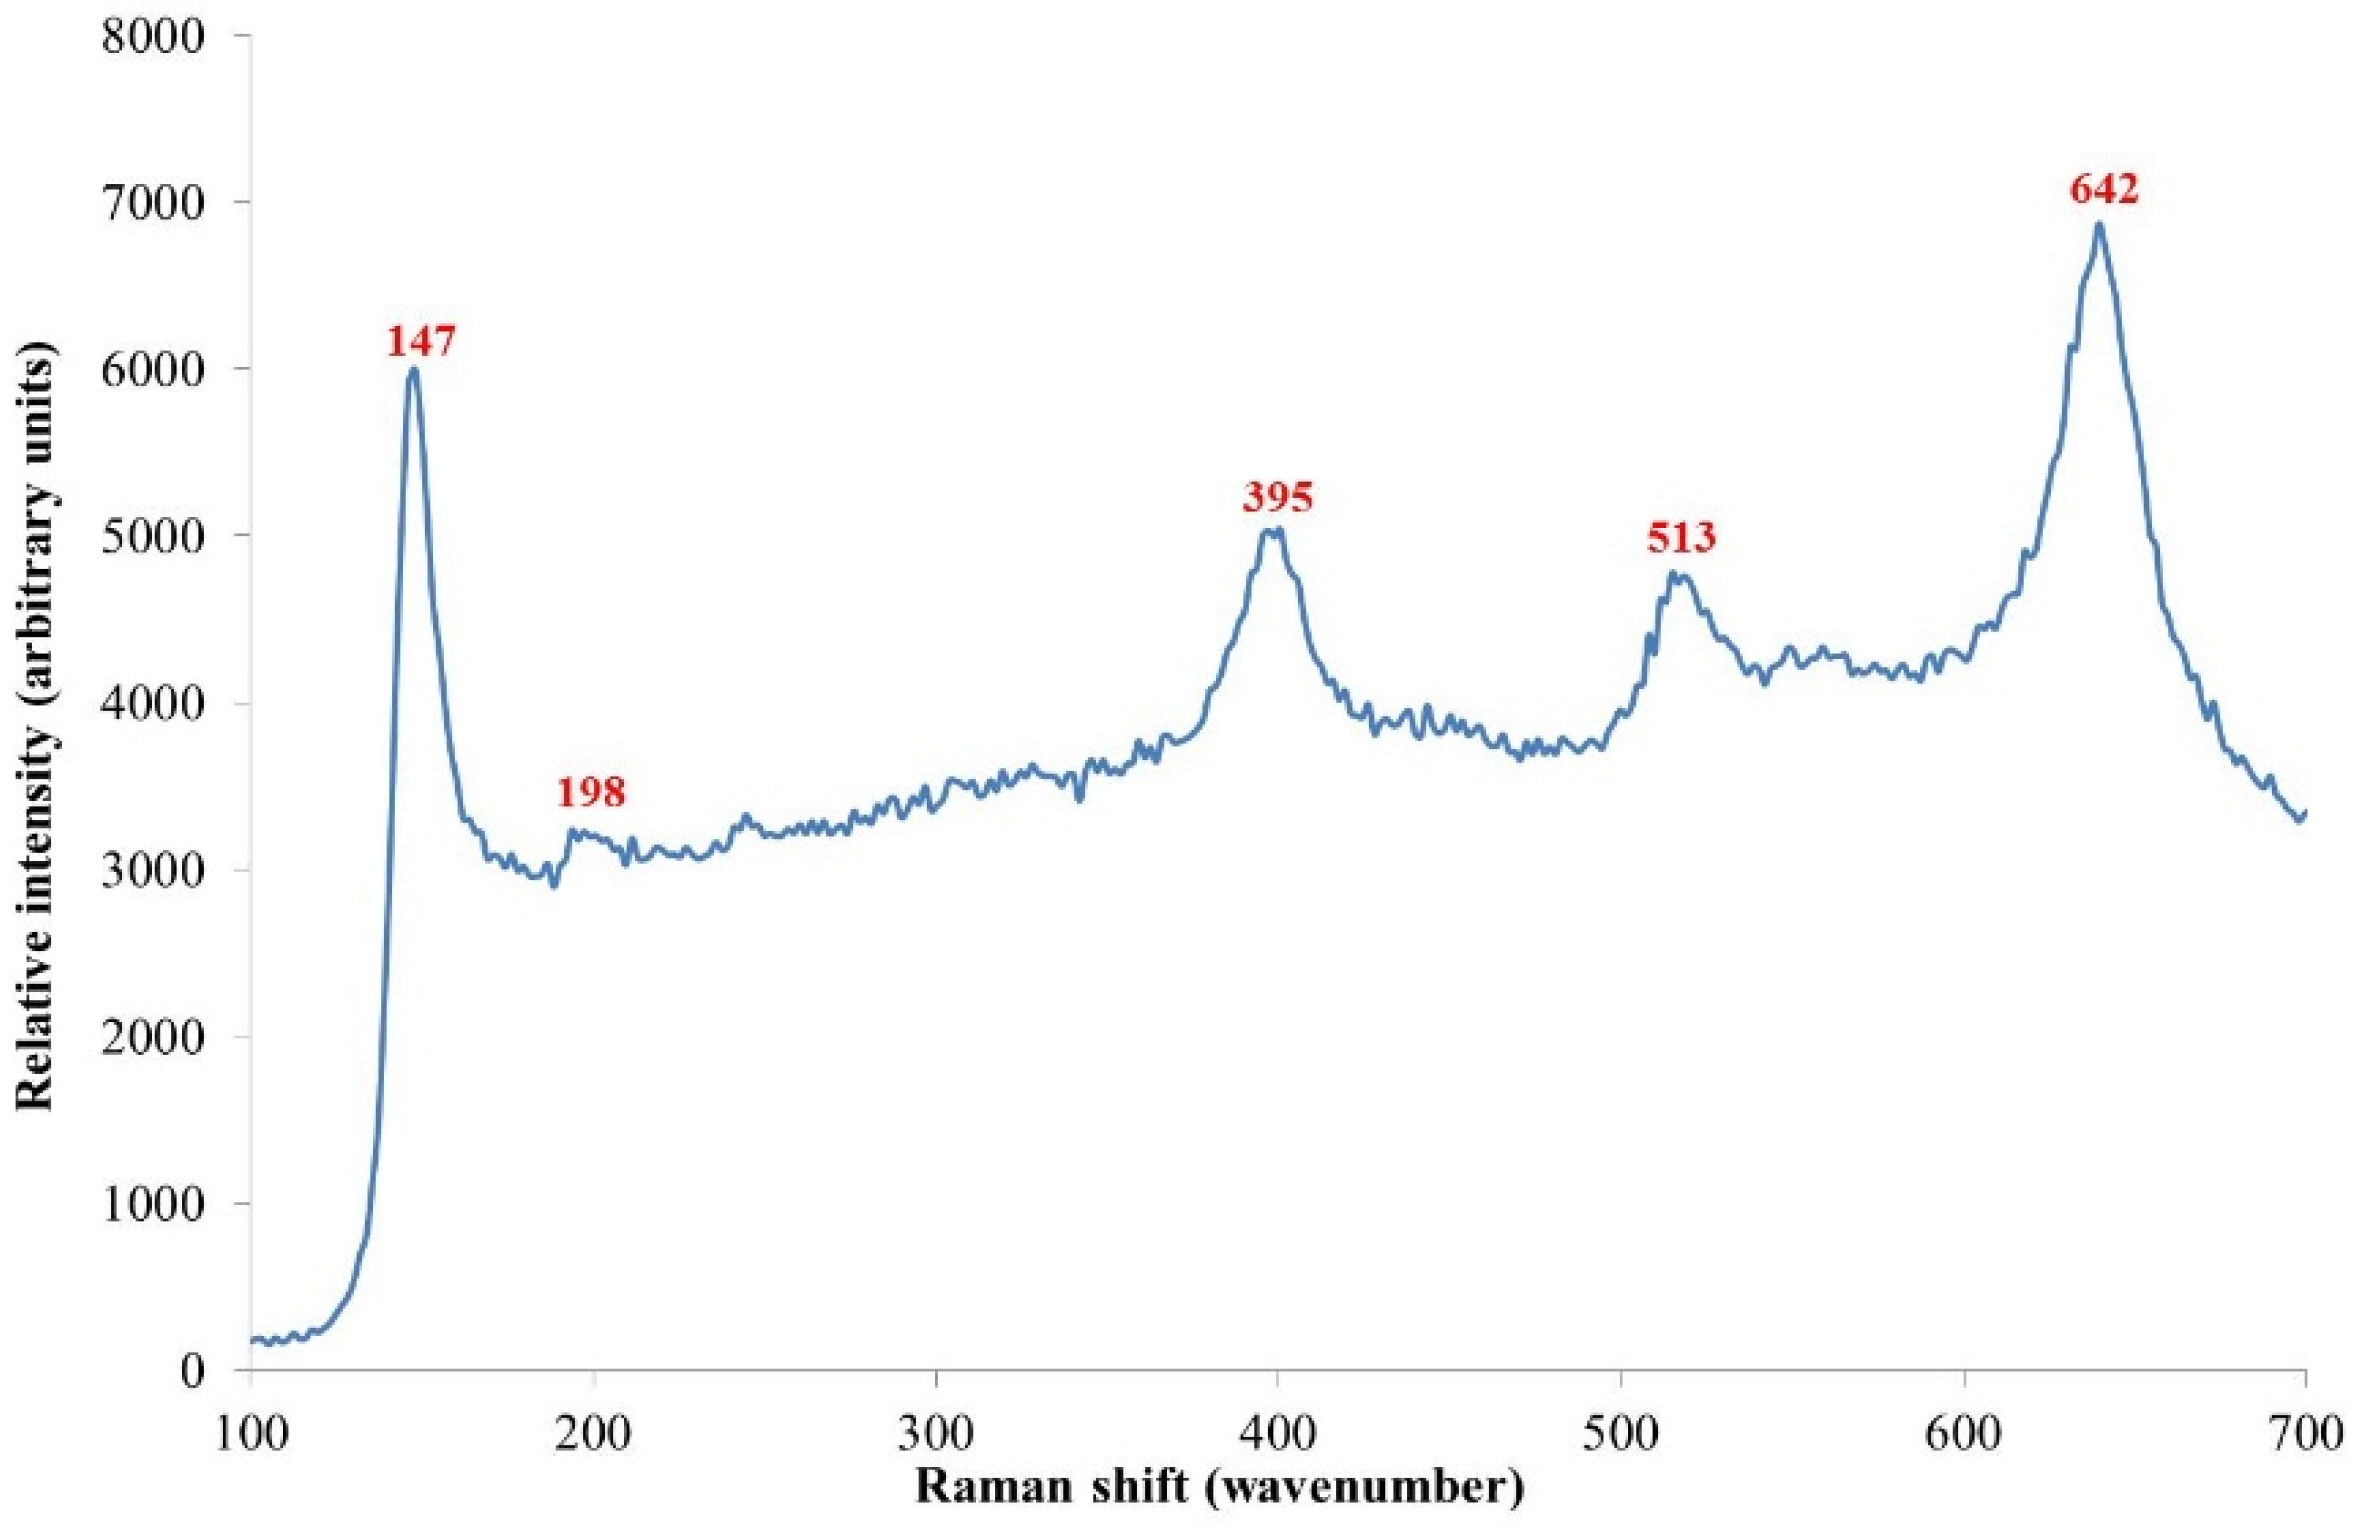
2 phase, Raman spectroscopy was used, whereby a typical spectrum is shown in
Figure 6. All samples gave strong Raman bands centred at 147, 395, 513 and 642 cm
−1, with a weaker band centred at 198 cm
−1, all of which are attributable to anatase titanium dioxide indicating that whilst there is poor long range order, anatase predominates over a short range [
23].
Figure 5.
XRD pattern for sample B (3 layers) produced with 6 × 10⁻⁴ mol·dm−3 Tween® 40 surfactant and annealed at 500 °C/ 15min. Red assigned peak denotes presence of anatase in the [101] plane. Blue peaks denote presence of brookite, and black peak denotes presence of rutile. Peaks denoted with an asterisk are from the casserite substrate. This diffraction pattern was the same for samples A, C, D and E.
Figure 6.
Typical Raman spectrum obtained for all samples. This spectra was for sample B3 annealed at 500 °C for 15 min. Peaks match the reference spectra for TiO
2 anatase [
23].
Figure 6.
Typical Raman spectrum obtained for all samples. This spectra was for sample B3 annealed at 500 °C for 15 min. Peaks match the reference spectra for TiO
2 anatase [
23].
3.5. Wetting Behaviour of Thin Films
All TiO
2 thin film samples produced exhibited UV induced hydrophilicity in varying degrees, as seen by the reduction in contact angle of deionised water on the TiO
2 surface after 30 min UV irradiation shown in
Table 2. Some samples that were produced with surfactant exhibited superhydrophilicity whereby the contact angle dropped to below 5° after UV irradiation, such as sample D2 and E2, which both had contact angles after 30 min UV irradiation which were around 3°. As these samples were produced with the lighter weight surfactant, Tween
® 20, the effects on particle growth were that slightly larger and more spherical particles were grown in comparison to samples B and C, as the surfactant was not as bulky when surrounding titania particles during growth, therefore were not as obstructing. This can be seen in the SEM images and is also reflected in the particle sizes as shown in
Table 2.
3.6. Photocatalytic Properties of Films
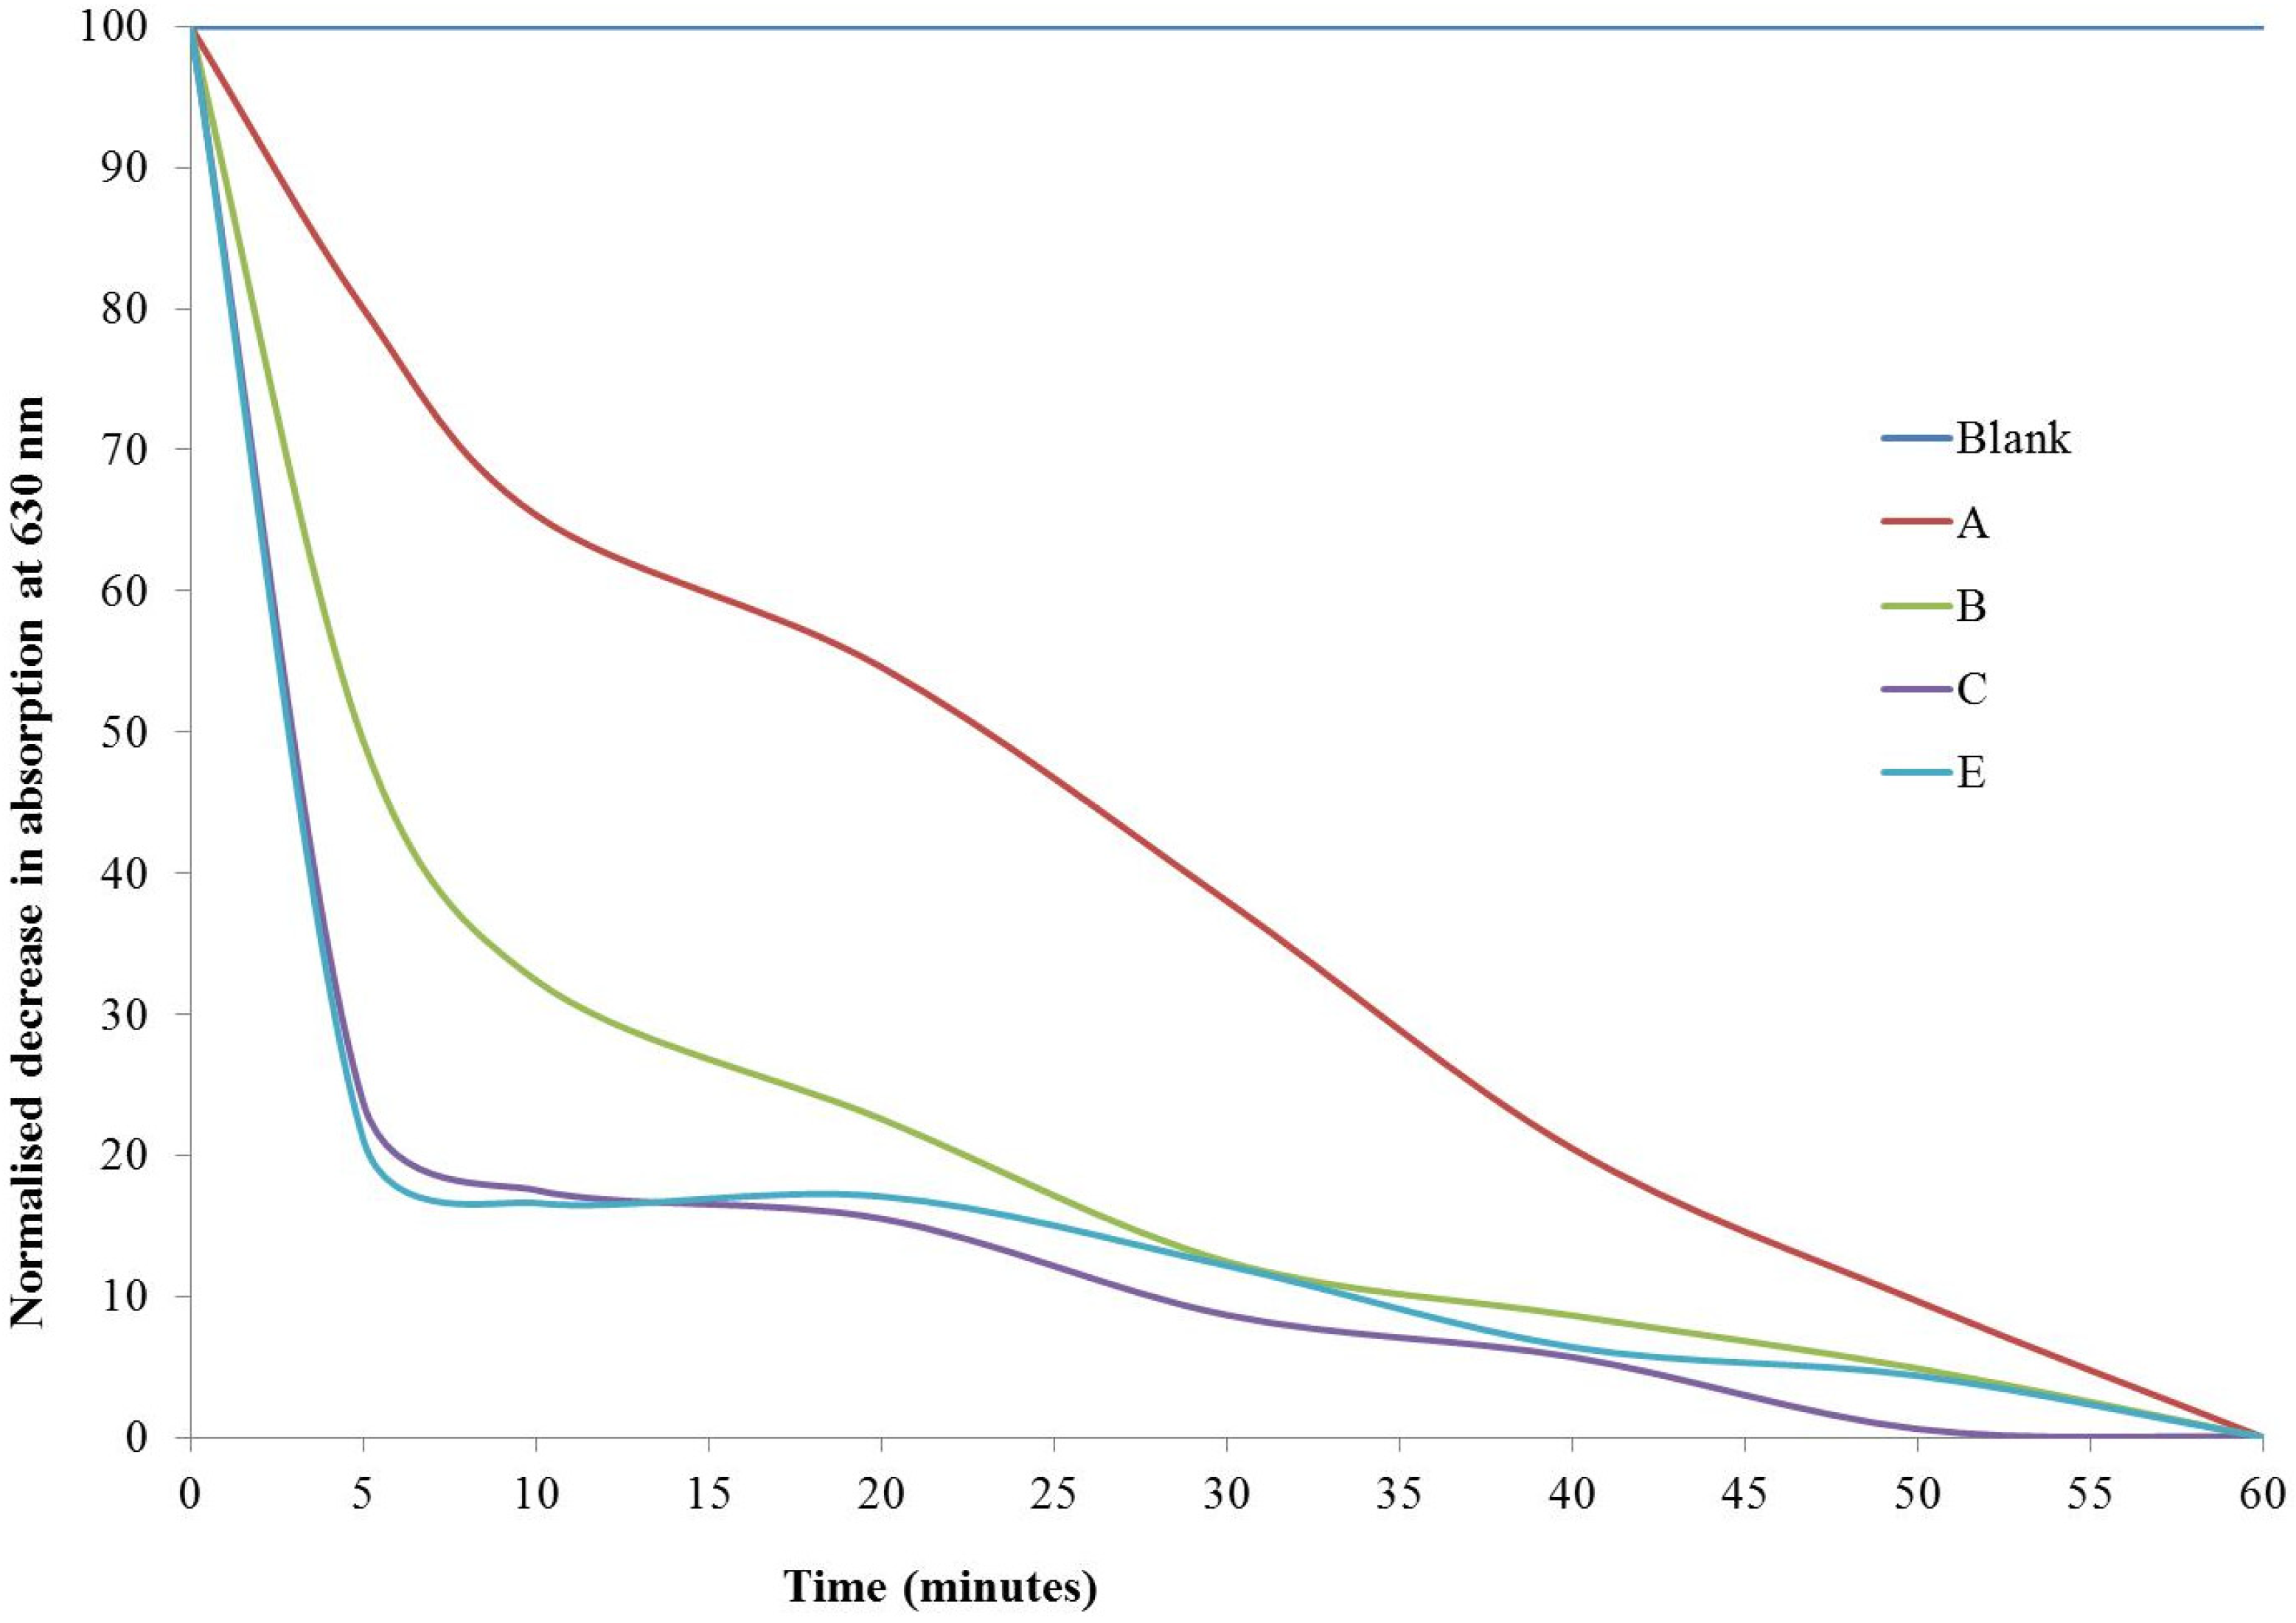
The sol-gel derived thin films all demonstrated photocatalytic activity for the degradation of resazurin intelligent ink. The addition of surfactant was found to increase the photocatalytic activity of the thin films as shown in
Table 2 and
Figure 7. The samples prepared without surfactant, samples A1–A3 exhibited half-lives in the range of 9.5–16.50 min. In contrast, the samples produced with surfactant had half-lives ranging from 3 to 5 min. The fastest half-lives observed were for samples C2 and E2, which both had a half-life of 3 min for resazurin degradation. This indicates that the addition of Tween
® 40 or Tween
® 20 surfactant in the lowest concentration (0.003 mol·dm
−3) has a beneficial effect on the thin film microstructure and morphology, such that the functional properties are improved for photocatalytic activity. The photocatalytic activity is attributed to the surfactant role as the particles grow within the sol-gel. The surfactant acts as a spacer between growing titania particles that enables great control over their size and shape, preventing agglomeration. The particles produced as a result are angular and smaller in size (average size for C2 29 nm, compared to 130 nm for A2). This modified morphology results in an increased surface area to volume ratio upon which the organic dye can be adsorbed and photocatalytically degraded.
It has been widely acknowledged that photocatalytic activity can be influenced and enhanced by a number of factors, and within this study it has been found that a combination of factors, particularly morphology and surface roughness have caused significant changes to the photocatalytic properties of the thin films produced. For example, all samples produced with surfactant exhibit a much higher average surface roughness, which can be seen morphologically in the SEM images (
Figure 2 and
Figure 3) where particles are more angular and a variety of sizes, and also in the 3D AFM images in
Figure 4. Samples prepared without surfactant showed a surface roughness ranging from 9 to17 nm, attributable to the poor definition of the larger, more spherical particles ranging in size 40–130 nm. In contrast, samples prepared with Tween
® surfactants showed average surface roughness values ranging from 135 to 366 nm, with much more angular and variable sized particles ranging from 25 to 55 nm as their average size. The increased surface roughness enables an increased surface area to volume ratio, and as described enables greater absorption of the dye on the surface, and an increased area for the photocatalytic reaction to take place.
Figure 7.
Normalised decrease in absorption of resazurin peak at 630 nm with UV irradiation (365 nm) over time for samples: Blank; A = no surfactant; B = Tween® 40, 0.006 mol·dm−3; C = Tween® 40, 0.003 mol·dm−3; E = Tween® 20, 0.003 mol·dm−3. Sample D has been removed for graph clarity.
Figure 7.
Normalised decrease in absorption of resazurin peak at 630 nm with UV irradiation (365 nm) over time for samples: Blank; A = no surfactant; B = Tween® 40, 0.006 mol·dm−3; C = Tween® 40, 0.003 mol·dm−3; E = Tween® 20, 0.003 mol·dm−3. Sample D has been removed for graph clarity.

