Article

Optimization of Cutting Parameters Based on the Response Surface Method to Minimize Cutting Forces During Bamboo Milling


1
Chinese Academy of Forestry, Beijing 100091, China
2
School of Materials and Energy, Central South University of Forestry & Technology, Changsha 410004, China
3
College of Furnishings and Industrial Design, Nanjing Forestry University, Nanjing 210037, China
4
Harbin Research Institute of Forestry Machinery, State Forestry and Grassland Administration, Harbin 150086, China
5
Research Institute of Wood Industry, Chinese Academy of Forestry, Beijing 100091, China
*
Authors to whom correspondence should be addressed.
Coatings 2026, 16(8), 977; https://doi.org/10.3390/coatings16080977
Submission received: 21 July 2026 / Revised: 2 August 2026 / Accepted: 4 August 2026 / Published: 17 August 2026

Abstract

In the manufacturing industry, cutting force is the primary factor affecting bamboo milling. Excessive cutting force can increase tool wear and affect processing quality, processing energy consumption, and processing stability. Cutting parameters have significant impacts on cutting forces. The cutting force is also one of the important indexes for evaluating machining performance. This article uses response surface methodology to study the influence of different cutting parameters on the cutting force during the bamboo milling process. Moreover, the importance of cutting parameters to cutting forces was determined by variance analysis, corresponding mathematical models were established, and the interaction between cutting parameters and cutting forces was analyzed to optimize the bamboo milling process. On this basis, the cutting parameter combination corresponding to the optimal milling process under experimental conditions was determined and experimentally verified. The prediction accuracy was high and the test optimization was good. Therefore, the proposed method can be used to predict and optimize the actual cutting force, providing a scientific basis for high-quality processing of bamboo milling.

1. Introduction

Bamboo is a good biomass material, and it has unique biological, mechanical, and ecological characteristics, is environmentally friendly, has a short production cycle, and manifests significant economical, ecological, and social benefits. Bamboo products are widely used in construction, food, paper, furniture, gardening, energy, and other industries due to their excellent performance [1,2,3]. Bamboo is considered to be the most promising potential plant to replace wood resources in the future. Bamboo milling refers to the surface treatment of bamboo materials. However, compared to wood, bamboo contains more silicon dioxide, is more abrasive, and its fiber-reinforced structure leads to significant anisotropy. The cutting force fluctuates greatly, the fibers are easily pulled out, and this can further accelerate the wear of the cutting tool. Therefore, in bamboo processing, multi-crystalline diamond (PCD) tools with high hardness and excellent wear resistance are preferred for cutting operations. Among them, cutting force is the primary factor affecting bamboo milling. Excessive cutting force can increase tool wear and affect processing quality, processing energy consumption, and processing stability. Cutting parameters have significant impacts on cutting forces. The cutting force is also one of the important indexes for evaluating machining performance [4].
Camposeco-Negrete [5] studied the effects of different cutting parameters on energy consumption and power during the cutting of AISI 6061 T6 under rough cutting conditions using an actual experimental solution, and parameter optimization was used to obtain the parameter combination of minimum power consumption and optimal cutting quality specific to the actual production situation, thereby reducing energy consumption and protecting the environment. Chien et al. [6] conducted a Box–Behnken design experiment to investigate the effect of different cutting parameters on the machining of Inconel 718-coated hard alloy ball-end milling cutters. A mathematical model between cutting forces and cutting temperatures was established by multiple linear regression. Chuchala et al. [7] conducted a study on the variation in friction force between the back face of the cutting tool and the processed European larch with moisture content, and revealed the contribution of the friction between the cutting tool and the workpiece to the cutting force. Barański et al. [8] investigated the moisture content, dimensional stability, and cutting force in beech wood. They found that the cutting force of lignocellulosic materials is jointly determined by material properties, tool geometry, and process parameters. Xie [9] employed response surface methodology to investigate the impact of various cutting parameters on cutting force during the high-speed milling of 3Cr2NiMo quenched steel. The adopted milling force model had a high prediction accuracy and could be used for the prediction and analysis of cutting forces. Helu et al. [10] used a green processing strategy to study the effects of electrical energy, tool wear, and service costs on vehicle titanium surface quality. Subramanian et al. [11] studied the effects of different cutting parameters on the machining of Al 7075-T6 using response surface methodology, and established and optimized a second-order mathematical model using the Matlab genetic algorithm. Hafner et al. [12] studied the influence of different cutting parameters on the surface quality and cutting force of polyurethane foam using response surface methodology, optimized the cutting parameters, and carried out experimental verification, and the optimization prediction accuracy was high. Zhu et al. [13] investigated the impact of various tool shapes and cutting parameters of diamond cutting tools on cutting quality and cutting force during the processing of high-end vinyl ceramic tiles. Using an orthogonal experimental design, it was concluded that different helix angles, cutting speeds, and cutting depths have different effects on the surface. The influence law of roughness and cutting force was obtained, and the optimal combination of cutting parameters was determined to guide practical production.
However, due to the numerous limitations of the bamboo industry, researchers mainly study the cutting quality, cutting force, and cutting power of metals and woods through orthogonal experiments, response surface methods, and artificial neural networks, etc. [14,15]. Bamboo is a natural fiber composite material with significant anisotropy. During cutting, the hard fibers alternate with the soft matrix, which leads to severe fluctuations in cutting force and severe fiber extraction. Traditional metal cutting models are not applicable [16,17]. At present, there is no mature mathematical model for the cutting force of bamboo materials. To effectively capture the nonlinear characteristics of anisotropic natural fiber composite materials during the cutting process, such as size effect, parameter coupling, and material heterogeneity, the response surface method can be adopted. By using polynomial functions, the relevant functions can be approximated and simulated, and the process can be optimized [18,19,20].
In this study, response surface methodology was employed to systematically investigate the effects of various cutting parameters (spindle speed, feed rate, and cutting depth) on the cutting force during bamboo milling. Corresponding mathematical models were established, and the interaction between cutting parameters and cutting forces was analyzed to optimize the bamboo milling process. On this basis, the cutting parameter combination corresponding to the optimal milling process under experimental conditions was determined and experimentally verified. Based on previous studies, we have comprehensively optimized the surface roughness and cutting force. Under experimental conditions, we obtained the optimal combination of cutting parameters that achieved the best cutting performance, and conducted a verification experiment. It is necessary to clearly state that this study and our previous publication Ref. [21] originated from the same experimental activity. The processing experiments shared the same workpiece material, cutting tools, and experimental protocol. The previous research mainly focused on the modeling and optimization of surface roughness, while this paper focuses on the study of cutting force.

2. Materials and Methods

2.1. Materials, Tools, and Testing Equipment

Due to factors such as the uneven distribution of natural bamboo, the presence of taper, and limited wall thickness, it is impossible to obtain test materials with consistent size and uniform distribution in the study of the cutting performance of a bamboo surface. However, the arrangement of the bundle tubes on the cutting surface of side-laminated hot-pressed bamboo plywood is the same as on the bamboo surface, so side-laminated hot-pressed bamboo plywood can be used instead of bamboo for the experiment. At the same time, the feed direction is parallel to the bamboo radial direction and the cutting depth is strictly controlled to ensure that it will not cut through the glue layer.
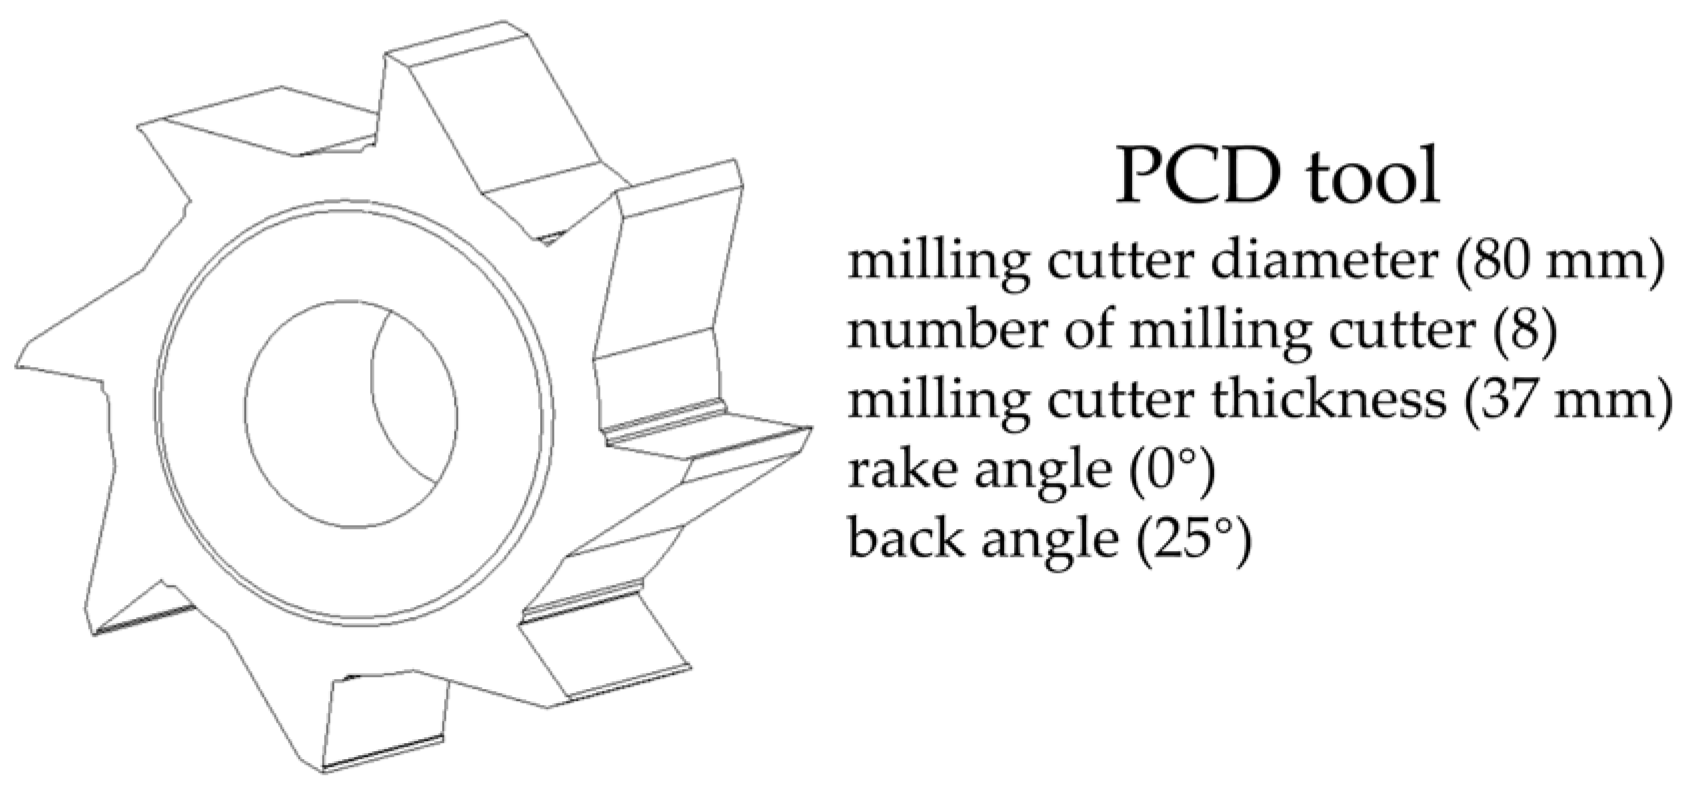
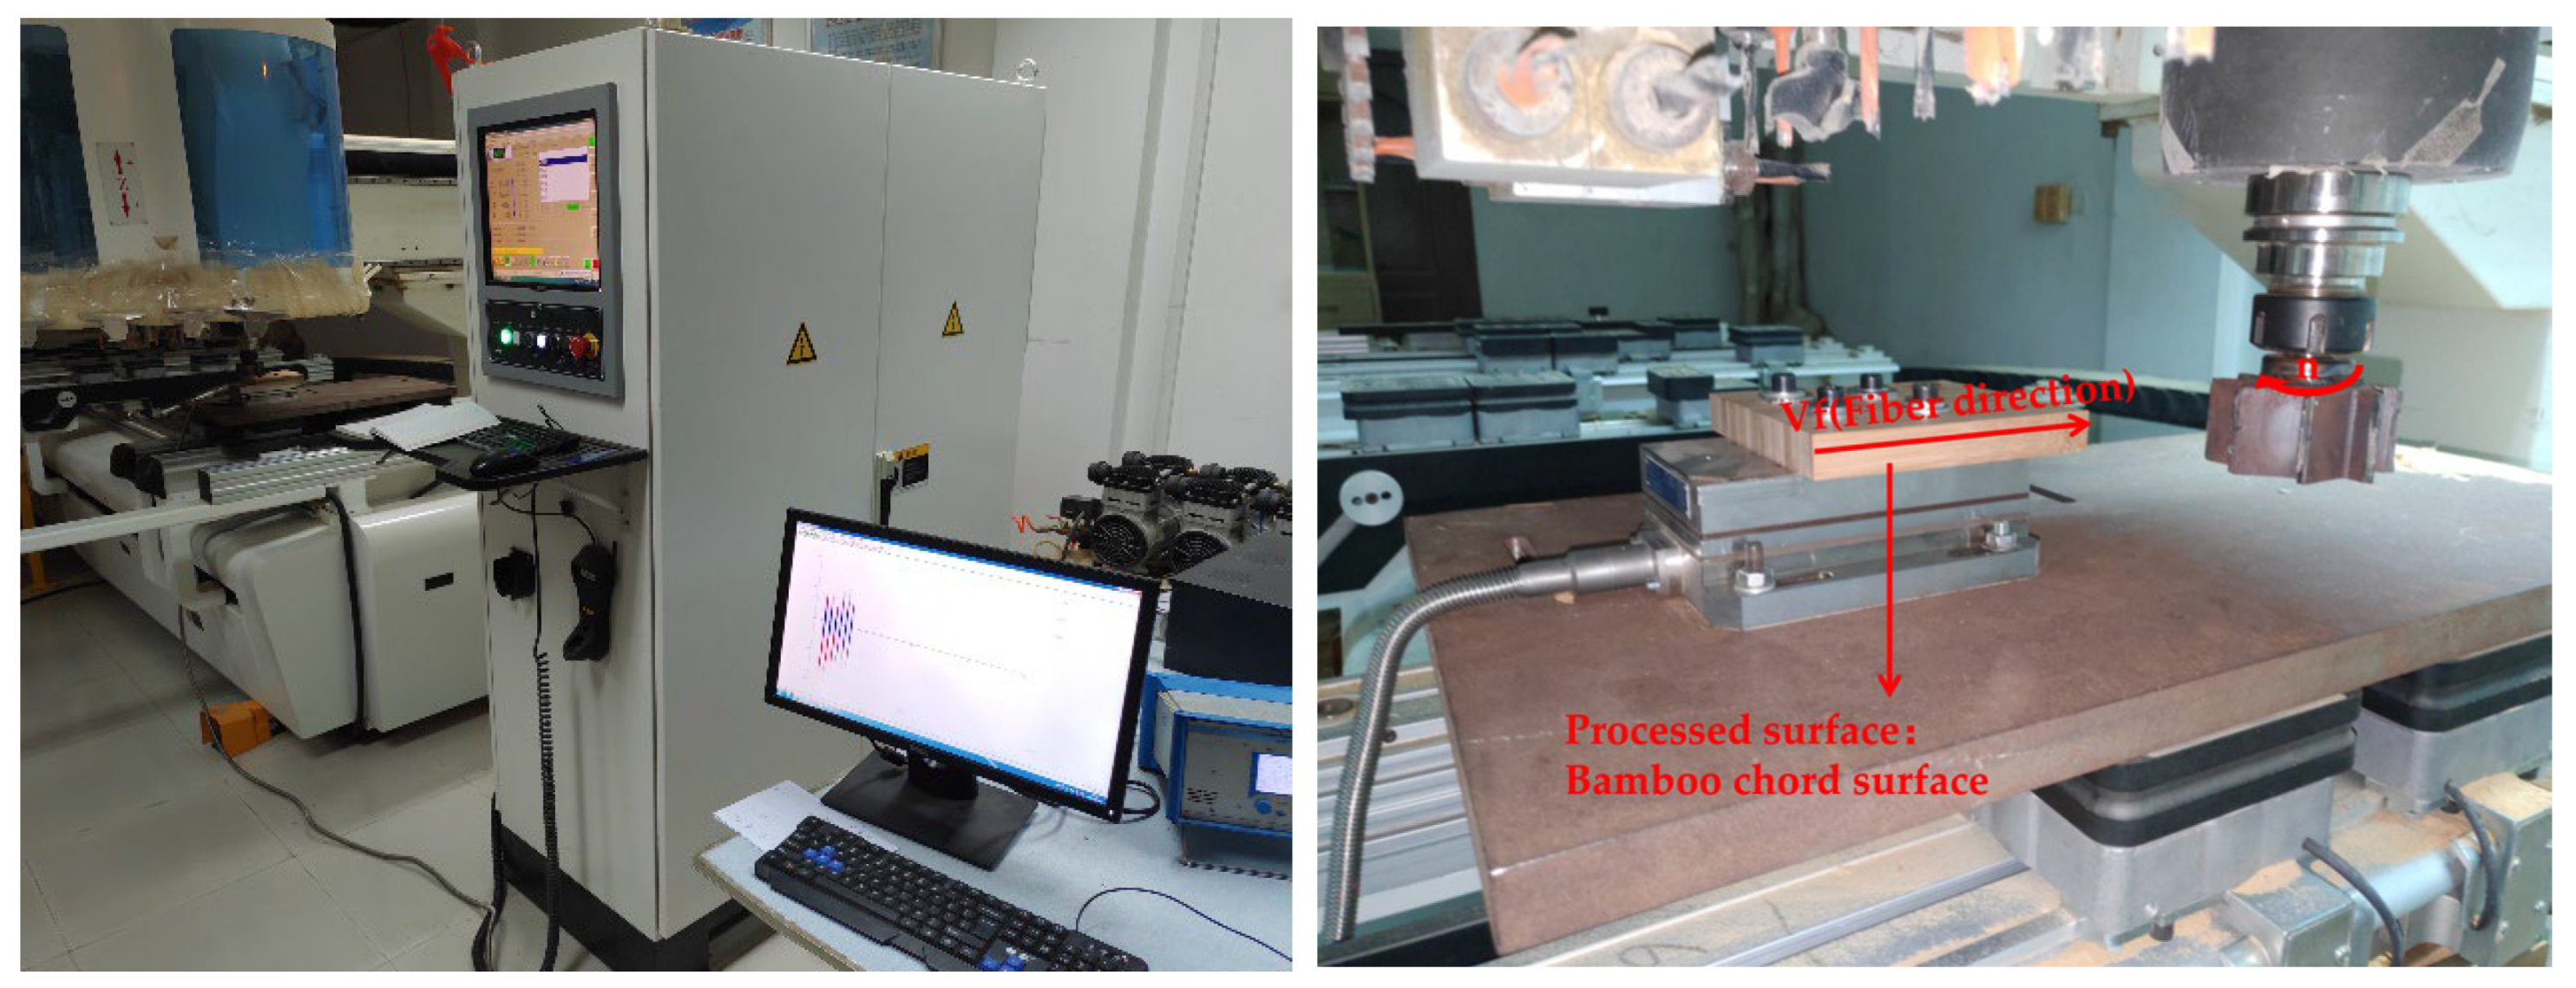
The experimental setup, workpiece materials, and cutting tools employed in this study are identical to those described in detail in Ref. [21]. Therefore, only a brief summary is given here; readers are referred to Ref. [21] for complete specifications. The test materials are shown in Figure 1, the PCD cutting tools used for the machining are shown in Figure 2, and the layout view of the test cutting area is presented in Figure 3.
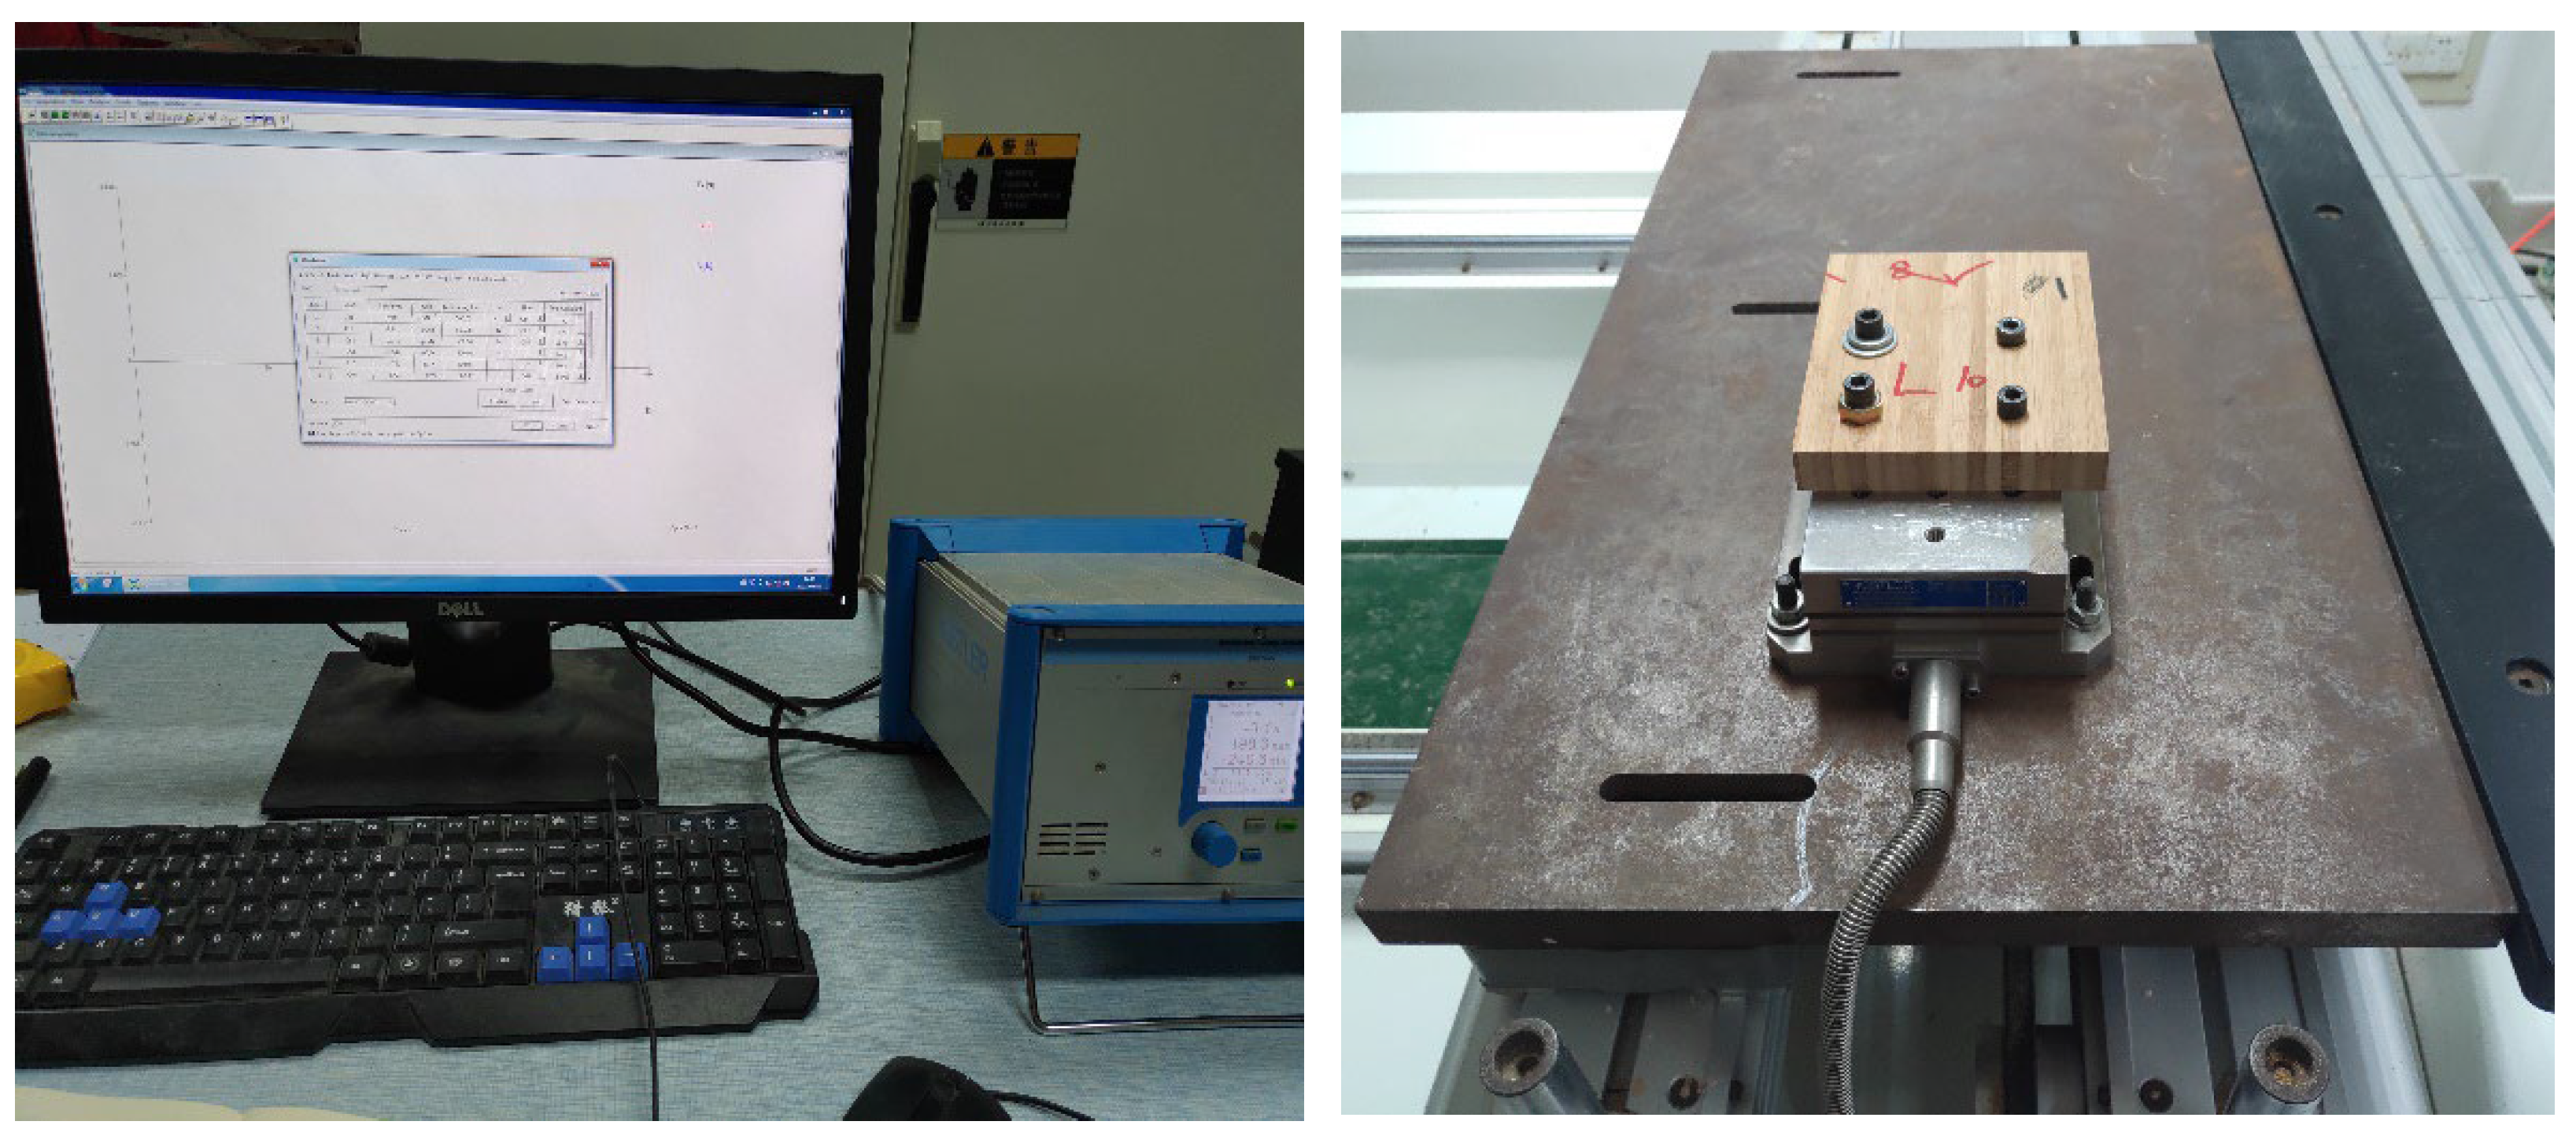
Dynamic cutting forces were measured by a 9257B quartz three-way dynamometer (Kistler, Winterthur, Switzerland) with a measuring range of −5 kN–5 kN. The cutting dynamometer was composed of a 9257B sensor, a 5070A charge amplifier, and a V2.6.5.16 dynoware. The frequency of the dynamometer was selected as 7142 Hz. This dynamometer could measure cutting forces and torques in three directions with high sensitivity. The primary technical parameters of the dynamometer were stiffness (1 µm/N), range (±5 kN), and sensitivity (0.05 N) (Figure 4).

2.2. Selection of Cutting Parameters

The Box–Behnken (BBD) design in the response surface method was utilized to assess nonlinear relationships among different indicators and factors. The main design points encompass the center point, +1 factor point, and −1 factor point. The study examined the impact of various bamboo cutting parameters on cutting force. Table 1 outlines the cutting parameters and their corresponding levels [21].
This study established a mathematical model through the response surface method to optimize the combination of different cutting parameters to achieve the minimum cutting force in cutting processing, and conducted experimental verification to verify the accuracy of the mathematical model. The experimental design is shown in Table 2. All the experiments were conducted in a completely random sequence, and it was ensured that the maximum value of VB in all experimental processes did not exceed 0.2 mm to avoid interference effects caused by tool wear, environmental changes, and other time-related factors.
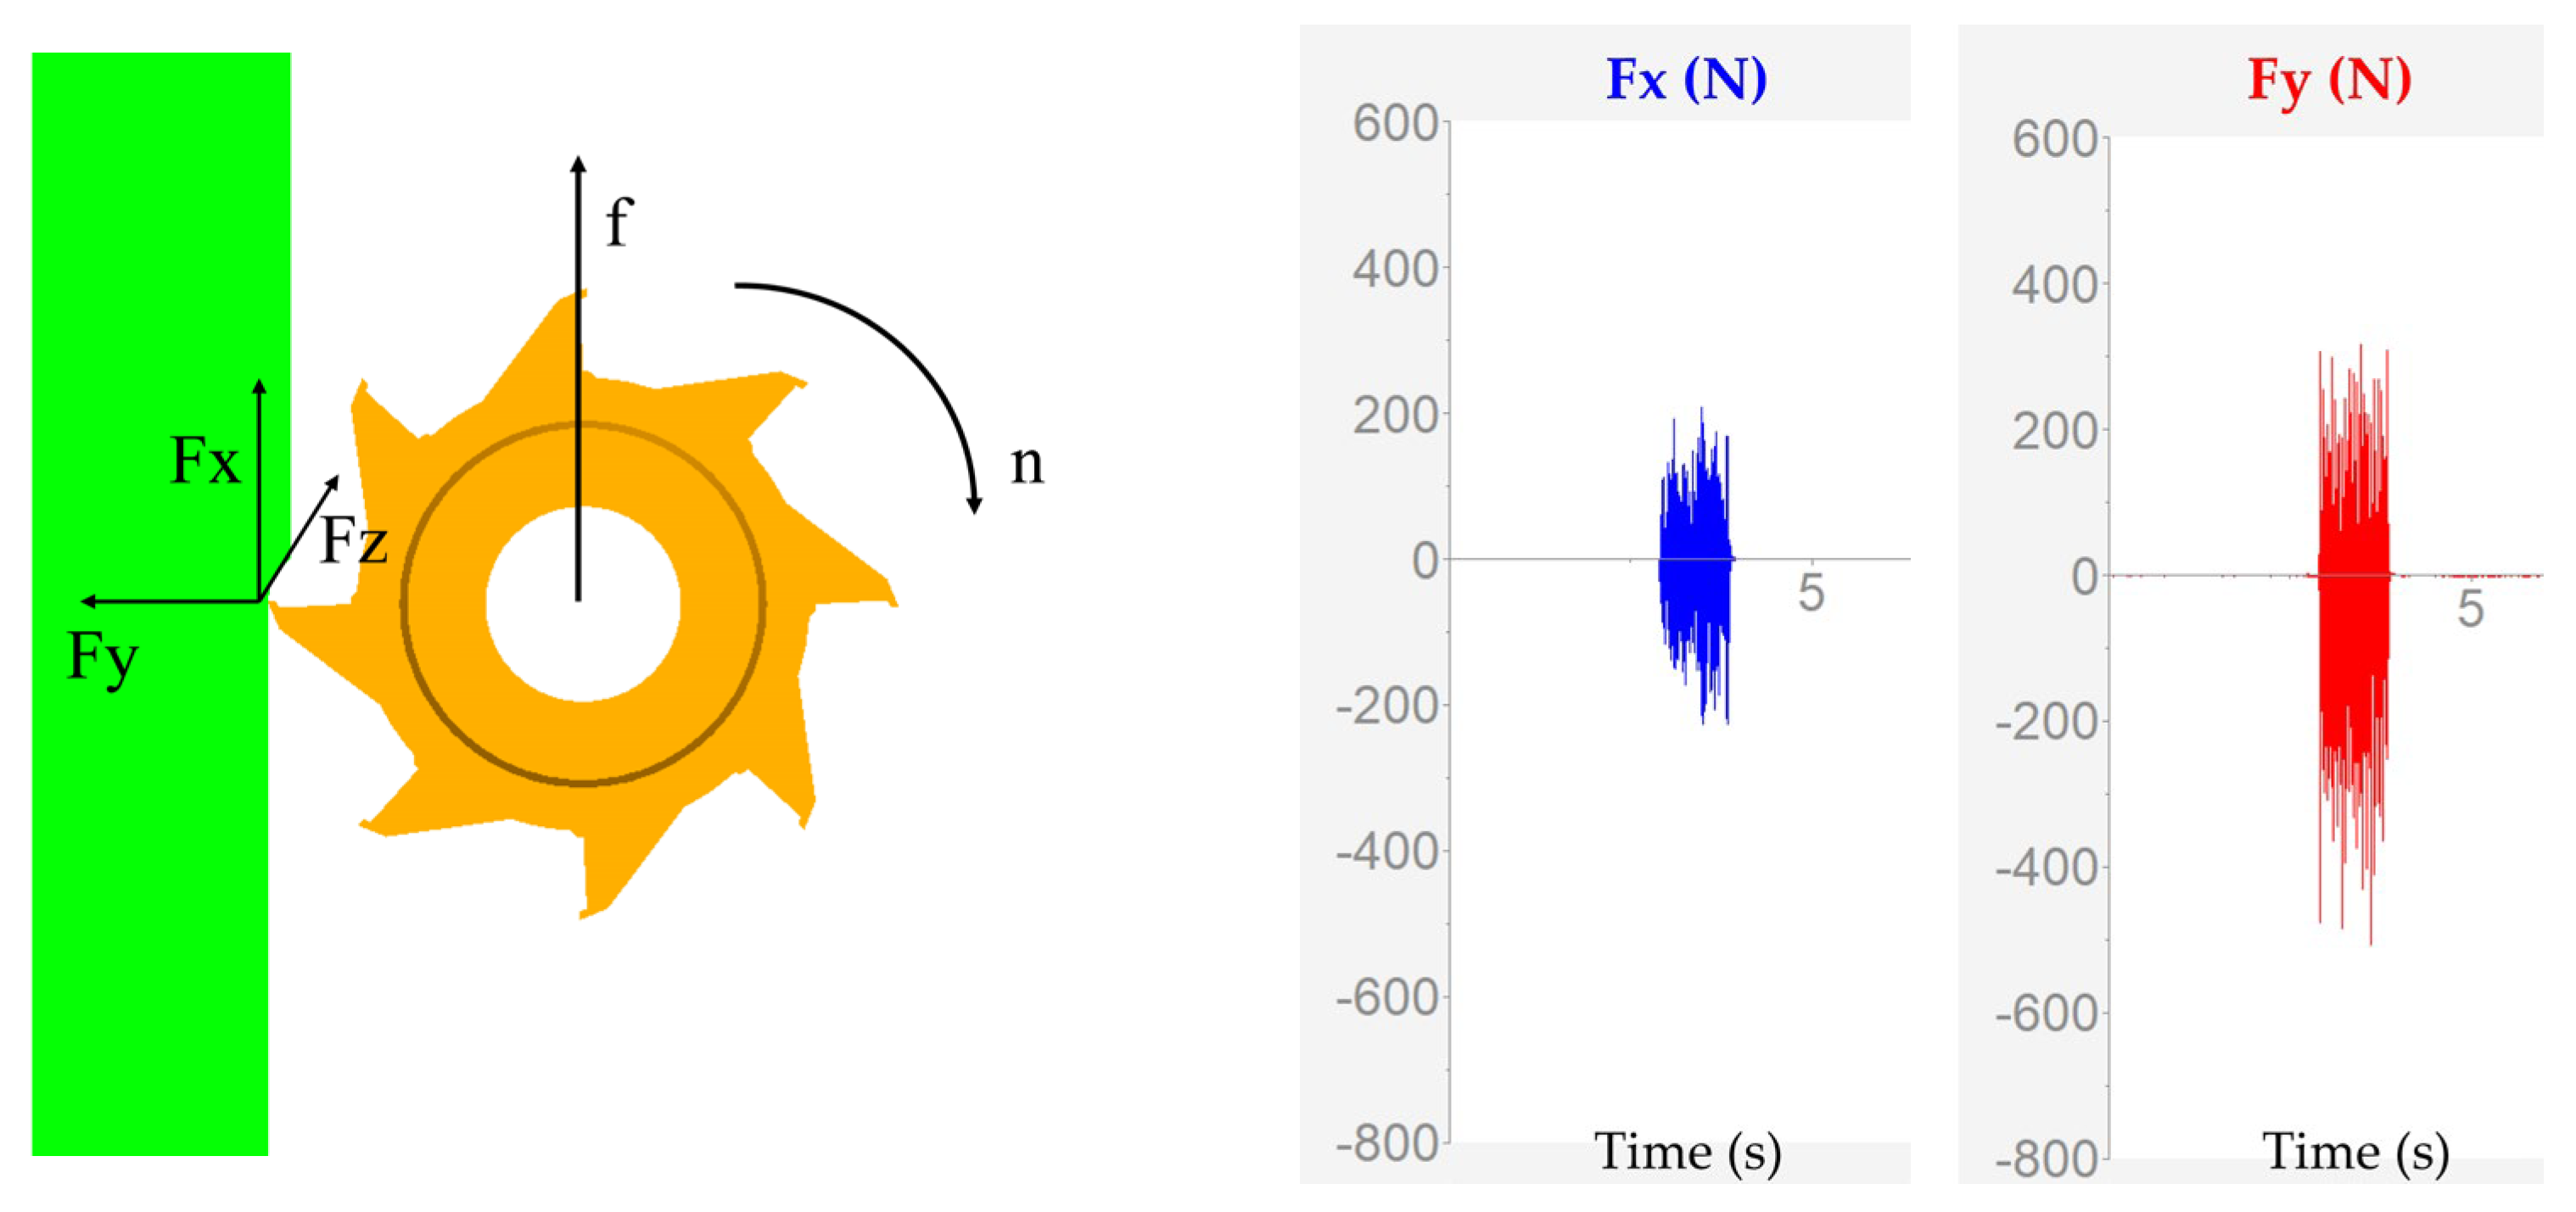
The cutting force in the feed direction is Fx, the cutting force perpendicular to the feed direction is Fy, and the cutting force along the tool axis is Fz. Since the cutting tool used in this work is a straight-tooth tool with a helix angle of 0, no axial cutting force will be generated along the tool axis direction in this cutting process, that is, Fz = 0 N. However, in the actual experiments, due to factors such as tool deviation and deviation in the installation of the test material, there may be slight axial force interference, so in this study, Fx and Fy are taken as the research indicators. In Figure 5, the cutting forces on the bamboo chord surfaces parallel and perpendicular to the feed direction are Fx1 (blue) and Fy1 (red), respectively. It can be observed that the measured real-time cutting forces are close to zero at the beginning and the end of the measurement, corresponding to the stage before the tool contacts the bamboo and the stage after the tool leaves the cutting area. During the effective cutting stage in the middle, a distinct high-intensity high-frequency oscillation signal is manifested, and the bidirectional positive and negative oscillation of the signal reflects the compressive and tensile loads alternately borne by the tool in the two measurement directions over time.
Before each cutting operation, collect the signals generated during the idle rotation of the spindle, and subtract their average value from the cutting force records. Eliminate the transient signals during the tool feed and withdrawal stages, and only retain the stable cutting processing signals in the middle. This paper selects the average value of the maximum cutting force during the stable cutting state as the research target. Repeat the cutting experiments three times, and calculate the average value of the maximum cutting force for each experiment.

3. Results and Discussion

Table 3 presents the test results of bamboo milling under different combinations of cutting parameters. The average values of Fx1, Fy1 were 134.618 N, 245.456 N, respectively.

3.1. Statistical Analysis

The influence of various cutting parameters on the experimental results was analyzed using Analysis of Variance (ANOVA). The second-to-last column of the ANOVA table shows the contribution rates of each factor. A significance test was conducted on the mathematical model, where significance levels of α = 0.05 and 0.01 correspond to confidence levels of 95% and 99%, respectively. A p-value less than 0.01 indicates that the project has an extremely significant impact on the response. A p-value greater than 0.01 but less than 0.05 indicates that the project has a significant impact on the response. When the p-value is greater than 0.05, it indicates that the project has a significant impact on the response.
The variance analysis of the transverse cutting force (Fx1) on the bamboo chord surface is presented in Table 4. The spindle speed (n) contributes 35.72%, the feed rate (f) contributes 16.95%, the secondary interaction term n × d contributes 19.51%, and the secondary term d2 contributes 15.16% had significant impacts on the transverse cutting force (Fx1). Among them, the spindle speed (n) stands out as the most significant factor, contributing 35.72%. The depth of cut (d) with a contribution rate of 0.78%, the secondary interaction terms n × f and f × d with the contribution rates of 2.04% and 0.01%, respectively, and the quadratic terms n2 and f2 with the contribution rates of 3.32%, and 0.19%, respectively, had no significant effect on the transverse cutting force (Fx1). The error contribution rate stands at 6.32%.
The variance analysis of the longitudinal cutting force (Fy1) on the bamboo chord surface is presented in Table 5. The quadratic term n2 contributes 67.44%, the spindle speed (n) contributes 7.87%, and the feed rate (f) contributes 11.05%, all having significant effects on longitudinal cutting force. Among them, the quadratic term n2 stands out as the most significant factor, contributing 67.44%. The depth of cut (d) with a contribution rate of 0.31%, the secondary interaction terms n × f, n × d, and f × d with contribution rates of 2.77%, 0.32%, and 0.01%, respectively, and the quadratic terms f2 and d2 with contribution rates of 0.08%, and 3.23%, respectively, had no significant effects on the longitudinal cutting force. The error contribution rate stands at 6.92%.

3.2. Regression Equations

A mathematical model of bamboo string cutting forces based on test results was established in MINITAB 17.0 and design-expert 11.0 software. The formula is shown in Equation (1), and the regression coefficient α is estimated based on the least squares method. Here, A, B, and C represent the encoded values of the main shaft speed, feed rate, and cutting depth, which are −1, 0, and 1, respectively, as shown in Table 2.
y = α1 + α2 ∗ A + α3 ∗ B + α4 ∗ C + α5 ∗ A2 + α6 ∗ B2 + α7 ∗ C2 + α8 ∗ A ∗ B + α9 ∗ A ∗ C + α10 ∗ B ∗ C
y1 = 110.17 − 36.60 ∗ A + 25.22 ∗ B + 5.42 ∗ C + 15.37 ∗ A2 + 3.72 ∗ B2 + 32.87 ∗ C2 − 12.36 ∗ AB − 38.26 ∗ AC − 1.01 ∗ BC
y2 = 192.83 + 37.09 ∗ A + 43.95 ∗ B − 7.34 ∗ C + 149.65 ∗ A2 − 5.08 ∗ B2 − 32.74 ∗ C2 + 31.15 ∗ AB − 10.53 ∗ AC − 1.91 ∗ BC
According to Equations (2) and (3), the encoding coefficients for the spindle speed, feed rate, and cutting depth can be obtained. The coefficients calculated by Fx1 are −36.60, 25.22, and 5.42, respectively. This indicates that the main effects of the cutting parameters on the cutting force Fx1 are in the order of n > f > d. In the processing of bamboo material cutting, increasing the spindle speed will reduce the feed per tooth, thereby decreasing the cutting force Fx1, which is the most significant factor affecting the process. The influence of the cutting depth is relatively small, indicating that within the test range, the cutting depth did not significantly change the tool advancement resistance. The coefficients calculated for Fy1 are 37.09, 43.95, and −7.34, respectively. This indicates that the main effects of the cutting parameters on the cutting force Fy1 are in the order of f > n > d. The increase in feed rate directly enhances the volume of material removed per unit time, while also increasing the thickness of the undeformed chip and the cross-sectional area of the sheared chip. Fy1 represents the cutting force that resists the formation of the chip in the material. The feed rate is the most influential factor.
Fx1 is dominated by the spindle speed, while Fy1 is dominated by the feed speed. This indicates that there is a significant direction sensitivity in the cutting processing of the bamboo lamina surface. Due to the anisotropic fiber structure of bamboo, the cutting force varies depending on whether the loading direction is relative to the fiber direction. This suggests that in multi-objective optimization, both Fx1 and Fy1 need to be considered simultaneously in order to obtain the parameter combination with the minimum cutting force.
The encoded equation is inversely transformed to the natural variable space. The true regression coefficient is b, and the quadratic mathematical model of cutting force is expressed as Equation (4):
y = β1 + β2 ∗ n + β3 ∗ f + β4 ∗ d + β5 ∗ n2 + β6 ∗ f2 + β7 ∗ d2 + β8 ∗ n ∗ f + β9 ∗ n ∗ d
Now, replacing the parameters of Equation (4) with the test results, we obtain the mathematical model of cutting forces on the bamboo chord surface:
Fx1 = 508.9 − 0.286 ∗ n + 22.44 ∗ f + 232.5 ∗ d + 0.000061 ∗ n2 + 0.149 ∗ f2 + 131.5 ∗ d2 − 0.00494 ∗ n ∗ f − 0.153 ∗ n ∗ d − 0.4 ∗ f ∗ d
Fy1 = 9327.06 − 4.776 ∗ n − 35.85 ∗ f + 554.19 ∗ d + 0.000599 ∗ n2 − 0.203 ∗ f2 − 130.94 ∗ d2 + 0.01246 ∗ n ∗ f − 0.0421 ∗ n ∗ d − 0.764 ∗ f ∗ d
The mathematical model of Fx1 is shown in Equation (5). The positive feed speed and cutting depth dominate the magnitude of the cutting force, while the negative spindle speed reflects the thermal softening characteristics of the cutting material. For the case where all the interaction terms are negative, it indicates that the increase in cutting parameters will slow down the increase in the cutting force, due to the reduction in the friction force between the tool and the chip.
The mathematical model of Fy1 is shown in Equation (6). The positive cutting depth dominates the magnitude of the cutting force, while the negative feed speed and spindle speed, respectively, reflect the deflection of the resultant force direction when the chip thickens and the thermal softening characteristics of the cutting material. The negative n ∗ d and f ∗ d interaction terms have the same influence trend as Fx1, while the positive n ∗ f is related to the change in the flow direction of the chip.
The determination coefficient R2 was used to describe how well the data fitted the model. The closer the R2 value to 1, the better the feasibility of the established model. The R2 values for Fx1 and Fy1 were 93.8% and 93%, respectively, (close to 1), indicating that the established mathematical model could effectively calculate Fx1 and Fy1. The CV% value of the coefficient of variation was used to describe the degree of variation between different levels of variables. The coefficients of variation were 12.223% and 15.143%, respectively, indicating that the repeatability, reliability, and accuracy of this experiment were very good (Table 6).
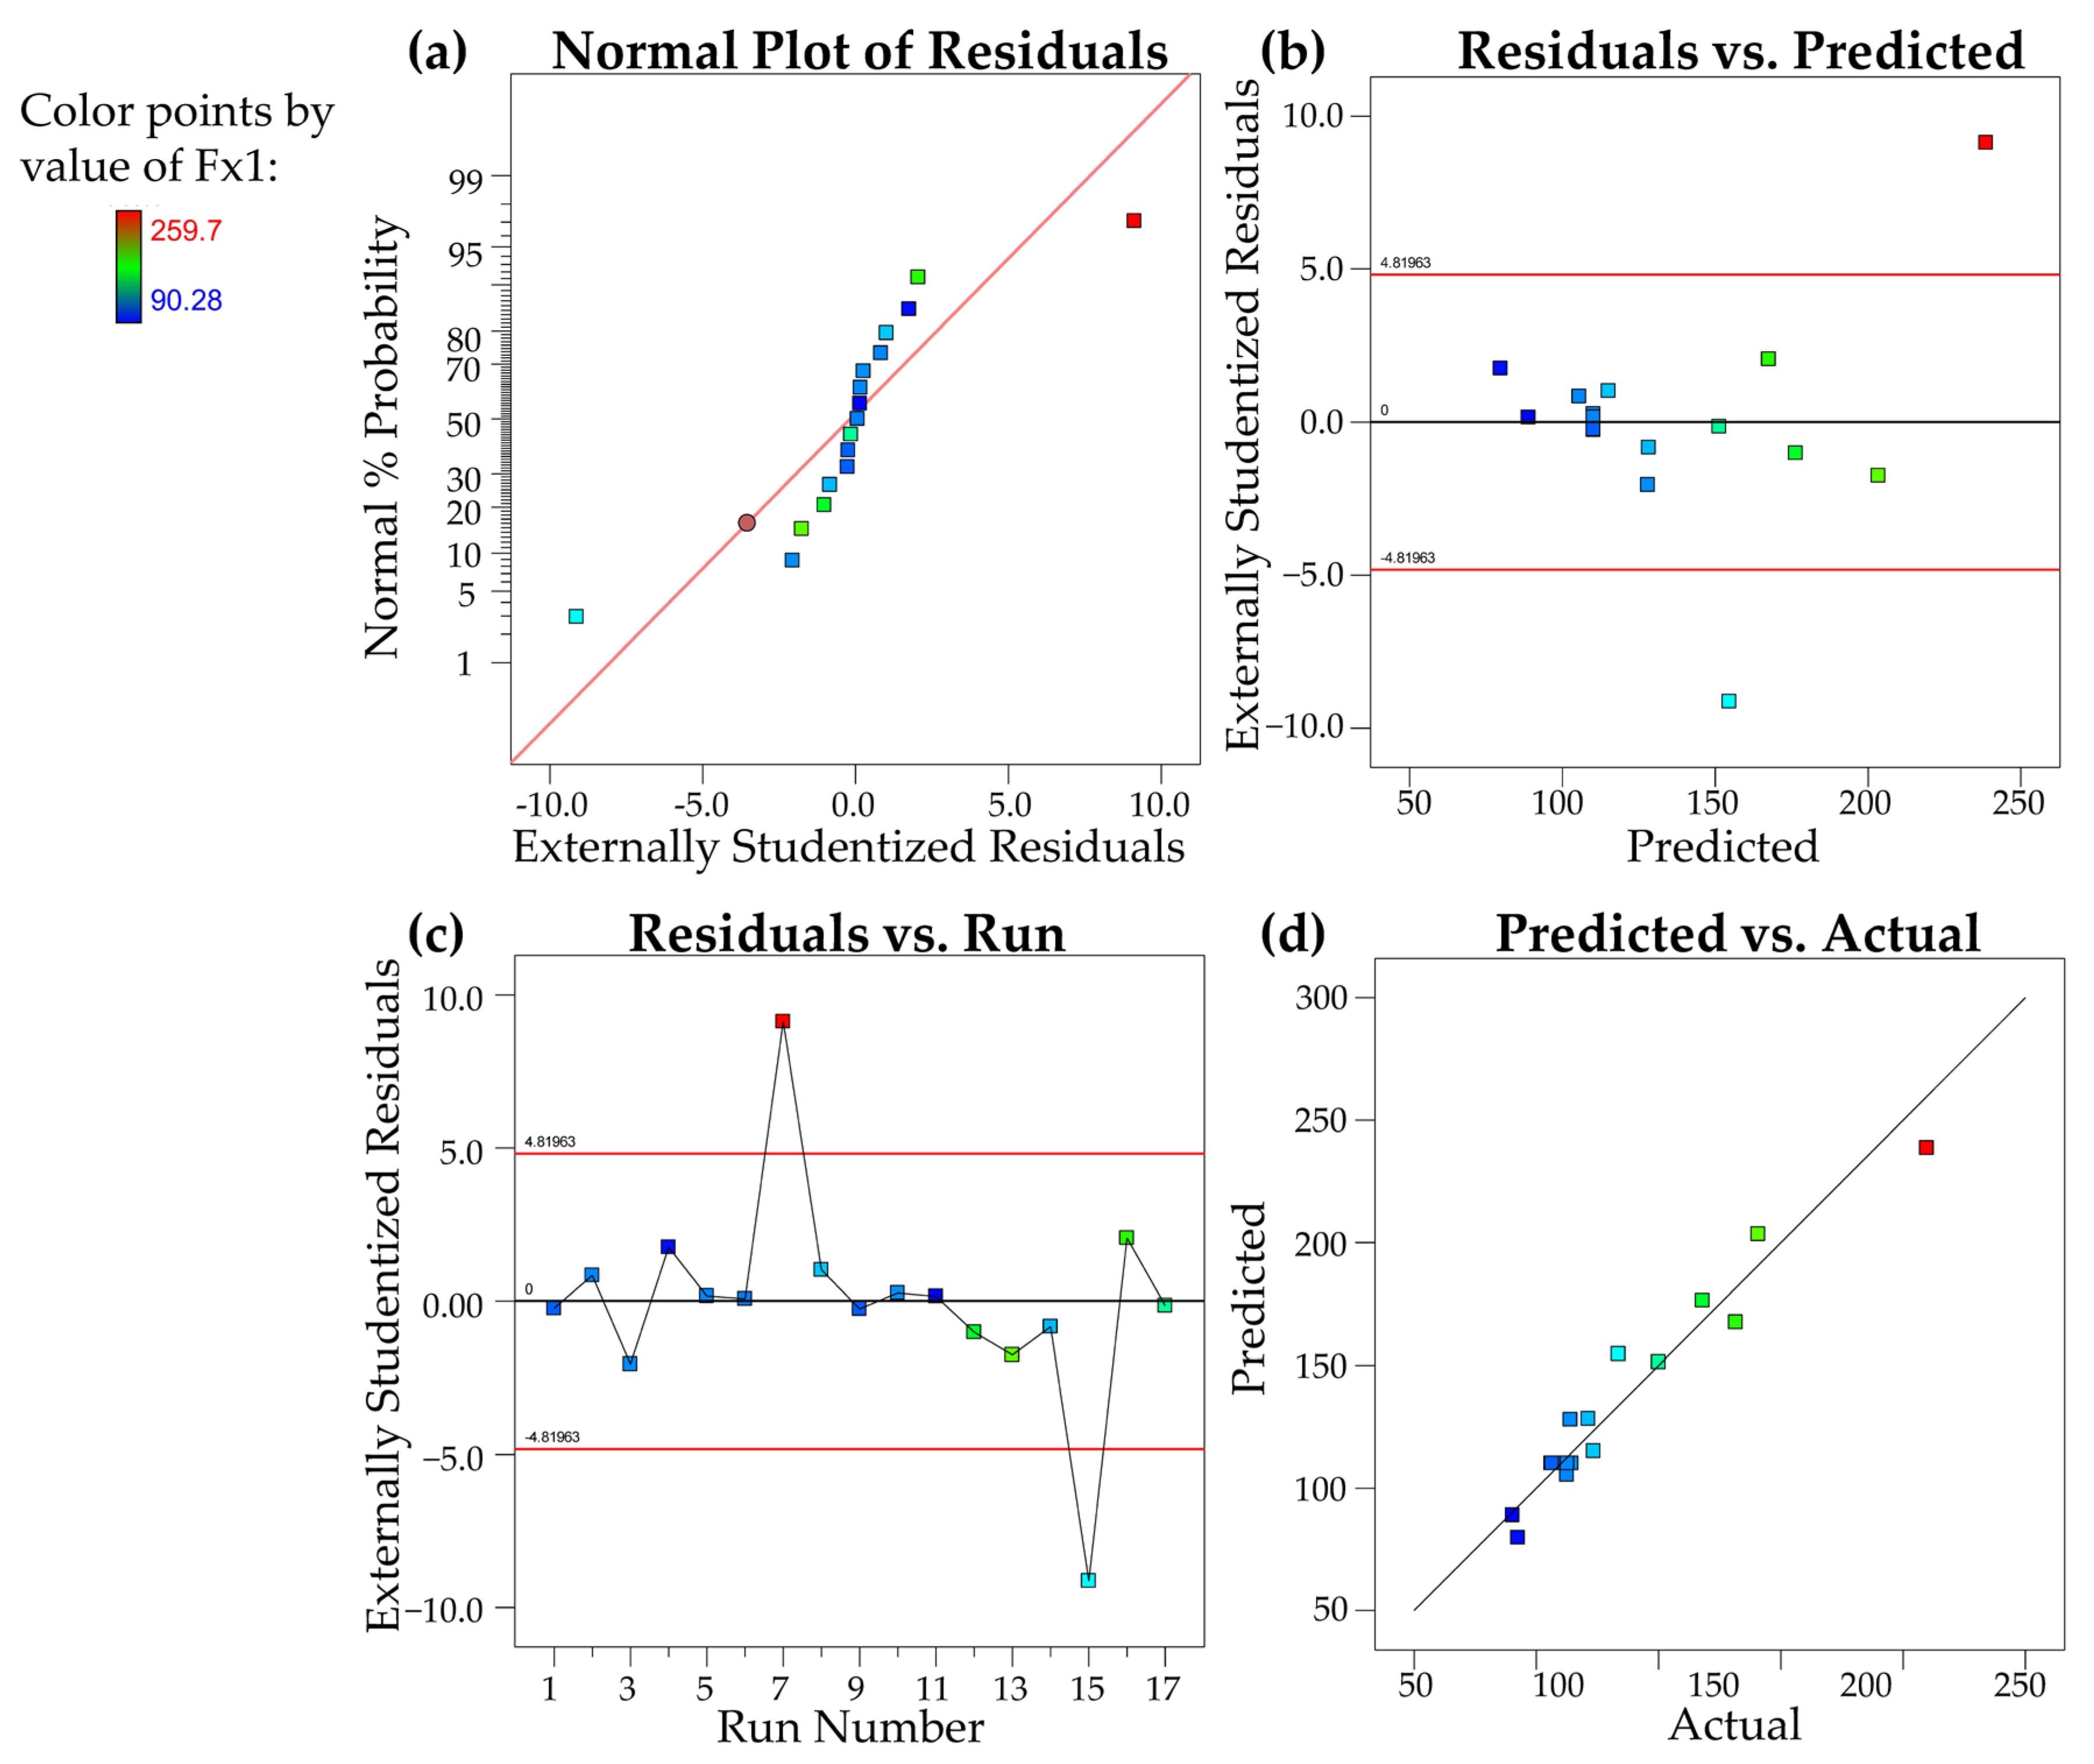
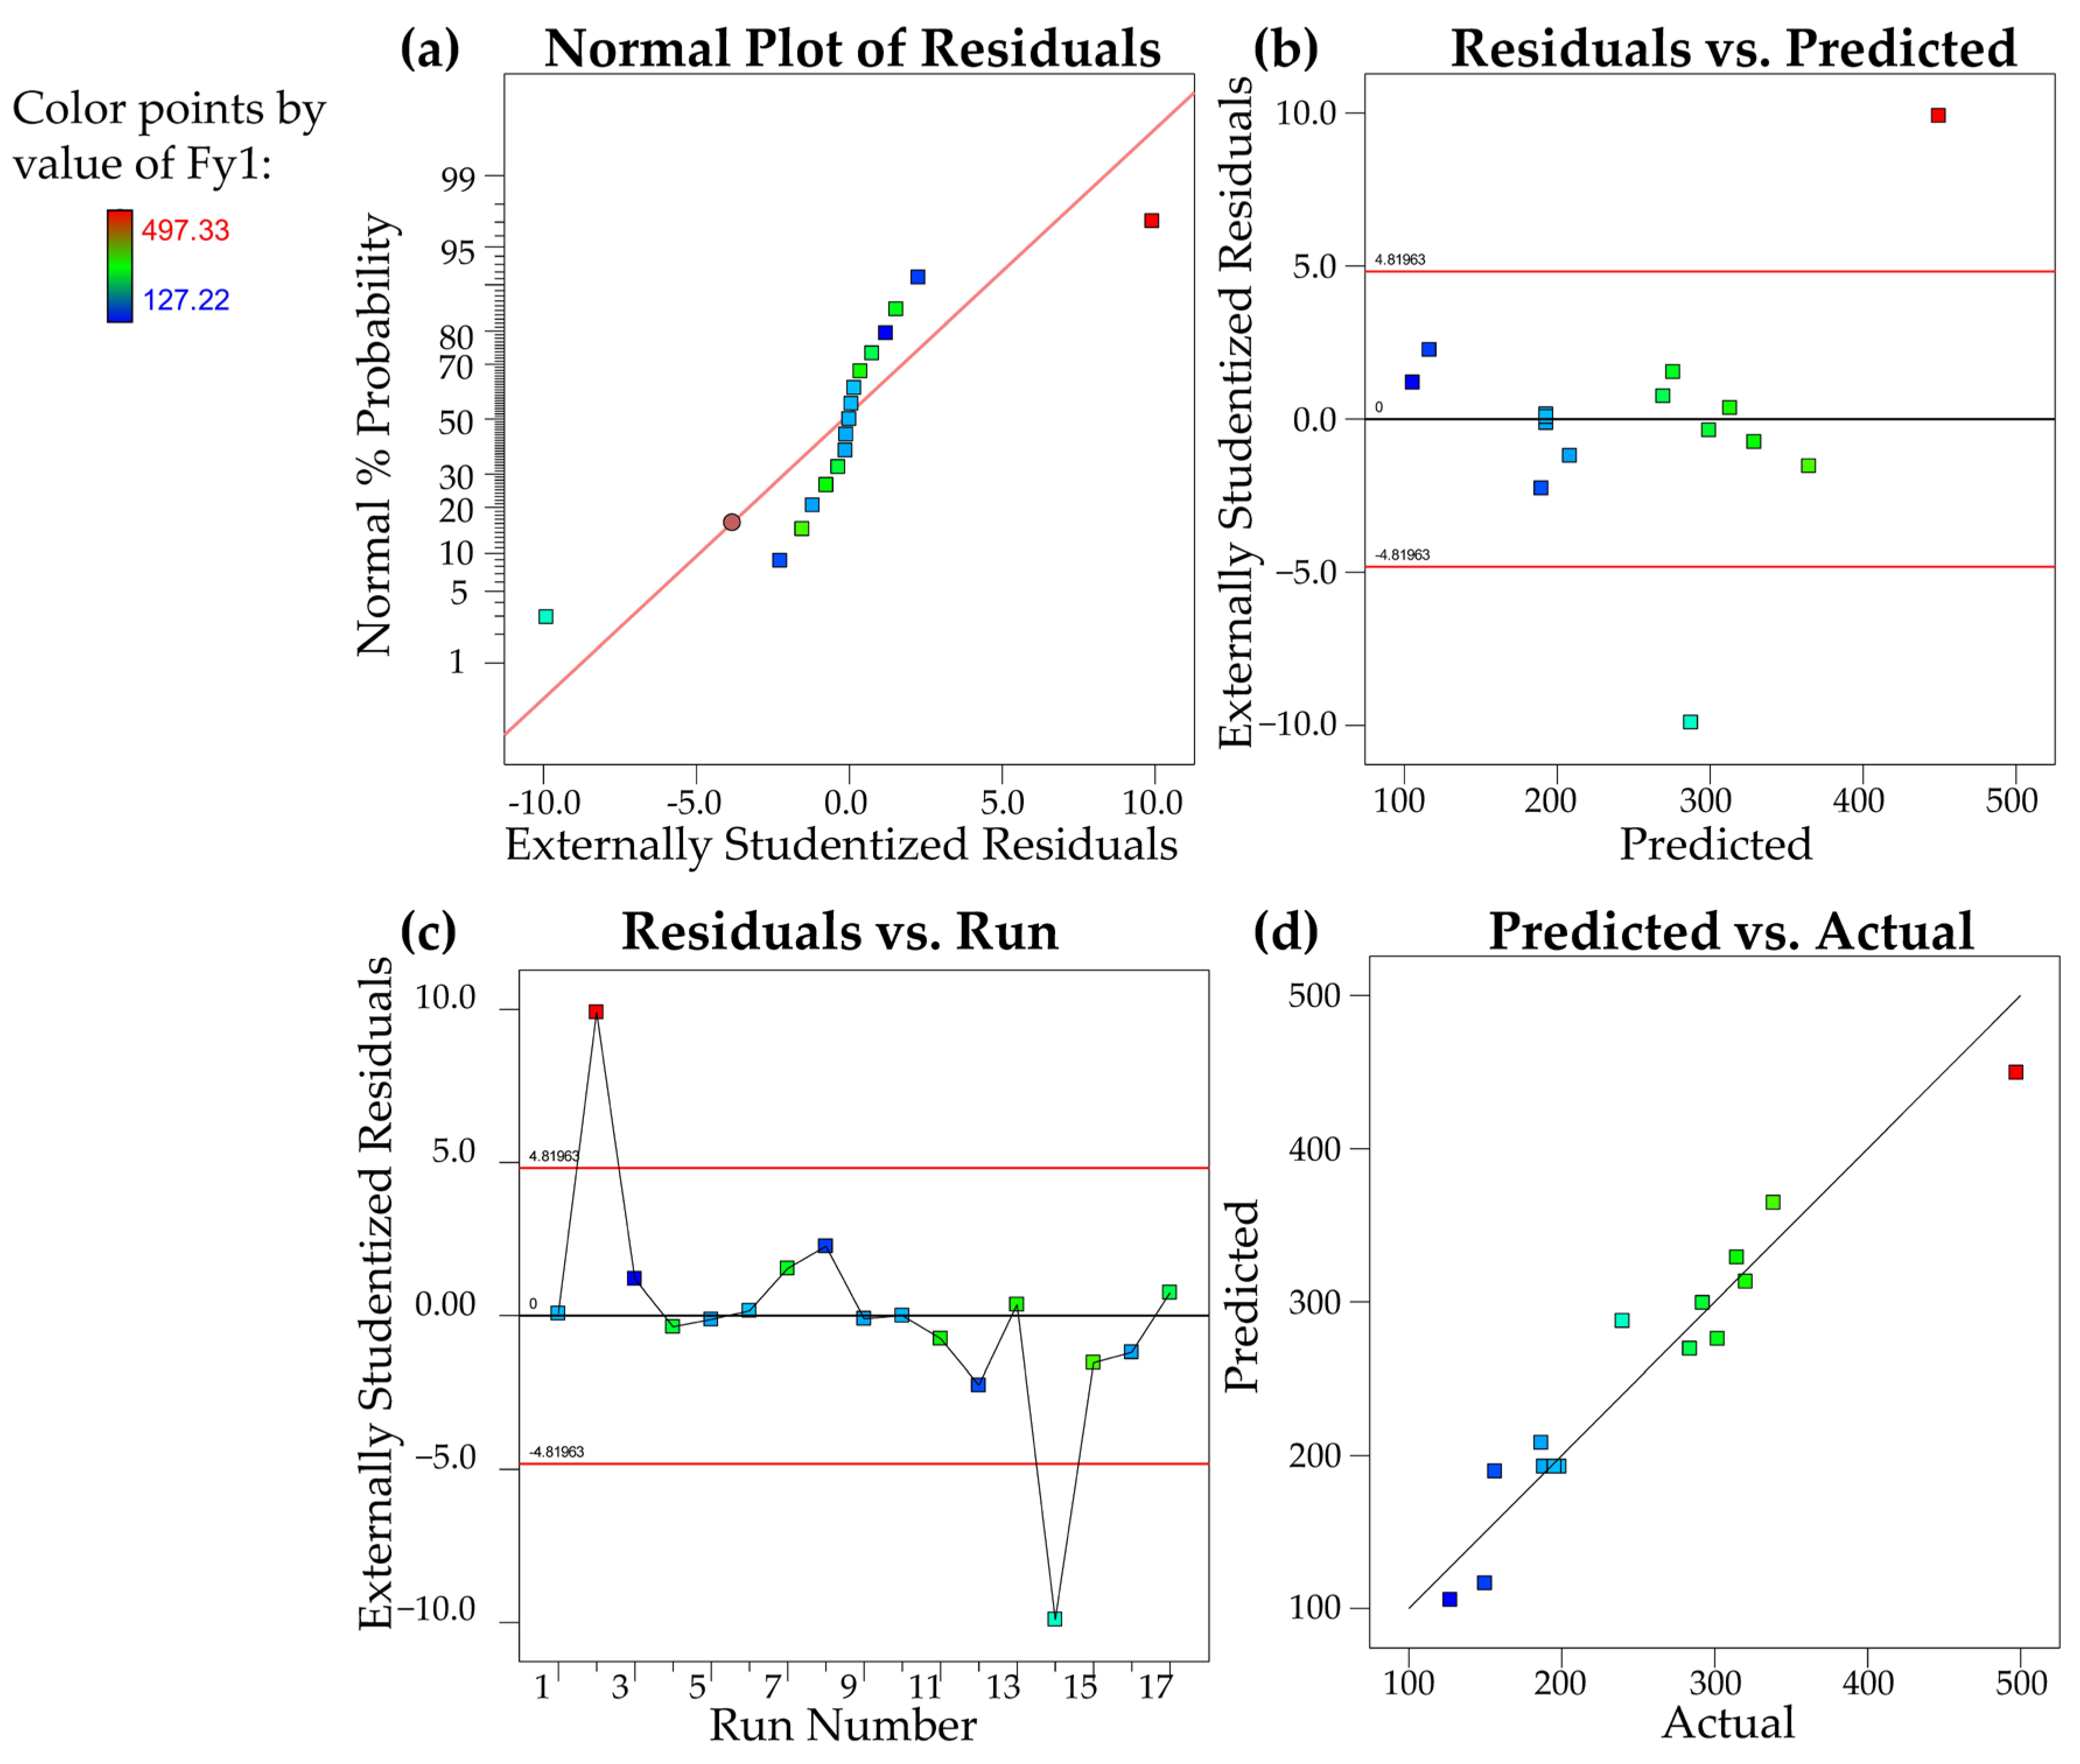
The residual analysis method and numerical calculations were used to verify the mathematical model of surface roughness established by the response surface method. The feasibility of the model was verified by judging the fitted value and size of each residual, and each residual was drawn corresponding to the test sequence.
Figure 6a,b present the residual and prediction diagrams and the residual and operation diagrams of the established mathematical model for calculating bamboo string cutting force Fx1, respectively. Notably, residuals of the mathematical model for calculating Fx1 were randomly distributed on the bamboo string surface. Figure 7a,b show a similar trend for Fy1.
A residual is the difference between measured values and predicted values, thereby indicating the discrepancy between actual observed values and regression estimates. If the probability distribution of residuals is approximately linear, the regression response satisfies the assumption of normality. Therefore, the relationship between residuals and predicted values ought to be random.
Figure 6c,d display the predicted/actual graphs and the residual normal graphs of the established mathematical model for calculating the bamboo chord cutting force Fx1, respectively. Importantly, all residuals were normally distributed, thus satisfying the normality assumption of all responses. Figure 7c,d show a similar trend for Fy1.

3.3. Effects of Machining Parameters on Surface Response Factors

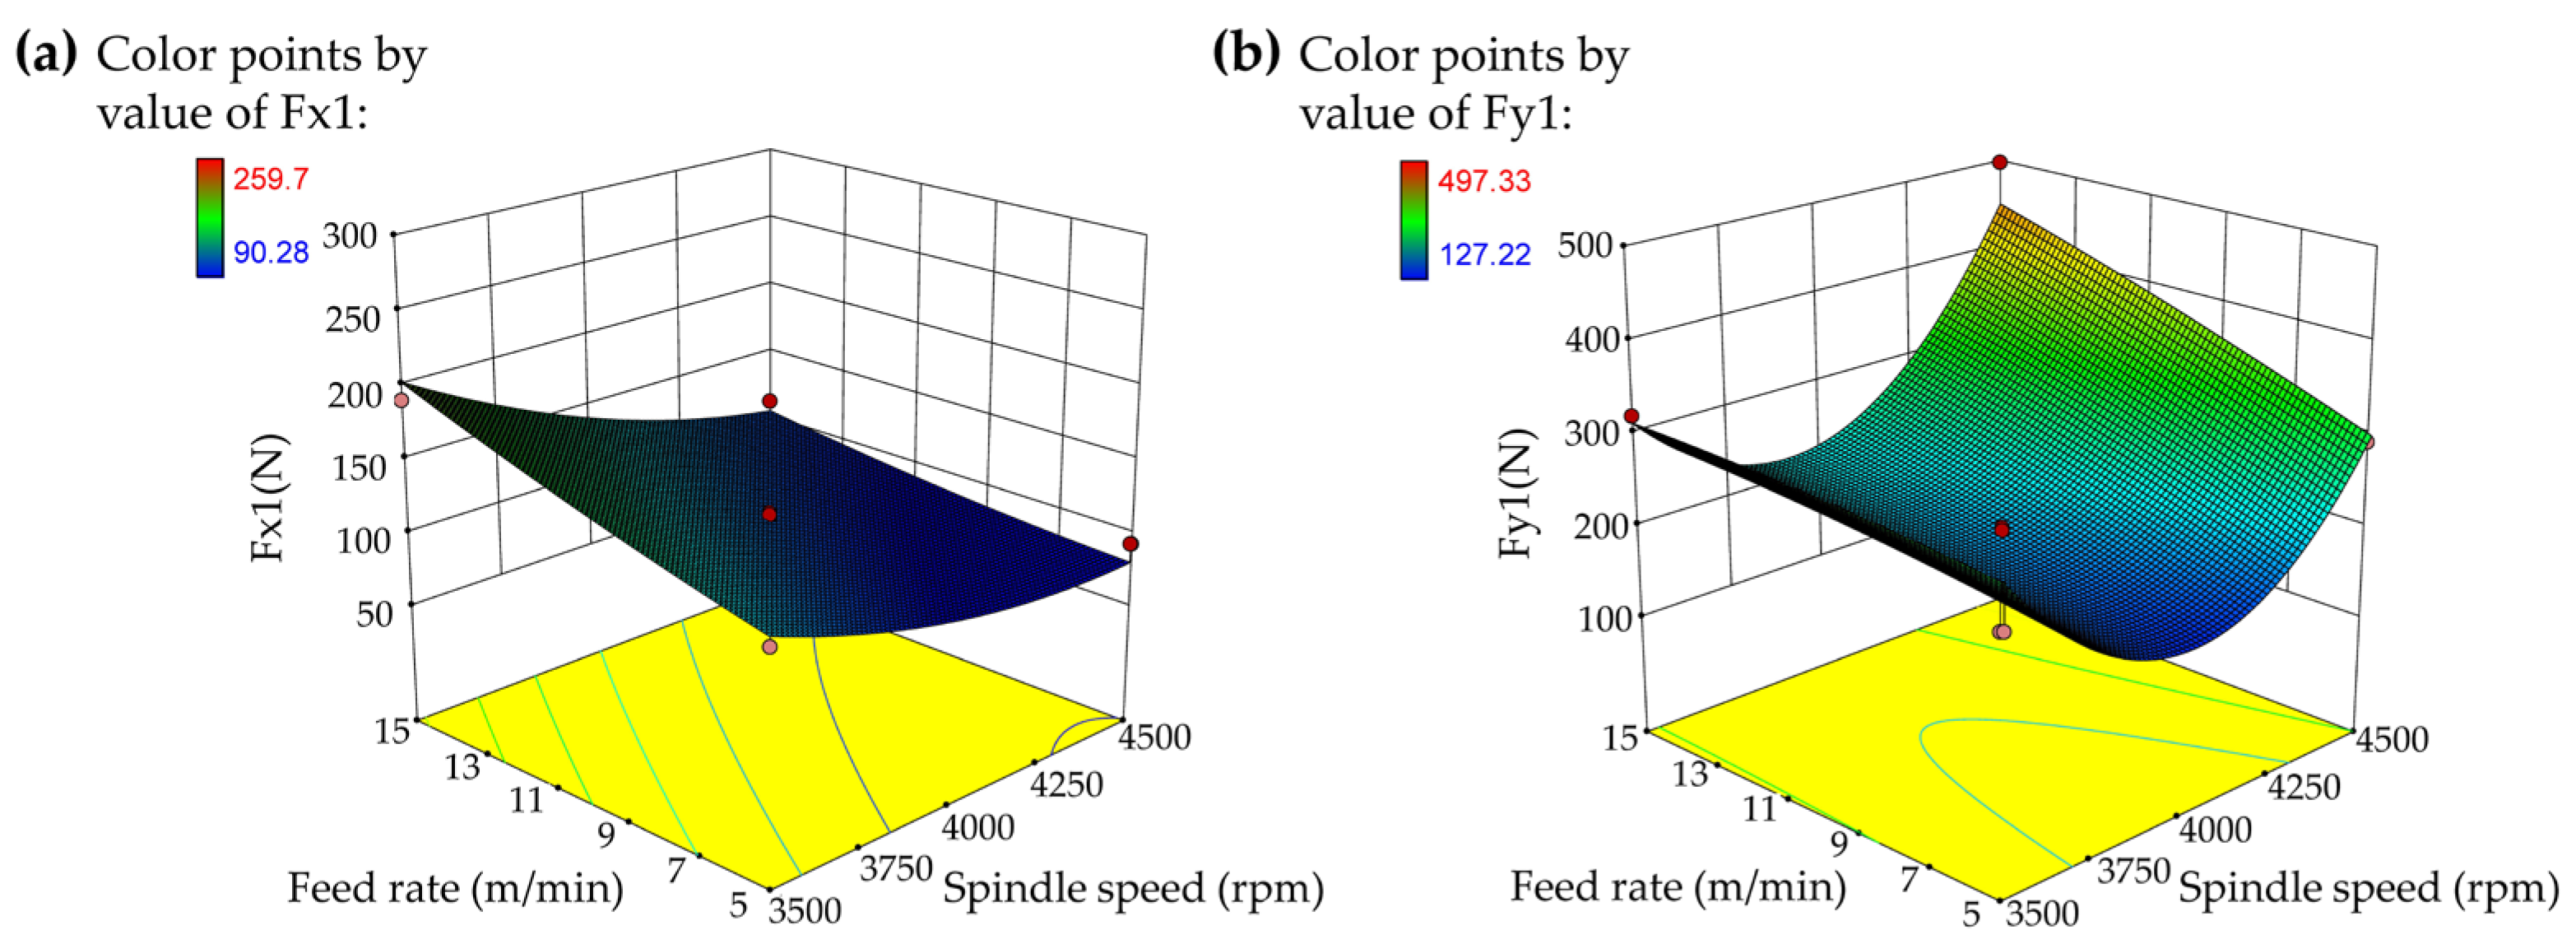
A three-dimensional surface map, which displays the interactive influence of two factors on cutting forces, was plotted based on the cutting force test results. The transition in color from blue to red on the three-dimensional surface plot signifies a variation in extraction quality, ranging from low to high. The steeper the change and the greater the slope, the more pronounced the influence on the test outcomes.
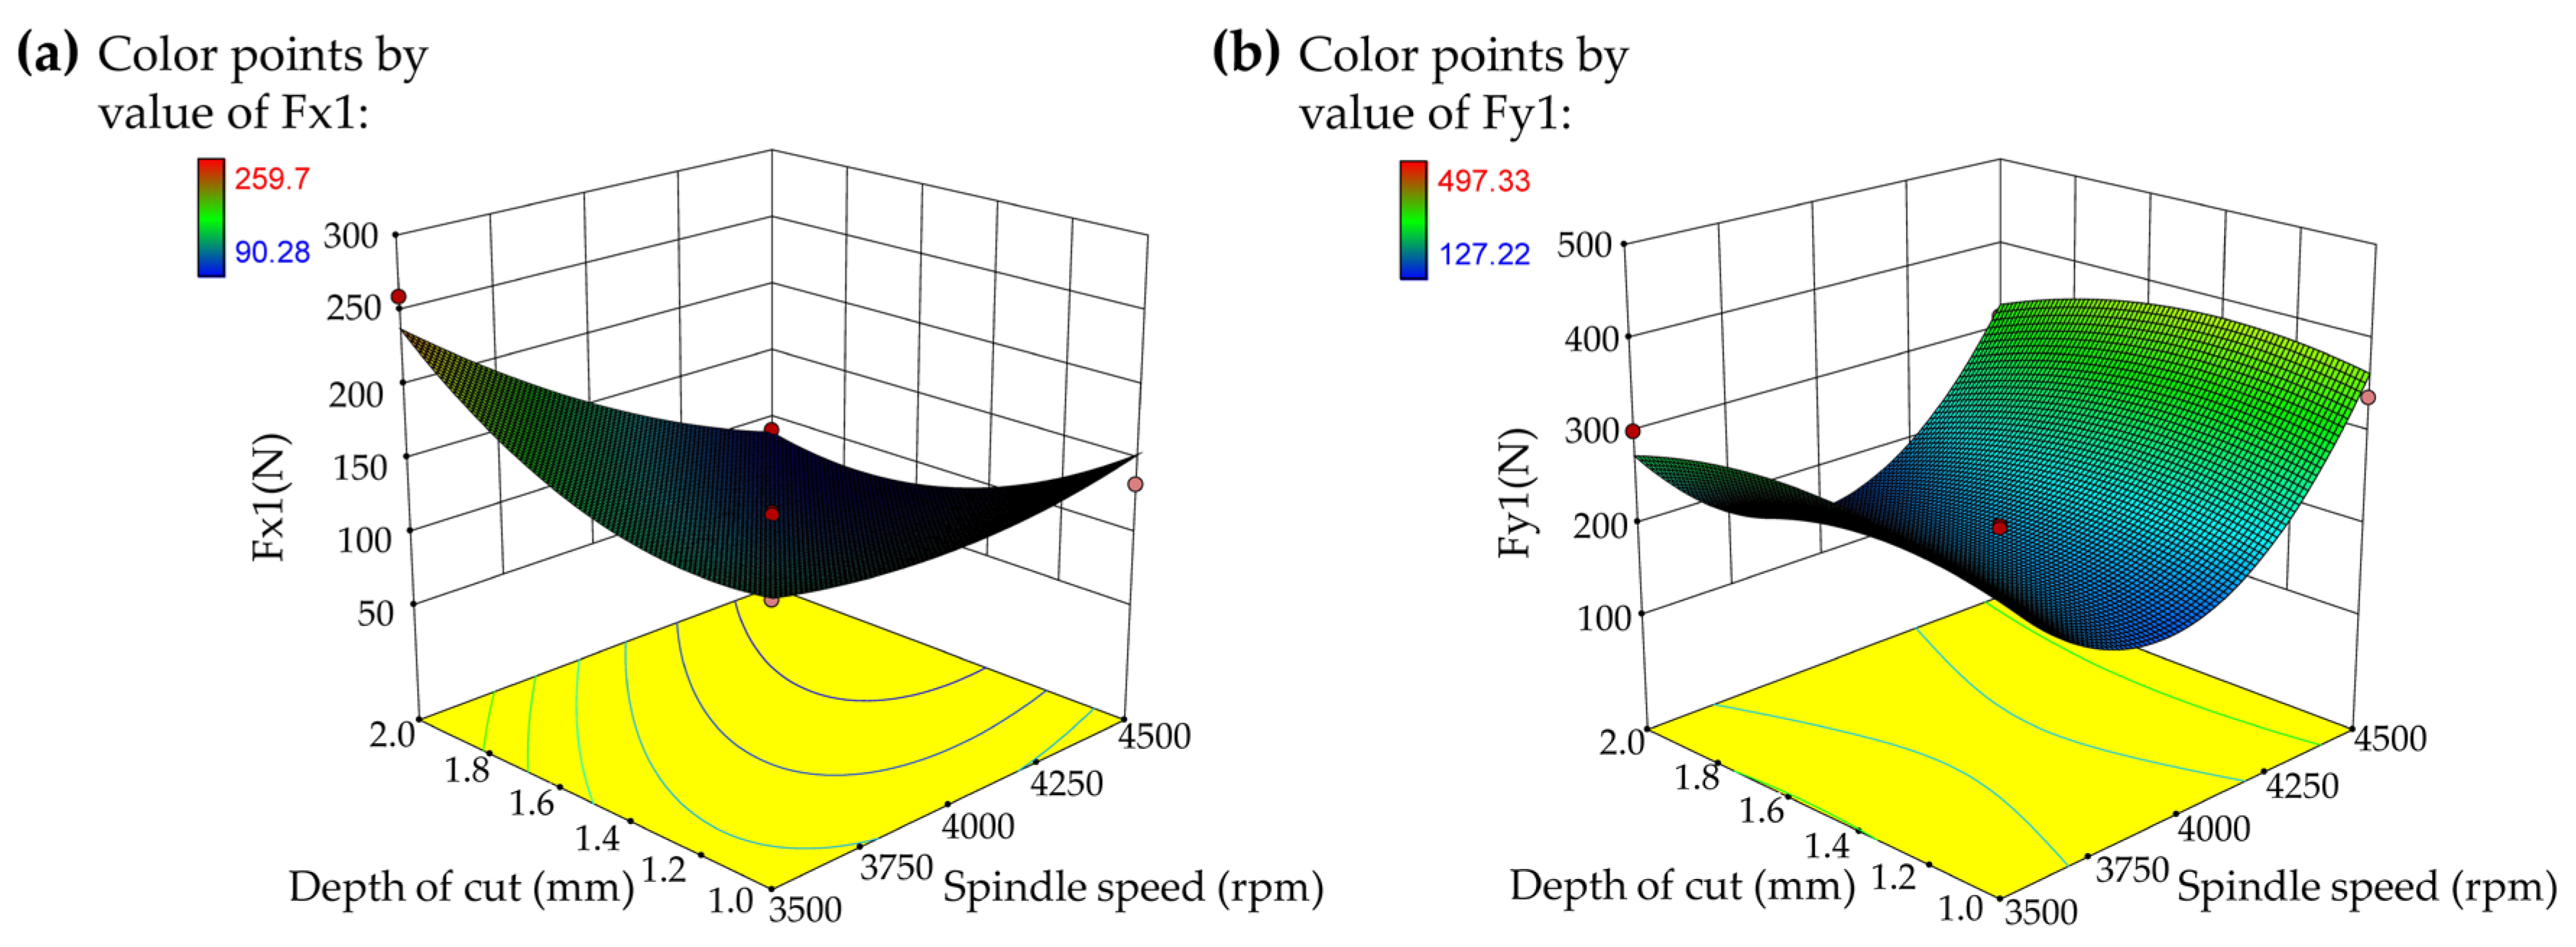
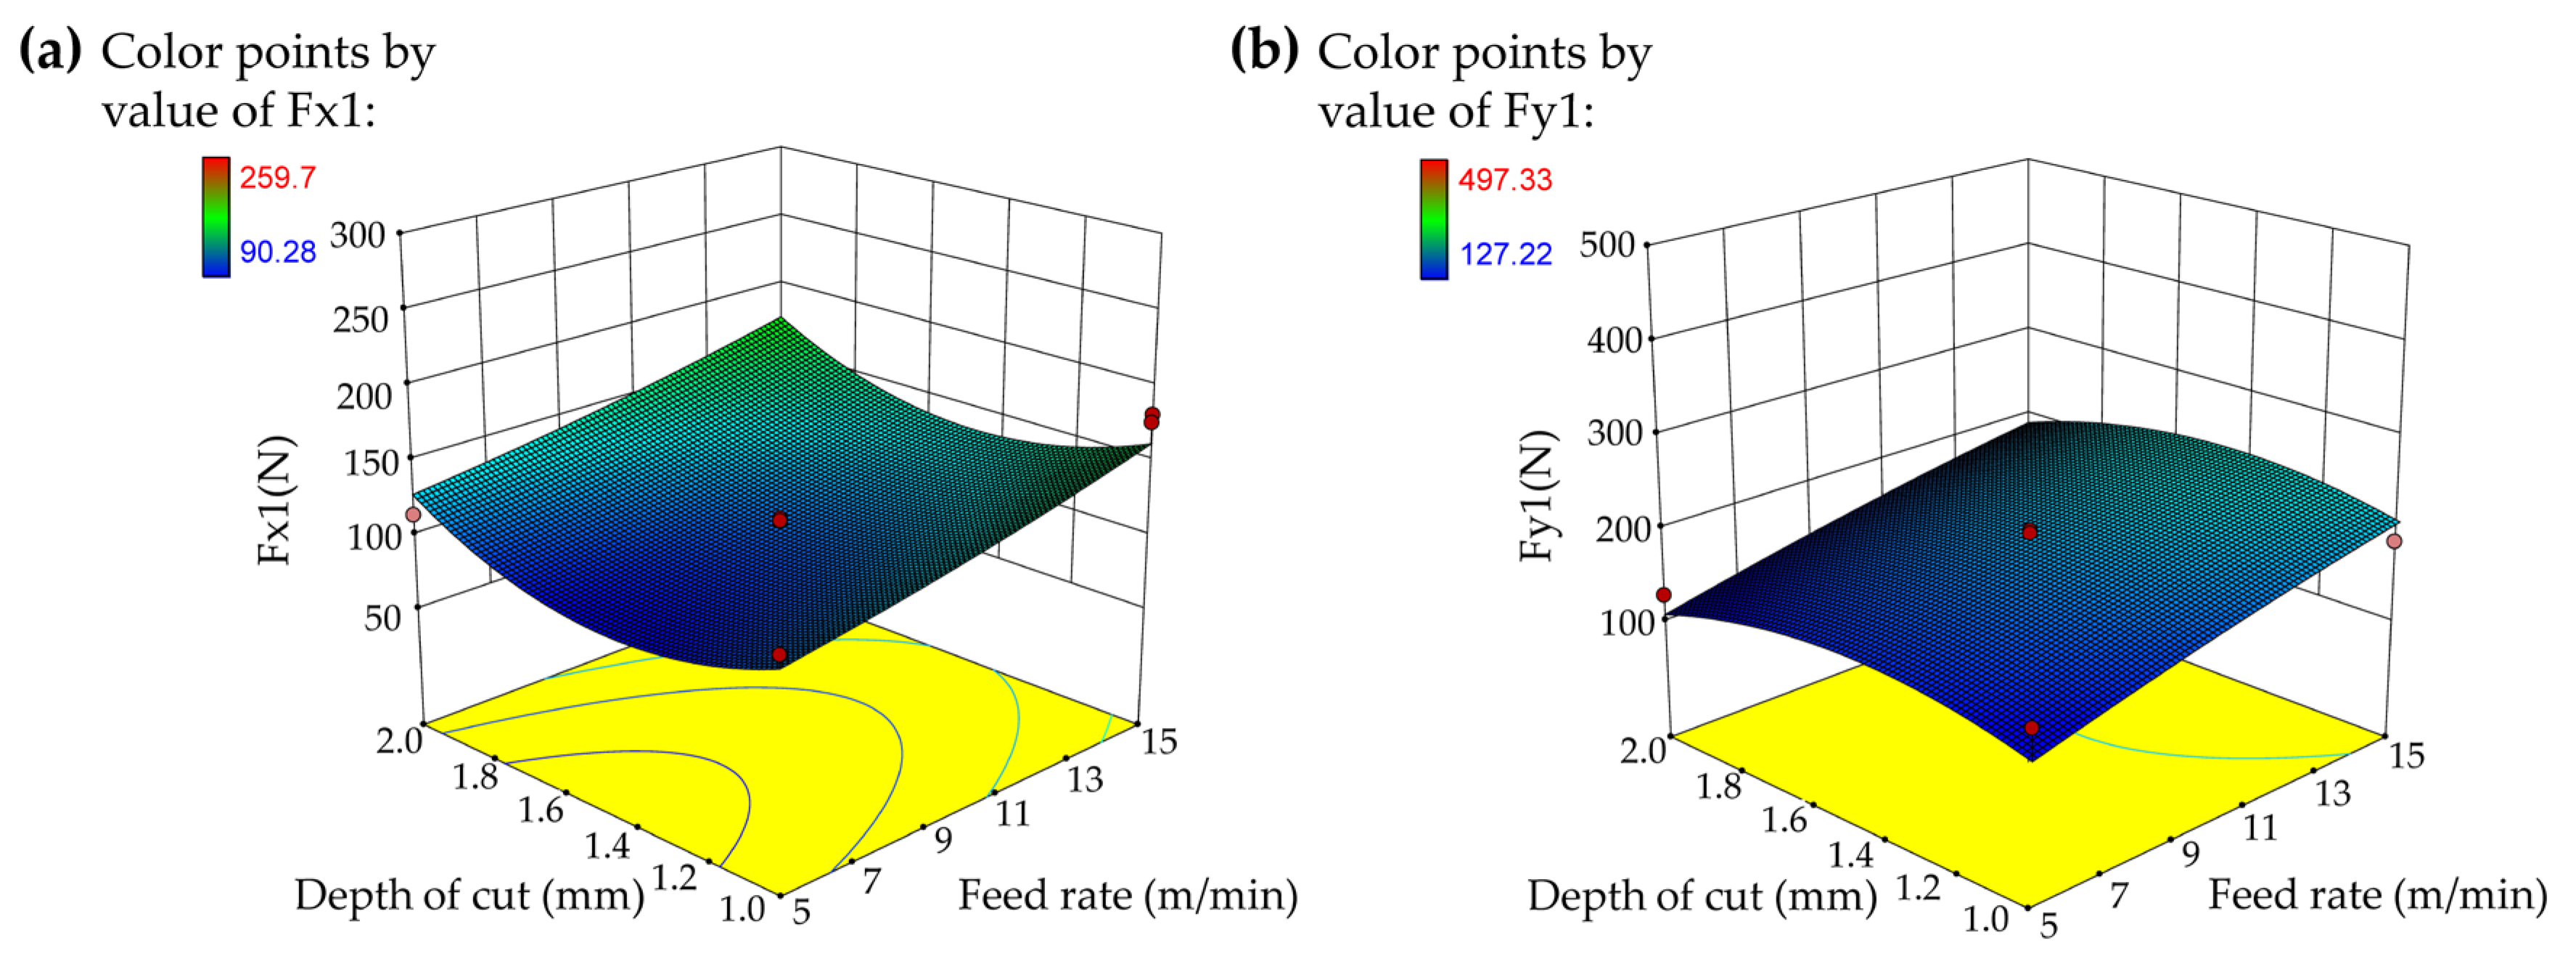
In order to reveal the relationship between each cutting parameter and cutting force on the bamboo chord surface (Fx1, Fy1), the corresponding response three-dimensional surface graphs are plotted in Figure 8, Figure 9 and Figure 10, and red dots represent the actual experimental observations.
Figure 8 presents the effects of spindle speed (n) and feed rate (f) on Fx1 and Fy1 when the depth of cut (d) was 1.5 mm. It is noticeable from Figure 8a that the interaction between spindle speed and feed rate was insignificant. However, the combination of a low feed rate and a high spindle speed could result in the minimum Fx1. The maximum Fx1 was obtained at a high feed rate and a low spindle speed. It is observable from Figure 8b that the interaction between spindle speed and feed rate was insignificant. However, the combination of a low feed rate and a high spindle speed could result in the minimum Fy1. The maximum Fy1 was obtained at a high feed rate and a low spindle speed. Both the minimum Fx1 and Fy1 occur at the same point. This is because the increase in spindle speed leads to an increase in cutting temperature, causing the lignin–hemicellulose matrix of the bamboo material to undergo thermal softening, thereby reducing the cutting force. The increase in feed speed corresponds to an increase in the thickness of the un-deformed chips, which increases the probability of contact with the high-strength vascular bundles during cutting, resulting in an increase in the cutting force.
Figure 9 expresses the effects of spindle speed and depth of cut on Fx1 and Fy1 when the feed rate was 10 m/min. It is discernible from Figure 9a that the interaction between spindle speed and depth of cut was significant. The combination of a medium depth of cut and a medium spindle speed could lead to a minimum Fx1. The maximum Fx1 was obtained at a high depth of cut and a low spindle speed. When the cutting depth and cutting speed are moderate, the fiber density in the cutting processing area is moderate. The moderate cutting speed causes the cutting temperature to rise, which softens the lignin–hemicellulose matrix, reduces the resistance to fiber bundle detachment, and thereby lowers Fx1. However, at low cutting speed and high cutting depth, the lignin–hemicellulose matrix does not soften, and the fiber bundles are difficult to detach, thus increasing Fx1. It is noticeable from Figure 9b that the interaction between spindle speed and depth of cut was insignificant. The combination of a medium depth of cut and a medium spindle speed resulted in the minimum Fy1, whereas the maximum Fy1 was obtained at a low depth of cut and a high spindle speed. At medium depth of cut and medium spindle speed, tool edge deflection is avoided, the cutting zone has not yet reached the high-density fiber bundle region, and the cutting temperature is moderate—all of which contribute to the minimum Fy1. In contrast, at low depth of cut and high spindle speed, although the tool does not engage the high-density fiber bundle region, the centrifugal force and vibration of the cutting tool become more pronounced, leading to the maximum Fy1.
Figure 10 reveals the effects of feed rate and depth of cut on cutting forces on bamboo chord surface (Fx1 and Fy1) when the spindle speed was 4000 rpm. Figure 10a shows that the interaction between feed rate and depth of cut was insignificant. The combination of a medium depth of cut and a low feed rate led to the minimum Fx1, and the maximum Fx1 was obtained at a low depth of cut and a high feed rate. This is because the low feed rate reduces the thickness of the undeformed chip, thereby reducing the force required for fiber cutting. Cutting with a medium cutting depth avoids excessive dense fiber bundles, so the Fx1 is the lowest. However, with a high feed rate and low cutting depth, the feed per tooth is large, and the cutting is mainly by impact fracture, resulting in a higher Fx1. Figure 10b expresses that the interaction between feed rate and depth of cut was insignificant. The combination of a high depth of cut and a low feed rate led to the minimum Fy1, and the maximum Fy1 was detected at a medium cutting depth and a high feed speed. At a high cutting depth, the cutting range of the tool simultaneously covers different fiber orientations of the layers. The weak connection of the inter-layer interface reduces the cutting force, while the low feed rate prolongs the cutting contact time, resulting in the minimum Fy1. When the feed rate is high and the cutting depth is moderate, the cutting process concentrates on the same fiber orientation layer, with the cutting force being concentrated and mainly of impact type, leading to the maximum Fy1.

3.4. Optimization of Cutting Forces

3.4.1. Optimal Results

The lower the predicted expected values, the smaller the cutting forces. Table 7 shows the constraints, target settings, lower limit, and upper limit. For optimization, it is important to establish goals for each factor. The goal for the cutting force is to “minimize” it, and the goal for other factors is to keep them “in range” between upper and lower limits.
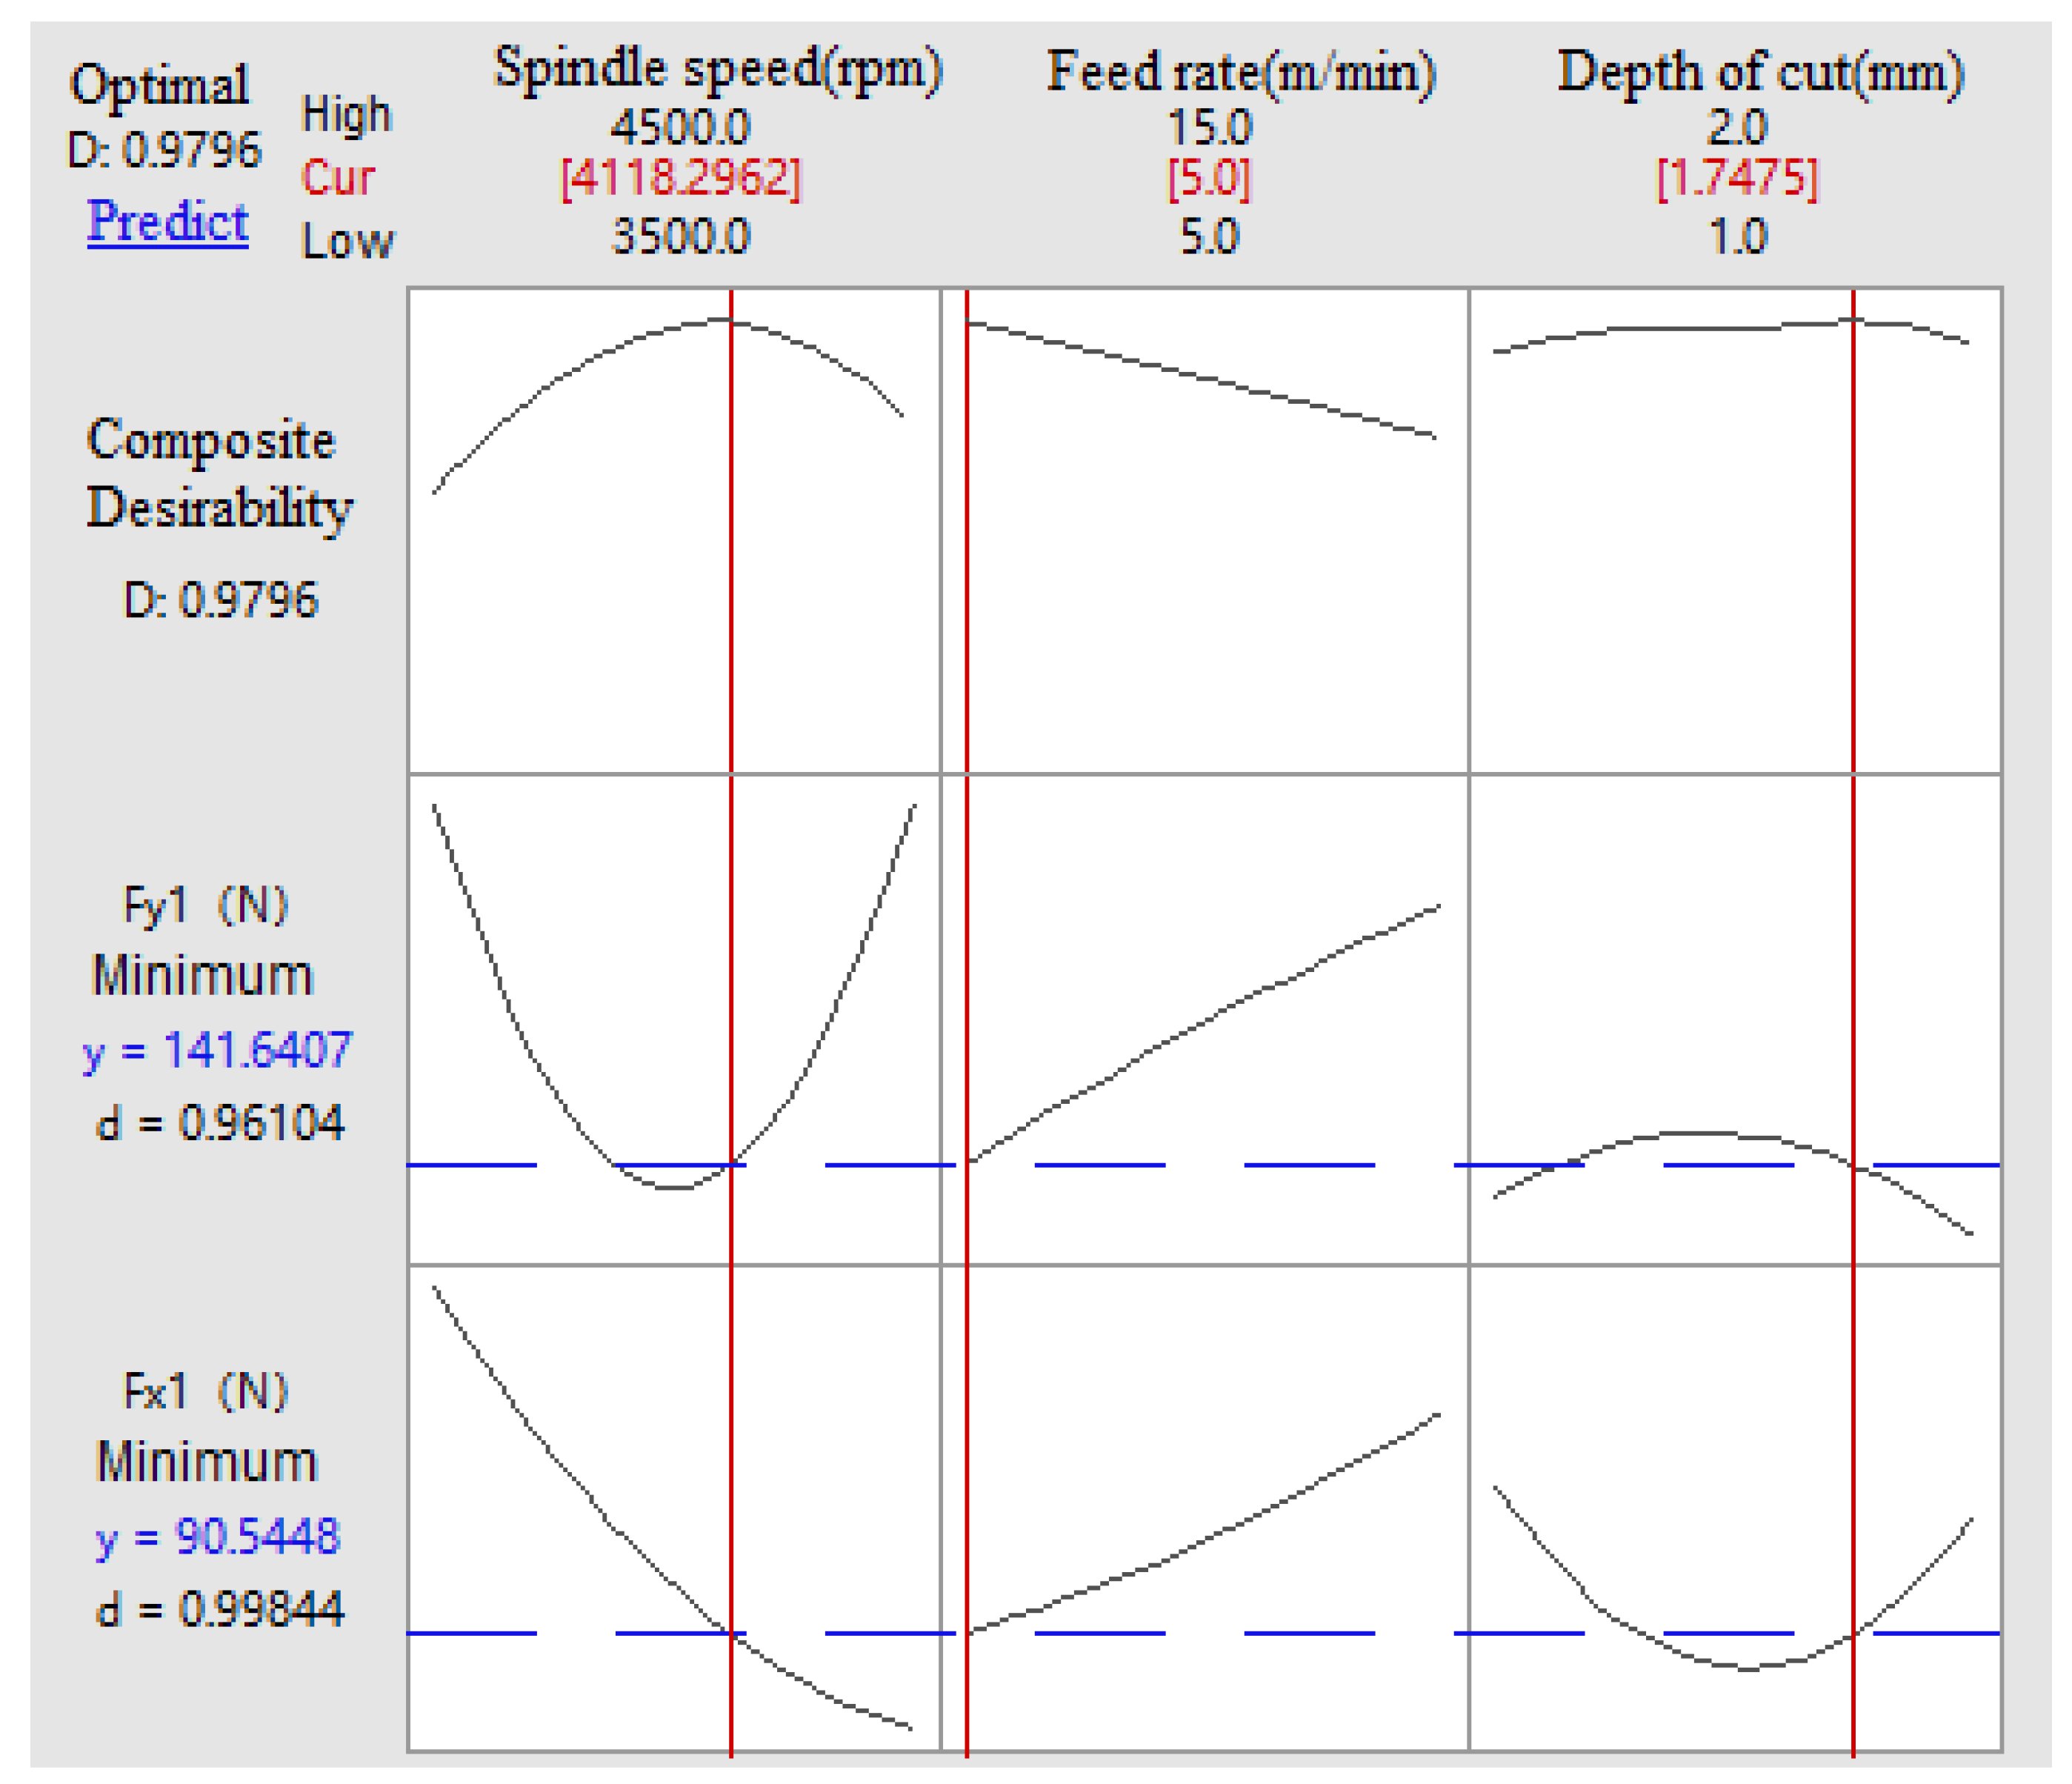
The optimization results are presented in Table 8. The best optimization results for Fx1 and Fy1 were obtained at the spindle speed of 4118.30 rpm, the feed rate of 5.0 m/min, and the depth of cut of 1.75 mm. For the expected values of 90.5448 N and 141.6407 N, the optimization credibilities were 0.998 and 0.961, respectively. The composite credibility was 0.980 (regarded as 1), indicating a good optimization effect (Figure 11).

3.4.2. Test Verification of Cutting Forces

According to the optimized milling parameters of cutting forces, experimental verifications were conducted, and the corresponding results are presented in Table 9. When the bamboo chord surface was milled at a spindle speed of 4118.30 rpm, a feed rate of 5.0 m/min, and a depth of cut of 1.75 mm, the prediction accuracies for Fx1 and Fy1 were 94.65% (test value = 95.66 N and predicted value = 90.54 N) and 94.62% (test value = 149.70 N and predicted value = 141.64 N), respectively. Therefore, the average prediction accuracy was 94.635%.

3.5. Optimization of Surface Roughness and Cutting Forces

3.5.1. Optimal Results

The author previously used the response surface method to study the bamboo chord surface roughness in cutting processing, but the surface roughness and cutting force are equally important. Optimization alone cannot guide the actual bamboo cutting processing well [21]. Both studies used the same materials and the same types of cutting tools, as well as the same spindle speed, feed rate, and range of cutting depths. Therefore, based on previous studies, a comprehensive optimization was carried out for surface roughness and cutting force. The parameter settings for optimizing the cutting force and surface roughness are shown in Table 7.
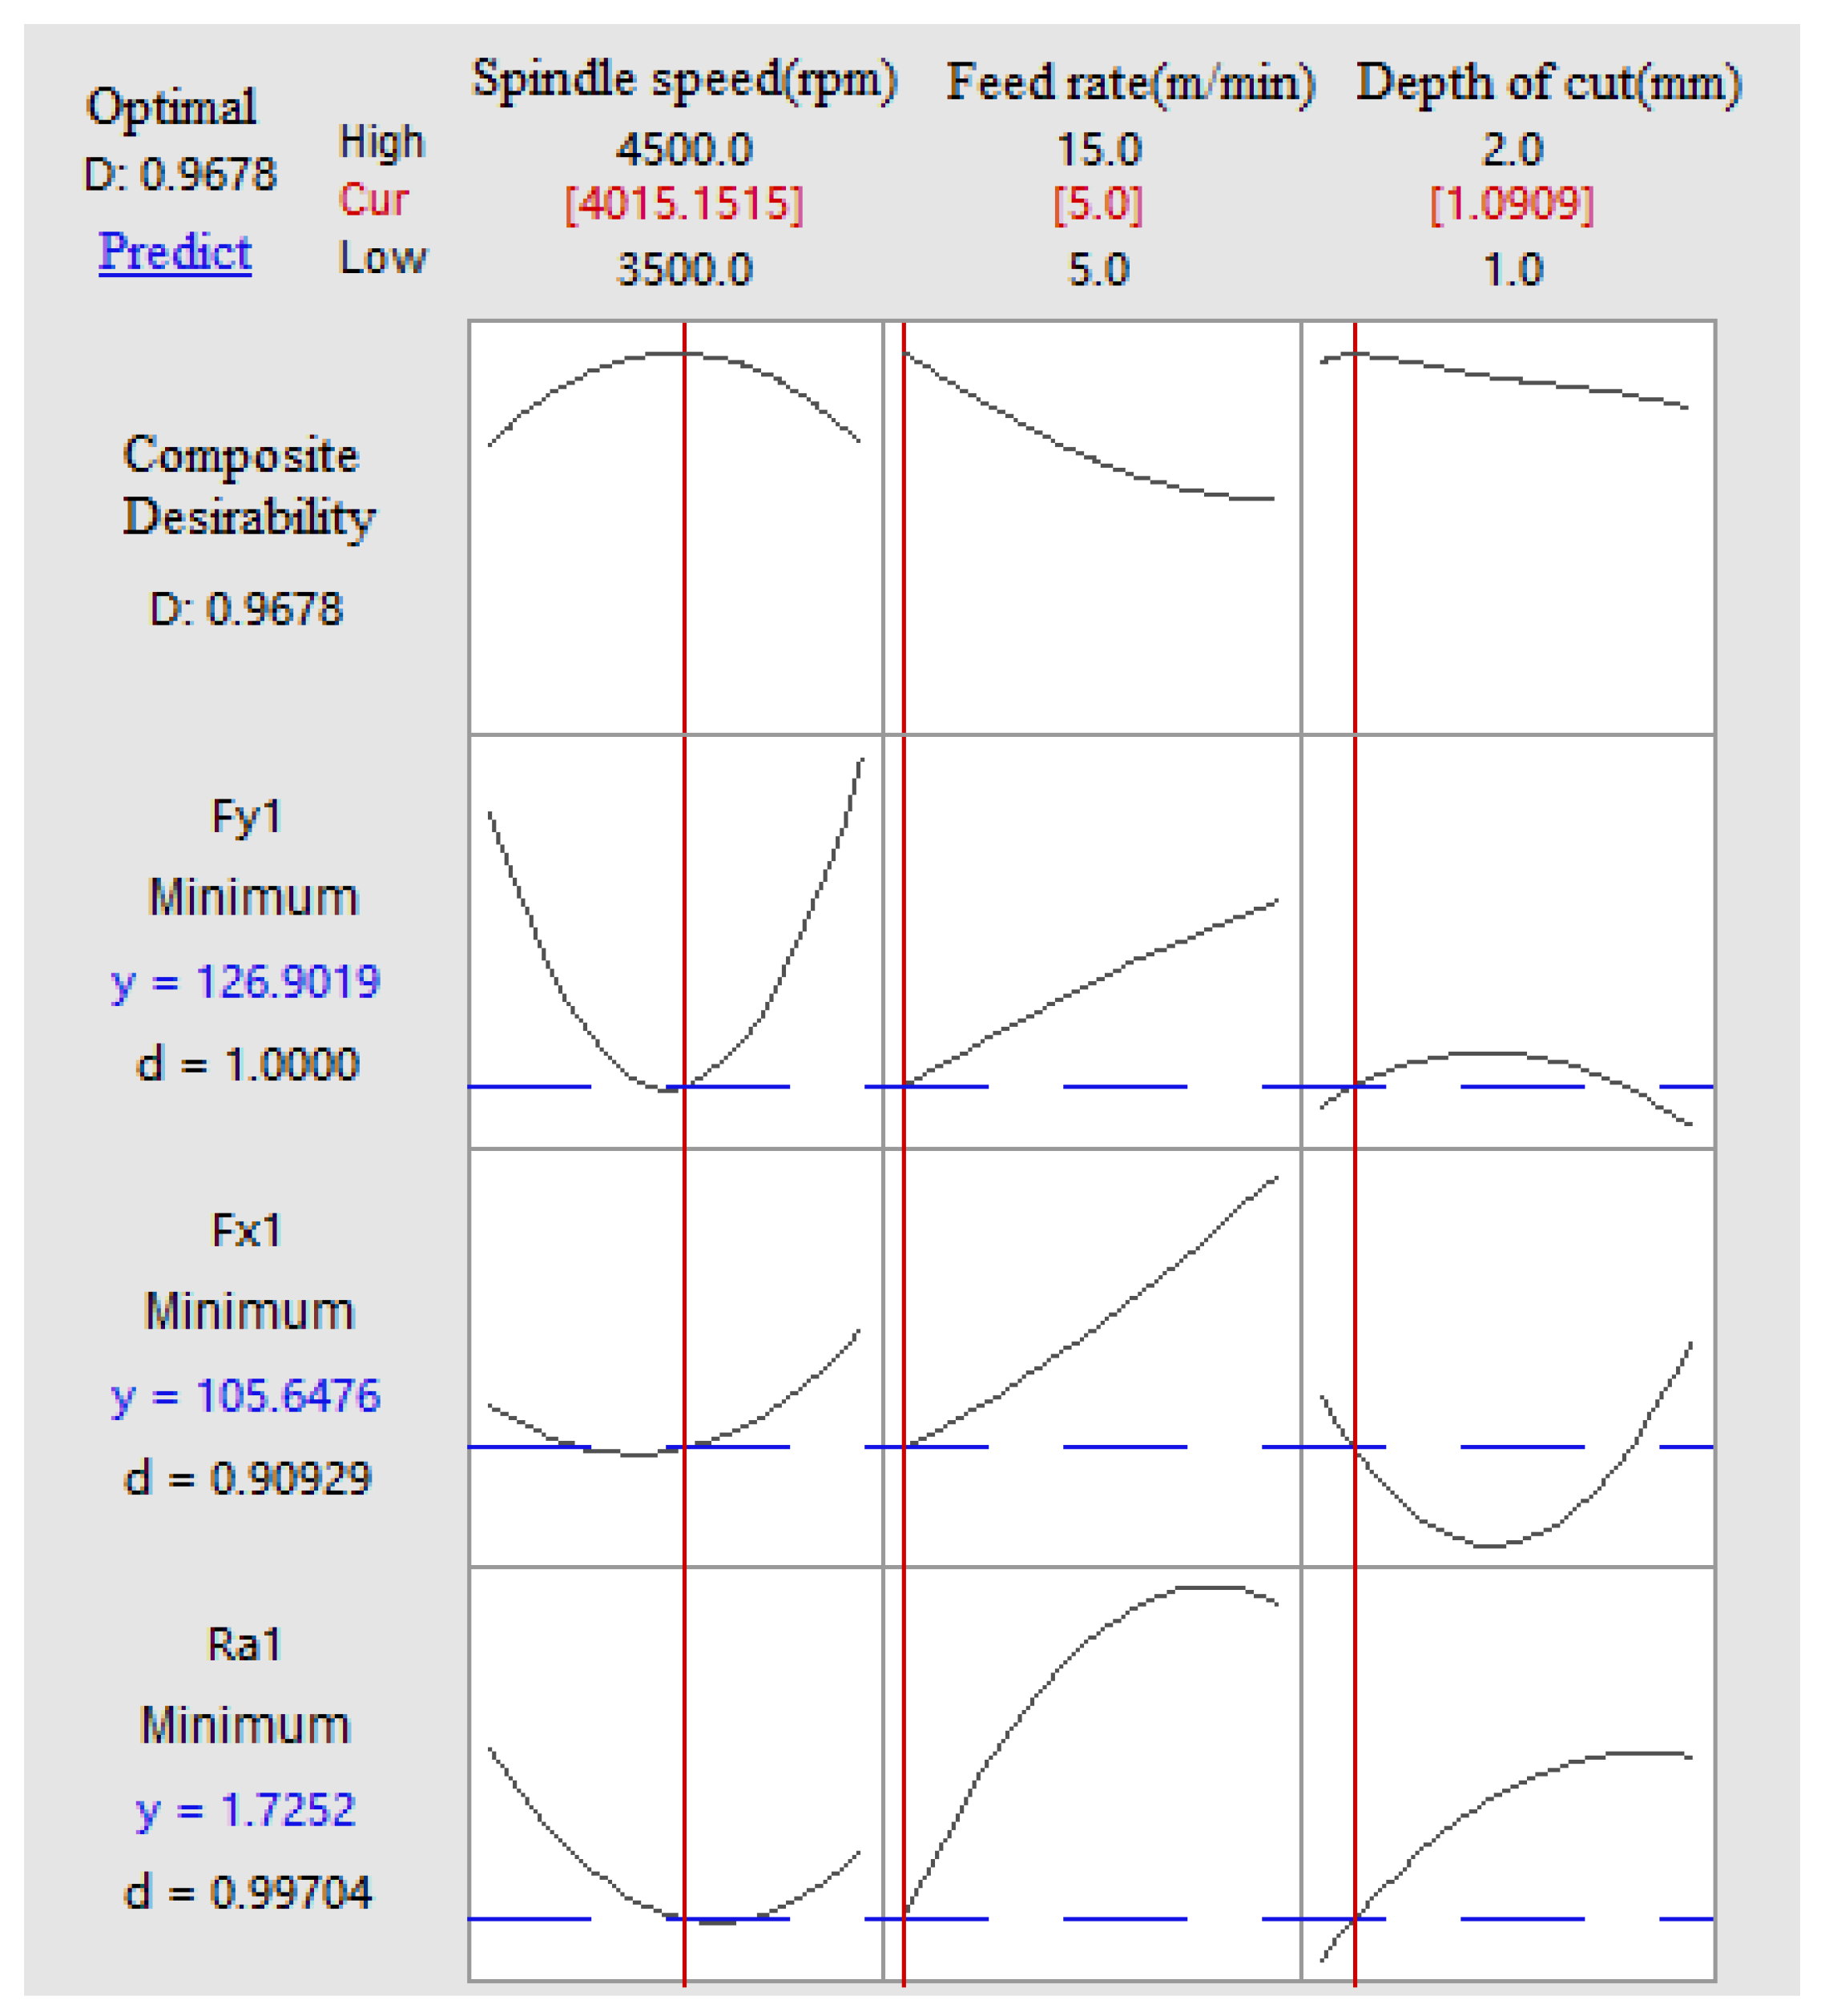
The optimization results are presented in Table 10. The best optimization results for Ra1, Fx1, and Fy1 were obtained at the spindle speed of 4015.15 rpm, the feed rate of 5.0 m/min, and the depth of cut of 1.09 mm. For the expected values of 1.73 μm, 105.65 N, and 126.90 N, the optimization credibilities were 0.997, 0.909 and 1.000, respectively. The composite credibility was 0.9678 (regarded as 1); indicating a good optimization effect (Figure 12).

3.5.2. Test Verification of Comprehensive

The test and verification were conducted based on the optimized cutting parameters presented in Table 10. The experiment was repeated three times to calculate the average value and standard deviation, and the results are shown in Table 11. When the bamboo chord surface was milled at a spindle speed of 4015.15 rpm, a feed rate of 5.0 m/min, and a depth of cut of 1.09 mm, the average test proved that Ra1 = 1.80 μm, SD = 0.03 μm, the predicted Ra1 = 1.73 μm, the prediction accuracy reached 95.84%; the test proved that Fx1 = 108.16 N, SD = 2.05 N, the prediction Fx1 = 105.65 N, the prediction accuracy reached 97.68%; the test proved that Fy1 = 125.43 N, SD = 3.75 N, the prediction Fy1 = 126.90 N, the prediction accuracy reached 98.84%. Therefore, the average prediction accuracy was 97.45%. The optimized results have high accuracy and the standard deviations are relatively small, which can be used to guide actual production.

4. Conclusions

This paper is the first to systematically apply the response surface method and the expected value function to study the influences of different cutting parameters (spindle speed, feed rate, depth of cut) on cutting forces on the bamboo chord surface during bamboo milling. Using variance analysis, the degree of influence of the cutting parameters on the cutting force was determined, and a quadratic mathematical model of the cutting force was successfully established and its reliability was verified. Based on previous studies, we have comprehensively optimized the surface roughness and cutting force. Under experimental conditions, we obtained the optimal combination of cutting parameters that achieved the best cutting performance, and conducted a verification experiment.
The analysis of variance revealed that spindle speed had a significant influence on the transverse cutting force on the bamboo chord surface (Fx1). Feed rate had a significant influence on longitudinal cutting force on the bamboo chord surface (Fy1).
The response surface method was utilized to establish a mathematical model between different cutting parameters and cutting force. The fitting degree was high and the test repeatability was good. It can effectively predict the cutting force response within the specified cutting parameter range.
The bamboo milling process was optimized, and the minimum cutting force was predicted to be obtained under the conditions of spindle speed of 4118.30 rpm, feed rate of 5.0 m/min, and cutting depth of 1.75 mm. The experiment has been optimized and can be used for predicting and optimizing the actual cutting force. Meanwhile, based on previous research, this paper comprehensively considers the surface roughness and cutting force to optimize the bamboo milling process. The minimum surface roughness and the minimum cutting force were predicted to be obtained under the conditions of spindle speed of 4015.15 rpm, feed rate of 5.0 m/min, and cutting depth of 1.09 mm. The minimum values for Ra1, Fx1, and Fy1 were 1.73 μm, 105.65 N, and 126.90 N, respectively. The optimized results have high precision.
The experimental conditions of this study (spindle speed from 3500 to 4500 rpm, feed rate from 5 to 15 m/min, and cutting depth from 0.5 to 1.5 mm), with the test materials and tools employed, can serve as a guide to actual bamboo milling; this study therefore has strong guiding significance. In subsequent work, the research materials will be expanded to other bamboo-based composite materials, and the numerical values of cutting parameters will be further expanded. At the same time, the influence of tool wear on cutting performance such as surface roughness, cutting force, and cutting temperature will also be considered to better simulate the actual cutting processing conditions. In addition, more detailed data feature extraction and integration of cutting performance data will be carried out to provide a possibility for online monitoring of tool wear and processing quality in the future.

Author Contributions

Conceptualization, Y.L. and B.Z.; methodology, Y.L.; software, Y.L.; validation, Y.L. and B.Z.; formal analysis, Y.L.; investigation, Y.L.; resources, J.Z.; data curation, Y.L.; writing—original draft preparation, Y.L.; writing—review and editing, J.Z.; visualization, Z.Z.; supervision, J.Z.; project administration, B.Z.; funding acquisition, J.Z. All authors have read and agreed to the published version of the manuscript.

Funding

This research was funded by Fundamental Research Funds for the Central Public-interest Scientific Institution of the Chinese Academy of Forestry (grant number: CAFYBB2021QC004).

Data Availability Statement

Data is contained within the article.

Acknowledgments

The authors are grateful for the support from Chinese Academy of Forestry and Nanjing Forestry University.

Conflicts of Interest

The authors declare no conflicts of interest.

References

  1. Xhauflair, H.; Pawlik, A.; Gaillard, C.; Forestier, H.; Vitales, T.J.; Callado, J.R.; Tandang, D.; Amano, N.; Dizon, E. Characterisation of the use-wear resulting from bamboo working and its importance to address the hypothesis of the existence of a bamboo industry in prehistoric Southeast Asia. Quat. Int. 2016, 416, 95–125. [Google Scholar] [CrossRef] [Scilit]
  2. Campatelli, G.; Lorenzini, L.; Scippa, A. Optimization of process parameters using a Response Surface Method for minimizing power consumption in the milling of carbon steel. J. Clean. Prod. 2014, 66, 309–316. [Google Scholar] [CrossRef] [Scilit]
  3. Aouici, H.; Yallese, M.A.; Chaoui, K.; Mabrouki, T.; Rigal, J.F. Analysis of surface roughness and cutting force components in hard turning with CBN tool: Prediction model and cutting conditions optimization. Measurement 2012, 45, 344–353. [Google Scholar] [CrossRef] [Scilit]
  4. Li, W.; Zhang, Z.; Peng, X.; Li, B. The influences of circular saws with sawteeth of mic-zero-degree radial clearance angles on surface roughness in wood rip sawing. Ann. For. Sci. 2017, 74, 37. [Google Scholar] [CrossRef] [Scilit]
  5. Camposeco-Negrete, C. Optimization of cutting parameters for minimizing energy consumption in turning of AISI 6061 T6 using Taguchi methodology and ANOVA. J. Clean. Prod. 2013, 53, 195–203. [Google Scholar] [CrossRef] [Scilit]
  6. Chien, S.E.M.; Reddy, M.M.; Lee, V.C.C.; Sujan, D. The study of coated carbide ball end milling tools on inconel 718 using numerical simulation analysis to attain cutting force and temperature predictive models at the cutting zone. Mater. Sci. Forum 2017, 882, 28–35. [Google Scholar] [CrossRef] [Scilit]
  7. Chuchala, D.; Huang, Y.; Orlowski, K.A.; Svensson, M.; Fredriksson, M.; Broman, O. Friction Forces Between Cutting Edge Flanks and Machined Wood Due to the Moisture Content of Scots Pine. In Advances in Wood Machining; Goli, G., Sandak, J., Schajer, G., Zanetti, M., Buonamici, F., Eds.; IWMS 2025; Springer: Cham, Switzerland, 2026; Volume 109. [Google Scholar]
  8. Baranski, J.; Suchta, A.; Vilkovská, T.; Vilkovský, P.; Chuchala, D.; Klement, I.; Orlowski, K. Comparative analysis of drying processes: Moisture content, dimensional stability, and cutting power in beech wood (Fagus sylvatica L.). BioResources 2026, 21, 7541–7557. [Google Scholar] [CrossRef]
  9. Xie, Y.X. Prediction Cutting Force Model of High-speed Milling Hardened Steel by Response Surface Methodology. Modul. Mach. Tool Autom. Manuf. Tech. 2015, 6, 24–27, 32. [Google Scholar]
  10. Helu, M.; Behmann, B.; Meier, H.; Dornfeld, D.; Lanza, G.; Schulze, V. Impact of green machining strategies on achieved surface quality. CIRP Ann. 2012, 61, 55–58. [Google Scholar] [CrossRef] [Scilit]
  11. Subramanian, M.; Sakthivel, M.; Sooryaprakash, K.; Sudhakaran, R. Optimization of Cutting Parameters for Cutting Force in Shoulder Milling of Al7075-T6 Using Response Surface Methodology and Genetic Algorithm. Procedia Eng. 2013, 64, 690–700. [Google Scholar] [CrossRef] [Scilit]
  12. Hafner, R.; Grguraš, D.; Kramar, D. Milling process optimization for the best surface coat adhesion of the rigid polyurethane foam. J. Polym. Eng. 2018, 38, 995–1005. [Google Scholar] [CrossRef] [Scilit]
  13. Zhu, Z.; Cao, P.; Guo, X.; Wang, X.; Zhang, F.; Gao, Y. Machinability of Luxury Vinyl Tiles during Plain Milling Using a Helical Cutter. Materials 2019, 12, 2174. [Google Scholar] [CrossRef] [Scilit] [PubMed]
  14. Aggarwal, A.; Singh, H.; Kumar, P.; Singh, M. Optimizing power consumption for CNC turned parts using response surface methodology and Taguchi’s technique—A comparative analysis. J. Mater. Process. Technol. 2008, 200, 373–384. [Google Scholar] [CrossRef] [Scilit]
  15. Asiltürk, İ.; Neşeli, S. Multi response optimisation of CNC turning parameters via Taguchi method-based response surface analysis. Measurement 2012, 45, 785–794. [Google Scholar] [CrossRef] [Scilit]
  16. Mandal, N.; Doloi, B.; Mondal, B.; Das, R. Optimization of flank wear using Zirconia Toughened Alumina (ZTA) cutting tool: Taguchi method and Regression analysis. Measurement 2011, 44, 2149–2155. [Google Scholar] [CrossRef] [Scilit]
  17. Valarmathi, T.N.; Palanikumar, K.; Latha, B. Measurement and analysis of thrust force in drilling of particle board (PB) composite panels. Measurement 2013, 46, 1220–1230. [Google Scholar] [CrossRef] [Scilit]
  18. Frăţilă, D.F.; Caizar, C. Assessment of Cooling Effect and Surface Quality to Face Milling of AlMg3 Using Several Cooling Lubrication Methods. Mater. Manuf. Processes 2012, 27, 291–296. [Google Scholar] [CrossRef] [Scilit]
  19. Maji, K.; Pratihar, D.K.; Nath, A.K. Experimental investigations and statistical analysis of pulsed laser bending of AISI 304 stainless steel sheet. Opt. Laser Technol. 2013, 49, 18–27. [Google Scholar] [CrossRef] [Scilit]
  20. Zhu, Z.; Buck, D.; Wu, Z.; Yu, Y.; Guo, X. Frictional behaviour of wood-Plastic composites against cemented carbide during sliding contact. Wood Mater. Sci. Eng. 2022, 18, 1127–1133. [Google Scholar] [CrossRef] [Scilit]
  21. Liu, Y.; Zhou, J.; Fu, W.; Zhang, B.; Chang, F.; Jiang, P. Study on the effect of cutting parameters on bamboo surface quality using response surface methodology. Measurement 2021, 174, 109002. [Google Scholar] [CrossRef] [Scilit]
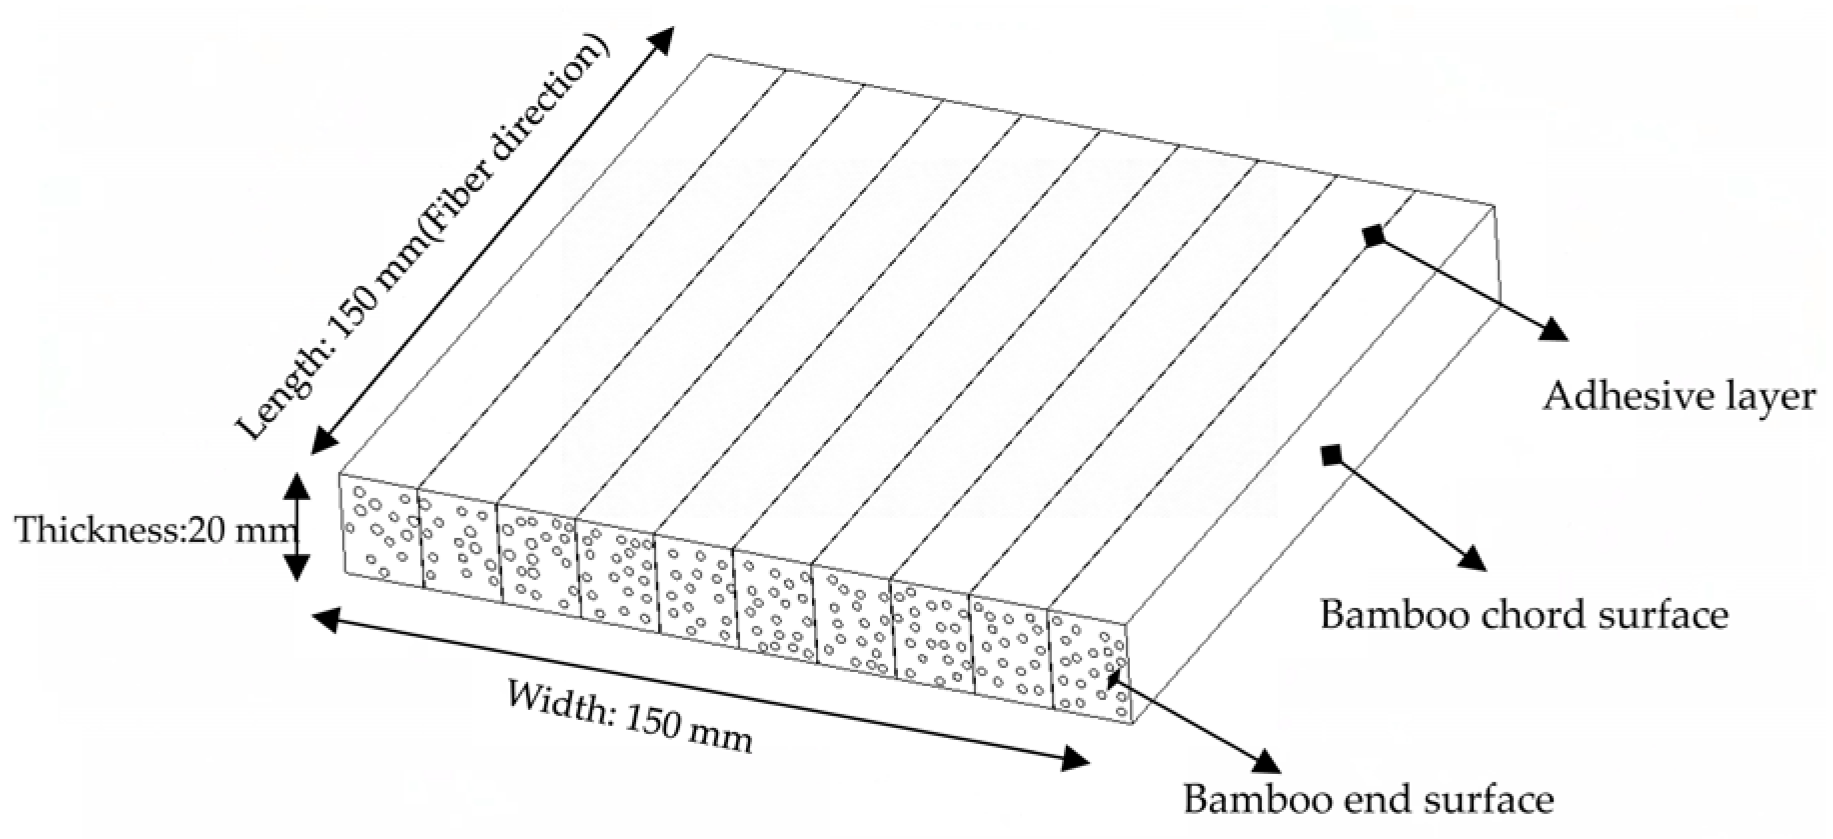
Figure 1. Bamboo plywood workpiece.
Coatings 16 00977 g001
Figure 2. Test tool.
Coatings 16 00977 g002
Figure 3. SMART five-axis machining center.
Coatings 16 00977 g003
Figure 4. Measuring system for cutting forces.
Coatings 16 00977 g004
Figure 5. Schematic diagram of cutting forces.
Coatings 16 00977 g005
Figure 6. Plots of residuals for Fx1 values: (a) Normal Plot of Residuals, (b) Residuals vs. Predicted, (c) Residuals vs. Run and (d) Predicted vs. Actual.
Coatings 16 00977 g006
Figure 7. Plots of residuals for Fy1 values: (a) Normal Plot of Residuals, (b) Residuals vs. Predicted, (c) Residuals vs. Run and (d) Predicted vs. Actual.
Coatings 16 00977 g007
Figure 8. Effect of spindle speed and feed rate on cutting forces of bamboo chord surface (d = 1.50 mm): (a) Fx1 and (b) Fy1.
Coatings 16 00977 g008
Figure 9. Effect of spindle speed and depth of cut on cutting forces of bamboo chord surface (f = 10 m/min): (a) Fx1 and (b) Fy1.
Coatings 16 00977 g009
Figure 10. Effect of feed rate and depth of cut on cutting forces of bamboo chord surface (n = 4000 rpm): (a) Fx1 and (b) Fy1.
Coatings 16 00977 g010
Figure 11. Response optimization plot for Fx1 and Fy1.
Coatings 16 00977 g011
Figure 12. Response optimization plot for bamboo chord surface Ra1, Fx1 and Fy1.
Coatings 16 00977 g012
Table 1. Cutting parameters and levels.
Process ParametersSymbolLevelCode
Spindle speed (rpm)n3500−1
40000
45001
Feed rate (m/min)f5−1
100
151
Cutting depth (mm)d1−1
1.50
21
Table 2. Experimental scheme [21].
RunCoded Values
Spindle Speed (rpm)Feed Rate (m/min)Depth of Cut (mm)
1000
2110
30−11
41−10
5000
6000
7−101
80−1−1
9000
10000
11101
12011
13−110
14−1−10
1510−1
1601−1
17−10−1
Table 3. Cutting force test Results.
RunReal ValuesExperimental Results
Spindle Speed (rpm)Feed Rate
(m/min)
Depth of Cut
(mm)
Fx1
(N)
Fy1
(N)
14000101.5106.38195.32
24500151.5112.54497.33
3400052.0113.96127.22
4450051.592.48292.18
54000101.5112.73188.29
64000101.5111.28198.54
73500102.0259.7301.98
8400051.0123.46149.84
94000101.5106.08189.18
104000101.5114.36192.81
114500102.090.28314.59
124000152.0168.04156.37
133500151.5190.76320.31
14350051.5121.26239.77
154500101.0133.62338.55
164000151.0181.56186.63
173500101.0150.02283.84
Total average of Fx1: 134.618 N; Fy1: 245.456 N.
Table 4. Variance analysis of horizontal cutting forces of bamboo chord surface Fx1.
SourceSum of SquaresDFMean SquareF-ValueProbCont.%Remarks
Model28,465.64693162.8511.6830.0019 Especially Significant
n10,717.944110,717.94439.5890.000435.72Especially Significant
f5087.37815087.37818.7910.003416.95Especially Significant
d234.5781234.5780.8660.38290.78Not Significant
n × f611.0781611.0782.2570.17672.04Not Significant
n × d5853.7815853.7821.6220.002319.51Especially Significant
f × d4.0414.040.0150.90620.01Not Significant
n2994.9411994.9413.6750.09683.32Not Significant
f258.33158.330.2150.65660.19Not Significant
d24548.37814548.37816.80.004615.16Especially Significant
Residual1895.1177270.731 6.32
Cor Total30,360.76316 100.00
Table 5. Variance analysis of longitudinal cutting forces of bamboo chord surface Fy1.
SourceSum of SquaresDFMean SquareF-ValueProb.Cont.%Remarks
Model128,142.865914,238.09610.3060.0028 Especially Significant
n11,007.57111,007.577.9680.02577.87Significant
f15,455.457115,455.45711.1870.012311.05Significant
d430.7111430.7110.3120.5940.31Not Significant
n × f3881.91313881.9132.810.13762.77Not Significant
n × d443.1021443.1020.3210.58890.32Not Significant
f × d14.592114.5920.0110.9210.01Not Significant
n294,291.787194,291.78768.2517.42 × 10−567.44Especially Significant
f2108.5621108.5620.0790.78730.08Not Significant
d24511.98614511.9863.2660.11373.23Not Significant
Error9670.78371381.54 6.92
Cor Total137,813.64816 100
Table 6. Model analysis for cutting forces of bamboo chord surface Fx1 and Fy1.
ModelStd. Dev.MeanC.V.%R-SquaredAdj R-Squared
Fx116.454134.61812.2230.9380.857
Fy137.169245.45615.1430.9300.840
Table 7. Goals and parameter ranges for optimization of cutting conditions.
ConditionGoalUpper LimitLower Limit
n (rpm)To be in range45003500
f (m/min)To be in range155
d (mm)To be in range21
Fx1 (N)To minimize259.7090.28
Fy1 (N)To minimize497.33127.22
Ra (μm)To minimize3.491.72
Table 8. Response surface optimization results of Fx1 and Fy1.
ResponseSpindle Speed
(rpm)
Feed Rate
(m/min)
Depth of Cut
(mm)
PredictedDesirability
Fx14118.305.01.7590.540.998
Fy1141.640.961
Table 9. Responsive test verification results of Fx1 and Fy1.
ResponseTest Value 1Test Value 2Test Value 3Average
Test Value
SDPrediction
Accuracy
Fx198.4891.4897.0295.663.6994.65%
Fy1152.85147.13149.12149.702.9094.62%
Table 10. Response surface optimization results of Ra1, Fx1 and Fy1.
ResponseSpindle Speed
(rpm)
Feed Rate
(m/min)
Depth of Cut
(mm)
PredictedDesirability
Ra14015.155.01.091.730.997
Fx1105.650.909
Fy1126.901.000
Table 11. Responsive test verification results of Ra1, Fx1 and Fy1.
ResponseTest Value 1Test Value 2Test Value 3Average
Test Value
SDPrediction
Accuracy
Ra11.831.781.791.800.0395.84%
Fx1106.68110.5107.3108.162.0597.68%
Fy1127.49121.1127.7125.433.7598.84%
Disclaimer/Publisher’s Note: The statements, opinions and data contained in all publications are solely those of the individual author(s) and contributor(s) and not of MDPI and/or the editor(s). MDPI and/or the editor(s) disclaim responsibility for any injury to people or property resulting from any ideas, methods, instructions or products referred to in the content.