Abstract
A systematic investigation was conducted on the laser shock forming (LSF) process of carbon steel Q355ME sheets and practical skin components, focusing on the influence of absorption layer types, laser energy, and impact cycles on forming capacity and surface properties. Three kinds of absorbing layers were compared in the experiment: no absorbing layer, 0.1 mm aluminum foil and 0.12 mm black tape. The results show that when the black tape is used as the absorbing layer, the forming effect is the best, the arc height value reaches 2.63 mm, and the radius of curvature is 1066 mm. Using 0.1 mm thick black tape as the absorption layer and laser parameters of 10% overlap rate, 15 ns pulse width, 4 mm spot, and 1064 nm wavelength, the single impact of 13 J, 15 J, and 17 J, and one, two, and three impacts of 15 J energy were carried out on the plate. It was found that the increase in laser energy and impact times resulted in increases in deformation, surface roughness, microhardness, and residual stress of the plate. The surface work hardening phenomenon of Q355ME plate after laser shock slowed down the increase in these performance parameters. The experimental results show that the laser energy is linearly positively correlated with the residual stress in a certain energy range. Under the optimized laser process parameters, the forming error of the actual skin parts is controlled within ± 0.4 mm, the surface residual stress increases by 368.9%, and the surface microhardness increases by 10.4%. The ultra-high strain plastic deformation and grain refinement on the surface of the sheet were caused by multiple laser shock peenings, which confirmed that LSF technology can improve the formability of carbon steel skin parts and improve its surface properties.
1. Introduction
Q355ME carbon steel is a new grade of low-alloy high-strength structural steel, which is widely used in the fields of ships, vehicles, and construction with its high strength and excellent plasticity [1,2]. Carbon steel, as a traditional power train head skin material, with the advantages of high quality and low price, is still used in the production of power train skins nowadays. For small-lot and multi-variety customized models, previous forming methods such as die stamping and molding are costly and have long production cycles [3,4]. Therefore, there is an urgent need for a new skin-forming method.
Laser shock forming (LSF) is a new type of sheet metal forming technology; its basic principle is shown in Figure 1. The fundamental process involves directing a high-power, short-pulsed laser through a water-based constraint layer onto an absorption layer pre-bonded to the sheet surface. The laser interacts with the absorption layer, triggering rapid ionization and vaporization to generate plasma shock waves. Confined by the constraint layer, these shock waves exert localized pressure (typically 1–10 GPa over nanoseconds) on the sheet surface, inducing plastic deformation. By sequentially applying laser impacts along a predetermined path, cumulative strain accumulates, enabling controlled shaping of the entire sheet [5,6].
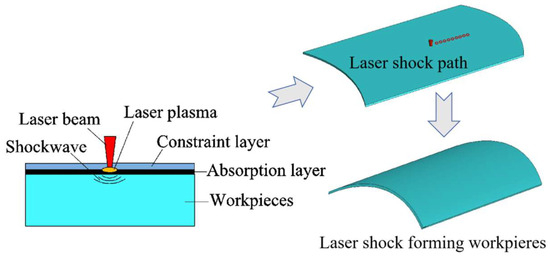
Figure 1.
Schematic diagram of LSF.
Some scholars have conducted experimental research on laser shock forming of metal plates. Li Kangmei et al. [7] based on the residual stress distribution on the surface of TC4 material after LPF treatment, inferred that the reflection waves transmitted along the material surface formed a dispersive wave, leading to the formation of residual tensile stress at the center of the specimen’s impacted surface. Laser shock forming of 7075 aluminum alloy found that increasing the laser energy, spot overlap rate, and the number of shocks increases the deformation of the plate [8]. Sala et al. [9] conducted laser shock forming experiments on Ti-6Al-4V plates without an absorbing layer. The results showed that as the laser power density and the number of shocks increased, the surface roughness of the plates increased accordingly; in addition, small microcracks were found in the near-surface region, and the average crack length increased with the increase in laser power density. Man et al. [10] performed laser shock forming on foil materials using low-intensity nanosecond UV laser technology. Experimental data revealed that low-intensity laser pulses can effectively reduce the likelihood of foil fracture. Further analysis indicated that with the increase in laser pulse energy, the forming depth of the foil experienced a process of initially increasing and then decreasing. Xingquan Zhang et al. [11] achieved precise forming of a 2024 aluminum alloy disk into a flat-bottomed cup through two-stage laser shock forming. They investigated the microstructural evolution in detail using scanning electron microscopy (SEM) and electron backscatter diffraction (EBSD). It was found that as the strain of the metal sheet increased, there was a transition from small-angle grain boundaries and high dislocation density to large-angle grain boundaries and low dislocation density. This resulted in an improvement in strength and plasticity of the treated material compared to the untreated material. Maharjan, N et al. demonstrated that due to the thermal effect of the laser, which facilitates oxygen diffusion, uncoated laser shock peening (LSP) forms a thin oxide layer on the material surface composed of titanium dioxide (TiO2) and aluminum oxide (Al2O3), and simultaneously generates a brittle alpha layer approximately 5–8 μm thick. After removing the alpha layer by abrasive grinding, the fatigue life of the material increased by almost 9 times compared to samples only subjected to uncoated LSP. The results indicate that uncoated LSP of Ti6Al4V alloy must be combined with a post-cleaning step to achieve a significant improvement in its fatigue life [12]. X Huang et al. [13] investigated the elastic–plastic deformation of the metal surface after laser shock forming and established the influence law of different forming process parameters on the shape of the parts. The results show that thickness is the main factor affecting the curvature radius of the shock zone. Liu et al. [14] studied the effect of laser process parameters on the amount of forming and surface quality of thick aluminum alloy plates. The results showed that plate deformation increases with the increase in the laser energy and the number of impacts, and surface roughness is positively correlated with the laser energy. However, increasing the number of laser shocks results in a more uniform degree of plastic strain on the plate surface. Zhang et al. [15] applied anisotropic characteristic strain on the thin plate model to predict the residual stress distribution in the length and width directions. Ye et al. [16] studied the effect of bending moment on the bending of 6061-T6 aluminum alloy plates during laser shock forming. It was revealed that the properties of material bending moments do not change as a function of the treatment area and spot overlap rate. But the size of the bending moment increases with the increase in the treated area and spot overlap rate, and the bending moment becomes larger, which in turn makes the plate deformation larger. Keller et al. [17] investigated the effect of different laser process parameters on the residual stresses in aluminum alloy AA2198. Research indicated that with the increase in the laser power density, the residual compressive stress on the surface of the laser-induced target increases, and the increase in the thickness of the target has less effect on the surface residual stress.
At present, the research on laser shock forming for metal materials is mostly on titanium alloys and aluminum alloys. However, there are few reports on the formation of carbon steel materials and surface quality. This work takes Q355ME carbon steel as the research object and determines the absorption layer through experimental comparative analysis. Based on this, it analyzes the influence of laser energy and the number of shocks on the deformation and surface quality of the plate, and finally examines the laser shock forming of the actual skinned parts.
2. Experimental Materials and Methods
The absorption layers used in this experiment were all from 3M company in the Saint Paul, Minnesota, United States. The Q355ME carbon steel plate with a size of 150 mm × 30 mm × 3 mm was used in the experiment. Wipe the surface to be treated with an anhydrous ethanol solution. Black tape and aluminum foil were selected as the absorbing layer, and deionized water with a thickness of 1 ~ 2 mm was selected as the constraint layer. Among them, the thickness of black tape is 0.12 mm, and the thickness of aluminum foil is 0.1 mm.
The plate is clamped unilaterally, as shown in Figure 2, the length of the clamping area is 20 mm. In order to make the plate impact along the central symmetrical area, the laser shock processing area is the middle 110 mm × 30 mm area, and the spot scanning direction is defined as the Y-axis direction, the robot arm stepping direction is the X-axis direction, and the laser shock path is ‘S’ shape.
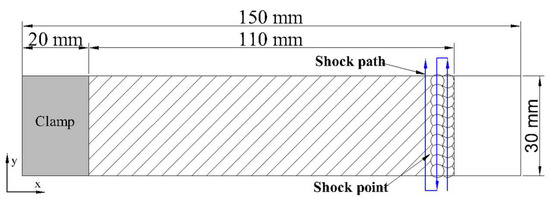
Figure 2.
Schematic diagram of plate laser shock forming.
The laser shock forming experiment was carried out using an Nd: YAG laser with a flat-top distribution of output energy with the following basic parameters: pulse width of 10–20 ns, a wavelength of 1064 nm, adjustable single-pulse energy in the range of 2–30 J, and a laser repetition frequency of 1–5 Hz. In this work, a laser with a pulse frequency of 5 Hz was selected for the molding experiments.
The schematic diagram of the bending deformation in the plate after laser shock forming is shown in Figure 3. The thickness of the carbon steel plate is denoted as z. The unshocked plate serves as the reference plane. After bending, the radius of curvature is R, and the arc height is h. The maximum distance between the bent plate and the reference plane is H. These parameters (h and R) are used to quantify the bending deformation extent of the plate.
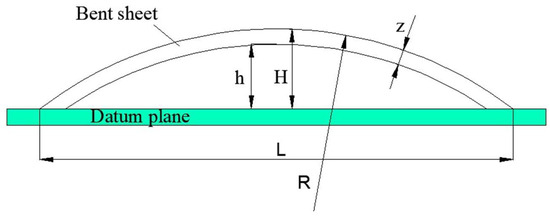
Figure 3.
Schematic diagram of deformation measurement of formed plates.
The following tests were conducted on the formed sheet metal after laser shock treatment:
- Point cloud data of the formed sheet metal were obtained using a Creaform handheld 3D laser scanner, and the data were imported into the Polyworks 2020 software to obtain the coordinate points of the center line of the sheet metal width.
- The surface topography and roughness of the formed part were measured using a white light interferometer under a 5x objective lens over a surface area of 7 × 7 mm2. The surface roughness can be directly obtained with a white light interferometer.
- The microhardness of the surface of the formed part was measured using an HVS-1000 type microhardness tester, with measurements taken at 5 points spaced 2 mm apart along the X-axis.
- Surface residual stress of the formed part was measured using an LXRD-type X-ray stress gauge from the Proto company along the central line of length (Y-axis direction) at intervals of 2 mm, with a total of 5 measurement points.
- Pole figures, grain boundary maps, and grain boundary misorientation distributions on the surface of the formed part were obtained using electron backscatter diffraction (EBSD) technology.
3. Experimental Results and Analysis
3.1. Influence of Absorbing Layers on Formed Plates
Using 15 J laser energy, a spot diameter of 4 mm, and a laser process parameter of 10% overlap rate, the plate was shocked once. Different absorption layer conditions under the conditions of laser shock forming plate surface are shown in Figure 4. The deformation is shown in Figure 5. It can be seen that after the shock of a 3 mm thick carbon steel plate covered with different absorbing layers, the plate shows convex deformation relative to the direction of laser incidence.
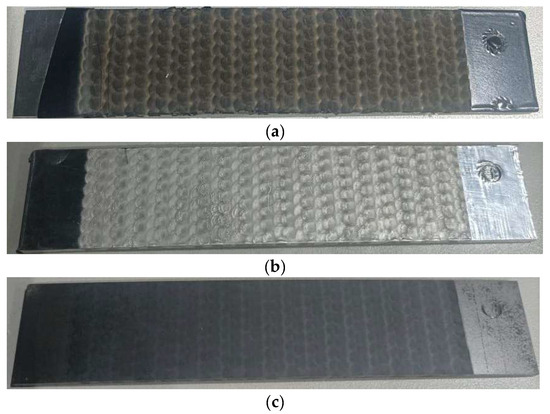
Figure 4.
Surface of plates with different absorption layers: (a) black tape; (b) Al foil; (c) none.
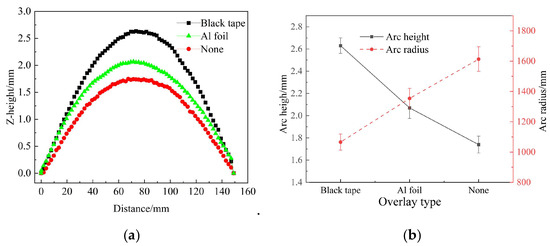
Figure 5.
Deformation of the plate under different cover absorbing layers: (a) centerline displacement; (b) arc height values and radius of curvature.
The LSF sheets with black tape and aluminum foil as absorbing layers obtained arc height values of 2.63 mm and 2.07 mm, and radius of curvature of 1066 mm and 1354 mm, while the final arc height and radius of curvature of the LSF sheets without the absorbing layer were only 1.74 mm and 1613 mm. In the same case, compared with the LSF sheets with black tape as the absorbing layer, the aluminum foil and the LSF sheets without the absorbing layer had 21.3% and 33.8% less deformation, respectively. Black ablation appears on the surface of the metal samples without an absorbing layer, but no ablation occurs in the plate with an absorbing layer, and the amount of deformation is larger. This is because the energy absorption efficiency is high when the black tape is used as the absorbing layer. The surface of the aluminum foil has a reflection effect on the incident laser light, which reduces the absorption rate of the energy. However, in non-absorbing plates, the laser energy is absorbed less efficiently, so that the plate is less distorted. Finally, it is preferred to use black tape as the absorbing layer.
3.2. Effect of the Number of Laser Shock Forming Plates
Under the premise of ensuring that the black tape is not broken, the selected process parameters are laser energy 15 J (power density: 7.96 GW/cm2), a spot overlap rate of 10%, and a spot diameter of 4 mm. In total, 1, 2, and 3 shocks were performed on the plate shock, respectively. The formed plate is shown in Figure 6. The point cloud data of the plate to extract the deformation is shown in Figure 7a, and the arc height value and radius of curvature are shown in Figure 7b. From the figure, it can be seen that the carbon steel plate after 3 mm has a convex deformation after laser shock.
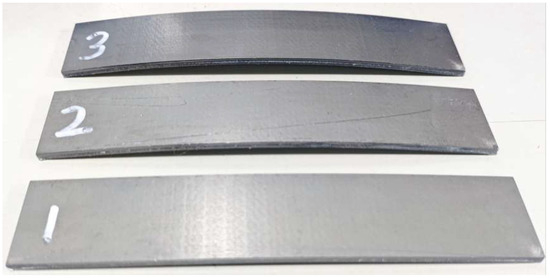
Figure 6.
LSF plates with different numbers of shocks.
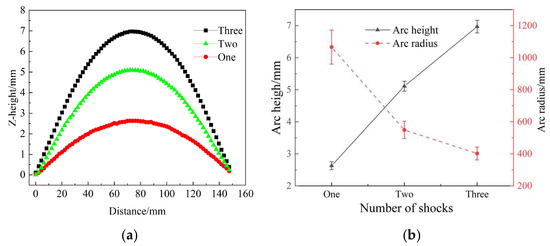
Figure 7.
Deformation of the plate under different numbers of laser shocks: (a) centerline displacement; (b) arc height values and radius of curvature.
After three consecutive laser shocks, the arc height of the plate increased sequentially to 2.63 mm, 5.11 mm, and 6.97 mm. The incremental gain in arc height diminished progressively with additional shocks, specifically 2.63 mm after the first shock, 2.48 mm after the second, and 1.86 mm after the third, indicating a diminishing enhancement effect with successive laser impacts.
The deformation of the plate increases progressively with the number of laser shocks, driven by the cumulative effect of residual compressive stress generated from repeated impacts within the same region. However, the increments in both the arc height and radius of curvature of the formed plate diminish successively with additional shocks. This attenuation is attributed to the work-hardening effect induced by prior impacts, which elevates surface hardening and reduces the plastic deformation increment of the material during subsequent impacts, ultimately leading to a gradual decline in deformation efficiency.
Figure 8 shows the variation in surface morphology and surface profile of the carbon steel plate with different numbers of shocks. Figure 9 shows the variation in surface roughness of the material. From Figure 8b, it can be seen that the surface plastic deformation forms a light spot indentation [18], which is related to the energy distribution of the flat-top laser (Figure 10) and the strength and hardness of the plate [19].
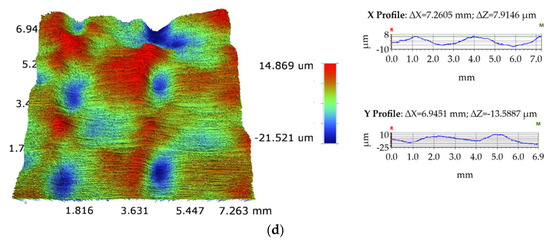
Figure 8.
Surface morphology and surface profile of plates with different numbers of laser shocks: (a) untreated; (b) one; (c) two; (d) three.
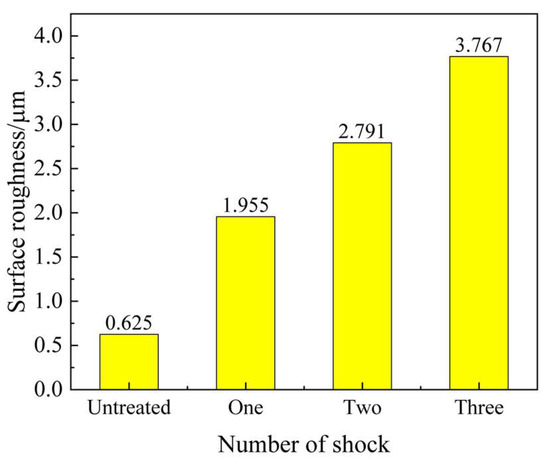
Figure 9.
Surface roughness of plate with different number of laser shocks.
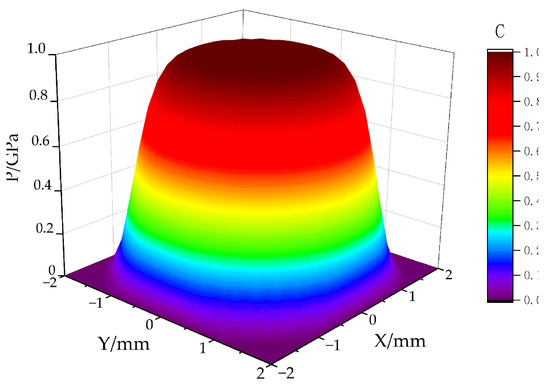
Figure 10.
Flat-top laser energy distribution.
A Gaussian laser beam is a common laser beam with uneven energy distribution. The pressure of the shock wave induced by the Gaussian beam is higher than the average level in the central region. The plastic deformation caused by the shock wave of a Gaussian distribution has a certain peak. The energy distribution of the flat-top beam is more uniform, and a shock wave with good flatness can be generated when the laser impacts the plate so that the shock wave pressure acting on the spot area is more uniform [20,21].
Gaussian distribution shock wave pressure:
Estimated value of flat-top distribution shock wave pressure:
In the formula, P(r) is the pressure at a certain position at any time; Pn is the peak pressure of the shock wave of a Gaussian distribution laser; Rs is the energy rise rate of the Gaussian-distributed laser. Pm is the peak pressure of shock wave of a flat-top distribution laser; I is the power density of the laser; Z is the reduced impedance; and α is the efficiency coefficient.
It can be seen from Figure 9 that the depth of the pits acting on the surface of the plate is relatively uniform, and the depth of the pits at the center of the spot is close to that at the edge of the spot, which conforms to the law of flat-top beam distribution.
The depth of the indentation at the light spot lap position becomes larger, and the center position of the light spot is non-uniform in depth due to the effect of the sparse wave of the laser-induced shock wave. With the increase in the number of shocks, the depth of the spot indentation on the surface of the plate increases, and the degree of fluctuation of the surface contour increases. The surface roughness of the plate was 1.955 μm, 2.791 μm, and 3.767 μm after 1, 2, and 3 shocks, respectively. When the plate is impacted many times, the same area is impacted many times due to the spot overlap, and the spot indentation repeats to gradually deepen the degree of surface depression, which leads to an increase in the surface roughness of the material. The increase in roughness after three times shocks is 1.955 μm, 0.836 μm, and 0.967 μm, respectively. The increase shows a trend of increasing and then decreasing. On the one hand, after the first laser shock, the surface hardness of the plate is significantly improved, and the phenomenon of work hardening occurs. When the same laser process parameters are used again, the indentation formed on the surface is also obviously shallow, and the increase in roughness is reduced. On the other hand, because of the spot radiation shock to the surface of the plate, the free state of the plate produces bending deformation, unloading part of the force. The positioning accuracy of repeated clamping of the plate during the experiment also affects the alignment accuracy of the spot, which leads to a decreasing trend in the increase in roughness.
Figure 11 shows the variation in microhardness of carbon steel plates after different times of shock. The average value of microhardness of the unshocked plate is 212.4HV. After 1, 2, and 3 shocks, the microhardness of the plate surface was 226.9 HV, 233.1 HV, and 237.8 HV, respectively, which increased by 13.4 HV, 6.2 HV, and 4.7 HV, respectively, compared with that of unshocked plates. With the increase in the number of shocks, the dislocation density and grain refinement on the surface of the formed plate gradually intensify, which leads to an increase in the surface microhardness and improves the resistance to plastic deformation of the plate, resulting in a gradual decrease in the increase in the amount of plate deformation.
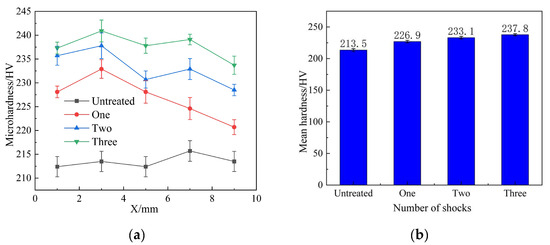
Figure 11.
Surface microhardness of formed plates after different numbers of shocks: (a) microhardness in different positions; (b) average microhardness.
Figure 12 shows the effect of different numbers of shocks on the residual stress on the surface of the carbon steel Q355ME-formed plate. From Figure 12a, the average residual stresses on the surface of the formed plate after 1, 2, and 3 shocks are −272.69 MPa, −355.42 MPa, and −403.59 MPa, respectively. Residual stress on the surface −69.34 MPa increased to −272.69 MPa after one shock treatment of the plates. With the increase in the number of shocks, the induced surface residual stress gradually increased, and the deformation of the plate also increased accordingly. The increase in the residual stress after three shocks is 80.73 MPa and 50.17 MPa, respectively. The increase in surface residual stress decreases gradually, and so does the increase in plate deformation.
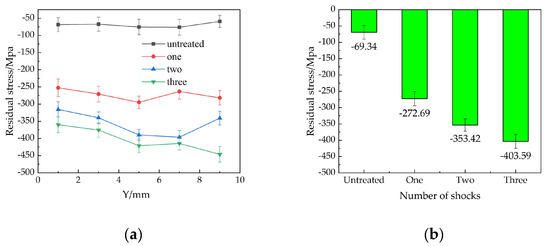
Figure 12.
Residual stresses on the surface of formed plates after different numbers of shocks: (a) residual stresses at different positions; (b) average residual stress.
3.3. Effect of Laser Energy on Plate Deformation
The laser shock forming of the sheet was carried out by selecting the laser process parameters with laser energy of 13 J, 15 J and 17 J, spot diameter of 4 mm and spot overlap rate of 10%, respectively. The sample after impact is shown in Figure 13. Figure 14 shows the deformation of the plate after shock with different laser energies. With the increase in the laser energy, the deformation of the plate increases. When the energy is 13 J, the plate deformation is the smallest, and the isolation value and the radius of curvature are 2.28 mm and 1233 mm, respectively. When the energy is 15J, the isolation value and the radius of curvature of the plate are 2.63 mm and 1066 mm, respectively. When the laser energy is 17 J, the plate has the maximum deformation, and the isolation value and the radius of curvature are 3.49 mm and 802 mm, respectively. According to the Fabbro formula [22], it can be seen that as the laser energy increases, the laser power density will also increase. The shock load borne by the plate will increase, and the increase in power density will lead to accelerated expansion of the plasma, which in turn produces a more violent shock wave. This causes a greater degree of plastic deformation of the plate, introducing a greater degree of residual compressive stresses on the surface of the plate, thus forming a greater stress in the direction of the thickness gradient [23], eventually causing greater deformation.
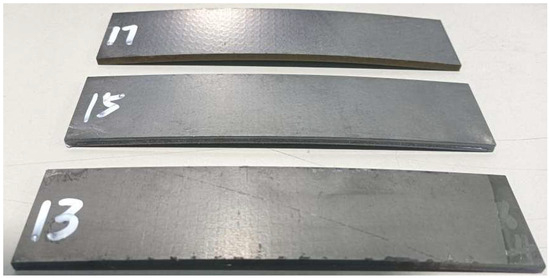
Figure 13.
LSF plates with different laser energies.
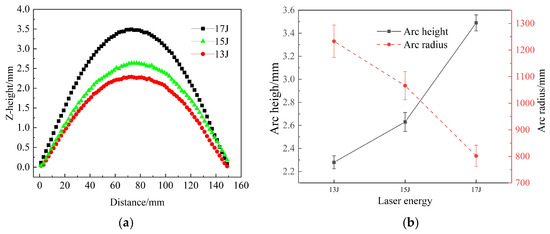
Figure 14.
Deformation of plates with different laser energies: (a) centerline displacement; (b) arc height values and radius of curvature.
Figure 15 shows the variation in surface morphology and surface profile of the carbon steel plate after treatment with different laser energies. Figure 16 shows the variation in surface roughness of the material. From the figure, it can be seen that when the laser energy is 13 J, 15 J, and 17 J, the surface roughness values of the formed plate are 1.742 μm, 1.955 μm, and 2.147 μm, respectively. With the increase in the power density, the laser acts on the plate to increase the shock wave. This leads to a greater depth of indentation on the surface of the plate, creating a more undulating profile, which in turn leads to an increase in the surface roughness of the plate.
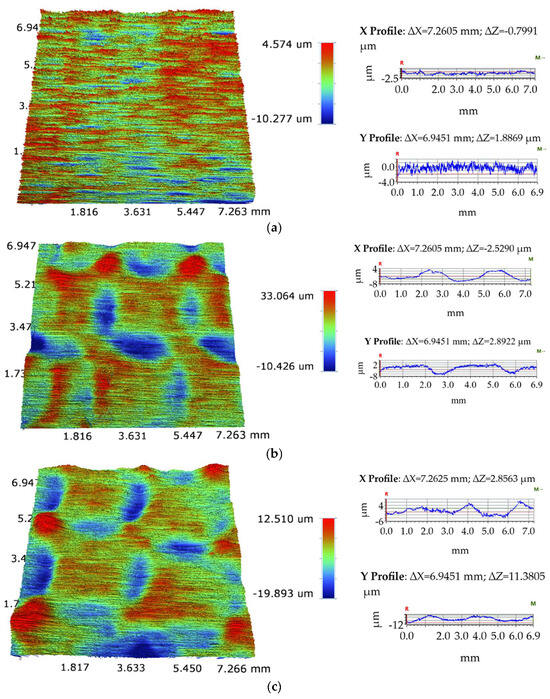
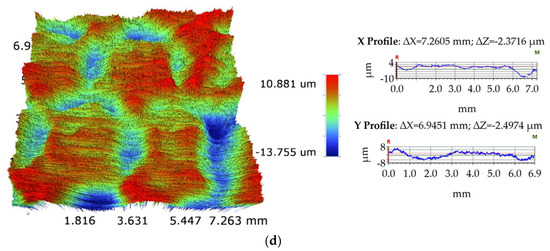
Figure 15.
Surface morphology and surface profile of plates with different laser energies: (a) untreated; (b) 13 J; (c) 15 J; (d) 17 J.
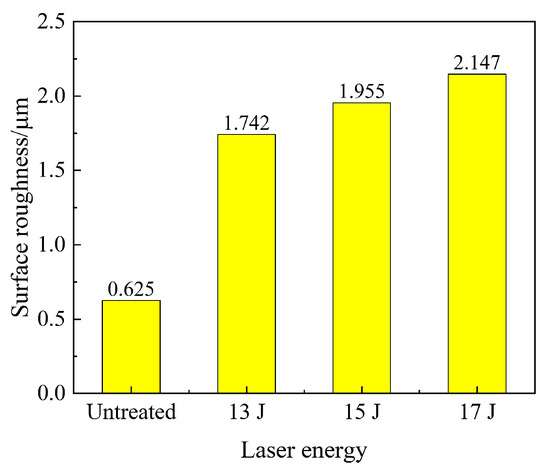
Figure 16.
Surface roughness of plates with different laser energies.
The increase in surface profile size exhibits a non-linear trend, whereas the increase in surface roughness shows a linear growth. This is primarily due to the fact that as the laser impact energy increases, the depth of the indentation also increases, leading to a more uneven surface and consequently a higher roughness. Furthermore, with a spot overlap rate of 10%, there is partial overlap between adjacent spots. The indentation depth in the overlapping areas is greater than in the non-overlapping areas, resulting in a non-monotonic change in the surface profile curve, with deeper indentations in the overlapping regions and relatively shallower indentations in the non-overlapping areas.
Figure 17 shows the variation in microhardness of the carbon steel plate after shock with different laser energies. When the laser energy is 13J, 15J, and 17J, the surface microhardness of the formed plate is 221.4 HV, 226.9 HV, and 234.1 HV, respectively. The surface microhardness of the formed plate increases with the increase in laser energy. As mentioned earlier, the increased laser energy induces a larger shock wave, and the degree of plastic deformation is directly proportional to the laser shock pressure, where the increased degree of plastic deformation leads to an increase in the high-density dislocations of the crystal, and ultimately to an increase in the microhardness of the sheet.
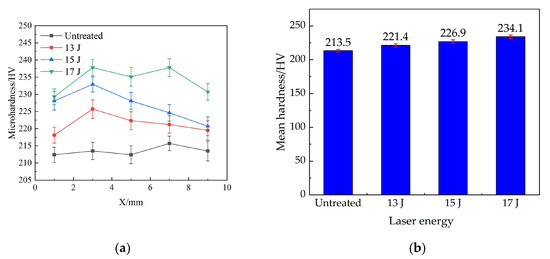
Figure 17.
Surface microhardness of plates formed by different laser energies: (a) microhardness in different positions; (b) average microhardness.
Figure 18 shows the effect of different laser energies on the residual stress on the surface of the carbon steel Q355ME forming plate. As can be seen from the figure, with the increase in laser energy, the residual compressive stress on the surface of the plate increases. When the laser energy of 13 J, 15 J, and 17 J, the value of residual stress on the surface of the plate is −234.19 Mpa, −272.69 MPa, and −310.75 MPa, and the increase in the residual stress is 38.50 Mpa and 38.06 Mpa, respectively. In the range of laser energy 13 J−17 J, the increase in laser energy and the increase in residual stress induced on the plate surface are linearly positively correlated.
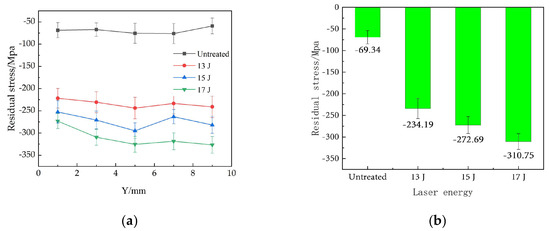
Figure 18.
Residual stresses on the surface of formed plates with different laser energies: (a) residual stresses at different positions; (b) average residual stress.
3.4. Actual Carbon Steel Forming Skin Deformation and Surface Quality Analysis
Figure 19 is the flow chart of laser shock forming of skin parts. According to the above experiments, the laser process parameters are selected, and the radius of curvature of the skin model is analyzed. The shock path, the shock area, and the restraint mode of the skin are planned. After the laser shock is completed, through the error comparison, the large error area of the skin is iteratively optimized, and finally, the skin is produced.
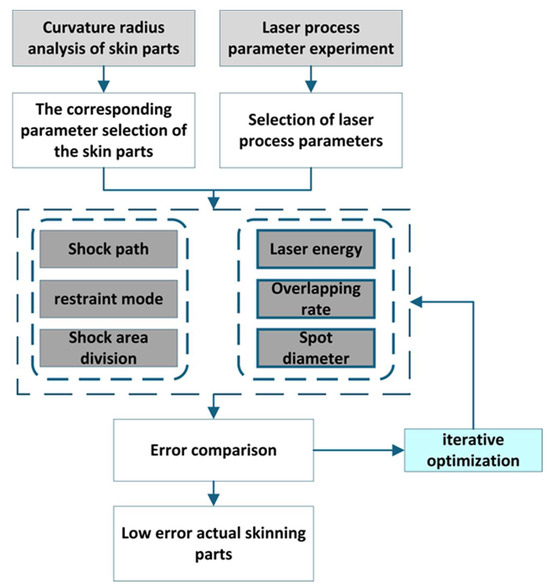
Figure 19.
Flow chart of laser shock forming of skin parts.
Based on the influence of process parameters on plate deformation and surface quality, forming experiments were conducted to analyze the surface quality of the front skin of electric locomotives. Figure 20 shows the actual laser shock forming of the skin. The maximum curvature distribution of the plate is first analyzed and obtained, as shown in Figure 20a. The maximum curvature of the entire face is 0.0033, corresponding to the minimum radius of curvature of 303 mm. The Gaussian curvature of the entire face of the plate is 5.67 × 10⁻⁹ ≈ 0; therefore, the plate can be regarded as a cylindrical single-curvature-shaped skinned member. The clamping and trajectory of the skinned part are shown in Figure 20b. Multi-point constraint on one side of the plate, with the laser shock direction parallel to the restraint edge. From the comparison diagram in Figure 20d, it can be seen that the maximum error between the formed plate and the actual skin model is within ±3 mm, and the overall large area error of the skin is within ± 0.4 mm.
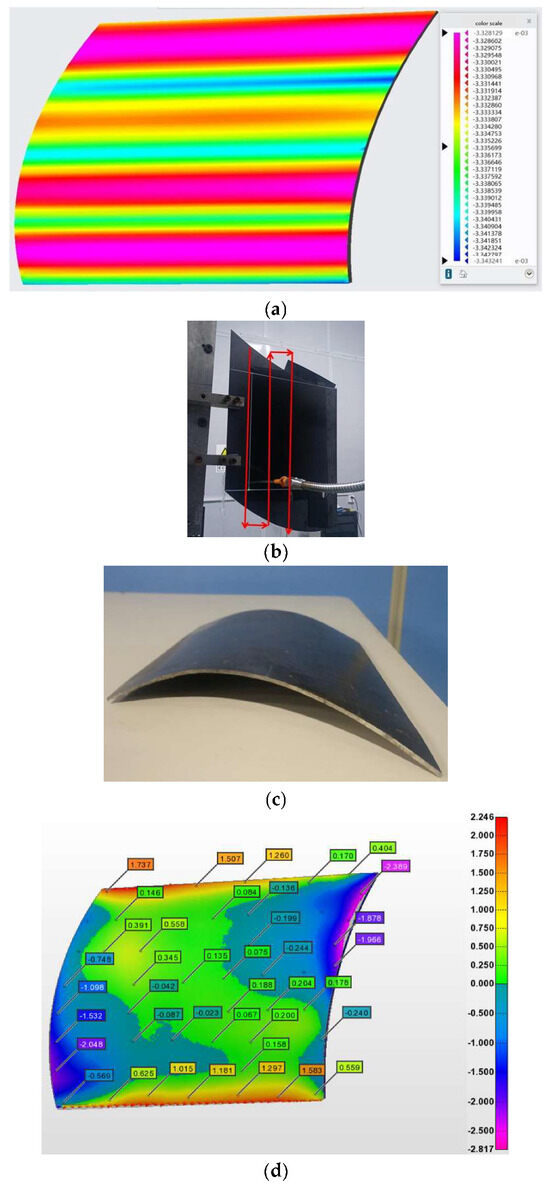
Figure 20.
Laser shock forming of actual skin parts: (a) plate maximum curvature distribution; (b) clamping and laser path; (c) actual skin molded parts; (d) comparison of LSF plate.
The measurement position of the actual skin-forming part is shown in Figure 21. Five positions on the surface were selected for testing and averaged, and the surface inspection values are shown in Table 1. The residual stress on the surface of the plate is −325.14 MPa, which is 368.9% higher than that of the untreated plate. The surface microhardness of the plate is 235.7 HV, which is 10.4% higher than that of the untreated plate. The surface roughness value is 3.067 μm.
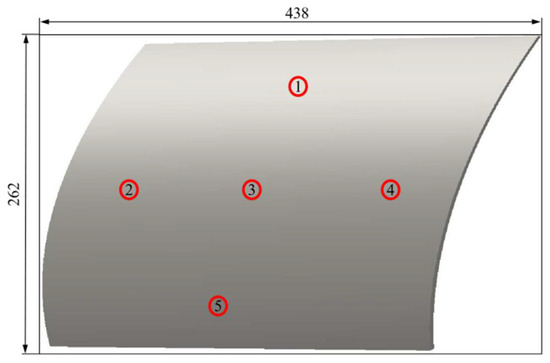
Figure 21.
Schematic diagram of the measurement position of the actual skin molding part.

Table 1.
Surface inspection values of actual skinned molded parts.
Electron backscatter diffraction analysis of the microstructure of laser shock forming primary plates and final actual skin-forming part cross-sections. Figure 21 shows the cross-sectional EBSD morphology of the untreated sheet. Figure 22 shows the EBSD pattern of the cross-section of the plate after a single laser shock. It can be observed that the near-surface region A is flatter than region B, which corresponds to the relationship between the surface roughness value and the number of laser shocks in the previous section. Multiple laser shocks create more uneven surfaces. Meanwhile, more green low-angle grain boundaries in the near-surface region B can be observed in the KAM plot, indicating a greater degree of plastic deformation in region B and the introduction of greater residual stresses by multiple laser shocks.
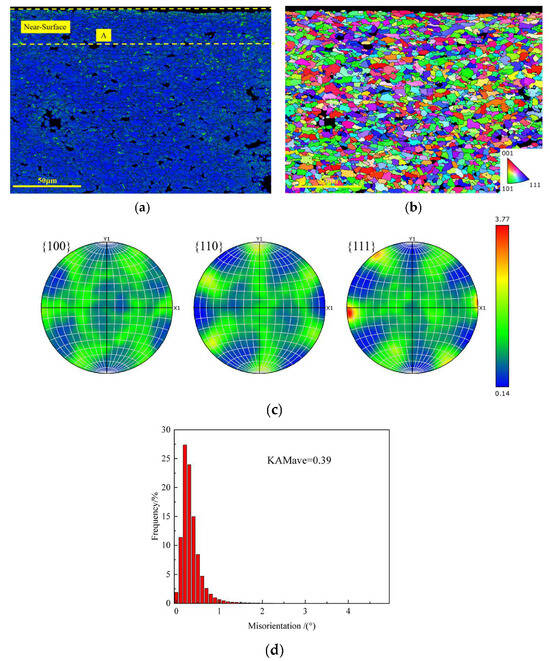
Figure 22.
EBSD morphology of laser shocked primary plate cross-section: (a) KAM plot of cross-section; (b) IPF plot of cross-section; (c) polar diagram of the cross-section; (d) KAM statistics.
Comparison of the grain boundary orientation angle distribution plots of Figure 22d and Figure 23d shows that after multiple shocks, the peak in the low-angle region of the grain boundary orientation angle distribution curve significantly increases, with its proportion further rising, while the proportion of high-angle grain boundaries relatively decreases. This is because under the load of the shock wave, the material undergoes instantaneous high pressure and extremely high strain rates, causing the movement speed of dislocations to sharply increase. This results in a significant and rapid rise in the dislocation density within the material, with a large number of dislocations accumulating near grain boundaries, leading to dislocation entanglement [24]. The grains are divided into many small grain blocks with slightly different orientations, forming sub-grains within the grains, thereby significantly increasing the proportion of low-angle grain boundaries.

Figure 23.
EBSD morphology of actual skin molded part cross-section: (a) KAM plot of cross-section; (b) IPF plot of cross-section; (c) polar diagram of the cross-section; (d) KAM statistics.
Analyzing the polar plots of Figure 22c and Figure 23c, it can be seen that strong basal plane weaving occurs at the {111} crystal surface after one laser shock, and the polar density reaches 3.77. Also peripheral weaving regions with polar densities of 1–2 appear at the {100} crystallographic plane and the {110} crystallographic plane. This is caused by reorientation induced by shock-induced plasticity. During the laser shock process, the powerful shock wave causes plastic deformation in the material, resulting in the proliferation, movement, and interaction of dislocations within the crystal [25]. This impact-induced plastic deformation alters the orientation of the grains, with the originally randomly distributed grains gradually adjusting their direction under the impact [26], thereby forming peripheral interlaced regions with specific orientation characteristics on the {100} and {110} planes.
The {111} basal plane weave polar density is decreased from 3.77 to 3.50 after multiple laser shocks, and the polar directions of the three crystal planes are shifted. At the same time, the decrease in density leads to more confusion of the internal texture.
These effects are not purely driven by dislocations or grain boundaries. After LSP treatment, the surface of carbon steel exhibits compression deformation zones and tensile deformation zones, with layered slip bands appearing in the tensile deformation zones and plate-like martensite and needle-like martensite appearing in the compression deformation zones [27].
4. Conclusions
This work takes Q355ME carbon steel as the research object, studies the effect of the type of absorbing layer on the deformation of the laser shock forming plate, and compares and selects the black tape as the optimal absorbing layer. Then it investigates the effect of the number of shocks and laser energy on the deformation and surface quality of the plate. The conclusions are as follows:
- Among different kinds of absorption layers for carbon steel Q355ME plate laser shock forming, black tape exhibits the strongest forming ability. Due to aluminum foil’s paste and de-gluing difficulties, the forming ability is weaker than that of the black tape. No absorption layer forming plate surface ablation occurs on the surface of the negative impact.
- With the increase in laser energy and shock times, the deformation, surface roughness, microhardness, and residual stress of the formed sheet will increase, and the increase will decrease due to surface hardening. The increase in laser energy is linearly positively correlated with the increase in residual stress in a certain energy range.
- The maximum error between the actual formed sheet and the actual skin model is within ± 3 mm, and the overall large-area error of the skin is within ± 0.4 mm. Compared with the standard model, the error between the actual skin-forming part and the standard model is very small. The surface introduces a large residual compressive stress and improves the surface microhardness. Multiple laser shock peening causes the surface of the formed sheet to undergo ultra-high strain plastic deformation and grain refinement. Laser shock peening technology can form carbon steel skin parts while improving surface properties.
- After multiple laser shocks, the peak value of the low-angle region of the grain boundary orientation angle distribution curve increases significantly, and the proportion increases further, while the proportion of high-angle grain boundaries decreases relatively.
Author Contributions
Conceptualization, X.C.; methodology, M.M.; validation, M.M. and W.H.; formal analysis, M.M. and J.C.; writing—original draft preparation, W.H., R.Z. and B.S.; writing—review and editing, X.C. All authors have read and agreed to the published version of the manuscript.
Funding
This work was supported by the CEIEC-2024-ZM02-0045, the Natural Science Foundation of Shandong Province of China (Nos. ZR2022ME150, ZR2022ME129), and the Shenyang Institute of Automation of the Chinese Academy of Sciences, which carried out the autonomous deployment of scientific research projects (E3551104).
Institutional Review Board Statement
Not applicable.
Informed Consent Statement
Not applicable.
Data Availability Statement
The data are available within the article.
Conflicts of Interest
Author Mingming Ma was employed by the company CRRC Zhuzhou Locomotive Co. Ltd. Author Xianrong Cao was employed by the company CRRC Zhuzhou Locomotive Co. Ltd. The remaining authors declare that the research was conducted in the absence of any commercial or financial relationships that could be construed as a potential conflict of interest.
References
- De Jesus, A.M.P.; Matos, R.; Fontoura, B.F.C.; Rebelo, C.; Simões Da Silva, L.; Veljkovic, M. A comparison of the fatigue behavior between S355 and S690 steel grades. J. Constr. Steel Res. 2012, 79, 140–150. [Google Scholar] [CrossRef]
- Forni, D.; Chiaia, B.; Cadoni, E. High strain rate response of S355 at high temperatures. Mater. Des. 2016, 94, 467–478. [Google Scholar] [CrossRef]
- Bastidas, D.M.; Gil, A.; Martin, U.; Ress, J.; Medina, S.F. Fatigue failure of ball joint heads connected to the weight holder mechanism in railway applications. Eng. Fail. Anal. 2021, 129, 105690. [Google Scholar] [CrossRef]
- Nonaka, I.; Setowaki, S.; Ichikawa, Y. Effect of load frequency on high cycle fatigue strength of bullet train axle steel. Int. J. Fatigue 2014, 60, 43–47. [Google Scholar] [CrossRef]
- Luong, H.; Hill, M.R. The effects of laser peening and shot peening on high cycle fatigue in 7050-T7451 aluminum alloy. Mater. Sci. Eng. A 2010, 527, 699–707. [Google Scholar] [CrossRef]
- Achintha, M.; Nowell, D.; Fufari, D.; Sackett, E.E.; Bache, M.R. Fatigue behavior of geometric features subjected to laser shock peening: Experiments and modeling. Int. J. Fatigue 2014, 62, 171–179. [Google Scholar] [CrossRef]
- Li, K.; Cai, Y.; Yu, Z.; Hu, J. Formation mechanism of residual stress hole under different pulse durations and shock pressure distributions in Ti6Al4V alloy during laser peen texturing. Opt. Laser Technol. 2020, 130, 106361. [Google Scholar] [CrossRef]
- Yang, Y.Q.; Qiao, H.C.; Lu, Y.; Zhao, J.B.; Sun, B.Y. The plastic flow mechanism and precise forming method of 7075 aluminum plate in laser shock forming. Opt. Laser Technol. 2023, 167, 109823. [Google Scholar] [CrossRef]
- Sala, S.T.; Keller, S.; Chupakhin, S.; Pöltl, D.; Klusemann, B.; Kashaev, N. Effect of laser peen forming process parameters on bending and surface quality of Ti-6Al-4V sheets. J. Mater. Process. Technol. 2022, 305, 117578. [Google Scholar] [CrossRef]
- Man, J.X.; Yang, H.F.; Wang, Y.F.; Chen, H.X.; Xiong, F. Study on controllable surface morphology of the micro-pattern fabricated on metallic foil by laser shock imprinting. Opt. Laser Technol. 2019, 119, 105669. [Google Scholar] [CrossRef]
- Zhang, X.Q.; Zhu, R.; Fang, J.X.; Guo, L.; Wang, Z.Y.; Zuo, L.S.; Duan, S.W. Microstructure evolution of 2024 aluminum alloy subjected to two stage laser shock sheet forming. Mater. Charact. 2024, 209, 113753. [Google Scholar] [CrossRef]
- Maharjan, N.; Ramesh, T.; Wang, Z.C. High energy laser shock peening of Ti6A l4V alloy without any protective coating. Appl. Surf. Sci. 2023, 638, 158110. [Google Scholar] [CrossRef]
- Huang, X.; Zeng, Y.S.; Wang, M.T.; Zou, S.K. Experimental study on laser peen forming of aluminum alloy 2024-T351 plate. IOP Conf. Ser. Mater. Sci. Eng. 2022, 1270, 012014. [Google Scholar] [CrossRef]
- Liu, H.L.; Yang, H.J.; Tong, Z.P.; Zhou, W.F.; Ye, Y.X.; Ren, X.D. Enhancing the forming quality of Al2024-T351 sheets in laser peen forming through a novel energy sequence arrangement strategy. J. Manuf. Process. 2023, 102, 814–826. [Google Scholar] [CrossRef]
- Zhang, Z.; Kong, J.; Yue, X. Determination of in-plane residual stress and eigenstrain in laser peened thin sheet using unit pulse function and equilibrium constraint. Opt. Laser Technol. 2023, 161, 109209. [Google Scholar] [CrossRef]
- Ye, Y.X.; Zeng, R.; Nie, Z.; Ren, Y.P.; Ren, X.D. Researches on the curvature adjustment of metal sheet induced by laser shock forming through experiments and simulations. Int. J. Adv. Manuf. Technol. 2020, 108, 2791–2802. [Google Scholar] [CrossRef]
- Keller, S.; Chupakhin, S.; Staron, P.; Maawad, E.; Kashaev, N.; Klusemann, B. Experimental and numerical investigation of residual stresses in laser shock peened AA2198. J. Mater. Process. Tech. 2017, 255, 294–307. [Google Scholar] [CrossRef]
- Lu, G.X.; Liu, J.D.; Qiao, H.C.; Cui, C.Y.; Zhou, Y.Z.; Jin, T.; Zhao, J.B.; Sun, X.F.; Hu, Z.Q. The Local Microscale Reverse Deformation of Metallic Material under Laser Shock. Adv. Eng. Mater. 2017, 19, 1600672. [Google Scholar] [CrossRef]
- Lu, G.X.; Liu, J.D.; Zhou, Y.Z.; Sun, X.F. Differences in microscale surface contours of metallic targets subjected to laser shock. Opt. Commun. 2018, 436, 188–191. [Google Scholar] [CrossRef]
- Li, Z.J.; Gu, H.; Qian, L.L.; Ren, X.D. Thermodynamic Behavior of Gaussian/Flat-Top Laser Powder Bed Fusion. Chin. J. Lasers 2025, 52, 1202304. [Google Scholar]
- Li, X.; He, W.; Nie, X.; Yang, Z.; Luo, S.; Li, Y.; Tian, L. Regularity of Residual Stress Distribution in Titanium Alloys Induced by Laser Shock Peening with Different Energy Spatial Distributions. Laser Optoelectron. Prog. 2018, 55, 061402. [Google Scholar] [CrossRef]
- Fabbro, R.; Fournier, J.; Ballard, P.; Devaux, D. Physical study of laser-produced plasma in confined geometry. J. Appl. Phys. 1990, 68, 775–784. [Google Scholar] [CrossRef]
- Hu, Y.X.; Xu, X.X.; Yao, Z.Q.; Hu, J. Laser peen forming induced two way bending of thin sheet metals and its mechanisms. J. Appl. Phys. 2010, 108, 073117. [Google Scholar] [CrossRef]
- Lu, J.Z.; Luo, K.Y.; Zhang, Y.K.; Cui, C.Y.; Sun, G.F.; Zhou, J.Z.; Zhang, L.; You, J.; Chen, K.M.; Zhong, J.W. Grain refinement of LY2 aluminum alloy induced by ultra-high plastic strain during multiple laser shock processing impacts. Acta Mater. 2010, 58, 3984–3994. [Google Scholar] [CrossRef]
- Wang, X.F.; Guo, M.X.; Zhang, Y.; Xing, H.; Li, Y.; Luo, J.R.; Zhang, J.S.; Zhuang, L.Z. The dependence of microstructure, texture evolution and mechanical properties of Al–Mg–Si–Cu alloy sheet on final cold rolling deformation. J. Alloys Compd. 2016, 657, 906–916. [Google Scholar] [CrossRef]
- Hosseinifar, A.; Dehghani, K. Microstructure and Texture Evolution of Al0.3CoCrFeNi High-Entropy Alloy After Cold Rolling Deformation. Trans. Indian Inst. Met. 2024, 77, 1467–1479. [Google Scholar] [CrossRef]
- Bakr, A.T.; Ali, J.A.; Adawiya, J.H.; Ahmed, C.K.; Ahmad, S.A.; Norhana, A. Needle-Free Targeted Injections Using Bubble Laser Technology in Therapeutics. Langmuir 2024, 40, 23549–23561. [Google Scholar] [CrossRef] [PubMed]
Disclaimer/Publisher’s Note: The statements, opinions and data contained in all publications are solely those of the individual author(s) and contributor(s) and not of MDPI and/or the editor(s). MDPI and/or the editor(s) disclaim responsibility for any injury to people or property resulting from any ideas, methods, instructions or products referred to in the content. |
© 2025 by the authors. Licensee MDPI, Basel, Switzerland. This article is an open access article distributed under the terms and conditions of the Creative Commons Attribution (CC BY) license (https://creativecommons.org/licenses/by/4.0/).