1. Introduction
The outer layer of body-contact furniture acts as a mechanical, thermal, and tactile interface. It controls pressure transfer, friction, local deformation, heat and moisture exchange, and the first surface cues perceived by the user. For coated surfaces, tactile response is closely related to roughness, friction, topography, thermal behavior, and coating formulation [
1,
2,
3]. In classrooms, furniture design also contributes to the quality of the learning environment and to students’ daily experience [
4,
5,
6]. Comfort therefore depends on the complete contact assembly, including the surface layer, substrate, cellular structure, and textile architecture.
Seating materials differ markedly in their time- and temperature-dependent response. Polypropylene (PP) is a semicrystalline thermoplastic whose stiffness and stress relaxation vary with temperature and loading time [
7]. Thermoplastic polyurethane (TPU) is a segmented block copolymer: hard domains provide physical cross-links, while soft segments provide extensibility. Its modulus, hysteresis, and recovery depend on segment chemistry, strain rate, temperature, processing history, and substrate constraint [
8,
9]. Closed-cell ethylene-vinyl acetate (EVA) foam deforms through cell-wall bending and collapse, whereas flexible polyurethane (PU) foam shows nonlinear compression, stress relaxation, and cyclic hysteresis [
10,
11,
12]. Woven mesh relies on yarn bending, inter-yarn friction, pretension, and open-area geometry to provide support and ventilation [
13].
Classroom nap chairs must accommodate both upright learning and short periods of reclining rest. Upright use requires stable support with limited local disturbance; reclining requires greater conformity, pressure relief, and relaxation. Although a multidimensional framework has been proposed for nap-compatible classroom chairs, material-level evidence across postures and body regions remains limited [
14,
15,
16].
Seating comfort is influenced by posture, interface pressure, support continuity, body dimensions, and subjective perception [
17,
18]. Mean pressure, contact area, pressure heterogeneity, and local pressure gradients describe complementary aspects of body-seat interaction [
19,
20,
21,
22,
23,
24]. Electrodermal activity (EDA) adds a physiological measure of autonomic arousal and relaxation, which is particularly useful during sustained rest [
25,
26].
Three issues remain unresolved. Most studies address office, vehicle, aircraft, or conventional school seating rather than a combined study-nap scenario [
27,
28,
29]. In addition, the head–neck, waist–back, and hip–thigh regions differ in load transfer, support function, and pressure sensitivity [
21,
30,
31]. Finally, mechanical, physiological, subjective, and material variables are often assessed separately, limiting their value for regional material selection.
This study compared rigid PP, a TPU-surfaced PP laminate, woven mesh, closed-cell EVA foam, and flexible PU foam in two functional postures and three body-contact regions. Pressure mapping quantified local mechanical response, EDA characterized posture-dependent physiological adaptation, and subjective ratings provided a secondary calibration term.
The objectives were to quantify posture- and region-dependent interface responses, identify suitable materials for each body region, integrate pressure, EDA, and subjective data using a layered low-compensation framework, and explore the relationship between integrated interface suitability and equivalent support stiffness.
2. Materials and Methods
2.1. Contact-Surface Materials and Experimental Chair
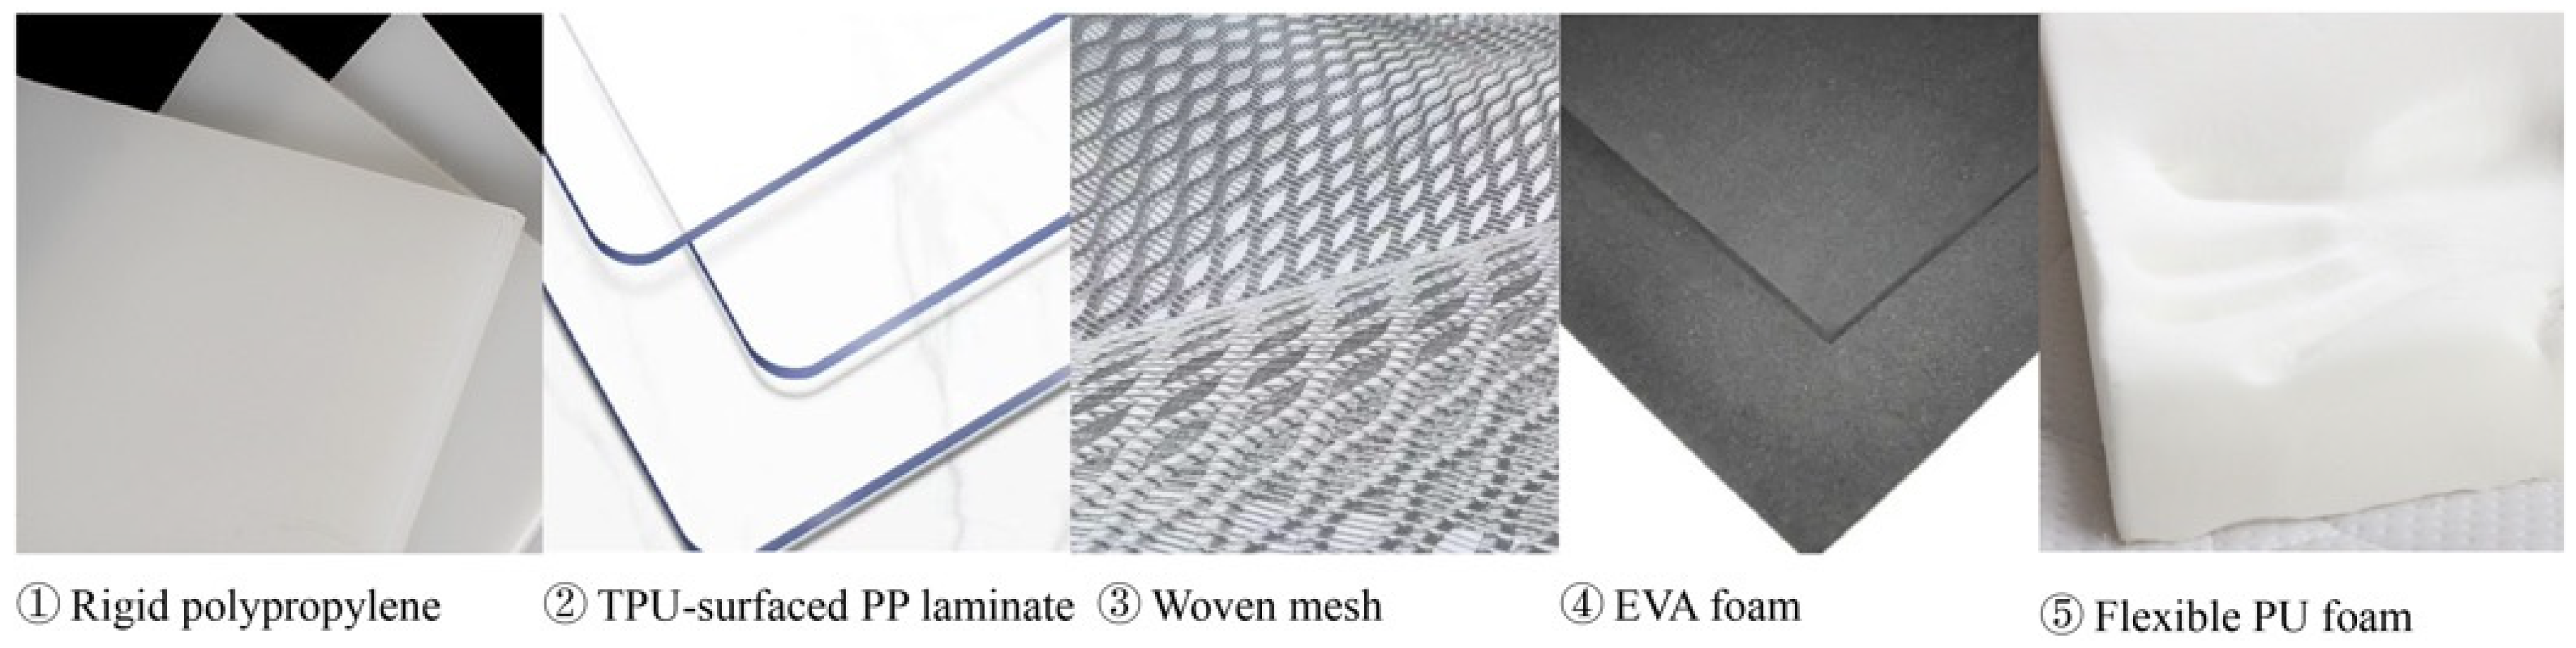
Five contact interfaces were selected to represent rigid, coated, textile, and cellular-polymer constructions used in classroom seating and nap-compatible furniture (
Figure 1). M1 was an uncoated rigid PP surface, M2 a TPU-surfaced PP laminate, M3 an open woven polymer mesh, M4 a closed-cell EVA foam, and M5 a flexible PU foam. Their construction and functional roles are summarized in
Table 1.
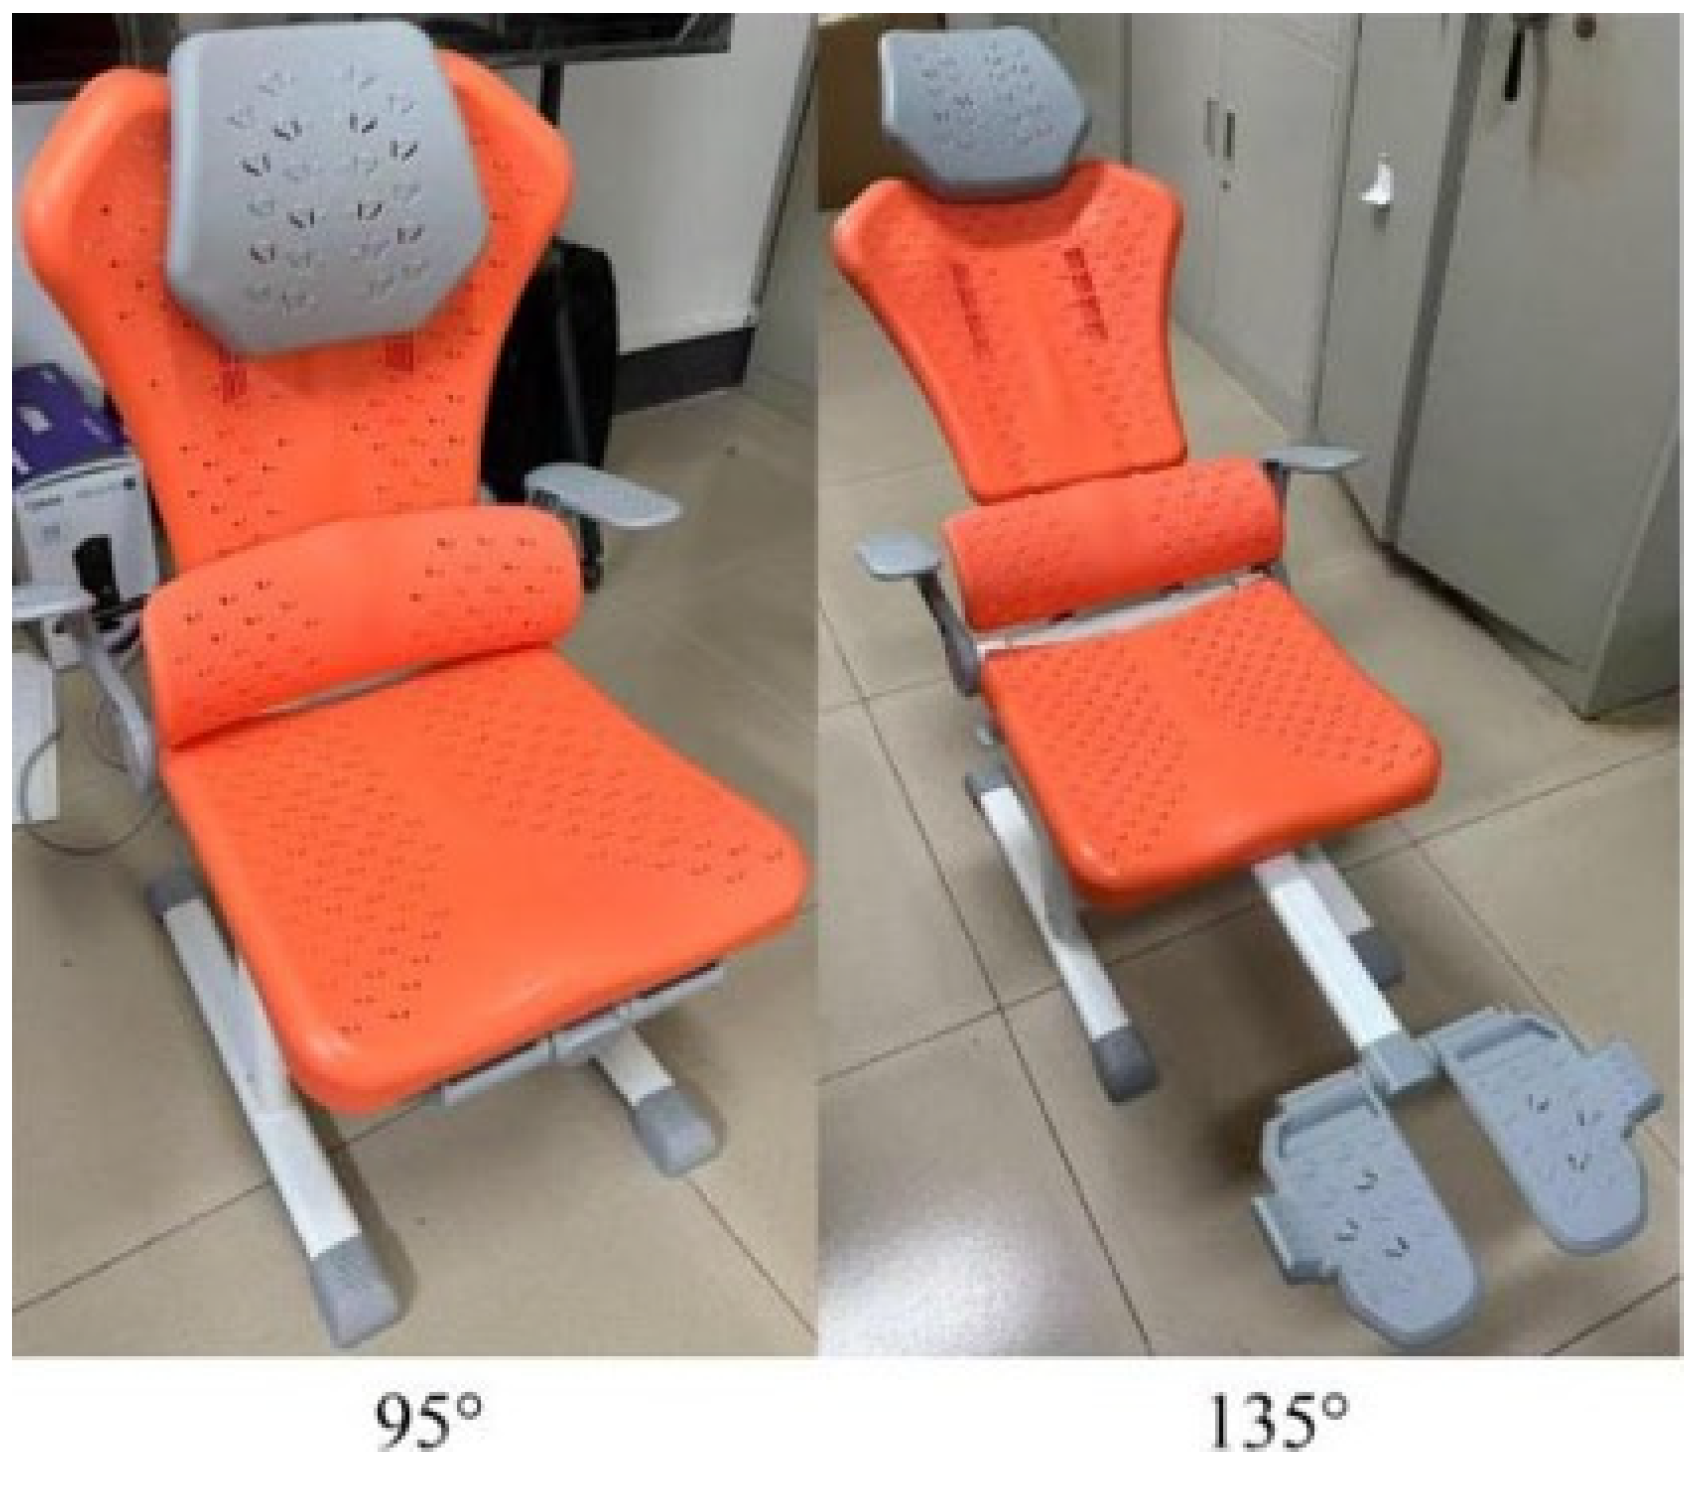
A commercially available classroom nap chair served as the test platform (
Figure 2). Only the removable contact-interface specimen was changed between conditions. Chair geometry, structural support, posture angle, sensor placement, and the laboratory setting were kept constant.
M2 was evaluated as one complete TPU-surfaced PP interface assembly. Because the TPU layer and PP substrate were not independently varied, comparisons involving M2 were not interpreted as isolating the effects of TPU chemistry, coating formulation, or any individual coating property.
2.2. Engineering Characterization of the Assembled Contact Interfaces
Table 2 summarizes the engineering descriptors of the five assembled contact interfaces. Equivalent support stiffness was measured directly and used as the dimensional material parameter in the subsequent stiffness–suitability analysis.
Equivalent support stiffness was measured using a custom quasi-static compression rig comprising an SH-II-100N digital force gauge (Wenzhou Sundoo Instruments Co., Ltd., Wenzhou, China), a 100 × 100 mm flat compression platen, a ShanCe digital displacement scale with a resolution of 0.01 mm, and a rigid support frame. All specimens had exposed plan dimensions of 350 × 350 mm. The nominal assembled-interface thicknesses were approximately 6, 8, 5, 20, and 100 mm for M1–M5, respectively.
No separate standardized conditioning procedure was applied; however, all specimens were stored and tested under the same indoor laboratory conditions. Each interface was placed on a rigid horizontal support. A preload of 5 N was applied and maintained for 5 s to establish stable platen contact. The load was then increased continuously from 5 to 80 N at an average loading rate of approximately 2 N/s. The same platen, loading direction, motor setting, and boundary conditions were used for all interfaces.
Each interface was measured three times at non-overlapping positions. A recovery period of 300 s was allowed between successive measurements to reduce the influence of residual deformation. Compressive stress was calculated as:
where
F is the applied force and
A is the platen contact area of 10,000 mm
2. Apparent compressive strain was calculated as:
where Δ
h is the platen displacement and
h0 is the initial assembled-interface thickness.
A linear regression was fitted over the 20–80 N loading range, corresponding to a compressive stress range of 2–8 kPa. The slope was defined as the equivalent support stiffness:
The equivalent support stiffness values were 450 ± 20 kPa for M1, 320 ± 16 kPa for M2, 180 ± 12 kPa for M3, 110 ± 8 kPa for M4, and 70 ± 5 kPa for M5. The corresponding coefficients of variation were 4.4%, 5.0%, 6.7%, 7.3%, and 7.1%, respectively.
Because the five interfaces differed fundamentally in structure and deformation mechanism, keq was interpreted as an apparent system-level descriptor of the complete assembled interface under the specified low-load conditions. It was not treated as the intrinsic elastic modulus of an individual polymer, textile, or foam constituent, or as a substitute for material-specific standardized mechanical testing.
The TPU-surfaced specimen (M2) was treated as a coupled coating–substrate system. The TPU surface layer affects tactile response, friction, and local deformation, whereas the PP substrate constrains the overall deformation of the assembly [
8,
9]. Therefore, the comparison between M1 and M2 reflects the end-use responses of an uncoated PP interface and a TPU-surfaced PP interface, rather than the isolated effects of TPU chemistry or coating formulation.
2.3. Participants and Experimental Design
Twenty-six participants were recruited, including 13 females and 13 males. Age ranged from 15 to 25 years, height from 160 to 183 cm, body mass from 44 to 79 kg, and body mass index from 17.0 to 25.28 kg/m2. Participants with musculoskeletal disorders, acute pain, skin conditions affecting EDA recording, or any condition that could impair posture maintenance were excluded. The study was conducted in accordance with the Declaration of Helsinki and approved by the Institutional Ethics Committee of Nanjing Forestry University (Approval No. 2026017; 19 January 2026). Written informed consent was obtained in accordance with the approved protocol.
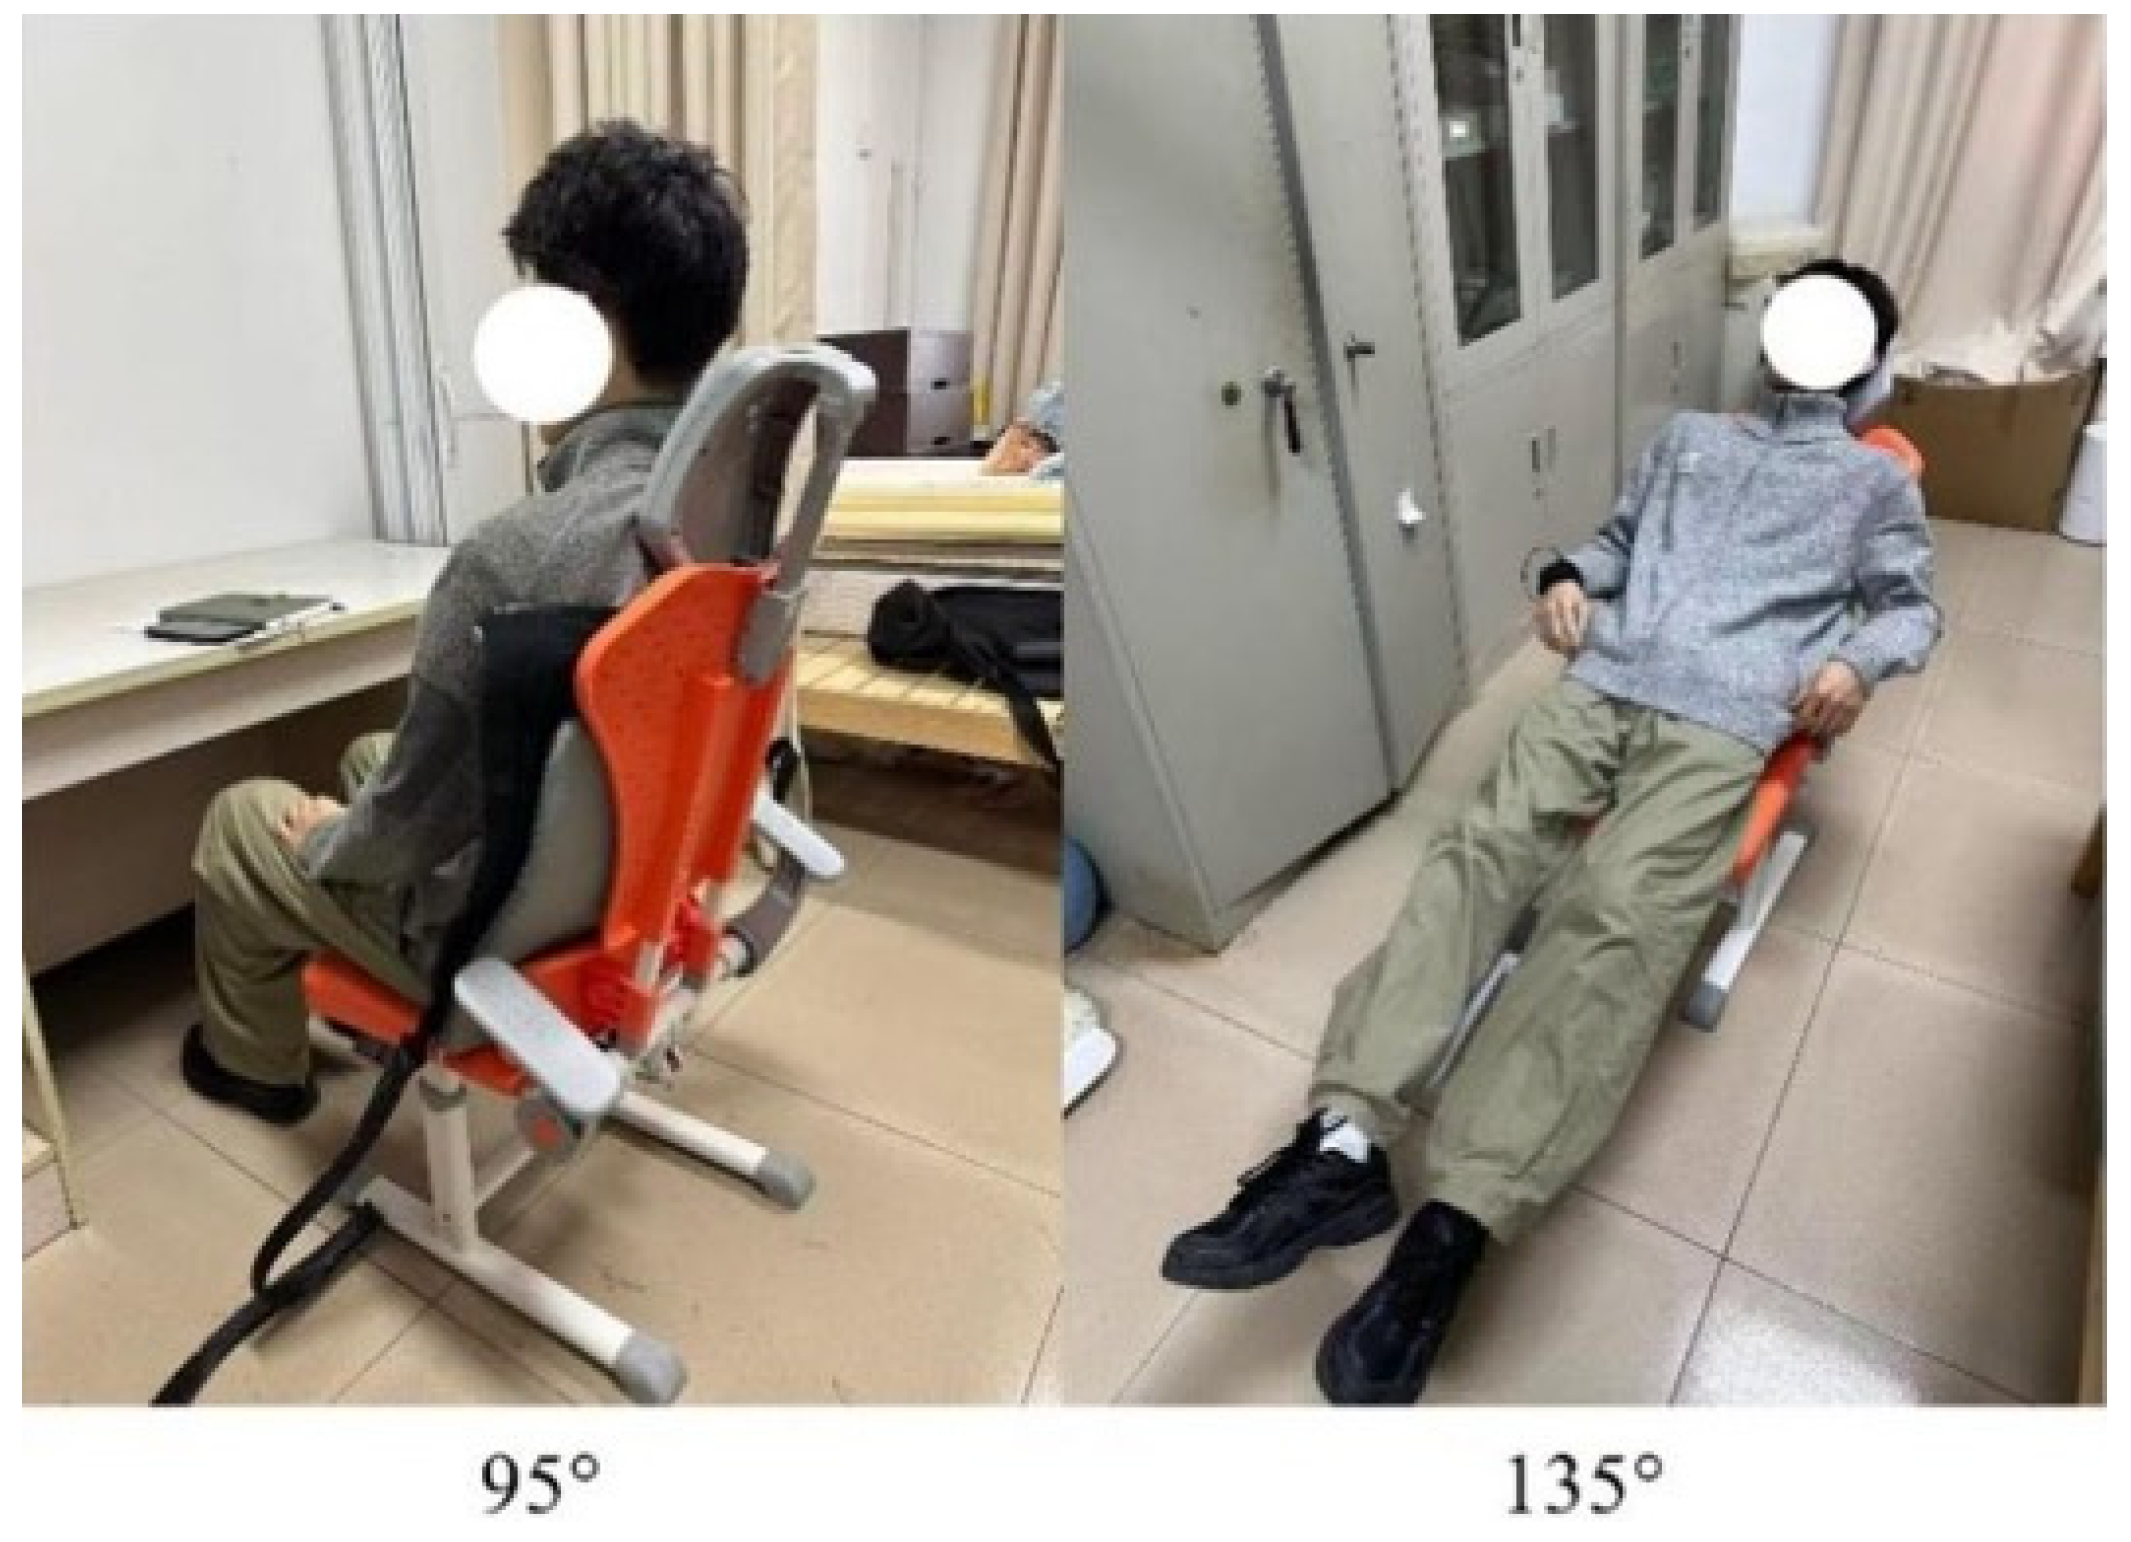
Two postures were tested: a 95° study posture and a 135° nap posture (
Figure 3), representing upright learning and reclining rest, respectively [
14,
15,
16]. These angles corresponded to the two preset functional configurations of the tested classroom nap chair: near-upright classroom study and semi-reclined rest. Intermediate angles were not included because the objective was to compare the two intended use states rather than to determine a continuous angle–response relationship or an optimum backrest angle. Three contact regions were analyzed: head–neck, waist–back, and hip–thigh, which differ in load transfer and support requirements [
21,
30,
31].
Each participant completed all five material conditions in randomized order. Rest intervals were provided between trials to reduce carry-over effects. Tests were conducted under stable indoor laboratory conditions, with chair geometry, sensor placement, posture settings, and experimental procedures kept constant. Because all participants completed all five material conditions, each participant served as his or her own control, thereby reducing the influence of stable between-participant differences on the material comparisons.
2.4. Pressure-Distribution Measurement and Local Mechanical Suitability Index
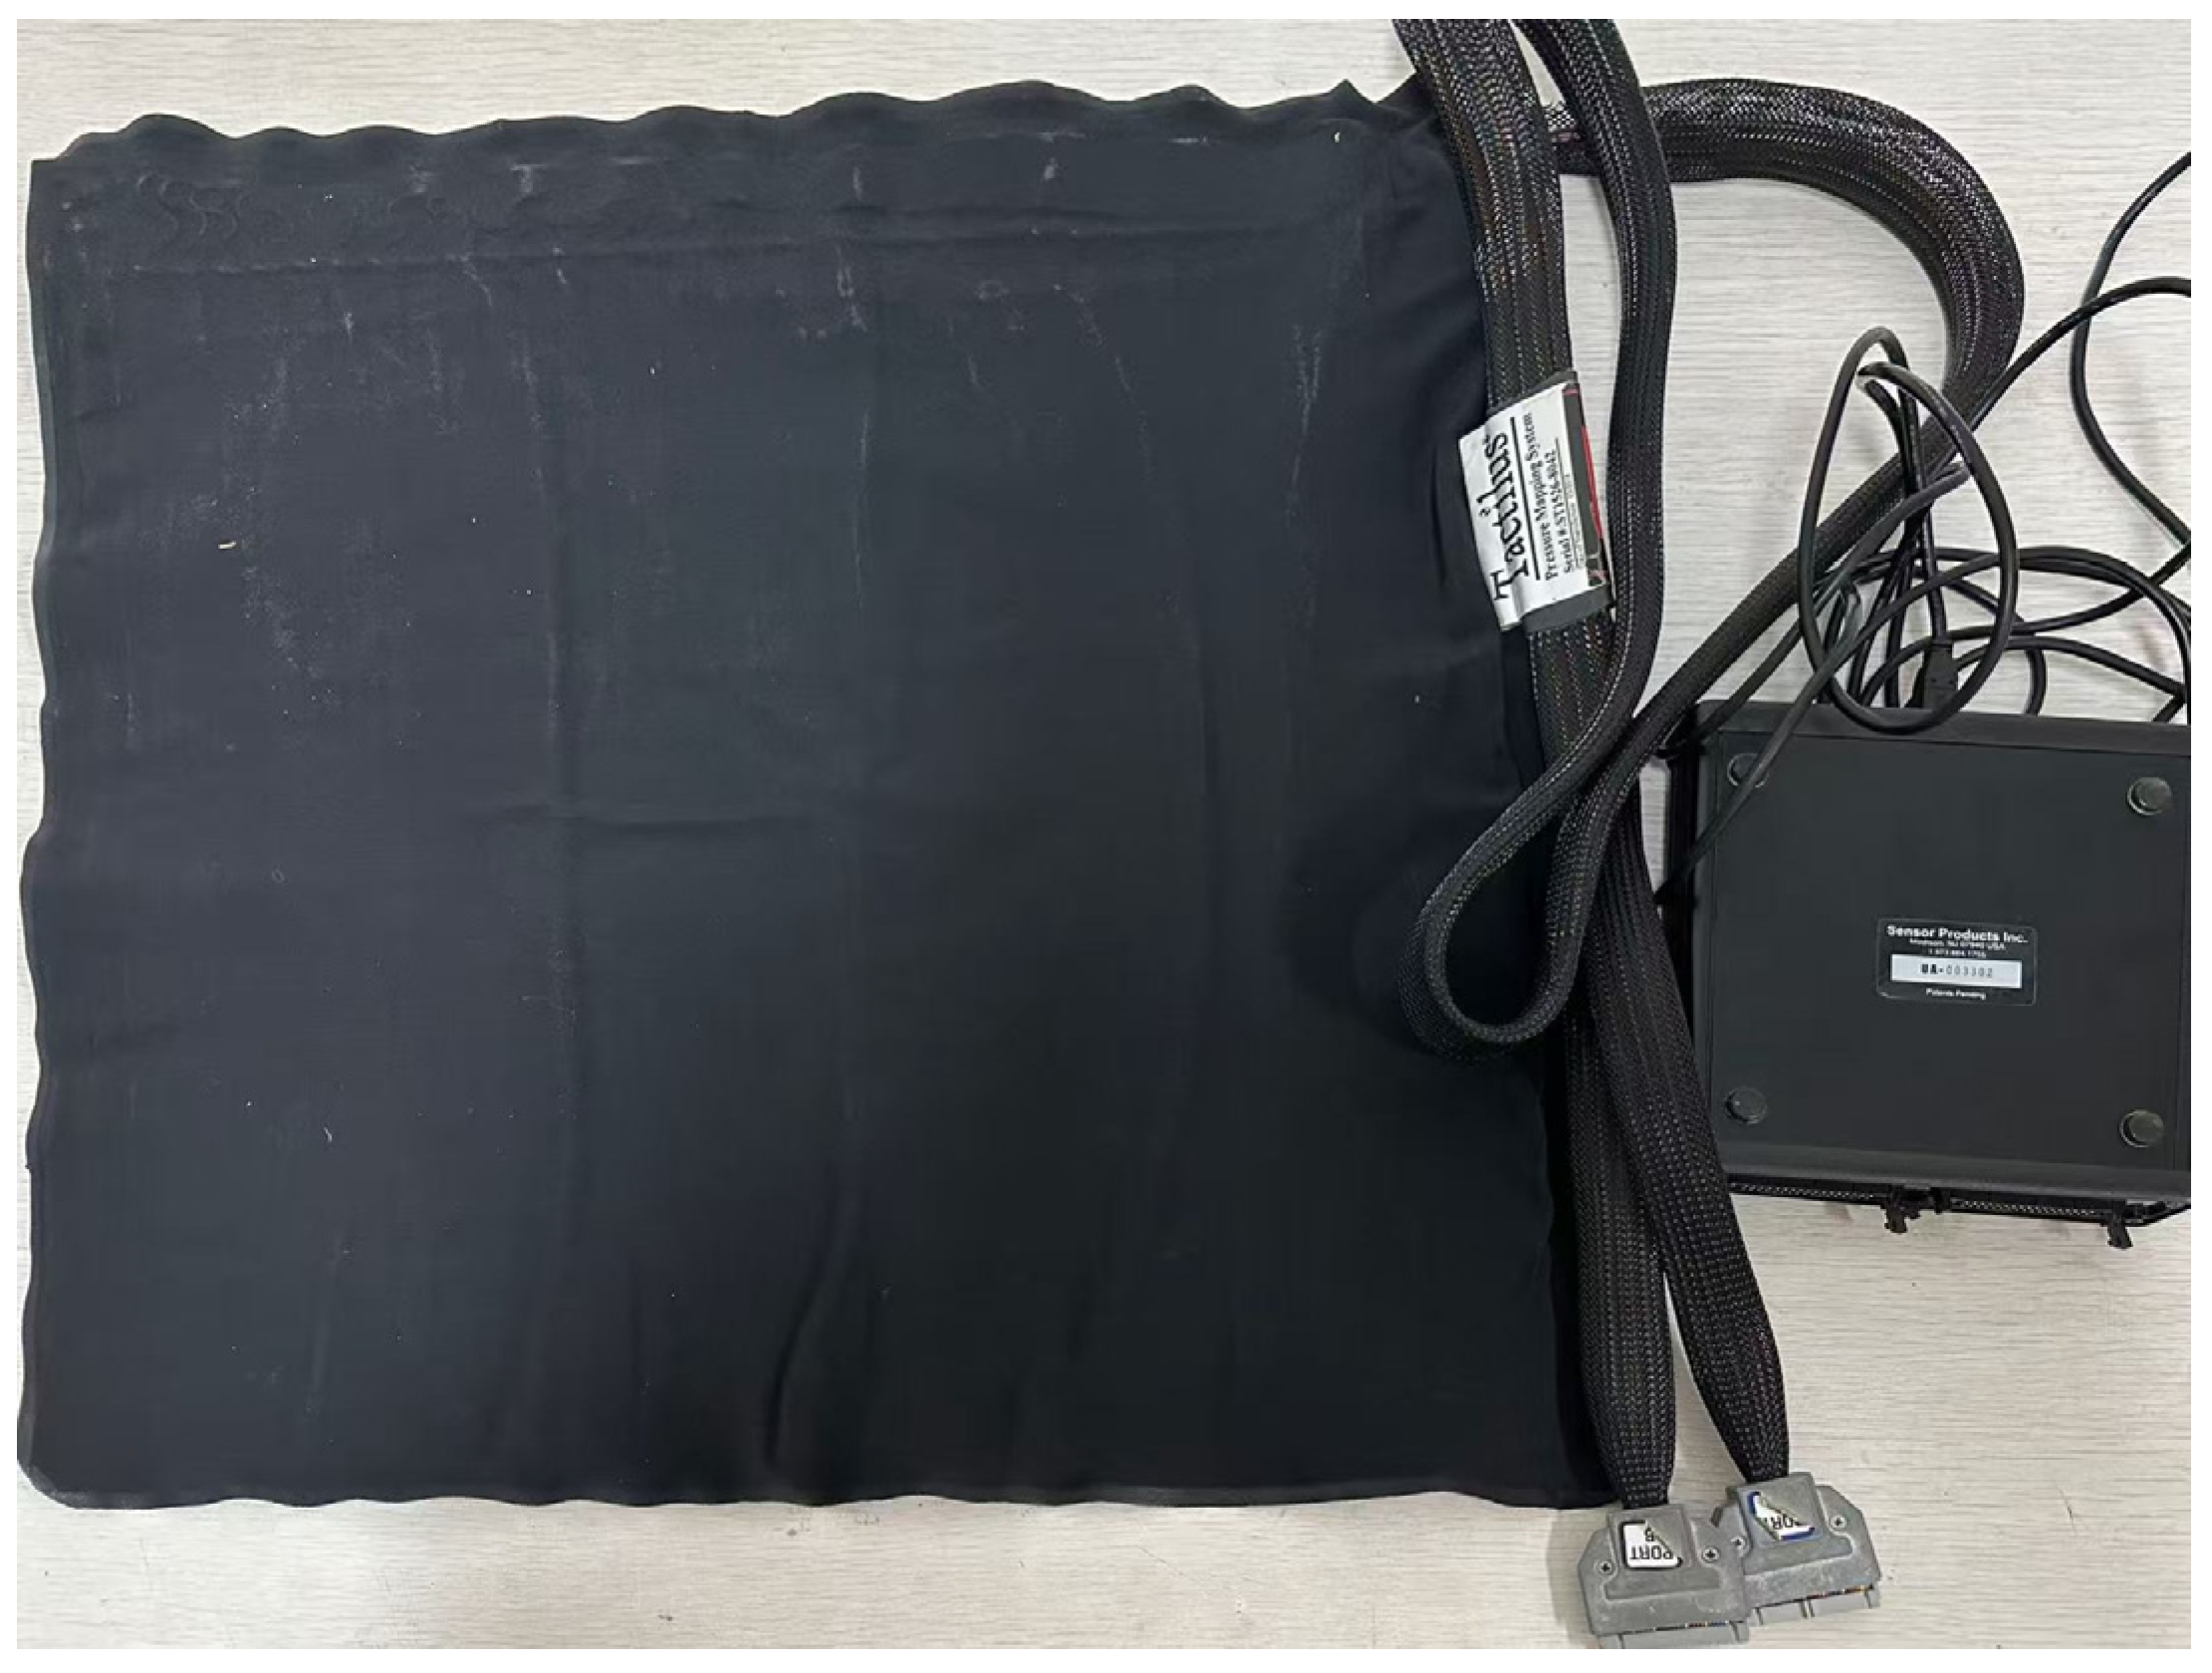
Interface pressure was recorded using a Tactilus S-1024 seat pressure-mapping system (Sensor Products Inc., Madison, NJ, USA;
Figure 4). The piezoresistive sensing mat comprised a 32 × 32 array with 1024 sensels, an active sensing area of 46.5 × 46.5 cm, a nominal sensel center-to-center spacing of approximately 15 mm, and a measurement range of 0–5 psi (approximately 0–34.5 kPa). The sensing mat was 2.5 mm thick, and pressure data were acquired through a USB connection at 50 Hz. The same sensing mat, calibration file, orientation, and placement procedure were used throughout all material conditions.
The pressure-mapping mat was used only during pressure measurements and was removed during the separate EDA and subjective-comfort assessments. The head–neck, waist–back, and hip–thigh regions were recorded as three separate predefined contact conditions rather than being segmented retrospectively from a single pressure map.
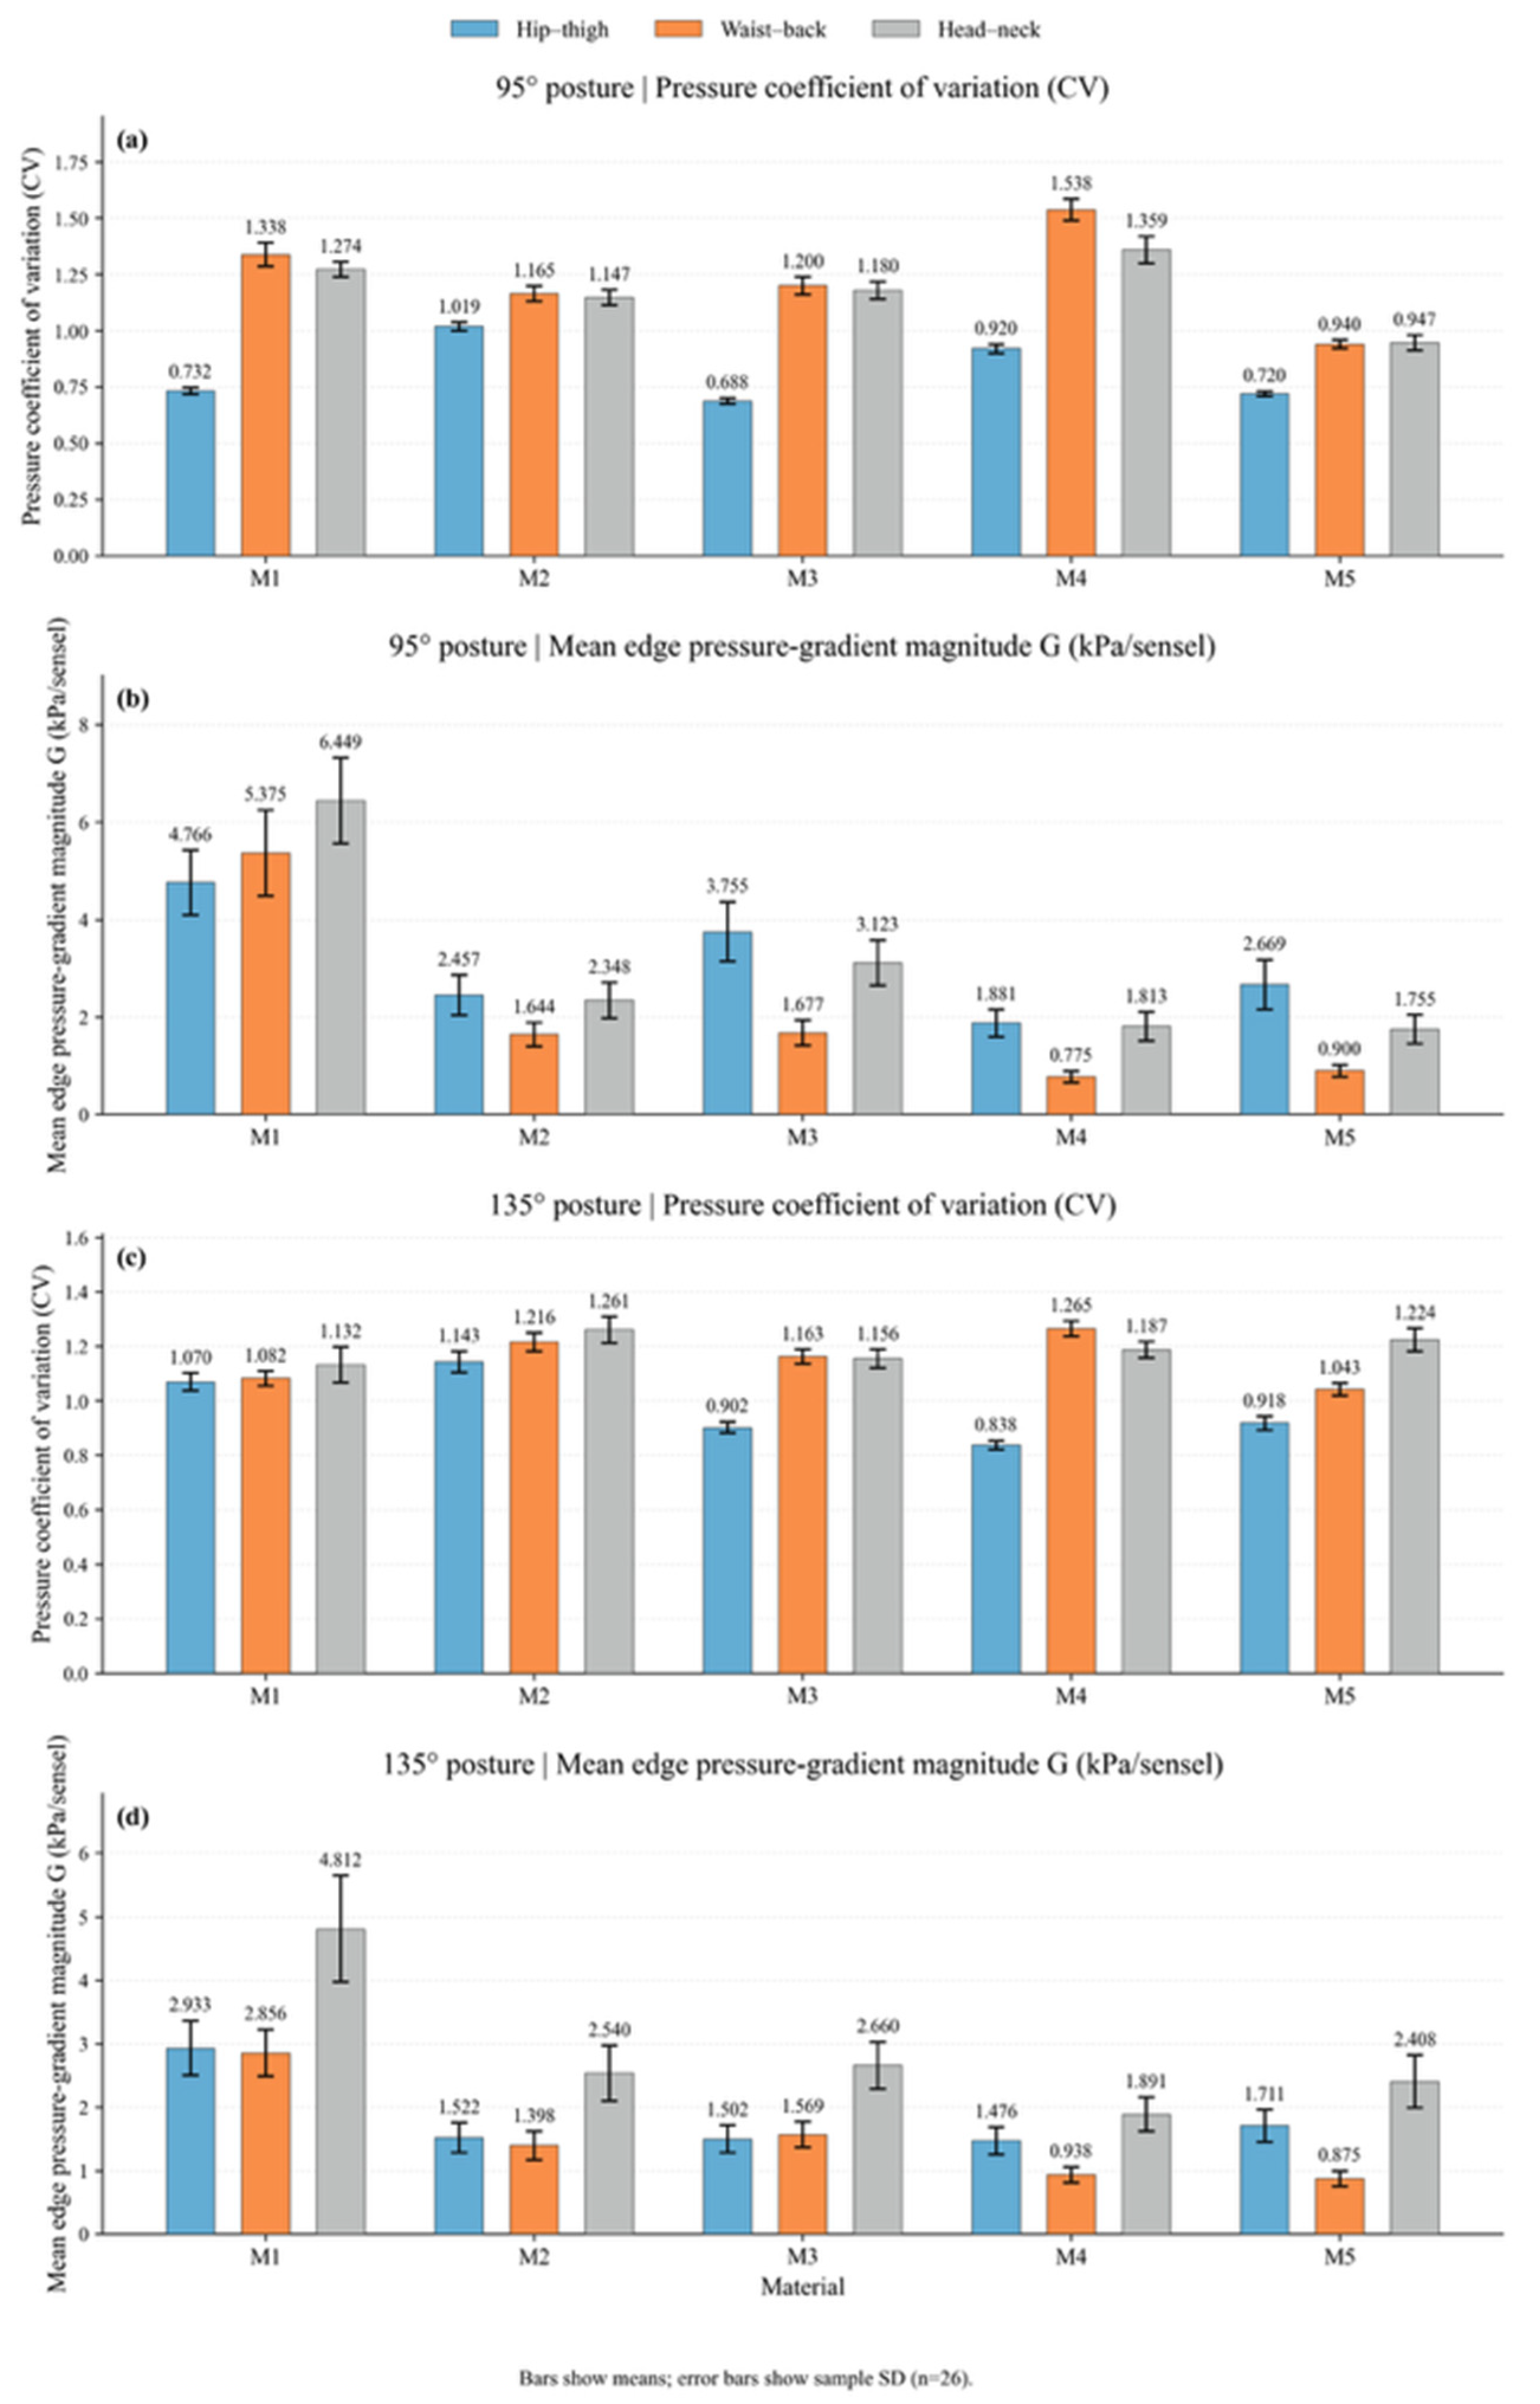
Four pressure indicators were extracted: mean pressure, contact area, coefficient of variation (CV), and mean edge pressure-gradient magnitude. These indicators describe complementary aspects of body–surface mechanical interaction, including loading intensity, contact extent, pressure heterogeneity, and boundary transition [
19,
20,
21,
22,
23,
24].
After the pressure distribution had reached a stable state, one stable 32 × 32 pressure frame was exported for each participant–posture–region–material condition. Sensels with pressure values greater than 0 kPa were treated as active contact sensels.
Mean pressure, contact area, CV, and mean edge pressure-gradient magnitude were calculated for each participant and condition. Contact area was obtained from the active-contact area reported by the acquisition software (version 3.1.0, Sensor Products Inc., Madison, NJ, USA).
The spatial CV was calculated as:
where
and
are the mean pressure and spatial population standard deviation of the active sensels for participant
, posture
, body region
, and material
m, respectively. Both are expressed in kPa; therefore, CV is dimensionless. Lower CV values indicate a more uniform pressure distribution.
The mean edge pressure-gradient magnitude was calculated as:
where
is the number of boundary sensels and
is the pressure-gradient magnitude at boundary sensel
. Because the gradient was calculated using unit sensel spacing,
G is reported in kPa/sensel. Lower values indicate smoother pressure transitions at the contact boundary.
Before aggregation, mean pressure, CV, and G were treated as cost-type indicators, whereas contact area was treated as a benefit-type indicator. The four indicators were converted into positive dimensionless scores within each posture–region condition, with a lower bound of applied to avoid zero values.
After direction correction and positive normalization, the four pressure indicators were combined using an equal-weight geometric mean, with a weight of 0.25 assigned to each indicator:
where
is the dimensionless suitability score of indicator
j. The geometric form limits compensation between poorly and strongly performing indicators. Higher
P indicates a more favorable pressure-distribution response.
Complete values for the four pressure indicators and normalized suitability scores are provided in
Appendix A,
Table A1 and
Table A2.
2.5. EDA Measurement and Physiological Adaptation Index
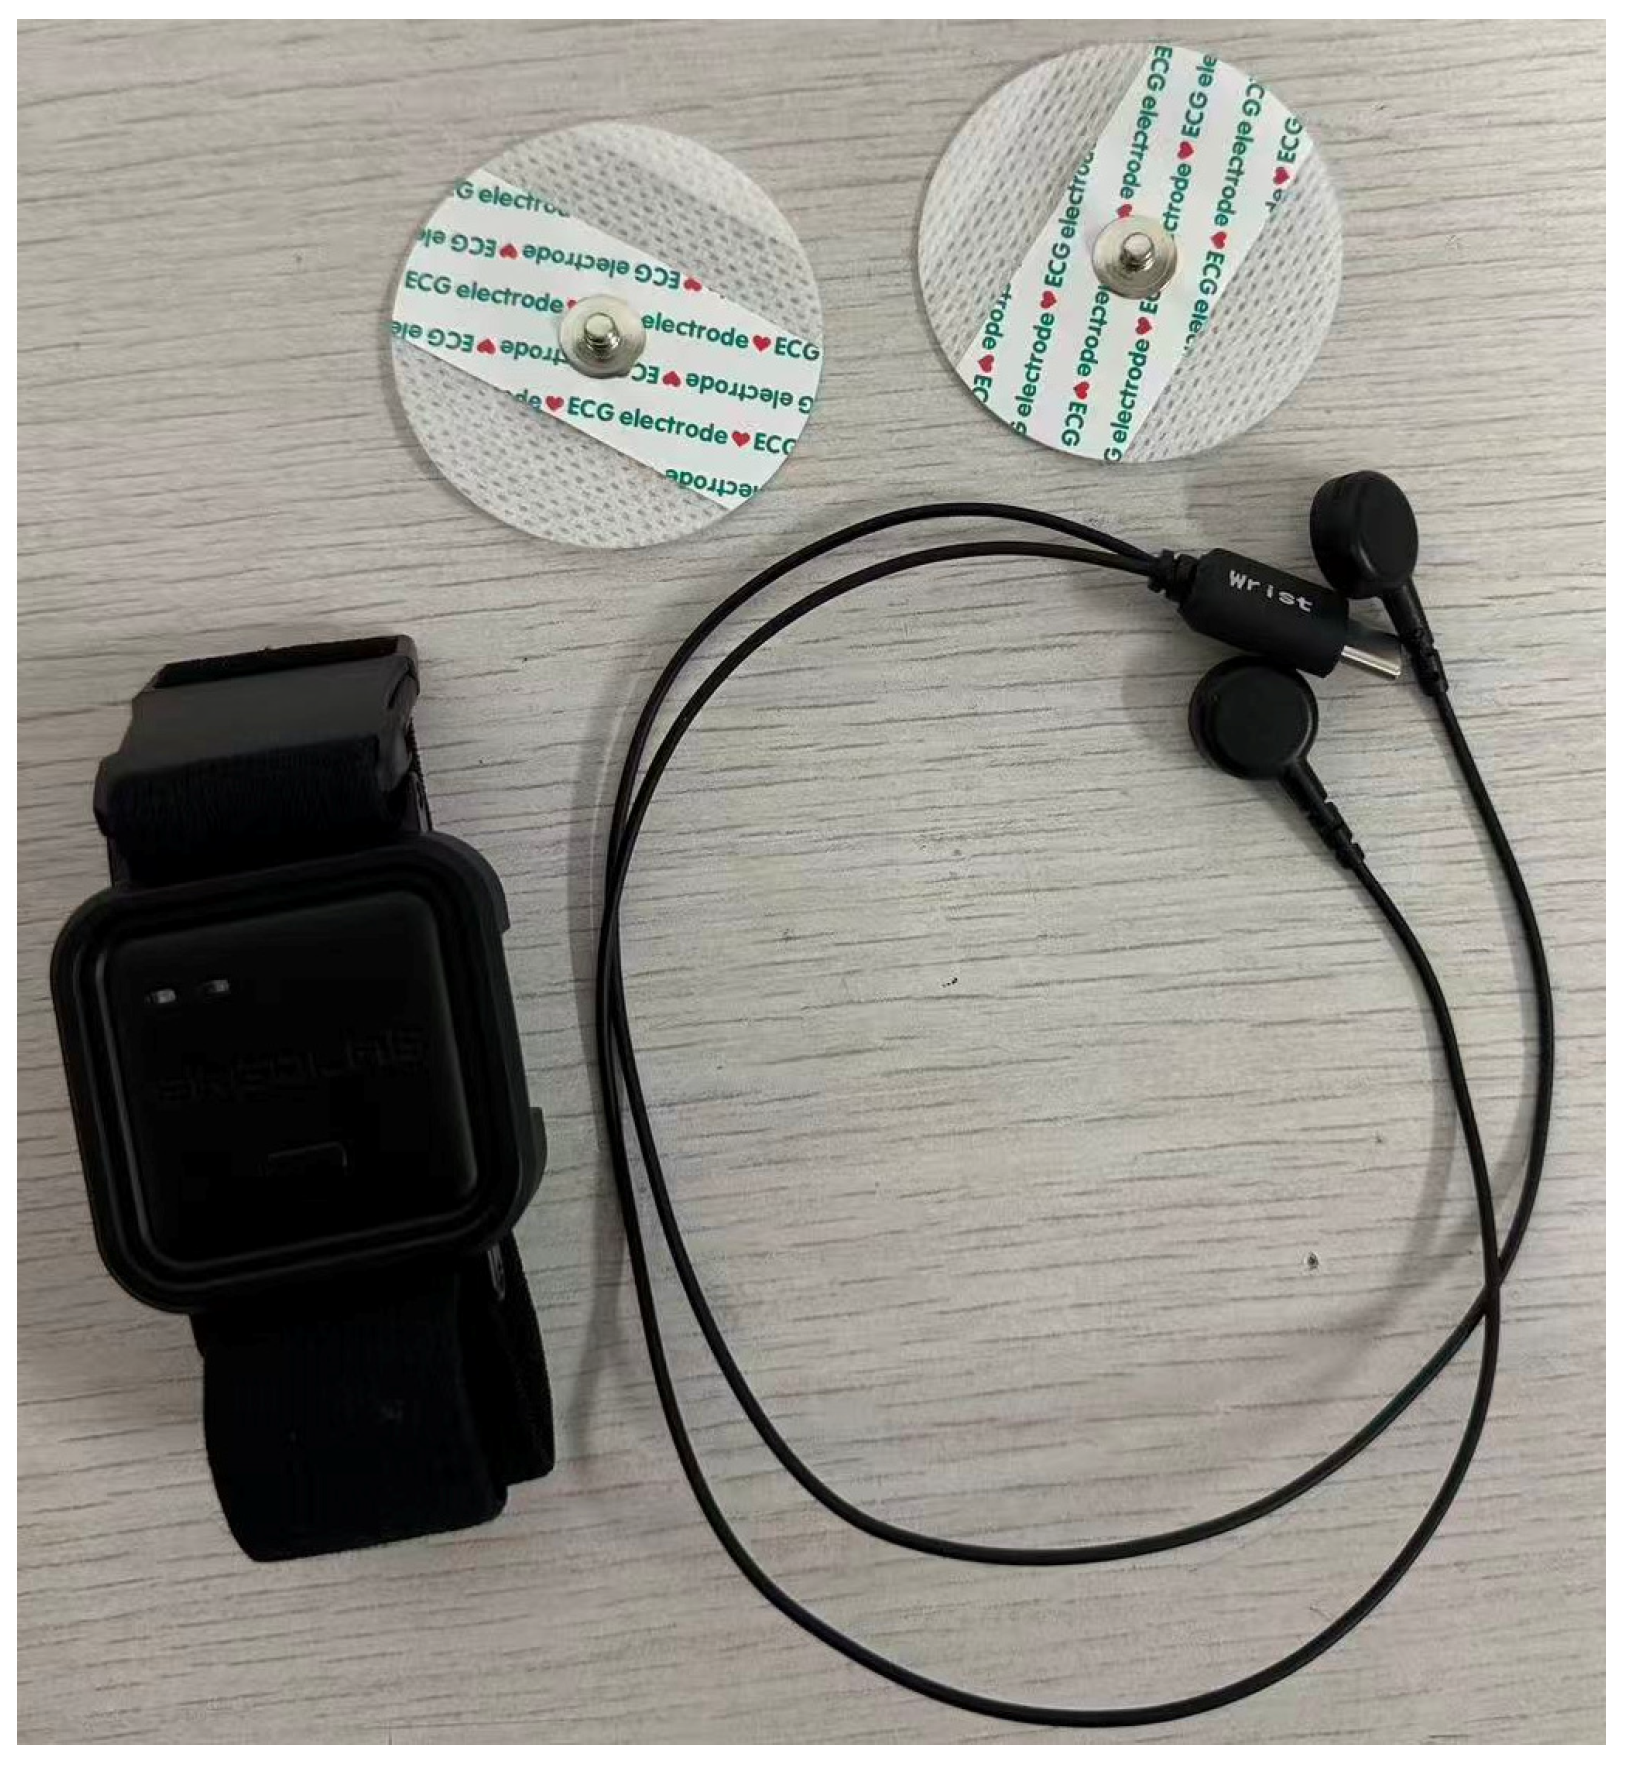
EDA was recorded at 64 Hz using an ErgoLAB EDA wireless skin-conductance sensor (Kingfar International Inc., Beijing, China;
Figure 5). Two Ag/AgCl-coated electrodes were attached to the volar pads of the participant’s left index and middle fingers. The left hand was supported and kept relaxed throughout recording to minimize movement-related disturbance [
25,
26].
A 60 s resting baseline was recorded before each material condition. The formal recording lasted 120 s under the 95° study posture and 300 s under the 135° nap posture. The final 60 s of each trial was used as the steady phase.
EDA data were exported from the acquisition software and visually inspected before feature extraction. No additional offline filtering was applied. The recordings were visually inspected for obvious signal discontinuities and electrode-contact loss. No recording showed an artifact requiring trial exclusion, and all trials were retained.
For each participant, posture, and material condition, baseline mean EDA, steady-phase mean EDA, overall mean EDA, and the change from baseline to the steady phase were extracted. The change score was calculated as:
where
and
are the mean EDA values during the steady and baseline phases, respectively.
To reduce inter-individual differences, each EDA feature was standardized within each participant across the five materials under the same posture:
where
is the standardized score;
is the original feature value, and
and
are the corresponding mean and standard deviation across material conditions.
Direction correction treated lower arousal disturbance as favorable under the 95° posture, and lower steady-state arousal together with a greater reduction from baseline as favorable under the 135° posture. After direction correction and normalization, the within-participant standardized ΔEDA score, the normalized raw ΔEDA score, the steady-phase mean, and the overall mean were combined using weights of 0.45, 0.35, 0.10, and 0.10, respectively:
where the four
D terms are the direction-corrected normalized scores. Higher
E values indicate more favorable physiological adaptation. Because EDA reflects overall autonomic arousal rather than a localized anatomical response, the same material-level EDA score was paired with the pressure scores of the three body regions under the corresponding posture.
2.6. Subjective Comfort Assessment
Subjective responses were recorded immediately after each material trial using a seven-point Likert scale ranging from 1 (“strongly disagree”) to 7 (“strongly agree”). The pressure questionnaire assessed general surface interaction and region-specific perceptions of support, pressure uniformity, and pressure-related discomfort, together with posture-specific study stability or nap relaxation. The EDA-associated questionnaire assessed calmness, tension, physiological discomfort, contact acceptance, and posture-specific psychological state [
17,
18].
For each body region, the regional subjective score was calculated as the mean of the three region-specific items and normalized to:
where
R is the original regional rating. The regional pressure-questionnaire score was used for weak subjective calibration of the final index. The EDA-associated questionnaire was used only as a convergent assessment and was not entered again into the final index.
Cronbach’s alpha was 0.742 for the general pressure-contact scale and ranged from 0.861 to 0.893 for the regional scales. The EDA-associated physiological-state scale had alpha values of 0.967 under the 95° posture and 0.972 under the 135° posture. Material-level descriptive results are provided in
Appendix A,
Table A3. The complete pressure-distribution and EDA-associated questionnaires are provided in
Appendix B,
Table A4 and
Table A5, respectively.
2.7. Layered Fusion and Integrated Interface-Suitability Index
The three data sources were integrated in layers because they differed in spatial resolution. Pressure data were specific to posture, body region, and material; EDA was specific to posture and material; and subjective ratings represented perceived suitability [
17,
18,
25,
26,
32]. All indices entering the fusion procedure were dimensionless.
Pressure and EDA were first integrated at the participant level. The posture-specific layered fused suitability index was calculated as:
where
is the dimensionless EDA correction weight. The main analysis used
, retaining pressure as the dominant component while using EDA as a physiological correction.
The two posture-specific indices were then matched by participant, body region, and material and combined as:
The 135° posture received a higher weight because nap performance was the primary function examined. Alternative posture-weight combinations were evaluated in the sensitivity analysis.
Subjective ratings were introduced as a weak calibration term:
where
is the subjective calibration weight. The main analysis used
. Group means and standard deviations were calculated only after all participant-level fusion steps had been completed.
The geometric formulation used throughout the fusion process limits direct compensation between weak and strong components. The resulting index is therefore interpreted as a comparative decision-support measure within the tested material set rather than as an absolute measure of perceived comfort.
2.8. Exploratory Stiffness–Suitability Trend Modeling and Threshold-Based Range Estimation
To examine the relationship between equivalent support stiffness and integrated interface suitability, the mean of the 26 participant-level final indices was calculated for each material and body region. A quadratic model was then fitted separately for each body region:
where
is the predicted dimensionless suitability index for body region, and
is the equivalent support stiffness expressed in kPa. Dimensional consistency therefore requires
to have units of kPa
−2,
to have units of kPa
−1, and
to be dimensionless.
When the fitted curve showed an internal maximum, the model-predicted peak location was calculated as:
where
is expressed in kPa.
Because only five material systems were tested, the quadratic model was used as an exploratory trend model within the observed stiffness range rather than as a general psychophysical law. A threshold-based 90%-of-predicted-peak range was defined as:
where
is the maximum predicted suitability value of body region
. This range is a model-derived threshold estimate rather than a statistical confidence interval. When the predicted maximum occurred at the boundary of the measured stiffness range, it was reported as a boundary peak.
2.9. Statistical Analysis
All pressure, EDA, posture-specific fused, and final integrated indices were calculated at the participant level. Descriptive results are reported as mean ± sample standard deviation across the 26 participants. Sample standard deviation, calculated using n − 1, was used for all error bars.
Because all participants completed all five material conditions, material effects on the final integrated suitability index were examined separately within each body region using Friedman repeated-measures tests. Significant Friedman tests were followed by paired Wilcoxon signed-rank comparisons, with Holm adjustment for multiple comparisons. Statistical significance was set at p < 0.05. Posture-specific material rankings and posture-weight sensitivity were examined descriptively, and the quadratic stiffness models were interpreted only as exploratory trends within the measured stiffness range.
Material effects on the subjective ratings were also examined using Friedman repeated-measures tests. Kendall’s W was reported as the effect size, followed by Wilcoxon signed-rank comparisons with Holm adjustment where appropriate.
4. Discussion
4.1. Material Response and Contact-Interface Performance
The five contact interfaces exhibited distinct mechanical and physiological responses related to their different structural characteristics. Rigid PP provides limited local conformity, whereas the TPU-surfaced PP laminate combines a relatively compliant surface layer with a rigid substrate. The overall mechanical response of M2 therefore reflects the coupled TPU–PP assembly rather than the intrinsic behavior of TPU alone.
Closed-cell EVA and flexible PU foam redistribute loads through cellular deformation. EVA undergoes progressive cell-wall deformation and densification, while flexible PU foam exhibits pronounced viscoelasticity, stress relaxation, and cyclic hysteresis [
10,
11,
12]. Woven mesh provides support through tensioned textile architecture, yarn bending, and inter-yarn interaction [
13].
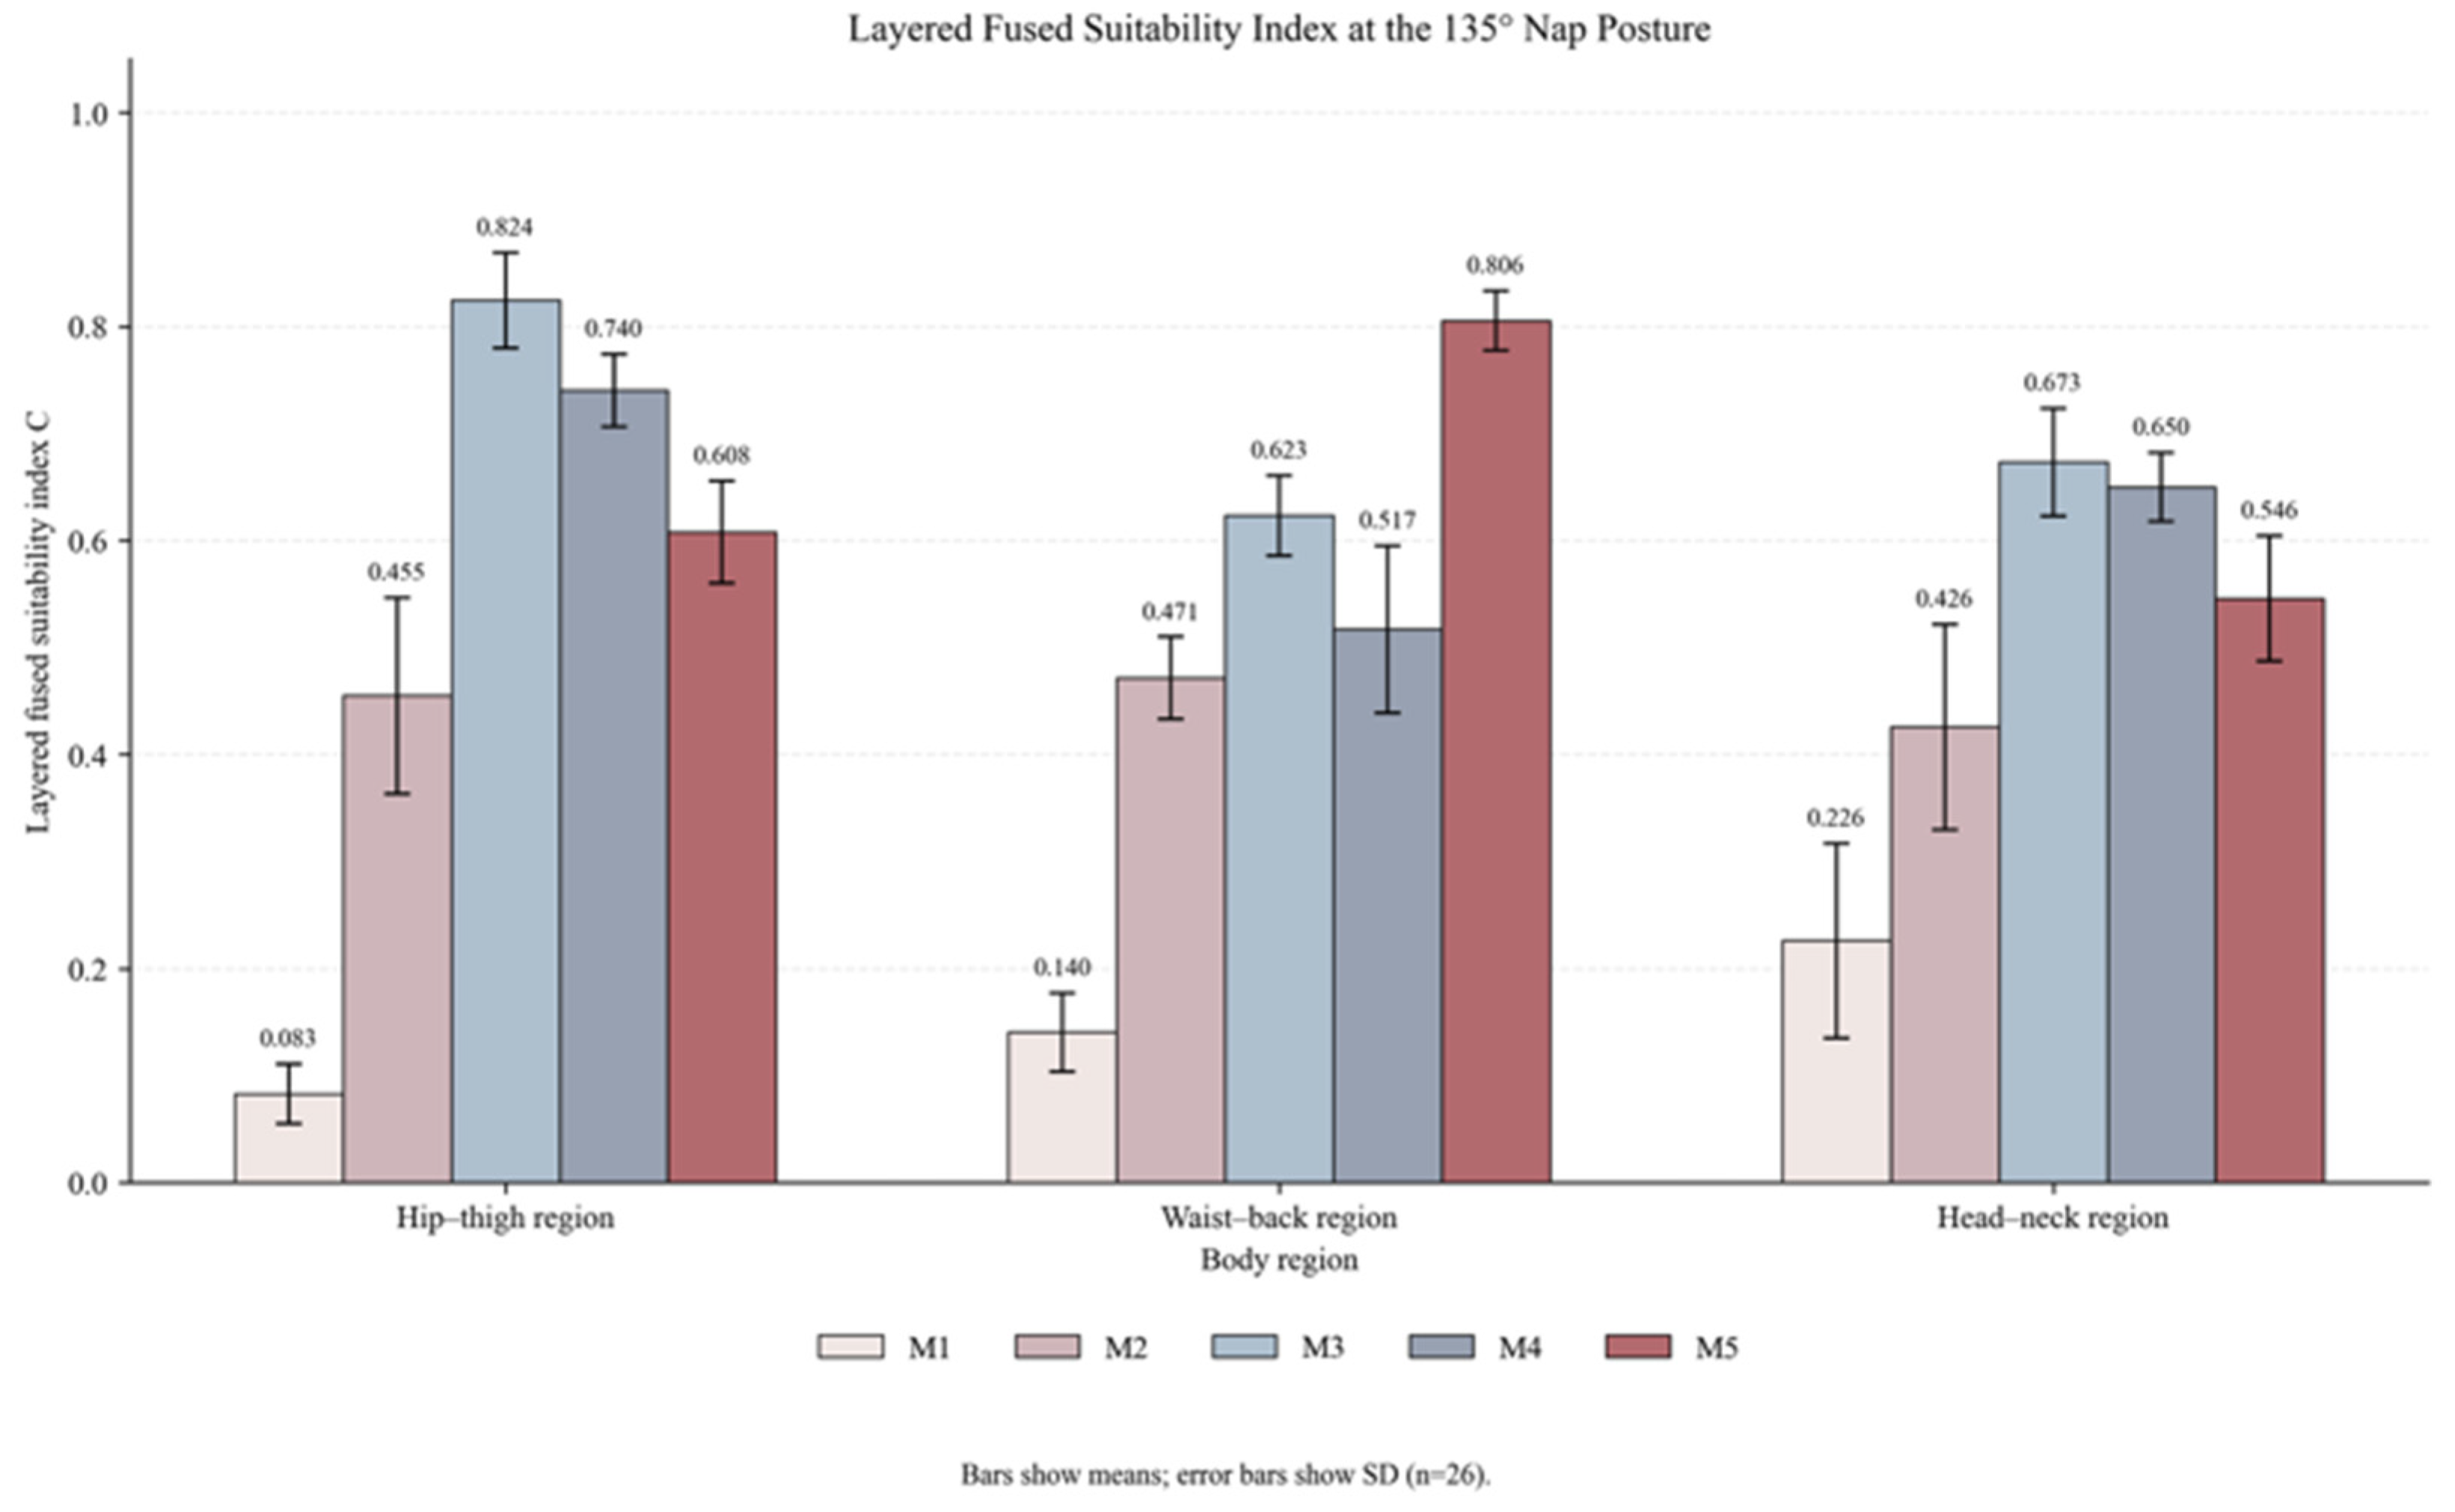
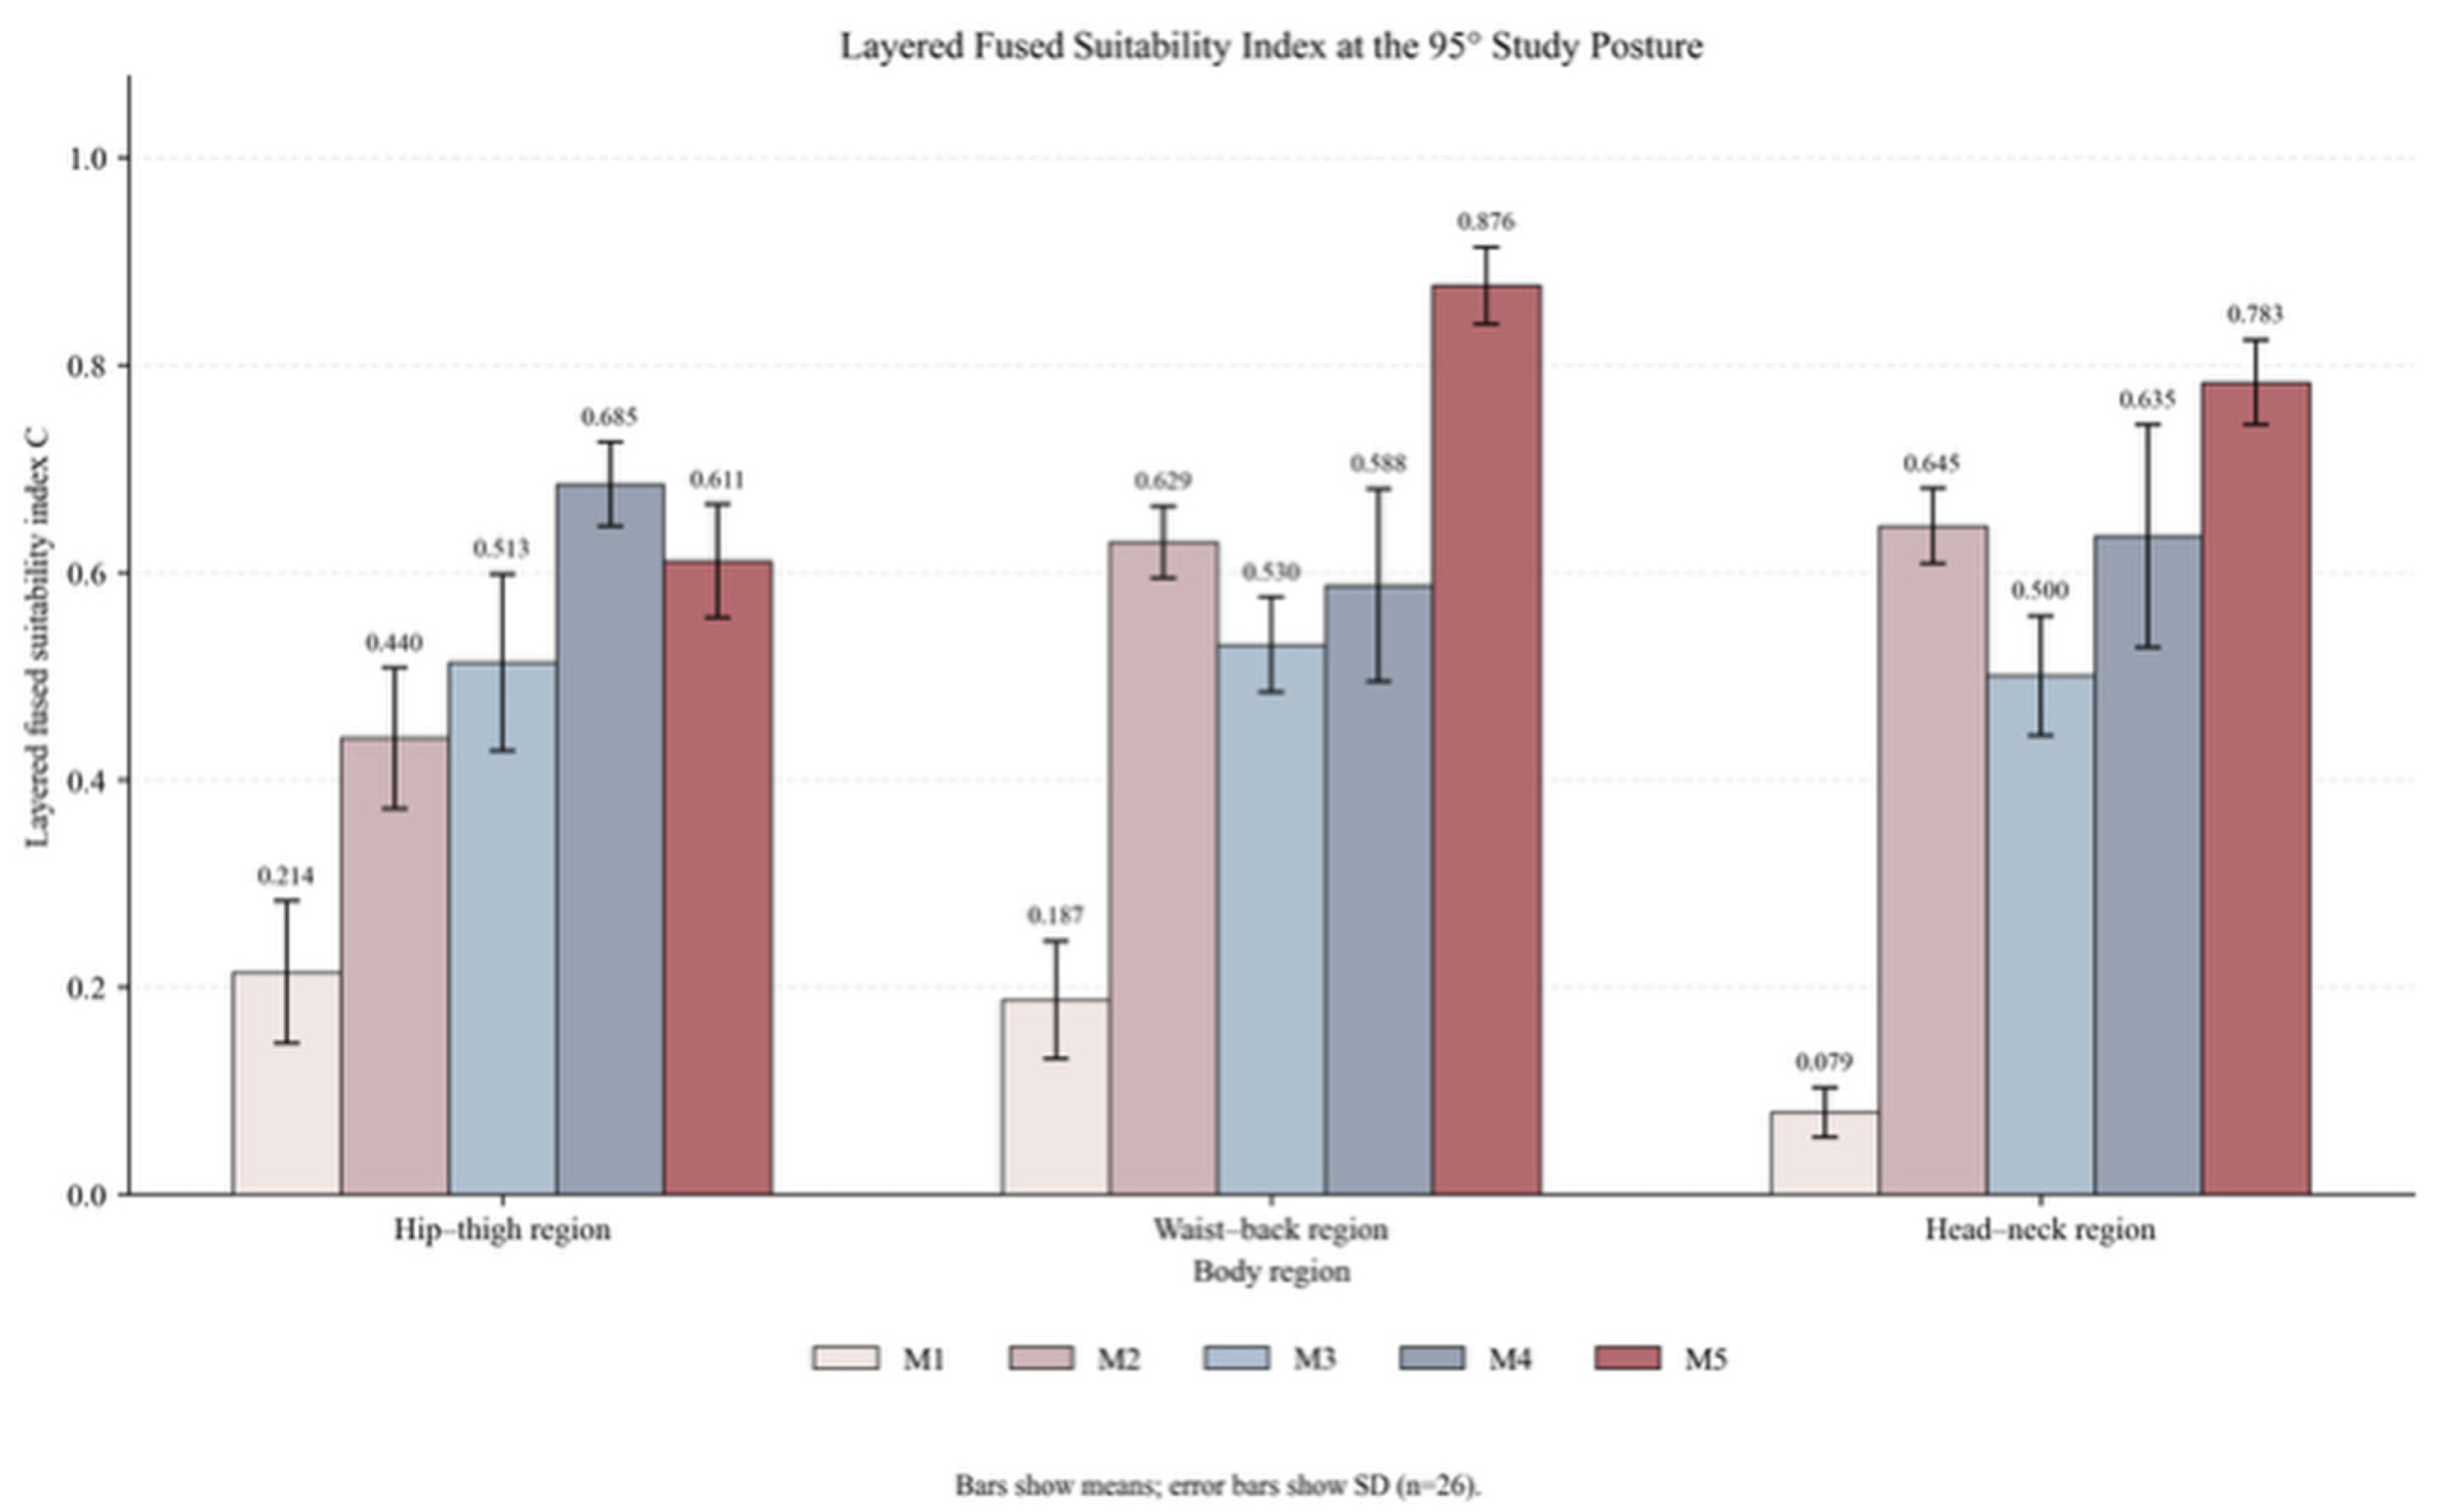
These structural differences were reflected in the posture- and region-specific fused results. Under the 95° study posture, closed-cell EVA foam showed the highest suitability in the hip–thigh region, whereas flexible PU foam ranked highest in the waist–back and head–neck regions. Under the 135° nap posture, woven mesh ranked highest in the hip–thigh and head–neck regions, while flexible PU foam ranked highest in the waist–back region. These differences reflect the distinct requirements of upright support and reclining conformity [
14,
15,
16,
27,
28,
29].
CV and edge pressure-gradient magnitude showed different material patterns. Lower pressure heterogeneity did not necessarily coincide with smoother boundary transitions, confirming that mean pressure, contact area, CV, and edge pressure-gradient magnitude describe complementary aspects of body–surface interaction [
19,
20,
21,
22,
23,
24].
4.2. Surface-Layer Performance Depends on Posture and Body Region
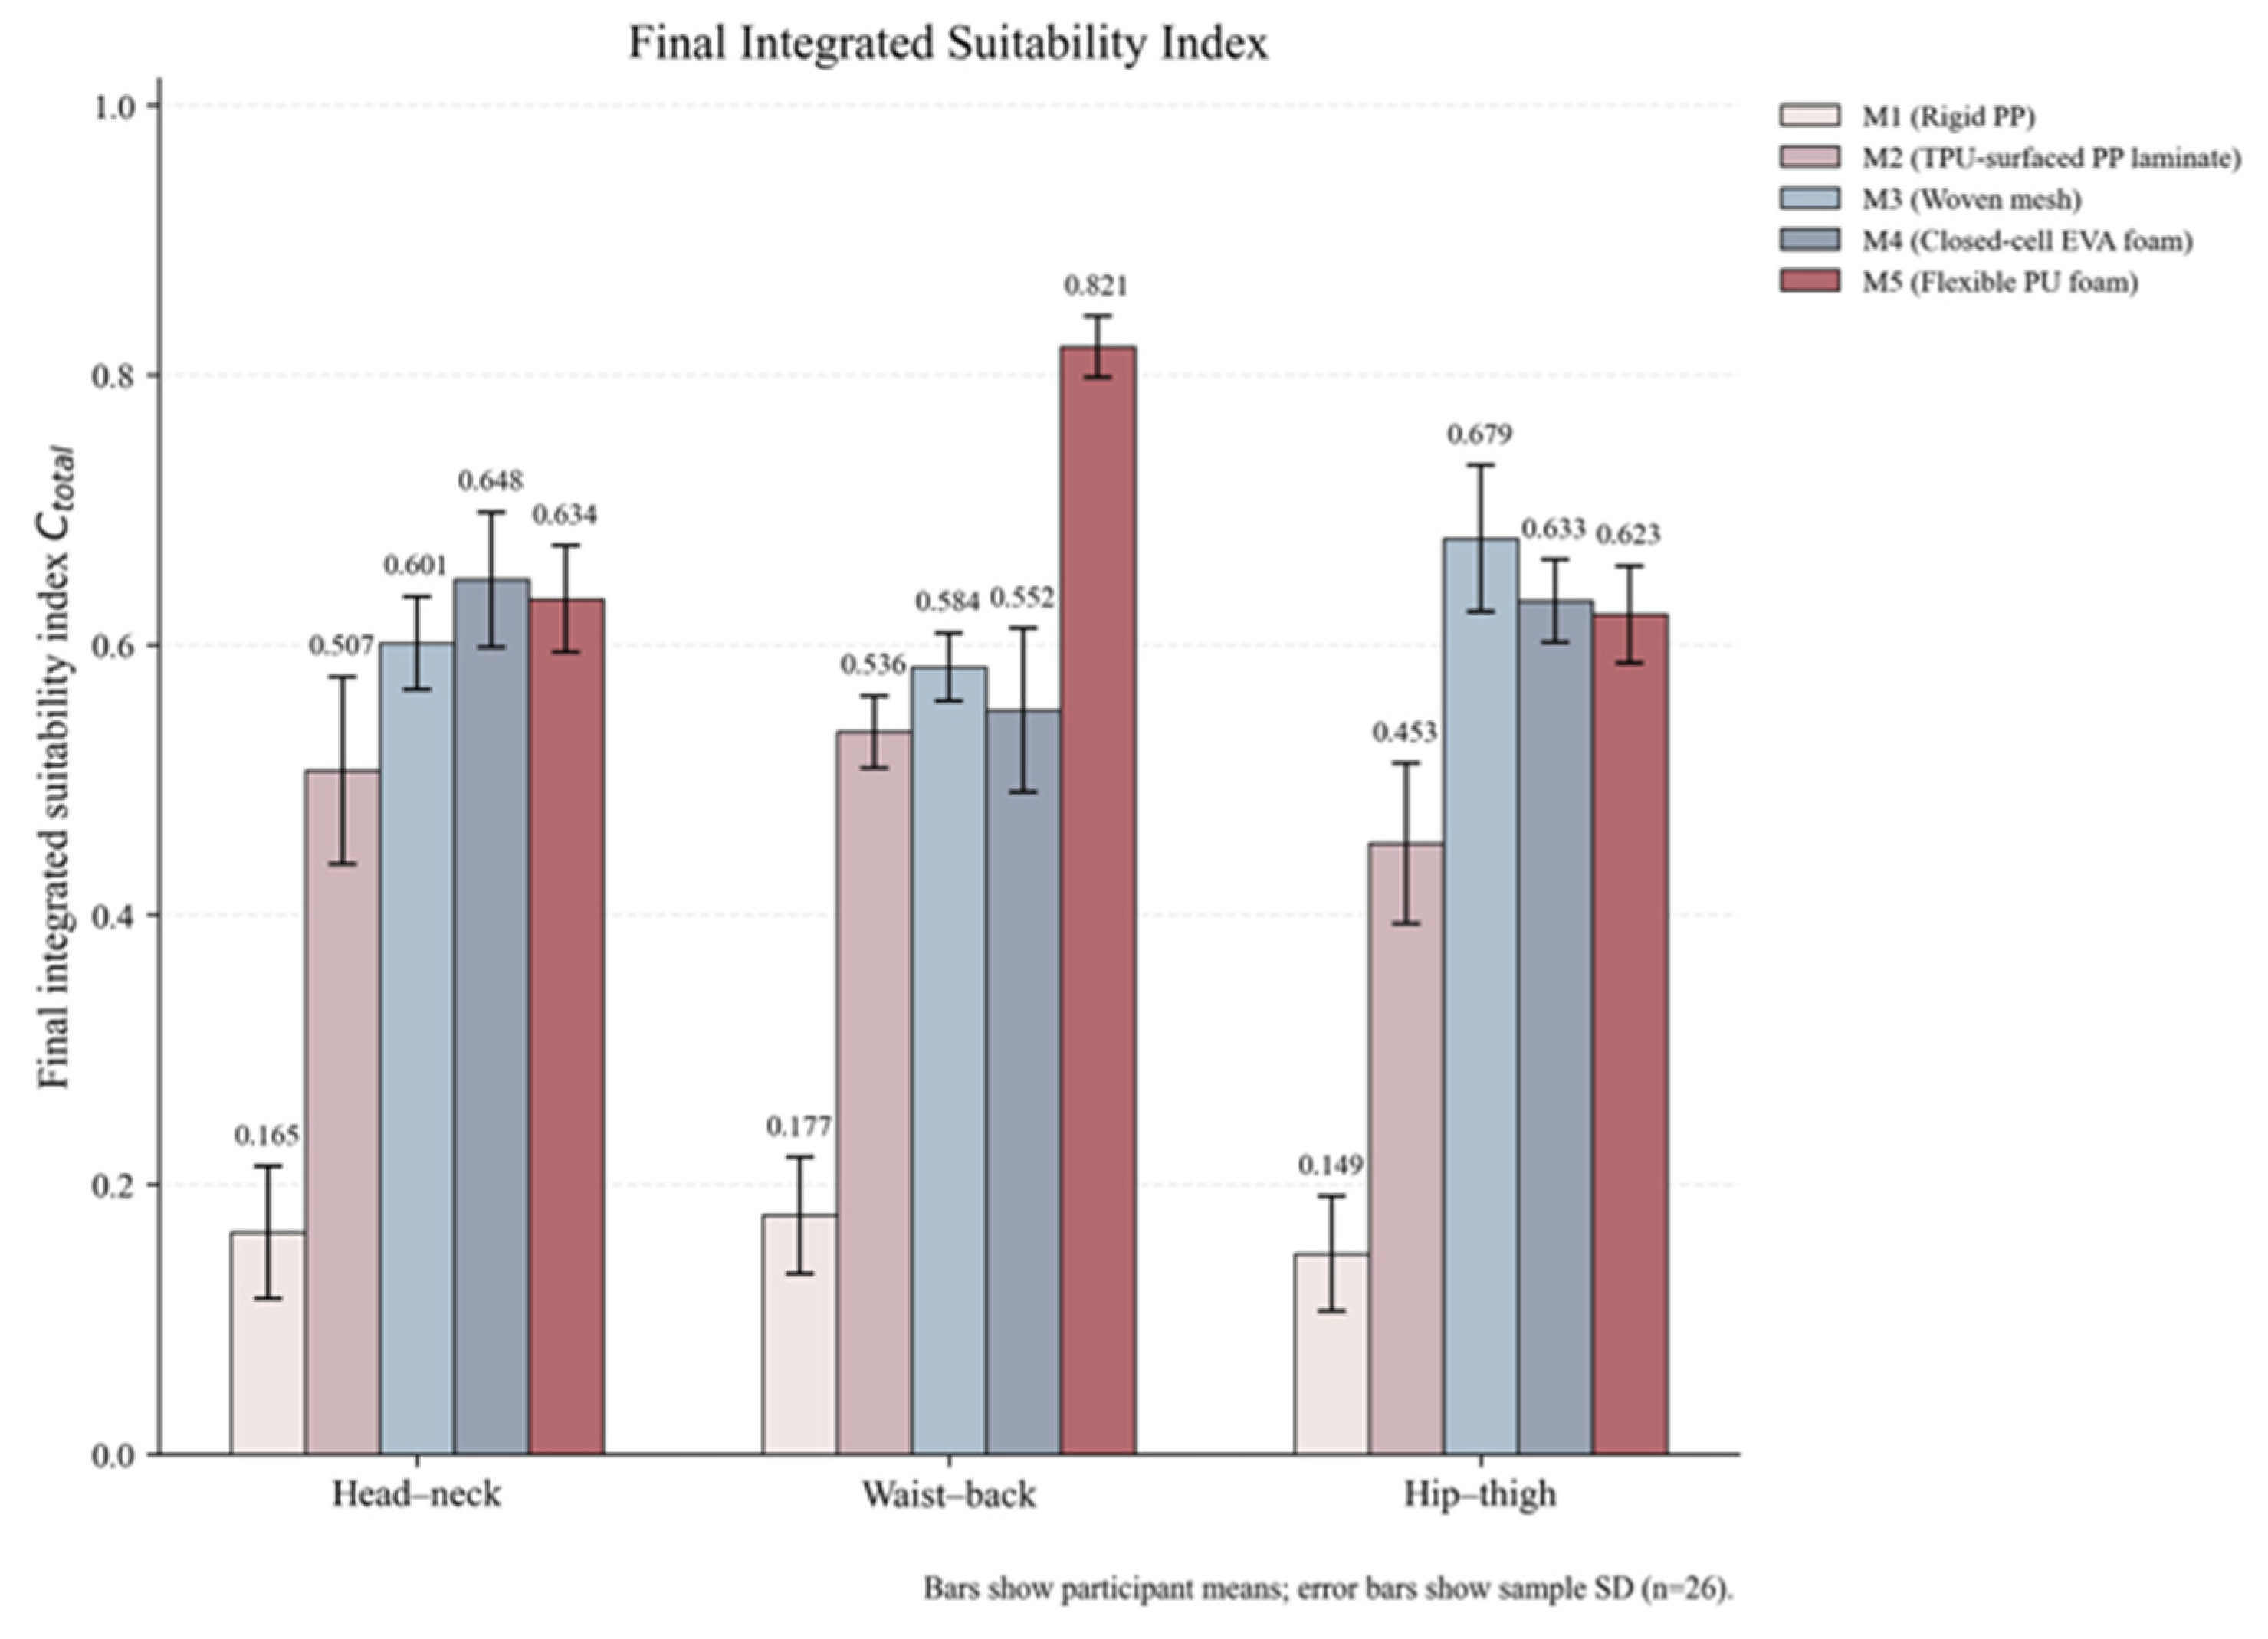
The final integrated results showed clear regional differences. Closed-cell EVA foam ranked highest in the head–neck region, flexible PU foam ranked highest in the waist–back region, and woven mesh ranked highest in the hip–thigh region. This finding supports region-specific interface selection rather than the use of a uniform surface material over the entire chair.
Closed-cell EVA foam and flexible PU foam were statistically comparable leading alternatives in the head–neck region, whereas flexible PU foam and woven mesh showed statistically supported advantages in the waist–back and hip–thigh regions, respectively. These differences are consistent with regional variations in load transfer, support function, and pressure sensitivity [
17,
18,
19,
20,
21,
30,
31].
The preferred material under an individual posture did not always remain the leading material after study–nap integration and subjective calibration. For example, woven mesh ranked highest in the head–neck region under the 135° posture, whereas closed-cell EVA foam achieved the highest final integrated index. This difference shows that posture-specific performance alone does not determine the final material recommendation.
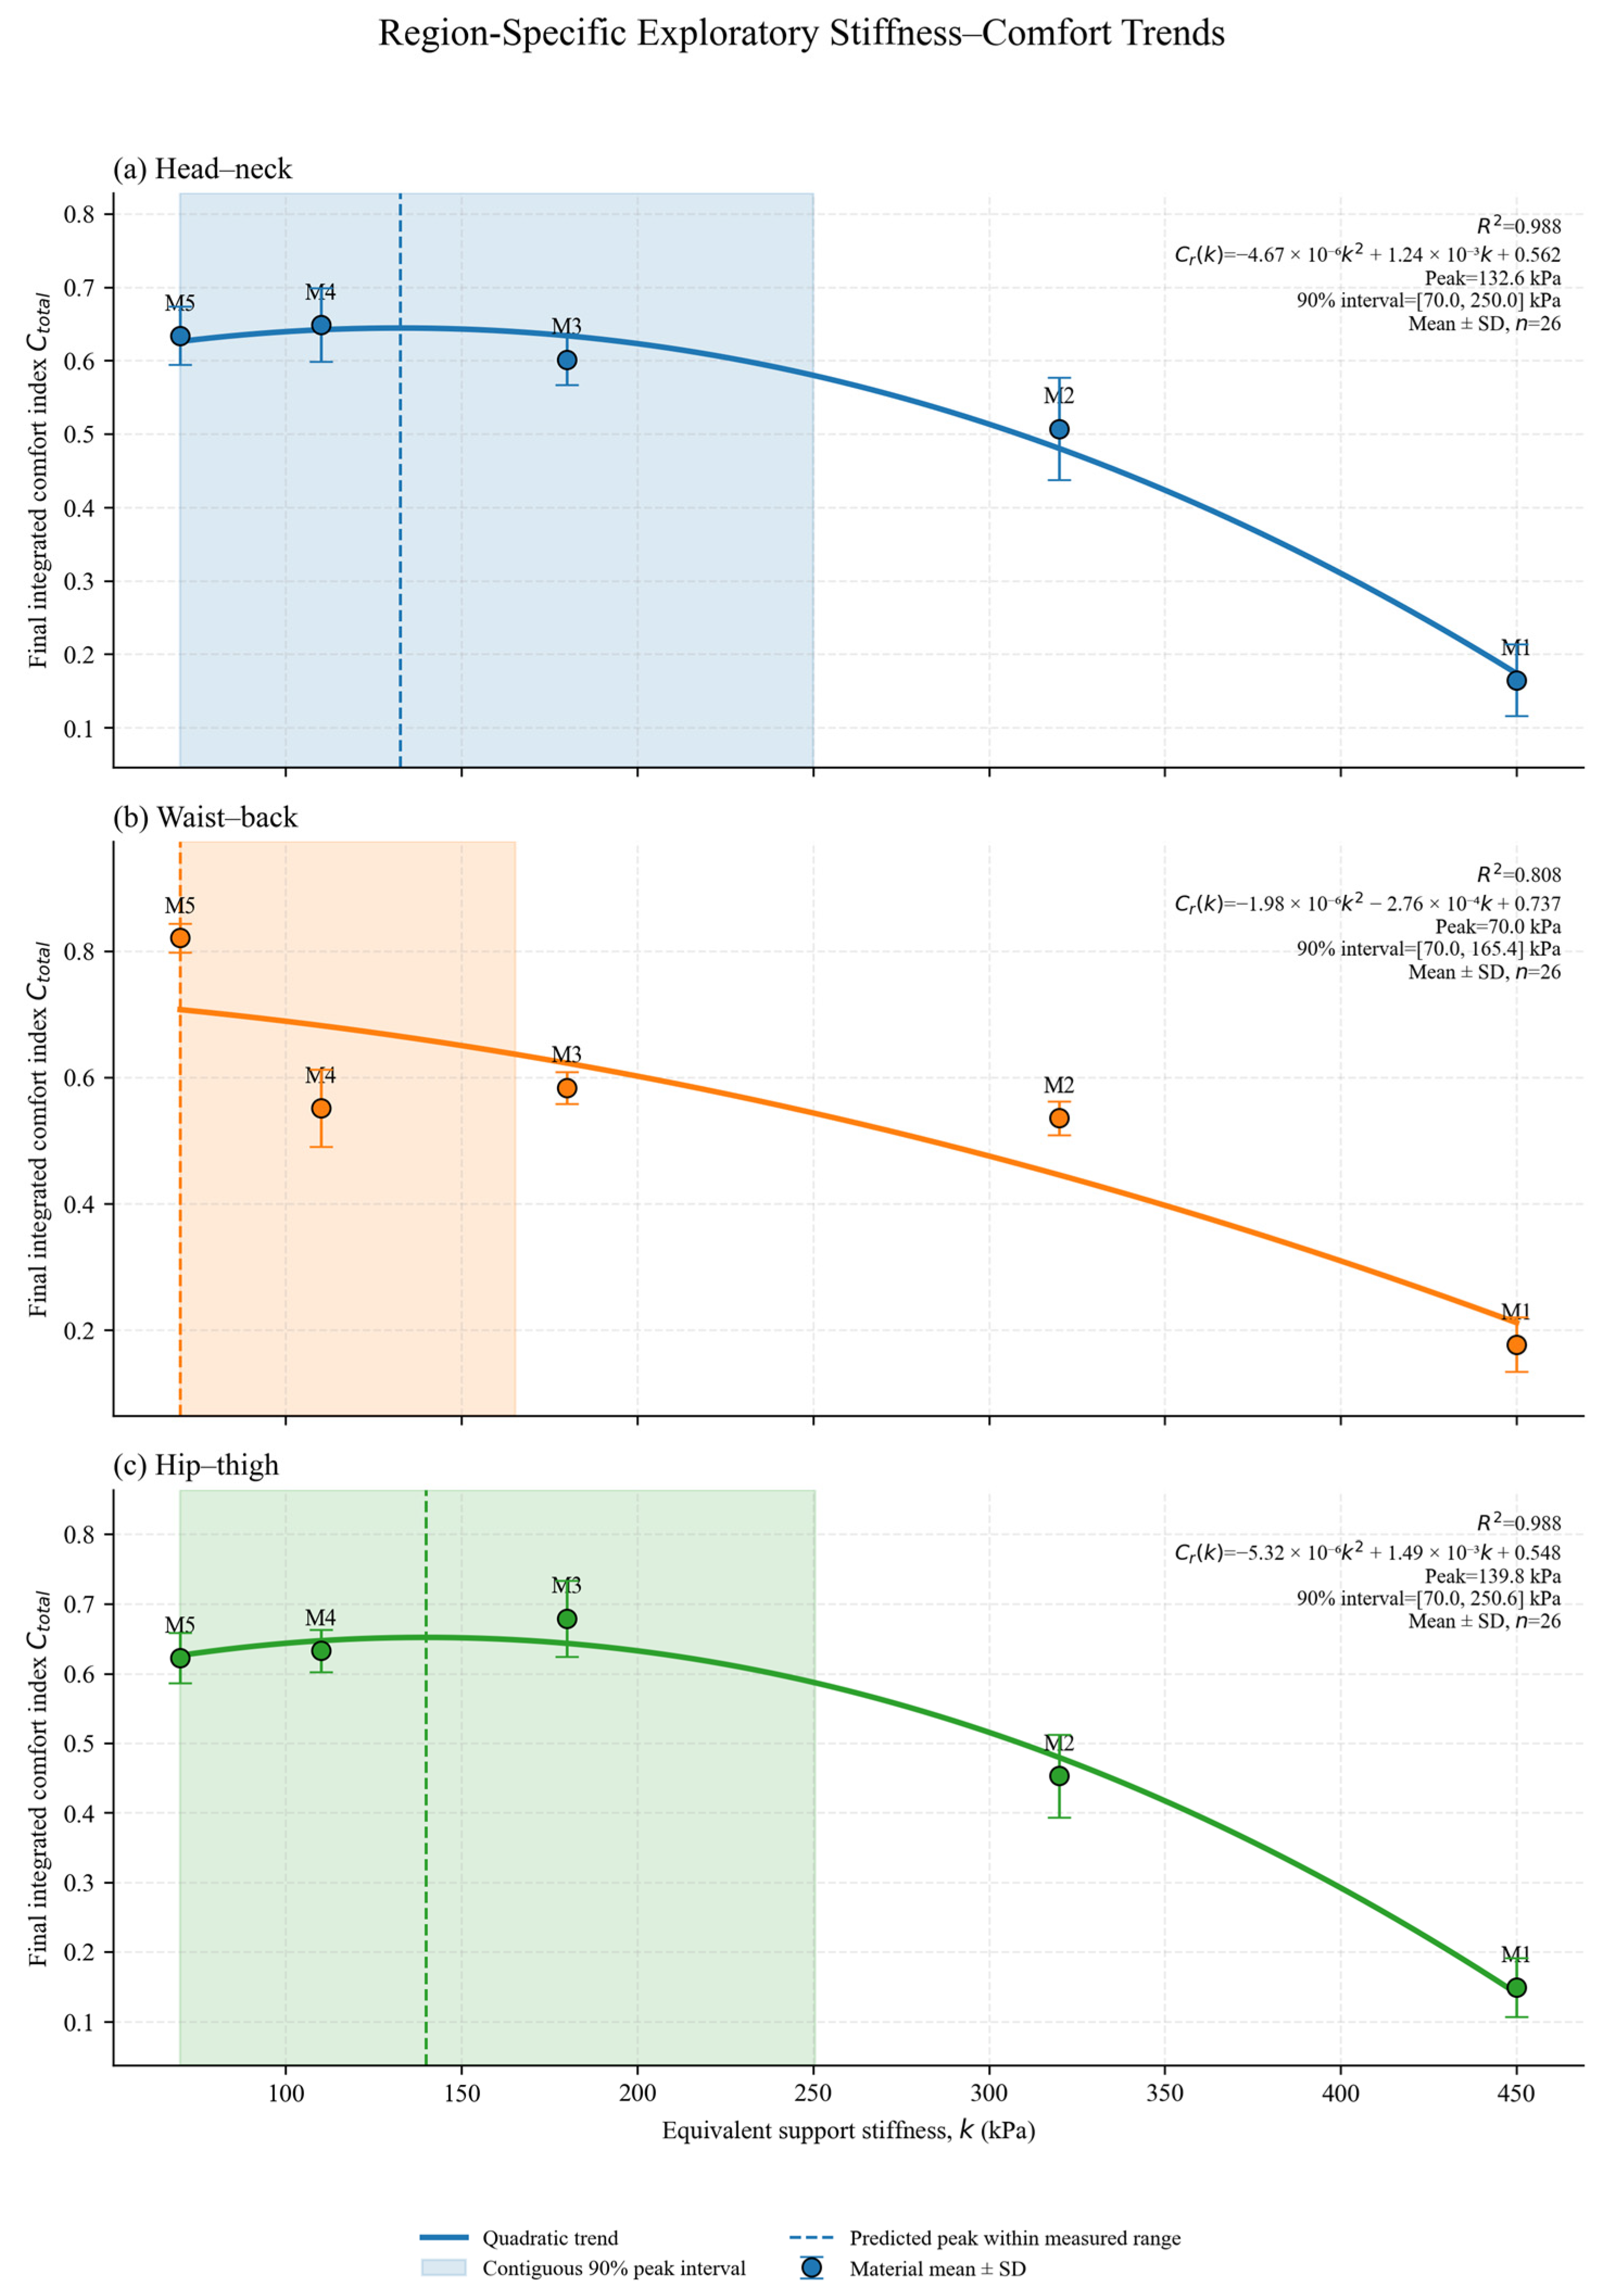
The updated stiffness models also showed regional differences. The head–neck and hip–thigh regions had model-predicted peak locations of approximately 130 and 140 kPa, respectively, whereas the waist–back response was highest at the lower boundary of the measured stiffness range. These exploratory trends indicate that highly rigid interfaces were generally unfavorable within the tested range, although stiffness alone cannot explain the material rankings.
The TPU-surfaced PP laminate showed intermediate performance in several conditions but did not rank first in any final region. This result applies only to the specific commercial TPU–PP assembly tested in this study and should not be generalized to TPU coatings with other formulations, thicknesses, substrates, or processing conditions. Because the TPU surface layer and PP substrate were not independently varied or characterized, the contribution of the TPU coating itself could not be isolated.
4.3. Interpretation of the Multimodal Fusion Framework
The layered framework preserved the distinct measurement roles of pressure mapping, EDA, and subjective evaluation. Pressure mapping characterized region-specific mechanical interaction, whereas EDA represented posture- and material-level autonomic adaptation rather than a localized anatomical response [
25,
26,
32]. Subjective ratings were therefore used as a weak calibration term rather than as a substitute for objective measurements, consistent with the recognized distinction between objective seating measures and perceived comfort [
17,
18].
Within the pressure layer, the four direction-corrected indicators were combined using an equal-weight geometric mean. Equal weighting was retained as a transparent primary assumption, while the geometric aggregation limited compensation between favorable and unfavorable indicator scores.
The differences between the posture-specific and final integrated rankings further demonstrate the complementary roles of the data sources. After study–nap integration and weak subjective calibration, closed-cell EVA foam ranked highest in the head–neck region, flexible PU foam in the waist–back region, and woven mesh in the hip–thigh region. These results differed from some individual-posture rankings because the final index incorporated mechanical, physiological, and perceptual responses across both postures.
The composite index should be interpreted as a comparative decision-support measure within the tested material set rather than as an absolute psychometric measure of comfort.
4.4. Implications for Textile, Coated, and Foam Interface Design
The results highlight the need to treat body-contact surfaces as complete interface systems. Mechanical response depends on the combined behavior of the surface layer and supporting structure, while tactile perception is influenced by surface roughness, friction, and topography [
1,
2,
3]. Thermal and moisture interaction, ventilation, adhesion, abrasion resistance, and repeated-use durability are also relevant to practical interface performance [
33,
34,
35,
36,
37,
38,
39,
40,
41,
42,
43,
44,
45,
46].
For classroom nap-chair design, the results suggest a compliant foam interface, represented by M4 or M5, for the head–neck region, an M5 interface for the waist–back region, and an M3 interface for the hip–thigh region. The exploratory models indicated peak locations near 130 kPa for the head–neck region and 140 kPa for the hip–thigh region, whereas the waist–back response was highest at the lower measured boundary of 70 kPa.
Closed-cell EVA foam, with an equivalent stiffness of 110 kPa, was close to the predicted head–neck peak and achieved the highest final suitability in this region. Flexible PU foam represented the most compliant tested interface and ranked highest in the waist–back region. Woven mesh, with an equivalent stiffness of 180 kPa, lay within the broad threshold-based range of the hip–thigh model and achieved the highest final suitability for this region.
These responses cannot be attributed to stiffness alone. Cellular structure, yarn architecture, pretension, friction, ventilation, and surface geometry also contribute to interface performance [
13].
For TPU-based coated systems, coating-specific properties may affect contact performance, but they were not measured in the present study [
33,
34,
35,
36,
37,
38,
39,
40,
41]. Future work should therefore characterize and vary coating and substrate parameters independently rather than treating the coated assembly as a single fixed condition.
From a product-development perspective, region-specific and replaceable interface modules may also support maintenance, repair, and material efficiency. Such strategies are consistent with broader approaches to durable and circular furniture design [
47,
48,
49,
50,
51].
4.5. Limitations and Future Work
Several limitations should be acknowledged. First, only five contact-interface systems were tested. The quadratic stiffness–suitability models therefore have limited resolution and should be interpreted only as exploratory trends within the measured 70–450 kPa range. Although the descriptive fits were relatively high, additional materials with intermediate stiffness values are required to verify the predicted peaks and intervals.
Second, only one commercial TPU-surfaced PP laminate was evaluated. Coating thickness, surface roughness, friction coefficient, wettability, adhesion, and abrasion resistance were not experimentally measured, and the TPU formulation was not independently identified or controlled. Therefore, the present results describe the end-use performance of the assembled TPU–PP interface rather than the isolated effect of the TPU coating or any individual coating property [
33,
34,
35,
36,
37,
38,
39,
40,
41].
Third, equivalent support stiffness was measured under quasi-static compression and does not fully characterize strain-rate dependence, hysteresis, stress relaxation, cyclic fatigue, or recovery, which are relevant to polymeric and cellular interfaces [
8,
9,
10,
11,
12].
Because only two functional postures were examined, the results should not be interpreted as defining a continuous relationship between backrest angle and interface suitability. Ambient temperature and humidity were not continuously monitored, clothing was not fully standardized, and the same specimens were reused across the experimental series. These factors may have influenced friction, heat transfer, and viscoelastic recovery. In addition, EDA is sensitive to autonomic responses beyond contact comfort and is not anatomically localized [
25,
26,
32].
The pressure-mapping mat introduced an intermediate layer during pressure measurement and may have affected local deformation, friction, thermal and moisture transfer, and direct tactile perception. Because the same mat and placement procedure were used in all pressure trials, the results should be interpreted as comparative responses under a standardized mat condition. The mat was removed during the separate EDA and subjective-comfort assessments.
Participant characteristics may have influenced the absolute body–surface responses. Greater body mass may increase transmitted load, while BMI and individual body geometry may affect contact area and regional pressure concentration. Sex-related anthropometric differences and habitual sitting strategies may also alter pelvic orientation, trunk support, and load transfer. The repeated-measures design reduced these between-participant influences because each participant completed all material conditions; however, the sample size was not sufficient for reliable sex- or BMI-stratified interaction analyses, and habitual sitting posture was not systematically recorded. The findings should therefore be interpreted as average within-participant responses across the sampled anthropometric range.
Finally, equal weighting was used as a transparent primary assumption rather than as evidence that the four pressure indicators have identical physiological importance. Future studies should validate indicator importance against independent discomfort outcomes and larger material sets. Future studies should also recruit larger target-user samples across predefined anthropometric strata and systematically record habitual sitting posture and prior experience with reclining classroom chairs. Controlled environmental and clothing conditions, additional stiffness levels, cyclic mechanical testing, and systematic coating characterization are also required.
5. Conclusions
Experimental findings. This study evaluated five assembled classroom nap-chair contact interfaces in 26 participants across a 95° study posture, a 135° nap posture, and three body regions. Under the 95° posture, M4 had the highest mean suitability in the hip–thigh region, whereas M5 had the highest mean suitability in the waist–back and head–neck regions. Under the 135° posture, M3 had the highest mean suitability in the hip–thigh and head–neck regions, whereas M5 had the highest mean suitability in the waist–back region. Final integration showed significant material effects within all three body regions (Friedman χ2 (4) = 90.246–96.769, all p < 0.001). M4 had the highest mean suitability in the head–neck region but did not differ significantly from M5 (Holm-adjusted p = 0.075). In contrast, M5 in the waist–back region and M3 in the hip–thigh region were significantly higher than the corresponding second-ranked interfaces (Holm-adjusted p < 0.001). Exploratory stiffness models indicated peak locations near 130 kPa for the head–neck region and 140 kPa for the hip–thigh region, whereas the waist–back response was highest at the lower measured boundary of 70 kPa.
Practical implications. The findings support region-specific interface allocation rather than the use of a uniform material across the complete chair. Within the tested interface set, either M4 or M5 may provide a suitable compliant option for the head–neck region, while M5 and M3 showed statistically supported advantages in the waist–back and hip–thigh regions, respectively. The results also indicate that surface layers, substrates, textile structures, and cellular materials should be designed and evaluated as coupled contact-interface systems. The corresponding threshold-based ranges were approximately 70–250 kPa for the head–neck region, 70–170 kPa for the waist–back region, and 70–250 kPa for the hip–thigh region. These ranges are exploratory model estimates rather than confidence intervals or validated universal stiffness limits.
Study limitations. The study compared only five complete interface assemblies and included only one commercial TPU-surfaced PP laminate. The TPU layer and PP substrate were not independently varied, and coating thickness, surface roughness, friction, wettability, adhesion, abrasion resistance, and TPU formulation were not experimentally characterized. Only two preset functional postures were examined, and the sample size was insufficient for reliable analyses across sex- or BMI-based subgroups; habitual sitting posture was also not systematically recorded. In addition, pressure analysis was based on one stable 32 × 32 pressure frame per condition rather than a complete pressure time series, and the exploratory stiffness models were fitted to only five material-level observations. The findings should therefore be interpreted as comparative evidence within the tested participants and interface systems, rather than as universal stiffness thresholds or evidence of the isolated performance of TPU coatings. Future studies should include larger anthropometrically stratified samples, additional stiffness levels, complete pressure time series, independent coating characterization, and durability testing under realistic service conditions.