Article

Microstructure and Dry-Sliding Tribology of HVOF-Sprayed NiCrBSi/WC-Co Coatings on AZ91D

1
Department of Automotive Engineering, Faculty of Technology, Firat University, Elazig 23119, Turkey
2
Aircraft Airframe-Engine Maintenance, School of Aviation, Firat University, Elazig 23119, Turkey
3
Department of Electricity and Energy Hybrid and Electric Vehicles Technology Program, Vocational School of Technical Sciences, Hitit University, Çorum 19030, Turkey
4
Aisin Automotive Parts Industry and Trade Inc., Tuzla 34953, Turkey
5
Rare Earth Elements Application and Research Center, Munzur University, Tunceli 62000, Turkey
*
Author to whom correspondence should be addressed.
Coatings 2026, 16(8), 906; https://doi.org/10.3390/coatings16080906
Submission received: 25 June 2026 / Revised: 24 July 2026 / Accepted: 25 July 2026 / Published: 30 July 2026
(This article belongs to the Special Issue Implant Surface Coatings and Biocompatibility Evaluation)

Highlights

  • HVOF formed continuous NiCrBSi/WC-Co coatings on AZ91D magnesium alloy.
  • WC-Co addition increased Vickers microhardness from 776 ± 4 to 959 ± 5 HV0.1.
  • Among the four discrete formulations, the 50 wt.% WC-Co coating showed the lowest wear loss.
  • The 50 wt.% WC-Co coating reduced mean friction by 36.2–40.1% relative to uncoated AZ91D.
  • Field-scale W-Co retention stabilized sliding, while isolated Mg-rich fields indicated local substrate participation.

Abstract
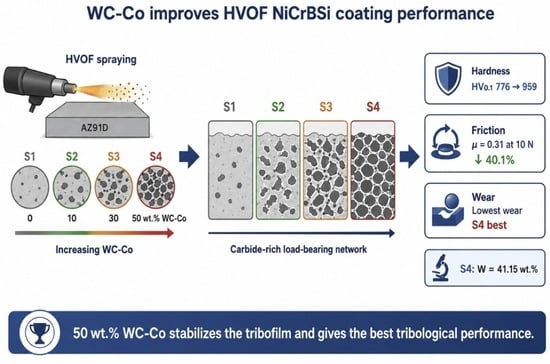
High-velocity oxy-fuel (HVOF)-sprayed NiCrBSi coatings containing 0, 10, 30, and 50 wt.% WC-Co were evaluated on AZ91D magnesium alloy to determine how the discrete reinforcement level affects surface topography, phase constitution, Vickers microhardness, dry-sliding friction, mass loss, and wear-track microchemistry. As-sprayed surfaces were characterized by three-dimensional profilometry; coating cross-sections and worn surfaces by optical microscopy and SEM/EDS; phase constitution by XRD; and mechanical response by HV0.1 indentation. Dry-sliding tests were performed at 10, 30, and 50 N over 100–1000 m. Increasing WC-Co content raised Sa from 8.8 ± 0.3 to 13.0 ± 0.5 µm and Vickers microhardness from 776 ± 4 to 959 ± 5 HV0.1. XRD indicated a γ-Ni-based matrix containing boride/carbide constituents, while WC, W2C, and Co became increasingly prominent in the reinforced coatings. Boride assignments are based on diffraction evidence, whereas B and C EDS signals were treated semi-quantitatively. The 50 wt.% WC-Co coating exhibited the lowest mass loss and mean coefficient of friction at every load. Its mean friction coefficients were 0.31, 0.35, and 0.41 at 10, 30, and 50 N, corresponding to reductions of 40.1%, 38.9%, and 36.2% relative to AZ91D. At 1000 m, its mass-normalized wear rate indices were 9.0 × 10⁻⁴, 4.0 × 10⁻⁴, and 5.3 × 10⁻⁴ mg N−1 m−1, respectively. Post-wear mapping showed the largest field-scale W-Co-rich fraction in the 50 wt.% coating; however, isolated spectra containing more than 94 wt.% Mg are compatible with local coating penetration/substrate exposure and/or Mg-rich debris. The 50 wt.% composition therefore provided the best combined response among the four tested levels, while intermediate compositions are required to identify a continuous-composition optimum.

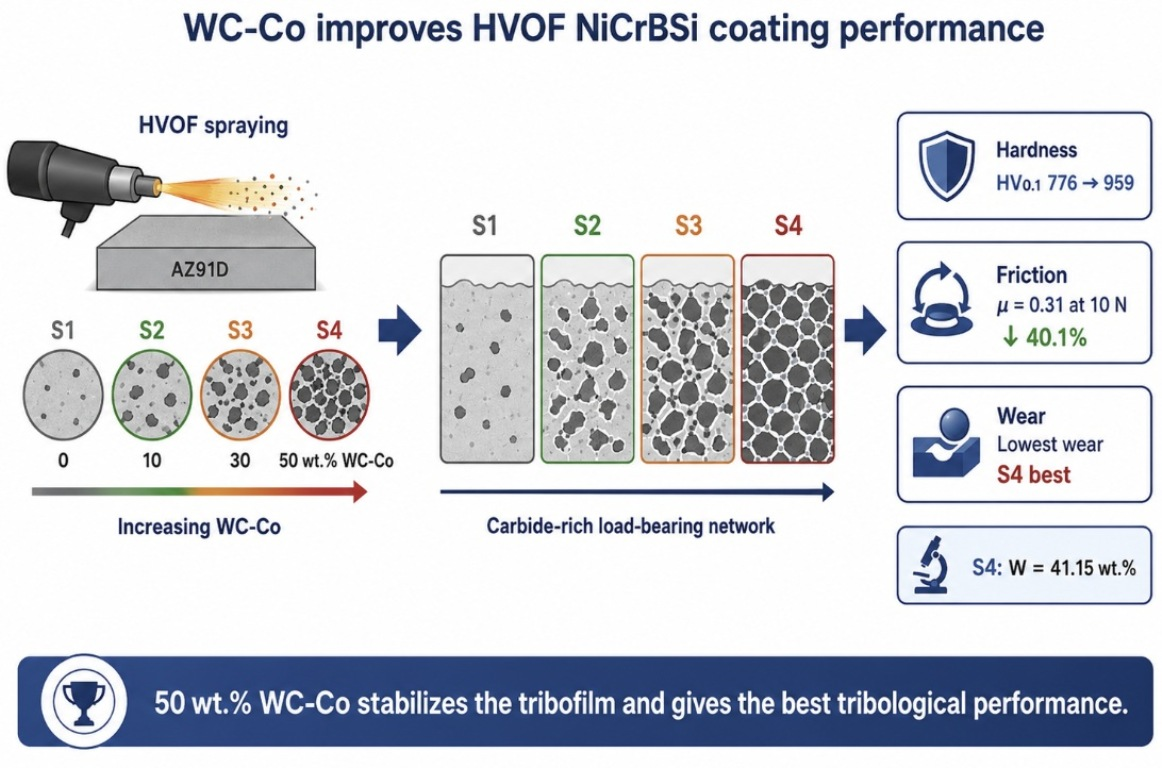
Graphical Abstract

1. Introduction

Magnesium alloys combine low density, high specific strength, machinability, damping, vibration absorption, and electromagnetic shielding, which supports their use in aerospace, defense, automotive, electronics, and other weight-sensitive systems [1,2,3,4,5,6,7,8,9,10]. Their comparatively low surface hardness, limited wear and corrosion resistance, and high chemical reactivity nevertheless constrain direct service in demanding contact environments [11,12,13,14]. Surface improvement has therefore been pursued through alloying [15,16,17,18,19], electrochemical and conversion treatments [20,21,22,23], and physical or hybrid coatings [24,25,26,27]. Thermal spraying is particularly attractive because it offers high deposition efficiency and a broad feedstock window [28]. Flame, HVOF, arc, plasma, and cold-spray processes have been applied to provide wear, corrosion, thermal, electrical, and multifunctional surface protection [29,30,31,32,33,34,35,36,37,38,39,40,41]. In these processes, heated and accelerated particles flatten and solidify as successive splats [42]; among them, HVOF is well suited to dense, strongly anchored coatings with comparatively low porosity and high load-bearing capacity [13,38,40].
NiCrBSi is a Ni-based self-fluxing alloy whose B and Si additions lower the melting range and promote deoxidation, wetting, and flow during deposition [43,44,45]. HVOF-sprayed NiCrBSi coatings combine a ductile γ-Ni-rich matrix with hard boride, carbide, and silicide constituents, providing useful fracture tolerance, hardness, wear resistance, interfacial compatibility, and corrosion performance [46,47,48,49,50,51]. Cr contributes oxidation/corrosion resistance and hard secondary phases, B promotes self-fluxing and boride formation, and Si improves melt flow and solidification behavior [46,49]. The resulting response is therefore governed by matrix continuity, hard-phase distribution, splat cohesion, oxidation, and local defects rather than by nominal chemistry alone.
WC-Co is frequently incorporated into NiCrBSi because WC provides high hardness, elastic modulus, thermal stability, and resistance to micro-cutting, whereas the ductile Co binder promotes carbide retention and fracture tolerance [52,53,54]. Although NiCrBSi/WC-Co coatings are well established, an integrated assessment of reinforcement-dependent roughness, phase evolution, Vickers microhardness, load- and distance-normalized mass loss, friction stability, and post-wear microchemistry on AZ91D remains limited.
Published results also show that the best carbide fraction is process- and contact-specific. Guo et al. reported minimum porosity and maximum hardness/wear resistance at 15 wt.% WC-Co in a supersonic plasma-sprayed NiCrBSi system [46]. Zhu et al. identified γ-Ni, intermetallic constituents, and W2C in a plasma-sprayed coating containing 30 wt.% WC [55]. Yao observed composition-dependent changes in material removal and carbide-supported contact modes over 0–80 wt.% WC-Co [56], while Zhang et al. linked the lamellar architecture to retained WC and W2C formed by partial decarburization [57]. Recent studies further confirm that hardness and wear resistance depend on carbide fraction, phase stability, matrix retention, and coating architecture [58,59,60,61,62].
This study compares undoped NiCrBSi with NiCrBSi coatings containing 10, 30, and 50 wt.% WC-Co deposited on AZ91D by HVOF. The objective is to establish a coherent structure–property–tribology relationship by correlating as-sprayed topography, phase constitution, coating architecture, Vickers microhardness, mass loss, friction evolution, worn surface morphology, and post-wear microchemistry. The selected 0, 10, 30, and 50 wt.% levels form a screening matrix spanning matrix-dominated, transitional, and carbide-rich conditions; they identify comparative trends and the best tested formulation but do not resolve a continuous optimum within the 10–30 or 30–50 wt.% intervals.

2. Materials and Methods

2.1. Materials, Coating Design, and Microstructural Characterization

AZ91D magnesium alloy stock supplied by Nanografi Nano Technology Co., Inc. (Ankara, Türkiye) was selected as the substrate because its low density is attractive for lightweight components, whereas its relatively low intrinsic surface hardness limits dry-sliding durability. Commercial NiCrBSi self-fluxing alloy powder supplied by Shanghai Truer Technology Co., Ltd. (Shanghai, China) was used as the metallic matrix. WC–Co nanopowder with a reported purity of 99.99%, a grain-size range of 35–75 nm, and an average particle-size range of 100–200 nm was supplied by Nanografi Nano Technology Co., Inc. (Ankara, Türkiye) and used as the reinforcing constituent. The 0, 10, 30, and 50 wt.% WC–Co levels were selected as a screening series representing unreinforced, low-, intermediate-, and high-reinforcement conditions reported for related NiCrBSi/WC-containing systems [46,56,63,64,65]. The nominal chemical composition of the AZ91D substrate is given in Table 1.
Cylindrical AZ91D substrates with a diameter of 20 mm and lengths of either 10 or 50 mm were ultrasonically cleaned in absolute ethanol with a purity greater than 99.9% and ACS-grade quality (TEKKİM Kimya San. ve Tic. Ltd. Şti., Bursa, Türkiye) for 15 min. The specimens were subsequently rinsed for 15 min using ultrapure water generated with a Smart N ultrapure-water system (Shanghai Canrex Analytic Instrument Co., Ltd., Shanghai, China). Surface activation was then performed by grit blasting with fused Al2O3 powder having a reported purity greater than 99% and a nominal particle size of 10 µm (Nanografi Nano Technology Co., Inc., Ankara, Türkiye) at an air pressure of 5 bar. Four coating formulations were deposited: S1/NiCrBSi, S2/NiCrBSi–10 wt.% WC–Co, S3/NiCrBSi–30 wt.% WC–Co, and S4/NiCrBSi–50 wt.% WC–Co, as summarized in Table 2. HVOF deposition was performed using an SX-5000 gas-fuel HVOF thermal-spray system (Guangzhou Sanxin Metal S&T Co., Ltd., Guangzhou, China). The recorded deposition parameters were oxygen and propane flow rates of 278.1 and 74.9 slpm, respectively, a spray distance of 15–20 mm, a powder feed rate of 40 g min−1, a torch traverse speed of 100 mm s−1, and an air pressure of 110 psi.
Surface roughness was measured in the as-sprayed condition using a Tencor P-7 stylus contact profilometer (KLA Corporation, Milpitas, CA, USA) before sectioning, grinding, or polishing. Specimens intended for cross-sectional microscopy and Vickers microhardness measurements were sectioned using an HQ-FL-series CNC wire electrical-discharge machine (Hanqi CNC Technology, Suzhou, China; supplied by Yıldırım Makina, Istanbul, Türkiye). The sectioned specimens were mounted in bakelite, ground sequentially using 320–2500 grit SiC abrasive papers supplied by ALS Laboratuvar Cihazları (Istanbul, Türkiye), and polished using a 3 µm diamond suspension supplied by MTC Metalurji San. ve Tic. A.Ş. (Bursa, Türkiye).
Optical examination of the coating cross-sections and coating/substrate interfaces was conducted using an OPTIKA B-292LD1 binocular research microscope (OPTIKA S.r.l., Ponteranica, Italy). Coating morphology, interfacial architecture, and local elemental distributions were examined using a Zeiss EVO MA10 scanning electron microscope equipped with an EDX detector (Carl Zeiss Microscopy GmbH, Jena, Germany). Phase constitution was determined using a Rigaku MiniFlex 300/600 X-ray diffractometer (Rigaku Corporation, Tokyo, Japan) operated with Cu Kα radiation having a wavelength of λ = 1.5406 Å over a 2θ range of 10–90°.
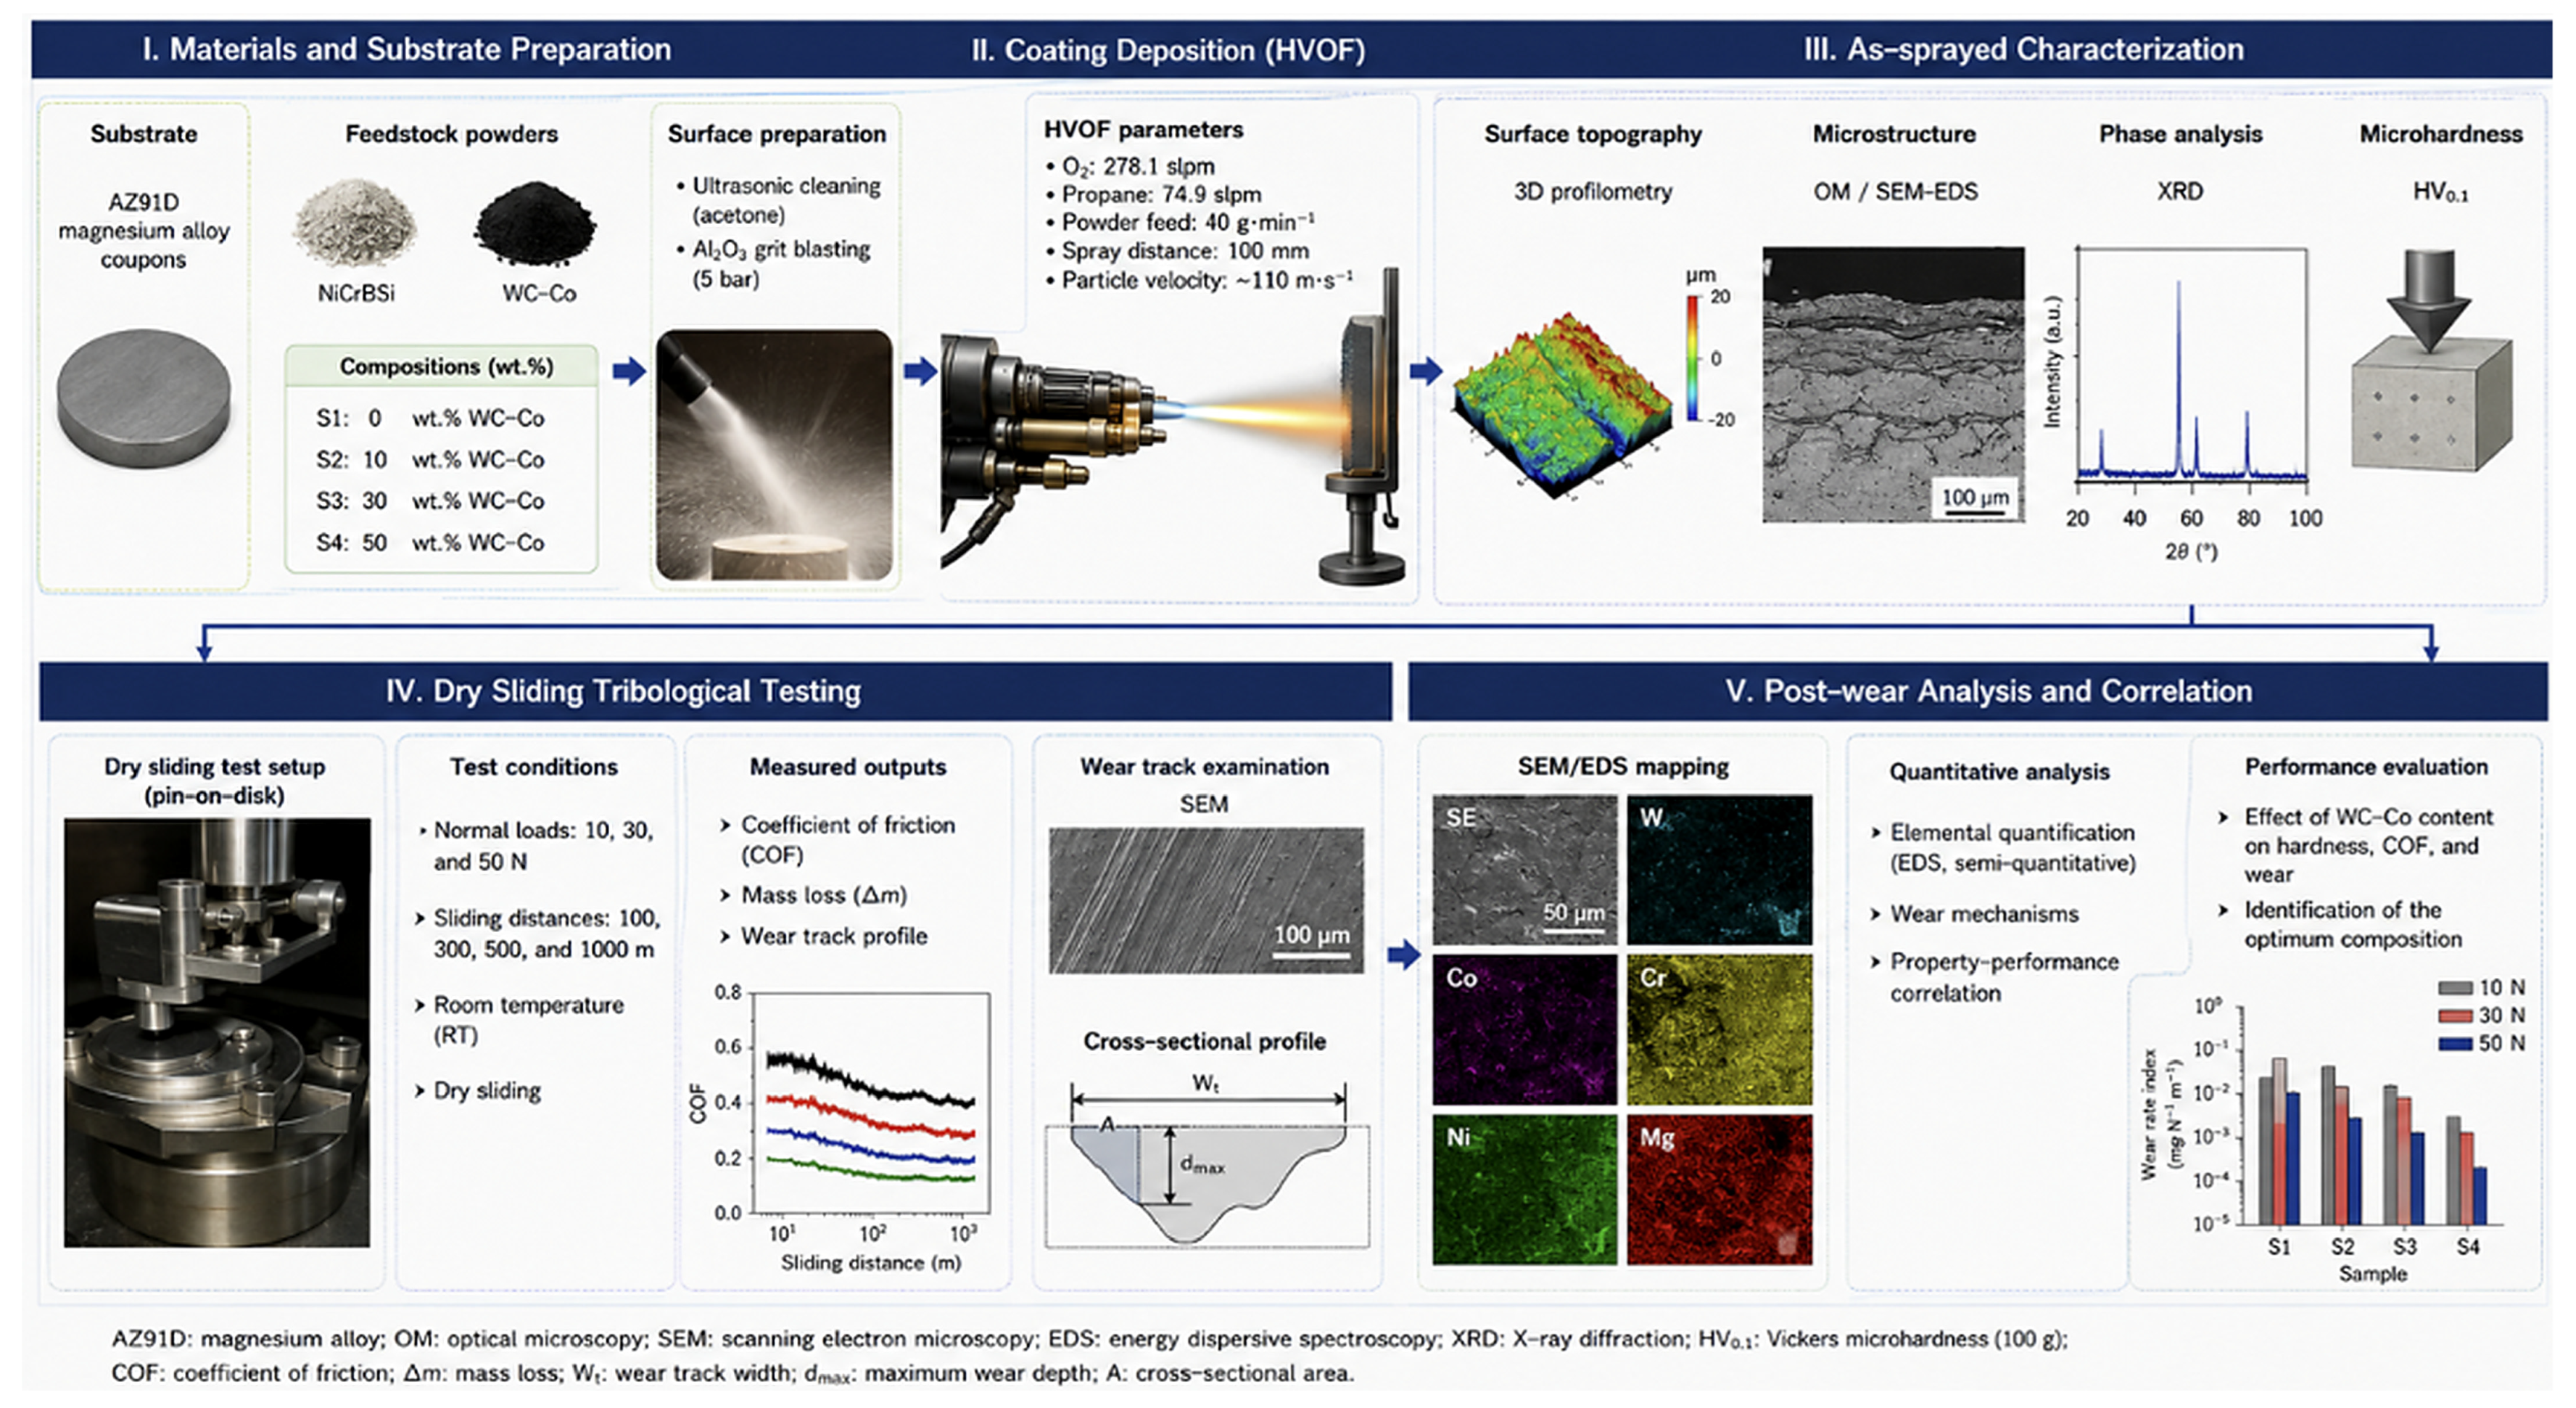
Apparent coating thickness was determined from five scale-bar-calibrated distances measured normal to the coating/substrate interface in each representative optical micrograph. The reported mean ± standard deviation therefore describes local within-field thickness variation rather than specimen-to-specimen process reproducibility. The available feedstock records preserve the supplier identities and nominal NiCrBSi/WC–Co blend ratios. Supplier-reported particle-size information was available for the WC–Co reinforcement. However, the lot-specific particle-size distribution of the NiCrBSi powder, the detailed pre-spray morphology of the blended feedstock, and the exact powder-premixing procedure were not retained in the experimental records and were therefore not reconstructed from the deposited-state microscopy. The integrated experimental workflow is summarized in Figure 1.
EDS compositions were treated as local semi-quantitative descriptors rather than bulk chemical analyses. Major-element trends were interpreted with an approximate practical accuracy of ±1–2 wt.% under the present rough and multiphase surface conditions. Greater uncertainty was associated with the B and C measurements because of detector response, X-ray absorption, surface relief, contamination, and electron-interaction-volume effects. Consequently, B and C values were not used for stoichiometric calculations, and a non-detected or near-detection-limit B signal was not interpreted as evidence against the presence of boride-related XRD peaks. Accordingly, Ni3B, CrB, and Cr23B6 are reported as phase assignments consistent with the XRD patterns rather than as compounds independently confirmed by EDS.

2.2. Vickers Microhardness Testing

Vickers microhardness measurements were performed on polished coating cross-sections using a digital Vickers hardness tester (Onalkon/Mitech, Bursa, Türkiye). A test load of 100 gf (HV0.1) was applied with a dwell time of 10 s. For each coating condition, three spatially separated indentations were placed within representative coating regions, avoiding specimen edges, visible pores, cracks, previously indented areas, and other localized defects. Sufficient spacing was maintained between adjacent indentations to prevent overlap of the corresponding plastic deformation zones. The microhardness results are reported as the arithmetic mean ± standard deviation of three indentations (n = 3) for each coating condition.

2.3. Dry-Sliding Wear Testing

Dry-sliding wear tests were conducted using a pin-on-disk tribometer (UTS Design, Trabzon, Türkiye) to determine the wear resistance of the uncoated AZ91D magnesium alloy and the HVOF-sprayed NiCrBSi and NiCrBSi/WC-Co composite coatings. The investigated coating systems consisted of S1/NiCrBSi, S2/NiCrBSi–10 wt.% WC-Co, S3/NiCrBSi–30 wt.% WC-Co, and S4/NiCrBSi–50 wt.% WC-Co. The specimens were mounted with the uncoated or coated test surface facing the HSS wear pin, which was used as the counterbody throughout the experiments. The same HSS pin geometry and contact configuration were maintained for all specimens to provide consistent comparative test conditions. The wear tests were performed under normal loads of 10, 30, and 50 N at a sliding speed of 50 mm s−1 over sliding distances ranging from 100 to 1000 m. The cumulative mass loss response was evaluated at 100 m intervals up to the final sliding distance of 1000 m.
Before testing, the specimens were cleaned to remove loosely adhered particles, surface contaminants, and residual preparation debris. The initial mass of each specimen was measured using a precision balance. Following completion of the prescribed sliding distance, the specimens were carefully cleaned to remove loose wear debris without mechanically disturbing the wear track, and the final mass was recorded. Wear loss was calculated as follows:
Δ m = m 0 m f
where Δ m is the mass loss, m 0 is the specimen mass before testing, and m f is the specimen mass after testing. The mass loss values measured between 100 and 1000 m were used to evaluate the progression of material removal under the different normal loads. Lower mass loss was considered to indicate higher resistance to material removal under the selected dry-sliding conditions.
The wear response was evaluated by comparing the uncoated AZ91D substrate with the S1–S4 coating systems under identical load, sliding speed, counterbody, and sliding distance conditions. The measured mass-loss data were correlated with the as-sprayed surface roughness, coating thickness, phase constitution, Vickers microhardness, coefficient-of-friction response, worn surface morphology, and post-wear SEM/EDS results. Particular attention was given to the retention of WC/W2C-rich regions, deformation of the NiCrBSi matrix, carbide–binder interaction, splat cohesion, HSS counterbody material transfer, third-body debris formation, tribo-oxidative products, mechanically mixed-layer development, and local coating/substrate participation.

2.4. Coefficient-of-Friction Acquisition and Processing

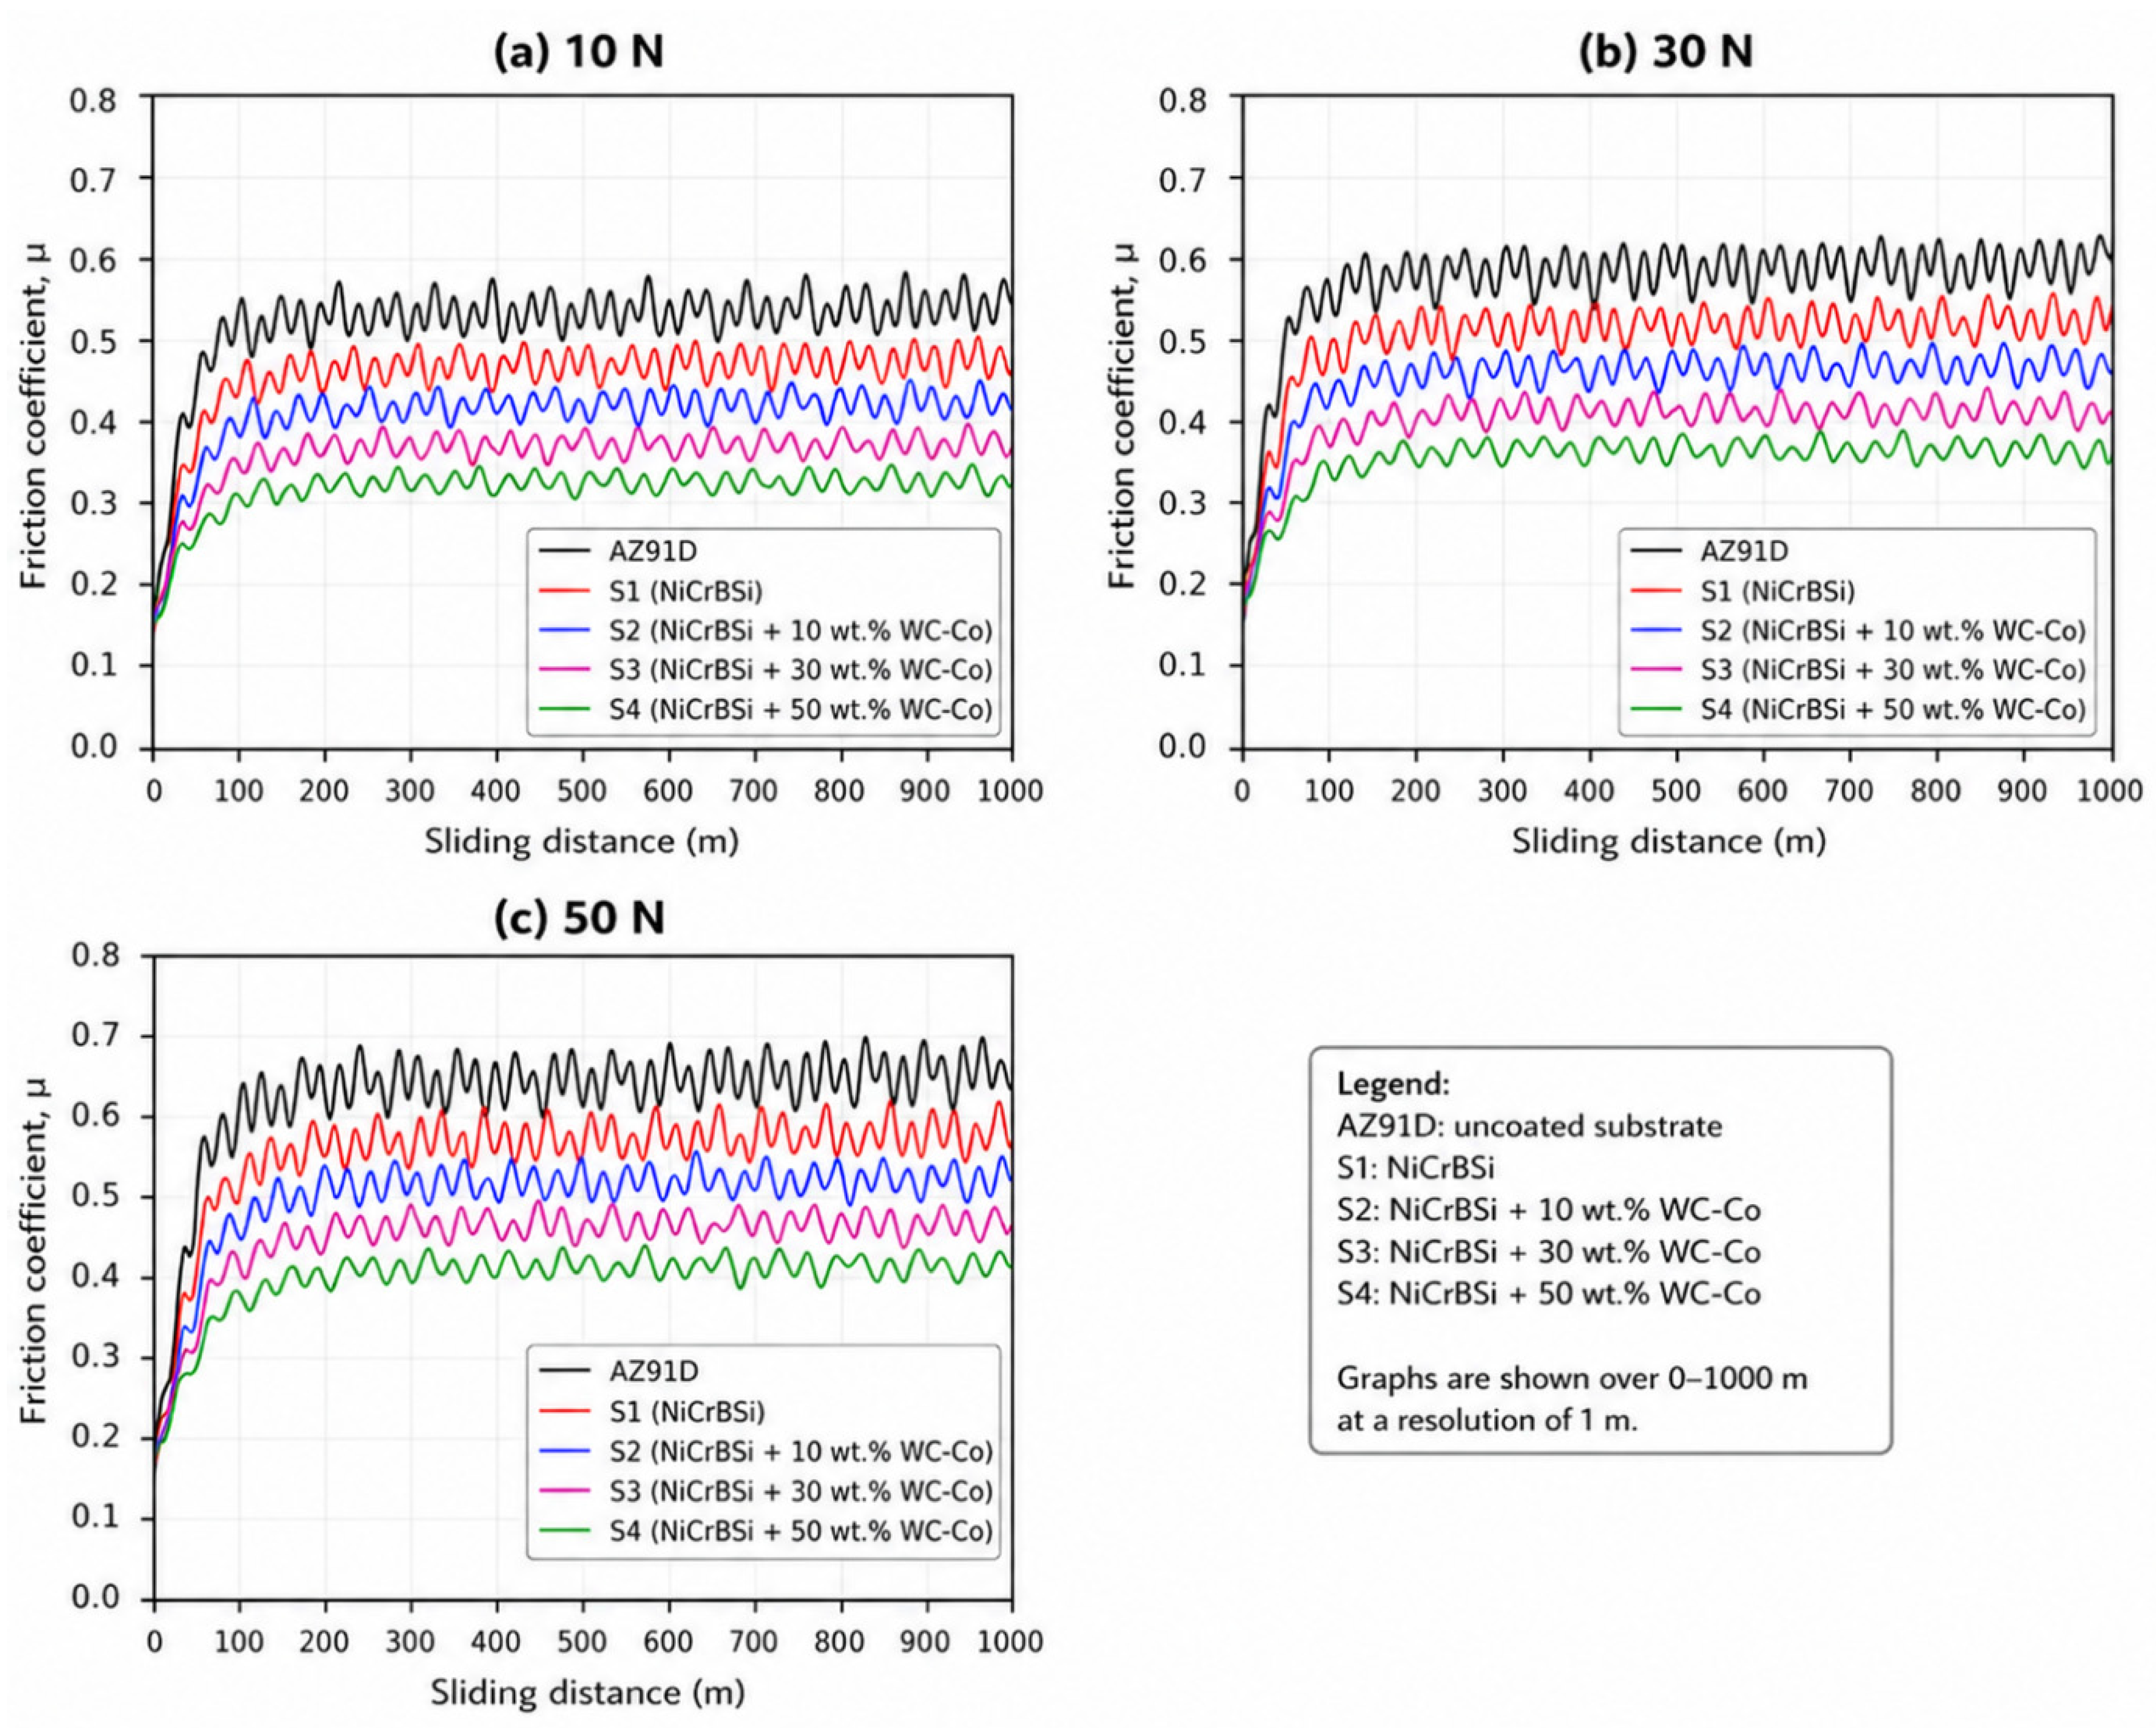
The coefficient of friction was calculated as μ = Ft/Fn from the tangential and normal forces recorded during the dry-sliding tests. The retained traces contain one coefficient-of-friction value per meter of sliding distance. No low-pass-filter parameters were present in the processing record, and no additional digital filtering was applied. The 0–100 m interval was defined as run-in, whereas 501–1000 m was defined a priori as the late-stage window because it excludes initial surface accommodation and represents the final half of each trace. Overall and late-stage means, temporal standard deviations, ranges, coefficients of variation, and reductions relative to AZ91D were calculated directly from the 1 m resolved traces.
One complete coefficient-of-friction trace was available for each coating-load combination. Accordingly, the standard deviations reported for friction quantify temporal variation within an individual trace and must not be interpreted as repeat-test or inter-specimen standard deviations; inferential significance testing was not applied.

2.5. Post-Wear SEM/EDS Analysis

Post-wear surface morphology and local elemental composition were examined using a Zeiss EVO MA10 scanning electron microscope equipped with an energy-dispersive X-ray spectroscopy detector (Carl Zeiss Microscopy GmbH, Jena, Germany). Low-magnification SEM images were used to assess wear-track continuity, the spatial distribution of damaged regions, and wear-debris accumulation, whereas higher-magnification images were used to identify abrasive grooves, adhesive smearing, particle pull-out, splat-boundary cracking, localized delamination, and mechanically mixed layers. Post-wear EDS elemental mapping and spectral acquisition were performed at an accelerating voltage of 20.0 kV. The uncoated AZ91D field was acquired at 2500× magnification with a 10 µm scale bar, whereas the coated-surface fields were acquired at 500× magnification with a 70 µm scale bar. The elemental maps and spectra were interpreted as relative spatial and semi-quantitative compositional evidence rather than as direct phase-distribution maps because an individual electron-interaction volume may simultaneously contain retained coating material, compacted wear debris, transferred counterbody material, and the underlying substrate. Particular caution was therefore exercised when interpreting B and C because their EDS quantification is more strongly affected by detector response, X-ray absorption, surface topography, contamination, and interaction-volume effects than the quantification of heavier elements.

3. Results and Discussion

3.1. Surface Topography, Phase Constitution, and Coating Architecture

The as-sprayed surface topography was evaluated using Sa, the arithmetic mean height deviation over the measured area, and Sq, the root-mean-square height parameter that is more sensitive to pronounced peaks and valleys.
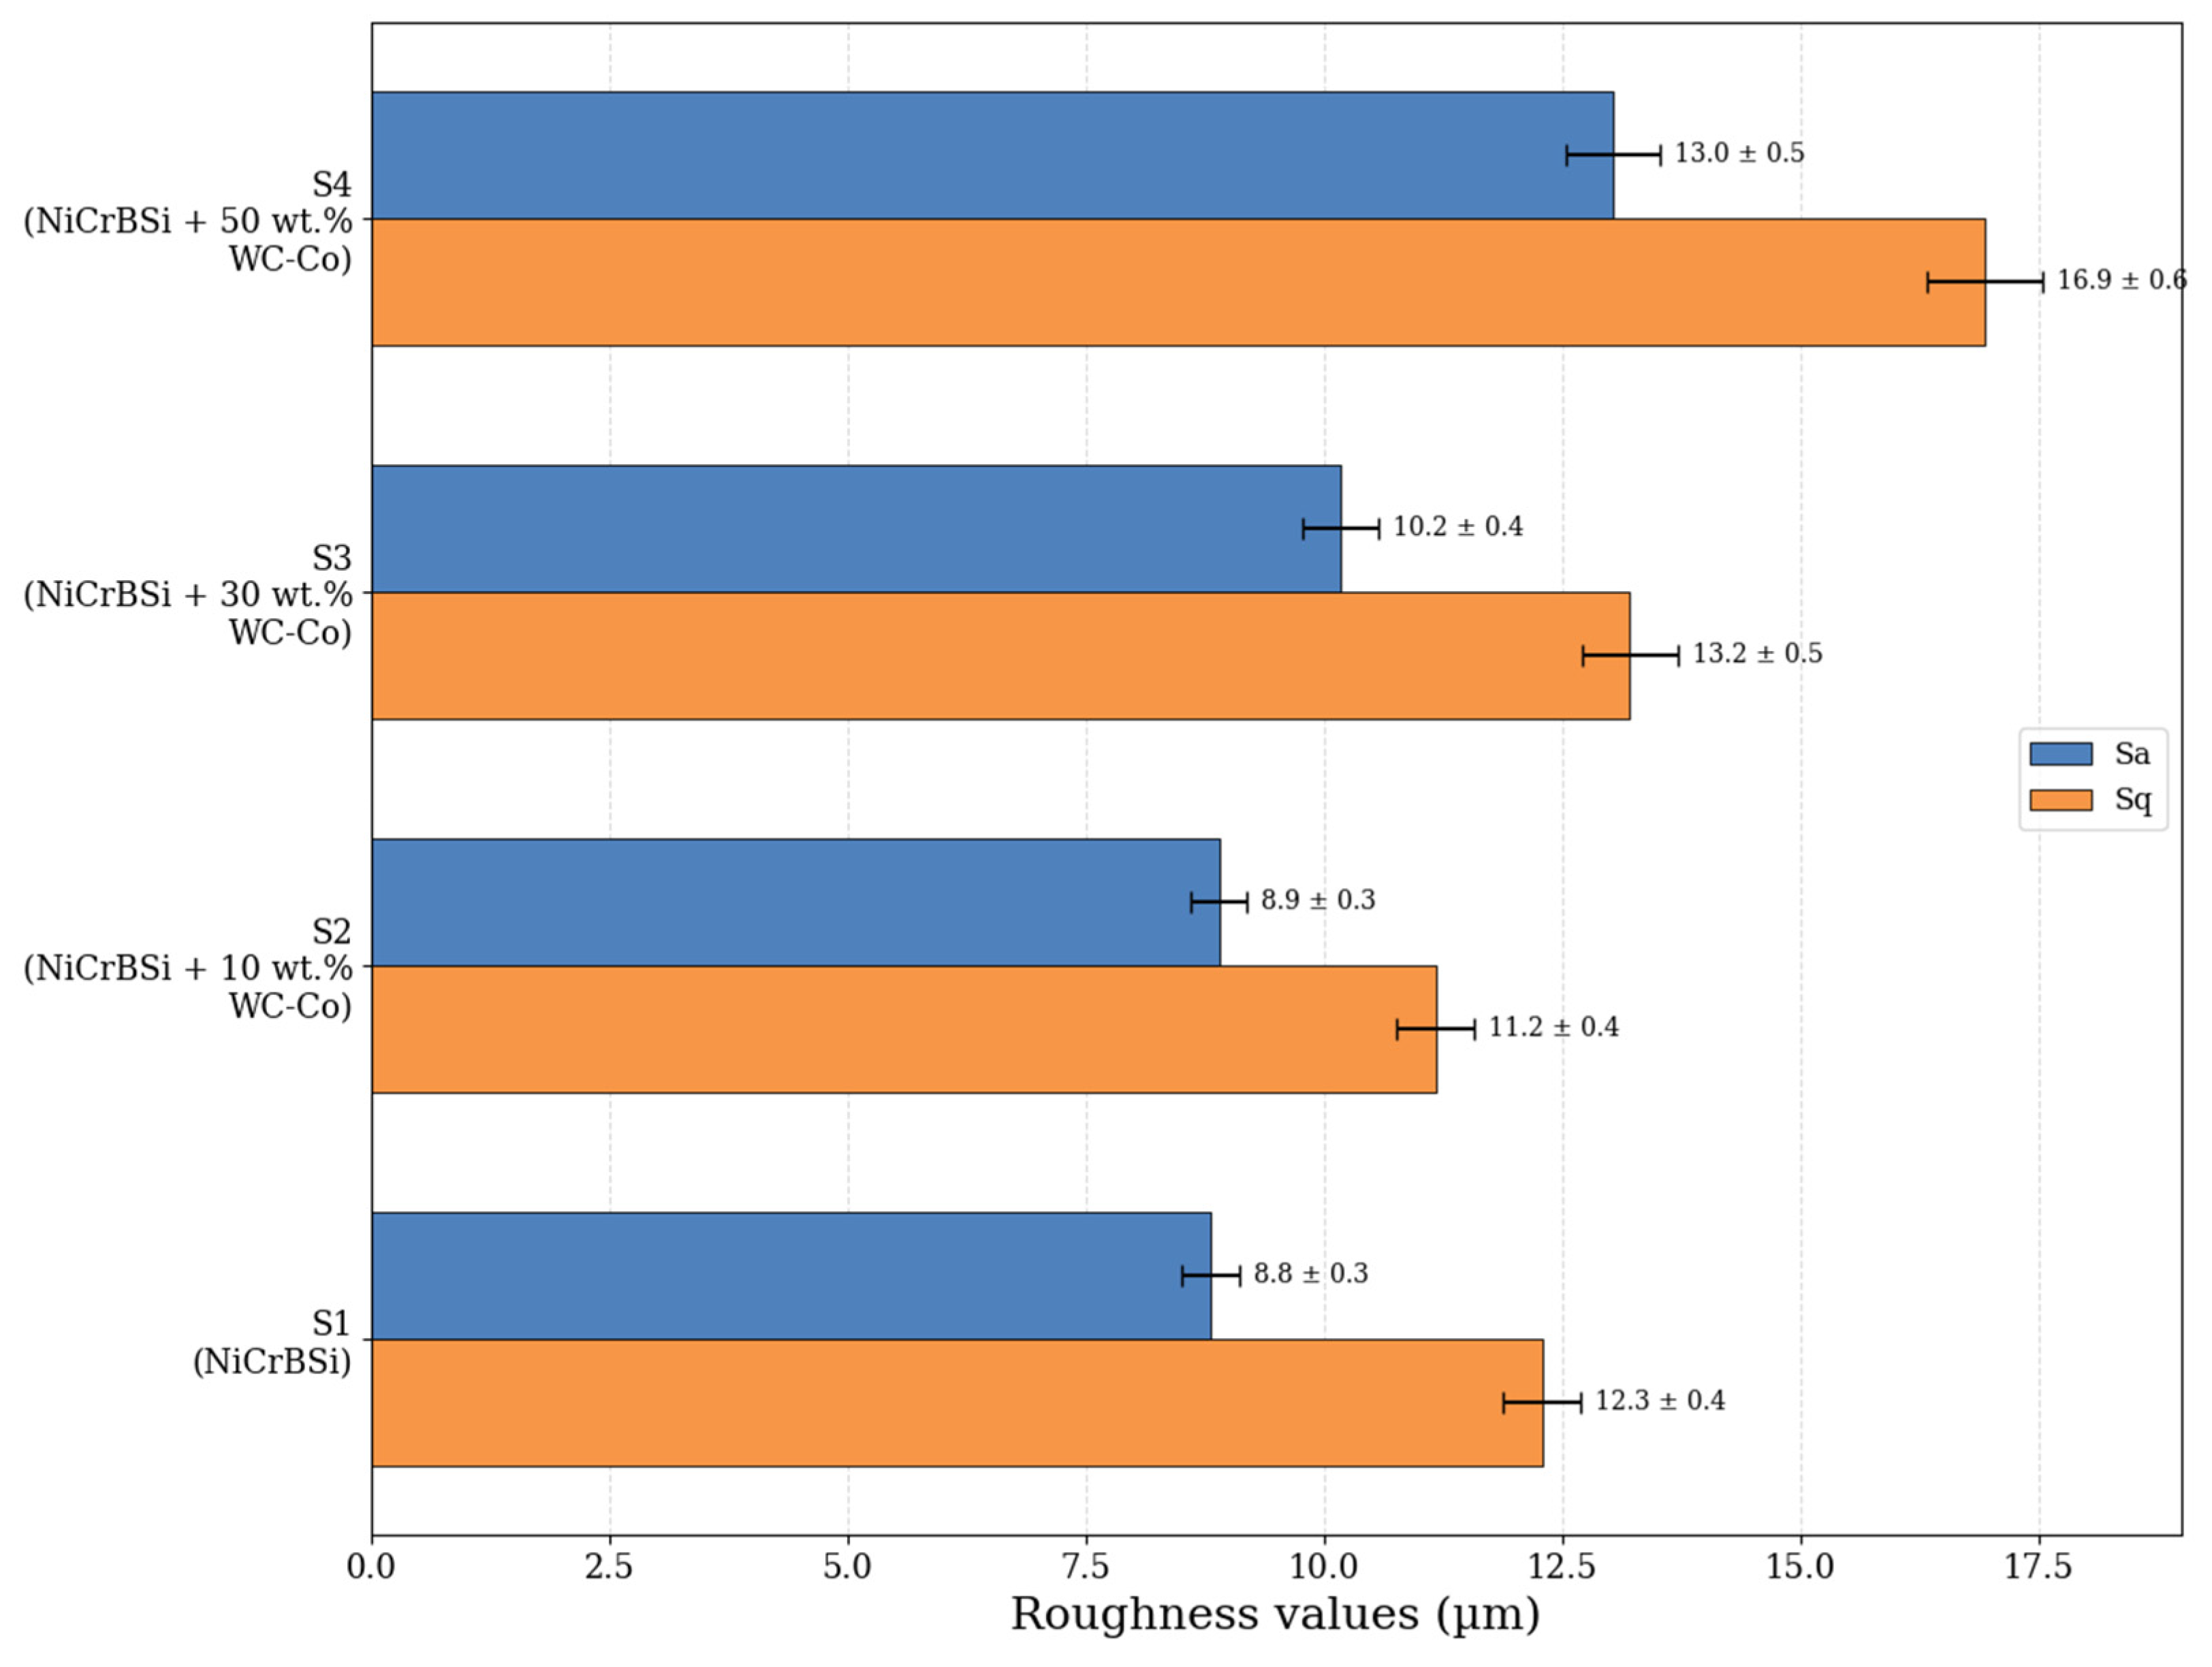
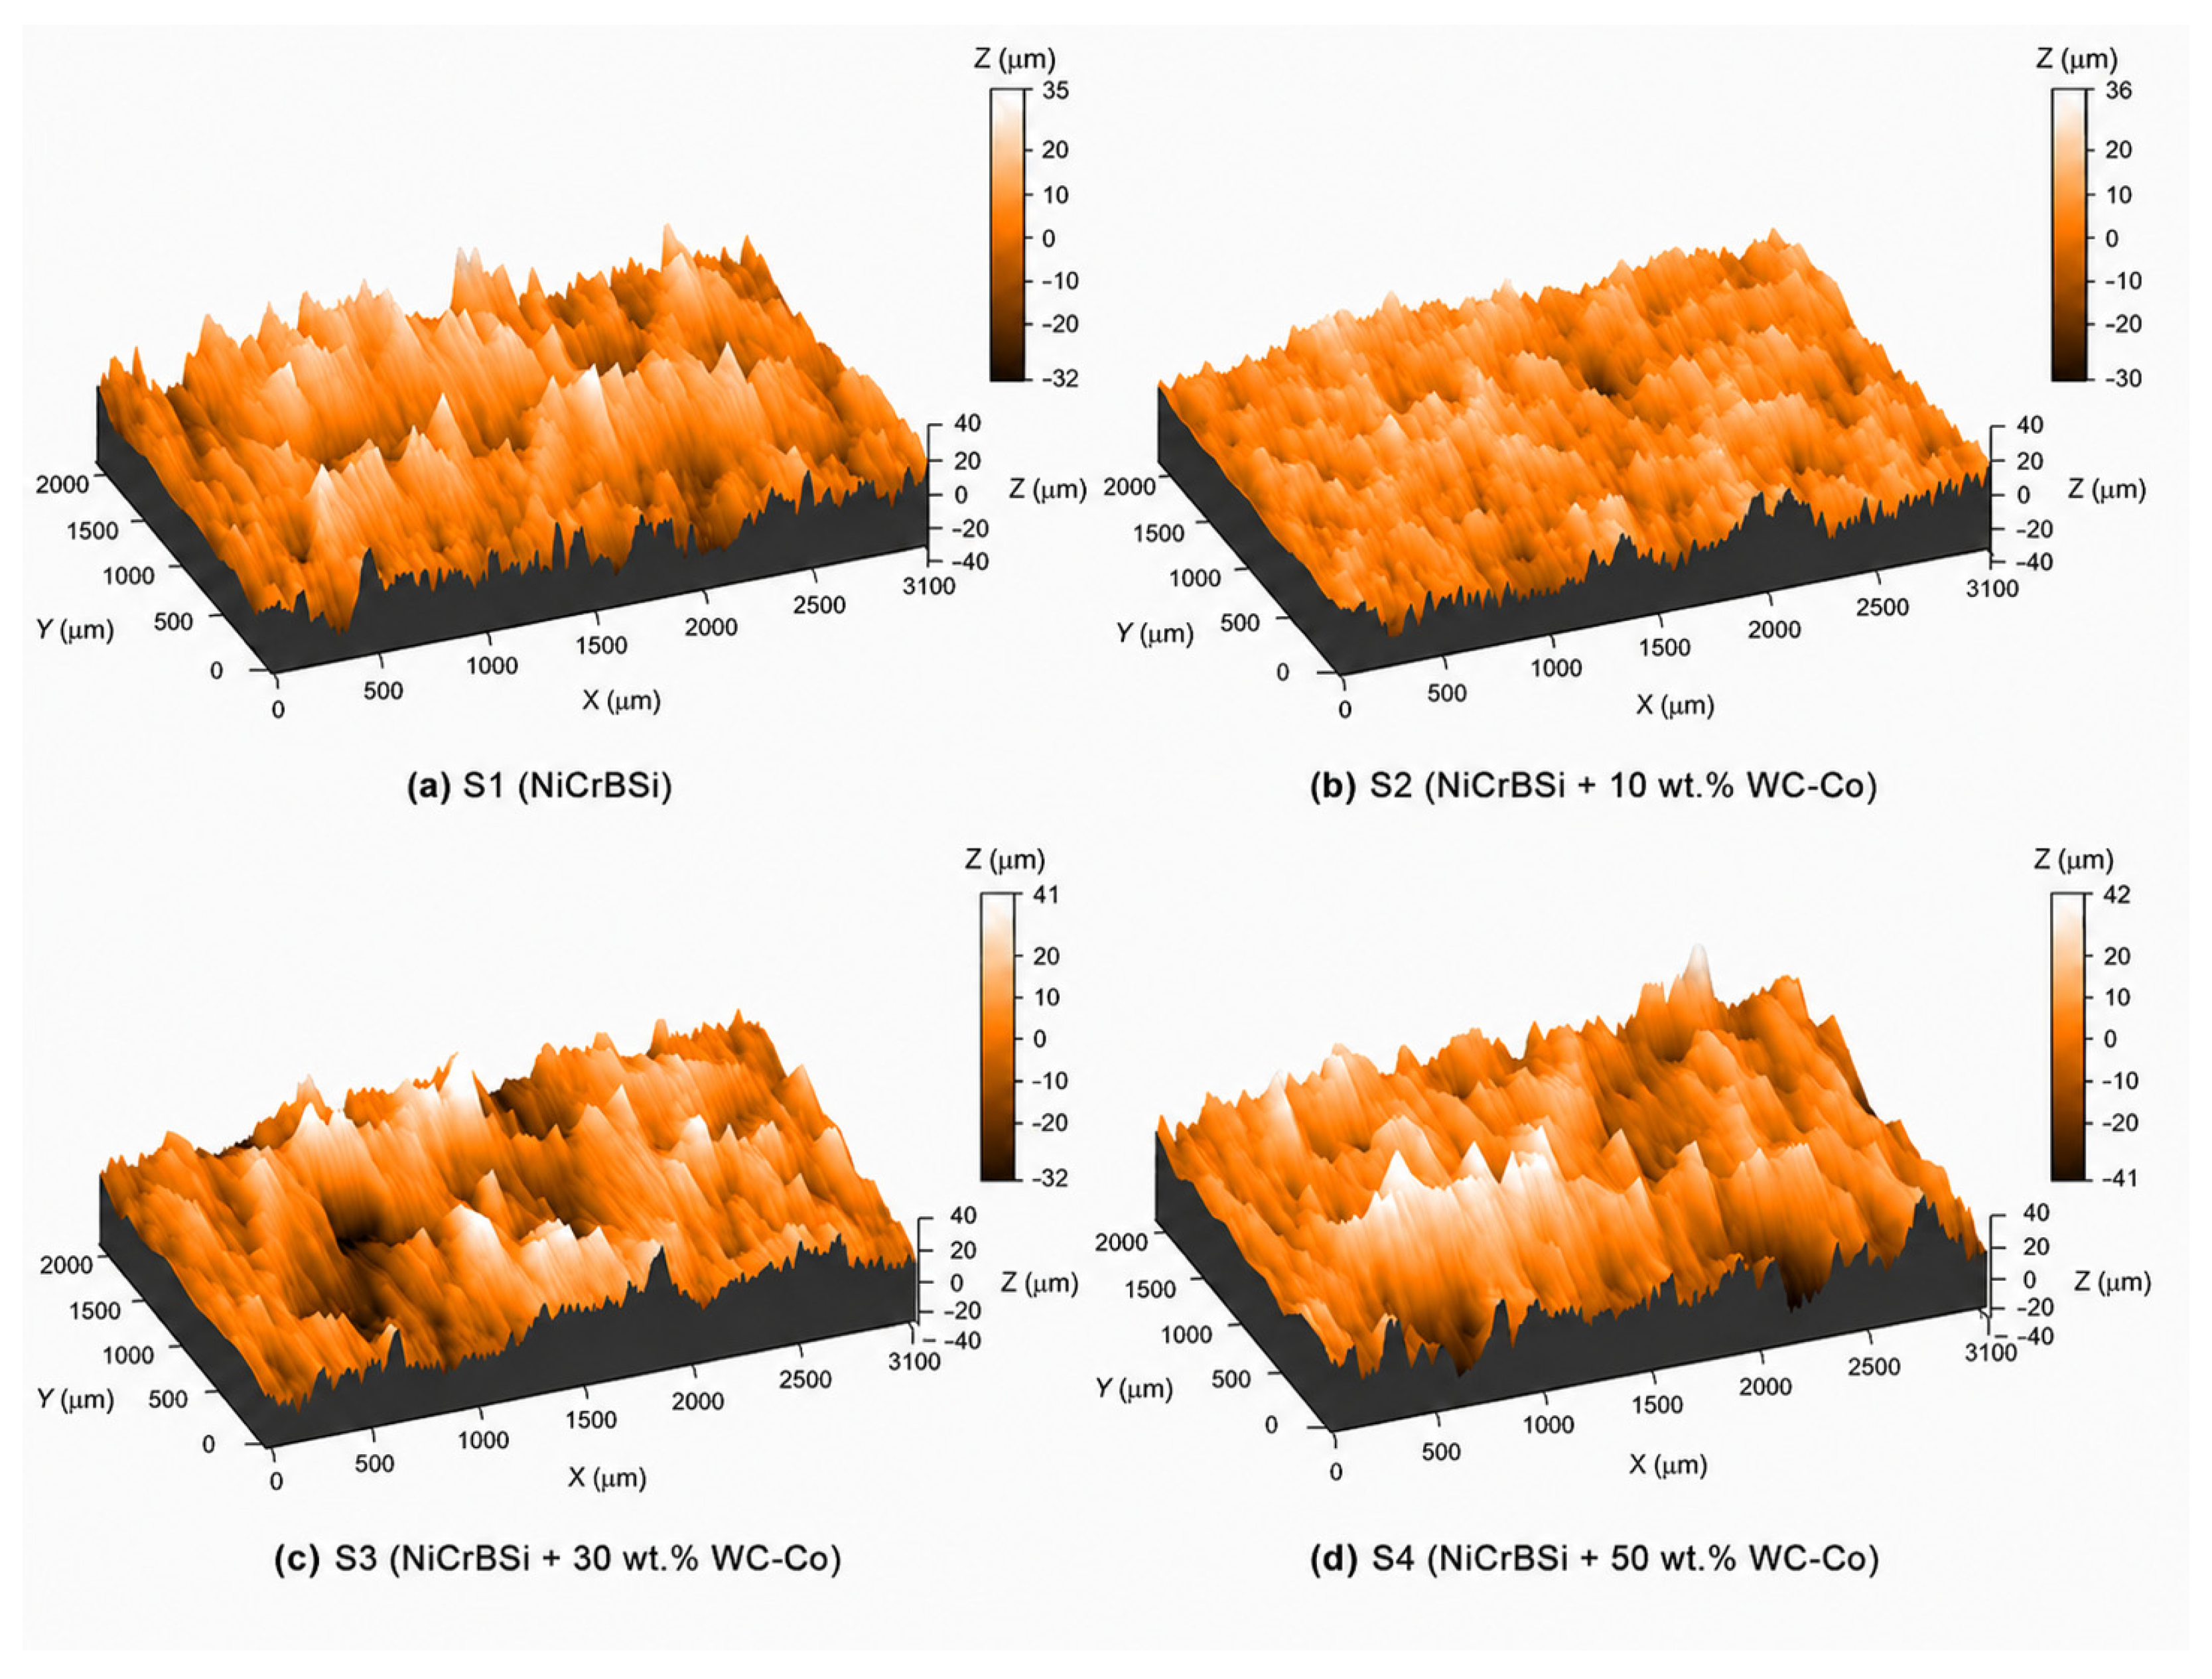
S1 exhibited Sa = 8.8 ± 0.3 µm and Sq = 12.3 ± 0.4 µm, while S2 remained similar in Sa (8.9 ± 0.3 µm) and showed a slightly lower Sq (11.2 ± 0.4 µm). Increasing WC-Co to 30 and 50 wt.% raised Sa/Sq to 10.2 ± 0.4/13.2 ± 0.5 µm and 13.0 ± 0.5/16.9 ± 0.6 µm, respectively. The coarser S3–S4 topographies are consistent with the partial melting response of carbide-bearing particles, splat-edge relief, and local carbide clustering during HVOF deposition [46,63]. Although the higher roughness can intensify asperity interaction during run-in, the wear results show that carbide-supported load bearing dominated the long-distance response. The corresponding Sa and Sq values are summarized in Figure 2.
The three-dimensional maps in Figure 3 confirm a transition from the comparatively even S1–S2 surfaces to broader peak–valley relief and greater heterogeneity in S3–S4; S4 contains the most prominent asperity population.
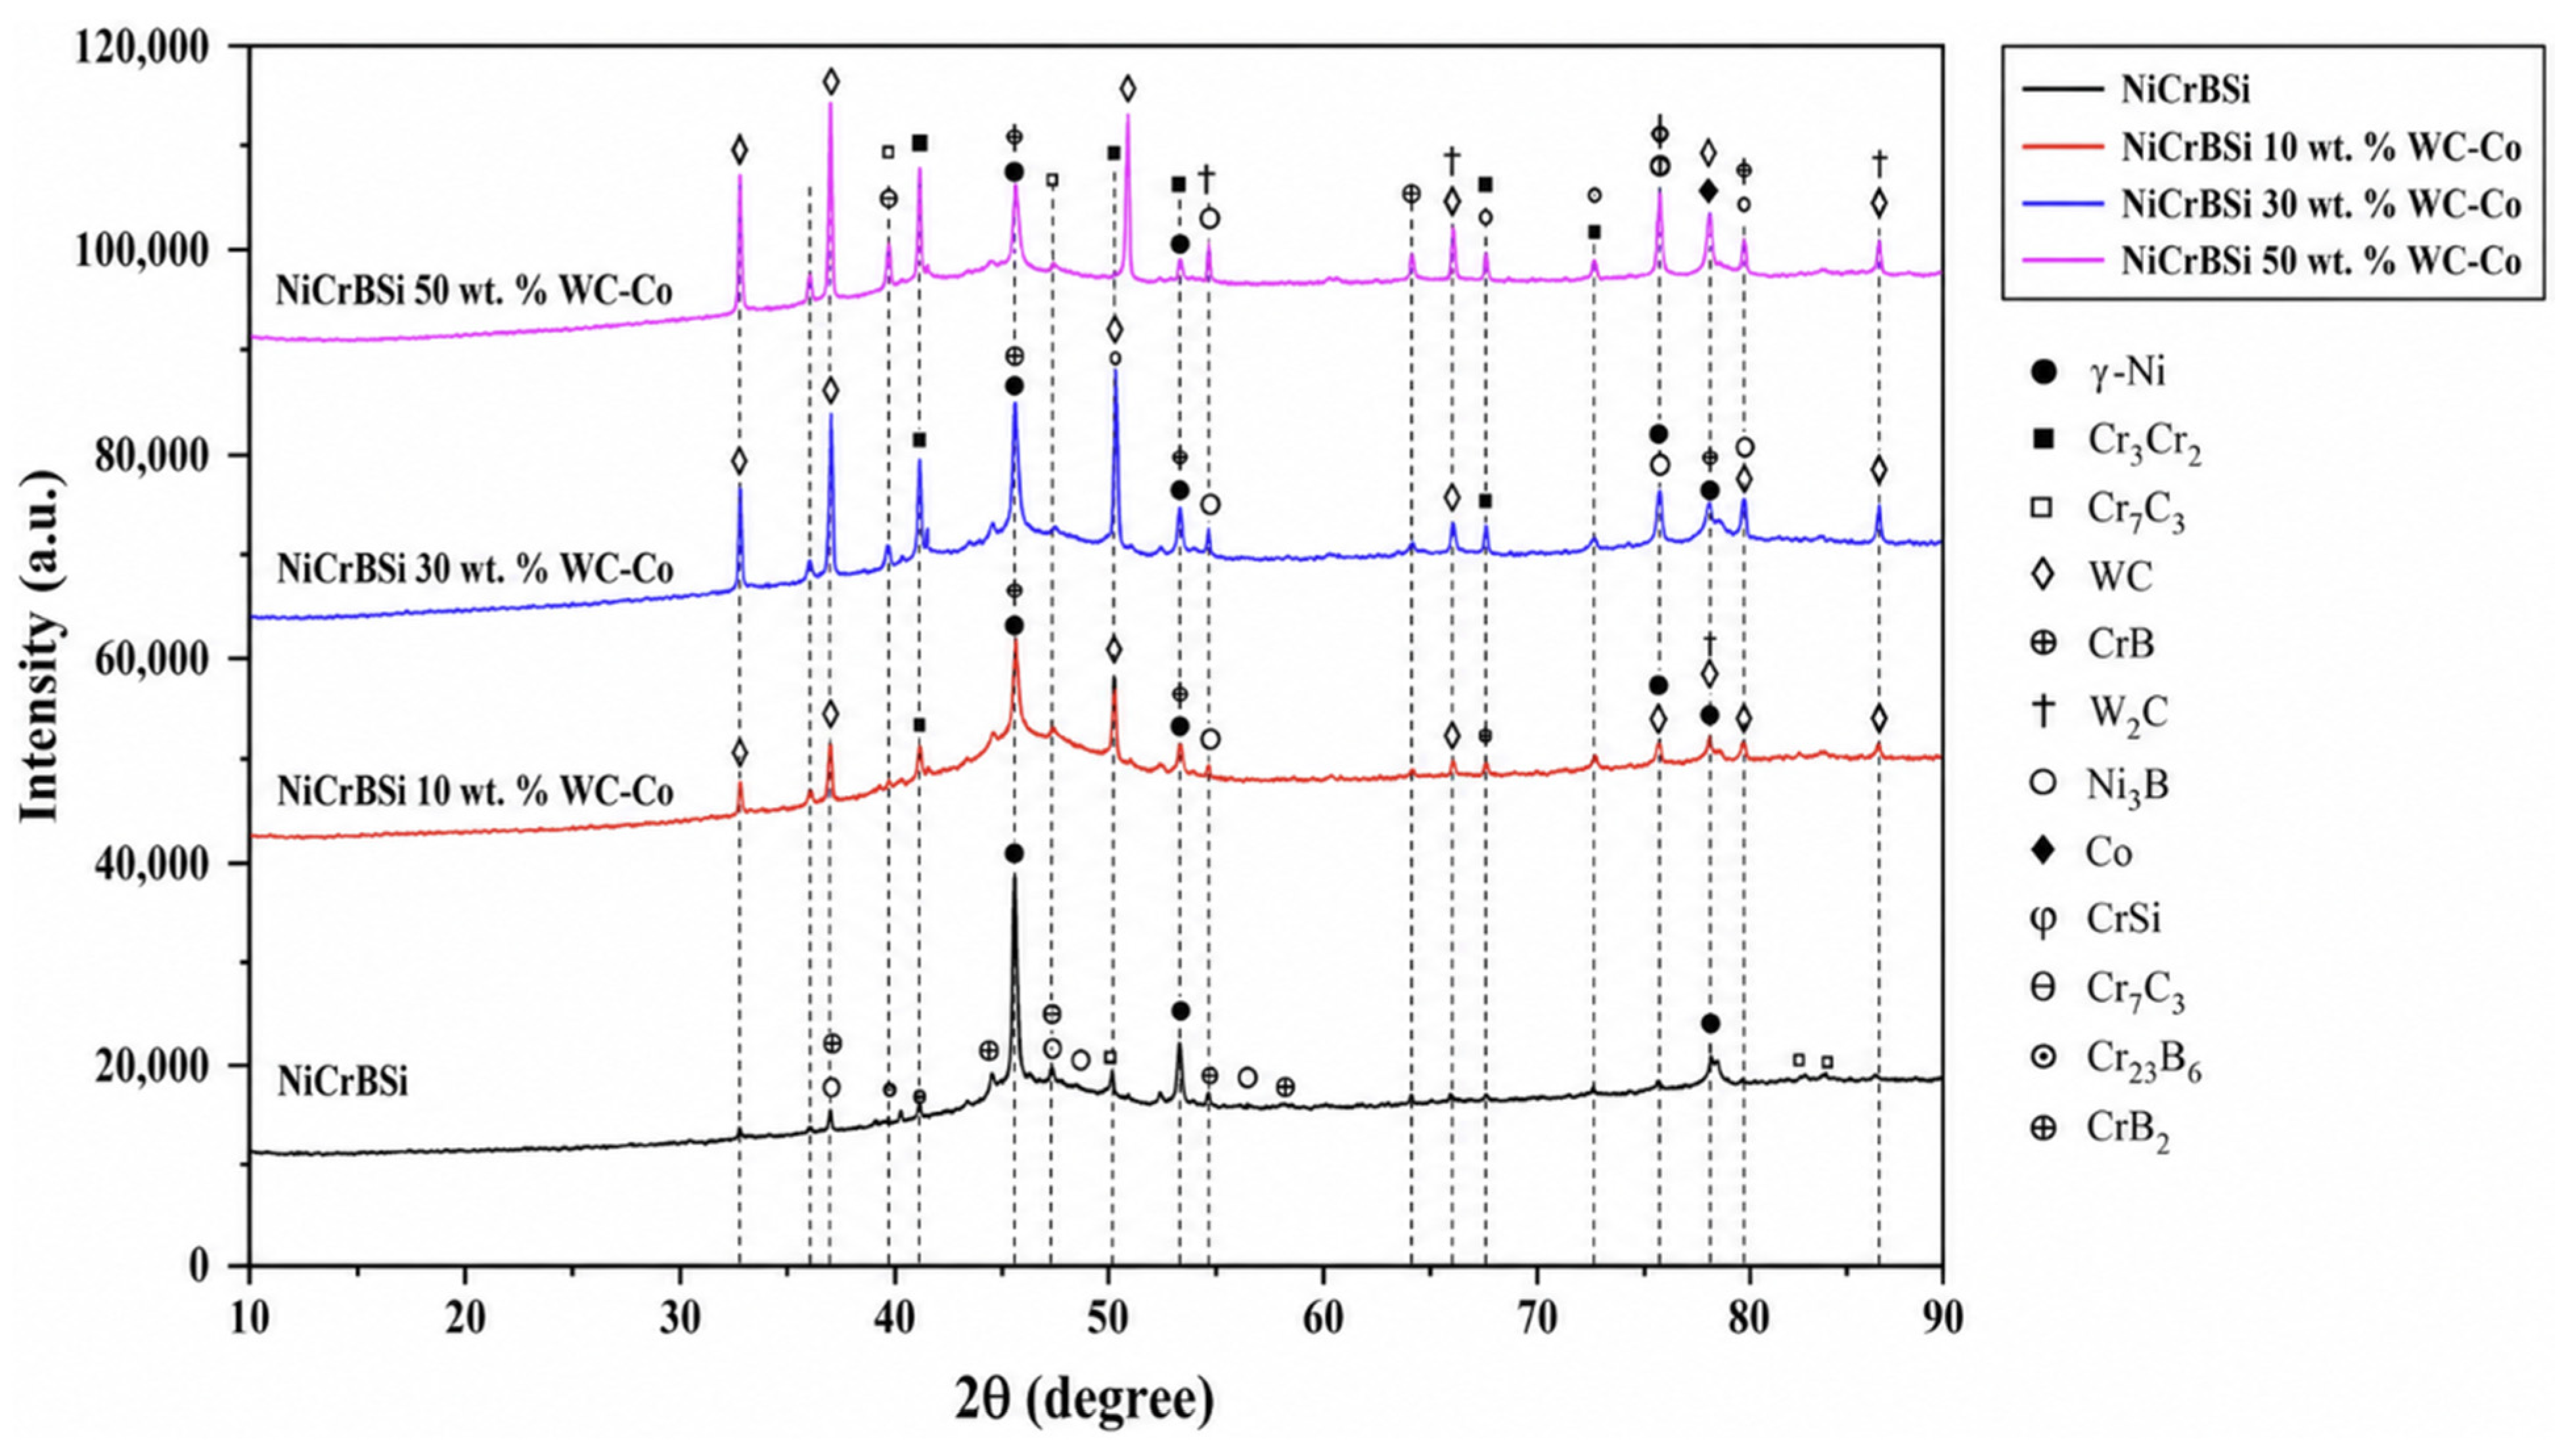
The XRD patterns in Figure 4 are dominated by a γ-Ni-based matrix in S1, together with reflections consistent with Ni3B, CrB, Cr7C3, Cr23B6, and Cr-Si-containing constituents. WC- and Co-related reflections become progressively more prominent from S2 to S4, while W2C indicates partial WC decarburization during particle heating and flight. The resulting architecture combines a comparatively ductile Ni/Co-rich binder with hard carbide- and boride-bearing regions that restrict plastic deformation and micro-cutting [55,64,65].
Because several reflections overlap and no Rietveld refinement or standard addition analysis was performed, the phase assignments are qualitative. In particular, the boride labels derive from XRD peak matching and are not validated by B concentrations measured by EDS.
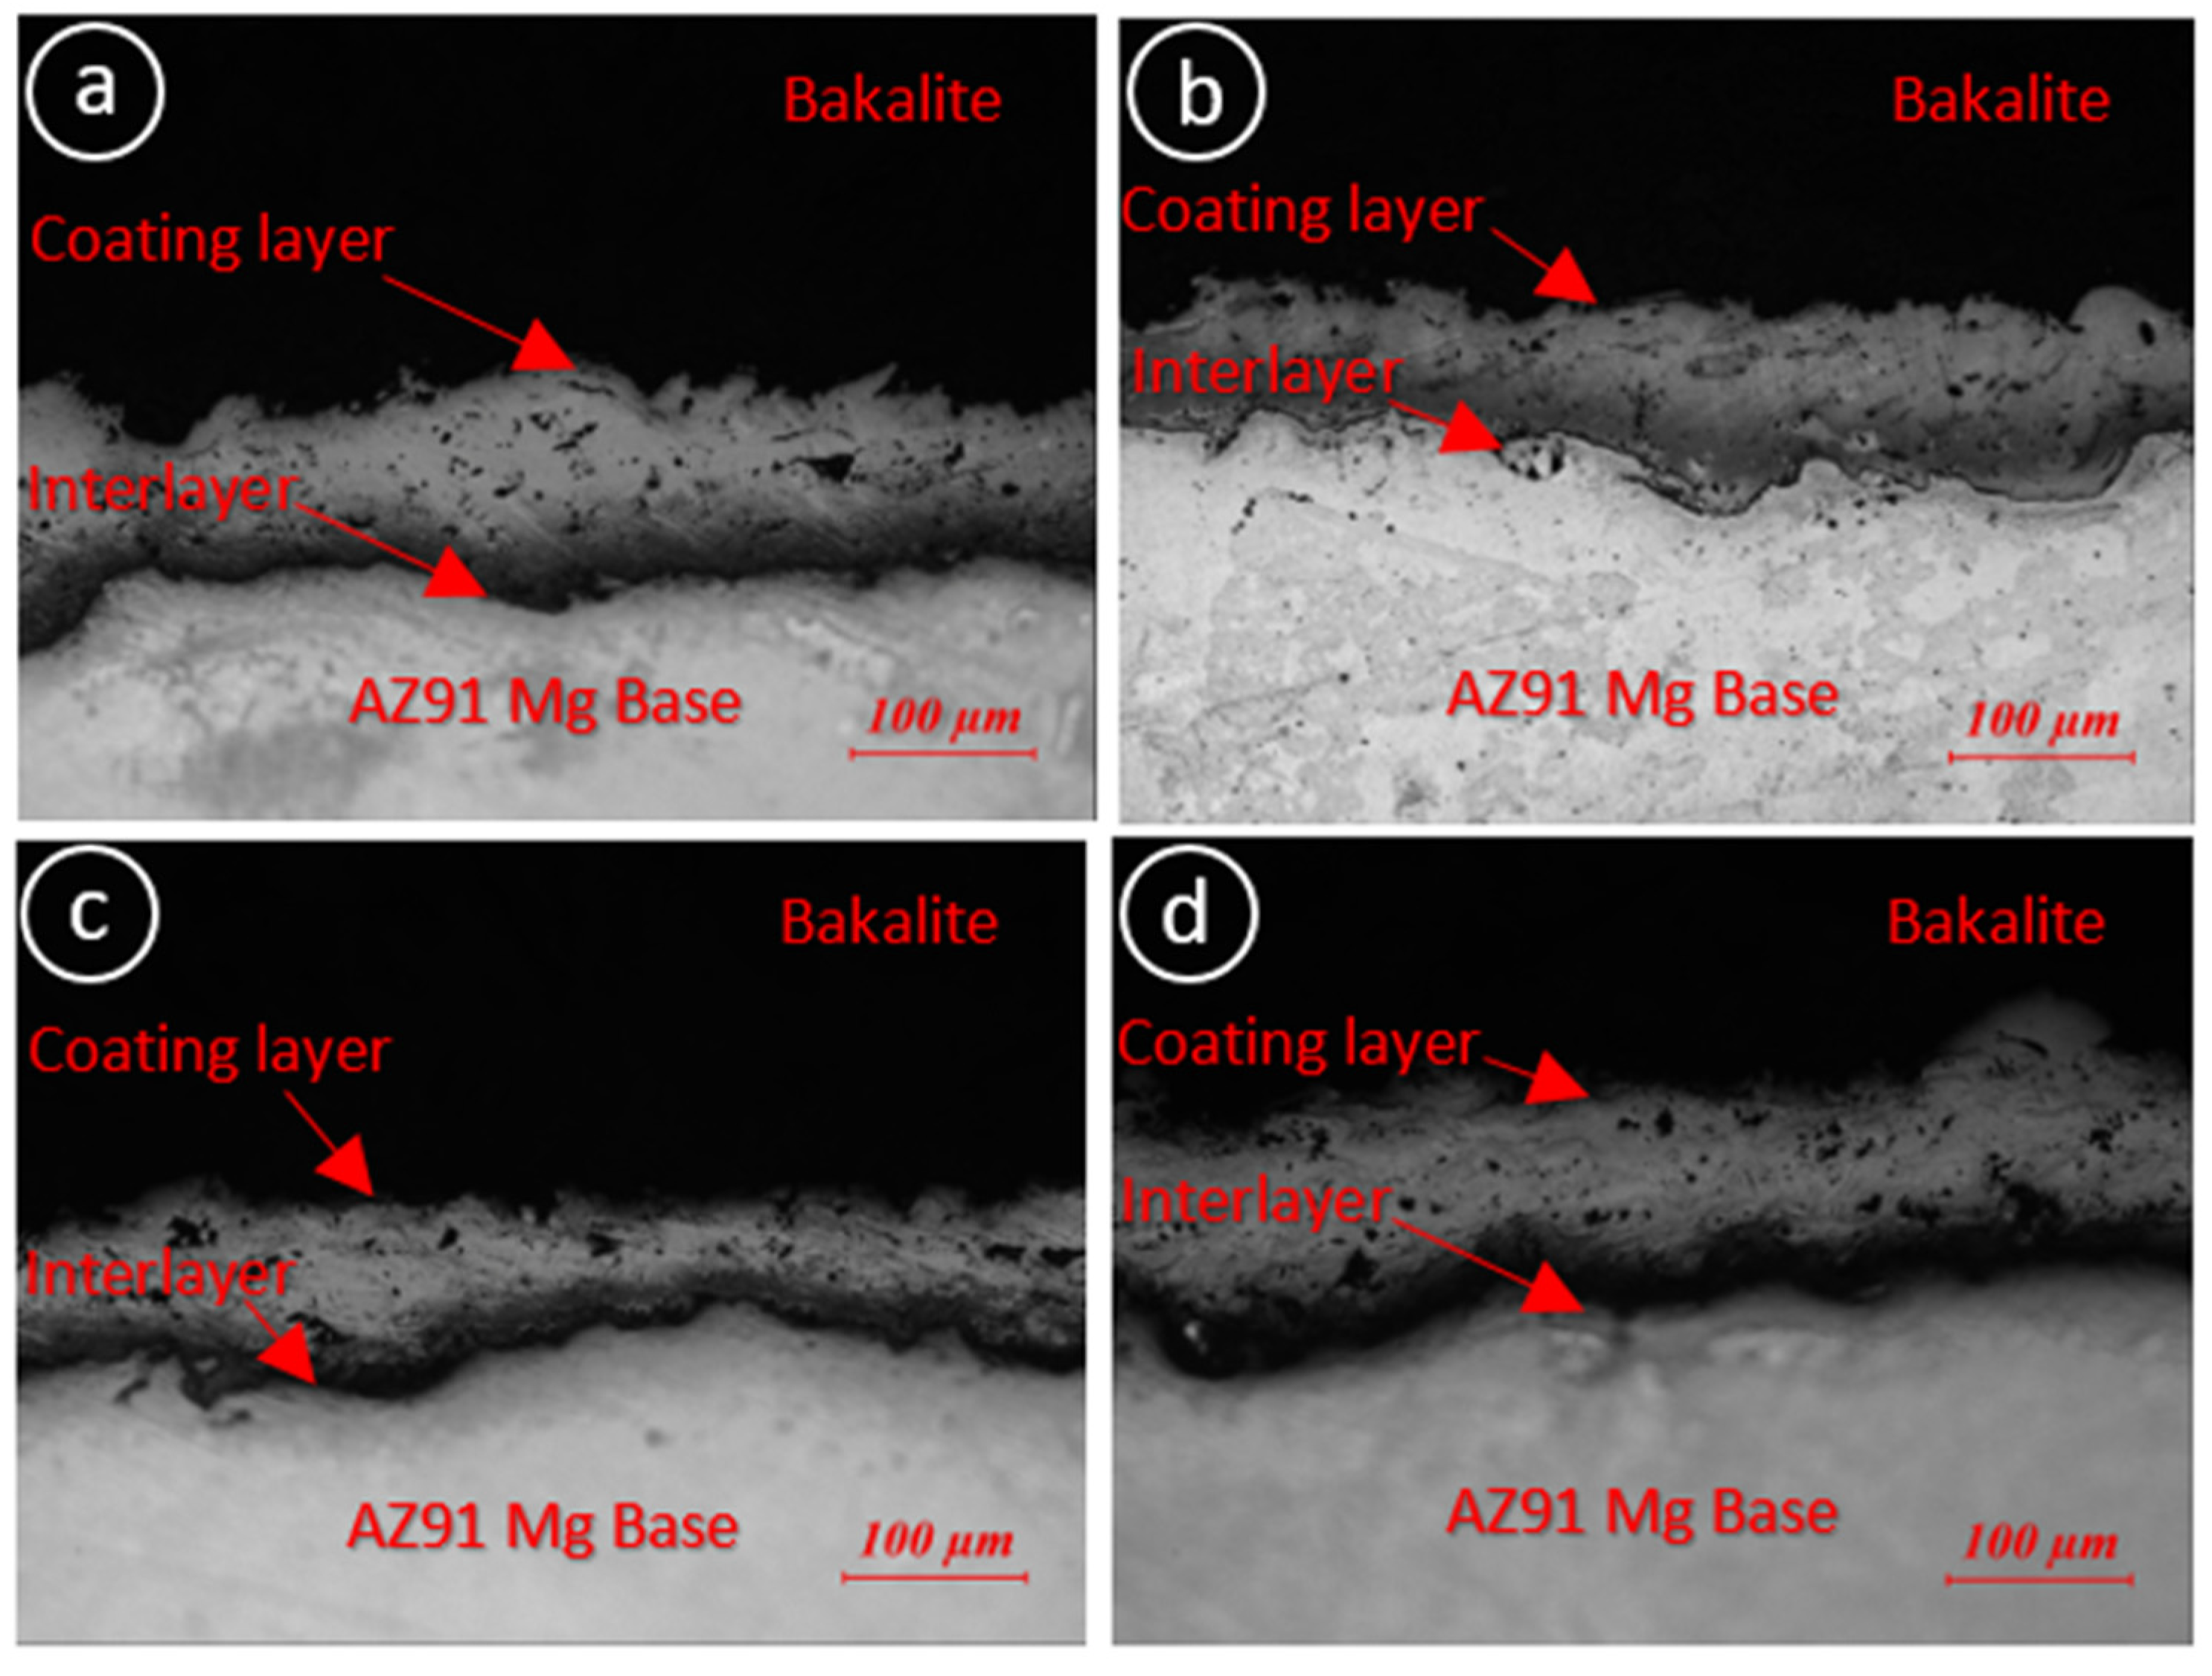
Cross-sectional optical microscopy (Figure 5) shows continuous lamellar coating bands on AZ91D, with no macroscale interfacial separation in the imaged fields. Isolated inter-splat pores, oxide-rich contrast, and local discontinuities remain visible, as expected for a thermally sprayed multiphase architecture [63]. Five scale-bar-calibrated measurements per representative panel gave apparent local thicknesses of 106 ± 15 µm for S1, 99 ± 11 µm for S2, 76 ± 12 µm for S3, and 100 ± 15 µm for S4. These values describe within-image variation and should not be interpreted as batch-level thickness reproducibility.
The cross-sections also indicate that the coatings are not fully featureless: isolated inter-splat pores, localized oxide-rich regions, and a multiphase lamellar architecture are visible, particularly in the WC-Co-reinforced coatings. These features are typical for thermally sprayed NiCrBSi/WC-Co systems and are important for interpreting the tribological behavior. In the present coatings, the pores and oxide-rich areas appear discontinuous rather than forming an open through-thickness network; therefore, the coating remains protective while the complex phase assemblage provides a combination of ductile γ-Ni/Co-based binding and hard boride/carbide load-bearing phases. This interpretation directly supports the later wear-rate, friction, and post-wear EDS results, where the S4 coating benefits from the most continuous carbide-rich load-bearing framework despite its more complex phase constitution.
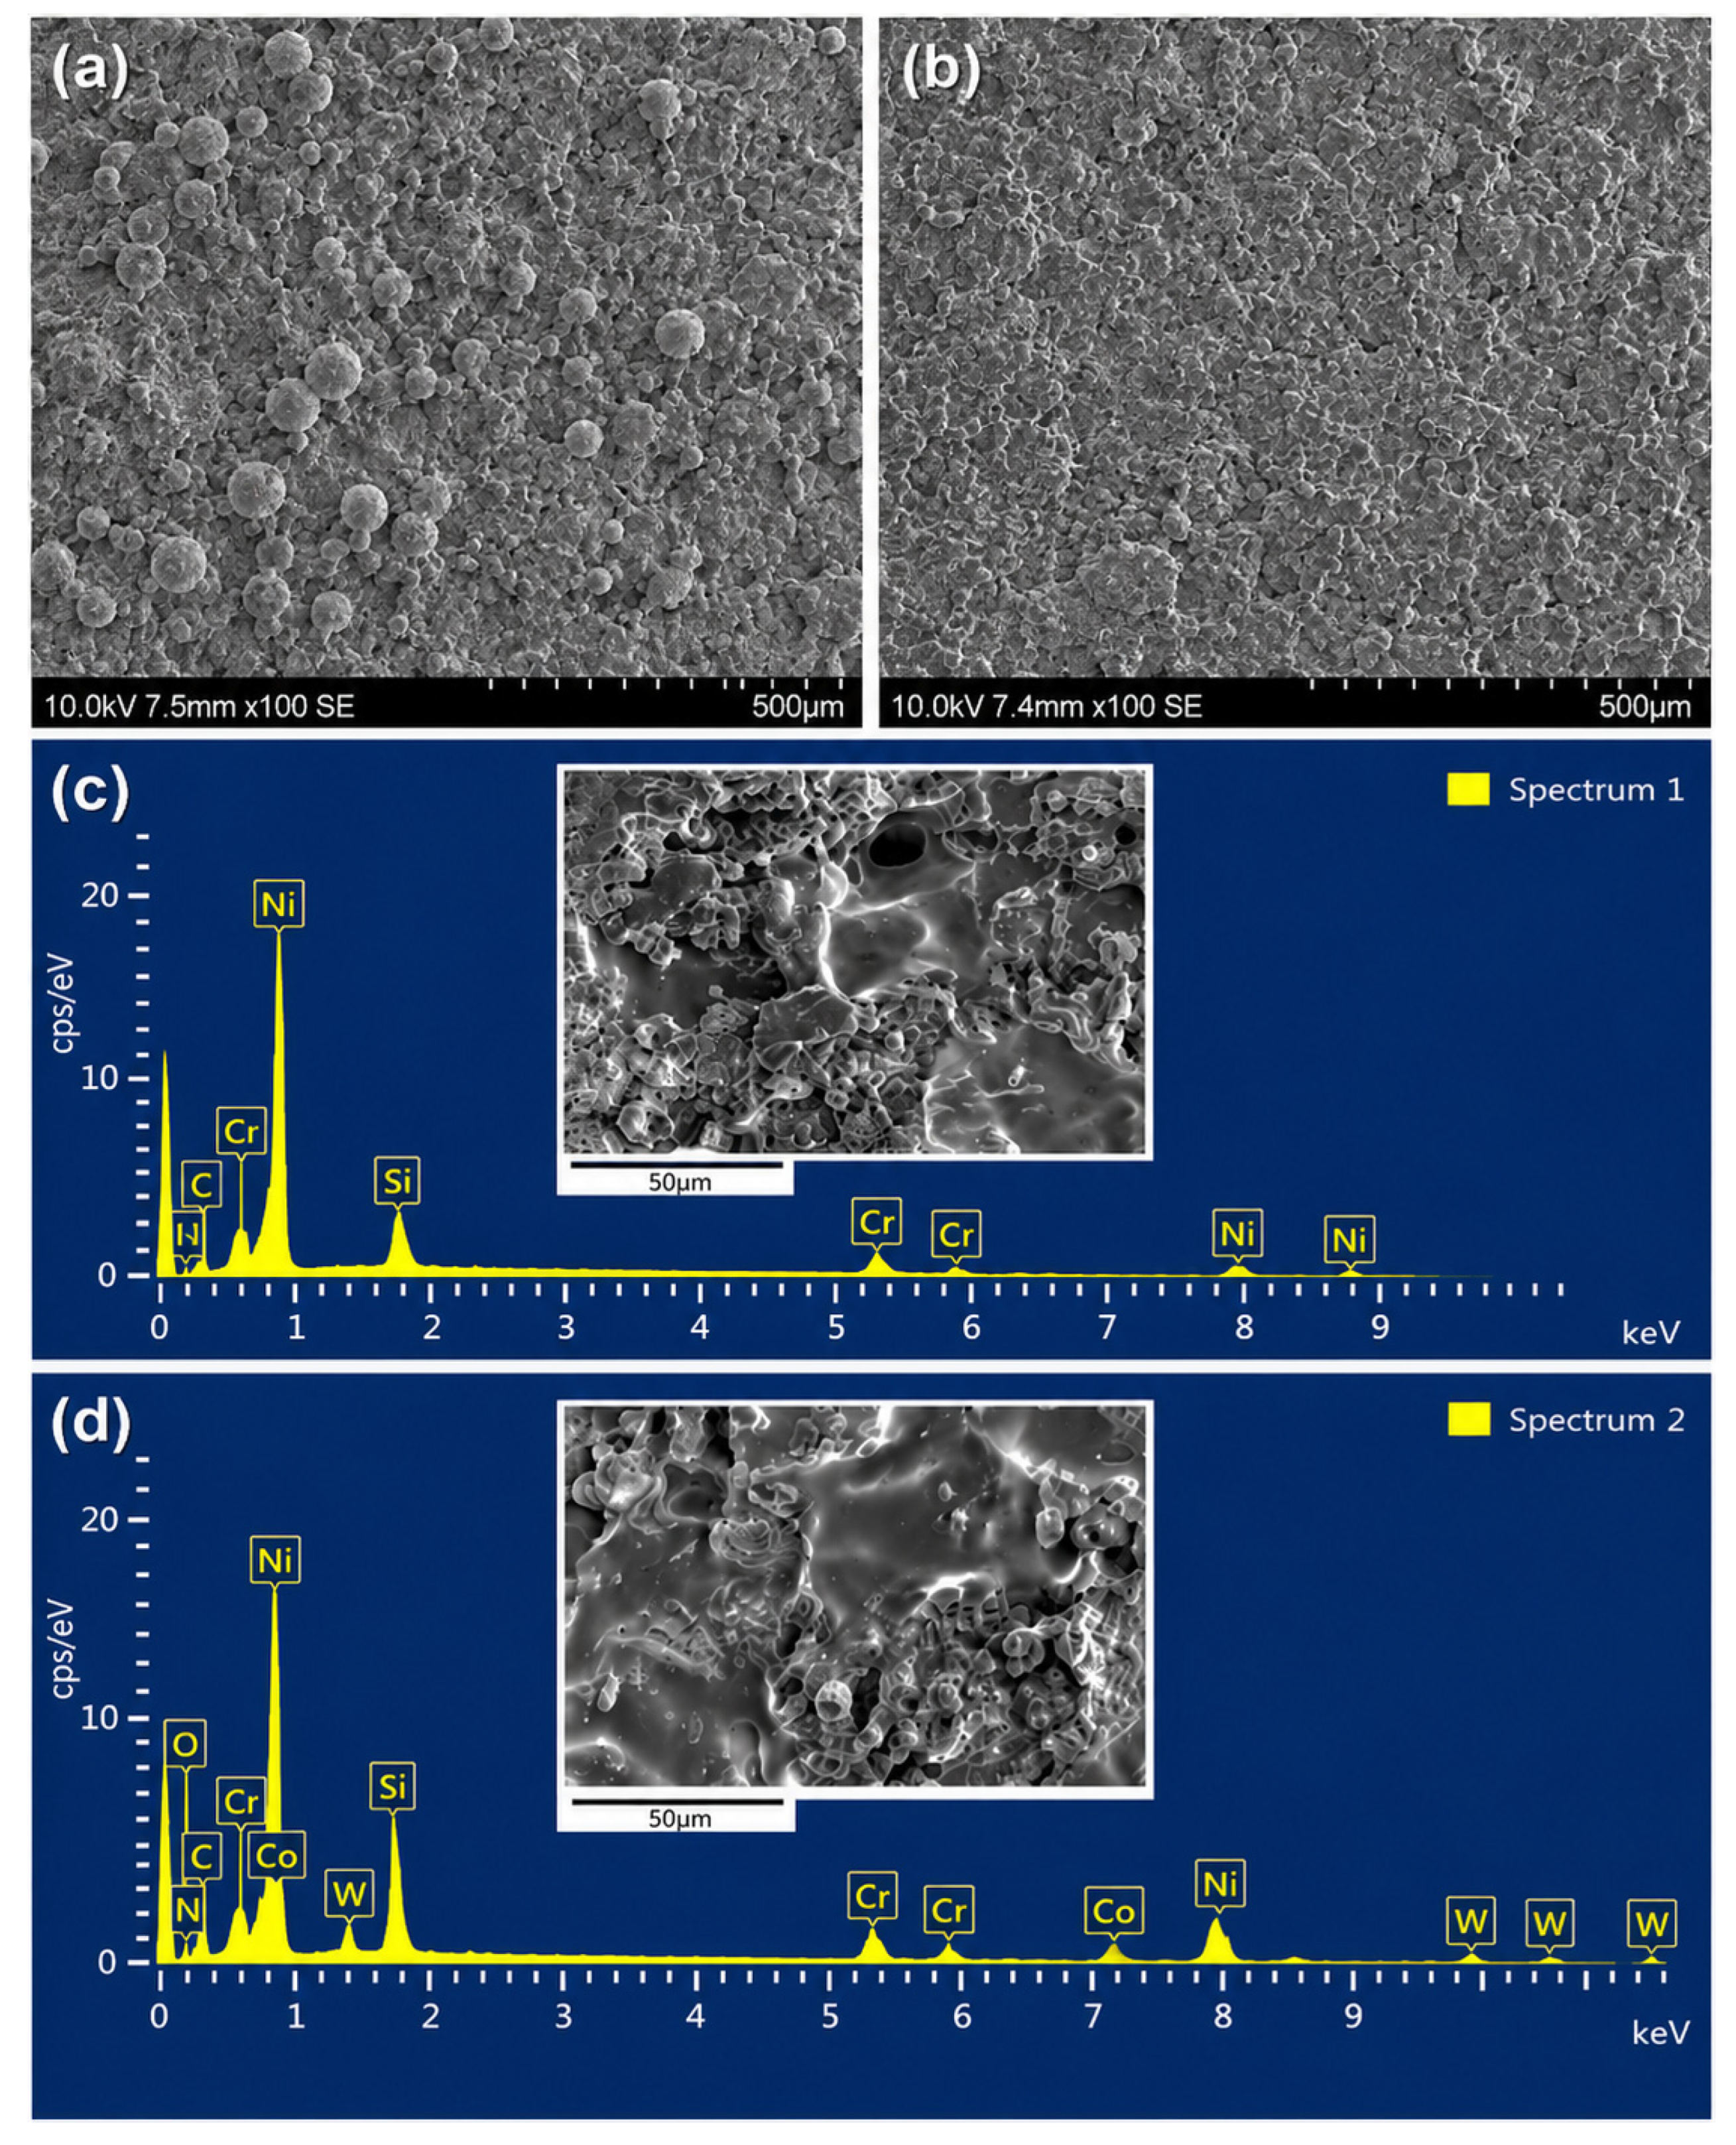
Top-surface SEM/EDS (Figure 6 and Table 3) distinguishes the comparatively Ni-Cr-rich S1 matrix from progressively more heterogeneous W-Co-rich regions in S2–S4. The increase in W and Co and the decreasing matrix dominance are consistent with the profilometry and XRD results and confirm the transition toward a carbide-rich composite architecture. The B and C values remain local semi-quantitative signals and are not interpreted as exact stoichiometric ratios or independent phase confirmation; phase interpretation is based on the combined XRD and SEM/EDS evidence.

3.2. Vickers Microhardness

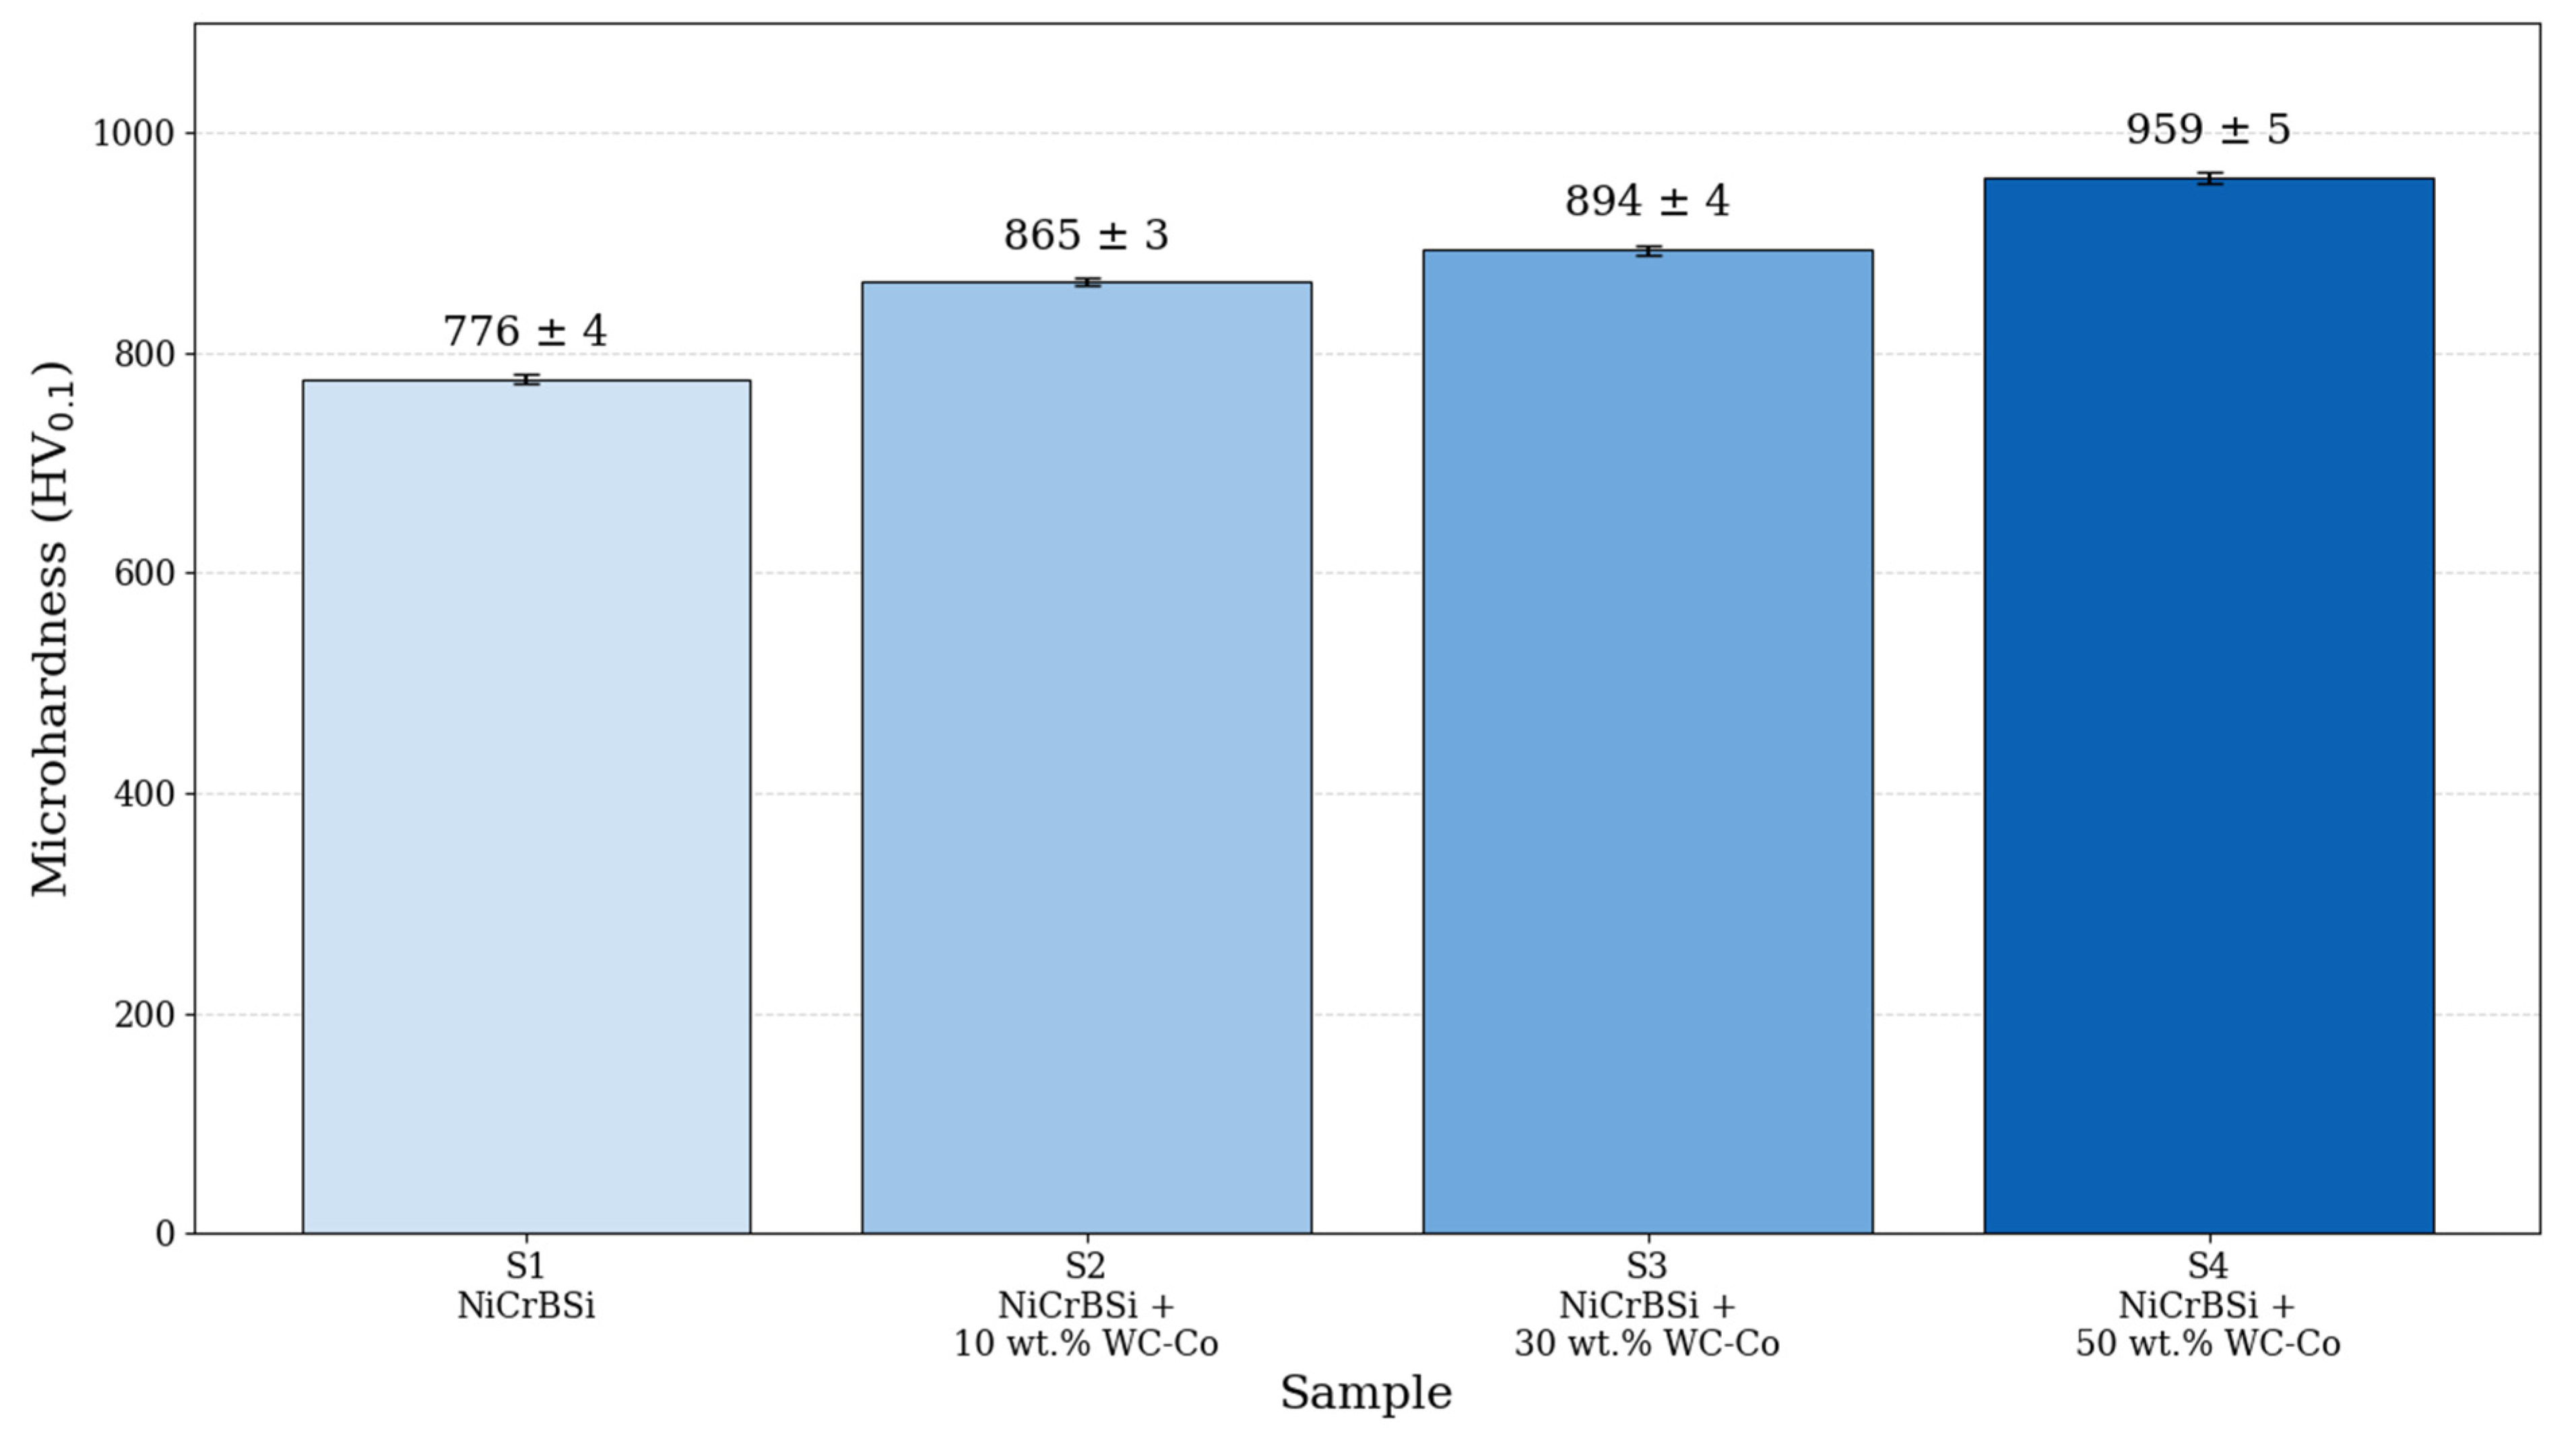
Vickers microhardness increased systematically from 776 ± 4 HV0.1 in S1 to 865 ± 3, 894 ± 4, and 959 ± 5 HV0.1 in S2, S3, and S4, respectively (Figure 7). The approximately 24% increase from S1 to S4 reflects the growing fraction and continuity of WC/W2C-bearing load-supporting regions together with the hard boride/carbide constituents of the NiCrBSi matrix. The smaller increment from S2 to S3 confirms that hardness also depends on carbide distribution, splat cohesion, local porosity, particle–matrix bonding, and oxidation. The microhardness measured in the substrate region adjacent to the coating was approximately 400–500 HV0.2; this increase is consistent with local impact-induced deformation during HVOF deposition and the cold-working effect of pre-spray grit blasting [65,66,67]. Each value is the mean ± standard deviation of three indentations within the coating and represents indentation-scale heterogeneity rather than independent-specimen reproducibility.

3.3. Wear

3.3.1. Weight Loss After Wear

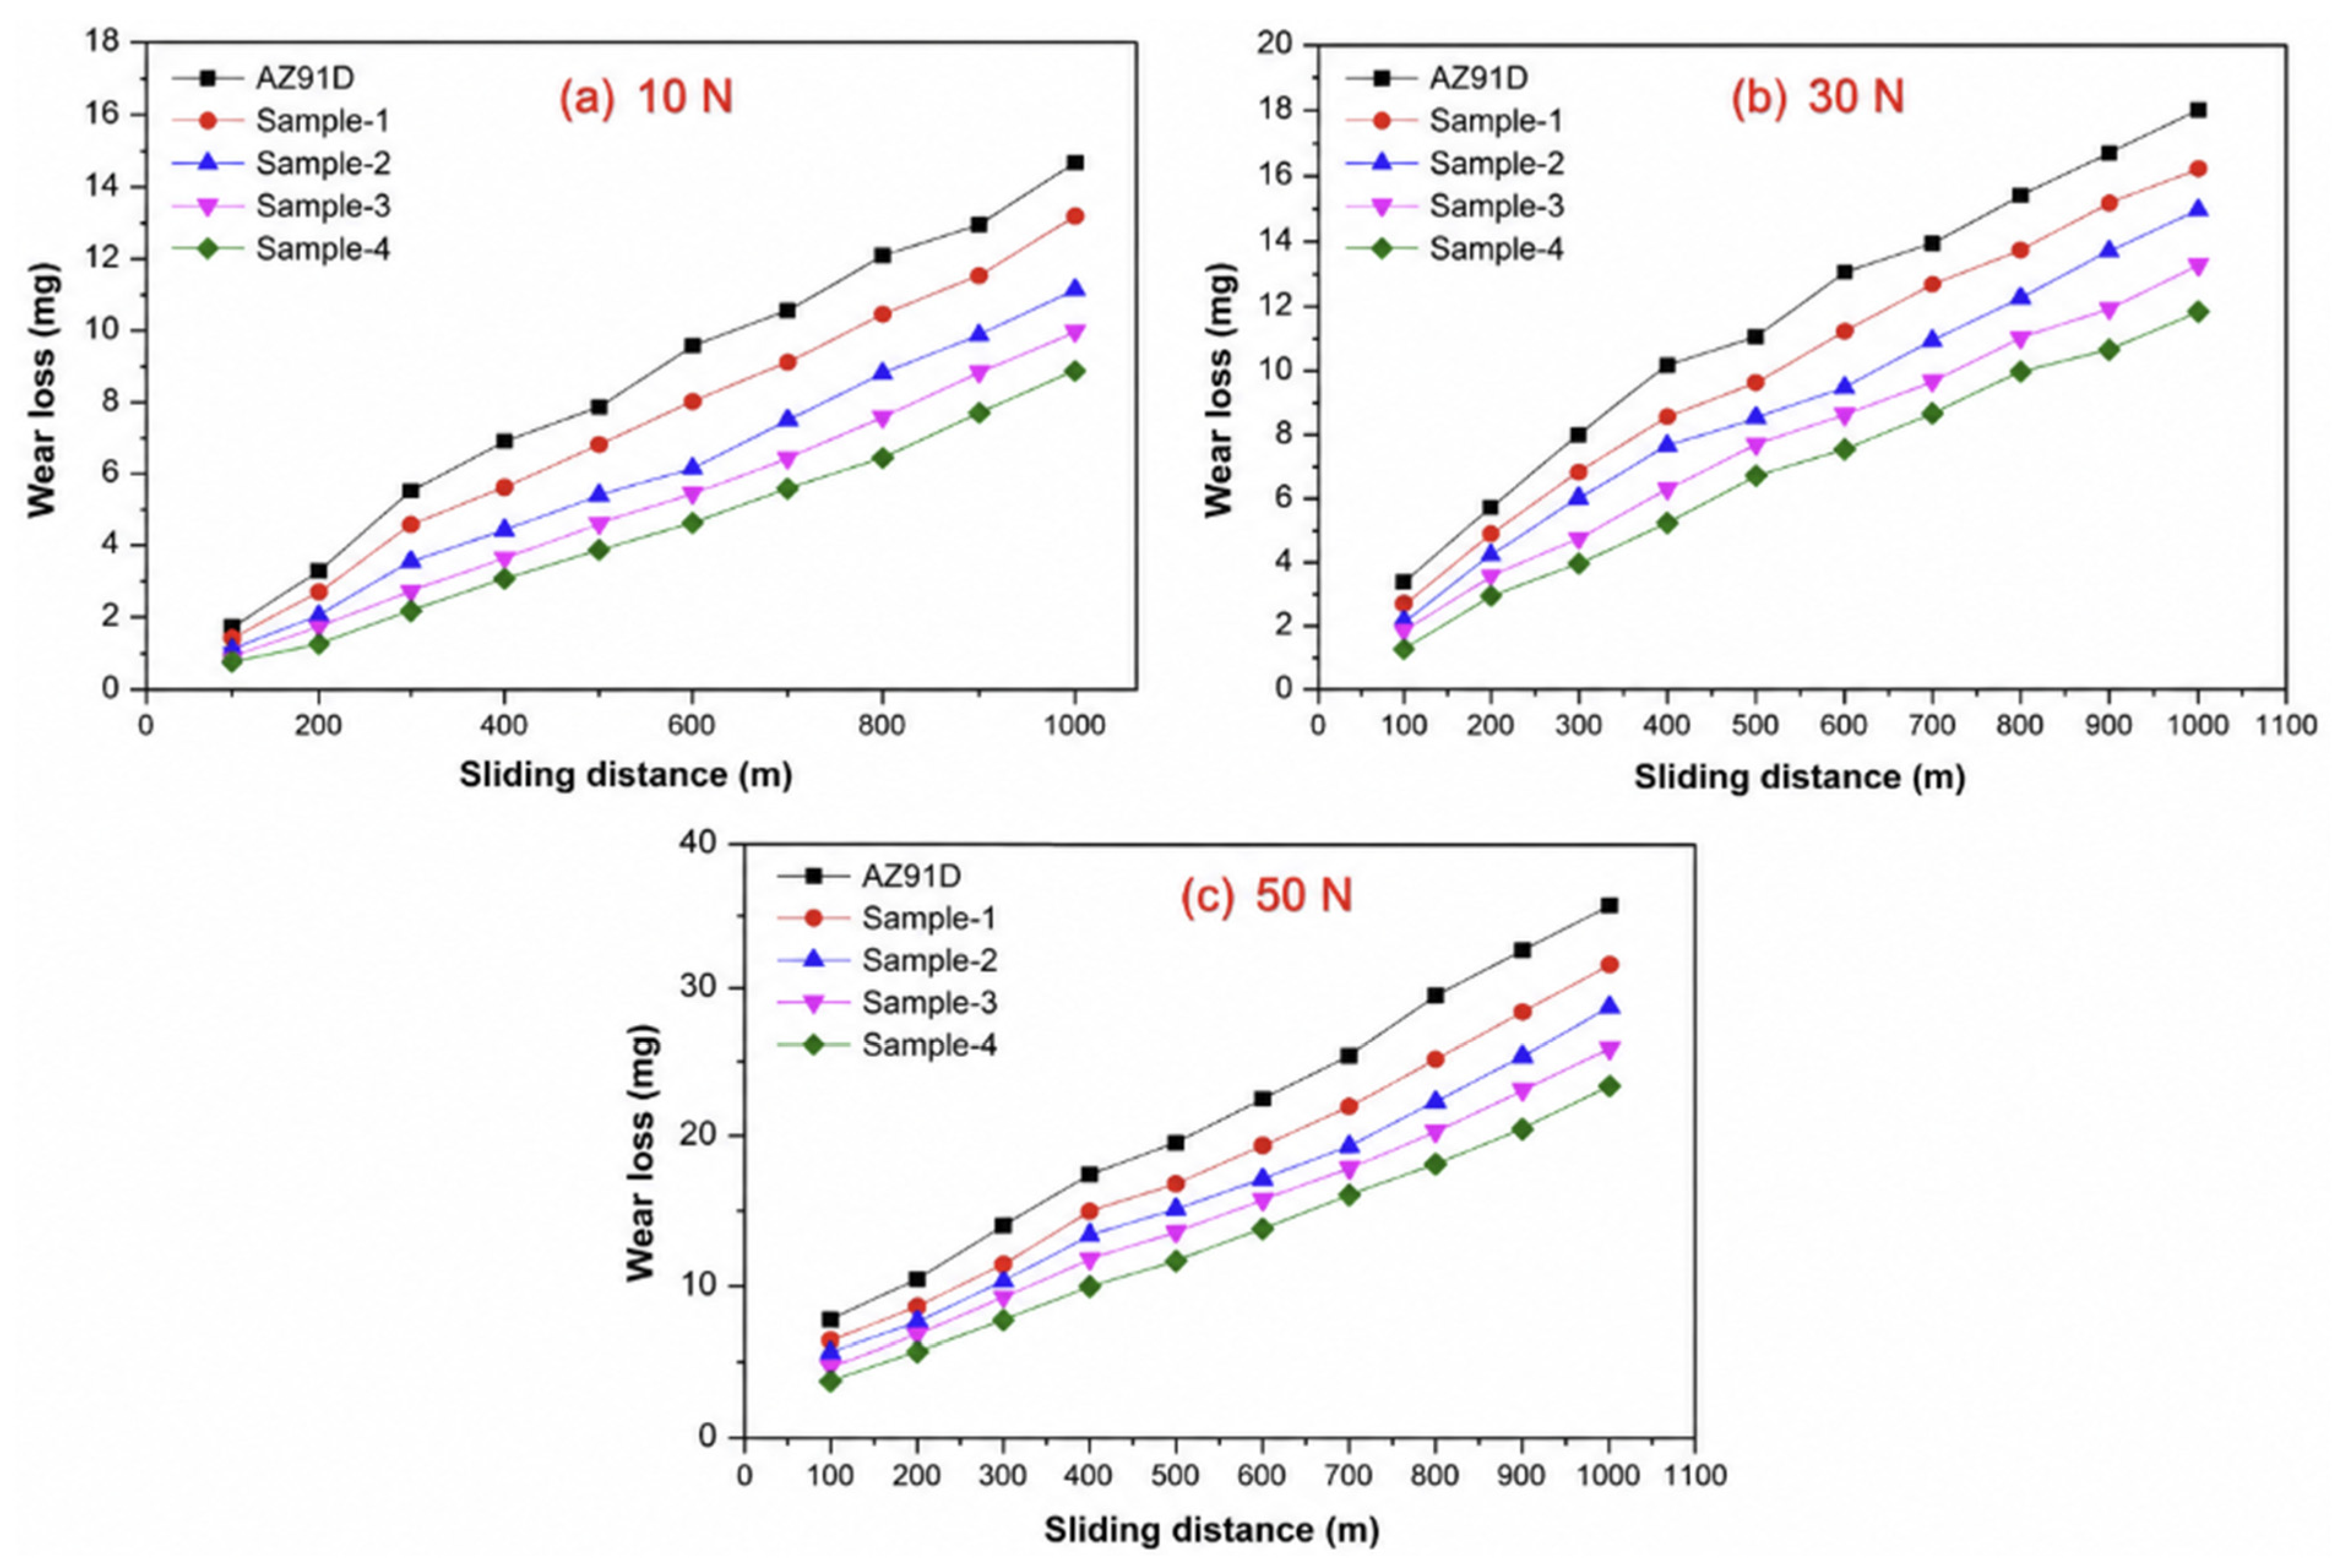
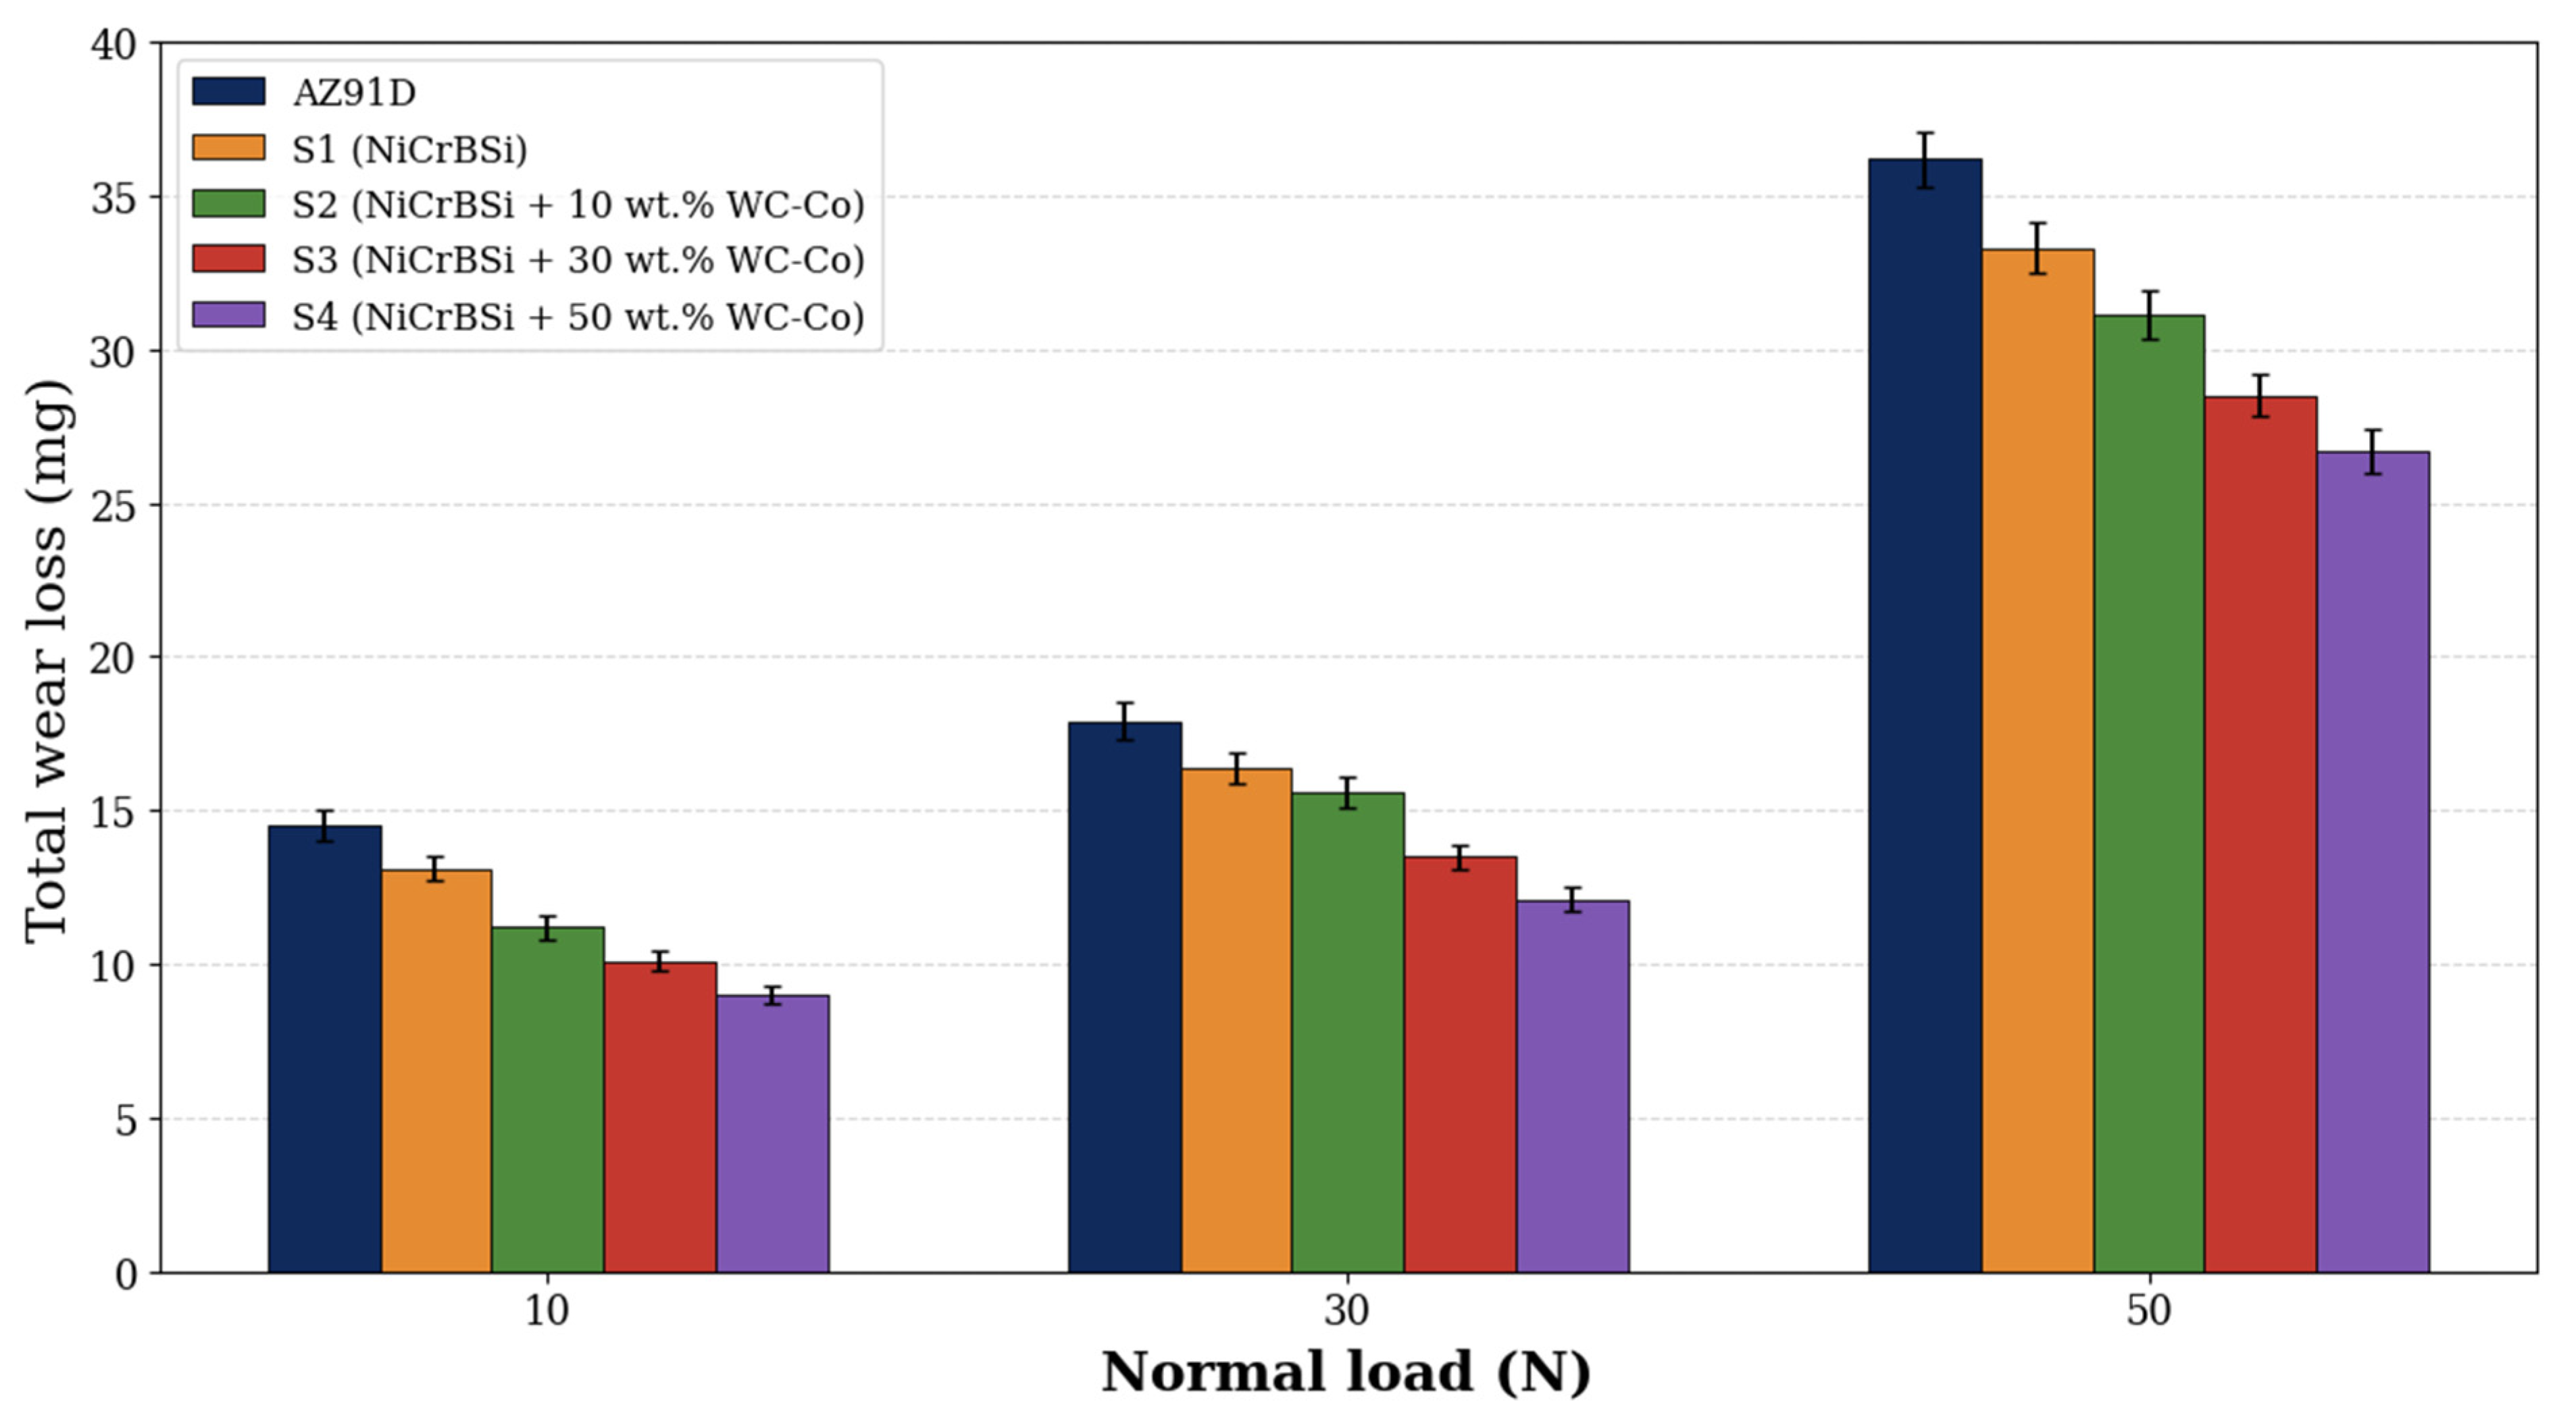
Mass loss increased with sliding distance and normal load for every condition (Figure 8), and the material loss ranking remained AZ91D > S1 > S2 > S3 > S4. The HVOF coatings shifted load support from the soft Mg-rich surface to the NiCrBSi-based layer, while progressively increasing WC-Co reduced matrix deformation, adhesive rupture, and micro-cutting through carbide-supported contact. The lower wear loss of S4 despite its higher initial Sa and Sq shows that long-distance performance was governed more strongly by hard-phase continuity, binder support, and controlled third-body formation than by roughness alone [46,55,56,57,64,65,66]. The corresponding total wear losses are presented in Figure 9. The wear curves are interpreted descriptively because the number of independent specimens underlying the reported dispersion is not documented. Moreover, the lower loss at 50 wt.% identifies the best result among the tested discrete levels only; intermediate formulations are required before a continuous composition optimum can be established.
The wear loss values were additionally normalized by load and sliding distance using Wm = Δm/(F·L). At 1000 m, S4 exhibited Wm values of 9.0 × 10⁻⁴, 4.0 × 10⁻⁴, and 5.3 × 10⁻⁴ mg N−1 m−1 at 10, 30, and 50 N, respectively, whereas the corresponding AZ91D values were 14.5 × 10⁻⁴, 6.0 × 10⁻⁴, and 7.2 × 10⁻⁴ mg N−1 m−1. Thus, S4 reduced Wm by approximately 38%, 32%, and 26%. Direct comparison with other coatings requires caution because counterfaces, speeds, loads, distances, post-treatments, and mass- or volume-based reporting differ among studies. Nevertheless, the trend agrees with NiCrBSi/WC-Co and WC-based HVOF or supersonic coatings in which carbide continuity, binder-mediated retention, and controlled third-body formation govern wear [46,56,63,64,65,66,67,68,69,70,71,72]. Within the present screening matrix, S4 combined the lowest mass loss, lowest Wm, and most stable friction response.

3.3.2. Coefficient of Friction

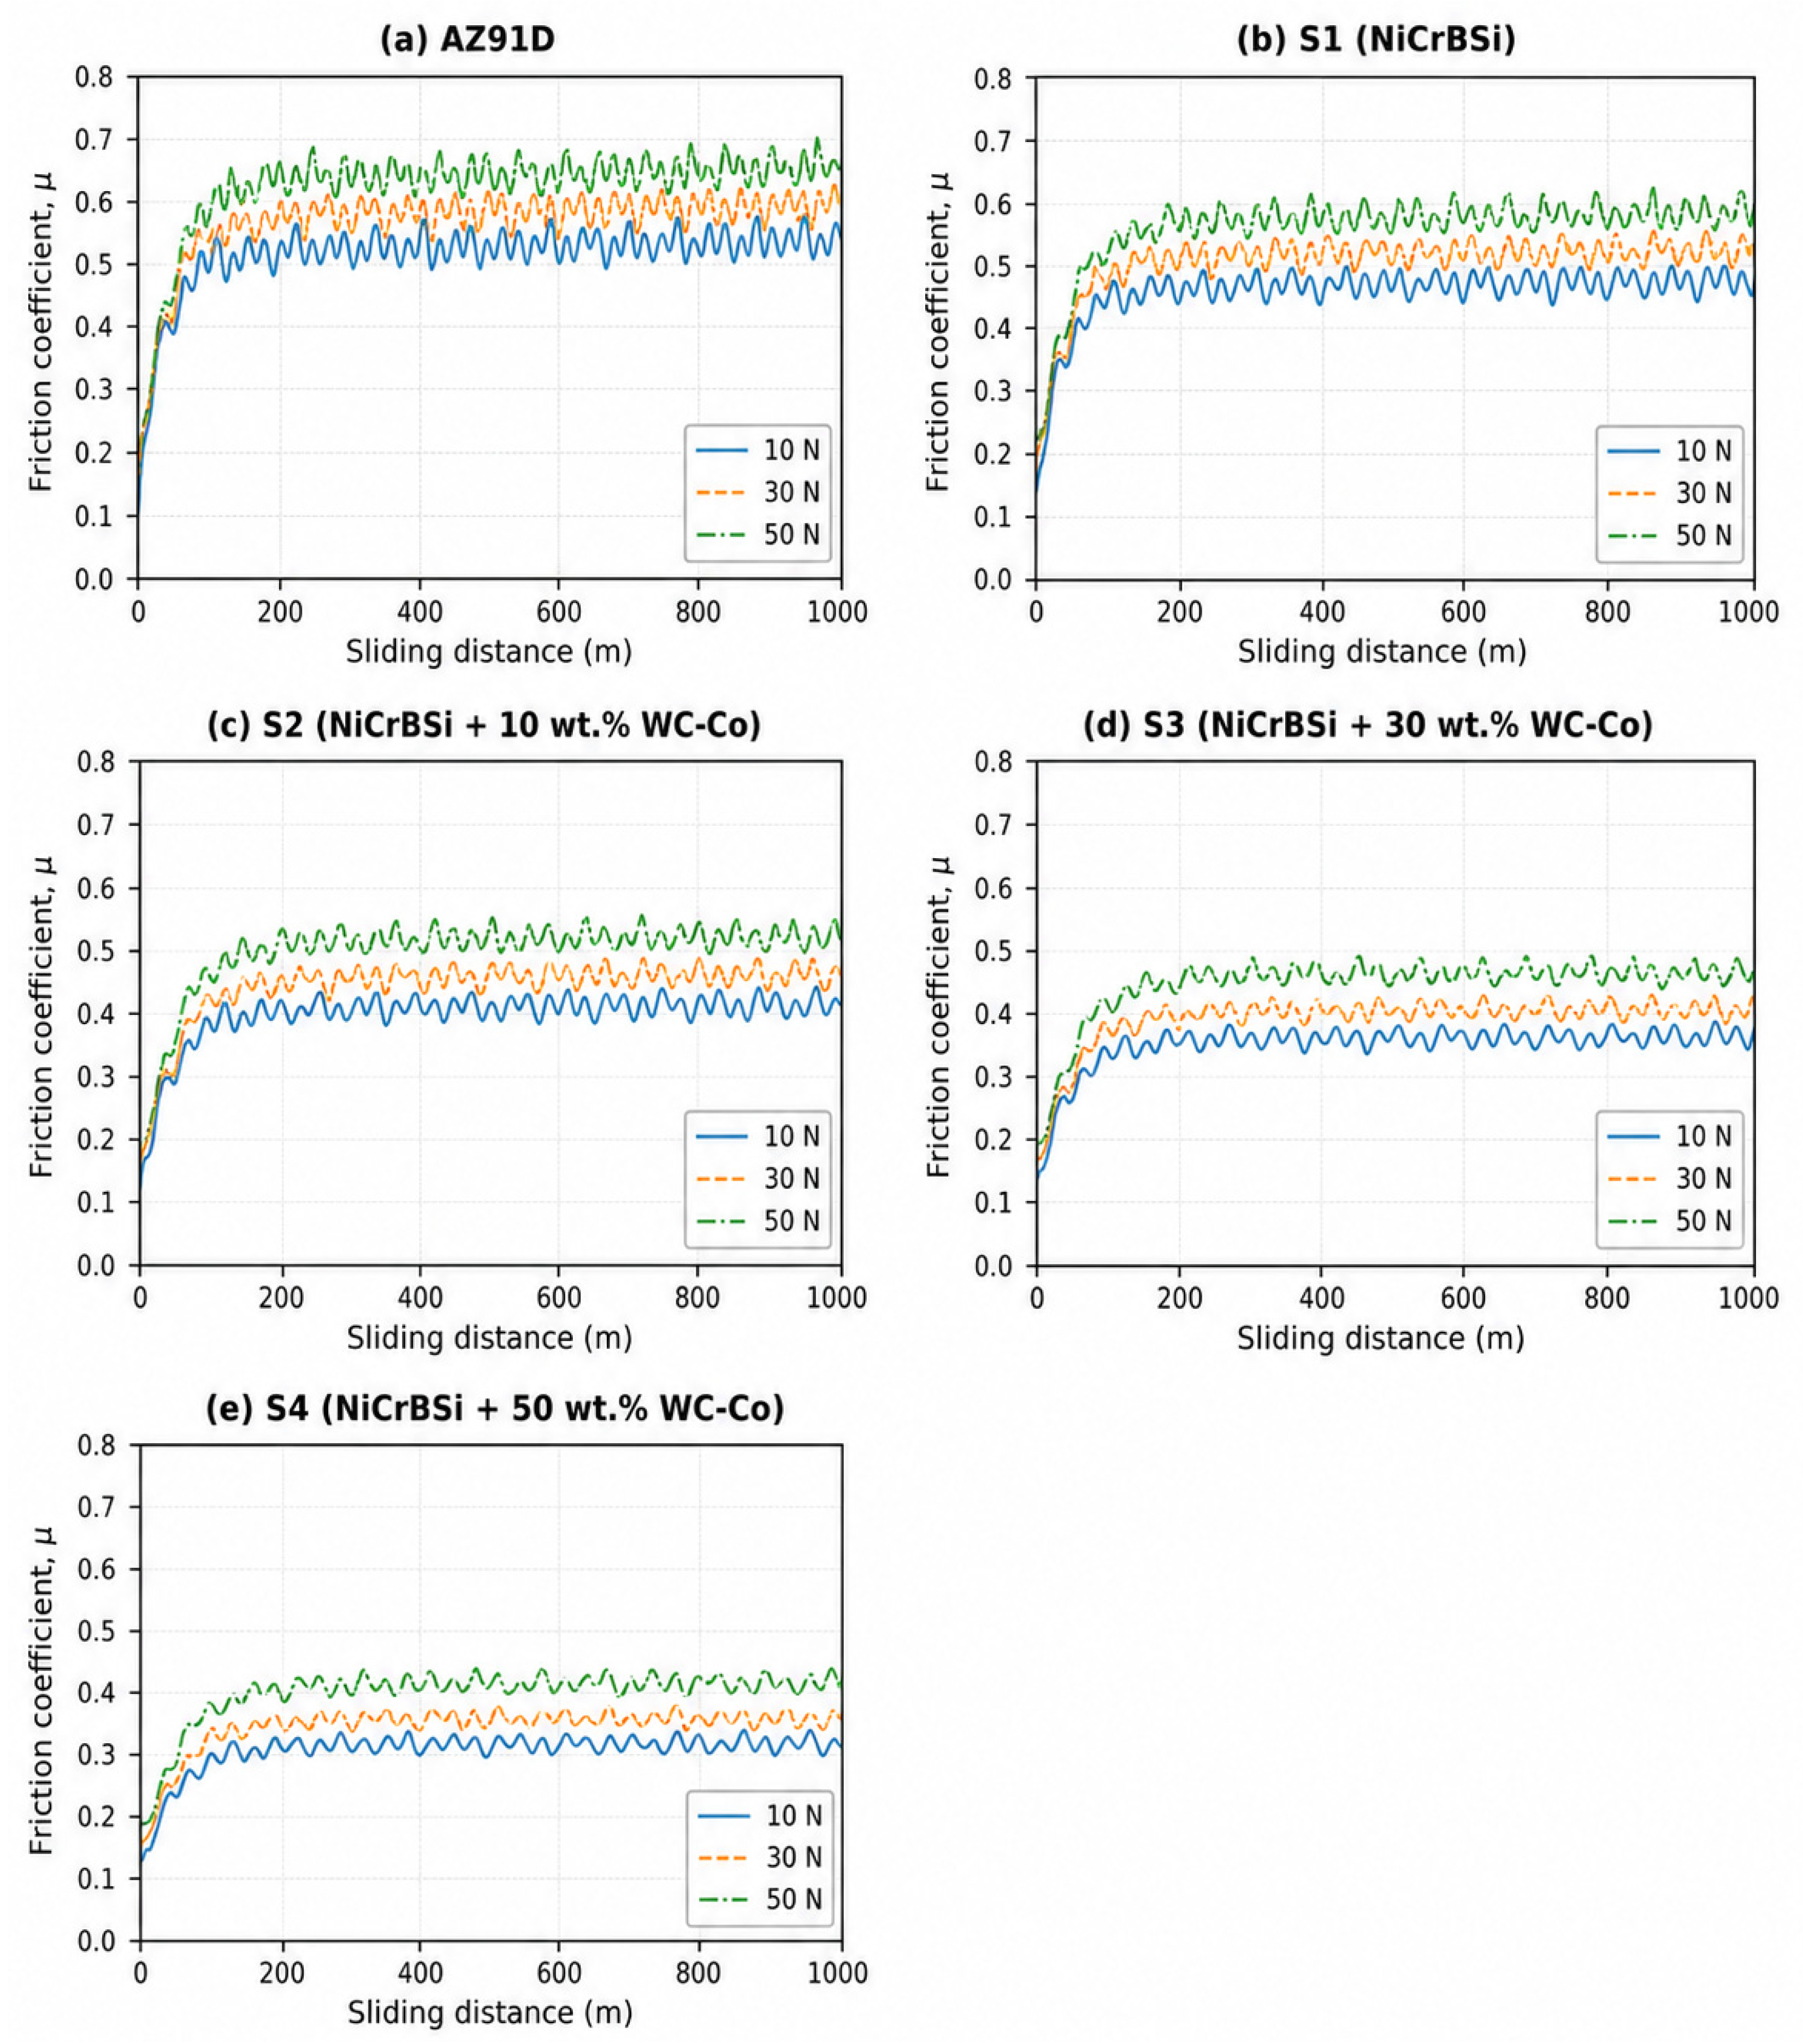
The 1 m resolved friction traces in Figure 10 show rapid accommodation over approximately the first 50–100 m, followed by a lower-amplitude quasi-steady response. The initial rise is consistent with asperity fracture, flattening, removal of loosely retained spray particles, and establishment of the first mechanically mixed layer. Subsequent fluctuations reflect periodic carbide–particle extraction, binder smearing, tribo-oxidative/third-body layer formation and breakdown, and debris circulation [68,69,70,71].
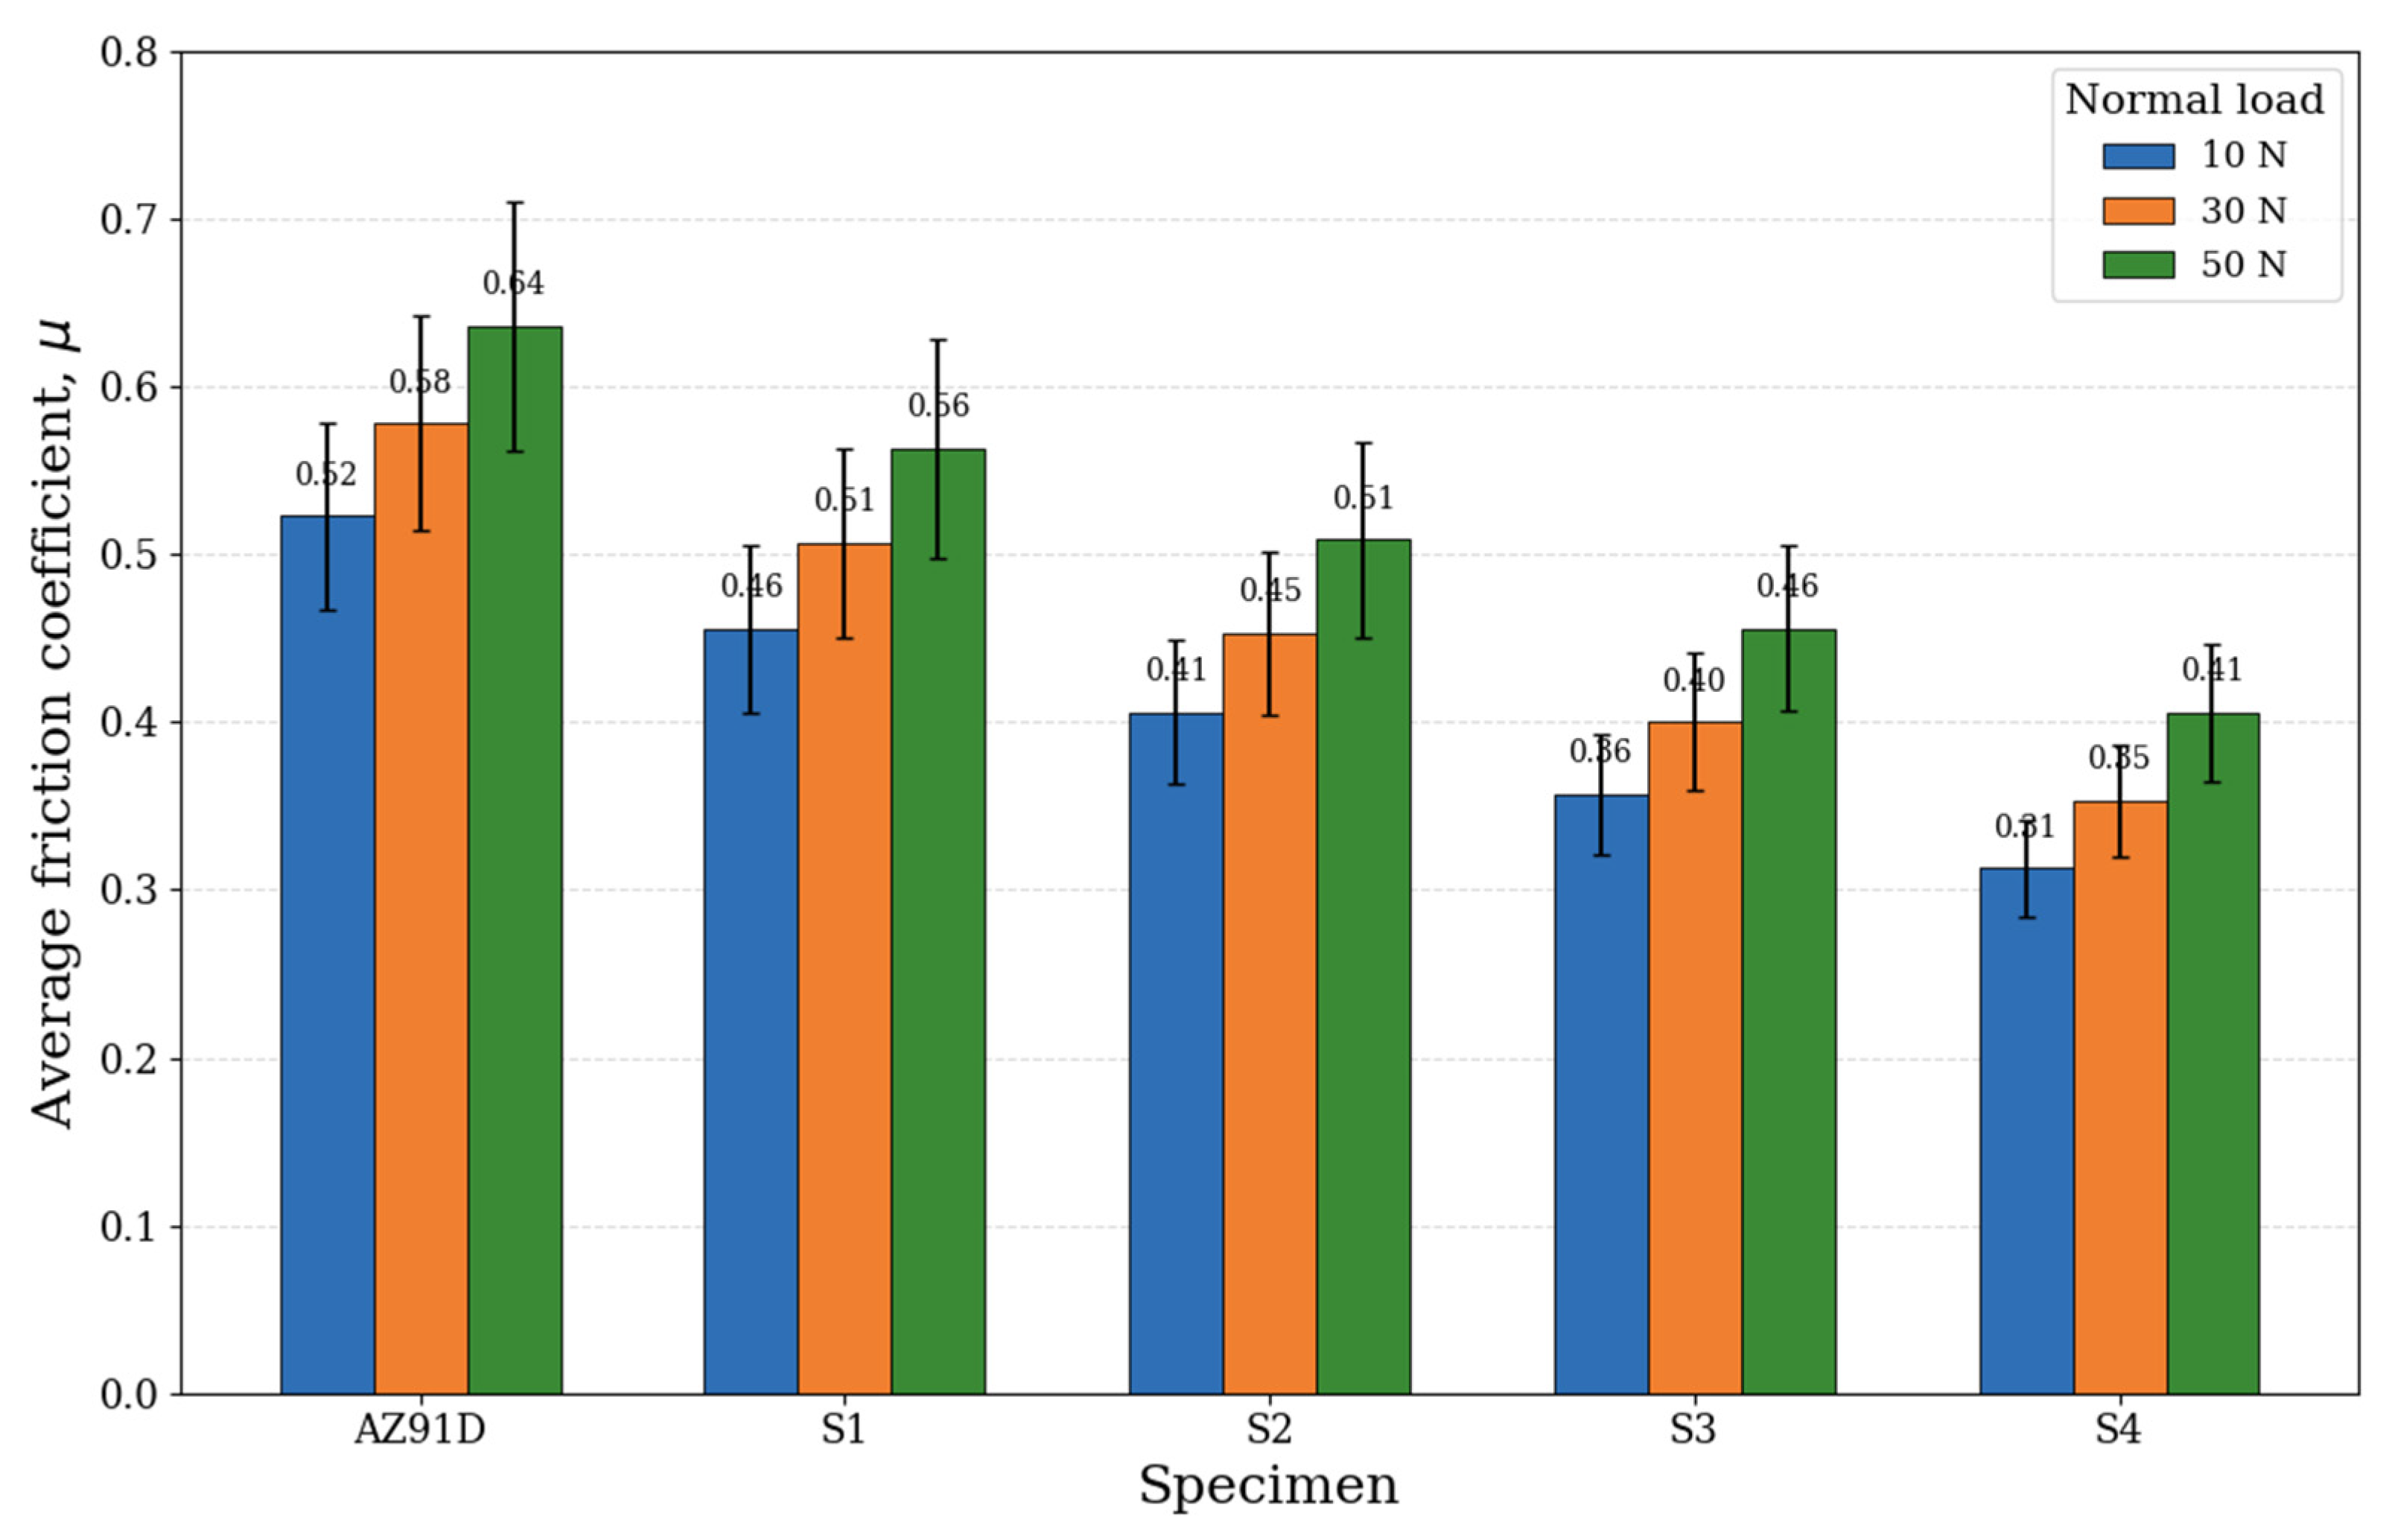
Under a load of 10 N, the overall average friction coefficients for 0–1000 m were 0.52, 0.46, 0.41, 0.36, and 0.31 for AZ91D, S1, S2, S3, and S4, respectively, with corresponding standard deviations of 0.06, 0.05, 0.04, 0.04, and 0.03. The uncoated AZ91D surface showed the highest friction level, while the S4 coating containing 50 wt.% WC-Co reduced the average μ value by 40.1% compared with AZ91D. The late-stage averages for 501–1000 m were 0.54, 0.47, 0.42, 0.37, and 0.32, respectively. Under 30 N, the overall average μ values were 0.58, 0.51, 0.45, 0.40, and 0.35 for AZ91D, S1, S2, S3, and S4, respectively; the reduction for S4 relative to AZ91D was 38.9%. Under 50 N, the overall average μ values were 0.64, 0.56, 0.51, 0.46, and 0.41, respectively, and S4 retained a 36.2% lower average friction coefficient than AZ91D. As the load increased, the friction level increased for all specimens because the real contact area, contact pressure, and subsurface shear stresses became larger. However, WC-Co-reinforced coatings retained their ranking due to the load-carrying capacity of the WC/W2C-rich regions and the deformation-limiting effect of the NiCrBSi matrix.
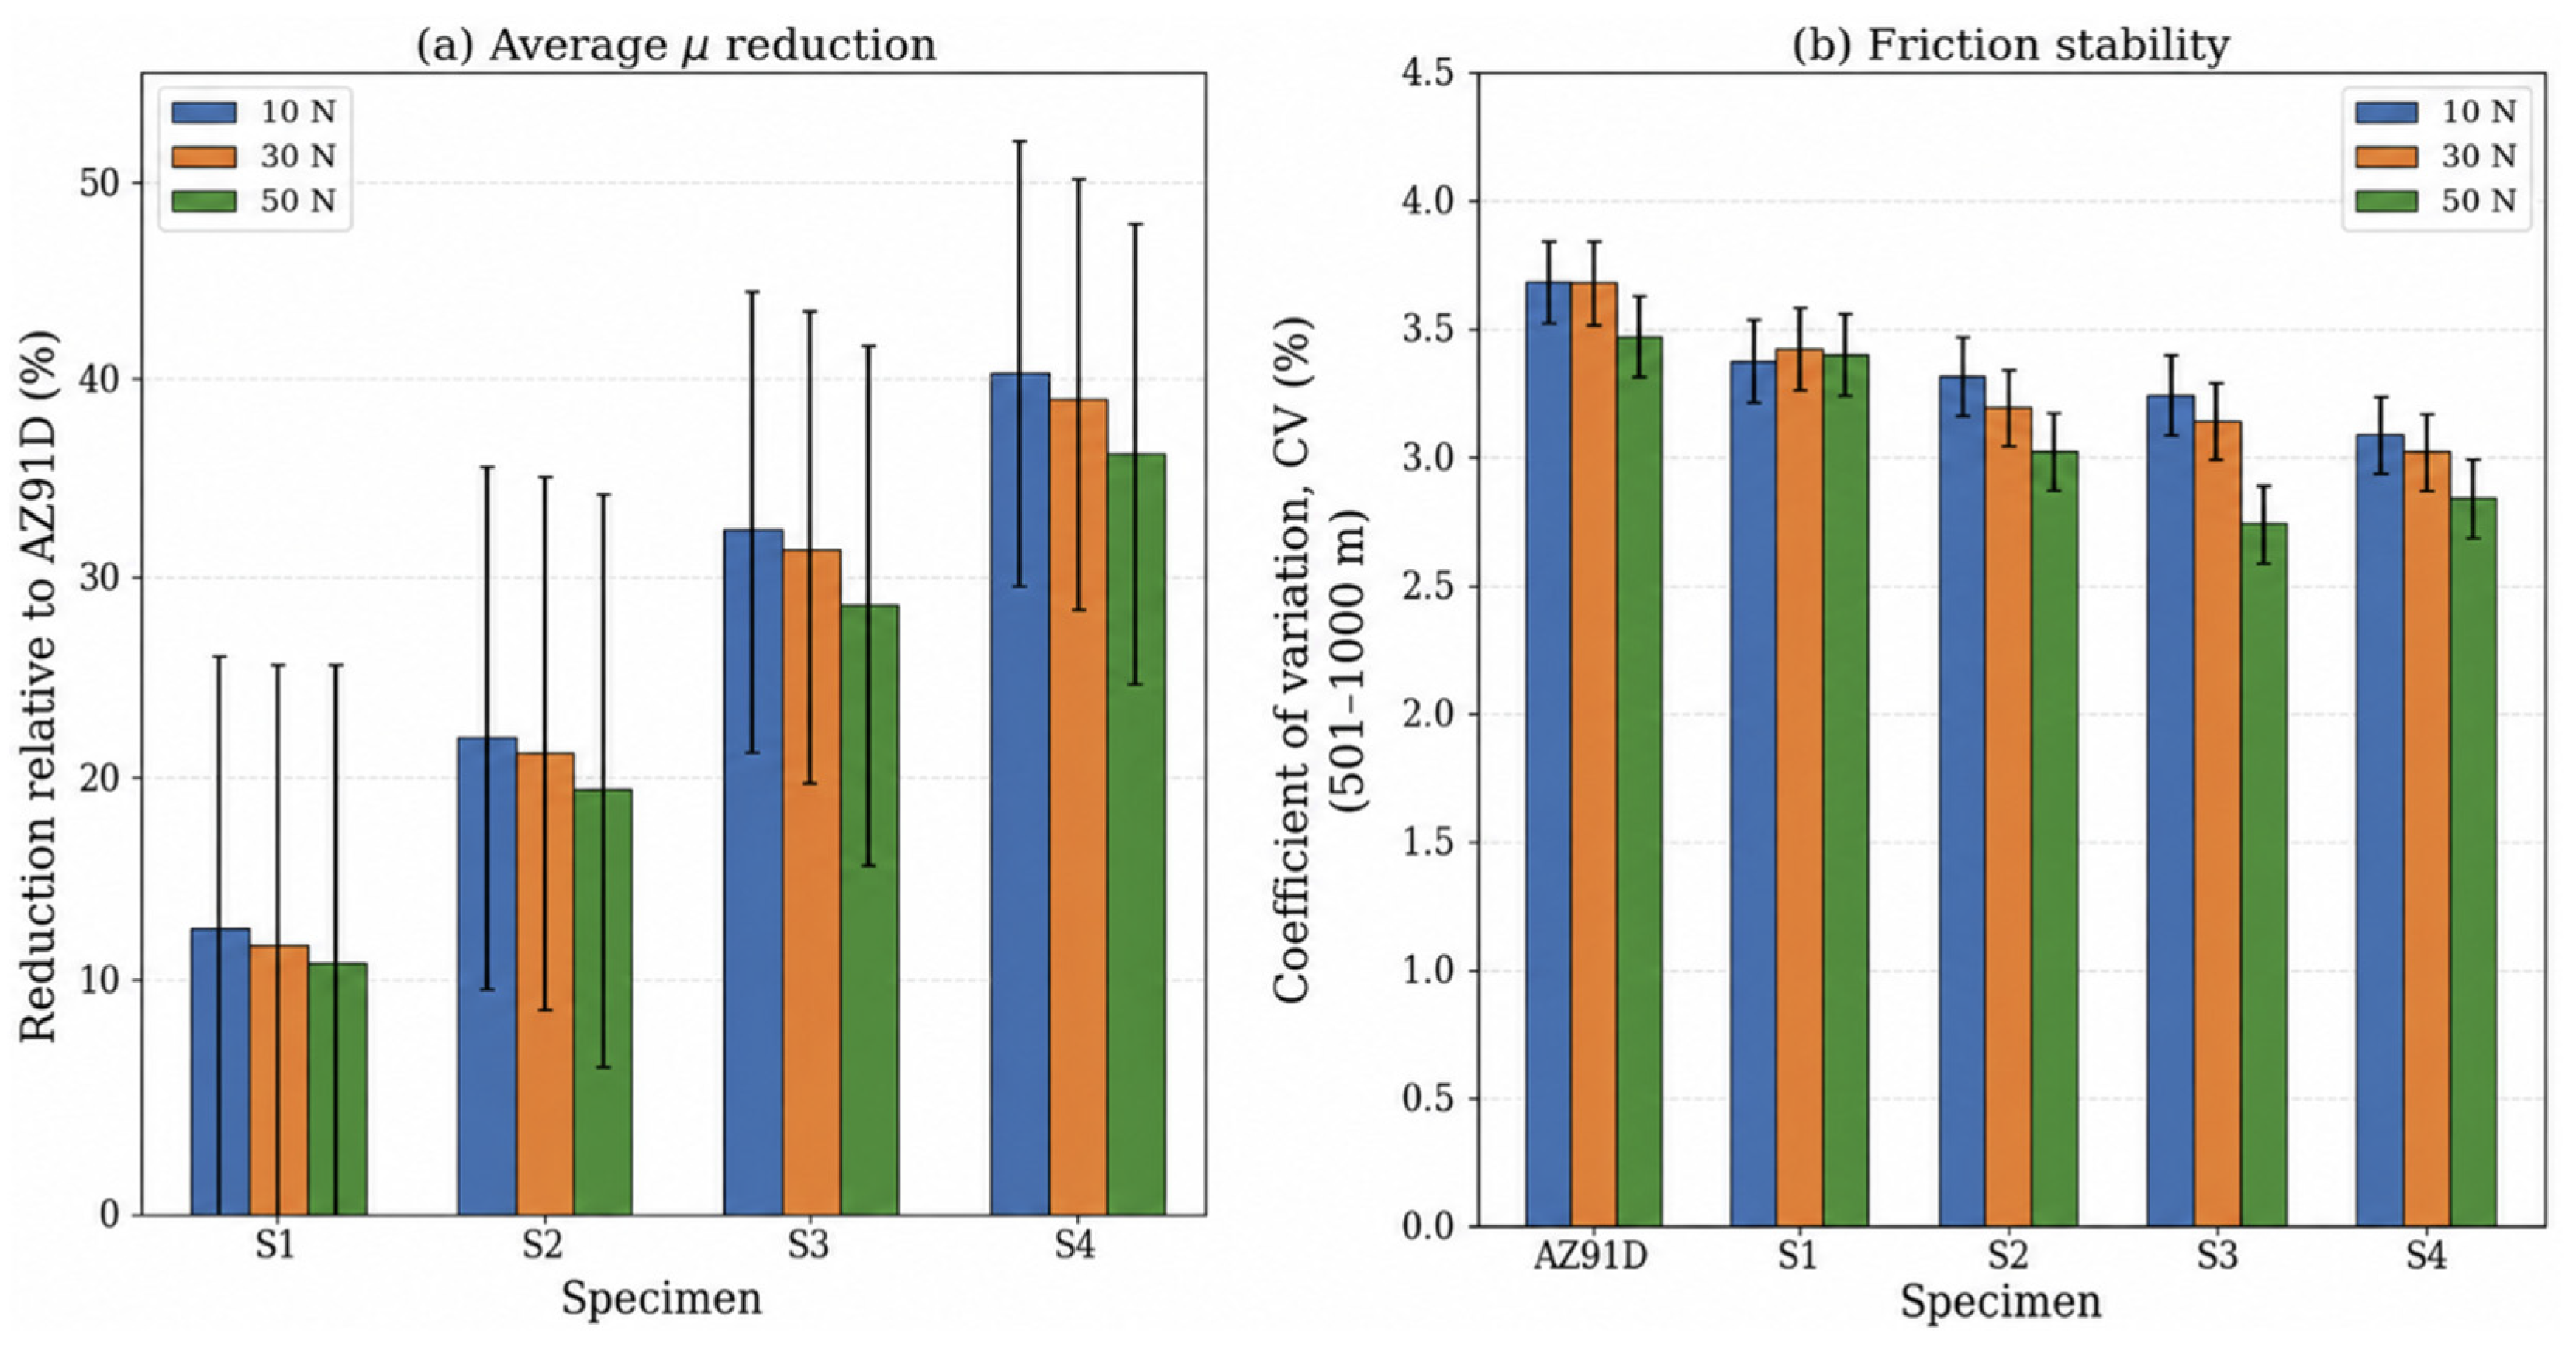
Figure 11 separates the load effect for each material. Raising the load from 10 to 50 N increased the overall mean coefficient of friction by 21.7%, 23.4%, 25.3%, 27.6%, and 29.7% for AZ91D, S1, S2, S3, and S4, respectively, although S4 retained the lowest absolute friction at every load. This trend is consistent with the combined influence of contact intensity and tribo-oxidation reported for HVOF WC-based coatings [68]. The composition effect cannot be attributed to hardness alone: carbide-rich regions limit counterface penetration, the Co-containing binder promotes particle retention, and the compacted friction layer moderates shear, while the initially higher roughness can intensify run-in interlocking [69]. The overall mean coefficients are presented in Figure 12, while the relative reductions and late-stage stability metrics are presented in Figure 13; the corresponding statistical descriptors are summarized in Table 4.
Across all loads, the mean friction ranking was AZ91D > S1 > S2 > S3 > S4. S4 reduced mean friction by 40.1%, 38.9%, and 36.2% at 10, 30, and 50 N, while its late-stage coefficient of variation decreased to 3.1%, 2.9%, and 2.8%. The lower late-stage fluctuation is consistent with improved carbide retention and reduced binder extrusion [71]. Composition-dependent friction and wear trends in related HVOF systems likewise emphasize the combined roles of hard-phase fraction, matrix support, and contact mode [56,72]. Friction and wear are not linked one to one: an oxide-rich or mechanically mixed layer can reduce interfacial shear, whereas repeated fracture of the same layer can generate abrasive third bodies and increase material loss [70]. The friction data must therefore be interpreted together with mass loss, microhardness, topography, and post-wear SEM/EDS. Table 5, Table 6 and Table 7 retain the values at 100 m intervals for direct numerical comparison.

3.3.3. Post-Wear SEM Images

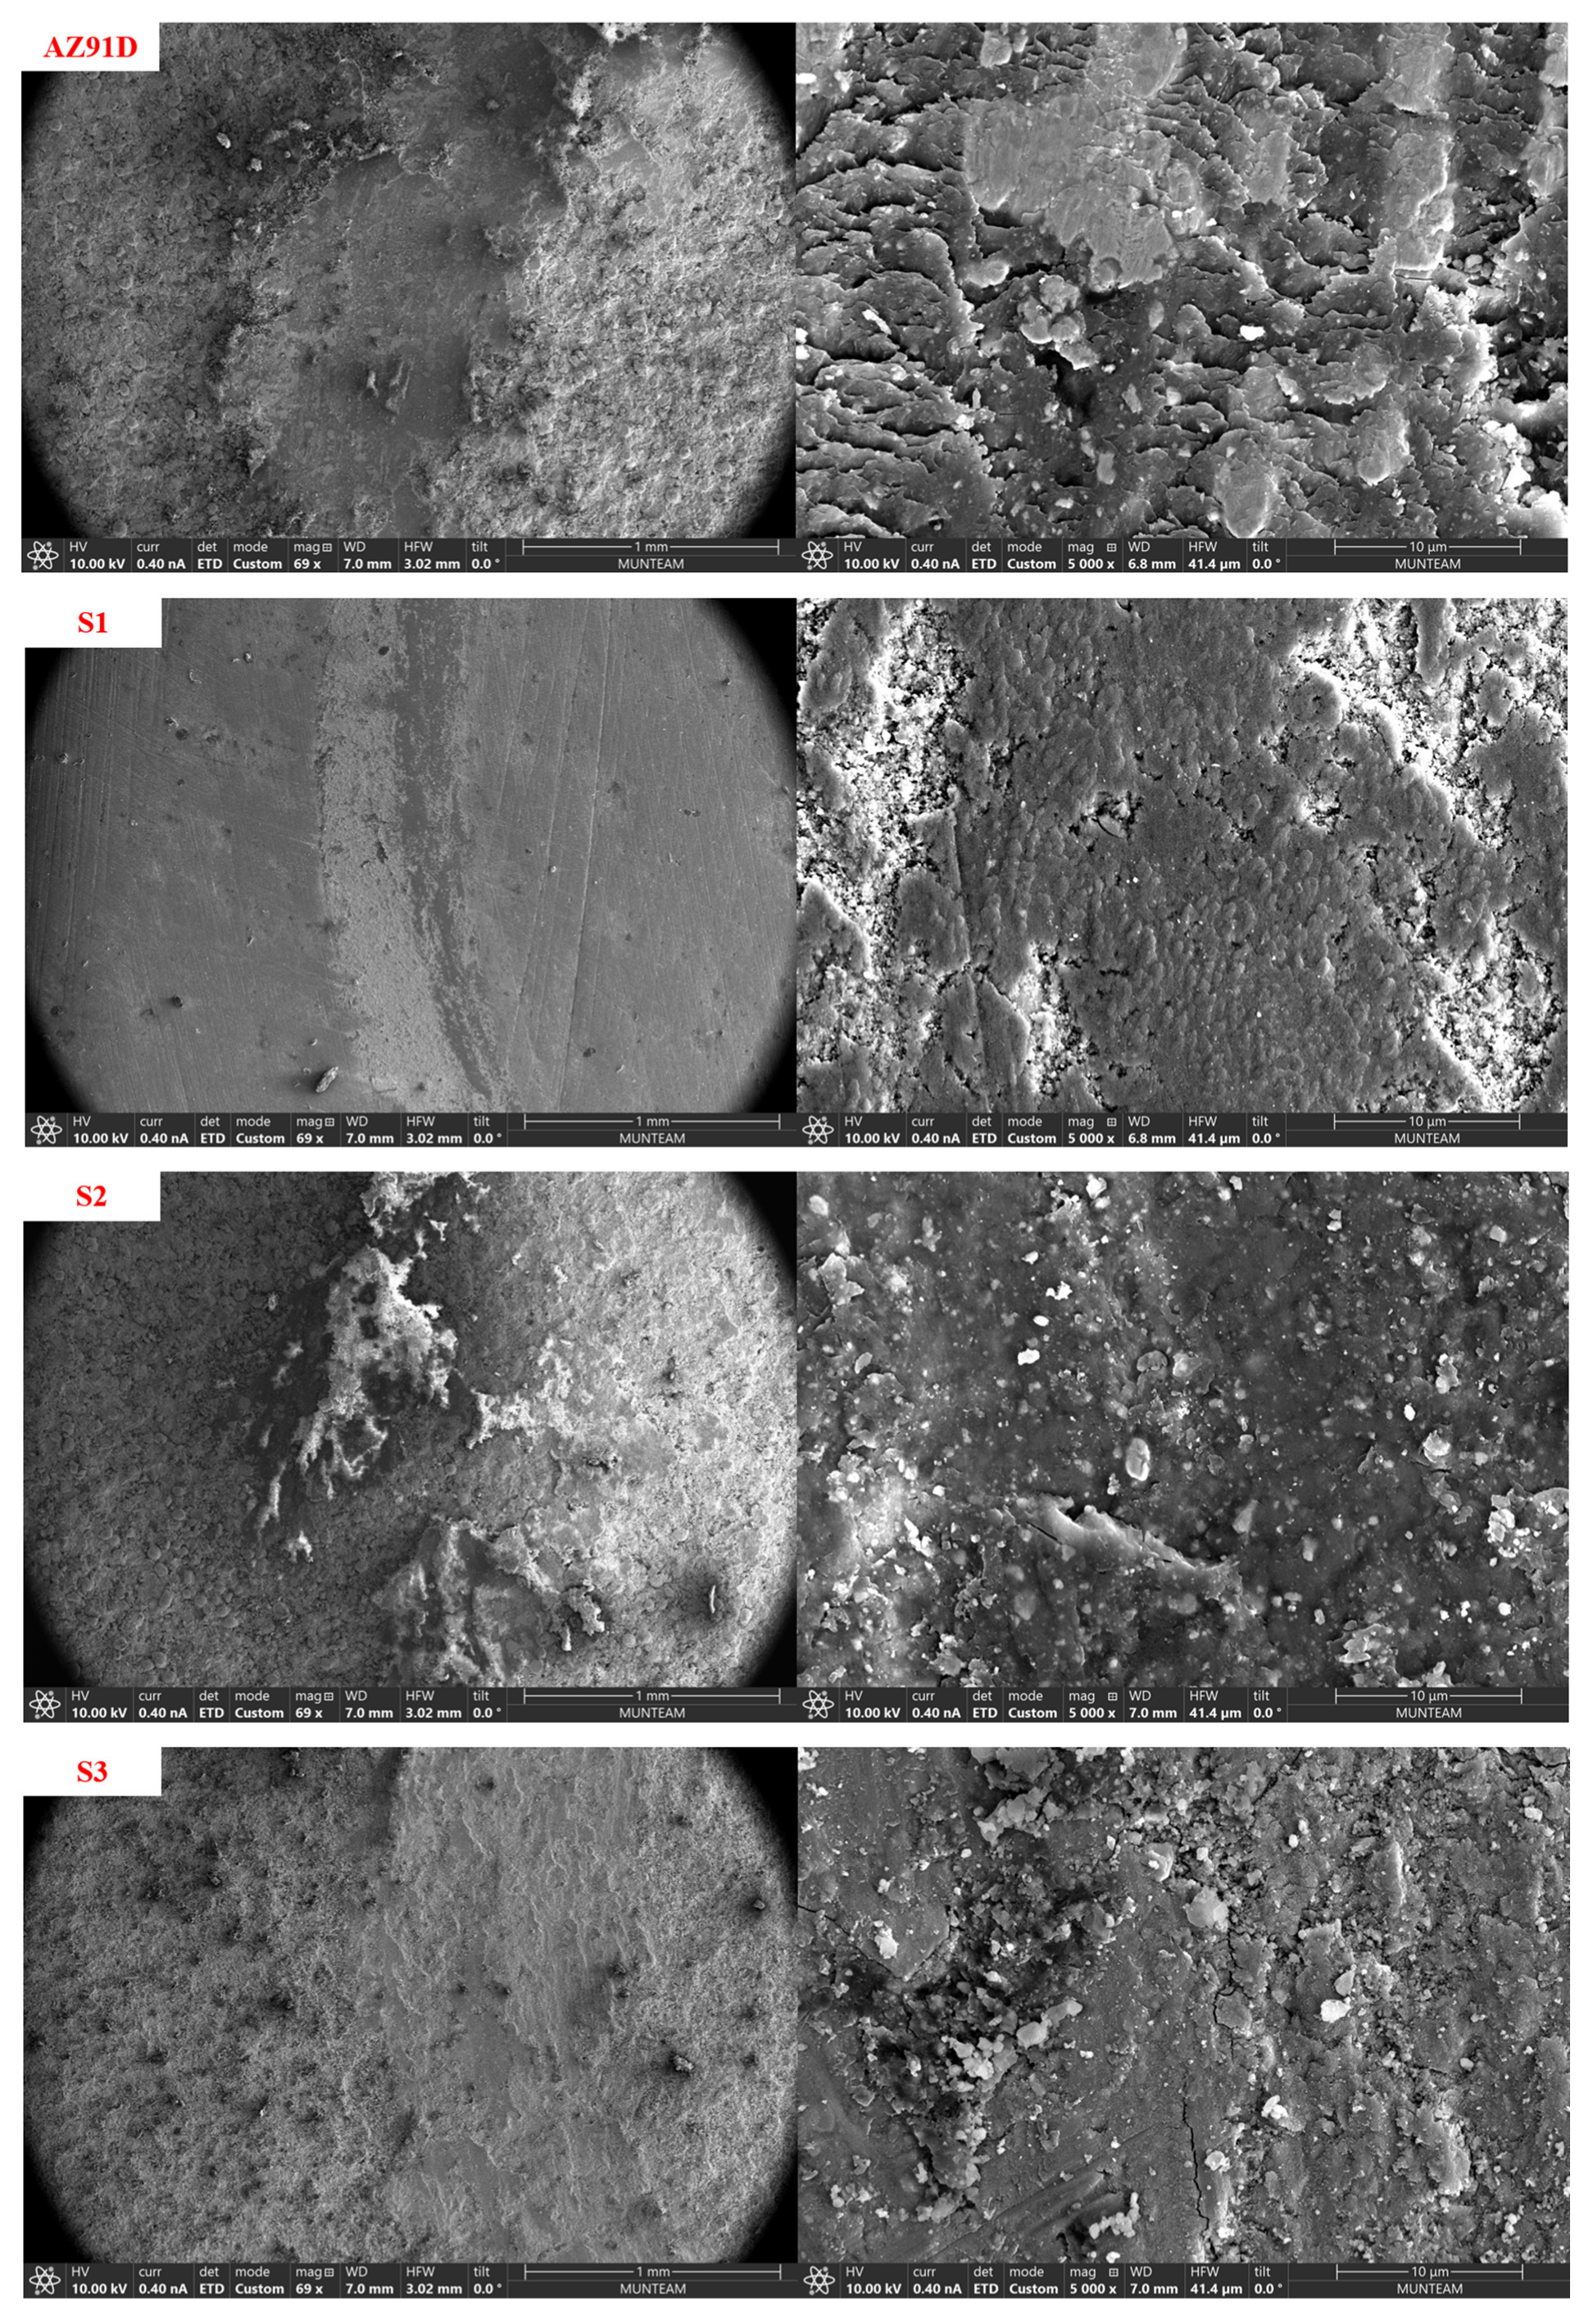
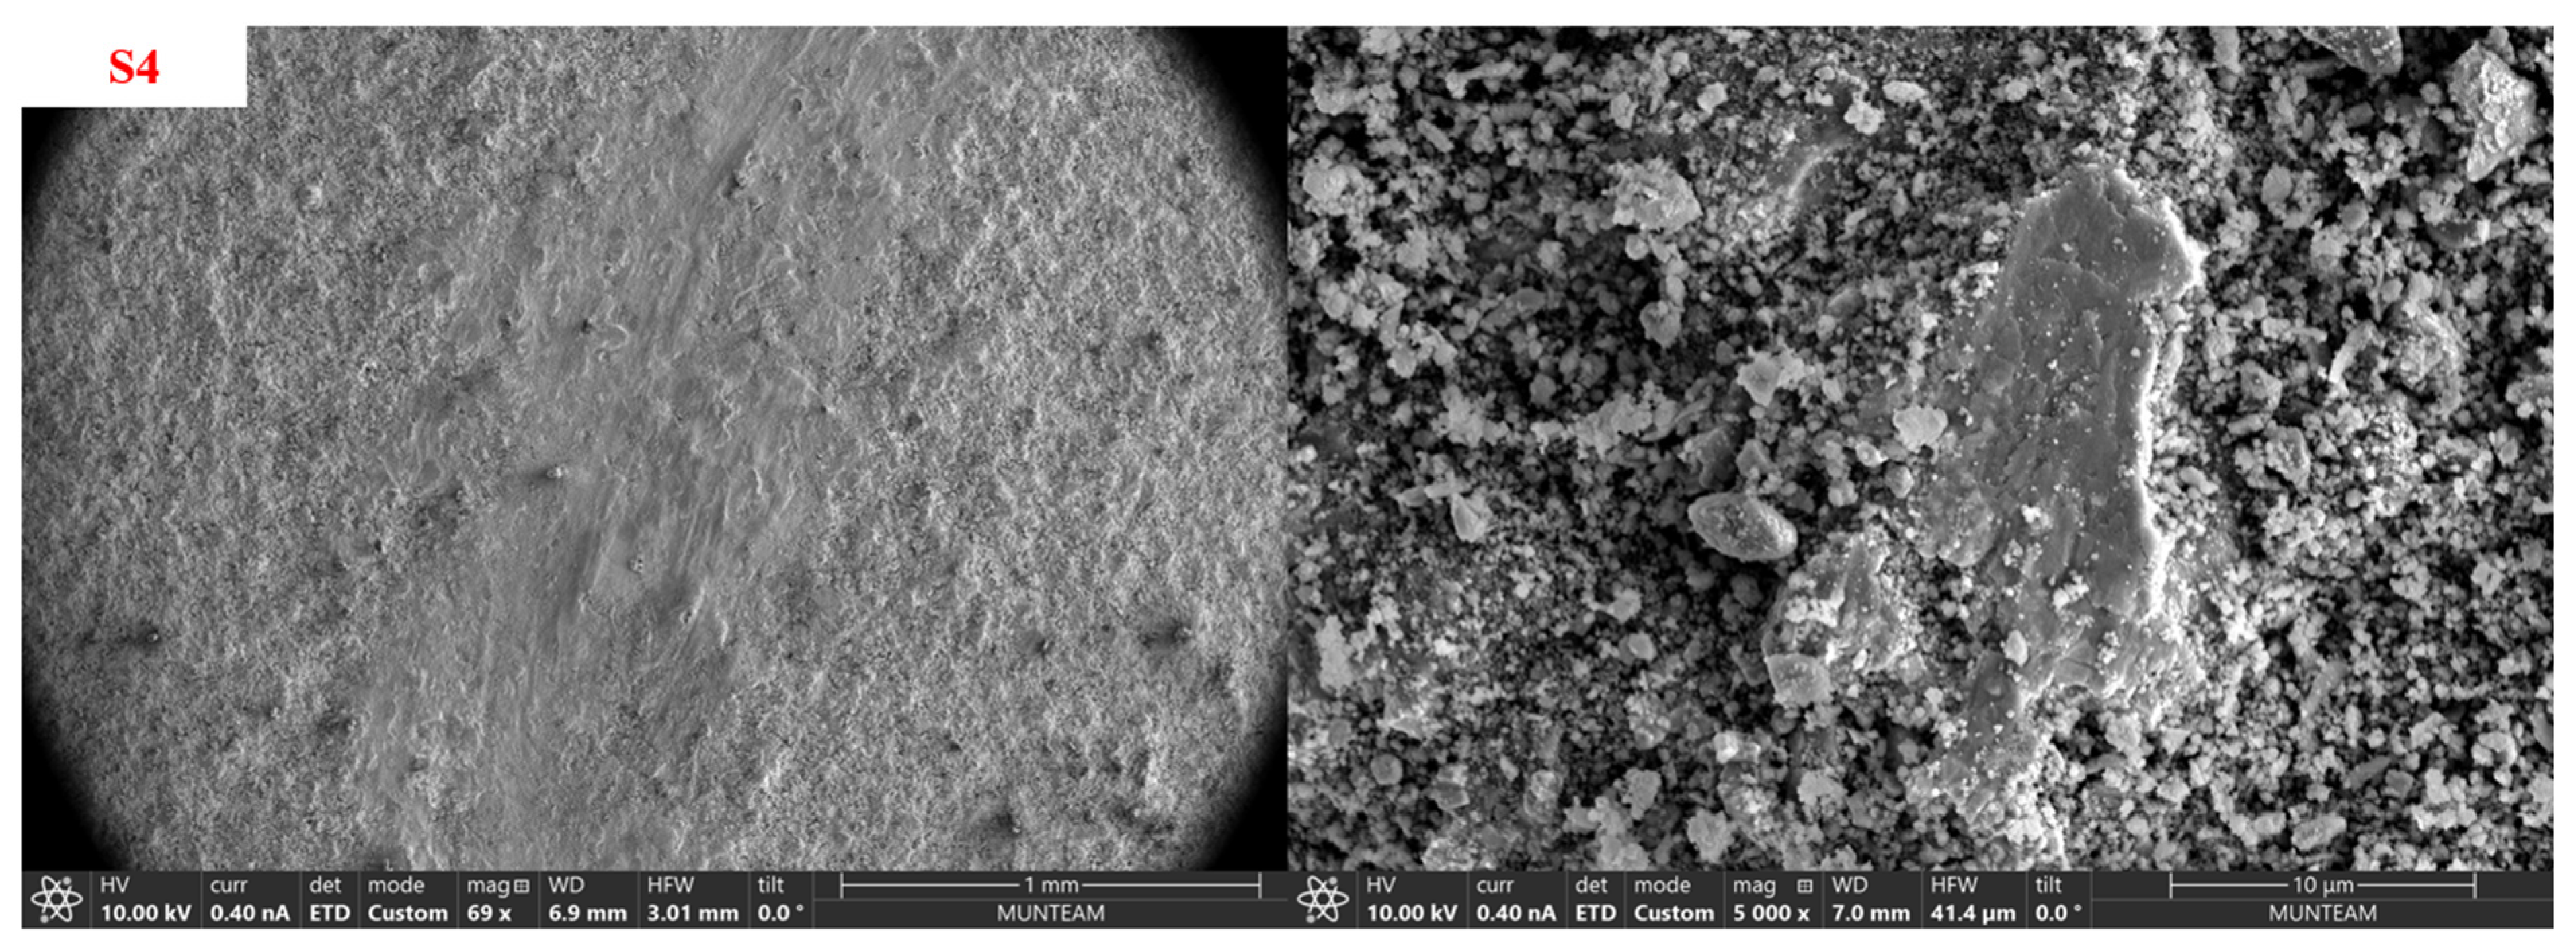
Surface morphologies formed after wear tests were comparatively examined using scanning electron microscopy (Figure 14) to determine the dominant damage mechanisms in uncoated AZ91D magnesium alloy and S1/NiCrBSi, S2/NiCrBSi-10 wt.% WC-Co, S3/NiCrBSi-30 wt.% WC-Co, and S4/NiCrBSi-50 wt.% WC-Co coated systems. Surfaces were imaged using an ETD detector with an acceleration voltage of 10.00 kV, a beam current of approximately 0.40 nA, and the measurement conditions given in the image captions. Low-magnification (69×) records were used to evaluate the continuity of the wear track, the distribution of damage along the surface, material accumulations at the track edges, and the macroscopic arrangement of loose wear residues. Records at 5000× magnification allowed for the differentiation of local features such as plastic coating, micro-grooving, particle detachment, splat boundary damage, microcracks, localized delaminated separation, and compressed third-body layer. Comparative SEM analysis shows that large-scale plastic deformation and irregular material removal on the uncoated AZ91D surface are transformed into a more limited and coating-controlled form of damage with the application of NiCrBSi-based coatings. As the WC-Co ratio increases, the damage on the surface does not disappear completely; however, the nature of the damage shifts from widespread coating and delaminated removal of the low-hardness metallic surface to carbide-assisted load bearing, localized deformation of the binder phase, fine particle formation, and the development of a mechanically intertwined third-body layer. Therefore, particle density seen at high magnification should not be considered as high total wear loss alone, particle size, compression status within the track, and the continuity of the damage along the surface should be considered together [70,71,72]. Uncoated AZ91D alloy. The low-magnification image shows a broad, irregular, and topographically heterogeneous damage area along the wear track. A relatively flattened and plastered contact band is present in the center of the track, while densely fragmented surface areas and accumulated wear debris surround this band. The irregular and non-sharp boundaries of the wear track indicate that the load was not homogeneously transported across the surface and that the low-hardness Mg-based matrix readily underwent plastic flow beneath the mating surface. Irregular accumulations developing towards the track edges suggest that some of the material displaced during contact was not directly removed but rather re-accumulated around the wear path. In the high-magnification AZ91D image, layered or plate-like areas, tear edges, irregular voids, local cracks, and fine-to-coarse wear fragments are observed together. This morphology is consistent with the plastic transport and local detachment of the surface layer as a result of the repeated formation and rupture of adhesive bonds between the mating surface and the Mg alloy. The recirculation of ruptured particles in the contact area increases micro-shearing and micro-scraping effects, leading to third-body abrasive wear accompanying adhesive wear. Furthermore, the friction-induced temperature increase and the high chemical reactivity of the fresh Mg surface may facilitate the intermittent formation and fragmentation of an oxide-rich mechanical mixture layer. However, it should be emphasized that the identification of an oxide or transfer layer is not based solely on secondary electron contrast and must be confirmed by EDS. The widespread deformation and layered detachment observed on the AZ91D surface are consistent with this specimen exhibiting the highest mass loss and the highest average coefficient of friction values at all loads. S1/NiCrBSi coating. In the low-magnification image of the undoped NiCrBSi coating, a more continuous, narrower, and more regular wear band is observed across the surface compared to AZ91D. Linear tracks along the wear path are developed approximately parallel to the shear direction, indicating a gradual flattening of the surface rather than deep and widespread material ruptures. The largely protected coating surface outside the track and limited particle accumulation at the wear boundary indicate that the NiCrBSi layer forms an effective load-carrying barrier separating the AZ91D substrate from direct contact. In the high-magnification image of the S1 surface, relatively compact but locally coated Ni-based matrix regions, fine pits, microvoids, short cracks, and limited amounts of loose residue are observed. Hard secondary phases such as Ni3B, CrB, and Cr7C3, identified in the XRD results, limit the penetration of the mating surface into the coating compared to AZ91D, while the more ductile gamma-Ni-based matrix continued to undergo local plastic deformation under contact load. Therefore, the dominant mechanism in S1 was considered to be moderate adhesive/oxidative wear developing with mild micro-grooving and local damage at the splat boundaries. The absence of widespread coating peeling suggests that the coating maintained its overall integrity throughout tribological contact; however, matrix coating and local particle separation contributed to S1 exhibiting higher mass loss and friction levels than WC-Co reinforced samples. S2/NiCrBSi-10 wt.% WC-Co coating. A low-magnification image of the S2 sample containing 10 wt.% WC-Co exhibits a transitional morphology characterized by pronounced flattening and compression in the central contact band, along with localized residue accumulation at the track boundaries. While the wear track is more controlled compared to AZ91D, load-bearing was not solely provided by a continuous carbide skeleton due to the limited amount of carbide. Therefore, the deformation of the NiCrBSi matrix regions and the contact support of the hard particles were simultaneously effective, resulting in a heterogeneous but less severe damage distribution on the surface compared to AZ91D and S1. At high magnification, fine particles, small pits, and a localized platy separation zone are visible, dispersed within a smoother and more compacted surface layer. This structure is consistent with the repeated crushing of fine wear residues formed during sliding, transforming them into a mechanically mixed tribological layer. Some of the topographically prominent protrusions and particles on the surface may be associated with WC/W2C-rich regions, considering the coating composition. However, the brightness in the secondary electron image alone is not sufficient for phase identification. Hard third-body particles that may be formed as a result of local particle extraction create a short-term micro-cutting effect, while the regions where carbides are retained in the matrix limit counter-surface penetration. Thus, mixed adhesive–abrasive wear continued in S2, but the damage became finer-scale and more localized [56,71] in the S3/NiCrBSi-30 wt.% WC-Co coating. In the low-magnification image of the S3 sample containing 30 wt.% WC-Co, a relatively smooth central band is seen along the wear track, and rougher, particle-rich regions are seen on either side of this band. The flattening in the center indicates that the actual contact area approaches a stable form with the fracture and compression of the contact asperities during sliding. The presence of fine remnants around the track suggests that a portion of the material detached from the surface remains as third-body material within or at the edge of the wear path instead of directly detaching. In the 5000× image, fine and granular wear residues, local cracks, partially flattened splat regions, short grooves parallel to the track direction, and limited layered separation areas are seen together. With the increase in the WC-Co ratio to 30%, the load-carrying contribution of the hard phases becomes more pronounced, and the large-scale coating of the Ni-based matrix is limited. However, the elastic and plastic incompatibility between the hard carbides and the more ductile binder phase can cause local stress concentrations around the carbide or at the splat boundaries, facilitating microcracking and particle separation. Therefore, the dominant damage on the S3 surface is not widespread matrix loss but rather local carbide/matrix interface damage, fine third-body abrasive wear, and local disintegration of the compact tribological layer. The localized nature of the damage is consistent with S3 exhibiting higher microhardness, lower mass loss, and lower coefficient of friction compared to S1 and S2 [70,71,72,73].
S4/NiCrBSi-50 wt.% WC-Co coating. In the low-magnification image of the S4 sample with the highest WC-Co content, the wear path generally maintains its continuity, and there is no significant plastic deposition, deep irregular grooves, or widespread layered surface rupture as seen in AZ91D. The flattened region in the center of the track indicates that the initially high surface roughness was adapted to the counter-surface during the run-in process, the coarser morphology around the track shows that carbide-rich asperities and compressed residues were preserved on the surface. In the high-magnification image of S4, a dense third-body layer composed of numerous fine and granular particles is seen together with a localized, elongated, and flattened platy region. The granular structure can be explained by the micro-scale fracture of high-carbide surface asperities and the crushing of wear residues under contact, causing them to settle into the track. The elongated platy region may be related to the localized coating and partial detachment of the binder phase or the mechanically mixed layer developing on the surface. However, this local feature does not imply widespread coating delamination across the surface. In S4, the formation of a more continuous load-carrying network in hard WC/W2C-rich regions limited the large-scale deformation of the NiCrBSi matrix and the deep penetration of the counter surface. Therefore, wear progressed not through large-volume material removal, but rather through fine particle generation, local binder phase deformation, and periodic renewal of the stable third-body layer. This morphology is consistent with S4 exhibiting the highest hardness (959 ± 5 HV0.1), the lowest total mass loss at all loads, and the lowest average coefficient of friction. The principal morphological features and corresponding wear mechanism interpretations are summarized in Table 8.
When the samples are evaluated together, it is seen that the WC-Co addition transforms the wear mechanism not only into a lower damage severity but also into a different form of material detachment. In AZ91D, plastic yielding, adhesive bonding fracture, and layered separation are dominant because the contact load is directly carried by the low-hardness Mg-based matrix. In the S1 coating, the Ni-based matrix and hard boride/carbide phases limited the deformation, but metallic matrix coating continued. In the S2–S4 range, with the increase in the amount of WC/W2C-based hard phase, a larger portion of the contact load was carried by carbide-rich regions, in contrast, the damage was localized in the form of local deformation of the binder phase, microcracks around the carbide, and the formation of fine third-body particles. The composition-controlled tribological behavior reported by Karaoglanli et al. for HVOF coatings with different compositions and Yao’s findings on the change in contact mode depending on the WC(Co) ratio support this mechanism transformation [56,72]. SEM morphology shows that the effect of surface roughness on wear is not unidirectional. Although the S4 specimen had the highest Sa and Sq values before the experiment, it did not show large-scale plastic yielding or deep continuous grooves after wear. While high initial roughness can increase asperity fracture and fine particle production in the run-in phase, the load-carrying capacity of the hard carbide phases and the mechanical mixture layer formed by the particles trapped in the track were more decisive in the advanced sliding phase. This observation is consistent with studies reporting that the roughness and friction/wear variation do not have to be in the same direction and that the embedded tribological layer can control the contact behavior [69]. The role of particles within the wear track is bidirectional. Large, angular, and sufficiently hard particles detached from the matrix can move between the counter surface and the coating, enhancing the micro-shearing and micro-scraping effects. When the same particles are fractured and compressed to smaller sizes under repeated contact, they can transform into a third-body layer that partially separates the direct counter surface-coating contact, contributes to load sharing, and regulates the shear behavior. Guilemany et al. reported the decisive role of three-body abrasive wear in thermally sprayed WC-Co coatings, while Shipway et al. reported that carbide extraction, binder phase behavior, and third-body dynamics control shear wear [70,71]. In the current images, larger and more irregular fracture products are seen in AZ91D and S1, while the prominence of fine and compressed particle aggregates in S3 and S4 is consistent with this transition. Tribo-oxidation is a mechanism that can contribute to all samples, especially due to the local temperature increase during repeated shearing and the contact of fresh surfaces with the atmosphere. The entrapment of oxide-rich fine residues consisting of coating surfaces containing Ni, Cr, Co, and W can reduce direct metallic contact by forming a tribofilm with low shear strength; however, cracking or detachment of this layer can lead to frictional fluctuations and new particle formation. Vashishtha et al. demonstrated that the friction and wear behavior in HVOF WC-10Co-4Cr coatings is enhanced by the combined effect of tribo-oxidation and contact intensity [68]. Although the precise identification of dark or smooth regions as oxides was not made in the present study, entrapment of fine particle layers and periodic layer separations provide morphologically consistent evidence for tribofilm formation and degradation. When morphological findings are considered together with quantitative results, a consistent structure–property–performance relationship emerges. Microhardness increased from S1 to S4 as 776 ± 4, 865 ± 3, 894 ± 4, and 959 ± 5 HV0.1, respectively. Total wear loss and the average friction coefficient decreased in the same order. While large-scale plastic deformation in AZ91D explained the highest material loss, the preservation of coating integrity in S1, the development of carbide-supported contact in S2 and S3, and the formation of a more continuous hard-phase load-carrying network in S4 gradually limited material detachment. The presence of localized particulate and platy regions in the high-magnification image of S4 does not mean that this specimen is undamaged, it indicates that the damage progressed in the form of localized micro-damage and thin third-body layers rather than large-scale and continuous material loss. This distinction explains that the low mass loss and the observable localized damage characteristics on the surface are not contradictory.
As the normal load increased from 10 N to 30 and 50 N, the contact pressure, true contact area, and subsurface shear stresses increased in all samples. Therefore, under high load conditions, plastic yielding and adhesive fracture are expected to become more pronounced in AZ91D, and in coatings, binder phase deformation, splat boundary cracks, and carbide ejection are expected to become more pronounced. However, the presented SEM records represent selected surface areas for comparison of sample compositions. To quantitatively decompose the effect of load on morphology, separate SEM series with the same magnification, the same track location, and multiple fields of view at each load level are required. Therefore, the interpretations derived from the available images are considered not as a definitive damage map independent of the load, but as comparative morphological evidence explaining weight loss and friction consequences. It should also be noted that the SEM images are local in nature. Different mechanisms may be present simultaneously in the center, edge, and transition zones along the wear track; a single 5000× image does not represent the area fraction or total damage volume of the entire wear path. Therefore, to confirm the wear mechanism, it is recommended that SEM investigations be supported by track profile measurements, three-dimensional profilometry, multi-field of view analysis, and post-wear EDS point/mapping results. In particular, the appearance of Mg and Al signals indicates local coating breach or substrate contact, the preservation of W and Co signals indicates the persistence of carbide-rich coating regions within the wear track, and an increase in the O signal indicates the formation of tribo-oxidative products. Overall, post-wear SEM findings show that NiCrBSi and NiCrBSi/WC-Co coatings significantly limit surface damage to AZ91D magnesium alloy. The severe plastic yielding, adhesive fracture, and layered delamination that predominated in uncoated AZ91D transformed into more moderate matrix coating and local splat damage in S1, mixed wear with carbide support in S2–S3, and a more stable third-body layer developing with fine particle production in S4. This mechanism sequence is entirely consistent with the fact that as the WC-Co content increases, microhardness increases, mass loss decreases, and frictional behavior becomes lower and more stable. Among the coating systems investigated, S4/NiCrBSi-50 wt.% WC-Co provided the highest level of tribological protection, most effectively limiting large-scale plastic deformation and transforming damage into localized micro-scale processes. The EDS point and mapping results presented in Section 3.3.4 provide the corresponding compositional verification for retained coating regions, carbide-rich load-bearing zones, Mg-rich local interaction volumes, and oxygen-bearing tribological layers.

3.3.4. Post-Wear EDS/EDX Elemental Mapping and Microchemical Analysis

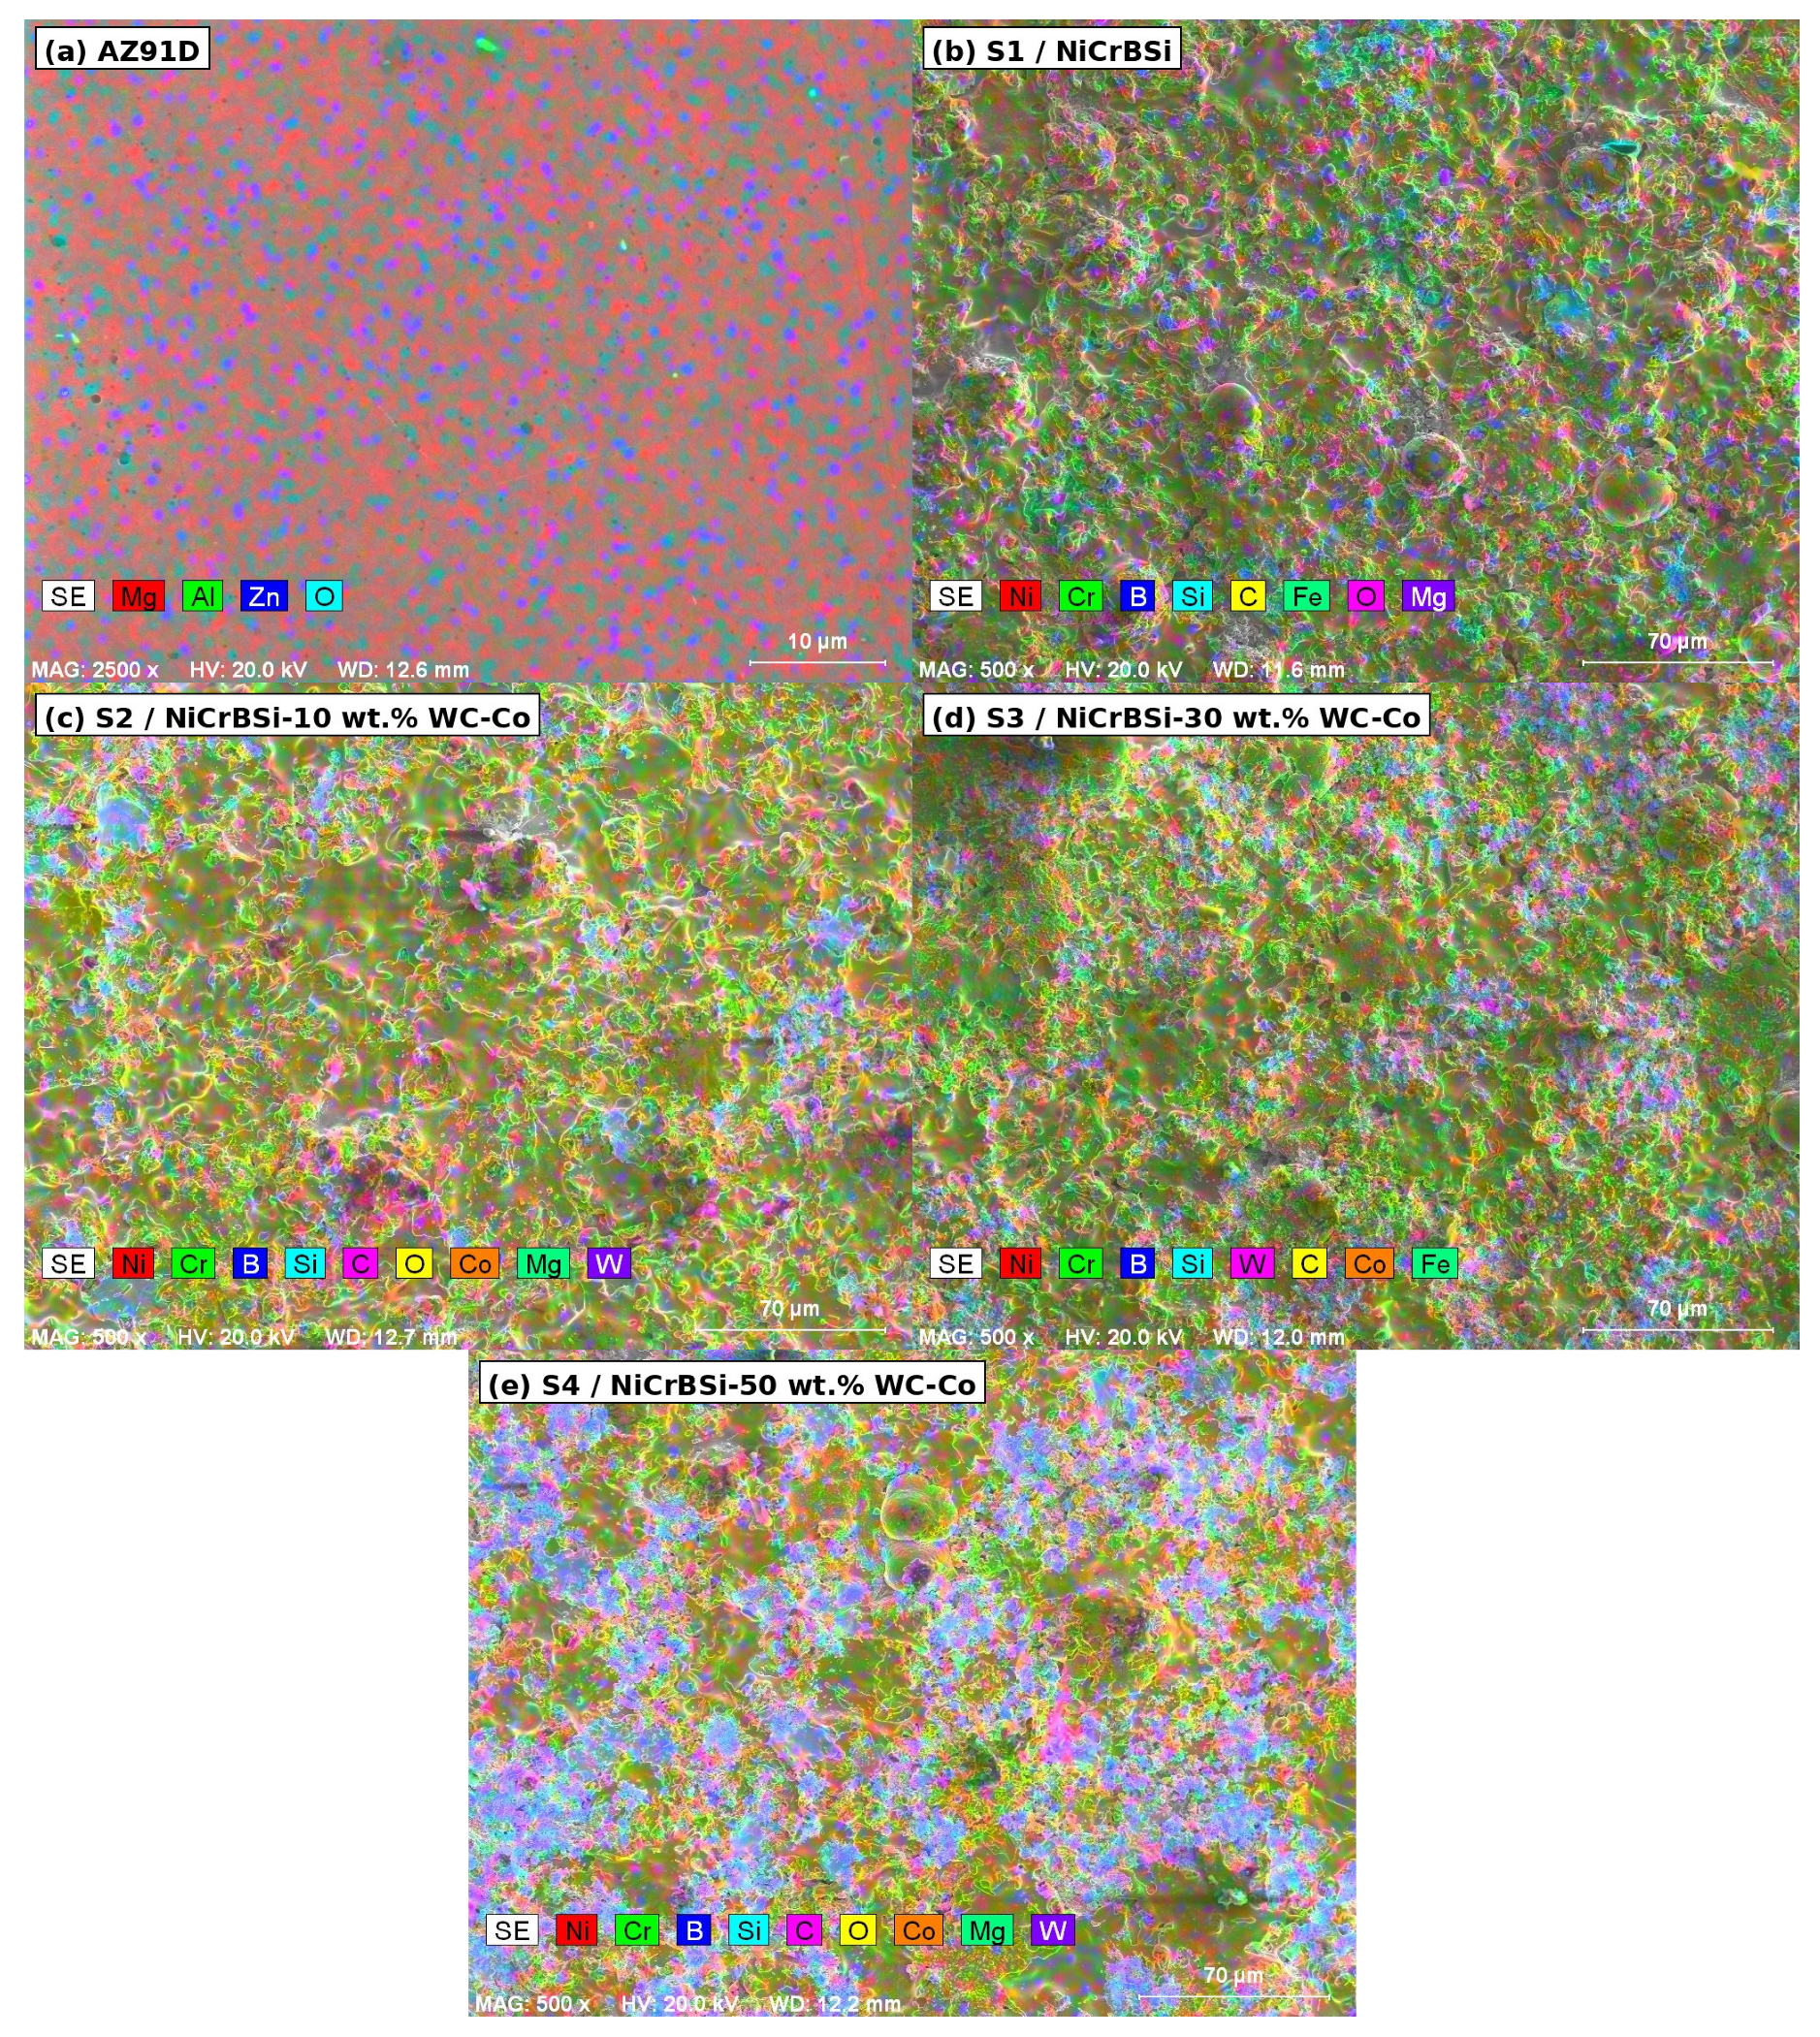
To provide chemical verification of the wear mechanisms inferred from the SEM morphology, the worn surfaces were examined by post-wear energy-dispersive X-ray spectroscopy (EDS/EDX) elemental mapping and selected-area/point microanalysis. Figure 15 compares the spatial distribution of the principal elements, while Table 9 and Table 10 summarize the normalized local compositions. The overlay maps must be interpreted as relative intensity distributions rather than direct phase maps: co-location of W and C is consistent with WC/W2C-rich matter, and co-location of C and O is consistent with a mechanically mixed and/or oxidized tribological layer, but definitive phase identification remains governed by the complementary XRD results. Likewise, a spectrum acquired from a rough wear track may simultaneously sample retained coating, compacted debris, transferred material, and the underlying substrate within the electron interaction volume. The numerical compositions are retained as normalized instrument outputs but should not be interpreted with sub-wt.% accuracy; the mechanistic interpretation is based on robust elemental trends and spatial distributions.
The uncoated AZ91D map in Figure 15a is dominated by a continuous Mg response, with Al and Zn appearing as finely dispersed minor constituents and O occurring in localized patches. The corresponding area composition was Mg 94.79 wt.%, Al 2.34 wt.%, Zn 1.82 wt.%, and O 1.05 wt.%. This chemistry confirms that the observed wear track is controlled by direct deformation and removal of the Mg-rich substrate. The oxygen signal supports the formation of tribo-oxidative products on freshly exposed Mg surfaces, but its relatively low area fraction and discontinuous distribution indicate that the oxygen-bearing layer was not uniformly continuous. The lower local Al level relative to the nominal alloy composition should not be interpreted as bulk depletion, it more plausibly reflects selection of a Mg-rich microscopic field, surface relief, and the finite EDS interaction volume. For S1/NiCrBSi (Figure 15b), Ni, Cr, and Si form the continuous chemical framework of the worn surface, while C, O, Fe, and Mg are concentrated more locally in debris-rich or flattened regions. The four spectra contained 61.53–73.02 wt.% Ni, 14.33–16.34 wt.% Cr, 4.60–5.41 wt.% Si, and 4.23–5.56 wt.% Fe. In the most tribolayer-rich region (Object 3), C, O, and Mg increased to 9.50, 3.56, and 2.26 wt.%, respectively, whereas the cleanest matrix-rich region (Object 4) contained only 0.18 wt.% C and 0.25 wt.% O. Thus, the NiCrBSi coating remained chemically dominant across the wear track, but localized carbonaceous/oxygen-bearing mechanically mixed matter and limited Mg contribution developed during sliding. Fe cannot be assigned to a unique source from EDS alone, its repeated occurrence is consistent with transfer from an Fe-bearing counterface or an Fe-containing third-body component. The B signal was generally zero or near the practical detection limit and therefore does not contradict the boride phases identified by XRD. The S2/NiCrBSi-10 wt.% WC-Co map (Figure 15c) reveals a Ni-Cr-Si-rich matrix containing discrete W-Co-rich particles and localized C-O-rich third-body accumulations. The matrix-dominant objects contained 62.01–73.51 wt.% Ni, 14.34–15.95 wt.% Cr, 4.90–6.13 wt.% Si, 3.58–4.63 wt.% Fe, and 0.53–1.58 wt.% Co. Object 4 was compositionally distinct, containing 64.50 wt.% W, 8.06 wt.% Co, 15.59 wt.% Ni, 4.13 wt.% Cr, 3.33 wt.% C, and 3.06 wt.% O, this spectrum directly identifies a retained carbide-rich agglomerate embedded in the worn surface. Conversely, Object 3 contained 9.48 wt.% C, 2.03 wt.% O, 0.81 wt.% Mg, and 1.65 wt.% Na together with the NiCrBSi matrix, consistent with a compacted mechanically mixed layer or contamination-bearing third-body deposit. Additional Mg-dominant fields contained 94.18–94.60 wt.% Mg, accompanied either by Al-Zn-O or by small residual W-Cr-Co-Ni signals. These local results are compatible with local coating penetration/substrate exposure and/or Mg-rich entrained debris; top-view EDS cannot distinguish these alternatives or establish uniform coating removal. For S3/NiCrBSi-30 wt.% WC-Co (Figure 15d), W is distributed over a substantially larger fraction of the mapped field than in S2, while the Ni-Cr-Si matrix remains continuous. In the Fe-inclusive final quantification, W ranged from 21.04 to 34.46 wt.%, Ni from 43.59 to 56.28 wt.%, Cr from 11.82 to 15.11 wt.%, Co from 0.50 to 3.88 wt.%, Fe from 3.24 to 3.66 wt.%, and C from 0.45 to 2.27 wt.%. The broad mapped-area spectrum (Object 1) contained 34.46 wt.% W and 3.88 wt.% Co together with 43.59 wt.% Ni, demonstrating that carbide-rich material was not confined to a single isolated particle but contributed significantly to the analyzed surface area. The additional Mg-rich acquisitions contained either Mg 94.22 wt.% with 4.61 wt.% W and minor Cr-Co-Ni-Si, or Mg 95.30 wt.% with Al-Zn-O. These isolated spectra likewise demonstrate local substrate participation and are compatible with local coating penetration/substrate exposure and/or Mg-rich wear matter. Oxygen was not included in the principal S3 quantification set; therefore, its absence from those numerical rows must not be interpreted as proof that tribo-oxidation did not occur. The S4/NiCrBSi-50 wt.% WC-Co surface (Figure 15e) exhibits the most extensive W-Co-rich distribution within the Ni-Cr matrix. The broad-area Object 1 spectrum contained 41.15 wt.% W, 35.22 wt.% Ni, 8.91 wt.% Cr, 5.27 wt.% Co, 3.45 wt.% Fe, 3.11 wt.% C, 1.48 wt.% Si, and 1.38 wt.% O. Matrix-dominant Objects 2 and 3 retained 59.38–62.29 wt.% Ni together with 13.52–13.94 wt.% W, whereas the carbide-rich Object 4 contained 62.96 wt.% W, 19.36 wt.% Ni, and 6.72 wt.% Co. A repeat acquisition of Object 1 reproduced the same composition within rounding and added only 0.08 wt.% Mg, supporting the repeatability of the local analysis. The coexistence of matrix-rich and carbide-rich spectra shows that hard WC/W2C-bearing regions remained mechanically anchored within a metallic binder framework after wear. A separate Mg-dominant field contained 97.06 wt.% Mg, 2.21 wt.% Al, 0.61 wt.% O, and 0.12 wt.% Na. In view of the low mass loss, preserved SEM track continuity, and carbide-rich principal map, this isolated Mg-rich signal is compatible with local coating penetration/substrate exposure and/or Mg-rich debris. It does not establish generalized S4 failure, but complete local penetration cannot be excluded. A critical comparative result is that the maximum W concentration at a single point did not increase monotonically with nominal WC-Co content: the isolated S2 carbide-rich point reached 64.50 wt.% W, slightly above the 62.96 wt.% W measured in the isolated S4 carbide-rich point. The decisive difference is instead spatial continuity and field-averaged retention. The broad-area W fraction increased from 34.46 wt.% in S3 to 41.15 wt.% in S4, and the S4 map shows a larger, more connected W-Co-rich fraction within the wear track. Consequently, the superior friction and wear behavior of S4 is associated not with the single highest local W value, but with the areal persistence of carbide-rich load-bearing regions, their retention by the Ni-Cr binder, and the stabilization of fine third-body material.
The Mg-rich spectra above 94 wt.% provide direct evidence of local substrate participation and are compatible with local coating penetration/substrate exposure and/or Mg-rich debris within the interaction volume; the available top-view data cannot distinguish these alternatives uniquely. They do not, by themselves, establish generalized through-thickness failure. In parallel, the principal maps show progressively greater field-scale retention of W-Co-rich material from S2 to S4, while localized C-O enrichment and persistent Fe signals are consistent with mechanically mixed matter, transfer, third-body circulation, and tribo-oxidative participation [56,68,69,70,71,72,73]. The superior S4 response is therefore linked to the areal persistence of carbide-bearing load-supporting regions within the Ni-Cr-rich matrix and to a comparatively stable mechanically mixed layer, while isolated local substrate participation remains evident.

4. Conclusions

This study established a coherent relationship among coating composition, phase constitution, surface morphology, mechanical response, and dry-sliding tribological performance in HVOF-sprayed NiCrBSi/WC–Co coatings deposited on AZ91D magnesium alloy. The spraying process produced continuous lamellar coating architectures without macroscopically detectable interfacial separation in the representative cross-sectional regions. The scale-calibrated local coating thicknesses were 106 ± 15, 99 ± 11, 76 ± 12, and 100 ± 15 µm for S1, S2, S3, and S4, respectively. XRD analysis indicated that the coating structure was governed by a γ-Ni-based matrix containing carbide- and boride-related constituents, while the diffraction contributions associated with WC, W2C, and Co became progressively more prominent with increasing WC–Co content. Because of the limited reliability of conventional EDS for light-element quantification, the identification of boride-related constituents was based principally on the diffraction response rather than on direct boron quantification.
The incorporation of WC–Co substantially modified both the topographical and mechanical characteristics of the coatings. The Sa and Sq values increased from 8.8 ± 0.3 and 12.3 ± 0.4 µm in S1 to 13.0 ± 0.5 and 16.9 ± 0.6 µm in S4, respectively, indicating a progressively rougher as-sprayed surface with increasing reinforcement content. In parallel, Vickers microhardness increased from 776 ± 4 HV0.1 in S1 to 959 ± 5 HV0.1 in S4. The simultaneous increase in roughness and wear resistance demonstrates that the tribological response was not governed solely by the initial surface asperity state. Instead, the improved continuity of carbide-rich load-bearing regions, enhanced resistance to local plastic deformation, and more effective mechanical support provided by the NiCrBSi matrix exerted a dominant influence over the adverse effect of the higher initial roughness.
A consistent composition-dependent improvement was observed in the wear response. At every applied load and sliding distance, mass loss followed the order AZ91D > S1 > S2 > S3 > S4. After 1000 m of sliding, S4 exhibited gravimetric specific wear rates of 9.0 × 10⁻⁴, 4.0 × 10⁻⁴, and 5.3 × 10⁻⁴ mg N−1 m−1 at 10, 30, and 50 N, respectively. These values corresponded to reductions of approximately 38%, 32%, and 26% relative to the uncoated AZ91D substrate. The decrease in the relative wear benefit at higher load indicates that the protective contribution of the coating remained substantial but became progressively challenged by increased contact stress, subsurface deformation, and intensified third-body activity. Nevertheless, S4 maintained the lowest material removal response throughout the investigated loading range.
The frictional behavior followed the same compositional tendency. Although the mean coefficient of friction increased with normal load for all materials, it decreased systematically with increasing WC–Co content. S4 yielded mean coefficients of friction of 0.31, 0.35, and 0.41 at 10, 30, and 50 N, corresponding to reductions of 40.1%, 38.9%, and 36.2%, respectively, relative to AZ91D. The lower late-stage fluctuation observed for S4 further indicates the development of a more stable sliding interface. This stabilization is attributed to reduced direct participation of the comparatively soft substrate, improved load transfer through carbide-containing regions, suppression of extensive adhesive junction formation, and more persistent formation and renewal of a mechanically mixed surface layer.
Post-wear SEM/EDS observations confirmed that the improvement in the quantitative wear and friction responses was accompanied by a distinct change in the dominant wear mechanism. Uncoated AZ91D exhibited extensive plastic flow, adhesive damage, severe grooving, and third-body abrasion. In contrast, the WC–Co-containing coatings, particularly S2–S4, showed a transition toward carbide-supported fine-particle abrasion and repeated mechanically mixed-layer development. S4 retained the largest broad-field W–Co-rich fraction within the worn region, demonstrating the greatest preservation of the reinforced coating architecture under sliding. However, localized EDS spectra containing more than 94 wt.% Mg indicated isolated substrate participation, showing that complete local penetration of the coating could not be entirely excluded under the applied contact conditions.
Taken together, the results demonstrate that increasing WC–Co content strengthened the load-bearing framework of the NiCrBSi coating, increased microhardness, reduced material loss, lowered friction, and stabilized the wear interface. Among the four discrete formulations investigated, the coating containing 50 wt.% WC–Co exhibited the most favorable overall combination of hardness, wear resistance, friction reduction, and reinforcement retention. This composition should therefore be regarded as the best-performing formulation within the experimentally examined range, rather than as a universally optimized composition. Further optimization should focus on intermediate reinforcement levels, coating thickness uniformity, carbide distribution, interfacial integrity, and validation under cyclic, corrosive, lubricated, and thermally elevated service conditions.

Author Contributions

T.G.: Conceptualization, methodology, supervision, interpretation of tribological results, and writing—review and editing. C.K.M.: Conceptualization, coating production coordination, wear experiments, coefficient-of-friction evaluation, data analysis, visualization, and writing—original draft. M.S.: Experimental support, coating process evaluation, microstructural interpretation, and writing—review and editing. B.A.: Supervision, project administration, funding acquisition, mechanical characterization evaluation, and critical editing of the manuscript. M.A.: Sample preparation, metallographic preparation, SEM/EDS characterization, post-wear surface analysis, and data evaluation. Y.S.: Materials characterization, XRD/SEM analysis support, interpretation of phase and microstructural results, and manuscript editing. All authors have read and agreed to the published version of the manuscript.

Funding

This study was supported by the Fırat University Scientific Research Projects Coordination Unit (FÜBAP), project number SHY.26.08.

Institutional Review Board Statement

Not applicable.

Informed Consent Statement

Not applicable.

Data Availability Statement

The data that support the findings of this study are available from the corresponding author upon reasonable request.

Acknowledgments

The authors would like to thank Aisin Automotive Parts Industry and Trade Inc., located in Tuzla, Istanbul, Türkiye, for providing access to routine quality-control data, operational records, technical documentation, and plant-scale information used in this study. The authors also gratefully acknowledge the support of the plant management, quality-control personnel, production engineers, and technical staff during the interpretation of manufacturing-related data and the evaluation of automotive production and quality-control processes.

Conflicts of Interest

Author Merve Ayık was employed by the company Aisin Automotive Parts Industry and Trade Inc. The remaining authors declare that the research was conducted in the absence of any commercial or financial relationships that could be construed as potential conflicts of interest.

References

  1. Grimm, M.; Lohmüller, A.; Singer, R.F.; Virtanen, S. Influence of the Microstructure on the Corrosion Behaviour of Cast Mg-Al Alloys. Corros. Sci. 2019, 155, 195–208. [Google Scholar] [CrossRef]
  2. Nakata, T.; Xu, C.; Ajima, R.; Shimizu, K.; Hanaki, S.; Sasaki, T.T.; Ma, L.; Hono, K.; Kamado, S. Strong and Ductile Age-Hardening Mg-Al-Ca-Mn Alloy That Can Be Extruded as Fast as Aluminum Alloys. Acta Mater. 2017, 130, 261–270. [Google Scholar] [CrossRef]
  3. Esmaily, M.; Svensson, J.E.; Fajardo, S.; Birbilis, N.; Frankel, G.S.; Virtanen, S.; Arrabal, R.; Thomas, S.; Johansson, L.G. Fundamentals and Advances in Magnesium Alloy Corrosion. Prog. Mater. Sci. 2017, 89, 92–193. [Google Scholar] [CrossRef]
  4. Zhang, Y.; Yan, C.; Wang, F.; Li, W. Electrochemical Behavior of Anodized Mg Alloy AZ91D in Chloride Containing Aqueous Solution. Corros. Sci. 2005, 47, 2816–2831. [Google Scholar] [CrossRef]
  5. Fernández-Hernán, J.P.; López, A.J.; Torres, B.; Rams, J. Influence of Roughness and Grinding Direction on the Thickness and Adhesion of Sol-Gel Coatings Deposited by Dip-Coating on AZ31 Magnesium Substrates. A Landau–Levich Equation Revision. Surf. Coat. Technol. 2021, 408, 126798. [Google Scholar] [CrossRef]
  6. Kelen, F. Fabrication, Microstructure and Mechanical Properties of Novel Titanium and Nickel Micro-Particulates Reinforced AZ91D Magnesium Alloy Metal Matrix Hybrid Composites. J. Alloys Compd. 2023, 968, 171999. [Google Scholar] [CrossRef]
  7. Feng, H.; Liu, S.; Du, Y.; Lei, T.; Zeng, R.; Yuan, T. Effect of the Second Phases on Corrosion Behavior of the Mg-Al-Zn Alloys. J. Alloys Compd. 2017, 695, 2330–2338. [Google Scholar] [CrossRef]
  8. Peng, F.; Zhang, D.; Liu, X.; Zhang, Y. Recent Progress in Superhydrophobic Coating on Mg Alloys: A General Review. J. Magnes. Alloys 2021, 9, 1471–1486. [Google Scholar] [CrossRef]
  9. Liu, C.; Liu, C.; Chen, H.; Nie, J.-F. Heat-Treatable Mg-9Al-6Sn-3Zn Extrusion Alloy. J. Mater. Sci. Technol. 2018, 34, 284–290. [Google Scholar] [CrossRef]
  10. Kelen, F. Novel Magnesium Matrix Hybrid Composites Manufactured through Powder Metallurgy Technique. Mater. Today Commun. 2023, 35, 106348. [Google Scholar] [CrossRef]
  11. Correa, E.; Zuleta, A.A.; Guerra, L.; Gómez, M.A.; Castaño, J.G.; Echeverría, F.; Liu, H.; Skeldon, P.; Thompson, G.E. Tribological Behavior of Electroless Ni–B Coatings on Magnesium and AZ91D Alloy. Wear 2013, 305, 115–123. [Google Scholar] [CrossRef]
  12. Chen, Y.; Wu, L.; Yao, W.; Chen, Y.; Zhong, Z.; Ci, W.; Wu, J.; Xie, Z.; Yuan, Y.; Pan, F. A Self-Healing Corrosion Protection Coating with Graphene Oxide Carrying 8-Hydroxyquinoline Doped in Layered Double Hydroxide on a Micro-Arc Oxidation Coating. Corros. Sci. 2022, 194, 109941. [Google Scholar] [CrossRef]
  13. Somer, M.; Gurgenc, T.; Ilkilic, C.; Macit, C.K. Investigation of Microstructure and Mechanical Properties of Magnesium Alloy Coated with Inconel 625/WC Composites by HVOF Method. Surf. Rev. Lett. 2023, 30, 2350077. [Google Scholar] [CrossRef]
  14. Kelen, F.; Gavgali, M.; Aydogmus, T. Microstructure and Mechanical Properties of a Novel TiNi Particulate Reinforced AZ91 Metal Matrix Composite. Mater. Lett. 2018, 233, 12–15. [Google Scholar] [CrossRef]
  15. Zhang, T.; Meng, G.; Shao, Y.; Cui, Z.; Wang, F. Corrosion of Hot Extrusion AZ91 Magnesium Alloy. Part II: Effect of Rare Earth Element Neodymium (Nd) on the Corrosion Behavior of Extruded Alloy. Corros. Sci. 2011, 53, 2934–2942. [Google Scholar] [CrossRef]
  16. Feng, C.; Li, M.; Hou, Y.; Wang, H.; Li, X.; Fan, L. Effect of Ca on Corrosion Resistance Behavior of As-Cast AZ91 Magnesium Alloys. Rare Met. Mater. Eng. 2015, 44, 41–47. [Google Scholar] [CrossRef]
  17. Hu, Z.; Liu, R.L.; Kairy, S.K.; Li, X.; Yan, H.; Birbilis, N. Effect of Sm Additions on the Microstructure and Corrosion Behavior of Magnesium Alloy AZ91. Corros. Sci. 2019, 149, 144–152. [Google Scholar] [CrossRef]
  18. Boby, A.; Srinivasan, A.; Pillai, U.T.S.; Pai, B.C. Mechanical Characterization and Corrosion Behavior of Newly Designed Sn and Y Added AZ91 Alloy. Mater. Des. 2015, 88, 871–879. [Google Scholar] [CrossRef]
  19. Liu, X.; Xue, J.; Zhang, P.; Wang, Z. Effects of the Combinative Ca, Sm and La Additions on the Electrochemical Behaviors and Discharge Performance of the as-Extruded AZ91 Anodes for Mg-Air Batteries. J. Power Sources 2019, 414, 174–182. [Google Scholar] [CrossRef]
  20. Chen, D.; Wang, R.; Huang, Z.; Wu, Y.; Zhang, Y.; Wu, G.; Li, D.; Guo, C.; Jiang, G.; Yu, S. Evolution Processes of the Corrosion Behavior and Structural Characteristics of Plasma Electrolytic Oxidation Coatings on AZ31 Magnesium Alloy. Appl. Surf. Sci. 2018, 434, 326–335. [Google Scholar] [CrossRef]
  21. Miyake, M.; Fujii, H.; Hirato, T. Electroplating of Al on Mg Alloy in a Dimethyl Sulfone–Aluminum Chloride Bath. Surf. Coat. Technol. 2015, 277, 160–164. [Google Scholar] [CrossRef]
  22. Maurya, R.; Siddiqui, A.R.; Balani, K. An Environment-Friendly Phosphate Chemical Conversion Coating on Novel Mg-9Li-7Al-1Sn and Mg-9Li-5Al-3Sn-1Zn Alloys with Remarkable Corrosion Protection. Appl. Surf. Sci. 2018, 443, 429–440. [Google Scholar] [CrossRef]
  23. Rajabalizadeh, Z.; Seifzadeh, D. Application of Electroless Ni-P Coating on Magnesium Alloy via CrO3/HF Free Titanate Pretreatment. Appl. Surf. Sci. 2017, 422, 696–709. [Google Scholar] [CrossRef]
  24. Ashassi-Sorkhabi, H.; Moradi-Alavian, S.; Jafari, R.; Kazempour, A.; Asghari, E. Effect of Amino Acids and Montmorillonite Nanoparticles on Improving the Corrosion Protection Characteristics of Hybrid Sol-Gel Coating Applied on AZ91 Mg Alloy. Mater. Chem. Phys. 2019, 225, 298–308. [Google Scholar] [CrossRef]
  25. Wei, Y.-K.; Li, Y.-J.; Zhang, Y.; Luo, X.-T.; Li, C.-J. Corrosion Resistant Nickel Coating with Strong Adhesion on AZ31B Magnesium Alloy Prepared by an In-Situ Shot-Peening-Assisted Cold Spray. Corros. Sci. 2018, 138, 105–115. [Google Scholar] [CrossRef]
  26. Bakhsheshi-Rad, H.R.; Hamzah, E.; Dias, G.J.; Saud, S.N.; Yaghoubidoust, F.; Hadisi, Z. Fabrication and Characterisation of Novel ZnO/MWCNT Duplex Coating Deposited on Mg Alloy by PVD Coupled with Dip-Coating Techniques. J. Alloys Compd. 2017, 728, 159–168. [Google Scholar] [CrossRef]
  27. Xie, J.; Hu, J.; Lin, X.; Fang, L.; Wu, F.; Liao, X.; Luo, H.; Shi, L. Robust and Anti-Corrosive PDMS/SiO2 Superhydrophobic Coatings Fabricated on Magnesium Alloys with Different-Sized SiO2 Nanoparticles. Appl. Surf. Sci. 2018, 457, 870–880. [Google Scholar] [CrossRef]
  28. Joshiand, S.V.; Srivastava, M.P. Plasma Spraying of WC-Co Part II: Experimental Study of Particle Deposition and Coating Microstructure. J. Therm. Spray Technol. 1993, 2, 133–136. [Google Scholar] [CrossRef]
  29. Lekatou, A.; Sioulas, D.; Karantzalis, A.E.; Grimanelis, D. A Comparative Study on the Microstructure and Surface Property Evaluation of Coatings Produced from Nanostructured and Conventional WC–Co Powders HVOF-Sprayed on Al7075. Surf. Coat. Technol. 2015, 276, 539–556. [Google Scholar] [CrossRef]
  30. Bolelli, G.; Lusvarghi, L.; Giovanardi, R. A Comparison between the Corrosion Resistances of Some HVOF-Sprayed Metal Alloy Coatings. Surf. Coat. Technol. 2008, 202, 4793–4809. [Google Scholar] [CrossRef]
  31. Ružbarský, J.; Panda, A. Plasma and Thermal Spraying; Springer: Berlin/Heidelberg, Germany, 2017; Volume 108. [Google Scholar]
  32. Berger, L.-M. Application of Hardmetals as Thermal Spray Coatings. Int. J. Refract. Met. Hard Mater. 2015, 49, 350–364. [Google Scholar] [CrossRef]
  33. Vaßen, R.; Kaßner, H.; Stuke, A.; Hauler, F.; Hathiramani, D.; Stöver, D. Advanced Thermal Spray Technologies for Applications in Energy Systems. Surf. Coat. Technol. 2008, 202, 4432–4437. [Google Scholar] [CrossRef]
  34. Espallargas, N. Introduction to Thermal Spray Coatings. In Future Development of Thermal Spray Coatings; Elsevier: Amsterdam, The Netherlands, 2015; pp. 1–13. [Google Scholar]
  35. Zhao, L.; Maurer, M.; Lugscheider, E. Thermal Spraying of a Nitrogen Alloyed Austenitic Steel. Thin Solid Films 2003, 424, 213–218. [Google Scholar] [CrossRef]
  36. Tejero-Martin, D.; Pala, Z.; Rushworth, S.; Hussain, T. Splat Formation and Microstructure of Solution Precursor Thermal Sprayed Nb-Doped Titanium Oxide Coatings. Ceram. Int. 2020, 46, 5098–5108. [Google Scholar] [CrossRef]
  37. Matthews, S.; James, B. Review of Thermal Spray Coating Applications in the Steel Industry: Part 1—Hardware in Steel Making to the Continuous Annealing Process. J. Therm. Spray Technol. 2010, 19, 1267–1276. [Google Scholar] [CrossRef]
  38. Schmucker, E.; Petitjean, C.; Martinelli, L.; Panteix, P.-J.; Lagha, S.B.; Vilasi, M. Oxidation of Ni-Cr Alloy at Intermediate Oxygen Pressures. I. Diffusion Mechanisms through the Oxide Layer. Corros. Sci. 2016, 111, 474–485. [Google Scholar] [CrossRef]
  39. Li, C.J. Thermal Spraying of Light Alloys. In Surface Engineering of Light Alloys; Elsevier: Amsterdam, The Netherlands, 2010; pp. 184–241. [Google Scholar]
  40. Vuoristo, P. Thermal Spray Coating Processes. In Comprehensive Materials Processing, 1st Edition Volume 4: Coatings and Films; Elsevier: Amsterdam, The Netherlands, 2014; pp. 229–276. [Google Scholar]
  41. Moonngam, S.; Tunjina, P.; Deesom, D.; Banjongprasert, C. Fe-Cr/CNTs Nanocomposite Feedstock Powders Produced by Chemical Vapor Deposition for Thermal Spray Coatings. Surf. Coat. Technol. 2016, 306, 323–327. [Google Scholar] [CrossRef]
  42. Tikkanen, J.; Gross, K.A.; Berndt, C.C.; Pitkänen, V.; Keskinen, J.; Raghu, S.; Rajala, M.; Karthikeyan, J. Characteristics of the Liquid Flame Spray Process. Surf. Coat. Technol. 1997, 90, 210–216. [Google Scholar] [CrossRef]
  43. Chun, E.-J.; Park, C.; Nishikawa, H.; Kim, M.-S. Microstructural Characterization of Ni-Based Self-Fluxing Alloy after Selective Surface-Engineering Using Diode Laser. Appl. Surf. Sci. 2018, 442, 726–735. [Google Scholar] [CrossRef]
  44. Yan, X.; Gao, S.; Chang, C.; Huang, J.; Khanlari, K.; Dong, D.; Ma, W.; Fenineche, N.; Liao, H.; Liu, M. Effect of Building Directions on the Surface Roughness, Microstructure, and Tribological Properties of Selective Laser Melted Inconel 625. J. Mater. Process. Technol. 2021, 288, 116878. [Google Scholar] [CrossRef]
  45. Devojno, O.G.; Feldshtein, E.; Kardapolava, M.A.; Lutsko, N.I. On the Formation Features, Microstructure and Microhardness of Single Laser Tracks Formed by Laser Cladding of a NiCrBSi Self-Fluxing Alloy. Opt. Lasers Eng. 2018, 106, 32–38. [Google Scholar] [CrossRef]
  46. Guo, H.; Li, B.; Lu, C.; Zhou, Q.; Jia, J. Effect of WC–Co Content on the Microstructure and Properties of NiCrBSi Composite Coatings Fabricated by Supersonic Plasma Spraying. J. Alloys Compd. 2019, 789, 966–975. [Google Scholar] [CrossRef]
  47. Serres, N.; Hlawka, F.; Costil, S.; Langlade, C.; Machi, F. Microstructures and Mechanical Properties of Metallic NiCrBSi and Composite NiCrBSi–WC Layers Manufactured via Hybrid Plasma/Laser Process. Appl. Surf. Sci. 2011, 257, 5132–5137. [Google Scholar] [CrossRef]
  48. Sidhu, T.S.; Prakash, S.; Agrawal, R.D. Characterisations of HVOF Sprayed NiCrBSi Coatings on Ni-and Fe-Based Superalloys and Evaluation of Cyclic Oxidation Behaviour of Some Ni-Based Superalloys in Molten Salt Environment. Thin Solid Films 2006, 515, 95–105. [Google Scholar] [CrossRef]
  49. Jafari, M.; Han, J.-C.; Seol, J.-B.; Park, C.-G. Tribological Properties of HVOF-Sprayed WC-Co Coatings Deposited from Ni-Plated Powders at Elevated Temperature. Surf. Coat. Technol. 2017, 327, 48–58. [Google Scholar] [CrossRef]
  50. Srichen, A.; Moonngam, S.; Linjee, S.; Banjongprasert, C. Tribological Behaviors of Arc Sprayed NiCrMoAl Alloy Coating after Heat Treatments. Surf. Coat. Technol. 2022, 437, 128325. [Google Scholar] [CrossRef]
  51. Srichen, A.; Linjee, S.; Banjongprasert, C. Corrosion Behavior of Heat-Treated NiCrMoAl Alloy Coatings Produced via Arc Spraying. Surf. Interfaces 2023, 39, 102880. [Google Scholar] [CrossRef]
  52. Deenadayalan, K.; Murali, V.; Elayaperumal, A.; Arulvel, S. Effective Role of Short Time Furnace Heat Treatment and Laser Treatment on the Residual Stress and Mechanical Properties of NiCrBSi–WC Weldments Produced Using Plasma Transferred Arc Welding Process. J. Mater. Res. Technol. 2021, 15, 3492–3513. [Google Scholar] [CrossRef]
  53. Szajna, E.; Moskal, G.; Tupaj, M.; Dresner, J.; Dudek, A.; Szymański, K.; Tomaszewska, A.; Trzcionka-Szajna, A.; Mikuśkiewicz, M.; Łysiak, K. The Influence of Laser Remelting on Microstructural Changes and Hardness Level of Flame-Sprayed NiCrBSi Coatings with Tungsten Carbide Addition. Surf. Coat. Technol. 2024, 478, 130403. [Google Scholar] [CrossRef]
  54. Zhou, S.; Dai, X. Laser Induction Hybrid Rapid Cladding of WC Particles Reinforced NiCrBSi Composite Coatings. Appl. Surf. Sci. 2010, 256, 4708–4714. [Google Scholar] [CrossRef]
  55. Zhu, L.; Wang, J.; Deng, X.; Dong, Y.; Yang, Y.; Li, D. Comparison of Microstructure and Properties of In-Situ TiN-and WC-Reinforced NiCrBSi Composite Coatings Prepared by Plasma Spraying. Materials 2018, 11, 2182. [Google Scholar] [CrossRef] [PubMed]
  56. Yao, S.H. Tribological Behaviour of NiCrBSi–WC (Co) Coatings. Mater. Res. Innov. 2014, 18, S2-332–S2-337. [Google Scholar] [CrossRef]
  57. Zhang, Z.Q.; Wang, H.D.; Xu, B.S.; Zhang, G.S. Characterization of Microstructure and Rolling Contact Fatigue Performance of NiCrBSi/WC–Ni Composite Coatings Prepared by Plasma Spraying. Surf. Coat. Technol. 2015, 261, 60–68. [Google Scholar] [CrossRef]
  58. Altay, O.; Gurgenc, T. GJO-MLP: A Novel Method for Hybrid Metaheuristics Multi-Layer Perceptron and a New Approach for Prediction of Wear Loss of AZ91D Magnesium Alloy Worn at Dry, Oil, and H-BN Nanoadditive Oil. Surf. Rev. Lett. 2024, 31, 2450048. [Google Scholar] [CrossRef]
  59. Khodabakhshi, A.; Eslami, A.; Ashrafizadeh, F.; Mendez, P. Microstructure, Erosion Performance, and Wear Resistance of Laser-Claded NiCrBSi-WC Composite Coatings. Metall. Mater. Trans. A 2025, 56, 2005–2020. [Google Scholar] [CrossRef]
  60. Zhou, L.; Guo, W.; Zhu, H.; He, G.; Ning, C.; Zhou, X.; Wang, H.; Cai, Z.; Xing, Z. Research on the Mechanism of NiCrBSi-WC/Co Coatings Wear Resistance Improvement by Low-Energy Laser Shock Peening. Tribol. Int. 2024, 199, 109957. [Google Scholar] [CrossRef]
  61. Bergant, Z.; Batič, B.Š.; Felde, I.; Šturm, R.; Sedlaček, M. Tribological Properties of Solid Solution Strengthened Laser Cladded NiCrBSi/WC-12Co Metal Matrix Composite Coatings. Materials 2022, 15, 342. [Google Scholar] [CrossRef] [PubMed]
  62. Sun, X.; Li, F.; Li, Y.; Du, J.; Qi, X.; Cui, W.; Niu, J. Enhancing the Wear and High-Temperature Oxidation Behavior of NiCrBSi Coatings by Collaboratively Adding WC and Cr3C2. Surf. Coat. Technol. 2023, 473, 129968. [Google Scholar] [CrossRef]
  63. Lee, C.W.; Han, J.H.; Yoon, J.; Shin, M.C.; Kwun, S.I. A Study on Powder Mixing for High Fracture Toughness and Wear Resistance of WC–Co–Cr Coatings Sprayed by HVOF. Surf. Coat. Technol. 2010, 204, 2223–2229. [Google Scholar] [CrossRef]
  64. Gruzdys, E.; Meškinis, Š.; Juraitis, A. Influence of WC/Co Concentration on Structure and Mechanical Properties of the Thermally Sprayed WC/Co-NiCrBSi Coatings. Mater. Sci. 2009, 15, 35–39. [Google Scholar] [CrossRef]
  65. Islak, S.; Buytoz, S. Microstructure Properties of HVOF-Sprayed NiCrBSi/WCCo-Based Composite Coatings on AISI 1040 Steel. Optoelectron. Adv. Mater. Commun. 2013, 7, 900–903. [Google Scholar]
  66. Özel, C.; Gürgenç, T. Effect of Heat Input on Microstructure, Wear and Friction Behavior of (Wt.-%) 50FeCrC-20FeW-30FeB Coating on AISI 1020 Produced by Using PTA Welding. PLoS ONE 2018, 13, e0190243. [Google Scholar] [CrossRef] [PubMed]
  67. Sundararajan, T.; Kuroda, S.; Abe, F. Steam Oxidation Studies on 50Ni-50Cr HVOF Coatings on 9Cr-1Mo Steel: Change in Structure and Morphology across the Coating/Substrate Interface. Mater. Trans. 2004, 45, 1299–1305. [Google Scholar] [CrossRef]
  68. Vashishtha, N.; Sapate, S.G.; Gahlot, J.S.; Bagde, P. Effect of Tribo-Oxidation on Friction and Wear Behaviour of HVOF Sprayed WC–10Co–4Cr Coating. Tribol. Lett. 2018, 66, 56. [Google Scholar] [CrossRef]
  69. Federici, M.; Menapace, C.; Moscatelli, A.; Gialanella, S.; Straffelini, G. Effect of Roughness on the Wear Behavior of HVOF Coatings Dry Sliding against a Friction Material. Wear 2016, 368, 326–334. [Google Scholar] [CrossRef]
  70. Guilemany, J.M.; Miguel, J.M.; Vizcaino, S.; Climent, F. Role of Three-Body Abrasion Wear in the Sliding Wear Behaviour of WC–Co Coatings Obtained by Thermal Spraying. Surf. Coat. Technol. 2001, 140, 141–146. [Google Scholar] [CrossRef]
  71. Shipway, P.H.; McCartney, D.G.; Sudaprasert, T. Sliding Wear Behaviour of Conventional and Nanostructured HVOF Sprayed WC–Co Coatings. Wear 2005, 259, 820–827. [Google Scholar] [CrossRef]
  72. Karaoglanli, A.C.; Oge, M.; Doleker, K.M.; Hotamis, M. Comparison of Tribological Properties of HVOF Sprayed Coatings with Different Composition. Surf. Coat. Technol. 2017, 318, 299–308. [Google Scholar] [CrossRef]
  73. Macit, C.K.; Saatci, B.T.; Albayrak, M.G.; Ulas, M.; Gurgenc, T.; Ozel, C. Prediction of Wear Amounts of AZ91 Magnesium Alloy Matrix Composites Reinforced with ZnO-HBN Nanocomposite Particles by Hybridized GA-SVR Model. J. Mater. Sci. 2024, 59, 17456–17490. [Google Scholar] [CrossRef]
Figure 1. Integrated experimental workflow from substrate and feedstock design through HVOF deposition, as-sprayed characterization, dry-sliding assessment, and post-wear correlation.
Coatings 16 00906 g001
Figure 2. Roughness values of samples S1–S4. Error bars indicate the reported dispersion, and numeric labels are expressed with precision consistent with the uncertainty.
Coatings 16 00906 g002
Figure 3. Three-dimensional surface roughness topographies of samples: (a) S1, (b) S2, (c) S3, and (d) S4.
Coatings 16 00906 g003
Figure 4. XRD peak patterns of the coating systems.
Coatings 16 00906 g004
Figure 5. Optical micrographs of the coating/substrate cross-sections: (a) S1, (b) S2, (c) S3, and (d) S4. Apparent local coating thicknesses (n = 5 scale-calibrated measurements per panel) were 106 ± 15, 99 ± 11, 76 ± 12, and 100 ± 15 µm, respectively.
Coatings 16 00906 g005
Figure 6. Representative SEM micrographs and corresponding EDS point-analysis spectra of the as-sprayed coating top surfaces: (a) surface morphology of S1/NiCrBSi; (b) surface morphology of S4/NiCrBSi–50 wt.% WC–Co; (c) EDS spectrum obtained from the NiCrBSi matrix-rich region of S1; and (d) EDS spectrum obtained from the WC–Co-rich region of S4.
Coatings 16 00906 g006
Figure 7. Vickers microhardness of S1–S4 (HV0.1; n = 3 indentations per coating). Error bars show the standard deviation among indentations.
Coatings 16 00906 g007
Figure 8. Reported mass loss as a function of sliding distance at (a) 10 N, (b) 30 N, and (c) 50 N.
Coatings 16 00906 g008
Figure 9. Total wear losses of AZ91D and the coated samples. Error bars reproduce the reported dispersion; the underlying independent-specimen count is not documented in the available dataset.
Coatings 16 00906 g009
Figure 10. Friction coefficient curves for samples AZ91D, S1, S2, S3, and S4: (a) 10 N, (b) 30 N, and (c) 50 N.
Coatings 16 00906 g010
Figure 11. Friction coefficient variation for each sample at 10, 30, and 50 N loads: (a) AZ91D, (b) S1, (c) S2, (d) S3, and (e) S4.
Coatings 16 00906 g011
Figure 12. Overall average friction coefficients and standard deviations of the samples at 10, 30, and 50 N loads.
Coatings 16 00906 g012
Figure 13. (a) Mean coefficient-of-friction reduction relative to AZ91D and (b) late-stage coefficients of variation over 501–1000 m. Displayed uncertainty describes within-trace temporal variation.
Coatings 16 00906 g013
Figure 14. SEM surface morphologies after wear.
Coatings 16 00906 g014aCoatings 16 00906 g014b
Figure 15. Post-wear SEM-EDS elemental distribution maps: (a) uncoated AZ91D, (b) S1/NiCrBSi, (c) S2/NiCrBSi-10 wt.% WC-Co, (d) S3/NiCrBSi-30 wt.% WC-Co, and (e) S4/NiCrBSi-50 wt.% WC-Co. The AZ91D map was acquired at 2500× (10 µm scale), whereas the coating maps were acquired at 500× (70 µm scale).
Coatings 16 00906 g015
Table 1. Nominal chemical composition of AZ91D magnesium alloy substrate (wt.%).
Alloy
Element
AlZnMnSiFe (Max.)Cu (Max.)Ni (Max.)OthersMg
AZ918.5–9.50.45–0.900.17–0.400.05
(max.)
0.0040.0250.0010.01Remainder
Table 2. Coating formulations and recorded HVOF spray parameters.
SampleCoating FormulationNiCrBSi/WC-Co
(wt.%)
O2/Propane
(slpm)
Spray Distance
(mm)
Powder Feed/Traverse/Air
S1NiCrBSi100/0278.1/74.915–2040 g min−1/100 mm s−1/110 psi
S2NiCrBSi–10 wt.% WC-Co90/10278.1/74.915–2040 g min−1/100 mm s−1/110 psi
S3NiCrBSi–30 wt.% WC-Co70/30278.1/74.915–2040 g min−1/100 mm s−1/110 psi
S4NiCrBSi–50 wt.% WC-Co50/50278.1/74.915–2040 g min−1/100 mm s−1/110 psi
Table 3. Local EDS compositions of the as-sprayed top surfaces (wt.%, instrument-normalized and semi-quantitative). B and C are not used for stoichiometric or phase confirmation; n.d. denotes not detected.
ElementNiCrBSi (wt. %)NiCrBSi WC-Co10
(wt.%)
NiCrBSi WC-Co30
(wt.%)
NiCrBSi WC-Co50
(wt.%)
Ni75702736
Cr19161910
B3454
Si3311
W 42833
C 3117
Co n.d.89
Table 4. Coefficient-of-friction statistics calculated from the retained 1 m resolved traces. SD denotes temporal standard deviation within an individual trace, not repeat-test variability.
Load
(N)
Sample μ ¯ (0–1000 m)SD μ ¯ (501–1000 m)SD (Late)Min–MaxReduction Relative to AZ91D (%)
10AZ91D0.520.060.540.020.09–0.59-
10S10.460.050.470.020.11–0.5012.7
10S20.410.040.420.010.13–0.4522.3
10S30.360.040.370.010.14–0.4031.7
10S40.310.030.320.010.14–0.3440.1
30AZ91D0.580.060.600.020.12–0.64-
30S10.510.060.530.020.14–0.5612.2
30S20.450.050.470.010.16–0.5021.6
30S30.400.040.410.010.17–0.4430.8
30S40.350.030.360.010.17–0.3938.9
50AZ91D0.640.070.660.020.14–0.71-
50S10.560.070.590.020.16–0.6311.5
50S20.510.060.530.020.18–0.5620.0
50S30.460.050.470.010.19–0.5028.4
50S40.410.040.420.010.19–0.4536.2
Table 5. Friction coefficient values at 100 m intervals under a 10 N load.
Sliding Distance (m)AZ91DS1S2S3S4
1000.540.460.380.330.30
2000.520.450.420.360.31
3000.520.470.420.370.31
4000.560.450.410.360.31
5000.510.470.420.380.31
6000.530.440.420.370.32
7000.550.460.410.350.34
8000.520.440.430.380.34
9000.560.470.410.380.33
10000.550.450.420.350.32
Table 6. Friction coefficient values at 100 m intervals under a 30 N load.
Sliding Distance (m)AZ91DS1S2S3S4
1000.570.490.420.370.34
2000.570.520.460.400.35
3000.590.510.480.430.34
4000.590.510.440.410.34
5000.580.500.490.410.36
6000.590.510.470.410.37
7000.590.500.450.400.37
8000.590.500.500.430.37
9000.610.510.440.420.37
10000.600.510.480.400.37
Table 7. Friction coefficient values at 100 m intervals under a 50 N load.
Sliding Distance (m)AZ91DS1S2S3S4
1000.650.540.460.410.38
2000.610.570.540.460.39
3000.670.570.530.490.40
4000.670.570.500.460.41
5000.620.560.560.470.42
6000.680.570.510.480.42
7000.660.550.520.460.43
8000.640.560.550.470.43
9000.690.560.500.480.44
10000.650.570.550.470.43
Table 8. Major morphological findings and possible dominant wear mechanisms determined from post-wear SEM images.
SampleDistinct SEM MorphologyPossible Dominant Wear Interpretation
AZ91DWide and irregular track, dense plastic coating, tear edges, voids, cracks, and coarse/fine debris.Severe adhesive abrasion, layered separation, third-body abrasive and possible tribo-oxidative mixture.
S1More continuous scarring, surface flattening, limited matrix sealing, fine pits, short cracks, and localized splat damage.Moderate adhesive–abrasive wear, local splat boundary damage and mechanically mixed layer formation.
S2Compressed central band, fine particles, small pits, and localized plate-like separation.Carbide-assisted mixed wear, limited particle extraction and third-body micro-cutting.
S3Relatively smooth central band, granular debris, short grooves, microcracks, and localized stratified separation.Third-body abrasive wear, local carbide/matrix interface damage and tribological layer regeneration.
S4Continuous track without widespread deep grooves, dense fine granular layering and isolated platy-like smearing/separation.Carbide network-supported mild wear, local binder/tribofilm deformation and fine particle generation.
Table 9. Normalized EDS compositions of the mapped post-wear fields and selected objects (wt.%).
Sample/RegionNormalized Composition (wt.%)Microchemical Interpretation
AZ91D—mapped areaMg 94.79, Al 2.34, Zn 1.82, O 1.05.Mg-rich worn substrate with localized oxygen-bearing products.
S1—Object 1Ni 70.43, Cr 15.88, Fe 5.42, Si 4.91, O 1.52, C 1.28, Mg 0.57.NiCrBSi matrix with minor Fe-bearing transfer and low oxidation.
S1—Object 2Ni 70.46, Cr 16.34, Si 5.41, Fe 4.51, O 1.59, C 0.96, Mg 0.73.Matrix-rich region with limited mechanically mixed material.
S1—Object 3Ni 61.53, Cr 14.33, C 9.50, Si 4.60, Fe 4.23, O 3.56, Mg 2.26.C-O-Mg-enriched compacted tribolayer/debris-rich region.
S1—Object 4Ni 73.02, Cr 15.81, Fe 5.56, Si 4.80, Mg 0.32, O 0.25, C 0.18, B 0.04.Cleanest matrix-rich region, minimal C-O enrichment.
S2—Object 1Ni 69.33, Cr 14.93, Si 6.13, Fe 4.63, C 1.97, Co 1.58, O 1.43.NiCrBSi matrix with dispersed Co and mild oxidation.
S2—Object 2Ni 73.51, Cr 15.95, Si 5.02, Fe 3.58, C 0.79, O 0.59, Co 0.53, B 0.03.Relatively clean matrix-rich worn region.
S2—Object 3Ni 62.01, Cr 14.34, C 9.48, Si 4.90, Fe 3.84, O 2.03, Na 1.65, Co 0.95, Mg 0.81.Carbon/oxygen-rich mechanically mixed layer with minor Mg/Na.
S2—Object 4W 64.50, Ni 15.59, Co 8.06, Cr 4.13, C 3.33, O 3.06, Fe 1.33.Retained WC-Co-rich particle/agglomerate.
S3—Object 1 (area)Ni 43.59, W 34.46, Cr 11.82, Co 3.88, Fe 3.24, Si 2.00, C 1.00.Carbide-rich composite field with substantial areal W retention.
S3—Object 2Ni 53.27, W 23.32, Cr 14.39, Fe 3.39, Si 2.70, C 2.27, Co 0.65.Matrix/carbide mixed region with elevated carbon.
S3—Object 3Ni 54.28, W 23.35, Cr 14.84, Fe 3.24, Si 2.84, C 0.97, Co 0.50.Matrix-rich composite region with retained W.
S3—Object 4Ni 56.28, W 21.04, Cr 15.11, Fe 3.66, Si 2.95, Co 0.51, C 0.45.NiCr-rich region with dispersed carbide contribution.
S4—Object 1 (area)W 41.15, Ni 35.22, Cr 8.91, Co 5.27, Fe 3.45, C 3.11, Si 1.48, O 1.38, B 0.02.Broad carbide-rich field, high areal hard-phase retention.
S4—Object 2Ni 59.38, Cr 17.23, W 13.52, Fe 4.77, Si 2.30, C 1.04, O 0.91, Co 0.85.Ni-Cr matrix with distributed W-bearing reinforcement.
S4—Object 3Ni 62.29, Cr 15.08, W 13.94, Fe 3.94, Si 3.14, Co 0.62, C 0.60, O 0.38.Matrix-dominant region with low O and retained W.
S4—Object 4W 62.96, Ni 19.36, Co 6.72, Cr 5.24, Fe 3.07, C 1.28, O 1.03, Si 0.33.Retained WC-Co-rich particle/agglomerate.
S4—Object 1 repeatW 41.12, Ni 35.20, Cr 8.91, Co 5.26, Fe 3.45, C 3.12, Si 1.48, O 1.38, Mg 0.08.Repeat confirms Object 1 composition within rounding.
Table 10. Additional Mg-rich post-wear EDS spectra and conservative interpretations (wt.%).
Sample/RegionNormalized Composition (wt.%)Cautious Interpretation
S2—Mg-rich field AMg 94.18, Al 2.23, Zn 1.87, O 1.72.Local coating penetration/substrate exposure and/or Mg-rich wear matter; top-view EDS cannot distinguish these alternatives.
S2—Mg-rich field BMg 94.60, W 4.26, Cr 0.43, Co 0.42, Ni 0.25, Si 0.03.Mg-rich interaction volume containing residual coating/carbide signals; local penetration or entrained debris is possible.
S3—Mg-rich field AMg 94.22, W 4.61, Cr 0.46, Co 0.39, Ni 0.27, Si 0.05.Mg-rich interaction volume with residual W-Co/NiCrBSi contribution; local penetration or entrained debris is possible.
S3—Mg-rich field BMg 95.30, Al 2.03, Zn 1.91, O 0.77.Local coating penetration/substrate exposure and/or Mg-rich wear matter.
S4—Mg-rich fieldMg 97.06, Al 2.21, O 0.61, Na 0.12.Local coating penetration/substrate exposure and/or Mg-rich debris; generalized failure is not established by a single spectrum.
Disclaimer/Publisher’s Note: The statements, opinions and data contained in all publications are solely those of the individual author(s) and contributor(s) and not of MDPI and/or the editor(s). MDPI and/or the editor(s) disclaim responsibility for any injury to people or property resulting from any ideas, methods, instructions or products referred to in the content.