Article

Research on Multiphysics Simulation of Arcing During Hot Plugging/Unplugging of Electrical Connector Contacts Made of Cu/Ni/Ag Composite Material

1
Key Laboratory of Testing Technology for Manufacturing Process in Ministry of Education, Southwest University of Science and Technology, Mianyang 621010, China
2
Sichuan Yonggui Science and Technology Co., Ltd., Mianyang 621000, China
*
Author to whom correspondence should be addressed.
Coatings 2026, 16(4), 459; https://doi.org/10.3390/coatings16040459
Submission received: 9 March 2026 / Revised: 27 March 2026 / Accepted: 9 April 2026 / Published: 11 April 2026

Highlights

What are the main findings?
  • This paper builds upon improved MHD model and methodology, integrating it with composite material electrical connector to optimize and enhance the model specifically for contacts.
  • Addresses a gap in the study of arc phenomena under conditions involving small scales, dynamic plugging/unplugging arc behavior, and medium to high voltages, offering strong engineering relevance and scenario-specific insights.
What are the implications of the main findings?
  • Study clearly delineates the temperature distribution gradient and the differences between anode and cathode regions, and reveals the competition mechanism between energy deposition and diffusion.

Abstract

Cu/Ni/Ag composite materials are widely used in the manufacturing of electrical connector contacts due to their excellent electrical conductivity and good wear resistance. During hot plugging and unplugging operations, electrical connectors inevitably generate arc discharge, leading to melting, splashing, and erosion of the contact material, which severely threaten system reliability and service life. To investigate the arc behavior of Cu/Ni/Ag composite electrical connectors during plugging and unplugging, this paper establishes a multiphysics coupling model incorporating electric field, fluid heat transfer, and laminar flow based on the COMSOL simulation software (version 6.2). The model employs a multiphysics coupling approach, incorporating electric field, fluid heat transfer, and laminar flow, to systematically simulate the formation and evolution mechanisms of the arc during plugging and unplugging. The study focuses on analyzing the effects of plugging and unplugging speed, operating voltage, and arc gap distance on the arc, exploring the temporal and spatial evolution characteristics and distribution patterns of arc temperature. The simulation results reveal that the arc temperature follows a radially decreasing gradient, with the core region exceeding 10,000 K. When the operating voltage increases to 1000 V, the arc peak temperature rises to 1.3 × 10⁴ K. As the arc gap distance increases, the arc coverage area expands, and the peak arc temperature increases by approximately 2% to 8%. As the plugging/unplugging speed is increased to 500 mm/s, the peak temperature of the arc increases from 1.19 × 10⁴ K to 1.3 × 10⁴ K. The distribution characteristics of the magnetic field are clearly correlated with the arc temperature field and the electric field intensity distribution and the current density also exhibits typical constriction characteristics. Prolonged arc duration is correlated with an upward trend in peak temperature. Further analysis indicates that the temperature distribution characteristics of the arc are constrained by the competition mechanism of energy deposition and diffusion, while the evolution characteristics of the arc are regulated by the coupling effect of electromagnetic field and mechanical work. The research results provide a theoretical basis and simulation methods for the design of arc-resistant structures in Cu/Ni/Ag composite electrical connectors.

1. Introduction

During the service process of electrical connectors, the arc effect induced by plugging and unplugging operations has become a critical technical challenge that cannot be ignored. However, under energized conditions during plugging and unplugging, arc discharge can be initiated at the contact interfaces due to variations in contact resistance [1], inconsistencies in plugging and unplugging speeds, and fluctuations in operating voltage [2,3,4]. This type of arc generates extremely high arc energy, which directly leads to damage such as welding, vaporization, and ablation on the surface of the nickel–silver composite coating. This significantly accelerates material degradation, compromising its service life. The cumulative effects caused by arc discharges not only significantly degrade the electrical conductivity of contact elements, but also directly affect the service life of the electrical connector and the operational safety of the system [5,6]. Therefore, revealing the formation and evolution mechanisms of arc discharge during the plugging/unplugging process holds significant theoretical value and engineering significance for improving the reliability of electrical connectors and the safety of electrical systems [7].
The performance of electrical contact materials directly determines the arc resistance of electrical connectors. Traditional silver-based contact materials, such as Ag-Ni, exhibit excellent electrical conductivity and corrosion resistance, making them dominant in low-voltage electrical appliances [8]. However, the scarcity and high cost of silver resources have driven researchers to develop alternative materials with comparable performance but lower cost. Copper-based composites have gained significant attention due to their good electrical conductivity, lower cost, and recyclability [9,10,11]. The Cu-Ni-Ag composite, formed by adding nickel and silver to a copper matrix, not only retains the high electrical conductivity of copper but also leverages nickel to enhance mechanical strength and arc erosion resistance, while the addition of silver helps improve the stability of contact resistance [10].
The arc phenomenon during the plugging/unplugging process of electrical connectors is extremely complex, involving strong coupling among multiple physical fields, such as electromagnetic, temperature and flow fields, and material phase transitions. Moreover, the occurrence of arcs is often uncontrollable, posing significant threats to material erosion, the safe operation of electrical equipment, and personal safety. In terms of simulation, Andrei Andras et al. [12], based on Holm’s contact theory and utilizing COMSOL Multiphysics software, numerically simulated the relationship between electrical potential and temperature during electrical contact processes. The study found that when the voltage drop exceeds 4 mV, the contact temperature increases significantly. Xiu et al. [13] established a high-current vacuum arc magnetohydrodynamic model, which considered the influence of ion and electron viscosity and the combined effect of the transverse magnetic field (TMF) and the axial magnetic field (AMF). The simulation yielded the plasma parameters of the arc column region as well as the temperature distribution characteristics of the cathode and anode surfaces. The simulation results were relatively consistent with the experimental results and the existing research results. Yu et al. [14] established a mathematical model of the arc in the pantograph–catenary system of urban railways. The study found that when the arc gap was fixed, the arc temperature increased with the arc duration. When the arc duration was fixed, the temperature at the arc center varied inversely with the arc gap. Rong et al. [15] conducted a numerical study on the effect of electrode erosion on arc behavior during the opening process of low-voltage circuit breakers. The simulation results indicated that when electrode erosion was considered, the stagnation time of both the moving and stationary contacts was significantly longer. Due to the change in conductivity of the air–copper vapor mixture, the calculated voltage of the arc column during arc motion was lower when erosion was taken into account. In terms of the experiment, Wu et al. [16] investigated the arc erosion behavior of Ag/Ni electrical contact materials. The results showed that “crater”-type erosion pits, island-like molten silver, pores, cracks, and coral-like splashes were observed on the eroded surface of the Ag/Ni contact materials. Furthermore, arc erosion under static contact was more severe than that under moving contact. To explore the arc initiation process and the temperature distribution characteristics of arc electrodes, Li et al. [17] studied a set of fault arc experiments under various initial current and power supply voltage conditions. The results indicated that the arc ignition process of copper–copper electrodes follows the sequence of arc breakage, electrode heating by the arc, electrode melting, and arc extinction. Li et al. [18] studied arc erosion at different electric load conditions for Ag/Ni materials. The results showed that compared with inductive load, there were longer make-arc-duration, lower make-arc-energy, lower break-arc-duration/energy, and lower arc power at resistive load. Serious material transfer happens at 18 V and 24 V. Moreover, the resistive load was helpful for decreasing mass loss. In conclusion, it is necessary to conduct in-depth research on the spatiotemporal evolution characteristics and distribution patterns of electric arcs to better understand the arc ablation mechanism and thereby mitigate associated risks.
This study draws on the aforementioned research by constructing a mathematical model of arc evolution using the magnetohydrodynamic (MHD) method. A simulation study on arcs in Cu/Ni/Ag composite material electrical connectors is conducted under high-voltage and high-current conditions. The investigation focuses on the formation and evolution mechanism of arcs during the hot-swapping process of electrical connector contacts under high-voltage conditions, with an in-depth analysis of its temperature distribution characteristics and energy consumption mechanisms. The research findings can provide theoretical support for the design optimization of composite material electrical connectors and arc extinguishing technologies, offering significant engineering application value for enhancing the operational reliability of electrical systems and advancing research in the field of high-current and high-voltage arcs.

2. Establishment of Mathematical Model for Arc Evolution

2.1. Establishment of Geometric Model

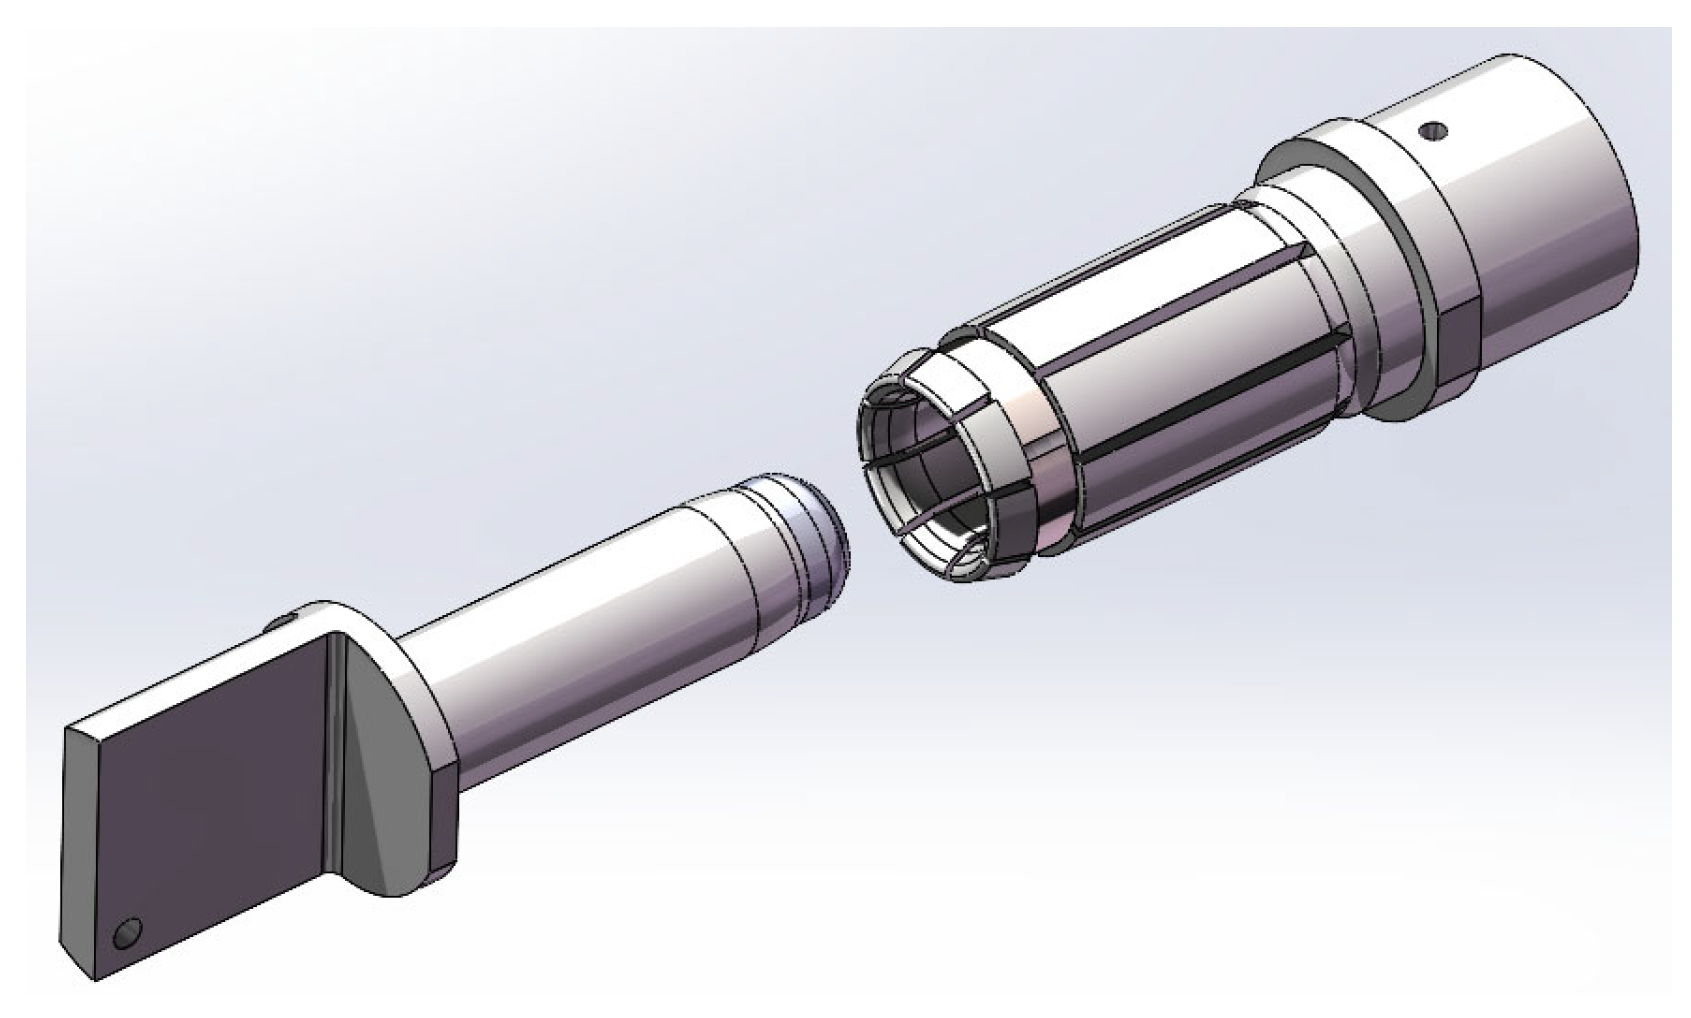
The contact components of electrical connectors consist of a rigid pin and an elastic socket, with a typical structure shown in Figure 1. The conductivity of these connectors is achieved through reliable mechanical contact between components. During pin–socket mating, the spring structure of the socket undergoes elastic deformation under mechanical stress, generating stable contact pressure. This pressure forms a stable contact region at the interface, thereby establishing a current pathway for electrical signal transmission.
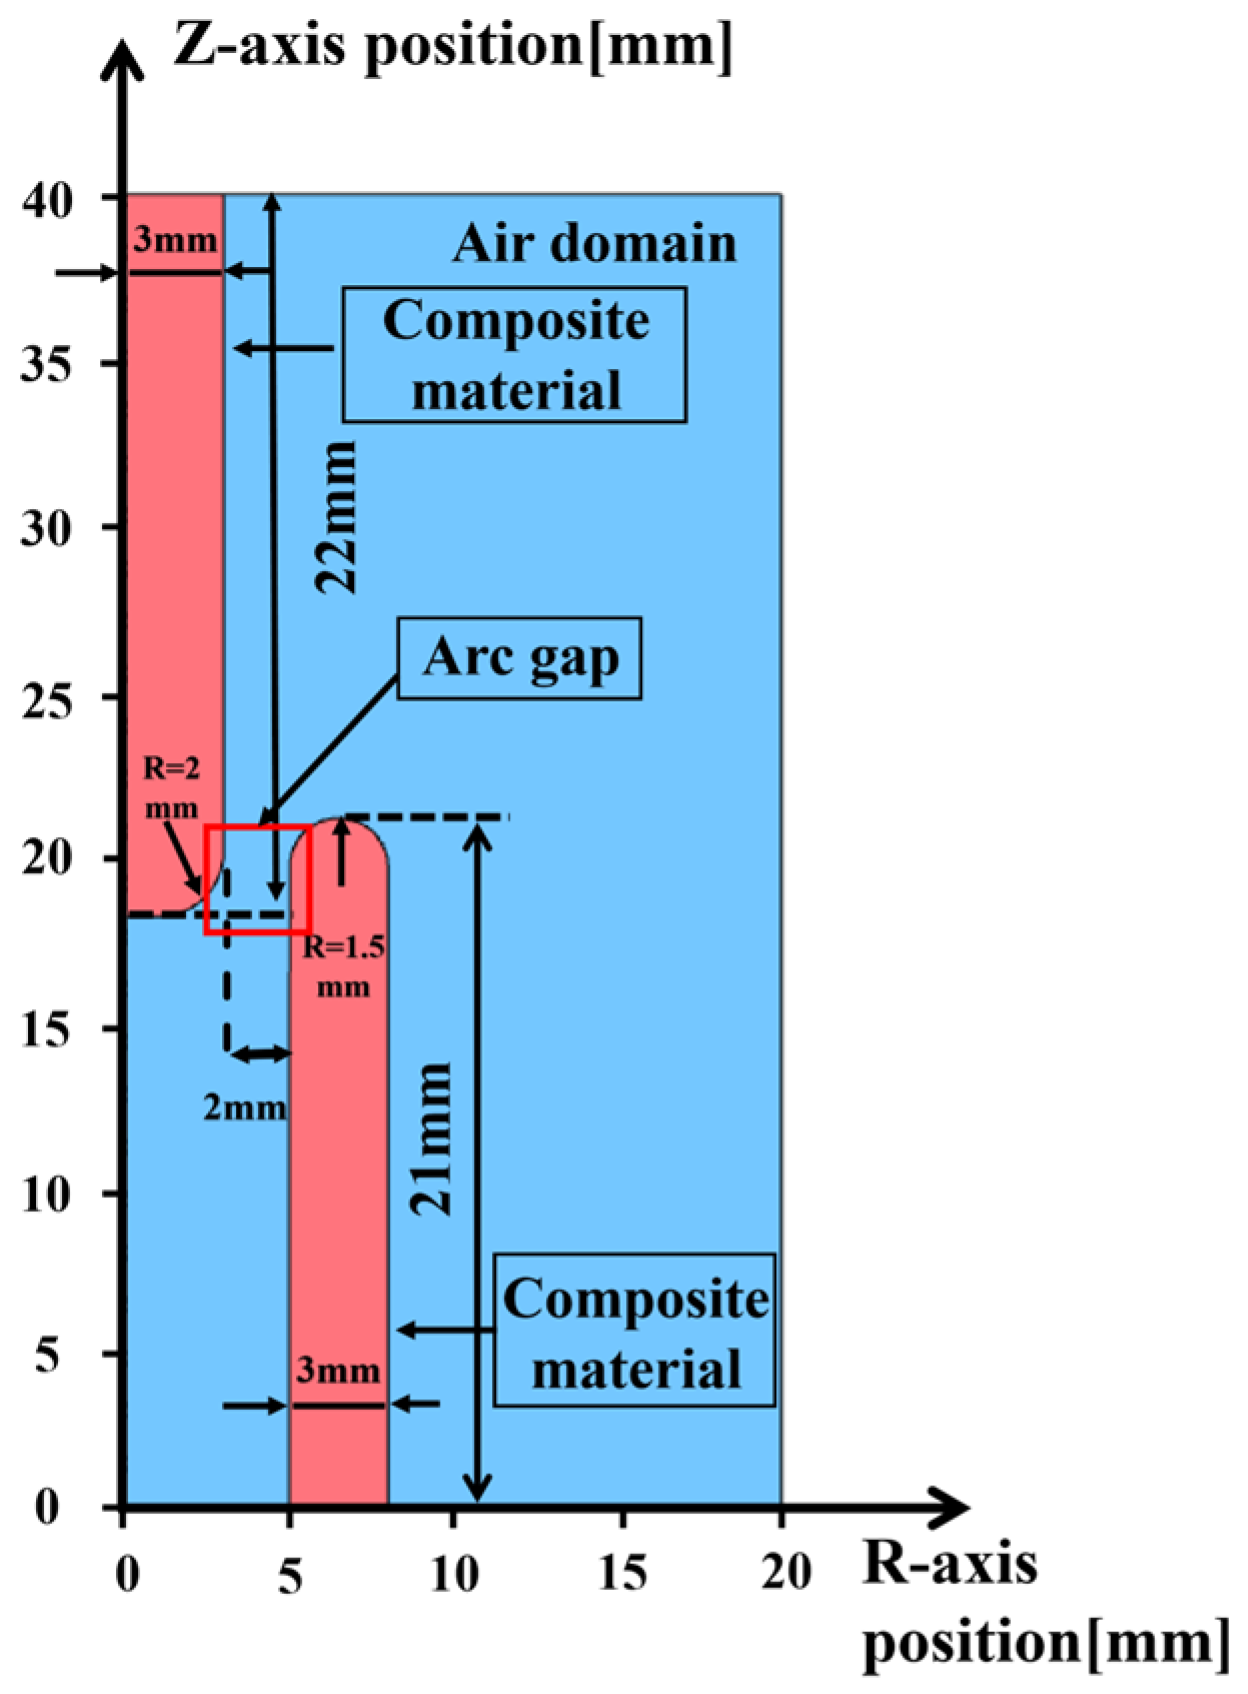
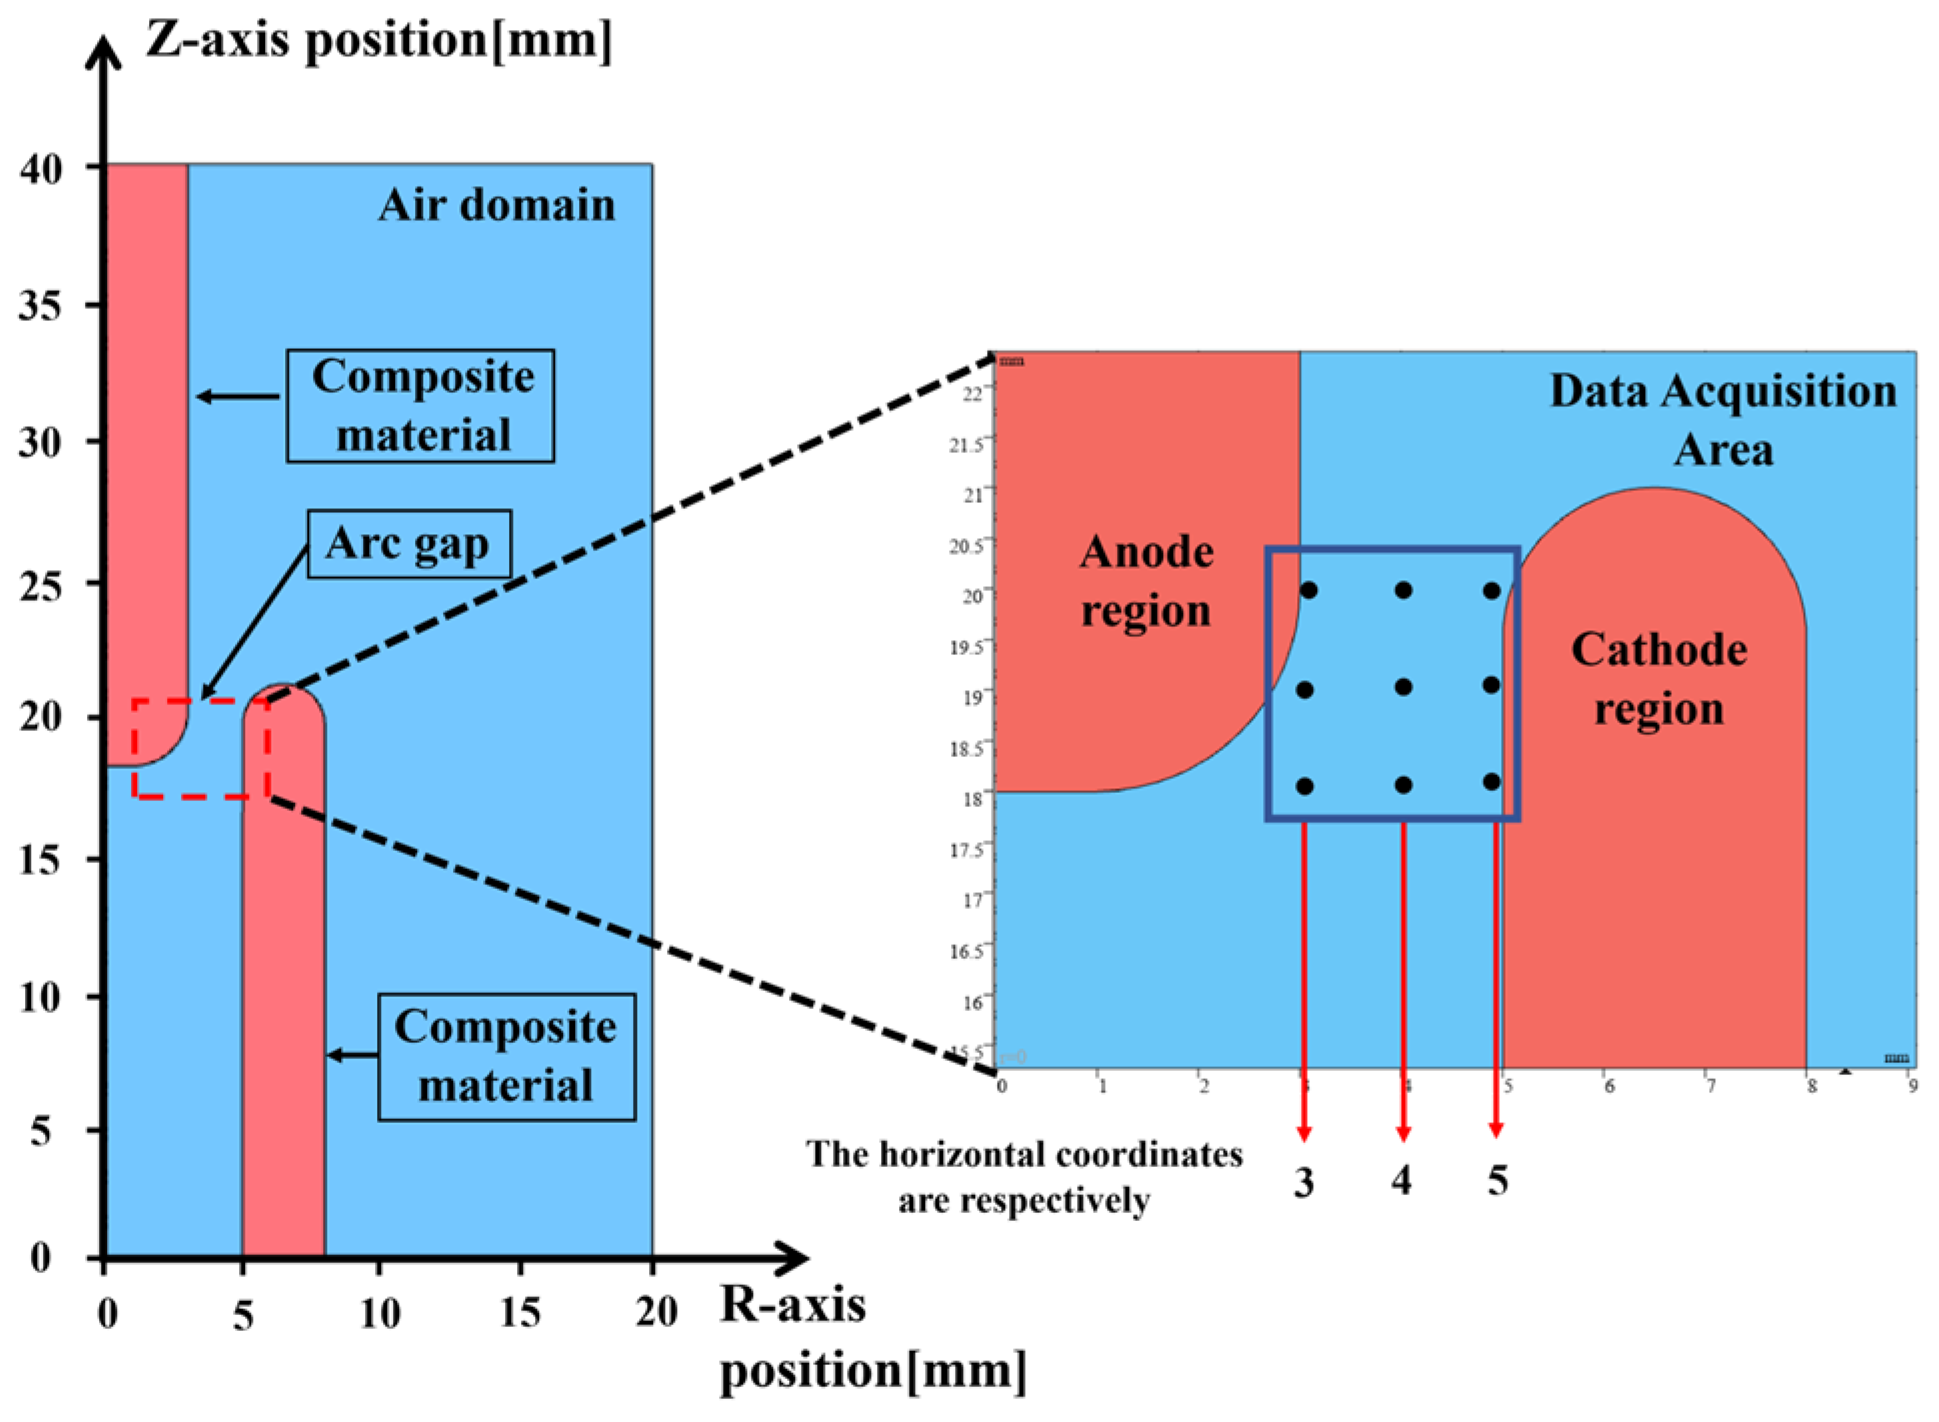
Arc modeling requires accurate characterization of the multiphysics coupling mechanism during the contact separation process. Since the electrical connector contact depends mainly on the function of the plug and socket in the process of unplugging, the model can be simplified in order to eliminate unnecessary structural interference. Based on the axisymmetric characteristics of the plug–socket structure, a two-dimensional axisymmetric model, as shown in Figure 2, has been established.
In Figure 2, the simulation domain is defined as a 200 mm × 400 mm rectangular region with its origin in the two-dimensional symmetry axis. The upper contact column is assigned geometric parameters of length 22 mm, 3 mm in width, and a filet radius of 2 mm, while the lower column is defined with dimensions of 21 mm × 3 mm × 1.5 mm. The horizontal spacing between contact columns is 2 mm. The contact column material is specified as Cu/Ni/Ag composite material (among them, copper serves as the base material, with a 5 μm nickel coating electroplated in the middle and a 5 μm silver coating electroplated on the surface), while the remaining area is defined as air. The arc evolution region within the air dielectric domain is captured using a gap dynamic mesh.
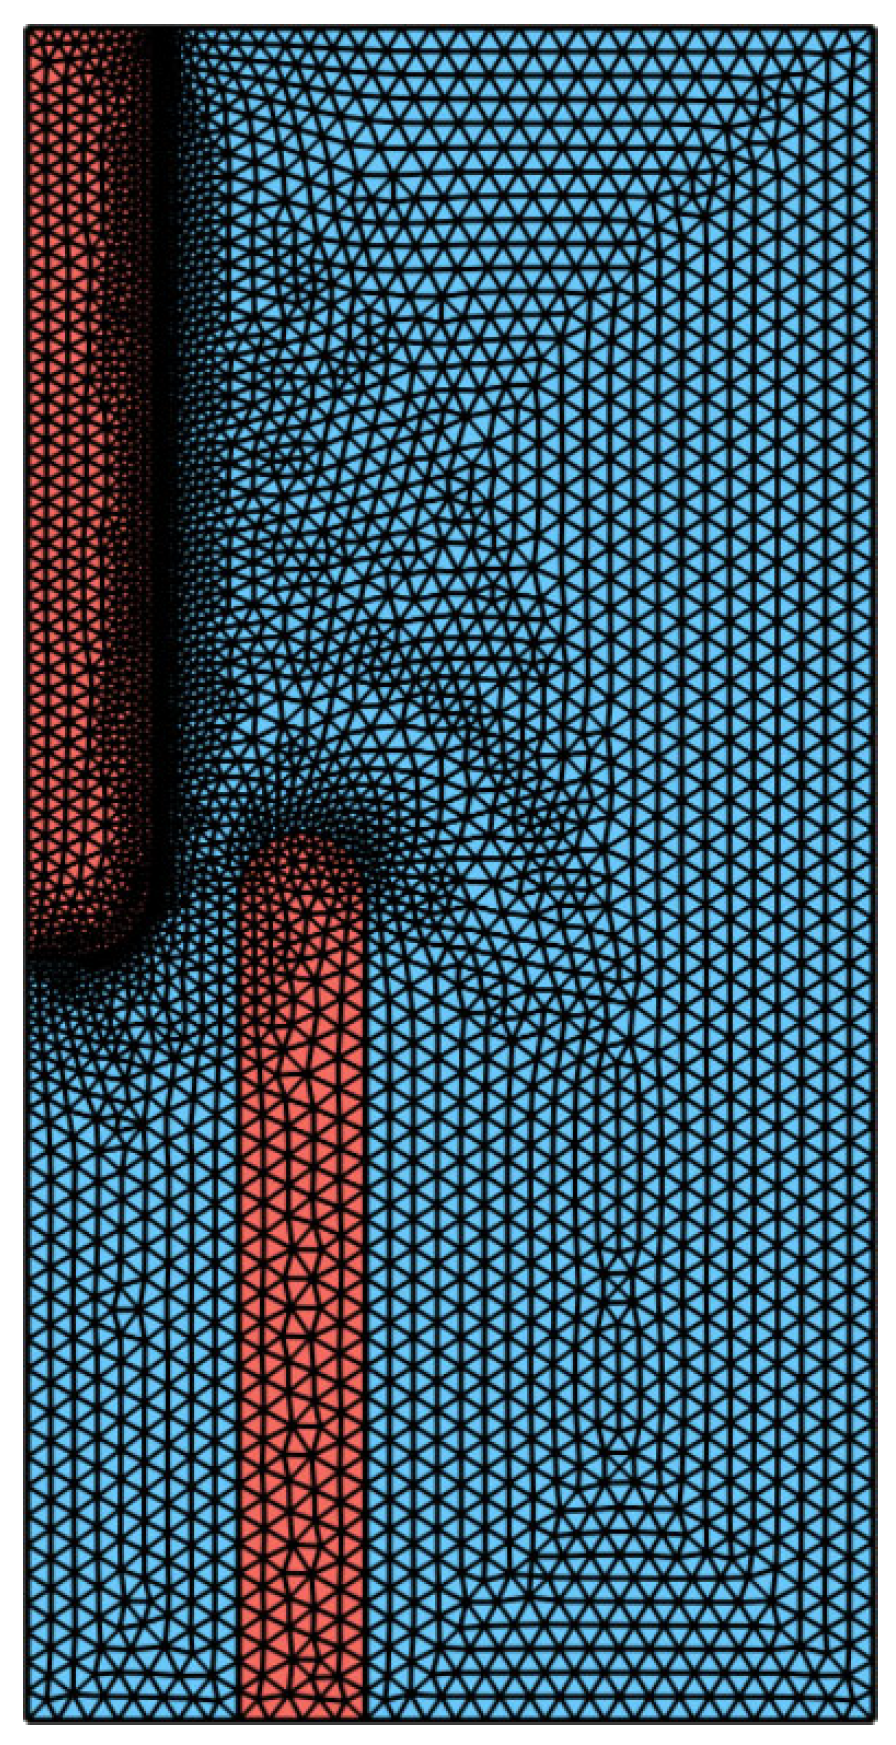
To accurately analyze the formation and evolution of the air gap arc at the contact point over time, a dynamic meshing method for the gap is adopted. The computational domain is discretized using a free triangular mesh, with mesh refinement applied to the region where the arc forms, while the mesh size gradually coarsens toward the far-field boundary to balance computational accuracy and efficiency. The final mesh model is shown in Figure 3. This meshing strategy enables adequate capture of the temperature, electric field, and current density in the arc column and near-electrode regions.
The initial and boundary conditions of the arc simulation model are defined as follows: the upper contact pin is designated as the anode, and the lower contact pin is designated as the cathode. The cathode serves as the emitter of electrons, while the anode acts as the receiver. The initial electric potential across the entire computational domain is set to zero. The initial temperature condition for the entire model is defined as 293.15 K, and the ambient pressure is set to 1 atm. The DC operating voltage of the model is set to 1000 V (representing extreme operating conditions for electrical connectors). The horizontal separation between the contact pins is set to 2 mm, and the vertical velocity of the lower contact pin is set to 500 mm/s. The simulation time step is set to 0.01 ms, with a total duration of 10 ms. The thermal convection mode is set to forced convection, with a heat transfer coefficient of 20 W∙(m2∙K)−1. In terms of material selection, the specific parameters of air and Cu/Ni/Ag under the classification of equilibrium discharge are listed in Table 1. Among them, some parameter values for air are defined as functions of temperature T. This study does not aim to precisely predict the absolute values of temperature. Under a single short-duration arc event, the amount of material ablation is limited, and the plasma composition remains predominantly air, making the study reasonable. Therefore, a constant property assumption can be adopted as a simplification in the qualitative analysis stage. It should be noted that within this temperature range, material properties do actually vary. So, parameters such as electrical conductivity used in this study are set as high-temperature effective values obtained through equivalent treatment. This model strictly satisfies the full-dimensional analytical accuracy requirements for two-dimensional axisymmetric problems under the three-dimensional solver of the simulation software.

2.2. Grid Independence Test and Model Reliability Verification

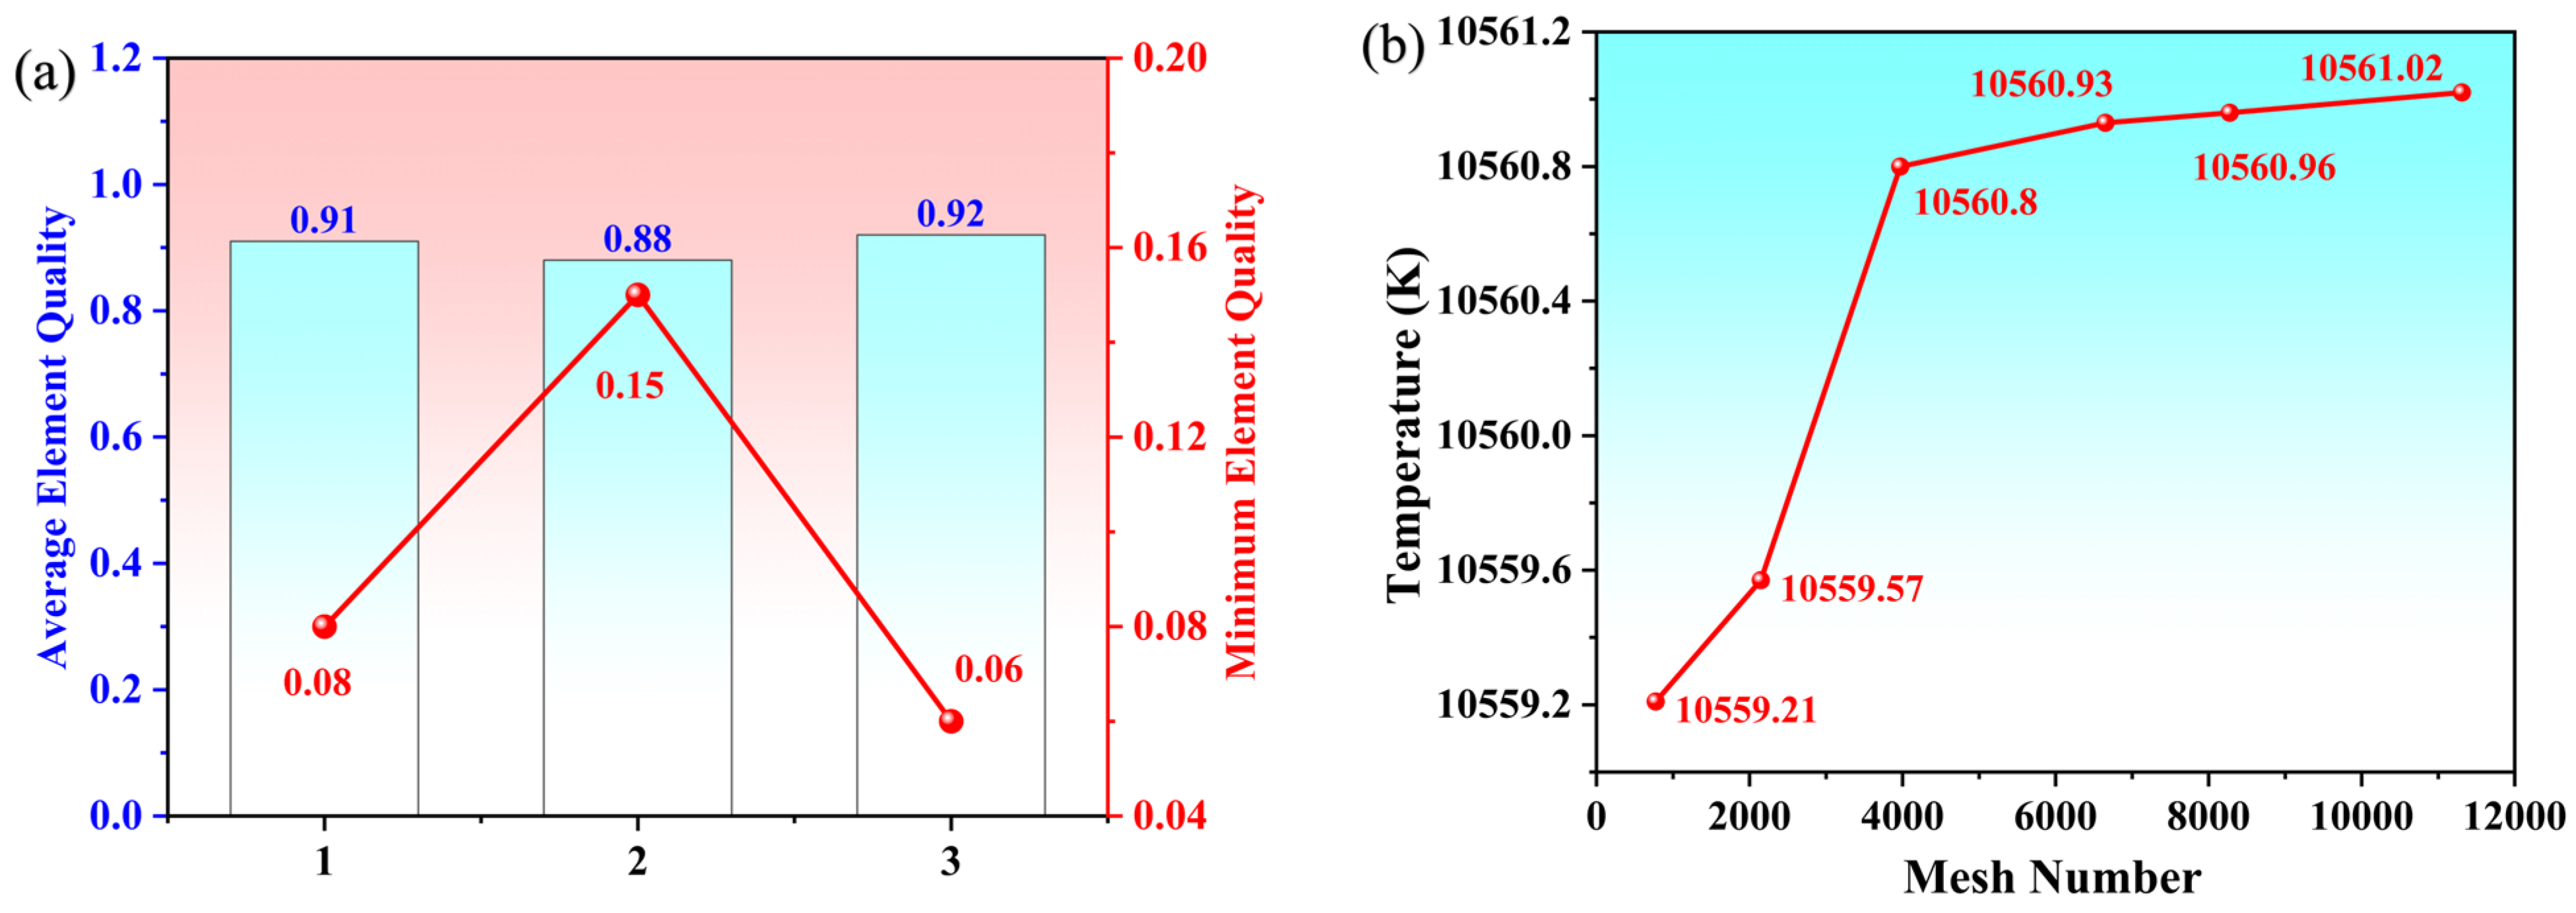
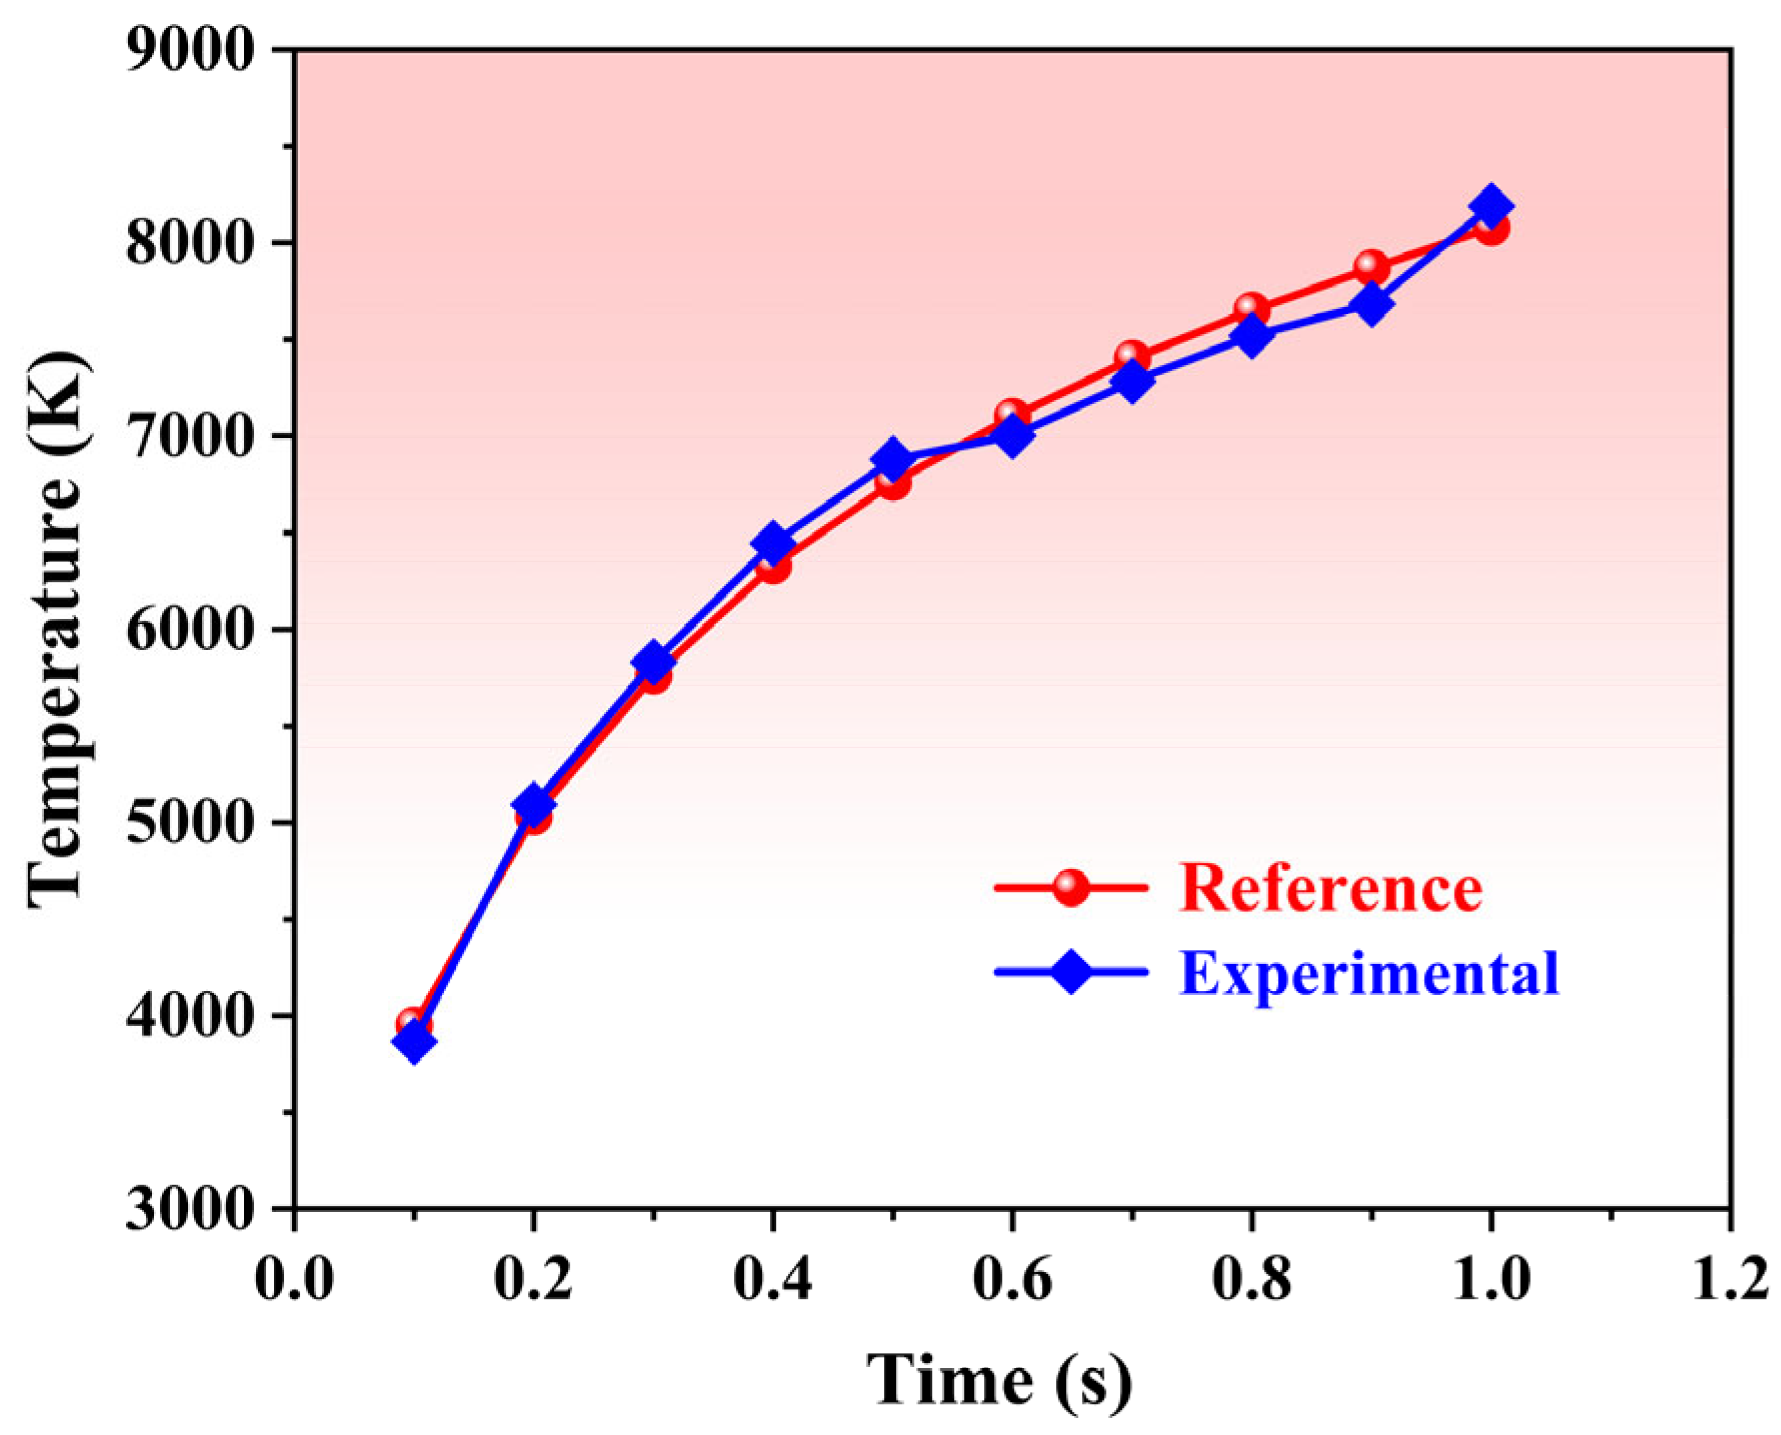
To ensure the computational accuracy and precision of the numerical simulation, a grid independence test is conducted using triangular meshes with different element numbers, and mesh refinement is applied to the boundary layers and corners to enhance simulation accuracy. Figure 4 presents the element quality distribution and the grid independence test results. As shown in Figure 4a, the element quality of the three mesh configurations is good; Figure 4b indicates that as the mesh count increases, the calculated temperature does not change significantly, demonstrating good grid independence. These results verify the rationality and good quality of the mesh. To further validate the accuracy of the model, the experimental parameters from the literature are incorporated into the model in this study [14], and the simulation results are compared with those in the literature, using the maximum temperature as the evaluation metric. As shown in Figure 5, the relative error of the maximum temperature is only 5%, which fully demonstrates that the established model has good accuracy.

2.3. Mathematical Model

The arc is generated within the air gap between the contacts and is formed as a magnetofluid under the coupling effects of electric, magnetic, and thermal fields. Due to the complexity of the physical and chemical reaction process inside the arc, the simulation and calculation processes of the plugging/unplugging arc of the connector are simplified. Accordingly, the arc physical model is established based on the following assumptions [19,20,21,22,23,24,25]:
(1)
When the arc exists, the arc plasma flow field satisfies local thermodynamic equilibrium (LTE), meaning that at every point in space, the arc plasma is in local thermodynamic equilibrium, such that the electron temperature, ion temperature, and neutral particle temperature are approximately equal;
(2)
The arc is treated as approximately steady after its formation. Here, steady state refers to solving the steady-state equations within each time step (a quasi-static approximation of the transient solution), rather than implying that the arc does not change over time;
(3)
The arc is axisymmetric, and under free-burning conditions, the arc fluid flow is laminar;
(4)
The arc is modeled as a weak compressible fluid;
(5)
The influence of the arc on the ablation of the electrode and the near-polar region is neglected.
The above assumptions are well supported under the operating conditions considered in this study. First, the LTE assumption requires that the electron temperature, ion temperature, and neutral particle temperature are approximately equal at every point in space, and that the number densities of particles satisfy the Saha equation [26], which describes the degree of gas ionization under thermodynamic equilibrium. The operating conditions in this study correspond to high voltage (up to 1000 V) and high current, where the current density can reach the order of 106 A/m2, satisfying the energy and momentum exchange conditions required for LTE to hold. However, non-equilibrium effects may appear near the electrodes (cathode and anode regions) and at the interfaces between the arc periphery and the cold gas. Since this study focuses primarily on the macroscopic temperature distribution and energy transport in the arc core region, the LTE assumption is considered to have high accuracy in this region.
Moreover, this study assumes that the arc fluid is a weakly compressible fluid and adopts a laminar flow model under free-burning conditions. In practical arcs, temperature gradients induced by Joule heating can reach the order of 104 K, leading to drastic variations in gas density, and compressibility effects become non-negligible under high-speed flow conditions. However, in the simulations presented herein, the electrode motion speed does not exceed 500 mm/s, and the flow velocity in the arc column region is generally below 100 m/s, corresponding to a Mach number of approximately 0.3. Therefore, the weakly compressible assumption remains within an acceptable range. Additionally, the laminar flow assumption is applicable to free-burning arcs in the absence of strong external magnetic field disturbances or turbulent excitation.
Finally, the model does not account for the influence of metal vapor generated by the ablation of electrode materials (Cu/Ni/Ag) on the physical properties of the arc plasma. This assumption is considered reasonable under a single short-duration arc event, where the extent of material ablation is limited, and the plasma remains predominantly composed of air.
The above assumptions are all established within the framework of MHD theory. MHD theory couples electromagnetism with classical fluid mechanics to study the motion and evolution of electrically conductive fluids in electromagnetic fields [27,28,29]. It rigorously describes mass, momentum, and energy transport processes of charged particles under electromagnetic fields. This theory includes fluid heat transfer equations and electromagnetic field equations.

2.3.1. The Fluid Heat Transfer Equations System (Navier–Stokes)

The fluid heat transfer equations are essentially a coupled system of the Navier–Stokes equations and the energy conservation equation, describing the momentum, mass, and energy transfer during fluid motion. The system of equations mainly includes the conservation of mass, momentum, and energy. Those commonly used equations are as follows:
Continuity equation (conservation of mass):
ρ t + ( ρ u ) = 0 .
Here, ρ is the fluid density; u is the velocity vector; t is time; and is the divergence operator.
Momentum equation (Navier–Stokes equation):
ρ u t + u u = p + μ 2 u + f .
Here, f is the external force per unit volume; p is the pressure; μ is the dynamic viscosity of the fluid; and 2 is the Laplace operator.
Energy equation:
ρ c p T t + u T = k 2 T + q ˙ v + ρ q ˙ p + μ u : u .
Here, T is the temperature; c p is the specific heat at constant pressure; k is the thermal conductivity; q ˙ v is the volumetric heat source per unit volume; q ˙ p is the heat generation per unit volume; u : u is the double contraction of the velocity gradient tensor, representing the viscous dissipation term.

2.3.2. Maxwell’s System of Equations (Maxwell)

Maxwell’s equations describe electromagnetic phenomena and fully characterize the interaction laws of electromagnetic fields. The equations are four fundamental equations describing the relationships between electric fields, magnetic fields, and charge–current distributions. The integral form of Maxwell’s equations is given as follows:
Gauss’s law (electric field):
V E d A = Q e ε 0 .
Gauss’s law (magnetic field):
V B d A = 0 .
Faraday’s law of electromagnetic induction:
S E d l = d d t S B d A .
Ampère–Maxwell law:
S B d l = μ 0 S J d A + μ 0 ε 0 d d t S E d A .
Here, E is the electric field intensity; B is the law of magnetic induction; Q e is the electric charge density; J is the current density; ε 0 is the vacuum permittivity; and μ 0 is the vacuum magnetic permeability.
The equations employed in this work are the governing equations describing plasma physics. The innovation is reflected in the introduction of the MHD framework, through which electromagnetism is coupled with classical fluid mechanics to provide a more comprehensive description of the mass, momentum, and energy transport processes of charged particles in electromagnetic fields [30]. The governing equation set is formulated to incorporate multiphysics interactions including plasma flow, Joule heating, and electromagnetic induction mechanisms, thereby enabling the establishment of a bidirectional electromagnetic fluid coupling model [31]. Consequently, a more accurate simulation of the dynamic constriction and diffusion behaviors of the arc is achieved, and the nonlinear saturation effects as well as the competing mechanisms between energy deposition and diffusion are revealed [32].

3. Analysis of Plugging/Unplugging Arc Simulation Results

3.1. Analysis of Parameter Results

3.1.1. Arc Temperature Distribution

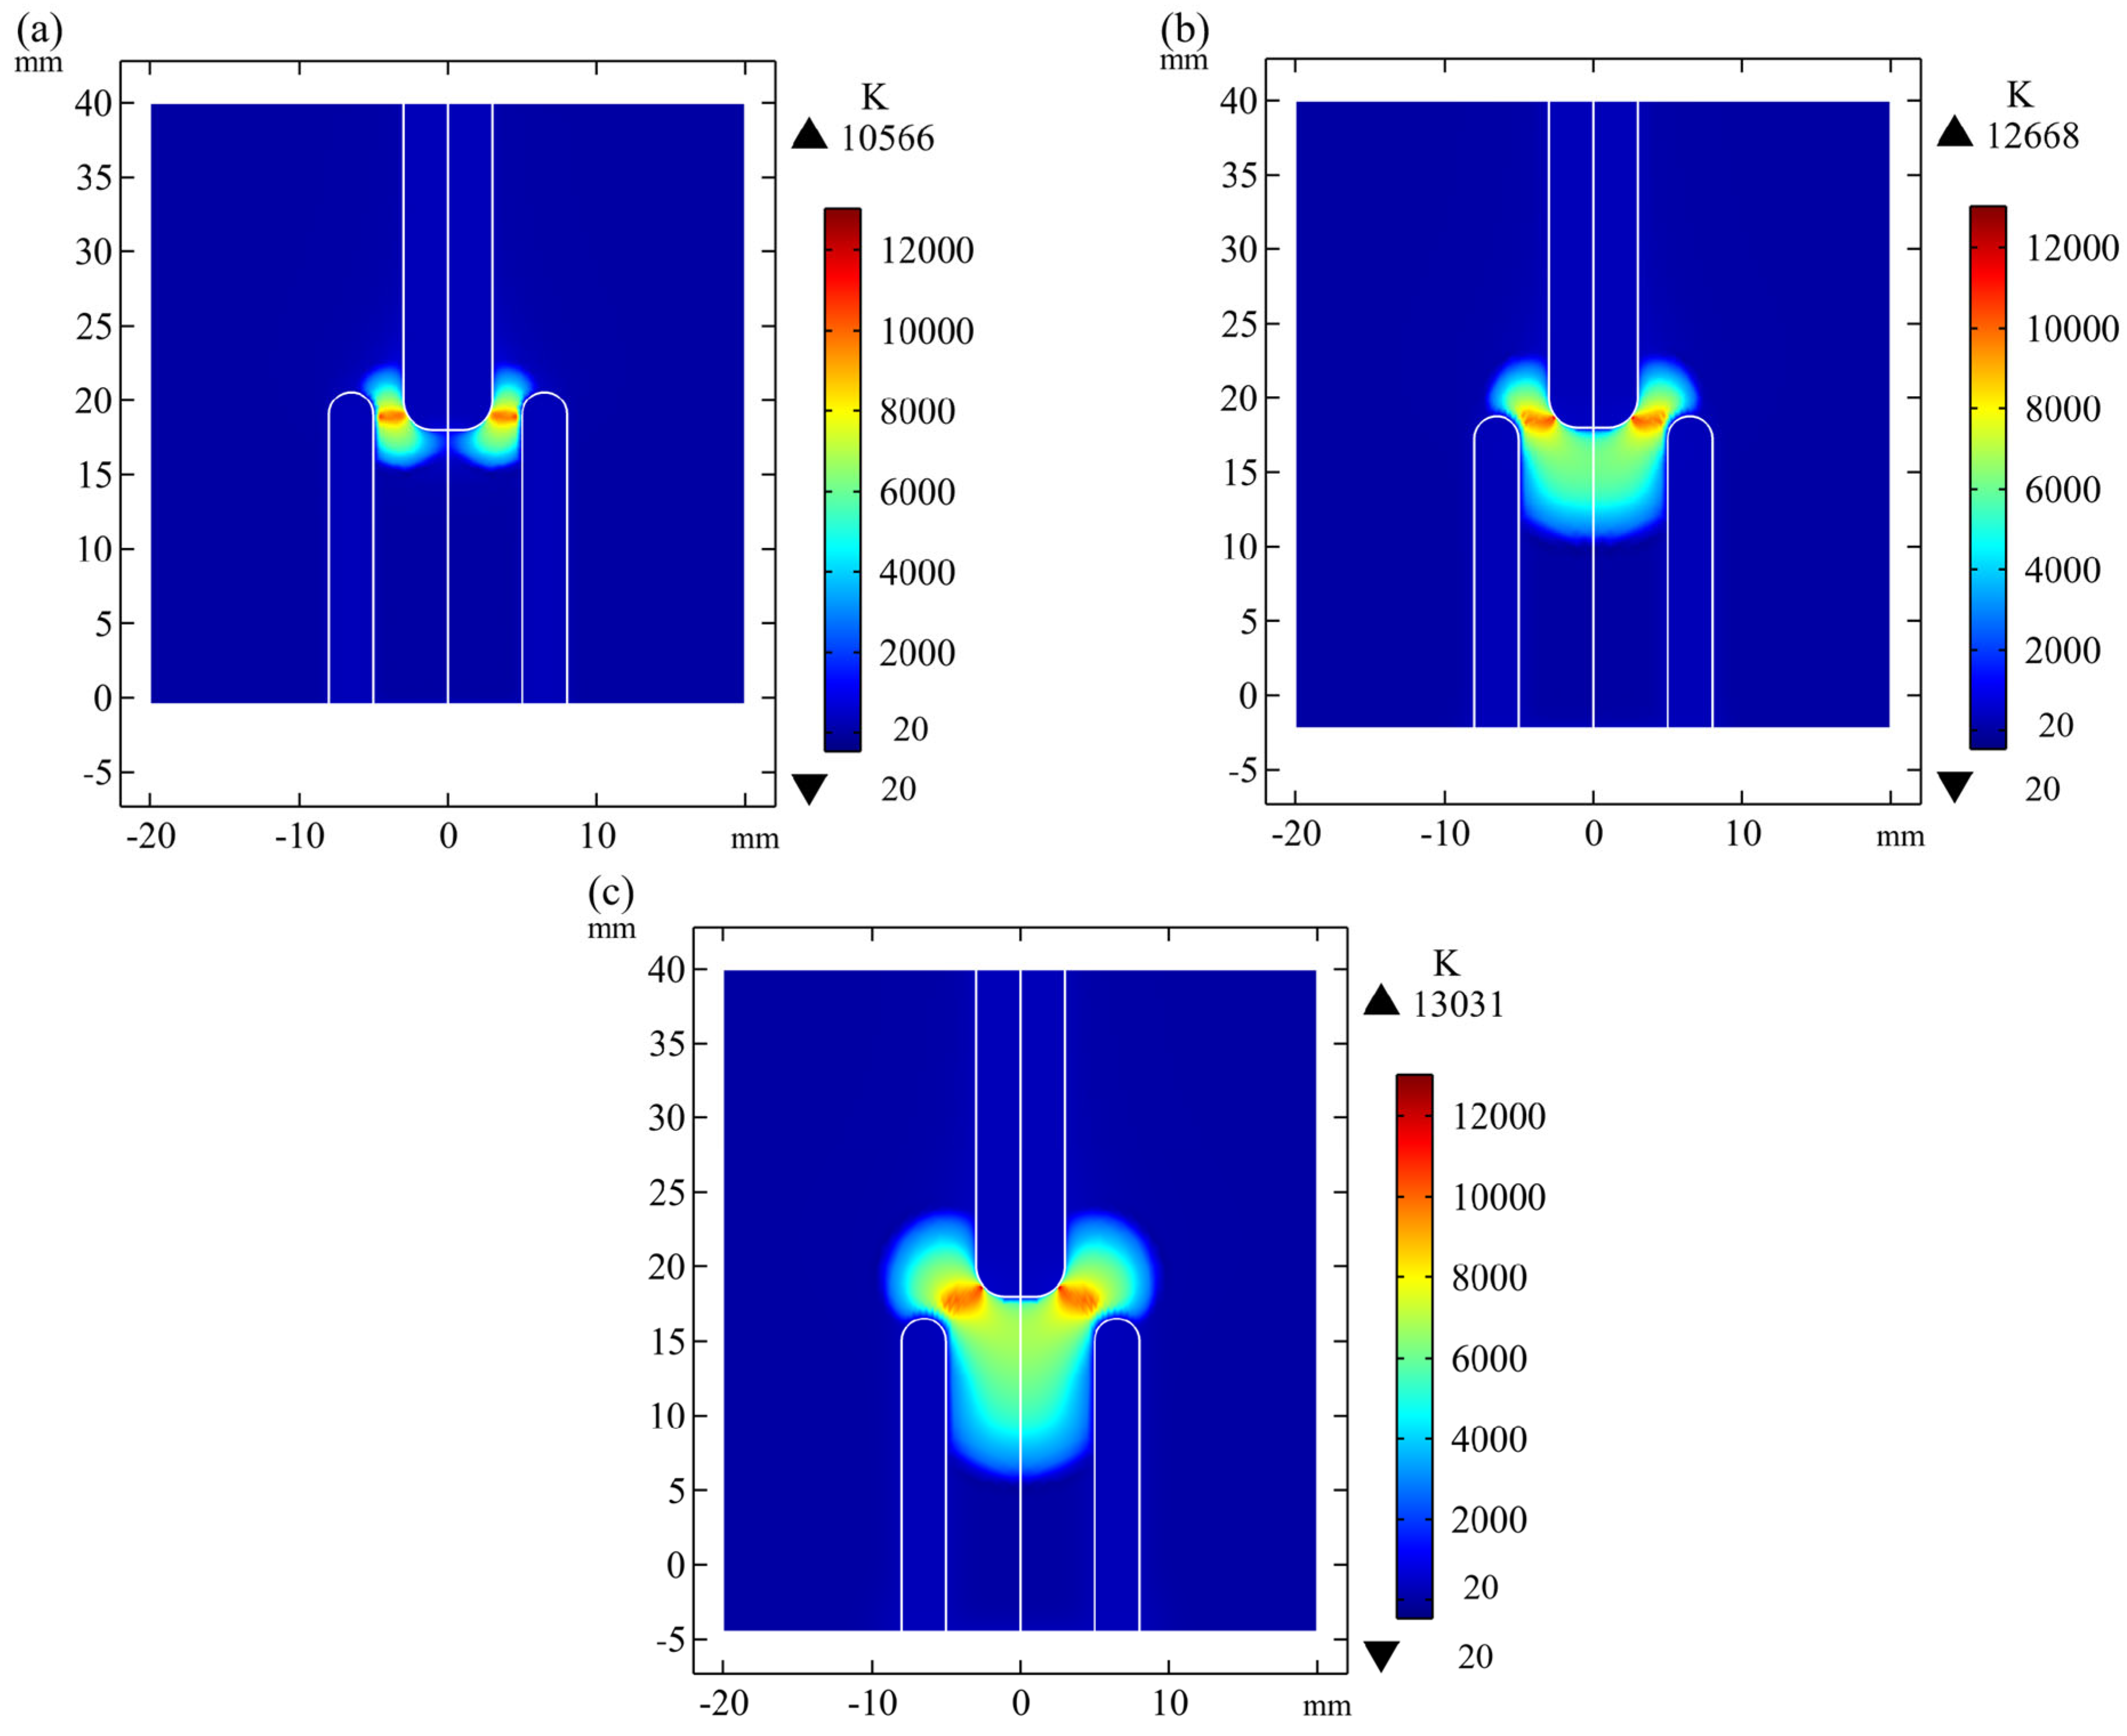
Numerical simulations are conducted using a multiphysics simulation software. By appropriately defining the boundary conditions and material parameters and incorporating source terms into the governing equations, the temperature distribution of the arc generated at electrical connector contacts under a high voltage of 1000 V is calculated, as shown in Figure 6.
As shown in Figure 6, the core temperature of the arc can exceed 10,000 K. When the contact pin moves downward by a displacement of 5 mm, the air gap between the electrodes gradually increases, and the arc exhibits a bidirectional diffusion trend. Within the initial 4 ms, the arc peak temperature rapidly increases to approximately 12,000 K, followed by a gradual rise to 13,000 K with prolonged duration. Concurrently, the arc position is continuously displaced as the contact pin moves downward. A significant temperature difference between the two electrodes is observed in Figure 6, with the temperature near the anode clearly higher than near the cathode. The anode temperature increases by approximately 20% compared to the cathode. This is attributed to the emission of electrons from the cathode, which are driven toward the anode under the influence of the electric field. Near the anode region, a large number of free electrons collide and release energy, resulting in a higher energy deposition density near the anode. Thus, there is a higher temperature in the anode region compared to the cathode region.
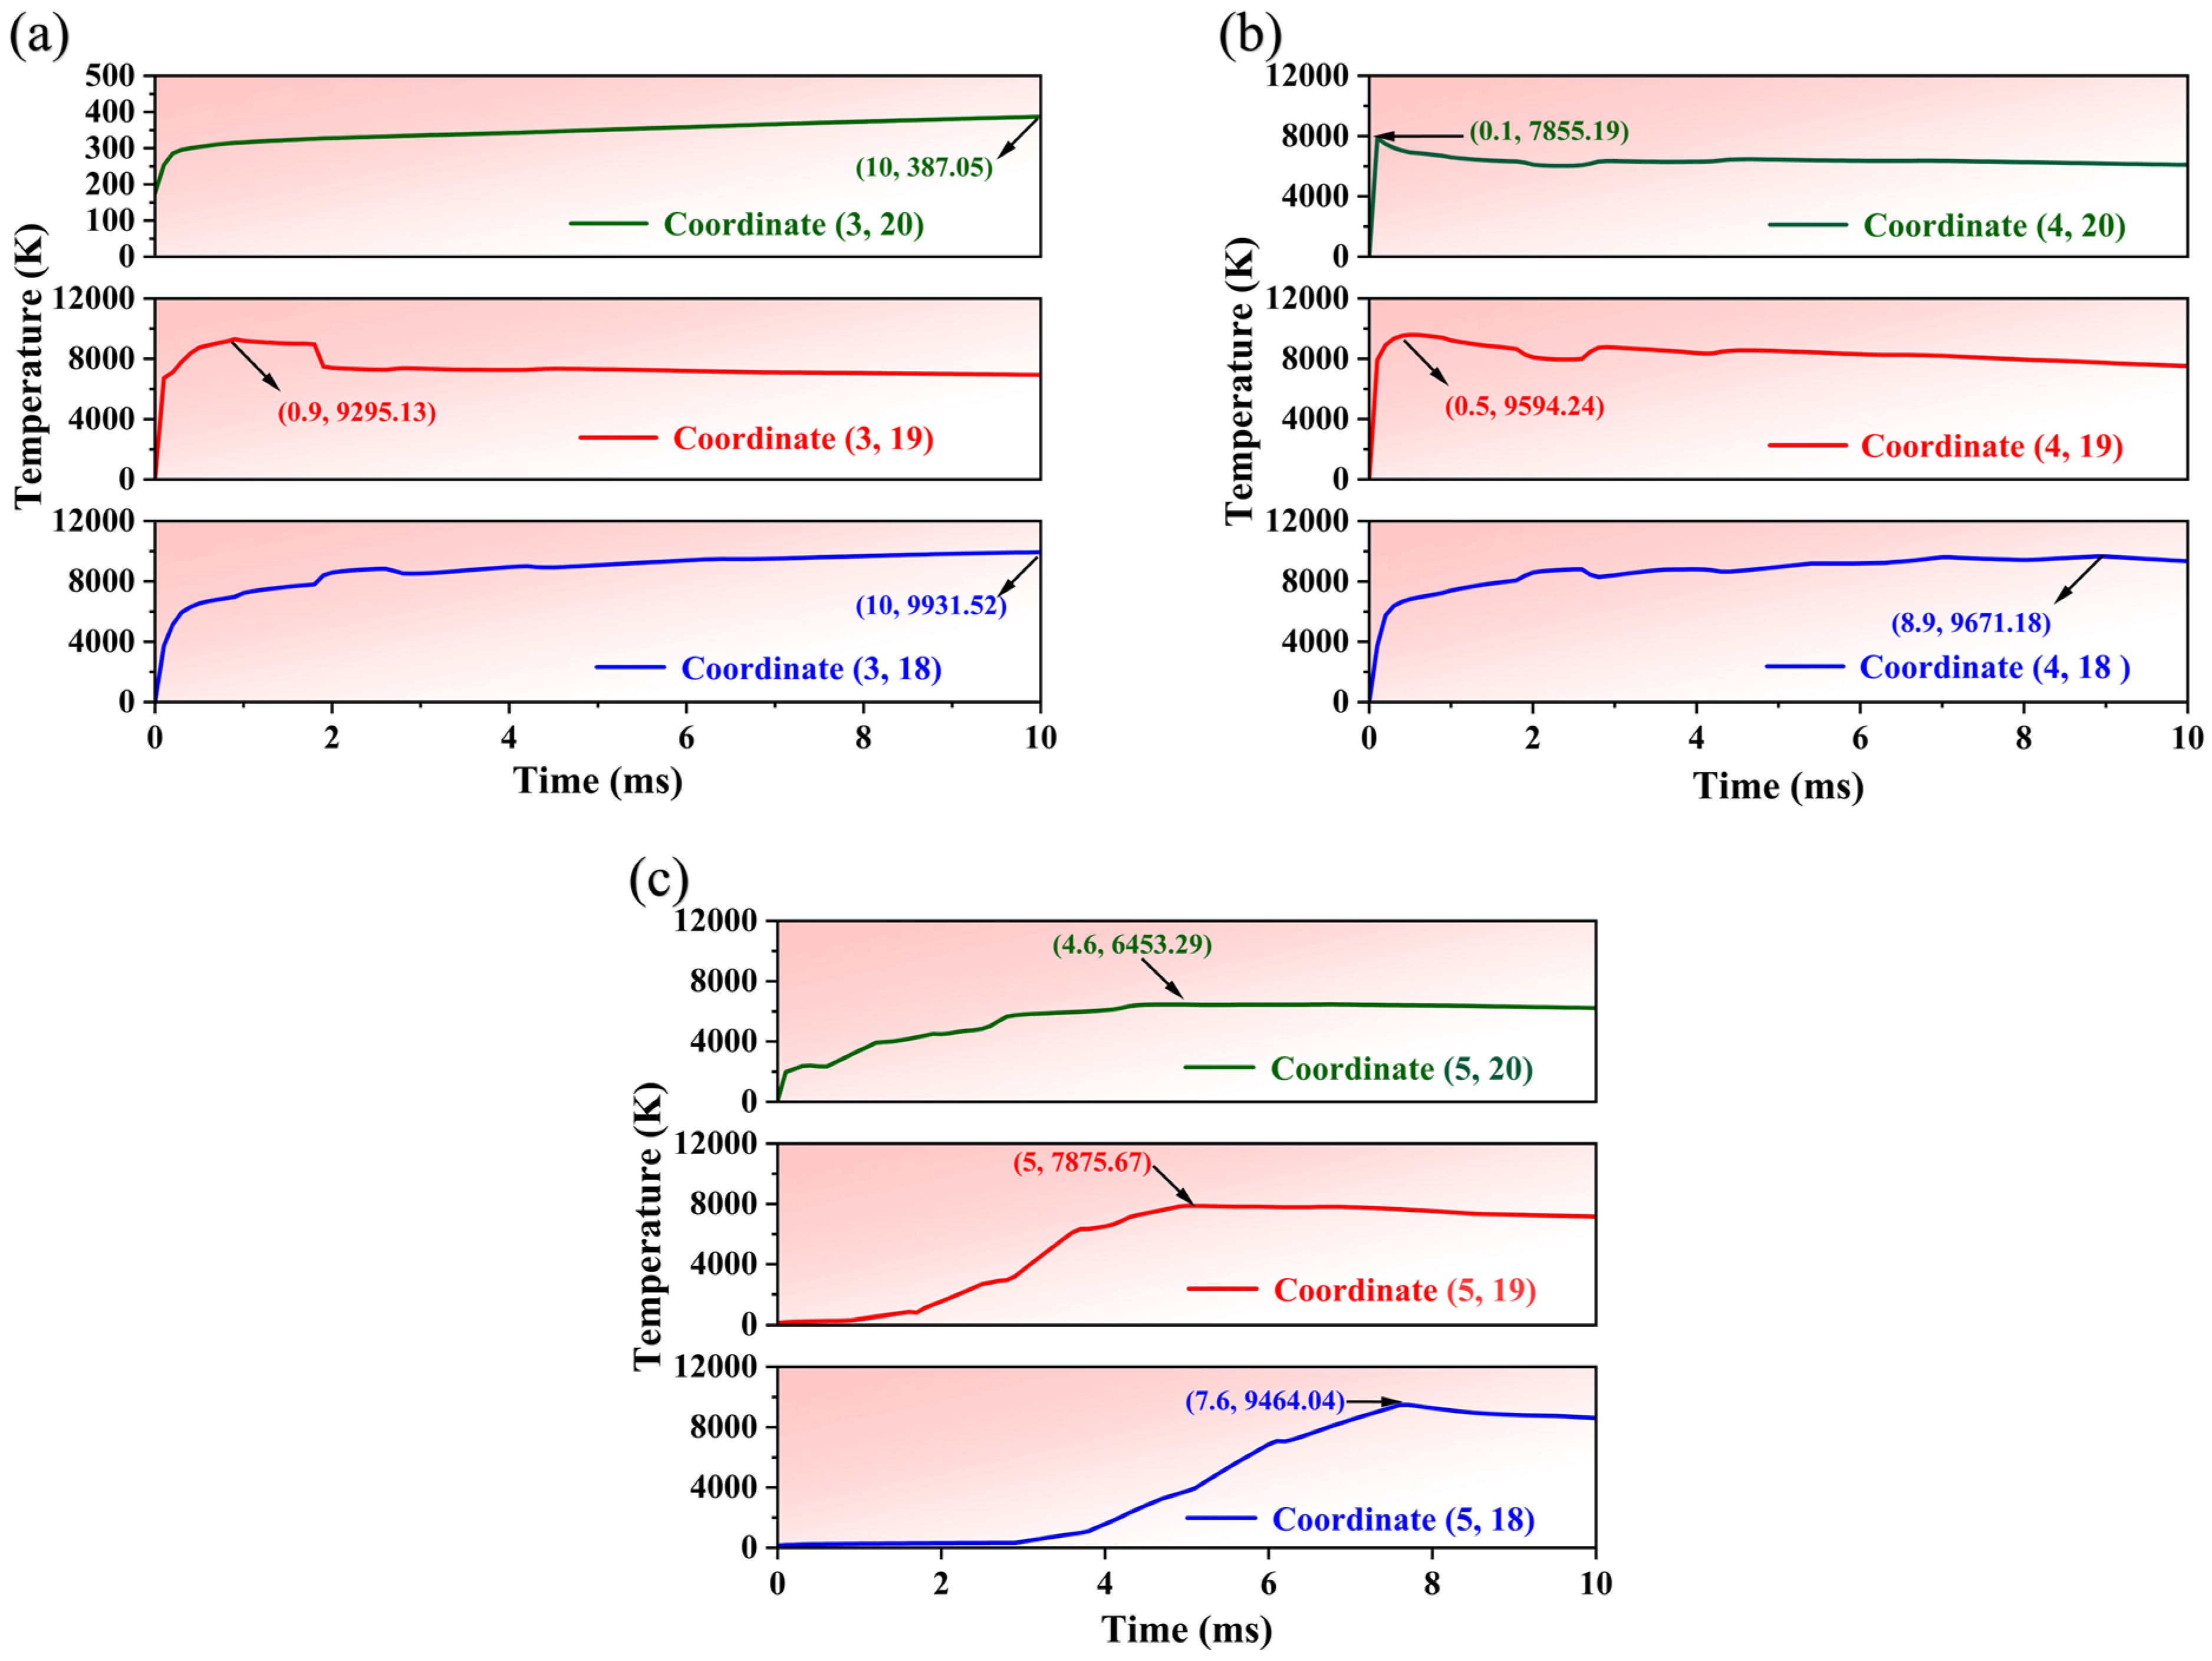
To better observe the relationship between arc duration and arc temperature, time-sequential temperature data from the cathode region, arc column region, and anode region within the arc-affected area are extracted through numerical simulation, as indicated by the coordinates in Figure 7.
Based on coordinate point data, temperature–time variation curves are plotted in Figure 8. The results indicate that the curves in Figure 8a represent data collected from sampling points near the anode region. From the curves corresponding to coordinates (3, 18) and (3, 19), it can be seen that arc generation occurred in this region, as the curves exhibit a typical arc temperature rise pattern, with peak temperatures approaching 10,000 K. In contrast, the curve corresponding to coordinates (3, 20) exhibits a lower temperature because it is located outside the arc occurrence zone, within the normal air domain. Moreover, the anode arc does not shift with the movement of the contact pin. The subsequent temperature increase at this point is attributed to the thermal diffusion effect radially spreading from the arc. In Figure 8b, curves represent data collected from sampling points near the core region of the arc. The curve at coordinates (4, 18) shows a monotonically rising temperature trend, with an arc temperature of up to 9671 K. The unchanged position of the anode arc during the movement of the contact column causes continuous energy deposition, which leads to a persistent increase in temperature. In contrast, the curves represented by coordinates (4, 19) and (4, 20) demonstrate cyclic temperature fluctuations characterized by repeated increase–decrease sequences. This alternating peak–valley behavior is caused by dynamic arc migration induced by electrode displacement. Figure 8c shows the sampling point located near the cathode region. The corresponding curve indicates a forward shift in the arc ignition timing over time, with the initial arcing duration shortening from 3 ms to less than 1 ms. Meanwhile, the maximum arc temperature decreases from approximately 9000 K to around 6000 K. The curve is obtained within the cathode arc region, and the significant rise in arc temperature is attributed to the increased energy deposition density in the cathode area.

3.1.2. Electric Field Intensity Distribution

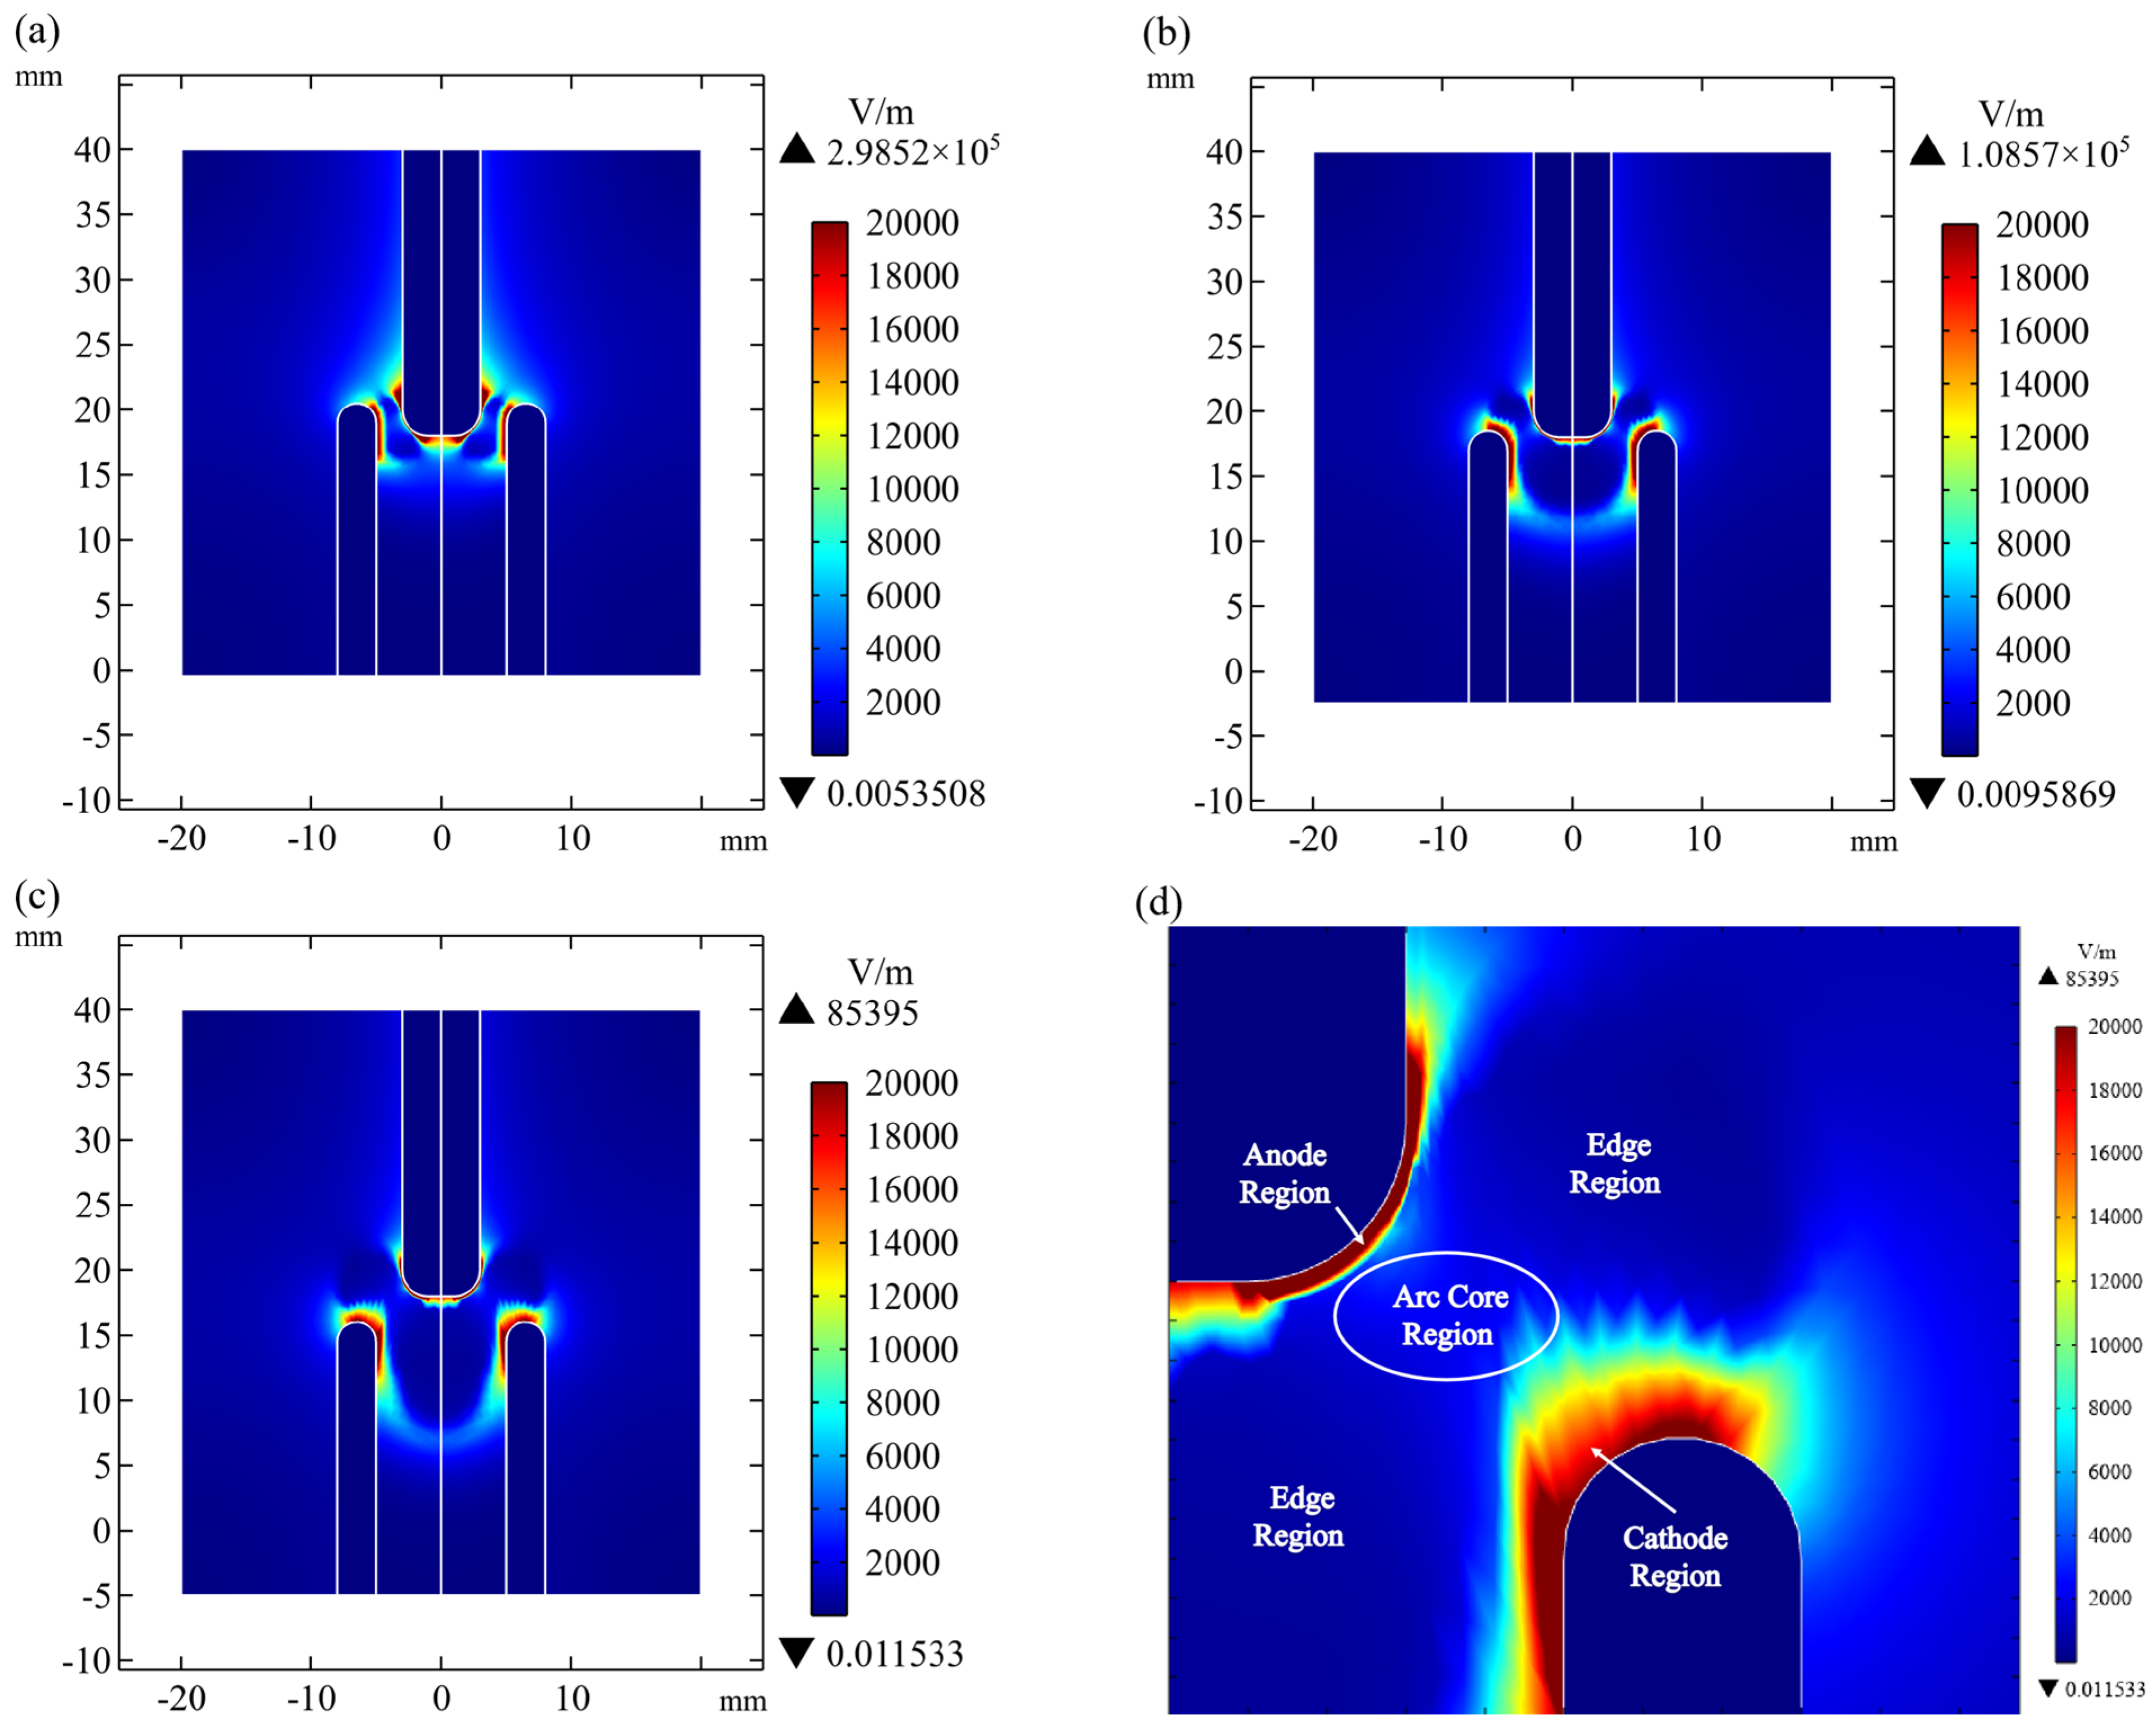
Based on the above arc temperature distribution cloud diagram, the electric field intensity and potential distribution characteristics are analyzed. Figure 9 illustrates the electric field intensity distribution within the arc region under a high voltage of 1000 V. To fulfill the structural feature analysis requirements, the entire arc is divided into three characteristic regions: bipolar region, the arc column core region, and the arc column edge region.
As shown in the simulation results in Figure 9, the electric field intensity is highest in the bipolar region, where a high concentration of the field occurs near both electrodes. The maximum electric field strength, reaching 3.02 × 10⁵ V/m, is observed in the cathode region. In the arc column core region, especially near the pole area, the current transport is realized by ionizing the gas or arc channel, as the gas has already been ionized and transformed into a charged plasma. Due to the extremely high conductivity of the plasma [33], the electric field is rapidly dispersed and neutralized as current flows, leading to a sharp decline in electric field strength [34]. As a result, the arc column exhibits weak field distribution characteristics, with the electric field strength falling below 5 × 10³ V/m, thereby forming a low-field intensity region. The edge region is the area between the arc column region and the surrounding gas, and its electric field intensity shows a gradual downward trend and eventually equalizes the intensity of the surrounding gas. Outside the arc edge region, the field strength of the outer edge reaches a dynamic equilibrium with the background gas medium, but the arc radiation energy will lead to the ionization of the surrounding gases and the formation of plasma.

3.1.3. Potential Distribution

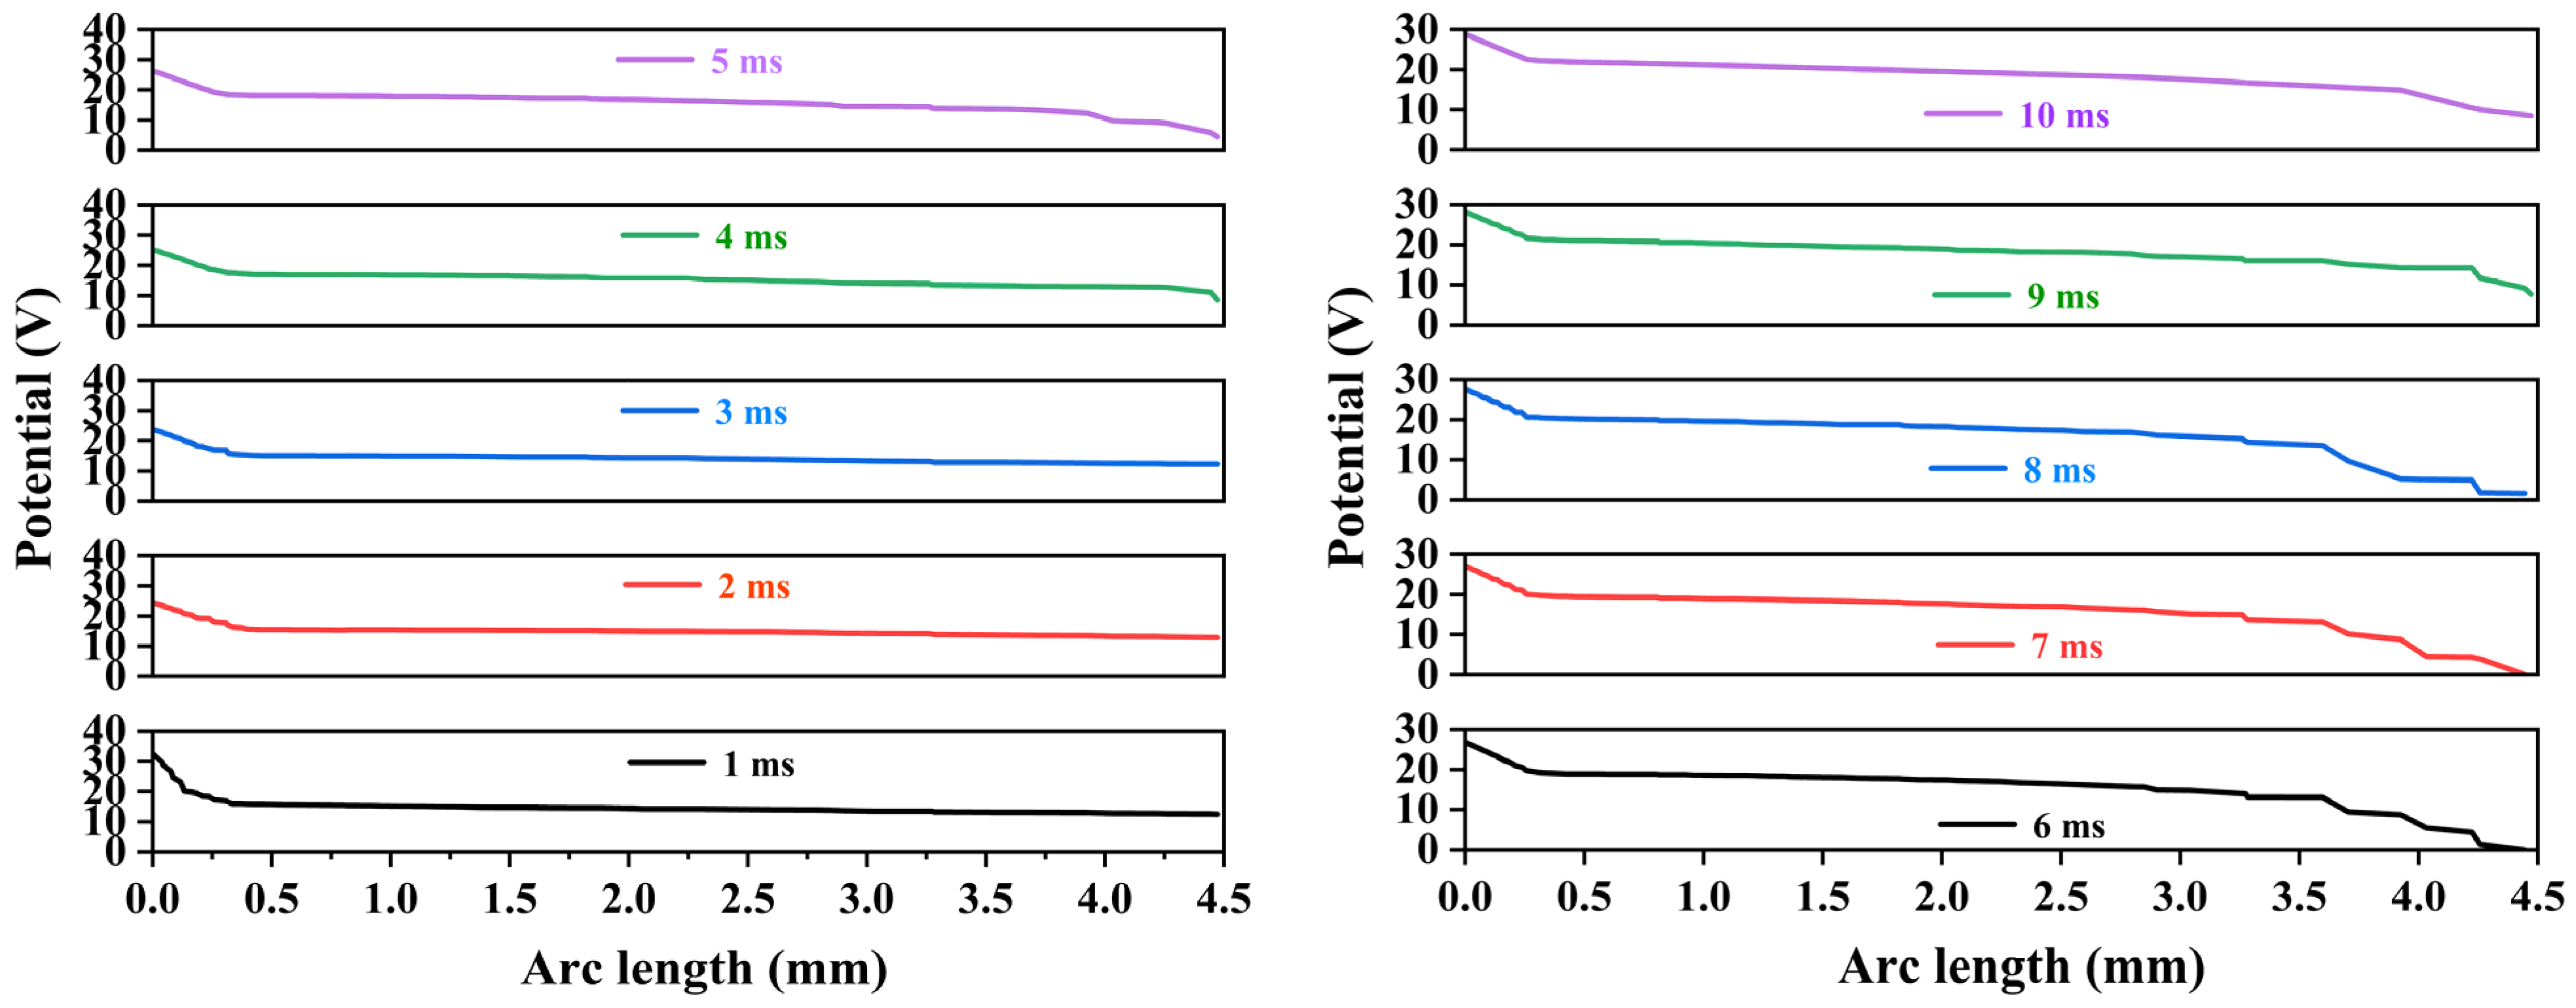
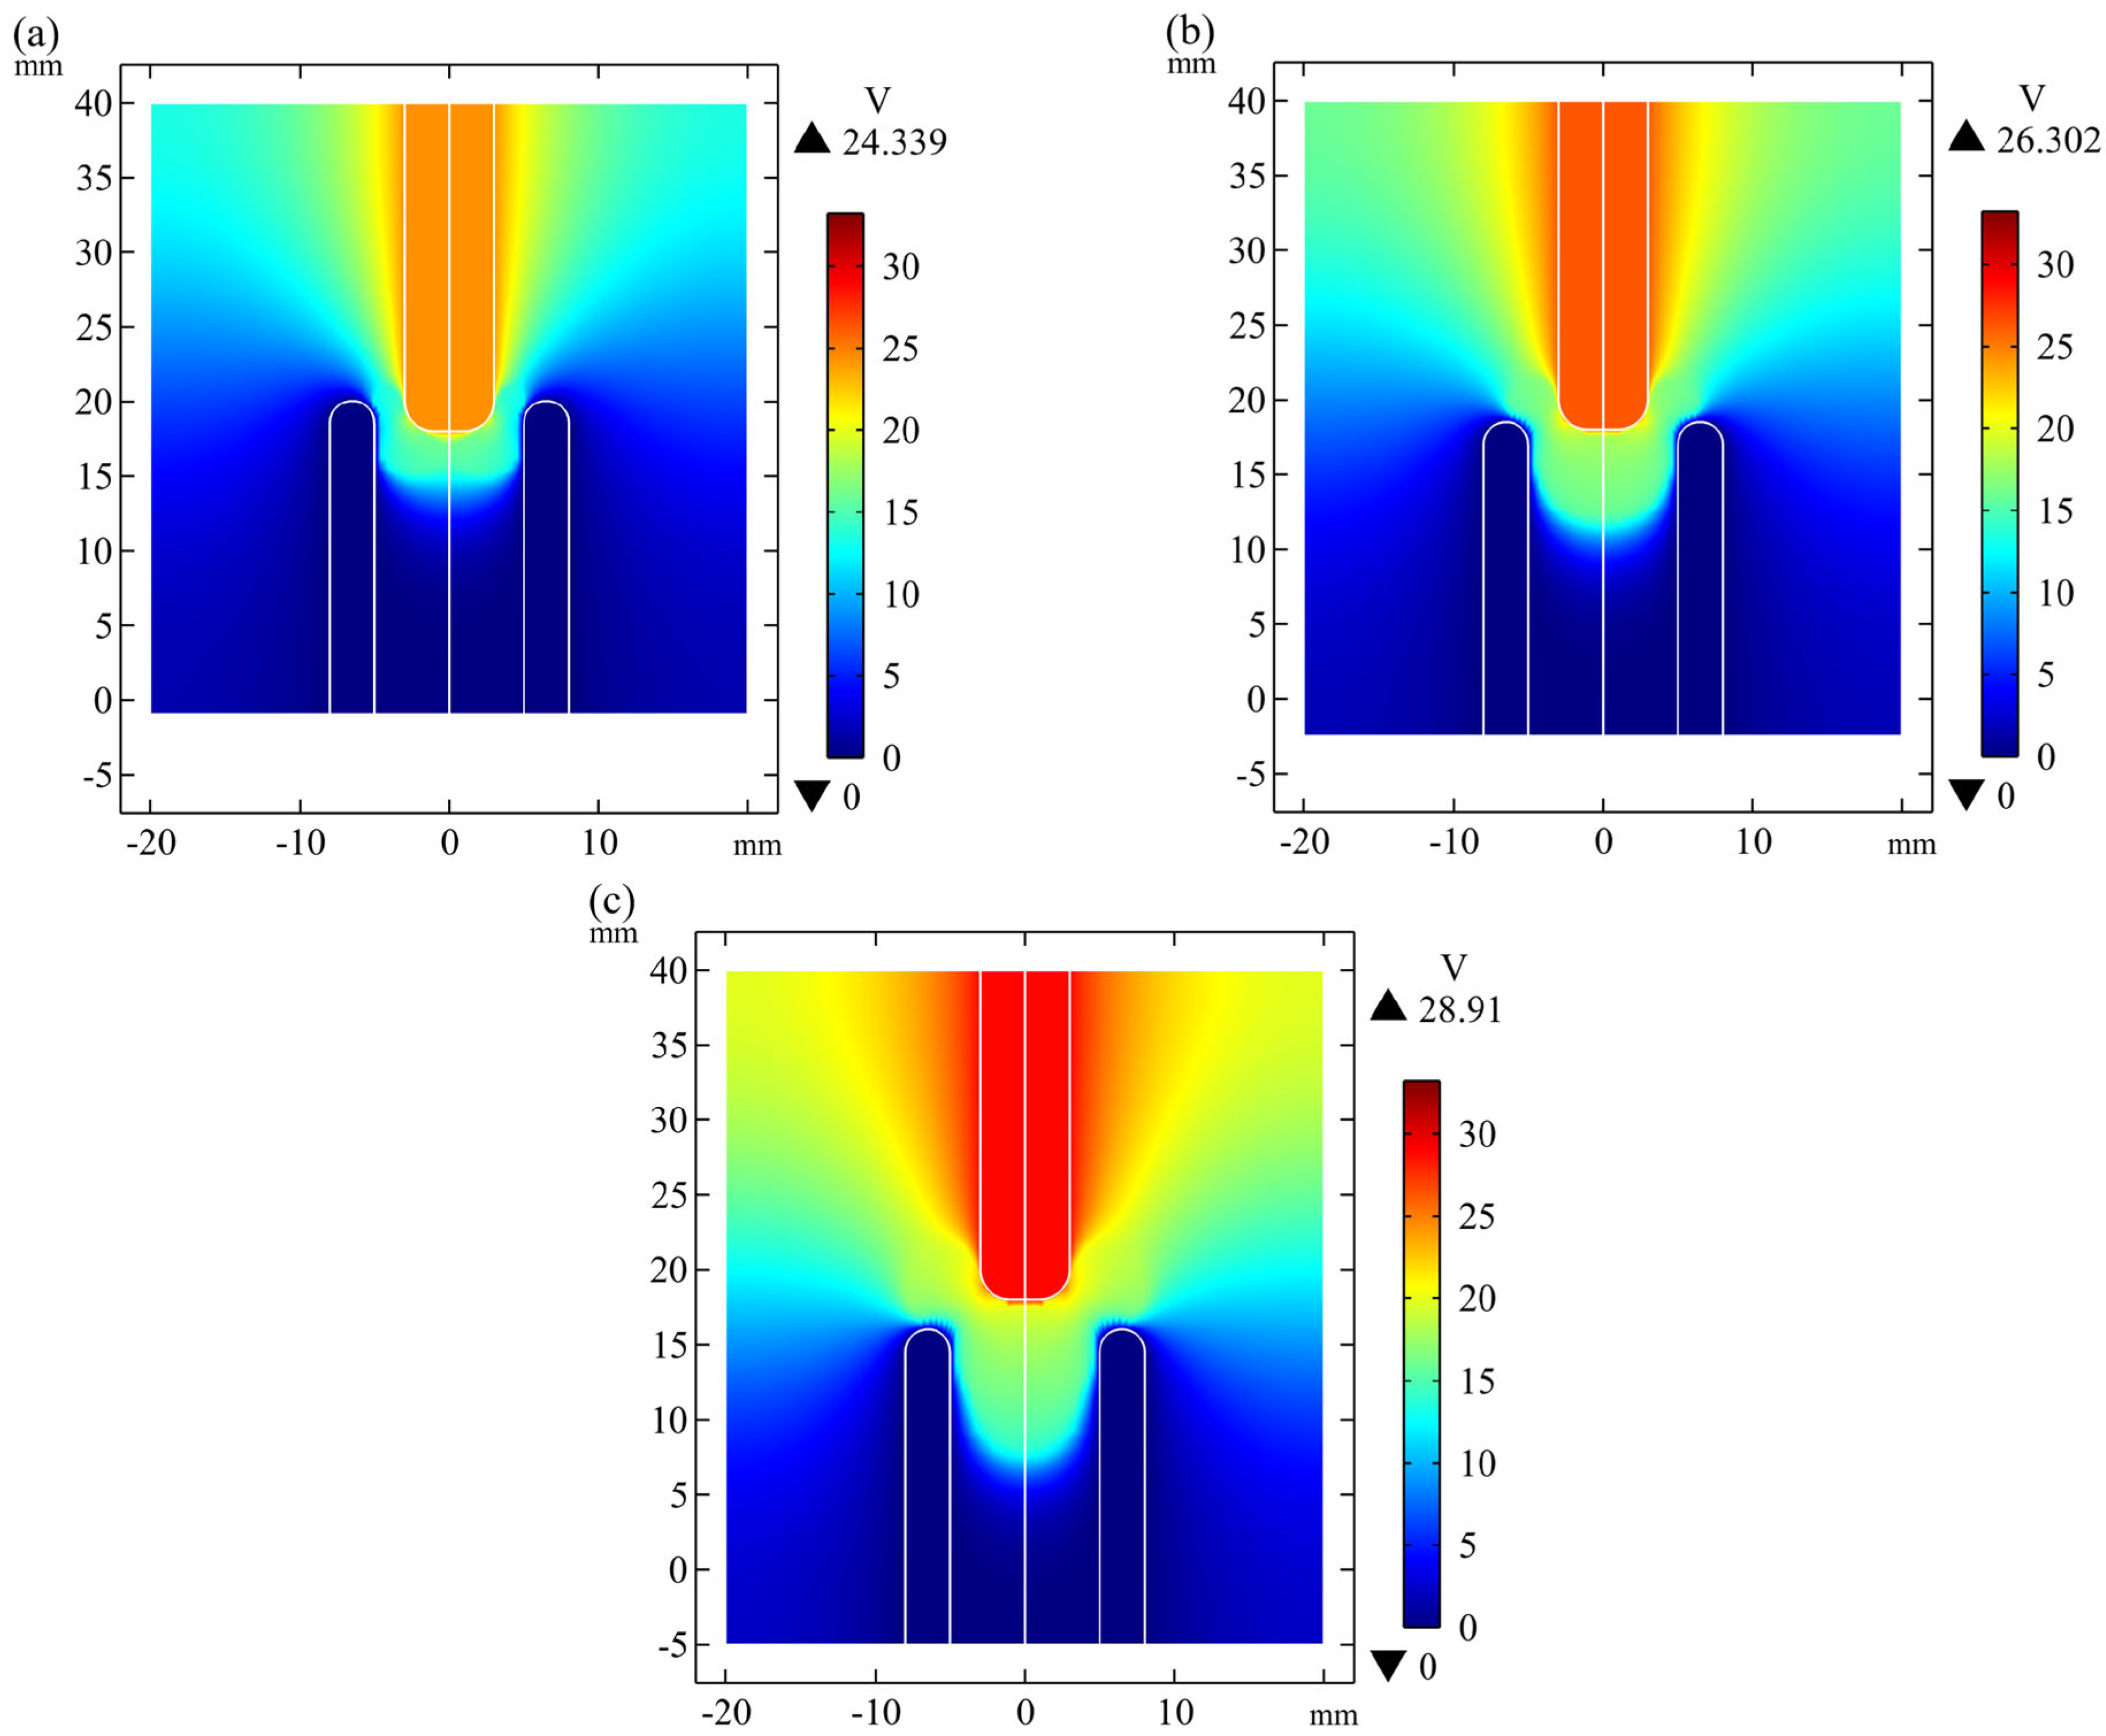
Figure 10 and Figure 11 respectively show the cloud map of the electric potential distribution under a high voltage of 1000 V and the evolution of the electric potential with arc length. The results indicate that, based on the cathode zero potential boundary condition, the potential gradient exhibits axially increasing distribution from cathode to anode. As the arc separation process progresses, the overall electric potential in the arc region increases from 15 V to 20 V, representing an increase of about 30%. At the center of the anode, the equipotential lines are densely distributed, and the potential reaches a maximum value of 28.9 V at the interface between the anode and the center of the arc column. The electric potential here is only 30 V because the arc core temperature is extremely high, reaching tens of thousands of K, which intensely ionizes the gas and forms a highly conductive plasma. This indicates that only a very low voltage is needed to sustain a large current [35]. Secondly, it is due to the clamping effect of the arc [36,37]—once the air gap breaks down and the arc forms, the voltage across the arc is immediately clamped to a very low value. As long as the arc exists, the voltage across it is determined solely by its length and the medium.

3.1.4. Magnetic Field Distribution

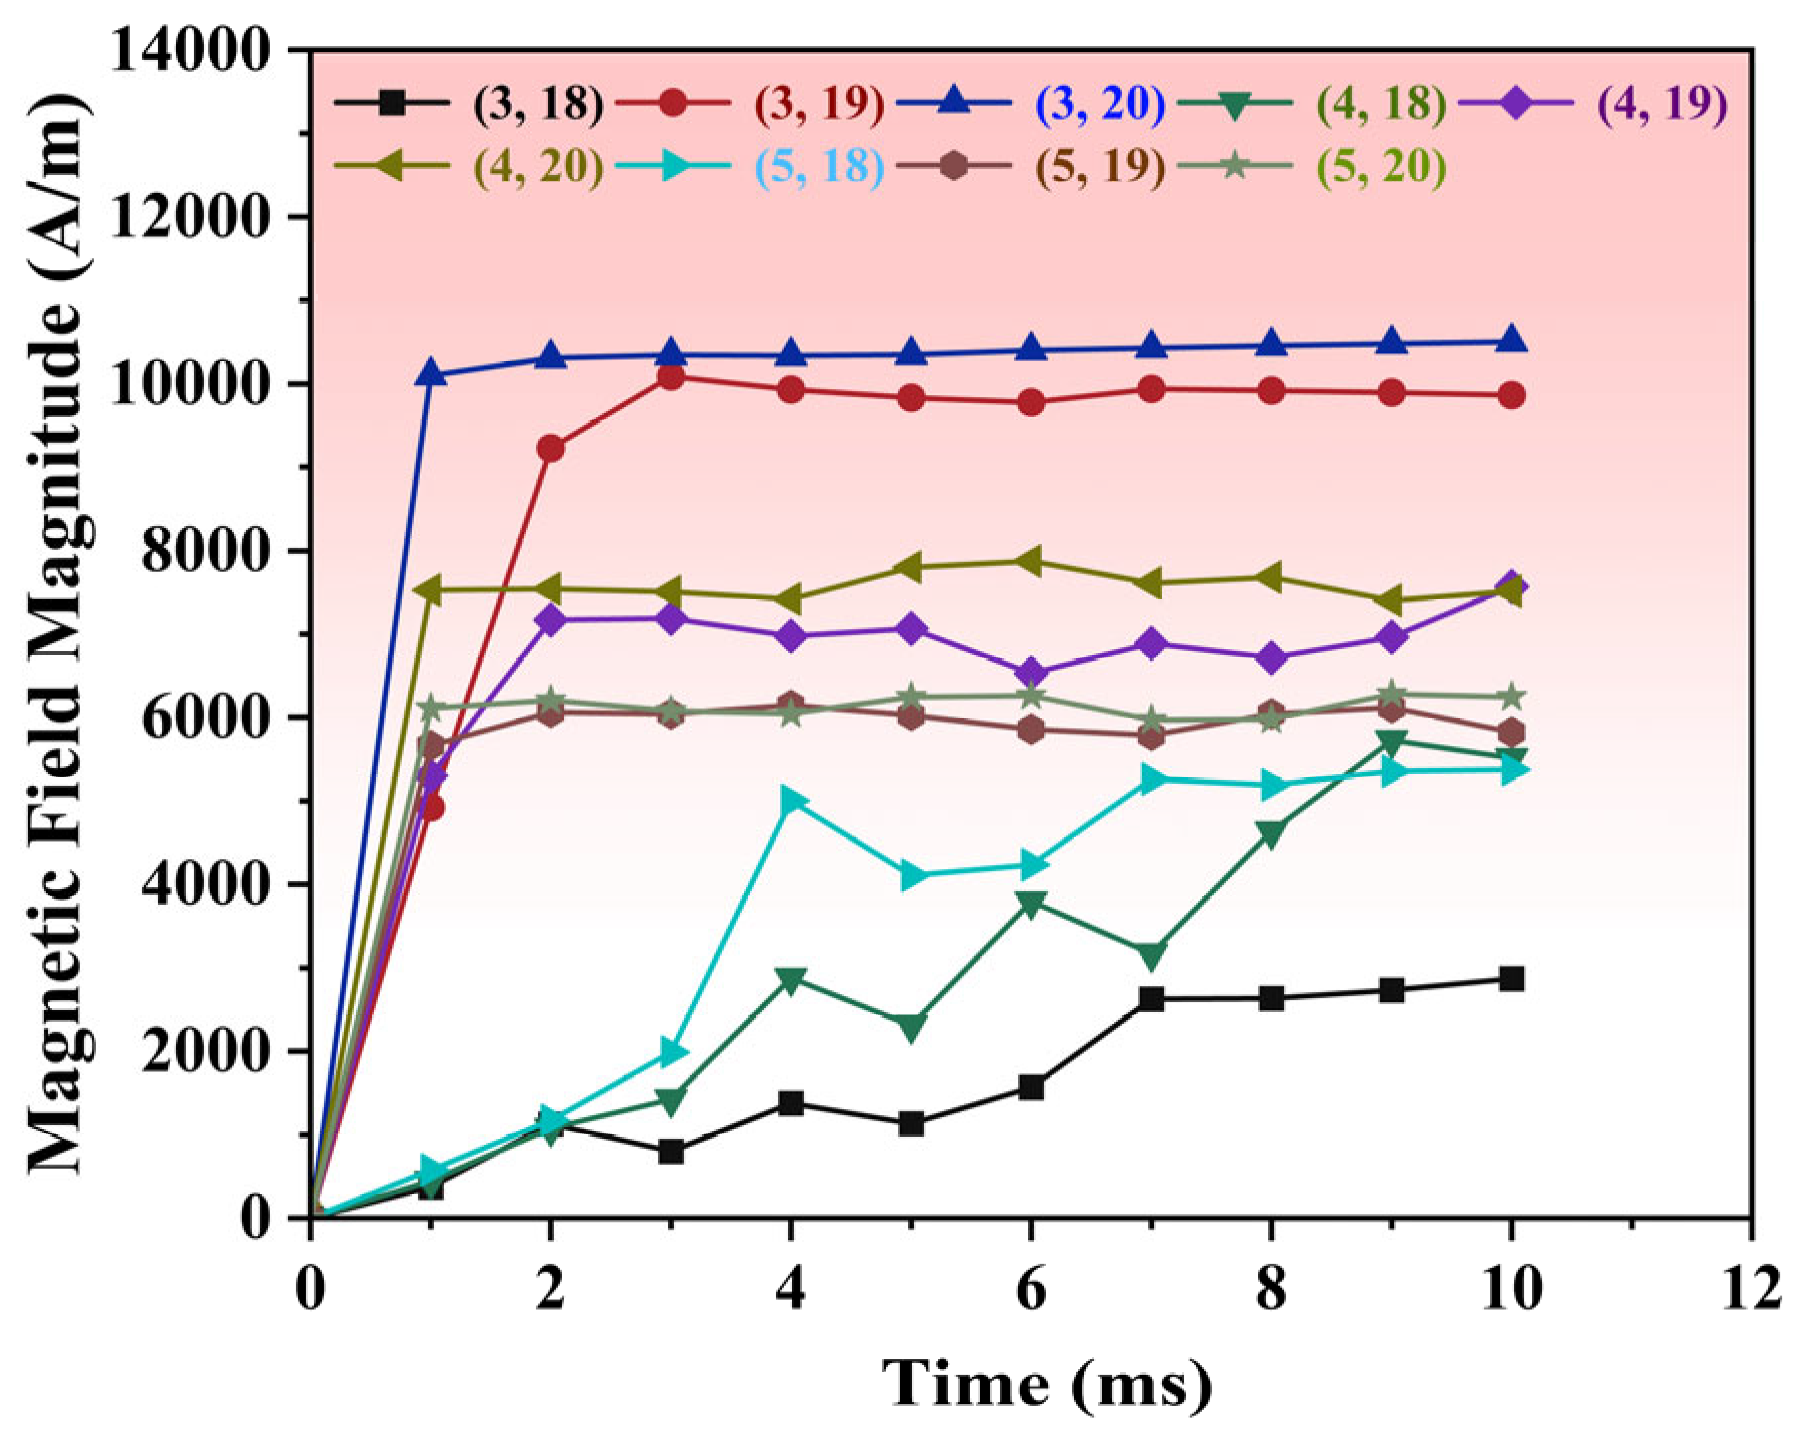
Figure 12 shows the variation in the magnetic field over time. From the analysis of the temporal evolution of the magnetic field magnitude at different spatial locations, it can be seen that the arc magnetic field is rapidly established within 1 ms and subsequently enters a relatively stable dynamic distribution stage. The spatial distribution of the magnetic field magnitude exhibits significant non-uniformity: the magnetic field magnitude is highest in the anode region (coordinates (3, 19) and (3, 20)), while it is lower in the cathode region. This distribution characteristic is clearly correlated with the arc temperature field and the electric field intensity distribution. In the anode region, the high density of energy deposition due to electron collisions, combined with the concentration of electric field intensity, leads to a locally high current density, thereby generating a stronger magnetic field response. In the cathode region, the magnetic field magnitude increases with arc duration, indicating enhanced energy accumulation and a corresponding rise in current density in the cathode region during the arc sustainment process.

3.1.5. Current Density Distribution

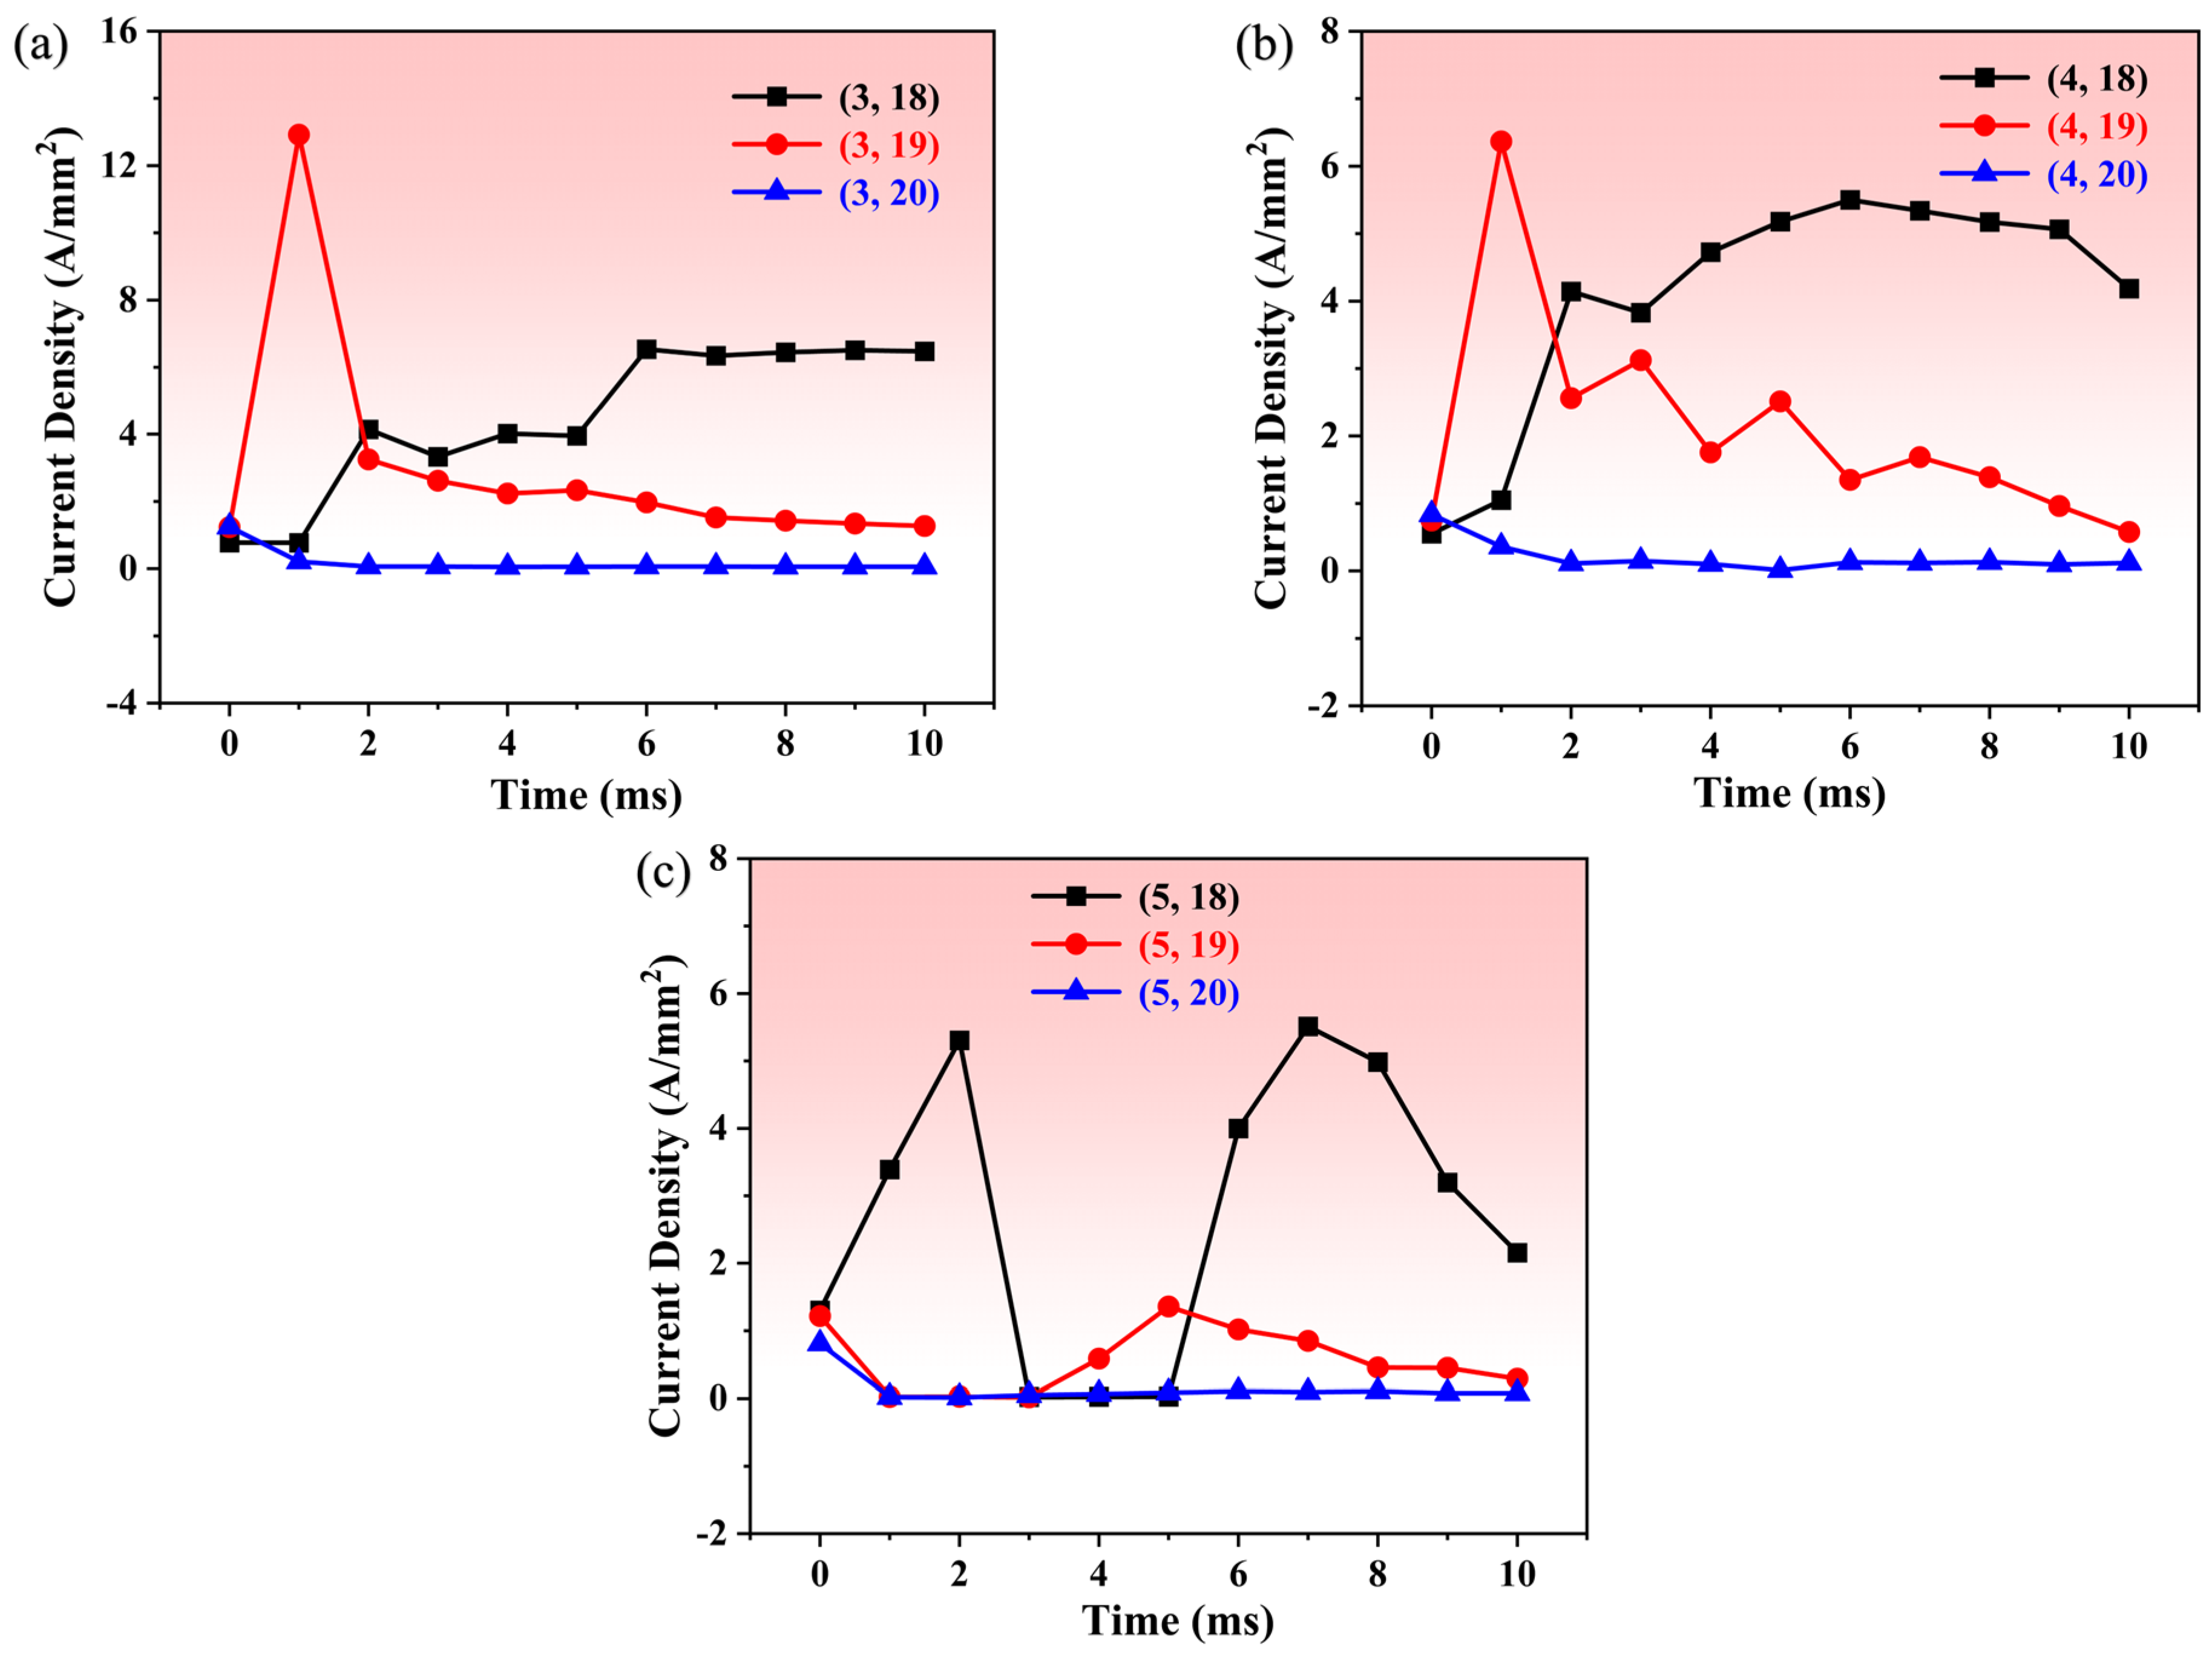
Figure 13 shows the variation in current density over time. The analysis reveals that the arc current is highly concentrated in three regions, the anode center, the arc column core, and the cathode center, while the current density at adjacent points is significantly lower, indicating that the arc channel exhibits a typical constriction characteristic. The decrease in current density in the arc core region is mainly attributed to the low electric field intensity in this region, along with the current diffusion effect caused by arc elongation and channel expansion. The current density in the cathode region shows considerable fluctuation, reflecting the time-varying characteristic of the spatial migration of the arc in the cathode region as it moves with the contact post after formation.

3.2. Temperature Response Under Different Voltages and Arc Gap Distances

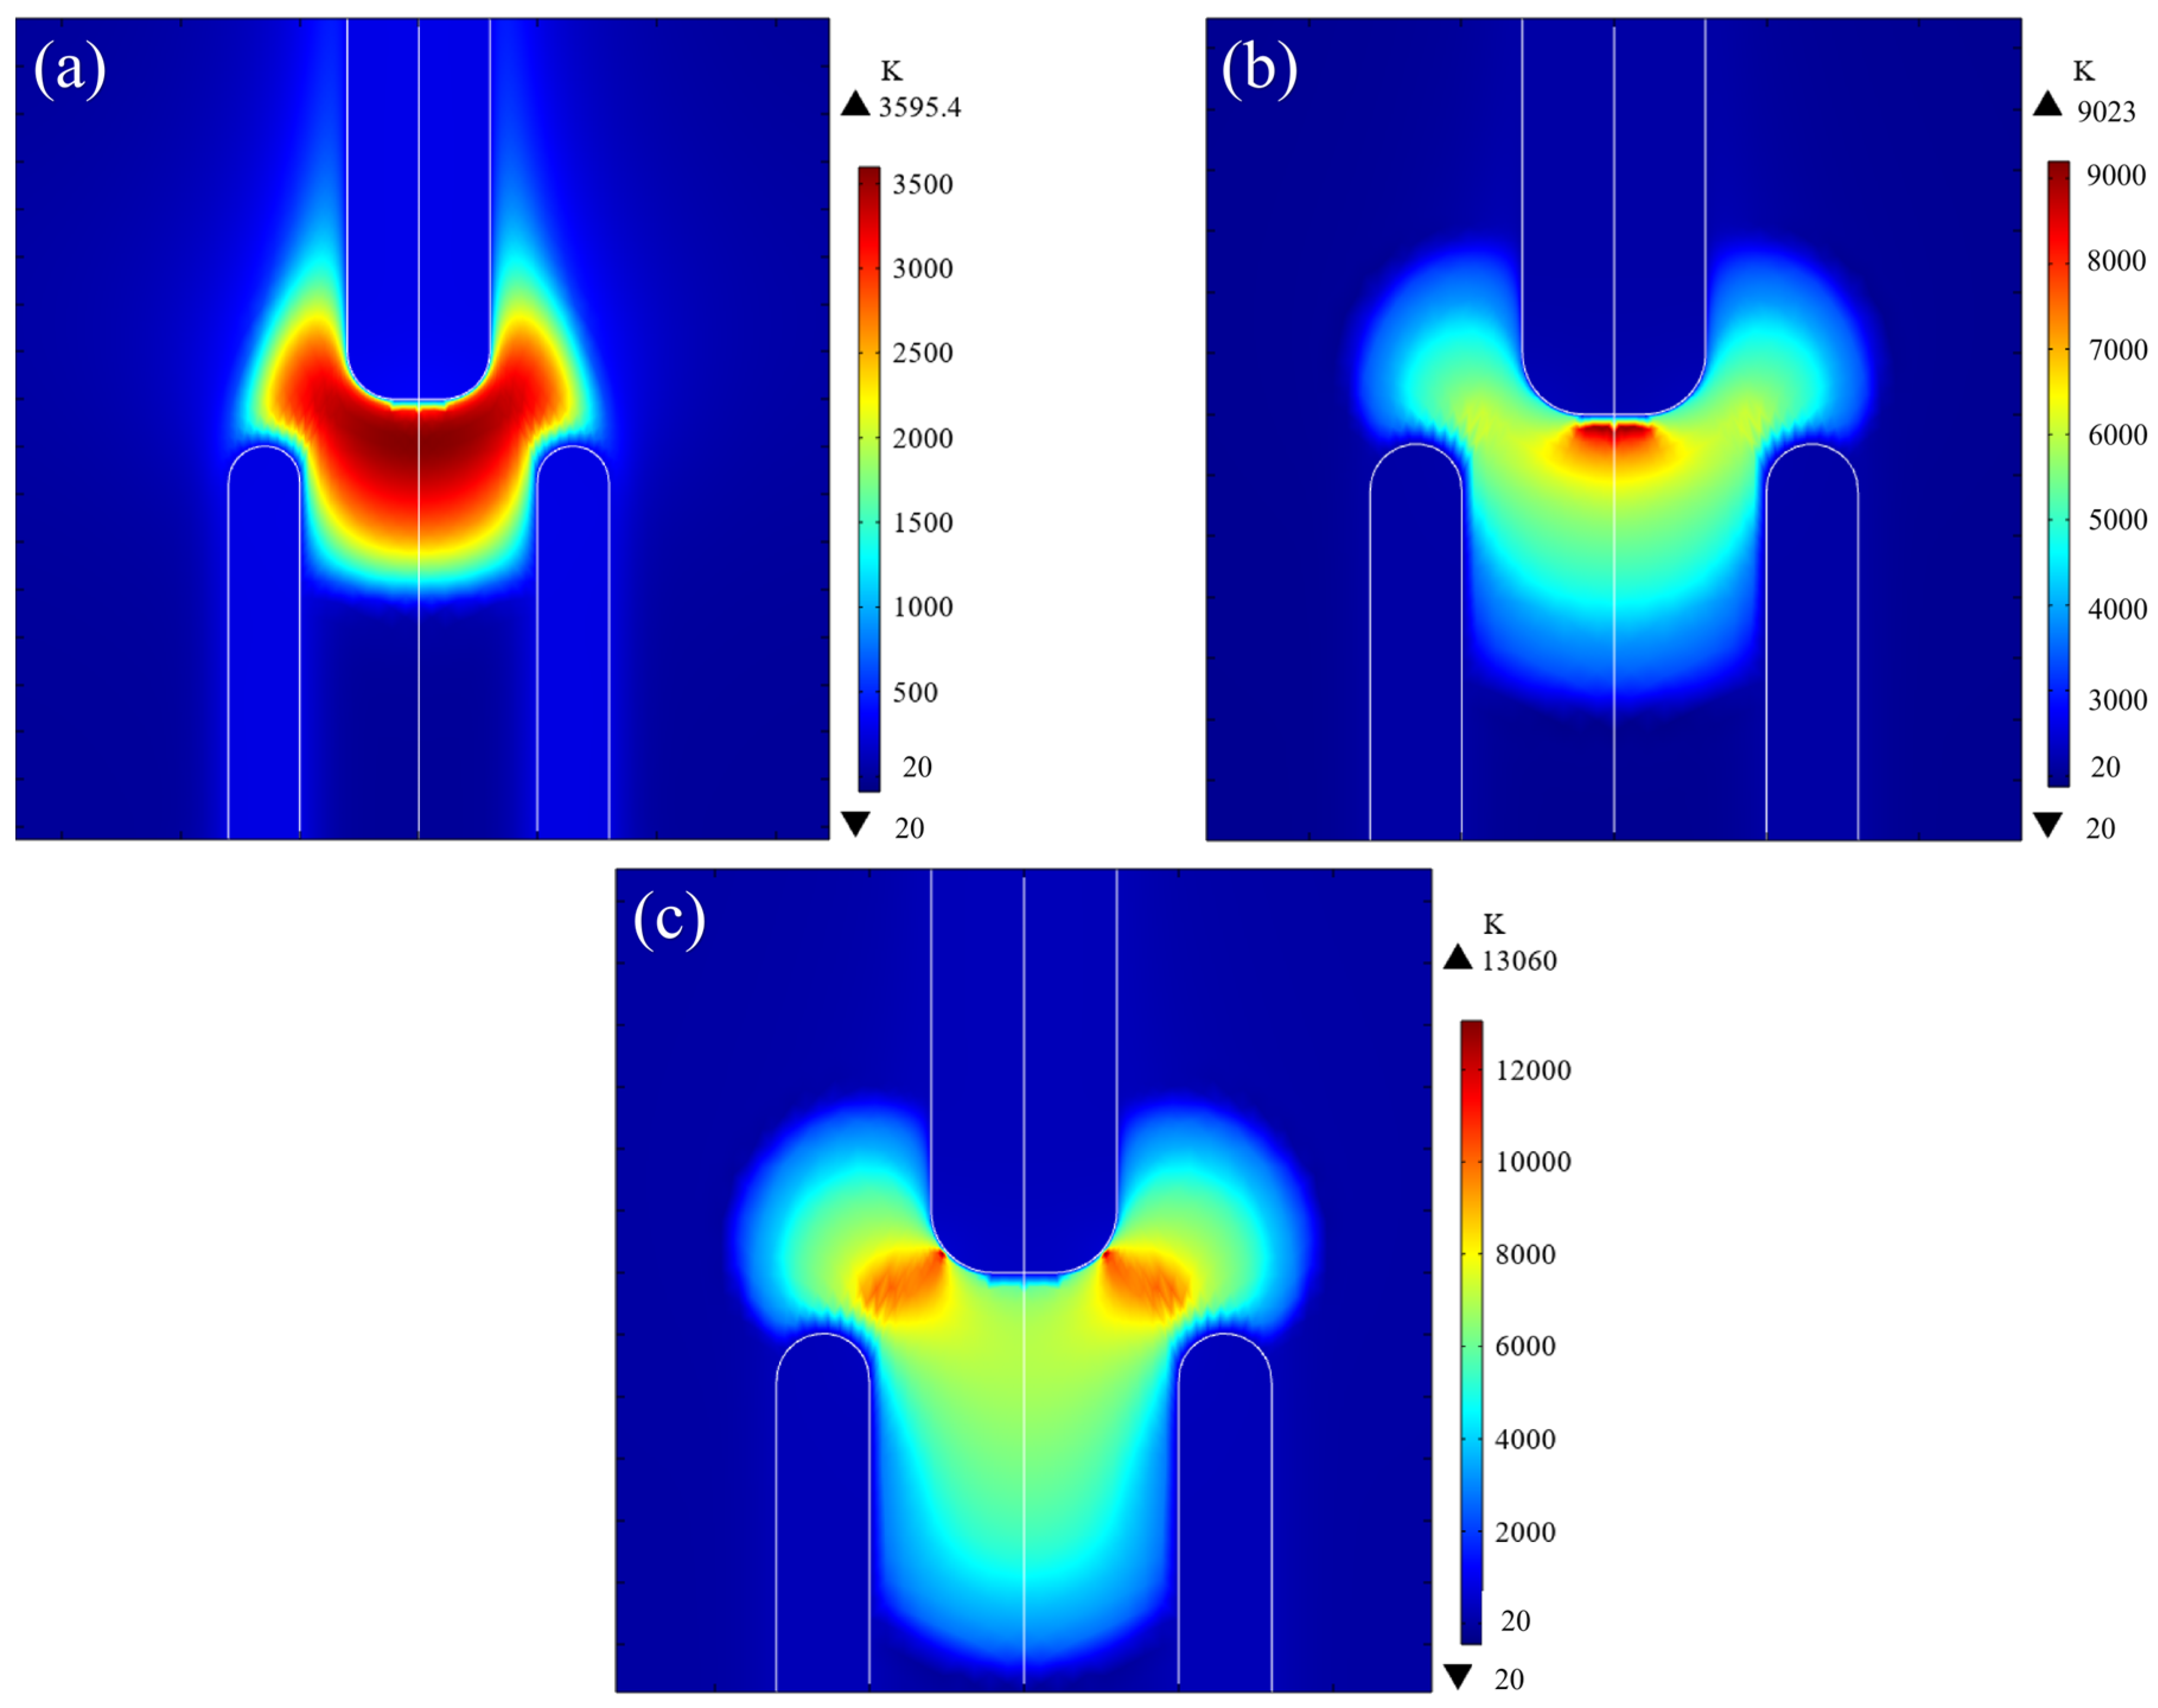
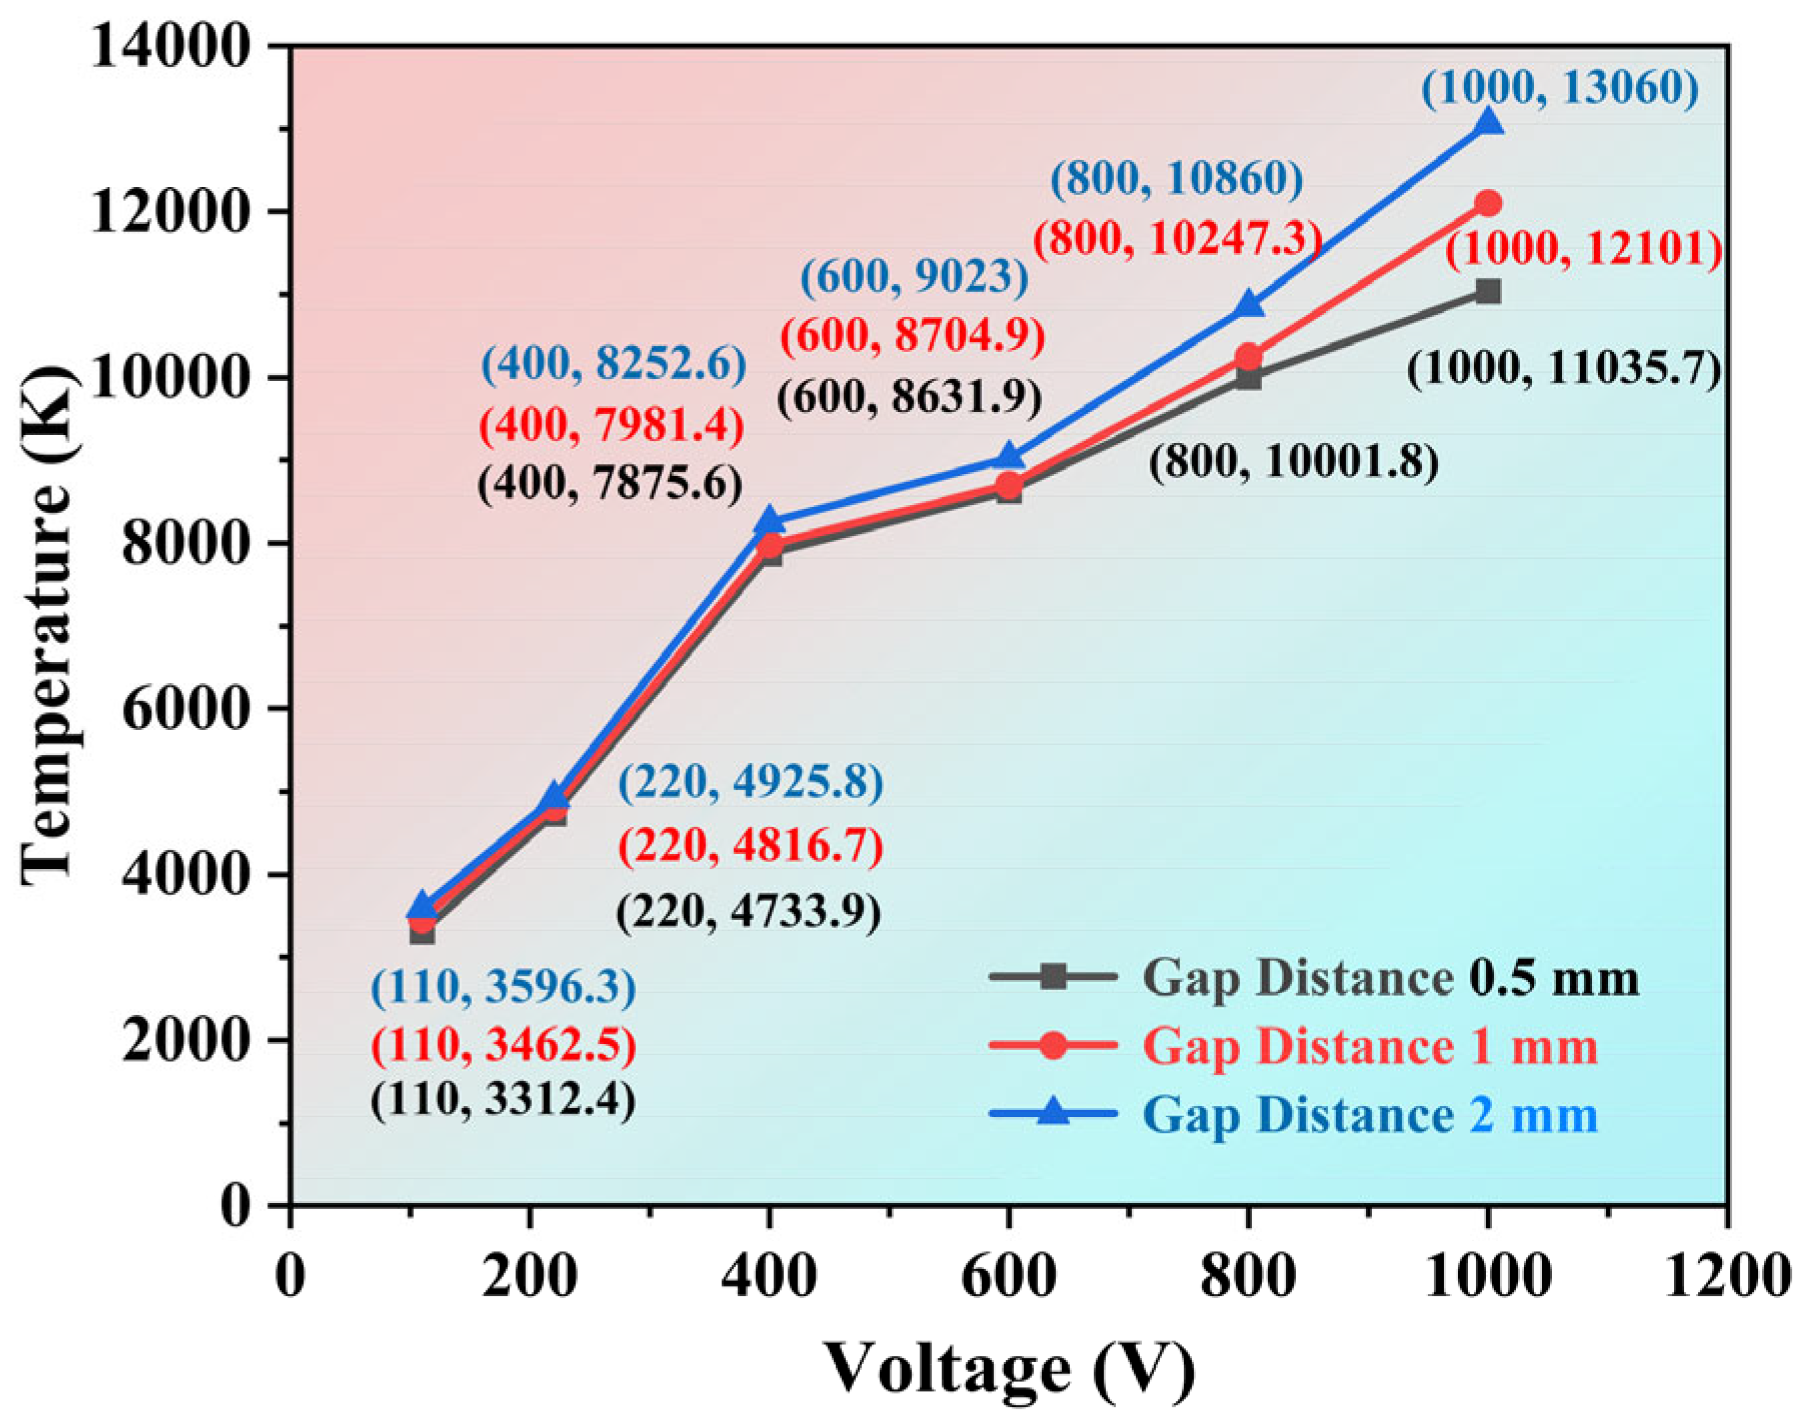
The arc temperature is found to vary with changes in voltage and gap distance. This study conducts arc simulation experiments under multi-parameter combinations of voltage (110, 220, 400, 600, 800, 1000 V) and gap distance (0.5, 1, 2 mm). The maximum temperatures under different voltages and gap distances are obtained and the simulation results are given. Figure 14 shows the temperature contour maps under different voltages, and Figure 15 presents a schematic diagram of the simulation results.
Figure 14 shows that the spatial distribution of the arc temperature varies significantly under different voltages. As the voltage increases, the arc column undergoes a self-constriction effect under the action of the current. At low voltages, the arc current is small, the constriction effect is not obvious, the arc is wider, and the peak temperature is more dispersed. At high voltages, the current increases, the arc column is compressed to a narrower diameter, and the current density rises significantly at the arc center, resulting in a higher peak temperature in the arc column core.
Figure 15 indicates the peak arc temperature distribution characteristics under varying operating voltages and arc gap distances. The results indicate that for a same arc gap distance, peak temperature increases markedly with rising voltage, exhibiting an approximately linear relationship. However, beyond 400 V, the temperature growth rate demonstrates significant attenuation. At voltages below 800 V, the peak temperature differences between gap distances of 0.5 mm and 1 mm are minimal, with a deviation of less than 5%. This is because when the voltage is below 800 V, the maximum arc temperature is significantly influenced by the voltage, while the variation in arc gap distance has minimal effect on the temperature change. A noticeable variation in maximum temperature is only observed once the voltage exceeds 800 V. This can be attributed to more sensitivity of the arc voltage to gap variations, where the increase in equivalent arc power leads to a rise in temperature. However, the maximum arc temperature is still primarily governed by the voltage. Also, at the same operating voltage, increasing the arc gap leads to a slight rise in the maximum arc temperature, with a relative increase of approximately 2% to 8%.
As the voltage increases (from 110 V to 1000 V), the peak arc temperature rises monotonically and exhibits nonlinear saturation beyond 400 V, which is consistent with the experimental observations of Li et al. [18] They report a similar trend for low-voltage DC fault arcs. The saturation effect is also in agreement with the numerical study by Rong et al. [15], in which the arc temperature in air shows a reduced growth rate under high power input due to enhanced radiative cooling.

3.3. Temperature Response Under Varying Plugging/Unplugging Speeds

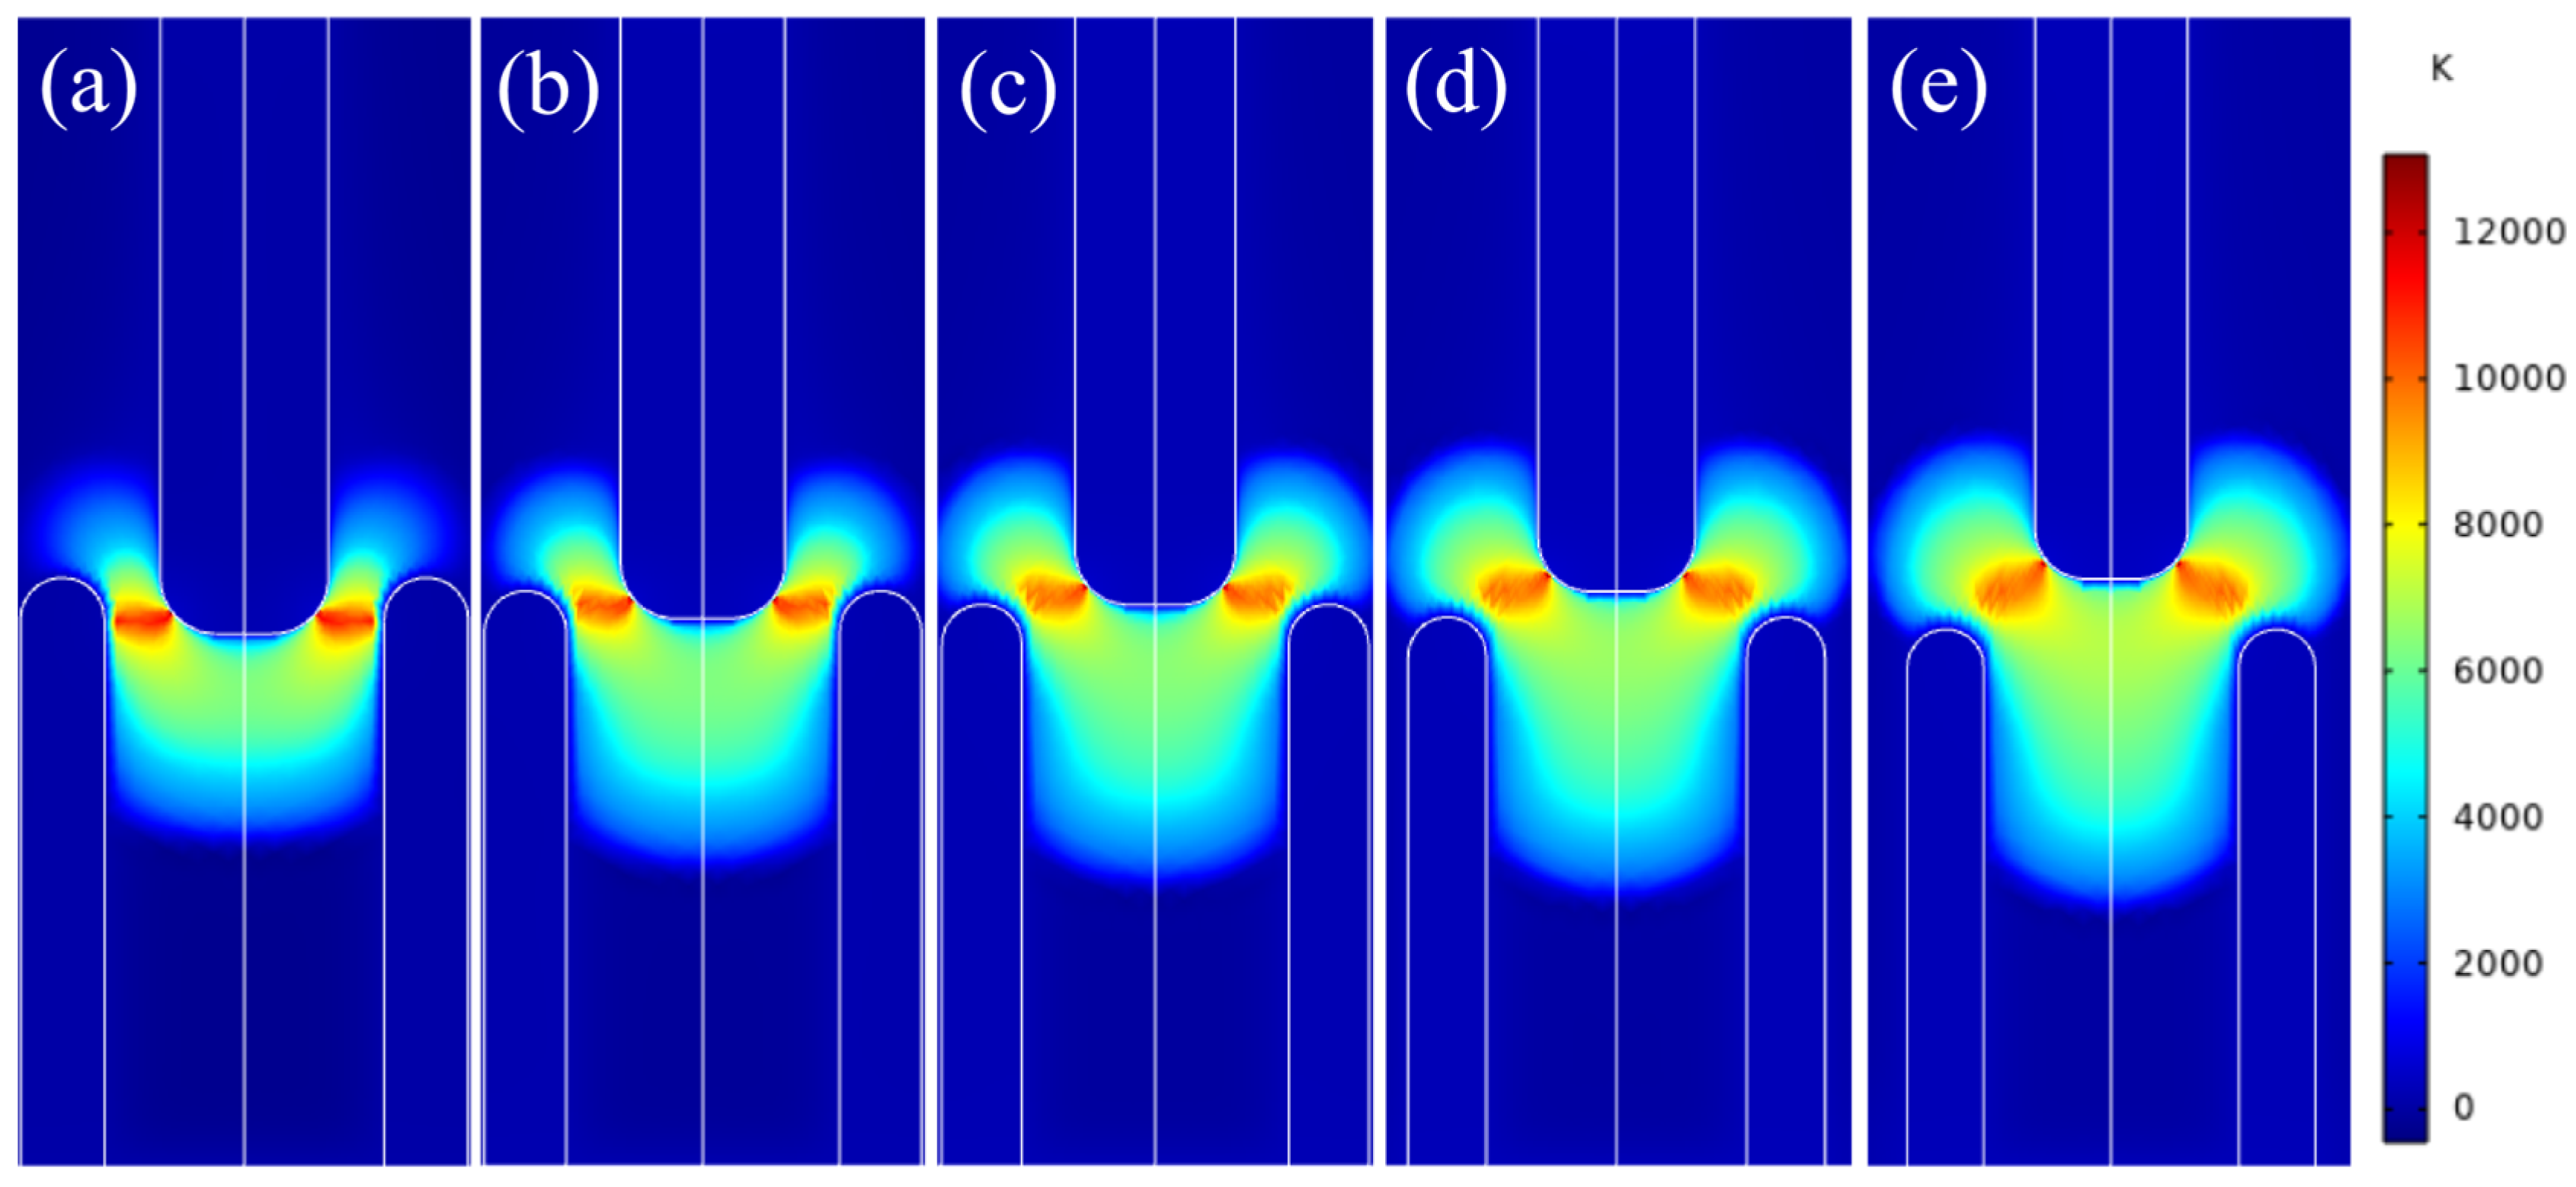
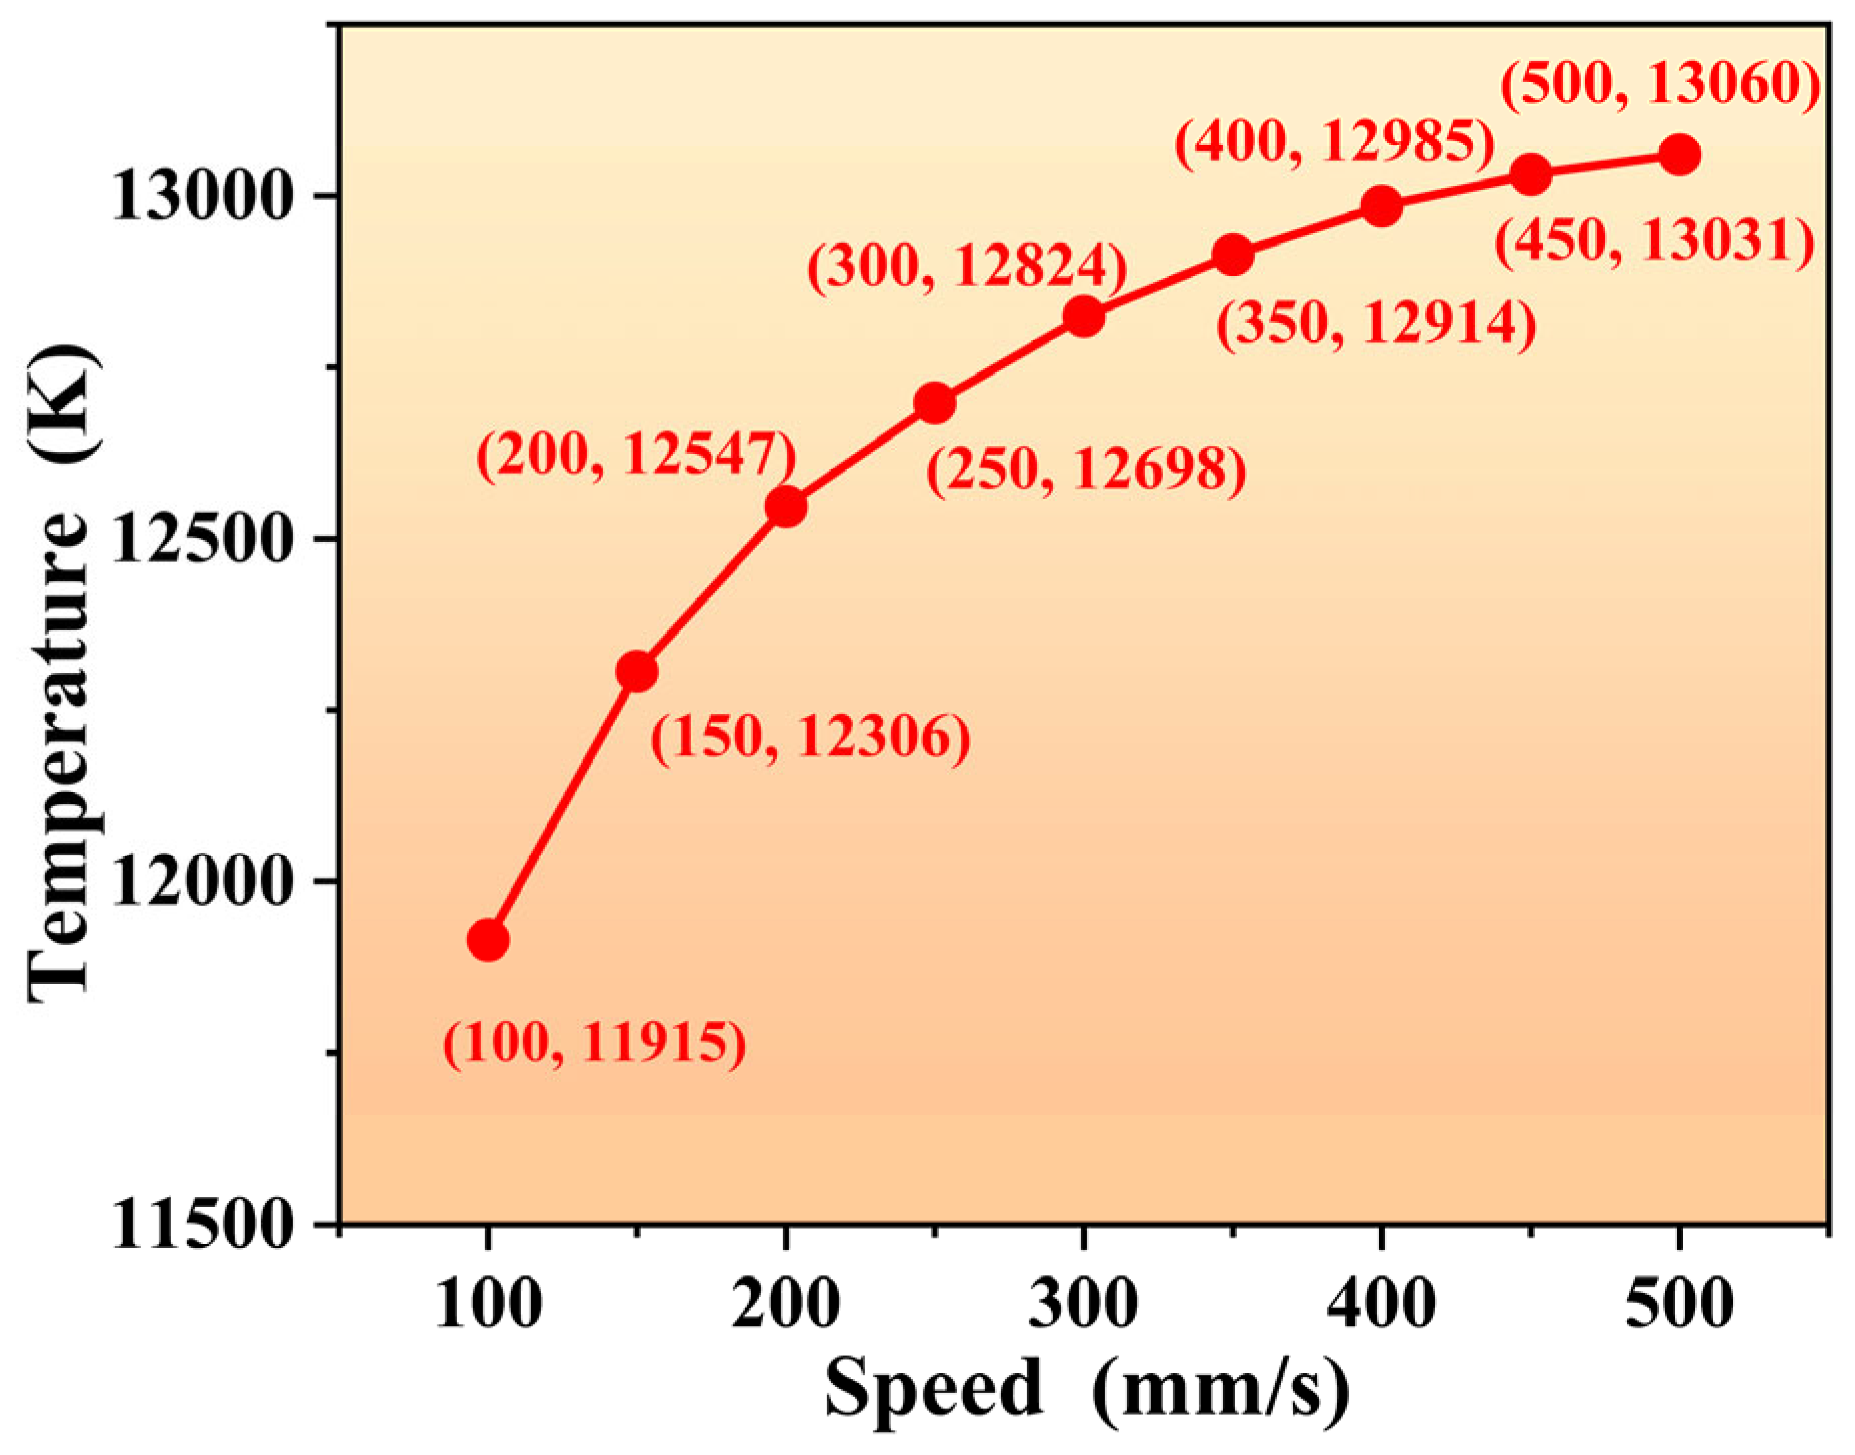
During the plugging/unplugging process of electrical connectors, the contact separation speed has a significant effect on the arc temperature distribution and the speed of separation greatly influences the service life of the connector. By simulating the temperature distribution under different motion speeds, a deeper understanding of how movement speed affects connector performance can be achieved. Figure 16 and Figure 17 respectively show the arc temperature distribution characteristics and the variations in peak temperature over time under different motion speed conditions.
As shown in Figure 17, when the moving speed is 100 mm/s, the arc distribution is relatively concentrated due to the low speed. As the moving speed increases, the diffusion effect of the arc is enhanced within the same time range, leading to a slower temperature rise trend. The peak temperature change is not significant, and the temperature rise rate decreases by approximately 50%. This phenomenon can be attributed to the following factors: lower moving speeds prolong the time of current passing through the contacts, resulting in a significant increase in current density at the contact point (J ≥ 8 × 10⁷ A/m2), which makes arc generation easier. Simultaneously, heat diffusion is limited, causing a sharp temperature rise. In contrast, higher plugging/unplugging speeds (v ≥ 300 mm/s) shorten the contact time, reduce the arc duration, and enhance outward heat diffusion, ultimately leading to a more gradual temperature rise trend in the arc column. This phenomenon is consistent with the experimental studies of Hornung et al. [3] and Sun et al. [4]. Both demonstrated that higher contact separation speeds reduce arc duration and energy deposition due to increased arc length and convective cooling.

3.4. Influence of Arc Burning Duration on Temperature

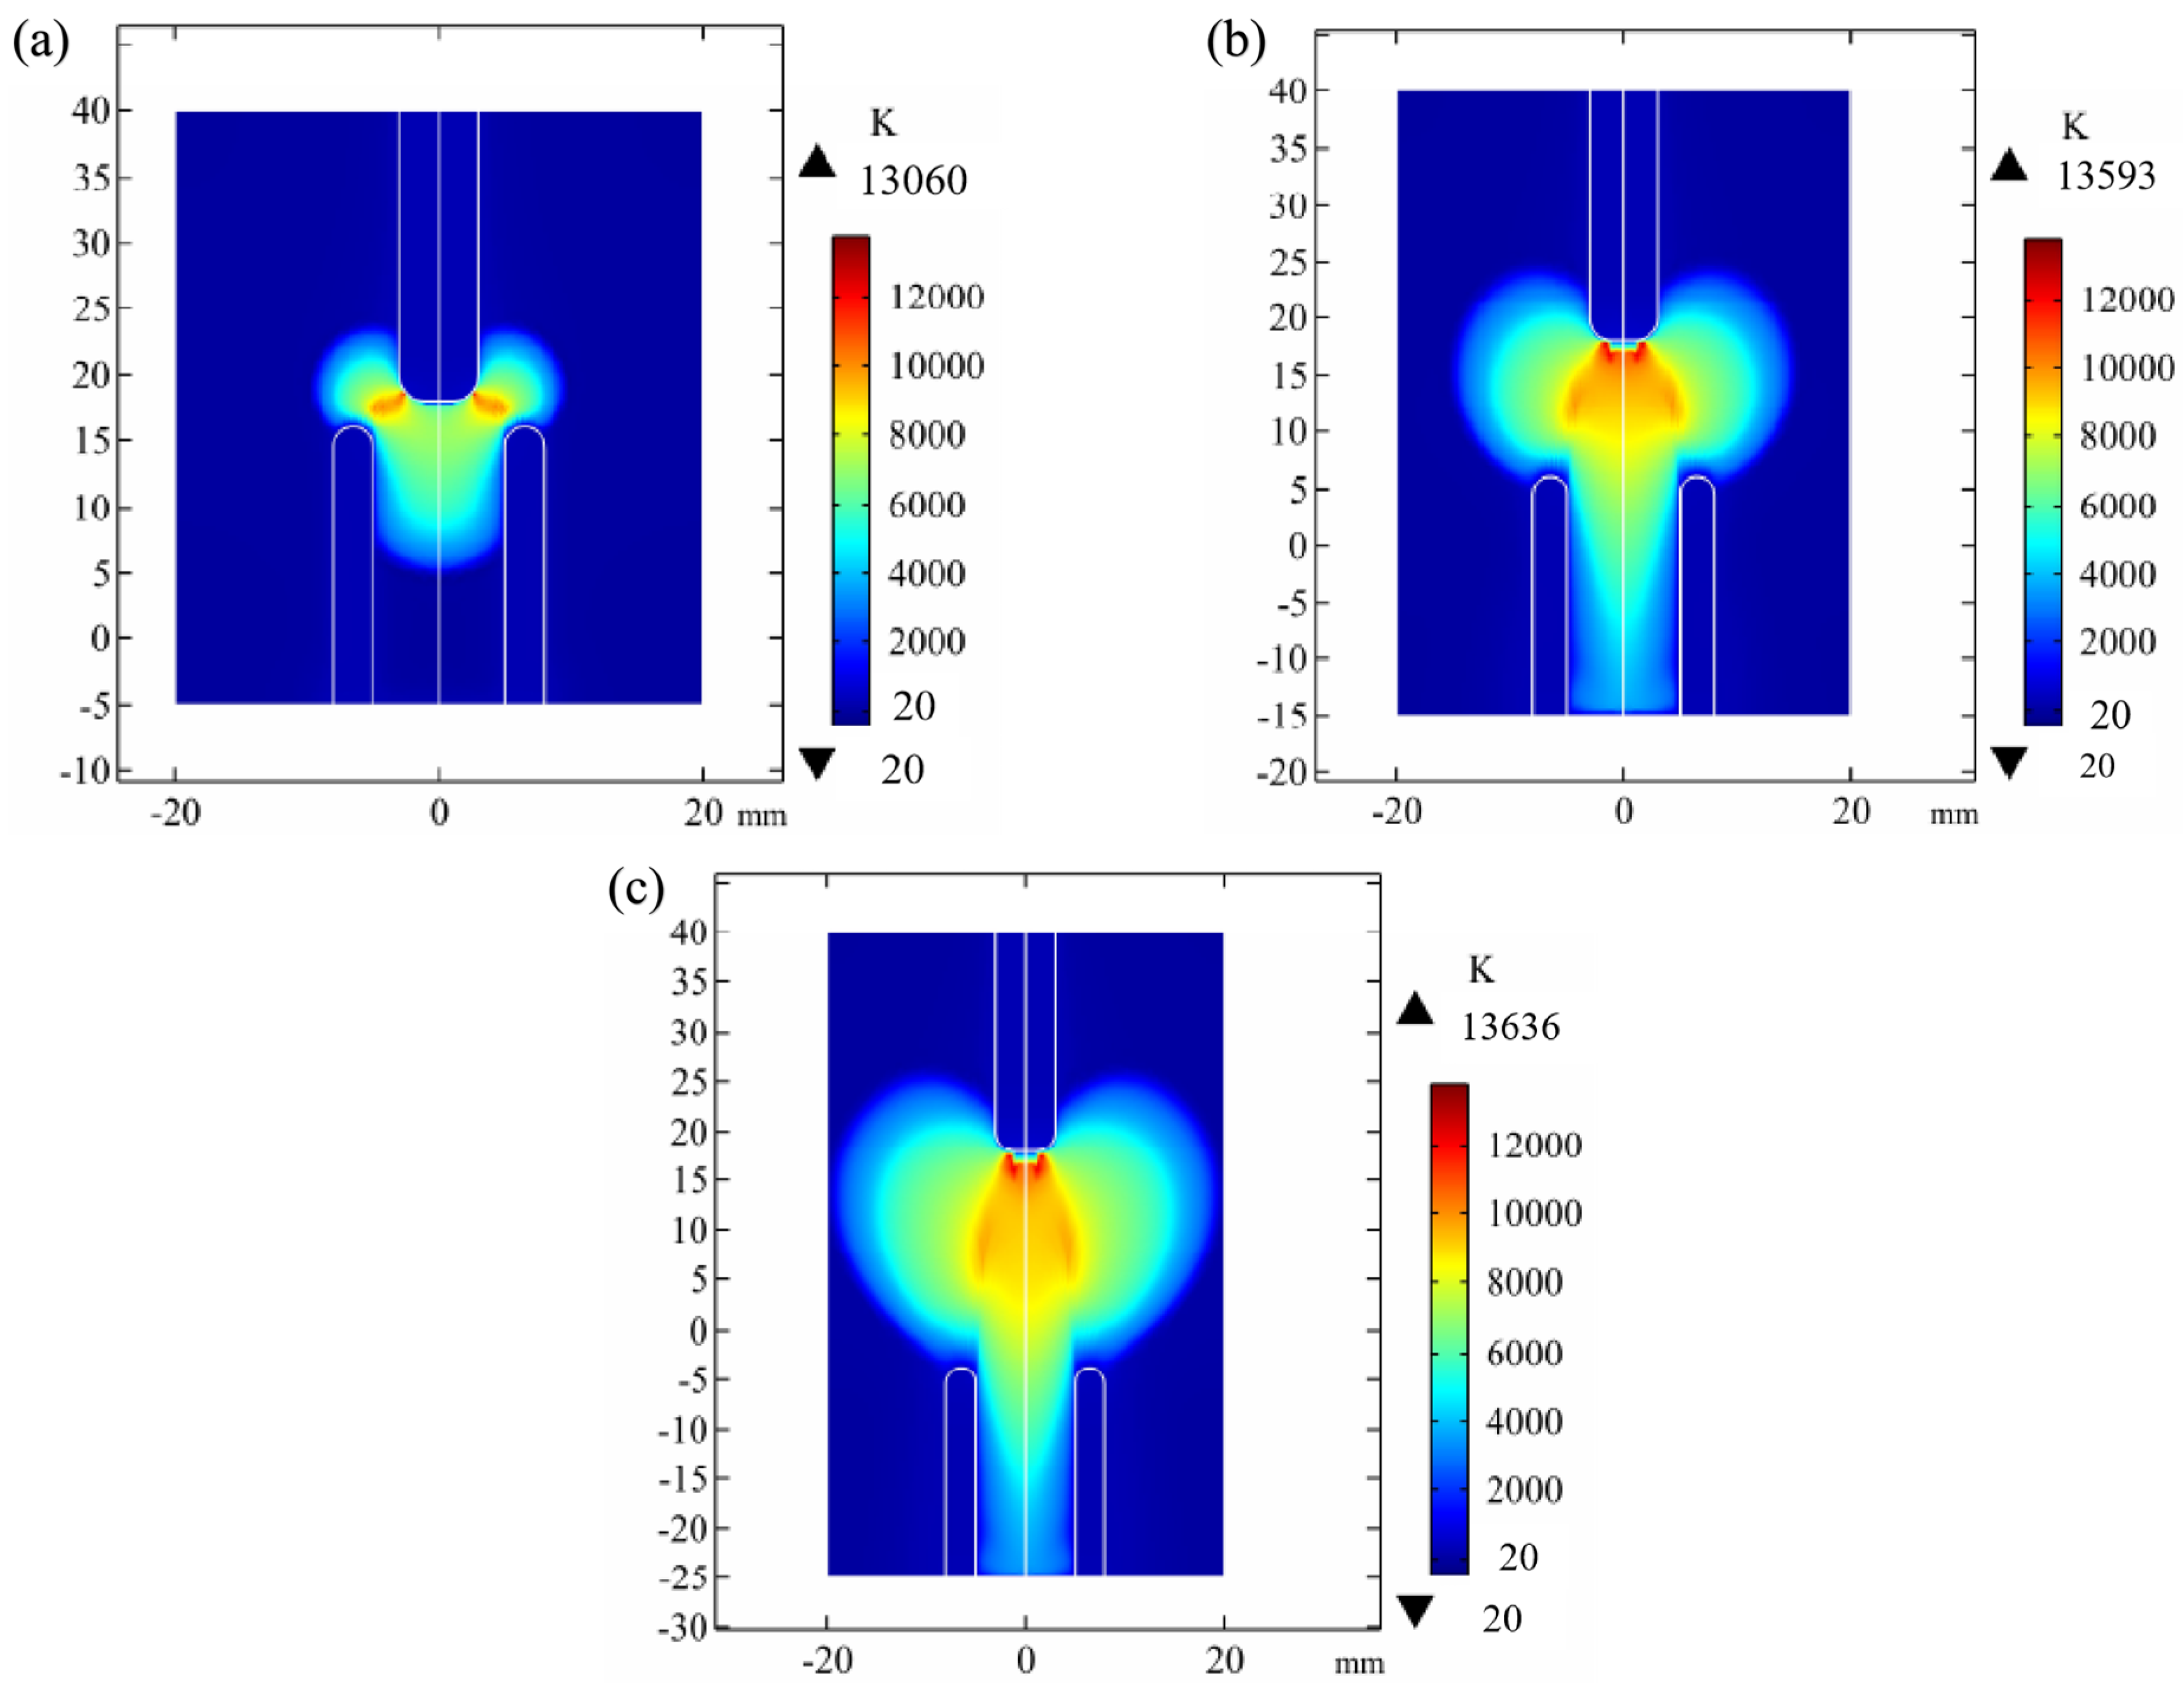
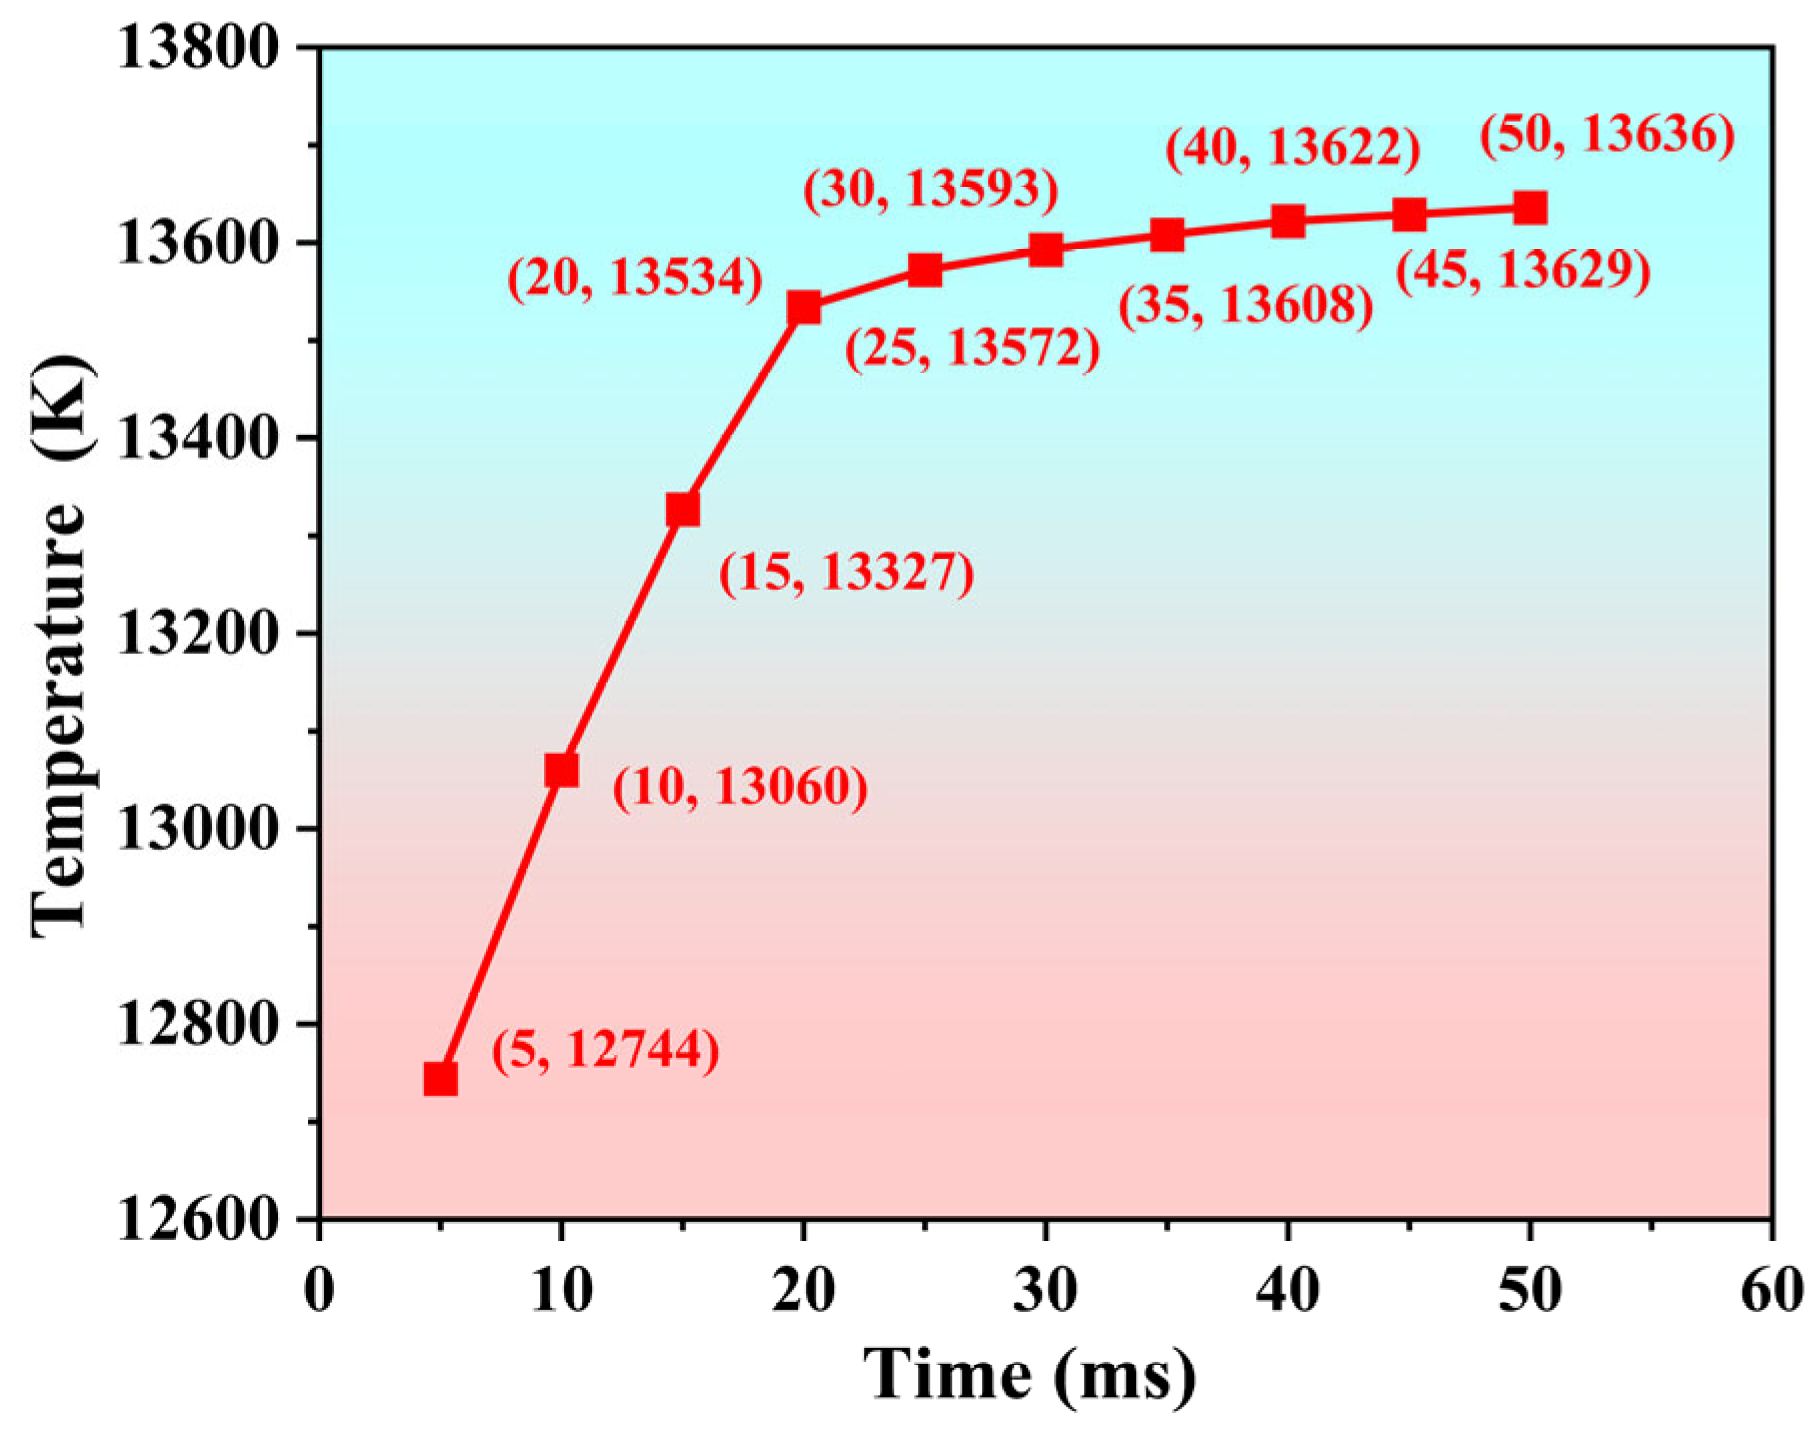
The correlation between arc duration and the temperature field is investigated, and the evolution of the arc temperature distribution is analyzed, which is of great significance for reducing the frequency of arc generation and prolonging the service life of products. In this study, simulation experiments are performed using a model with a 2 mm electrode gap, where arc durations are set to 10 ms, 30 ms, and 50 ms, respectively. The results are shown in Figure 18 and Figure 19.
Figure 18 indicates that as the arc duration increases, the arc coverage area expands, and the overall arc temperature exhibits an increasing trend. The peak temperature is observed in the central region of the arc column, which reaches approximately 13,000 K. The arc temperature is characterized by a radially decreasing gradient distribution, with the peripheral temperature around 5 × 10³ K, which is 61.6% lower than the central temperature. Figure 19 shows the variation curve of the peak temperature over time. During the initial stage of arc development (t ≤ 20 ms), the peak temperature rapidly rises to 13,000 K. As the arc evolves into a stable stage (t ≥ 20 ms), the increase in maximum temperature shows a slow and steady trend, with the rate of temperature rise reduced by approximately 80%. This is attributed to the fact that the relationship between arc temperature and time is not simply linear. When the dynamic equilibrium stage is reached, the arc temperature is no longer increased with time. Meanwhile, the increase in electrode spacing leads to a larger air gap, which further inhibits the temperature rise rate and results in a gradual leveling of the temperature growth.

4. Discussion and Analysis of the Results

The electric arc is essentially a plasma discharge phenomenon by the breakdown of a gaseous medium. Its physical evolution follows a chain reaction mechanism of field emission–collision ionization–thermal ionization [38,39]. When electrical contacts are in a critical contact or initial separation state, the gap at the micrometer or millimeter scale causes the electric field intensity (E = U/d, where U is the inter-electrode voltage and d is the gap distance) to surge abruptly to the dielectric breakdown threshold. At this point, the intense electric field induces avalanche ionization in the gap medium (air/metal vapor), forming a plasma channel. Specifically, the initial electrons emitted from the cathode surface via field emission effect gain kinetic energy under the acceleration of the electric field and collide with neutral particles, generating secondary electrons and positive ions. These newly formed charged particles arouse an exponential increase in ionization degree during continuous acceleration–collision processes, ultimately leading to the collapse of the medium’s insulating properties. Throughout this self-sustained discharge [19], the conduction current formed by electron migration and the Joule heating effect jointly sustain the high-temperature characteristics of the arc plasma (typically 3000–20,000 K), until the arc column is contracted and extinguished due to energy dissipation [40].
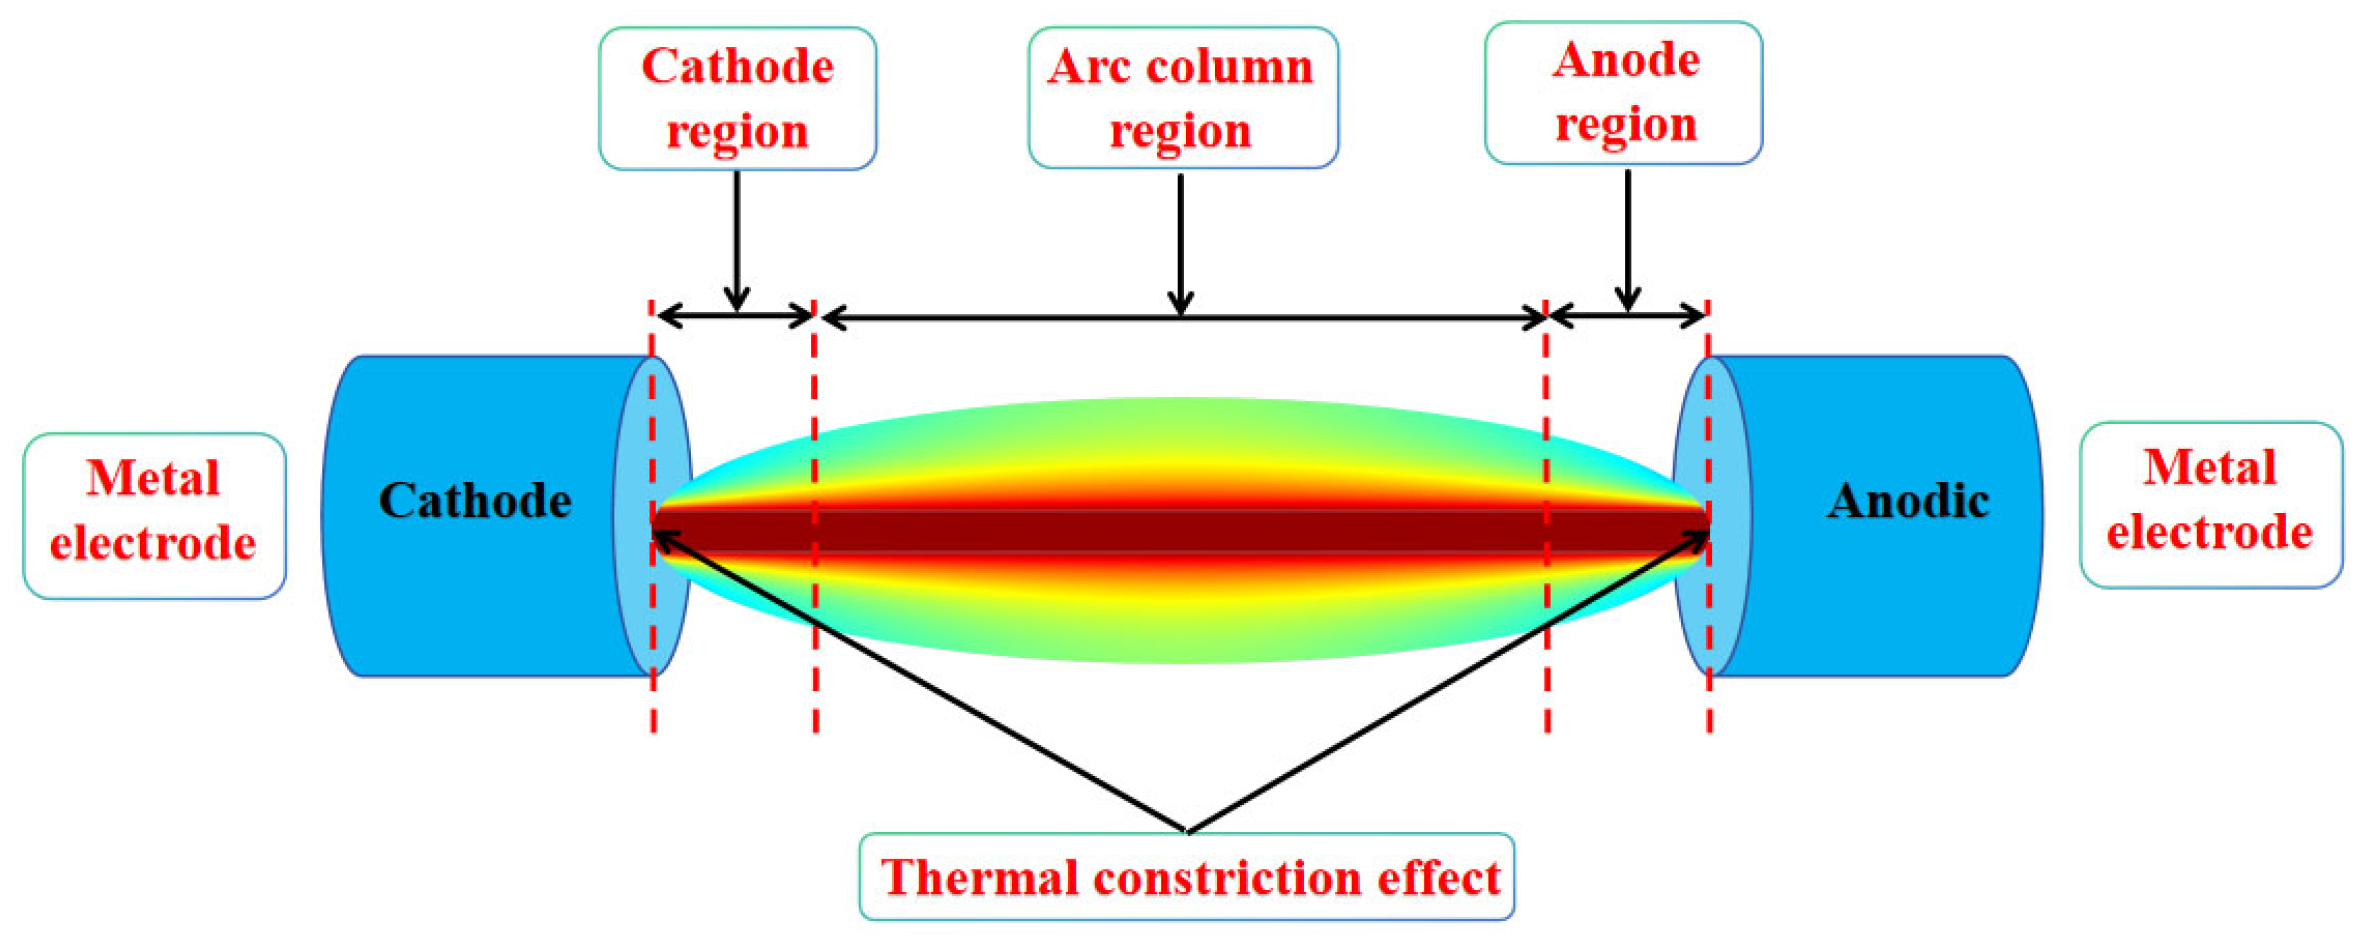
The thermodynamic configuration of an electric arc can be divided into three characteristic regions according to the temperature field, the cathode region, arc column region, and anode region, as shown in Figure 20. The arc temperature is shown to exhibit a typical radial gradient distribution, with the peak temperature located at the core of the arc column, while the other temperature gradually decreases along the radial direction. Additionally, the electrodes at both ends exhibit significantly higher thermal conductivity than air, and a thermal constriction effect is induced at the electrode contact interfaces by the temperature gradient. This result shows that the temperature in the near-electrode regions is observed to be lower than that in the arc column region, and the arc diameter is reduced to approximately one-third to one-half of that in the arc column region.
Based on the systematic analysis of arc generation mechanisms and multiphysics coupling simulation results presented above, the arc evolution characteristics and the correlation between arcs and key parameters during plugging/unplugging operations of electrical connector contacts are revealed. The spatiotemporal distribution characteristics of the arc temperature field indicate that the peak arc temperature can exceed 1.3 × 10⁴ K, with the temperature distribution exhibiting significant stage-dependent complexity. The temperature in the near-anode region is approximately 20% higher than that in the cathode region, which is closely related to the gradient distribution of electron kinetic energy deposition during plasma energy transport. The distribution characteristics of the magnetic field are clearly correlated with the arc temperature field and the electric field intensity distribution and the current density also exhibits typical constriction characteristics. Specifically, the energy deposition density in the anode region is positively correlated with the electron migration rate, which also verifies the anode thermal shock mechanism dominated by electron collision ionization. Furthermore, electrode displacement triggers dynamic migration of the arc in the cathode region, which also indicates that arc morphology is dually regulated by electromagnetic coupling effects and mechanical motion.
Parameter sensitivity analysis indicates that plugging/unplugging speed imposes a nonlinear constrained effect on arc thermodynamic characteristics, while voltage exhibits a linear relationship with arc temperature. When the speed is increased from 100 mm/s to 500 mm/s, the expansion of the arc gap enhances the convective heat dissipation efficiency by 47%, and the peak temperature growth rate declines to 50% of its initial value. During contact separation or engagement, the temperature rise process is led by voltage and current. However, the thermal diffusion effect becomes the limiting factor as the gap widens. The phase transition process of the arc energy transport mechanism from Joule heating dominance to convective dissipation dominance is revealed. In addition, a nonlinear dynamic equilibrium relationship is observed between arc duration and temperature. In the initial stage (t ≤ 20 ms), the temperature rapidly rises to 1.3 × 10⁴ K. Meanwhile, with prolonged time (t ≥ 20 ms), the increasing electrode gap inhibits the temperature rise rate, eventually leading to stabilization. This phenomenon further demonstrates that the thermodynamic behavior of the arc is jointly constrained by the competing mechanisms of energy deposition and diffusion.
Many research teams conduct extensive simulation and experimental studies on the MHD arc generation and erosion mechanisms in high-voltage, high-current circuit breakers [15,41,42,43]. Based on the previous arc research, this paper employs an improved MHD model and method and applies it to the integrated analysis and performance optimization of Cu/Ni/Ag composite electrical connectors, specifically focusing on their contact points. The limitations of conventional low-voltage and low-current conditions are overcome in the research by revealing the nonlinear saturation characteristics of arc temperature versus voltage under high-voltage environments. By quantifying the influence patterns of key parameters on arc behavior, the theoretical support is provided for the insulation design and arc inhibition techniques of Cu/Ni/Ag composite electrical connectors in high-voltage conditions.
This study systematically investigates arc responses under different voltages (110 V to 1000 V) and dynamic insertion/withdrawal operations (separation speeds ranging from 100 mm/s to 500 mm/s). Furthermore, a two-dimensional axisymmetric model is adopted, preserving the key dimensional features of the actual connector contact point (pin–socket structure) rather than using an idealized electrode geometry. This configuration enables a more direct engineering interpretation of the simulation results. In addition to the qualitative description of arc morphology, this study quantifies several key relationships that have not been systematically described in previous studies on connector arcs, including the nonlinear saturation behavior of arc temperature with increasing voltage, the weak dependence of peak temperature on gap distance, the nonlinear effect of separation speed on the temperature rise rate, and the competitive mechanism between energy deposition and diffusion. In addition, it should be noted that this study does not account for the metal vapor doping effect caused by electrode ablation, and may underestimate the temperature spatiotemporal evolution characteristics of long-duration arcs (t > 50 ms). Future research can improve the model by incorporating an ablation mass transport equation and conducting spectroscopic diagnostic experiments to further enhance the accuracy of simulation predictions.

5. Conclusions

Based on magnetohydrodynamic (MHD) theory, an arc mathematical model realistically aligned with practical conditions is established. This model is solved computationally using multiphysics finite element simulation software. Systematic analysis of the simulation results yields the following conclusions:
(1)
The central region of the arc column exhibits high temperatures exceeding 10,000 K, with a radially decreasing gradient distribution. The arc morphology displays a distinct bipolar constriction characteristic, with more pronounced constriction at the anode. The energy deposition density in the near-anode region is significantly higher, resulting in a temperature approximately 20% greater than that in the near-cathode region. During the vertical motion of the contact column, dynamic migration of the arc in the cathode region is induced by electrode displacement. High electric field intensity distributions are exhibited in both electrode regions, with the maximum field strength in the near-cathode region reaching 3.02 × 10⁵ V/m. In contrast, the high conductivity of the plasma in the arc column core reduces the electric field strength to below 5 × 10³ V/m. The field intensity in the peripheral regions decreases gradually and eventually reaches dynamic equilibrium with the surrounding gas medium. Under the boundary condition of zero cathode potential, the electric potential gradient increases monotonically along the axial direction from cathode to anode. During arc separation, this electric potential rises from 15 V to 20 V, representing an increase of approximately 30%. In the central region near the anode pole, equipotential lines become highly concentrated, forming a peak potential of 28.9 V. While equipotential lines are distributed uniformly within the arc column core, a significant potential voltage drop forms in the anode near-electrode region. The potential gradient near the cathode changes gently and eventually decays to zero potential at the cathode boundary region.
(2)
Through the analysis of the temporal evolution of the magnetic field magnitude at different spatial locations, it can be seen that the arc magnetic field is rapidly established within 1 ms and then enters a relatively stable dynamic distribution stage. The spatial distribution of the magnetic field magnitude exhibits significant non-uniformity, and this distribution characteristic is clearly correlated with the arc temperature field and the electric field intensity distribution. The current is highly concentrated in three regions, the anode center, the arc column core, and the cathode center, whereas the current density at adjacent points is significantly lower, indicating that the current density in the arc exhibits typical constriction characteristics. The current density in the cathode region shows considerable fluctuations, reflecting the time-varying characteristic of the spatial migration of the arc in the cathode region as it moves with the contact post after formation.
(3)
Under the condition of a constant arc gap distance, the maximum arc temperature is observed to increase significantly with rising voltage, exhibiting an approximately linear relationship. However, when the voltage exceeds 400 V, the rate of maximum arc temperature rise gradually slows down. Within the voltage range below 800 V, the difference in peak temperature between arc gaps of 0.5 mm and 1 mm is less than 5%. Beyond 800 V, this difference increases significantly. Under identical voltage conditions, an increase in arc gap distance leads to a marginal rise of 2%–8% in the maximum arc temperature.
(4)
The electrode motion velocity is found to have a significant impact on arc temperature. During low-speed separation (v ≤ 200 mm/s), the arc energy distribution remains highly concentrated, causing the arc temperature to rise rapidly and reach a maximum of 1.2 × 10⁴ K. As the separation velocity increases, the air gap between the contact columns widens, enhancing the arc diffusion effect. This leads to a slower increase in peak temperature, with the temperature rise rate reduced by approximately 50%.
(5)
Arc duration is found to exhibit a nonlinear relationship with temperature. As the duration increases, the arc coverage area expands, and the overall arc temperature demonstrates an upward trend. The highest temperature, reaching approximately 1.3 × 10⁴ K, is observed in the core region of the arc column. The arc temperature displays a radially decreasing gradient distribution, with the peripheral temperature approximating 5 × 10³ K, representing a 61.6% reduction compared to the core temperature. With further extension of arc duration, the temperature achieves dynamic equilibrium. Concurrently, the electrode gap progressively widens, and arc diffusion effects are gradually enhanced. This mechanism further inhibits the temperature rise rate, resulting in a gradual moderation of temperature growth.

Author Contributions

Conceptualization, J.S.; methodology, J.S. and Y.Z.; software, J.S., C.T. and Y.X.; validation, J.S., C.T. and Y.X.; formal analysis, C.T. and Y.X.; investigation, J.S., W.L. and Y.H.; resources, W.L., Y.H. and Y.Z.; data curation, J.S., C.T. and Y.X.; writing—original draft preparation, J.S.; writing—review and editing, J.S., C.T. and Y.X.; visualization, J.S.; supervision, Y.Z.; project administration, Y.Z.; funding acquisition, Y.Z. All authors have read and agreed to the published version of the manuscript.

Funding

This research was funded by the Local Science and Technology Development Fund Projects Guided by the Central Government (Grant No. 2025ZYDF028, 2023ZYDF045), Sichuan Yonggui Science and Technology Co., Ltd., (Grant No. 25ZH0133), the Sichuan Provincial Department of Science and Technology (Grant No. 24NSFTD0019), and the Special Topic for Discipline Construction of Southwest University of Science and Technology in 2022 (Grant No. 22XKKT03).

Institutional Review Board Statement

Not applicable.

Informed Consent Statement

Not applicable.

Data Availability Statement

Data are contained within the article.

Conflicts of Interest

Authors Wei Li and Yue Hu were employed by the company Sichuan Yonggui Science and Technology Co., Ltd. The remaining authors declare that the research was conducted in the absence of any commercial or financial relationships that could be construed as a potential conflict of interest.

References

  1. Farges, C.; Chevrié, M.; Sabatier, J.; Pradere, L.; Guillemard, F. Detection of Electric Contact Resistance Variations in Automotive Connectors. IEEE Trans. Ind. Electron. 2017, 64, 9469–9476. [Google Scholar] [CrossRef]
  2. Hadda, K.; Boutte, A.; Beloufa, A.; Amirat, M. Experimental study of electrical arc phenomena in electrodes with pure and coated materials to be used in aerospace power connectors. Aeronaut. J. 2025, 130, 284–301. [Google Scholar] [CrossRef]
  3. Hornung, A.; Berger, F.; Freudiger, G.; Kummerer, D.; Ledermann, T. Investigations on the threshold range of connectors in conditions of engaging and separating with electrical load. In Proceedings of the ICEC 2014: The 27th International Conference on Electrical Contacts, Dresden, Germany, 22–26 June 2014; pp. 1–6. [Google Scholar]
  4. Sun, C.; He, Y.; Zhang, C.; Ren, W. Research on the Electrical Contact Performance Degradation Process of Power Connectors under Hot-Swapping Conditions. J. Fail. Anal. Prev. 2025, 25, 2415–2424. [Google Scholar] [CrossRef]
  5. Song, J.; Shukla, A.; Probst, R. The State of Health of Electrical Connectors. Machines 2024, 12, 474. [Google Scholar] [CrossRef]
  6. Martínez, J.; Riba, J.-R.; Moreno-Eguilaz, M. State of Health Prediction of Power Connectors by Analyzing the Degradation Trajectory of the Electrical Resistance. Electronics 2021, 10, 1409. [Google Scholar] [CrossRef]
  7. Zhengbo, L.; Cao, Y.; Fu, S. Arc Motion Behavior During Rotary Separation of Vacuum Contacts. In The Proceedings of 2023 4th International Symposium on Insulation and Discharge Computation for Power Equipment (IDCOMPU2023); Dong, X., Cai, L.C., Eds.; Springer Nature: Singapore, 2024; pp. 219–228. [Google Scholar]
  8. Stasac, C.-O.; Tomșe, A.-D.; Costea, T.O.; Moldovan, V.-A.; Bandici, L.; Arion, M.-N.; Hathazi, F.-I. Analysis of the Corrosive Process Originating from Electrical Arcs on Ag–Ni Contacts Based on Residual Layer Distribution. Processes 2025, 13, 2808. [Google Scholar] [CrossRef]
  9. Suman, P.; Kumar Bannaravuri, P.; Baburao, G.; Ratna Kandavalli, S.; Alam, S.; ShanthiRaju, M.; Swamy Pulisheru, K. Integrity on properties of Cu-based composites with the addition of reinforcement: A review. Mater. Today Proc. 2021, 47, 6609–6613. [Google Scholar] [CrossRef]
  10. Tong, J.; Wang, J.; Zhang, H.; Liu, H.; Sun, Y.; Li, Z.; Zhang, W.; Wang, Z.; Chang, Y.; Yuan, Z.; et al. Performance evaluation of Cu-based contact material reinforced by the CuCrNiCoFe high entropy particles. Wear 2026, 584–585, 206373. [Google Scholar] [CrossRef]
  11. Kumar, V.; Singh, A.; Ankit; Gautam, G. A comprehensive review of processing techniques, reinforcement effects, and performance characteristics in copper-based metal matrix composites. Interactions 2024, 245, 357. [Google Scholar] [CrossRef]
  12. Andras, A.; Popescu, F.D.; Radu, S.M.; Pasculescu, D.; Brinas, I.; Radu, M.A.; Peagu, D. Numerical Simulation and Modeling of Mechano–Electro–Thermal Behavior of Electrical Contact Using COMSOL Multiphysics. Appl. Sci. 2024, 14, 4026. [Google Scholar] [CrossRef]
  13. Xiu, S.; Jiang, Y.; Liu, Z.; Liu, Z.; Yang, J.; Qu, C. Numerical simulation of vacuum arc movement between transverse magnetic field contacts. Phys. Plasmas 2021, 28, 123513. [Google Scholar] [CrossRef]
  14. Yu, X.; Song, M.; Wang, Z. Simulation and Verification of Effect of Arc Duration on Arc Temperature Based on COMSOL. Machines 2023, 11, 289. [Google Scholar] [CrossRef]
  15. Rong, M.; Ma, Q.; Wu, Y.; Xu, T.; Murphy, A.B. The influence of electrode erosion on the air arc in a low-voltage circuit breaker. J. Appl. Phys. 2009, 106, 023308. [Google Scholar] [CrossRef]
  16. Wu, C.; Yi, D.; Weng, W.; Li, S.; Zhou, J.; Zheng, F. Arc erosion behavior of Ag/Ni electrical contact materials. Mater. Des. 2015, 85, 511–519. [Google Scholar] [CrossRef]
  17. Li, C.; Yang, Z.; Yao, W.; Liu, H.; Lin, J.; Lu, S. Experimental investigation of the effects of current and voltage on the thermal characteristics of low-voltage DC fault arc. Int. J. Therm. Sci. 2025, 217, 110122. [Google Scholar] [CrossRef]
  18. Li, H.; Wang, X.; Fei, Y.; Zhang, H.; Liu, J.; Li, Z.; Qiu, Y. Effect of electric load characteristics on the arc erosion behavior of Ag-8wt.%Ni electrical contact material prepared by spark plasma sintering. Sens. Actuators A Phys. 2021, 326, 112718. [Google Scholar] [CrossRef]
  19. Trelles, J.P. Finite Element Methods for Arc Discharge Simulation. Plasma Process. Polym. 2017, 14, 1600092. [Google Scholar] [CrossRef]
  20. Zhou, X.; Zhang, H.; Wang, G.; Bai, X. Three-dimensional numerical simulation of arc and metal transport in arc welding based additive manufacturing. Int. J. Heat Mass Transf. 2016, 103, 521–537. [Google Scholar] [CrossRef]
  21. Zhang, X.; Bruce, A.; Rowland, S.; Terzija, V.; Bu, S. Modeling the development of low current arcs and arc resistance simulation. IEEE Trans. Dielectr. Electr. Insul. 2018, 25, 2049–2057. [Google Scholar] [CrossRef]
  22. Abadi, M.M.; Tang, H.; Rashidi, M.M. A review of simulation and numerical modeling of electric arc furnace (EAF) and its processes. Heliyon 2024, 10, e32157. [Google Scholar] [CrossRef] [PubMed]
  23. Liu, X.; Huang, X.; Cao, Q. Simulation and Experimental Analysis of DC Arc Characteristics in Different Gas Conditions. IEEE Trans. Plasma Sci. 2021, 49, 1062–1071. [Google Scholar] [CrossRef]
  24. Jiang, C.; Qu, L.; Yu, Z.; Gan, Z.; Yan, X.; Zeng, R.; Huang, Y.; Li, S. Research of simulation and experiment on arc characteristics of gas mechanical switch. High Volt. 2024, 9, 626–635. [Google Scholar] [CrossRef]
  25. Huang, R.; Fukanuma, H.; Uesugi, Y.; Tanaka, Y. An Improved Local Thermal Equilibrium Model of DC Arc Plasma Torch. IEEE Trans. Plasma Sci. 2011, 39, 1974–1982. [Google Scholar] [CrossRef]
  26. Dewan, E.M. Generalizations of the Saha Equation. Phys. Fluids 1961, 4, 759–764. [Google Scholar] [CrossRef]
  27. Wu, S.; Wang, K.; Liu, S.; Shi, D.; Zhao, S.; Shuai, P.; Liu, Q. Magnetohydrodynamics simulation of arc motion in time-varying copper vapor–air mixture within medium-voltage DC air circuit breakers. J. Appl. Phys. 2025, 137, 133303. [Google Scholar] [CrossRef]
  28. Xiong, D.; Chen, S.; Xiao, Y.; Ma, C. Simulation study on arc motion process of DC miniature circuit breakers. AIP Adv. 2023, 13, 105112. [Google Scholar] [CrossRef]
  29. Jia, B.; Wu, J.; Li, S.; Wu, H.; Peng, X.; Dai, J.; Chen, R. Magneto-hydrodynamic simulation study of direct current multi-contact circuit breaker for equalizing breaking arc. Plasma Sci. Technol. 2023, 25, 025506. [Google Scholar] [CrossRef]
  30. Londero, R.P.; Dutra, A.C.; Bender, V.C.; Beltrame, R.C.; Marchesan, T.B.; Falcão, C.E.G.; Pepe, F.C.; De Chiara, L.M. Analysis and Simulation of Direct Current Electric Arcs using the Magnetohydrodynamics Theory. In Proceedings of the 2021 International Conference on Electrical, Computer and Energy Technologies (ICECET), Cape Town, South Africa, 9–10 December 2021; pp. 1–6. [Google Scholar]
  31. Rau, S.-H.; Zhang, Z.; Lee, W.-J. 3-D Magnetohydrodynamic Modeling of DC Arc in Power System. IEEE Trans. Ind. Appl. 2016, 52, 4549–4555. [Google Scholar] [CrossRef]
  32. Wang, F.; Ma, X.; Chen, H.; Zhang, Y. Evolution simulation of lightning discharge based on a magnetohydrodynamics method. Plasma Sci. Technol. 2018, 20, 075301. [Google Scholar] [CrossRef]
  33. Guo, C.; Wu, H.; Peng, Y.; Wang, Z.; Jiang, W.; Zhang, Y. Numerical simulation of the breakdown process of micro-discharge sustained by field emission. J. Phys. D Appl. Phys. 2022, 55, 465202. [Google Scholar] [CrossRef]
  34. Kiyoumarsi, A.; Nazari, A.; Ataei, M.; Khademhosseini Beheshti, H.; Hooshmand, R.-A. Electromagnetic analysis of an AC electric arc furnace including the modeling of an AC arc. COMPEL 2010, 29, 667–685. [Google Scholar] [CrossRef]
  35. Rutberg, P.G.; Popov, S.D.; Surov, A.V.; Serba, E.O.; Nakonechny, G.V.; Spodobin, V.A.; Pavlov, A.V.; Surov, A.V. The investigation of an electric arc in the long cylindrical channel of the powerful high-voltage AC plasma torch. J. Phys. Conf. Ser. 2012, 406, 012028. [Google Scholar] [CrossRef]
  36. Lee, H.J.; Plaksin, V.Y.; Riaby, V.A. The volt–ampere characteristics of a DC arc plasmatron with a distributed anode spot. Thin Solid Film. 2007, 515, 5197–5201. [Google Scholar] [CrossRef]
  37. Baeva, M.; Benilov, M.S.; Almeida, N.A.; Uhrlandt, D. Novel non-equilibrium modelling of a DC electric arc in argon. J. Phys. D Appl. Phys. 2016, 49, 245205. [Google Scholar] [CrossRef]
  38. Tang, J.; Qiu, A.; Yang, L.; Jia, W.; Wang, H.; Li, J. Process of Surface Flashover in Vacuum Under Nanosecond Pulse. IEEE Trans. Plasma Sci. 2010, 38, 53–58. [Google Scholar] [CrossRef]
  39. Chen, J.; Zhou, Y.; Zhao, Y.; Zhang, L.; Huang, X.; Ge, J. Numerical Simulation of Surface Dicharge in Oil-paper Insulation Under Various Temperatures. In Proceedings of the 2021 International Conference on Electrical Materials and Power Equipment (ICEMPE), Chongqing, China, 11–15 April 2021; pp. 1–4. [Google Scholar]
  40. Lie, L.; Bin, W.; Chi, Y.; Chengkang, W. Characteristics of Gliding Arc Discharge Plasma. Plasma Sci. Technol. 2006, 8, 653. [Google Scholar] [CrossRef]
  41. Sun, J.; Yao, X.; Ren, J.; Le, Y.; Wu, Y.; Rong, M. Analytical Investigation of Lightning Strike-Induced Damage of OPGWs Based on a Coupled Arc-Electrical-Thermal Simulation. IEEE Trans. Power Deliv. 2022, 37, 5145–5155. [Google Scholar] [CrossRef]
  42. Xiao, Y.; Wu, Y.; Wu, Y.; Yang, F.; Rong, M.; Yang, Z. A fuse-based DC circuit breaker with vacuum interrupter enhanced by an external transverse magnetic field. High Volt. 2024, 9, 710–720. [Google Scholar] [CrossRef]
  43. Li, M.; Rong, M.; Wu, Y.; Zhang, J.; Wu, Y. The influence of electrode erosion on fault arc. In Proceedings of the 2015 3rd International Conference on Electric Power Equipment—Switching Technology (ICEPE-ST), Busan, Republic of Korea, 25–28 October 2015; pp. 142–145. [Google Scholar]
Figure 1. Schematic diagram of contact structure.
Coatings 16 00459 g001
Figure 2. Simplified model of contact element.
Coatings 16 00459 g002
Figure 3. Model mesh configuration.
Coatings 16 00459 g003
Figure 4. (a) Element quality distribution; (b) grid independence.
Coatings 16 00459 g004
Figure 5. Comparison of model accuracy.
Coatings 16 00459 g005
Figure 6. Temperature contour maps over time under a voltage of 1000 V. (a) t = 1 ms, (b) t = 5 ms, (c) t = 10 ms.
Coatings 16 00459 g006
Figure 7. Plot of data collection points with coordinates.
Coatings 16 00459 g007
Figure 8. Temperature variation curves at different coordinates. (a) The data acquisition curve at abscissa x = 3; (b) the data acquisition curve at abscissa x = 4; (c) the data acquisition curve at abscissa x = 5.
Coatings 16 00459 g008
Figure 9. Electric field intensity distribution at different times. (a) t = 1 ms, (b) t = 5 ms, (c) t = 10 ms, (d) characteristic regions.
Coatings 16 00459 g009
Figure 10. Electric potential distribution at different times: (a) t = 1 ms, (b) t = 5 ms, (c) t = 10 ms.
Coatings 16 00459 g010
Figure 11. Variation curve of electric potential with arc length.
Coatings 16 00459 g011
Figure 12. Variation curve of magnetic field magnitude over time.
Coatings 16 00459 g012
Figure 13. Variation curve of current density over time. (a) The curve of current density varying with time when the abscissa x = 3; (b) The curve of current density varying with time when the abscissa x = 4; (c) The curve of current density varying with time when the abscissa x = 5.
Coatings 16 00459 g013
Figure 14. Temperature contour maps under different voltages. (a) 110 V, (b) 600 V, (c) 1000 V.
Coatings 16 00459 g014
Figure 15. Maximum arc temperature at different voltages and spacings.
Coatings 16 00459 g015
Figure 16. Temperature distribution map at different moving speeds. (a) V = 100 mm/s, (b) V = 200 mm/s, (c) V = 300 mm/s, (d) V = 400 mm/s, (e) V = 500 mm/s.
Coatings 16 00459 g016
Figure 17. Peak temperature variation curve at different moving speeds.
Coatings 16 00459 g017
Figure 18. Temperature contour maps under different durations. (a) t = 10 ms; (b) t = 30 ms; (c) t = 50 ms.
Coatings 16 00459 g018
Figure 19. Peak temperature at different durations.
Coatings 16 00459 g019
Figure 20. Arc mechanism diagram.
Coatings 16 00459 g020
Table 1. Material parameters.
MaterialAirCu/Ni/Ag
Parameters
Relative Magnetic Permeability11
Electrical Conductivitysigma(T) [S/m]5.998 × 107 [S/m]
Constant Pressure Heat Capacitycp(T) J/[(kg·K)]385 [J/(kg·K)]
Relative Dielectric Constant11
Densityrho(T) [kg/m3]8960 [kg/m3]
Thermal Conductivityk(T) W/[(m·K)]400 [W/(m·K)]
Coefficient of Thermal Expansion-17 × 10−6 [1/K]
Young’s Modulus-110 × 109 [Pa]
Poisson’s Ratio-0.35
Reference Resistance Value-1.72 × 10⁻⁸ [ Ω · m ]
Resistivity Temperature Coefficient-3.9 × 10⁻³ [1/K]
Reference Temperature-298 [K]
Dynamic Viscositymu(T) [Pa·s]-
Specific Heat Rate1.40-
Total Volume Radiation CoefficientQrad(T) [W/m3]-
Disclaimer/Publisher’s Note: The statements, opinions and data contained in all publications are solely those of the individual author(s) and contributor(s) and not of MDPI and/or the editor(s). MDPI and/or the editor(s) disclaim responsibility for any injury to people or property resulting from any ideas, methods, instructions or products referred to in the content.