Article

Thickness Effects on Acoustic Parameters of TiO2 Layers on SiO2, Ti, Al2O3, and Si Substrates

by
Houssem Eddine Doghmane
1,*,
Elfahem Sakher
2,
Djamila Nebti
3,
Ibtissem Touati
1,
Djemâa Ben Othmane
1,
Tourkia Tahri
4,
Talia Tene
5,
Cristian Vacacela Gomez
6,7,*,
Lala Gahramanli
8,9,
Rana Khankishiyeva
10,11,12 and
Abdellaziz Doghmane
1
1
Laboratory of Semiconductors, Department of Physics, Faculty of Sciences, Badji Mokhtar—Annaba University, Annaba 23000, Algeria
2
Faculty of Science and Technology, University of Mohamed Cherif Messaadia of Souk Ahras, Annaba 41000, Algeria
3
Laboratoire de Recherche sur le Médicament et Développement Durable, Faculté de Génie des Procédés, Université Constantine 3, Ali Mendjeli, Constantine 25000, Algeria
4
Laboratory of Materials Technology and Process Engineering (LTMGP), Faculty of Technology, University of Bejaia, Bejaia 06000, Algeria
5
Department of Chemistry, Universidad Técnica Particular de Loja, Loja 110160, Ecuador
6
Universidad Ecotec, Km. 13.5 Samborondón, Samborondón 092302, Ecuador
7
Department of Environmental Engineering (DIAm), University of Calabria, Via P. Bucci, Cubo 42B, 87036 Rende, Italy
8
Nano Research Laboratory, Center of Excellence, Baku State University, Academic Zahid Khalilov 33, Baku AZ1148, Azerbaijan
9
Faculty of Physics, Chemical Physics of Nanomaterials, Baku State University, Academic Zahid Khalilov 33, Baku AZ1148, Azerbaijan
10
Institute of Radiation Problems, Ministry of Science and Education of the Republic of Azerbaijan, 9 B. Vahabzada Str., Baku AZ1143, Azerbaijan
11
Department of Physics and Chemistry, Azerbaijan University of Architecture and Construction, 11 A. Sultanova Str., Baku AZ1073, Azerbaijan
12
Department of Organic Substances and Technology of High-Molecular Compounds, Azerbaijan State Oil and Industry University, 20 Azadlig Ave., Baku AZ1010, Azerbaijan
*
Authors to whom correspondence should be addressed.
Coatings 2026, 16(4), 410; https://doi.org/10.3390/coatings16040410
Submission received: 28 January 2026 / Revised: 11 March 2026 / Accepted: 16 March 2026 / Published: 28 March 2026
(This article belongs to the Special Issue Thin Films and Nanostructures Deposition Techniques)

Abstract

We investigated the effect of film thickness d on the acoustic response of titanium dioxide (TiO2) layers deposited on Ti, SiO2, Al2O3, and Si substrates. For each TiO2 thickness–substrate pair, we computed reflection coefficients and acoustic signatures under normal operating conditions of a conventional scanning acoustic microscope, then deduced the Rayleigh-wave velocity VR from spectral analysis of the oscillatory layer–substrate signatures. As d increased, VR either rose or fell, depending on the layer/substrate pair, and eventually approached a saturation value. For TiO2/SiO2 and TiO2/Ti, VR increased from those of the bare substrates (SiO2: 3415 m/s; Ti: 2965 m/s) toward 3830 m·s−1, the bulk TiO2 value. For TiO2/Al2O3 and TiO2/Si, VR decreased from the substrate values (Al2O3: 5700 m/s; Si: 4712 m/s) toward the same TiO2 saturation. These dispersion trends are consistent with stiffening (VR (TiO2) > VR (Substrate)) or loading (VR (TiO2) < VR (Substrate)) effects. The resulting VRd dispersion charts provide theoretical reference trends relating thickness and Rayleigh-wave velocity for the idealized TiO2/substrate systems considered here.

1. Introduction

A renewed interest has emerged in TiO2 as a wide-band-gap, transparent, conductive oxide with numerous modern applications owing to its outstanding physicochemical and notable mechanical properties [1,2,3,4], such as good chemical stability, excellent mechanical durability, high transparency, wide band gap, high refractive index, and large optical nonlinearity [5]. These properties have enabled applications in solar cells, optoelectronics, photovoltaics, photocatalysis, gas and photonic sensors, and antireflective coatings [6,7,8,9]. Moreover, the importance of TiO2 lies not only in its bulk form but also in thin coating films because of their high strength, fracture toughness, durability, and good adhesion.
It should be noted that the most important natural TiO2 polymorphs are anatase, rutile, and brookite. Among them, anatase is often considered because of its catalytic properties, relevance in optoelectronic applications, and thermodynamic stability under specific conditions. This structure crystallizes in a tetragonal lattice with sixfold coordination for Ti and threefold coordination for O, a Ti–O bond length of 1.934 Å, and an O–Ti–O bond angle of 92.6° [10,11,12,13]. Accordingly, anatase is adopted here as the reference TiO2 phase for the acoustic calculations.
In fact, TiO2 can be deposited by several techniques [14,15] on various substrates for different purposes: TiO2/silicon is used in MEMS devices due to its unique properties [16]; TiO2/SiO2 for high reflectors [17]; TiO2/Al2O3 for photocatalytic activity [18]; and TiO2/Ti for implant production [19].
Although many studies have examined the structural, electronic, and optical properties of TiO2 [1,15,20,21], comparatively little attention has been paid to its elastic properties in thin-film form, which govern quantities such as hardness, elastic constants, and stress changes under external perturbations [22]. To date, the database on the elastic properties of TiO2 thin films remains limited despite their practical importance in technological applications and the microelectronics industry. Consequently, understanding and optimizing the mechanical behavior of these coatings is still a primary challenge in thin-film technologies for various commercial applications [23].
Investigations of TiO2 thin-film properties can be conducted either experimentally or theoretically. Experimental approaches—destructive or non-destructive—often require sophisticated instrumentation and are therefore difficult, costly, and time-consuming. An alternative is to develop and use appropriate simulation tools to reproduce and predict the properties of layers with targeted characteristics.
In this context, unlike most numerical approaches used to date, particularly ab initio calculations [24,25], we adopt a simulation strategy that reproduces and predicts results obtained with a reflection-mode scanning acoustic microscope (SAM), a powerful non-destructive technique for determining elastic parameters in a wide range of solids. The SAM method exploits the propagation of surface acoustic waves (SAW) [26,27,28], which carry information about the elastic behavior of the medium through (or along) which they travel. These waves, which propagate in different modes with specific velocities, can be transmitted, refracted, or reflected at interfaces with acoustic mismatch and/or defects.
In this work, motivated by potential micro- and nanotechnological applications of layer/substrate systems, we first examine how varying the thickness d of TiO2 layers on SiO2 substrates affects reflection coefficients and acoustic signatures, along with their analysis and processing. We then highlight the thickness effects for other layer/substrate combinations: TiO2/Si, TiO2/Al2O3, and TiO2/Ti. Finally, for all TiO2/substrate pairs, we explore the evolution of the SAW phase velocity as a function of the normalized parameter d/λT, where λT is the transverse wavelength in the layer.

2. Materials and Methods

2.1. Theoretical Background

The principle of the scanning acoustic microscope relies on the emission and reflection of surface acoustic waves [26,27,28]. These waves consist of a superposition of longitudinal and transverse modes that travel along the surface with a common phase velocity, known as the Rayleigh-wave velocity (VR). This velocity is lower than both the longitudinal velocity (VL) and the transverse velocity (VT) [29,30]. The key quantitative feature of SAM is the acoustic material signature, also denoted as V(z). The V(z) curves are obtained by recording the output signal, V, when the sample is displaced by a distance z from the focal plane toward the acoustic lens. These V(z) curves can be used in the investigation of several materials properties [31,32,33,34,35], coating thickness, SAW velocity attenuation, film adherence, anisotropy, crack detection, surface hardening, residual stress, etc.
Theoretical studies of V(z) curves, in the SAM case, were shown to be in good agreement with experimental investigations for several materials (Plexiglas, silica, stainless steel, etc.) and under variable acoustic lens illumination. Moreover, this numerical microacoustic approach has proved efficient in the estimation of elastic properties of bulk and thin-film materials with different structural forms (crystalline, polycrystalline, amorphous, polymers, nanostructures, etc.) [36,37,38]. Specific effects on material behavior, such as porosity, texture, stress, pressure, preparation method, and attenuation, can also be theoretically and/or experimentally investigated within this framework, as reported in the literature [39,40,41,42]. However, in the specific case of TiO2 coatings prepared by techniques such as magnetron sputtering or sol–gel, real films may deviate from the present idealized model because of deposition-dependent microstructure and effective property variations. Therefore, the present charts should be interpreted as theoretical reference trends under the stated assumptions, rather than as directly validated predictors for all real TiO2 coatings. In the present work, a single TiO2 reference case was adopted to establish a first baseline for the thickness-dependent acoustic response; a comparative analysis including amorphous and other crystalline phases was beyond the scope of this study and will be considered in future work.
According to the angular spectrum model, the expression of V(z) is given in [26,43] and presented as Equation (1):
V z =   0 π 2 P ( θ ) R ( θ ) e i 2 z k cos θ sin θ cos θ d θ
where P(θ) is the pupil function of the lens, R(θ) is the reflection coefficient, θ is the half-opening angle of the lens, z is the defocusing distance, and k = 2π/λ is the wave number in the coupling liquid, i = √−1. It should be noted that the reflection coefficient is the ratio between the intensities of the reflected and incident waves. R(θ) of a liquid/film/substrate configuration is given by [43,44,45,46] as Equation (2):
R θ =   Z s +   Z f Z f   Z l i q e 2 i φ +   Z s   Z f Z f +   Z l i q Z s +   Z f Z f +   Z l i q e 2 i φ +   Z s   Z f Z f   Z l i q
where φ is the phase of the plane wave crossing the thin film; Zs, Zf, and Zliq are acoustic impedances of the substrate, the film, and the coupling liquid, respectively.
These acoustic impedances, which depend on phase velocities (Vj) and density (ρj), are given by the following:
Z ( j = s ,   f ,   l i q ) =   ρ j V j cos θ j
The subscripts (s, f, liq) stand for solid substrate, film, and liquid, respectively. It can be noted that at normal incidence, the acoustic impedance becomes the product of density and velocity.
The V(z) curves, measured experimentally or calculated theoretically from Equation (1), possess an oscillatory behavior due to constructive and destructive interference between different propagating modes. The spectral treatment of these periodic curves via fast Fourier transform (FFT) spectra leads to the determination of the oscillation period (Δz) given by [26,46] as Equation (4):
Δ z =   λ l i q 2 ( 1 cos θ S A W )
where λliq is the coupling liquid wavelength, and θSAW is the critical angle at which a surface acoustic wave is excited. Thus, using Snell’s law, the SAW velocity can be written in terms of Δz, longitudinal liquid velocity (Vliq), and operating frequency (f) as Equation (5) [26,46,47]:
V S A W =   V l i q 1 ( V l i q 2 f Δ z ) 2
Hence, the treatment of the oscillatory V(z) curves via the FFT technique leads to the deduction of the period and, consequently, to the direct SAW velocity determination.

2.2. Analytical Approach for Extracting Elastic Parameters

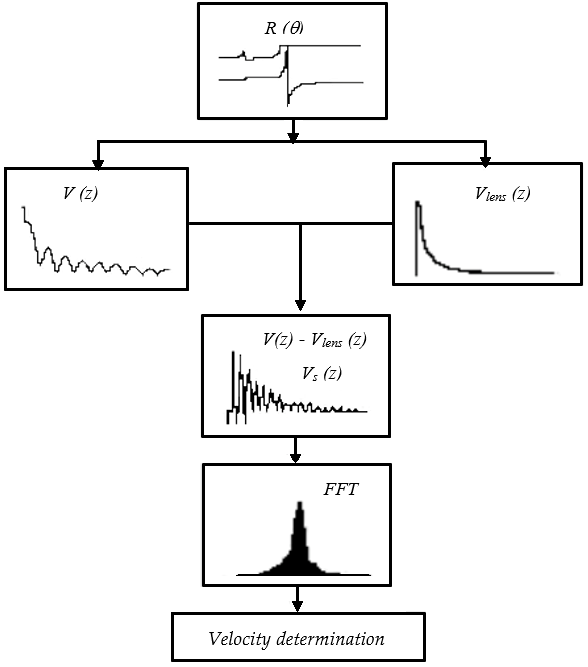
To investigate the dependence of elastic parameters on the thickness of TiO2 films on different substrates, we performed calculations using analytical spectral methods for a reflection-mode SAM under normal operating conditions. It should be noted that the V(z) signature is governed by interference between the specular reflection and a leaky surface-wave contribution. Therefore, this signature is influenced by several SAM parameters: acoustic lens (line focus, point focus, annular), coupling liquid (water temperature, sound speed, and attenuation), operating frequency, electronic emission and acquisition system, operation frequency, etc.). The present analysis follows the classical SAM/V(z) framework reported in the literature [26,28,46,47,48,49], particularly the periodicity/FFT-based treatment described by Kushibiki and Chubachi [46]. In this approach, the acoustic response is modeled through the reflection coefficient, the pupil-function-weighted V(z) signature, and the identification of the dominant spectral contribution associated with the leaky Rayleigh mode under fixed water-coupled operating conditions. As in other SAM/V(z) analyses, the interpretation may be influenced by aperture conditions, thickness regime, and possible multi-mode contributions; therefore, the reported results should be understood within these modeling assumptions. Nevertheless, the main steps of the calculation procedure for each layer/substrate configuration can be summarized by the flowchart in Figure 1 and the following steps:
Calculating reflection coefficients, R(θ).
Calculating acoustic materials signatures, V(z).
Calculating the response of the lens, Vlens(z).
Deducing V(z) curves of the sample by subtracting the response of the lens from that deduced theoretically or measured experimentally.
Treating the oscillatory V(z) curves, via fast Fourier transforms (FFT), to determine the spatial period, Δz, of these oscillations.
Deducing the velocity of the most dominant mode, which corresponds to leaky Rayleigh waves under SAM normal operating conditions.
Repeating all the previous steps for several thicknesses of TiO2 layers ranging from zero to twice the wavelength of the transverse waves propagating in the layer (2λT).

2.3. Materials and Simulation Methods

2.3.1. Materials

To carry out a complete and comprehensive investigation, we considered different types of substrates onto which TiO2 thin films can be deposited to form combinations used in many modern technologies and industrial fields [16,17,18,19]. Hence, glass (SiO2), alumina (Al2O3), silicon (Si), and titanium (Ti) substrates were chosen to represent materials with different electrical properties: semiconductors (Si), conductors (Ti), and insulators (SiO2 and Al2O3). Moreover, with respect to elastic properties, they also represent fast materials, with longitudinal velocities higher than 7000 m/s (i.e., Al2O3 and Si) and medium materials for which 4000 ≤ VL ≤ 7000 m/s. (i.e., Ti and SiO2). The TiO2 layer in this study was represented by literature bulk anatase parameters, adopted as a reference material case for the acoustic calculations.
Table 1 summarizes the substrate characteristics [26,37]. Accordingly, the present results should be understood as model-based predictions obtained from literature parameters under fixed idealized assumptions.

2.3.2. Simulation Conditions

Reflection SAMs can operate at frequencies from MHz to GHz, using acoustic lenses with different geometries and opening angles for various purposes [50,51,52]. To ensure efficient SAW transmission between the lens and the sample, coupling liquids with specific velocities (Vliq.) and densities are required. These liquids are commonly classified by density as heavy, medium, or light coupling—typified by mercury, water, and Freon, respectively.
All calculations were performed using literature material constants and a SAM forward model under the normal operating conditions of a conventional reflection-mode SAM: (i) operating frequency of 142 MHz, (ii) spherical lens with a half-opening angle of 50°, and (iii) water as the coupling liquid. No experimental SAM measurements, inverse fitting procedures, or parameter-optimization steps were performed in this study. The reported leaky Rayleigh-wave velocity corresponds to the dominant spectral contribution identified from the FFT treatment of the simulated V(z) response under these fixed model conditions.
For reproducibility, the V(z) responses were sampled on a fixed defocus grid and processed consistently under the same numerical conditions for all layer/substrate configurations. The leaky Rayleigh-wave velocity was obtained from the dominant FFT peak of the oscillatory V(z) signal, and the same peak-selection procedure was applied in all cases. The water properties were kept fixed throughout the calculations.

3. Results and Discussions

3.1. TiO2 Acoustic Parameter Determination

For any solid, the SAW velocities are correlated to elastic constants, i.e., Young’s modulus (E), shear modulus (G), bulk modulus (B), Poisson coefficient (ν), etc., through well-established relations. Because few studies have reported the elastic properties of TiO2, we first determine the SAW velocity values of bulk TiO2 from published data for bulk anatase TiO2: ρ = 3840 kg/m3 [53], B = 178 GPa [54,55], and G = 64.3 GPa [19]. The values of VL and VT velocities are deduced from the following familiar relations (Equation (6)):
V T =   G ρ
V L = B + 4 G / 3 ρ
Thus, we obtain VL = 8287 m/s and VT = 4092 m/s. The acoustic impedances at normal incidence are ZL = 32.35 MRayl and ZT = 16.88 MRayl. Knowledge of these values is essential for determining reflection coefficients and, consequently, the V(z) curves in the following simulations based on Equations (1) and (2).

3.2. Thickness Effects on the Properties of TiO2/SiO2 Structure

The study of reflection is crucial for understanding the physical phenomena governing material elasticity. Any change or modification in the propagating media leads to parameter mismatches and consequently affects SAW characteristics. This phenomenon can be quantified through the reflection coefficient, a complex-valued function with amplitude and phase; total reflection is obtained when ǀR(θ)ǀ = 1. R(θ) is calculated for waves incident on the structure (water half-space/TiO2/SiO2) at a constant frequency of 142 MHz. The frequency is related to the transverse wavelength in the film using the following:
f = VTT
For the TiO2 layer considered here, the transverse wave velocity is VT = 4092 m/s. Therefore, the transverse wavelength is λT = VT/f = 4092/(142 × 106) ≈ 28.8 μm. Accordingly, the normalized thickness range 0.3 ≤ d/λT ≤ 2 corresponds to physical thicknesses from 8.7 to 57.6 µm.
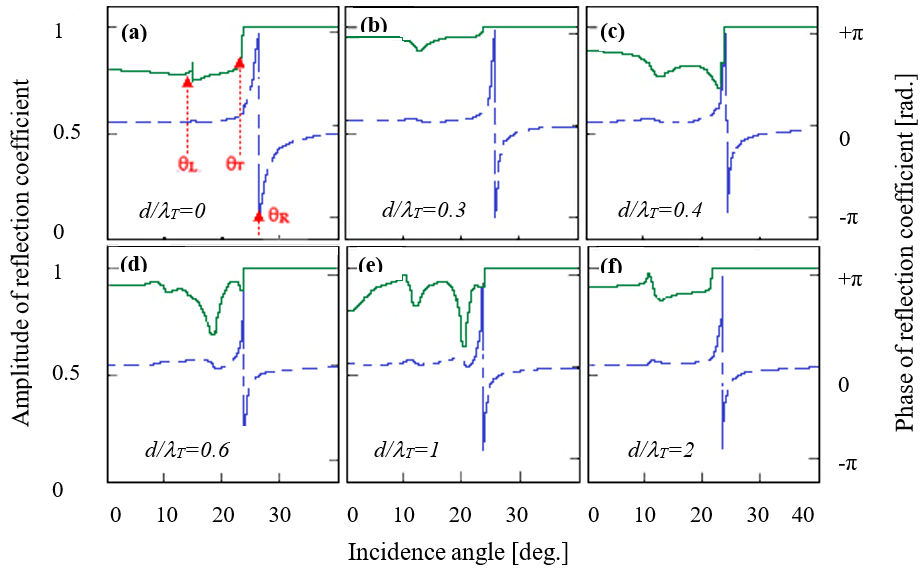
Figure 2 illustrates the calculated reflection coefficients of TiO2/SiO2 structures as a function of the incidence angle; the phase is shown on the right-hand axis and the modulus on the left-hand axis. In fact, a large number of TiO2 layer thicknesses on SiO2 substrates were investigated. However, the thicknesses investigated in this work correspond to microscale films (8.7 µm ≤ d ≤ 57.6 µm), which are substantially larger than the nanoscale regime where deviations of thin-film elastic properties from bulk values are often more pronounced. Therefore, the use of bulk anatase TiO2 constants in the present study is intended as an idealized first-order approximation, and the resulting trends should be interpreted within this assumption. It should also be noted that real TiO2 coatings may be amorphous or may exhibit deposition-dependent phase composition and microstructure, so their effective acoustic properties can differ from those of the idealized anatase reference case adopted here.
In all cases, it can clearly be seen that, as the incidence angle increases, several features appear that depend on the film thickness within the investigated range (0 ≤ d/λT ≤ 2).
Several features depend on the film thickness. For d/λT = 0 (Figure 2a), corresponding to the bare SiO2 substrate, as the incidence angle increases, we identify the following changes:
(i)
The first small fluctuations in both amplitude and phase occur at θL = 16°, corresponding to the critical angle for longitudinal waves in SiO2.
(ii)
The second variation, occurring at θT = 24°, corresponds to the transverse-wave critical angle, above which all energy is reflected due to the absence of transmission in the solid, and the modulus of the reflectance function approaches unity.
(iii)
The most pronounced phase changes (nearly 2π) occur a few degrees beyond θT; this is centered at θR = 26.2°, at which waves in the liquid can couple into a generalized leaky Rayleigh wave on the solid SiO2 substrate.
Then, if we consider SiO2 substrates onto which TiO2 layers are deposited with variable thicknesses, we clearly observe some changes in curve shapes due to the fact that the surface acoustic wave propagation occurs in both the layer and the substrate. For instance, for small thicknesses (d = 0.3 λT in Figure 2b), most of the propagation still occurs within the SiO2 substrate, leading to a quasi-similar curve behavior similar to that of the substrate (Figure 2a). However, as TiO2 layers become thicker, the surface wave propagates increasingly within the layer, leading to more changes in the curves: d = 0.4 λT (Figure 2c), d = 0.6/λT (Figure 2d), d = λT (Figure 2e). Finally, for d = 2 λT (Figure 2f), the TiO2 layer becomes thick enough so that the wave completely propagates within it, without reaching the substrate. Thus, the reflection coefficient represents that of the bulk TiO2 with clear critical angles at which longitudinal, transverse and Rayleigh waves are excited, a behavior similar to that of bulk SiO2 (Figure 2a).
Moreover, a close examination of Figure 2a–f shows the existence of small shifts in the positions of the critical angles, particularly for θR. It should be noted that under normal SAM operating conditions, the Rayleigh mode is the most dominant; accordingly, the most relevant change concerns the Rayleigh mode, whose critical angle decreases from 26.2° to 23.2°, corresponding to SiO2 and the thickest TiO2 films, respectively.

Acoustic Signatures

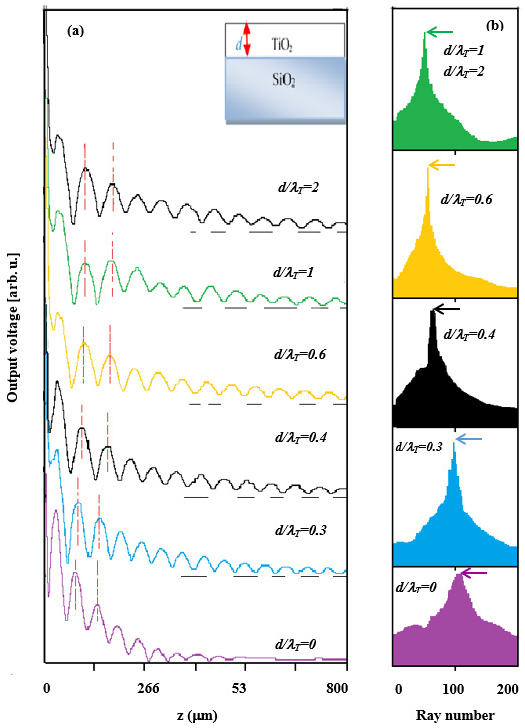
To better illustrate the phenomena inferred from the reflection coefficients, we calculated the acoustic signatures (Equation (1)), which are functions of R(θ). The resulting V(z) curves are shown in Figure 3a for SiO2 substrates onto which TiO2 films of different thicknesses are deposited; the curves are normally superimposed but are shifted vertically for clarity. The lowest curve (d/λT = 0) represents the bare SiO2 substrate, whereas the uppermost curve (d/λT = 2) corresponds to the thickest TiO2 film. The intermediate curves were obtained for the normalized thickness values indicated.
In all cases, as the sample is displaced by a distance z from the focal plane of the acoustic lens, the reflected signal V exhibits a series of peaks and valleys due to constructive (peaks) and destructive (valleys) interference between propagating modes. A closer inspection reveals differences not only in amplitudes but also in periods. As film thickness increases, the oscillatory behavior of the V(z) curves changes slightly from that of the SiO2 substrate (d/λT = 0) to that of the thickest TiO2 films (d/λT = 2). Accordingly, the positions of peaks (or valleys) shift, and the spatial period enlarges with increasing normalized thickness.
These discrepancies are emphasized by FFT processing of the V(z) curves; the corresponding spectra are displayed in Figure 3b. As the layer thickness increases, the principal ray in the spectra—representing the Rayleigh mode—shows both an amplitude change and a shift in position. The amplitude changes reflect the efficiency of mode generation and its contribution to the acoustic signature. Moreover, it is clear from Figure 3b that as d/λT increases from 0 to 2, the efficiency of generalized Rayleigh wave modes increases regularly, indicating an efficient Rayleigh mode generation.
The shift in peak positions indicates variations in the spatial period between two successive minima (or maxima) in the V(z) curves. The deduced Δz values vary from 52.7 µm (for d/λT = 0) to 66.9 µm (for d/λT = 2), leading to changes in the values of propagating SAW velocities, in particular, VR. Consequently, the corresponding deduced VR according to Equation (5) was found to vary from 3415 m/s (for d/λT = 0) to 3830 m/s (for d/λT = 2).

3.3. Effects of Substrate Type on Elastic Parameters

To enrich and complete this study, and to demonstrate reproducibility, we examine the effect of layer thickness on the acoustic parameters of TiO2 films deposited on other substrates—Al2O3, Si, and Ti. These insulating (Al2O3), semiconducting (Si), and conducting (Ti) substrates are widely used in micro- and nanotechnological applications. They are characterized by different wave velocities (see Table 1). In fact, SAW velocities (VL and VT) of Al2O3 and Si are higher than those of TiO2, whereas Ti and SiO2 exhibit lower values.
Following the same calculation steps described above, we obtained R(θ), V(z), and VR for TiO2/Al2O3, TiO2/Si, and TiO2/Ti at different layer thicknesses. In all cases, the reflection coefficients (amplitude and phase) computed at various film thicknesses show behavior generally similar to that observed for TiO2/SiO2 in Figure 2: (i) a first small fluctuation at θL, (ii) a second variation at θT, and (iii) a very important change at θR. However, the positions of such critical angles depend on the substrate type.
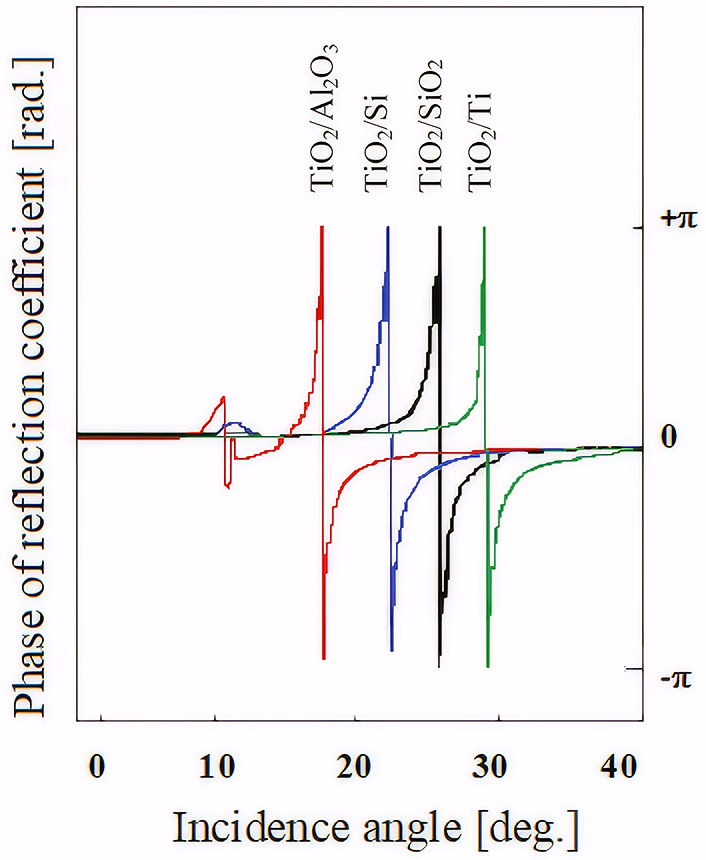
For clarity, we focus on the dominant 2π phase change at the Rayleigh critical angle. Figure 4 shows the phase of representative reflection coefficients at the intermediate normalized thickness d/λT = 0, for different film/substrate pairs: TiO2/Al2O3, TiO2/Si, TiO2/SiO2, and TiO2/Ti. As the incidence angle increases, all curves display similar overall behavior, with the strongest transition occurring near the Rayleigh critical angle. The position of this angle varies with the substrate, from 17.4° for TiO2/Al2O3 to 25.8° for TiO2/Ti, as summarized in Table 2.
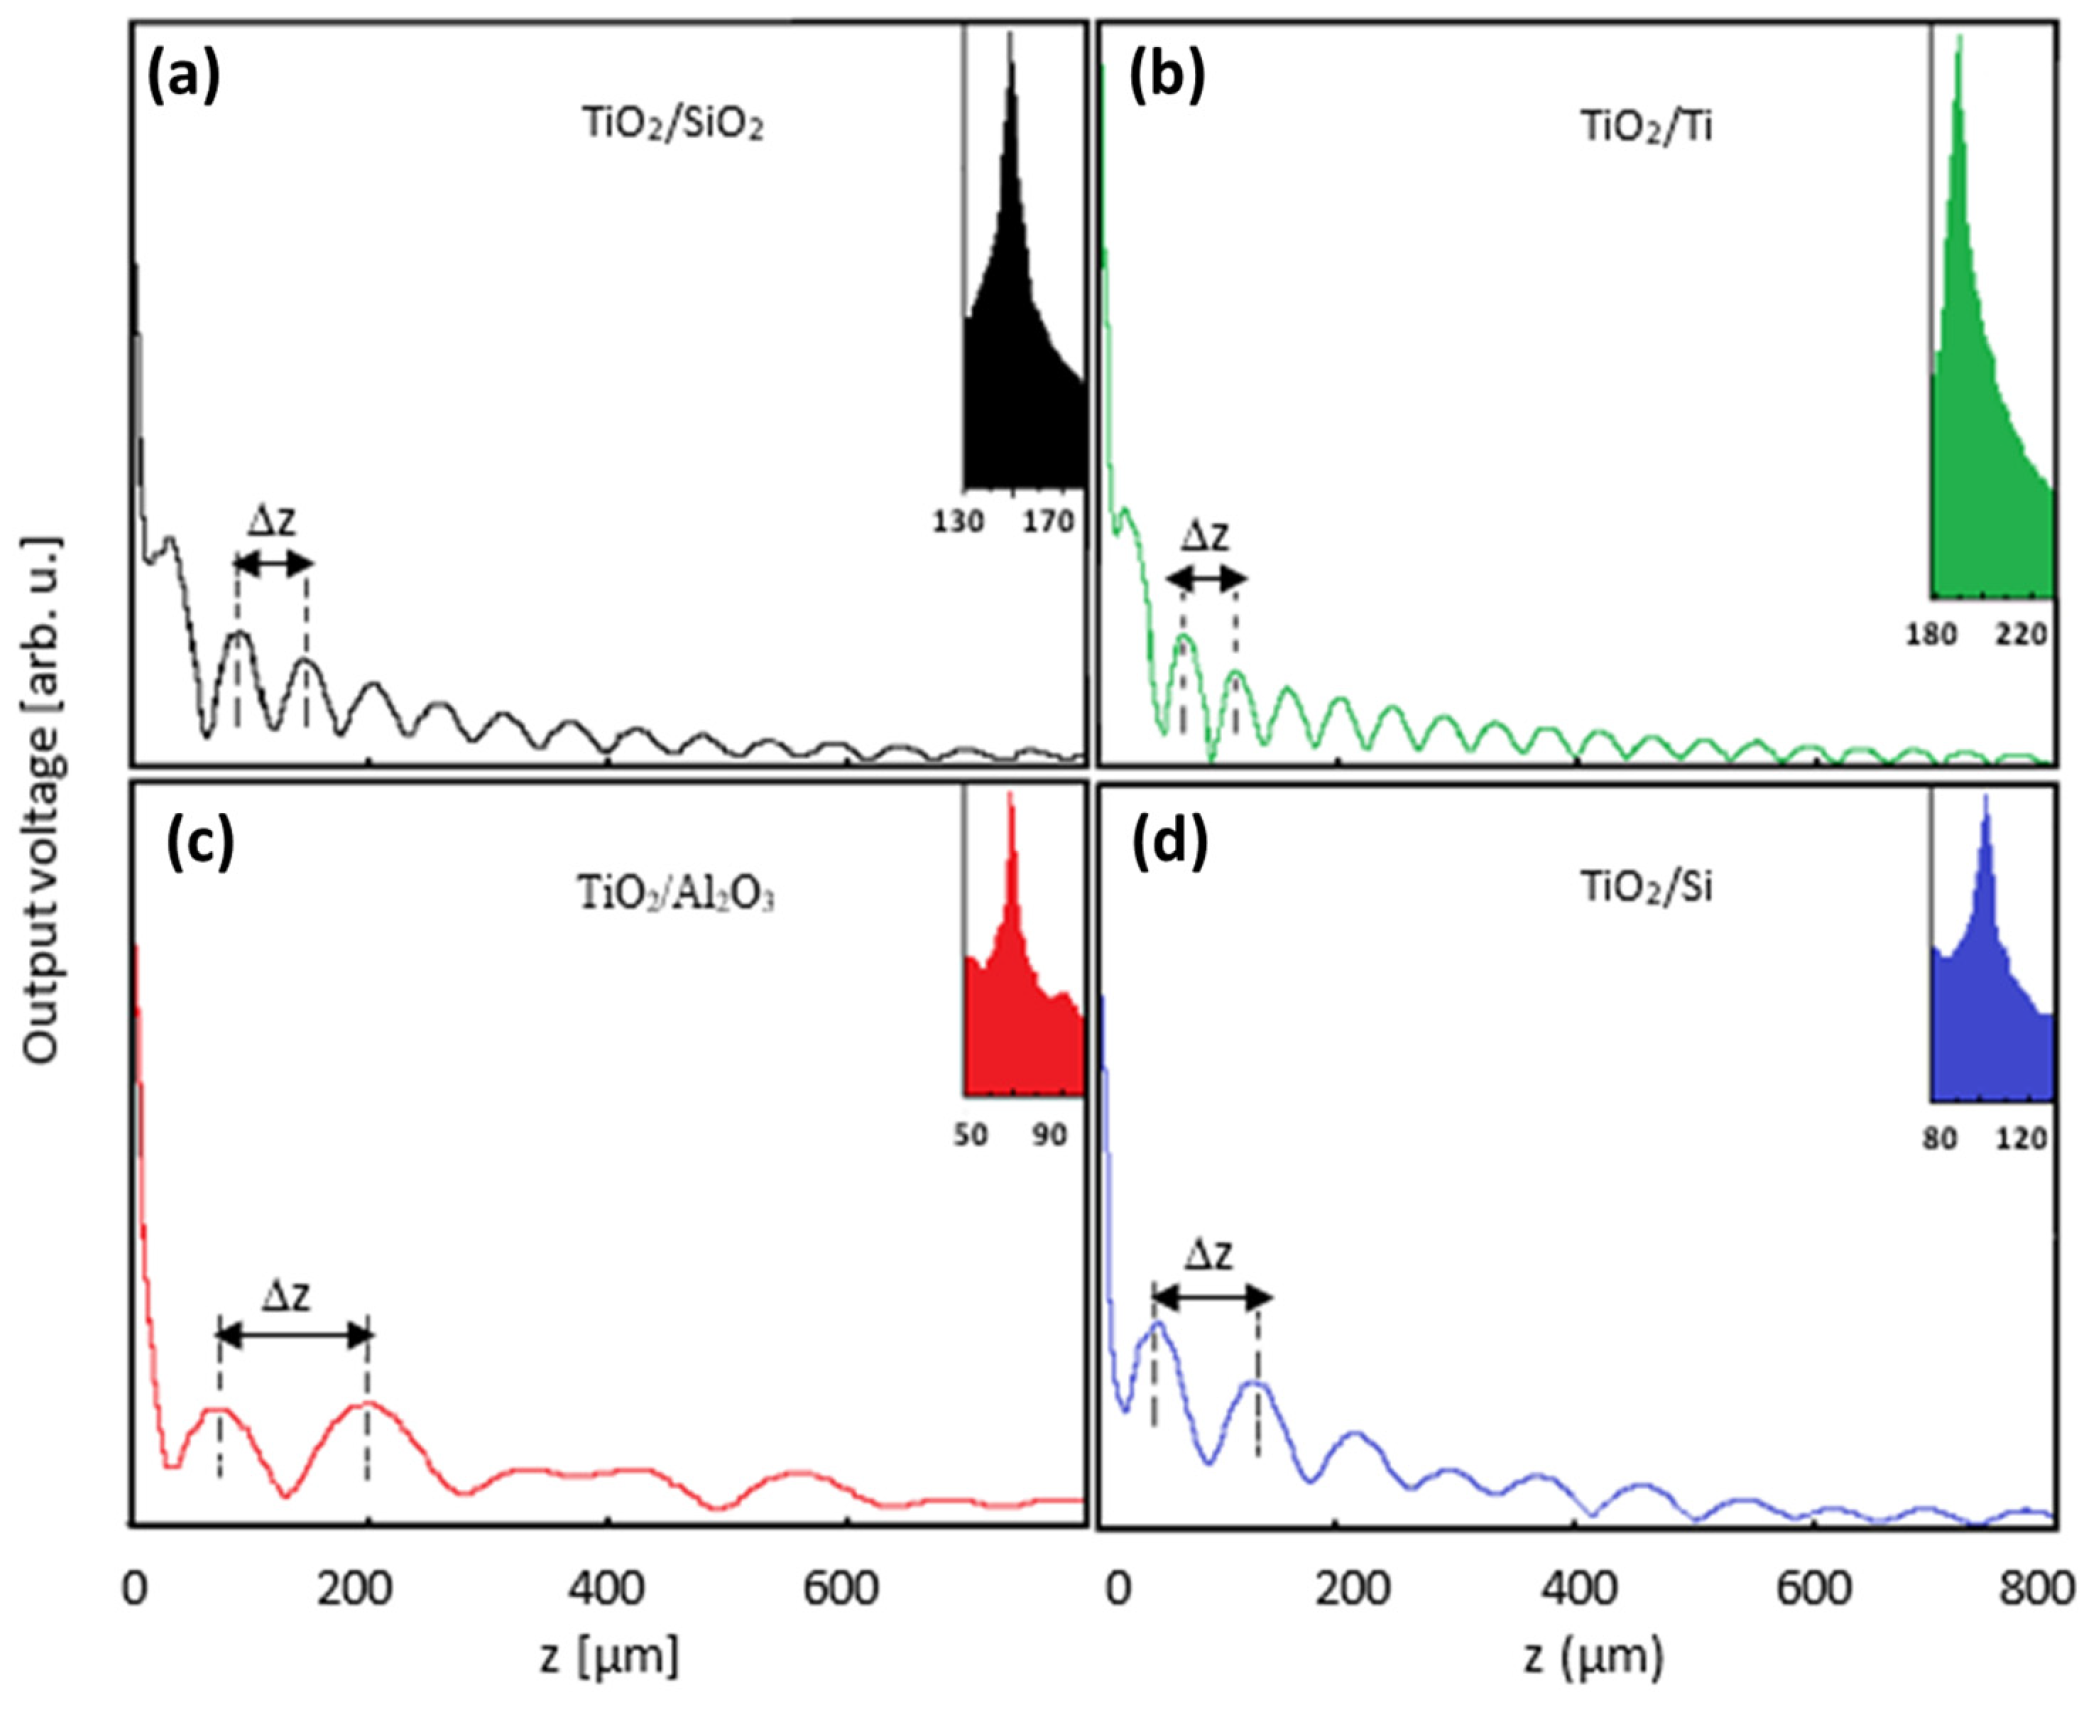
Figure 5 illustrates acoustic material signatures at d/λT = 0.3, for different layer/substrate structures: (a) SiO2, (b) Ti, (c) Al2O3, and (d) Si. All curves exhibit oscillatory behavior but differ in amplitude and spatial period. The deduced Δz values (Table 2) range from 118.7 µm for TiO2/Al2O3 to 48.1 µm for TiO2/Ti. FFT processing of the oscillatory V(z) curves (insets in each panel) yields the velocity of the dominant Rayleigh mode, VR, whose values are also summarized in Table 2; they vary from 5051 m/s for TiO2/Al2O3 to 3272 m/s for TiO2/Ti.
The variations in VR result from differences in the elastic properties of the bulk materials and their corresponding layers, as well as parameter mismatches between layers and substrates. The values obtained at d/λT = 0.3 for each layer/substrate pair do not coincide with those of the substrate alone or the layer alone; rather, they reflect the combined response of the full layer/substrate structure. To explain this behavior physically, we now examine the Rayleigh-wave velocity dispersion with layer thickness.

3.4. Rayleigh-Wave Velocity Dispersion

As shown above, increasing layer thickness modifies SAW velocities. These variations, known as velocity dispersion, can be positive or negative. Positive dispersion (stiffening effect) occurs when the wave velocity in the substrate is lower than that in the layer. Negative dispersion (loading effect) occurs when the SAW velocity in the substrate exceeds that of the layer.

3.4.1. TiO2 Film Stiffening Effect

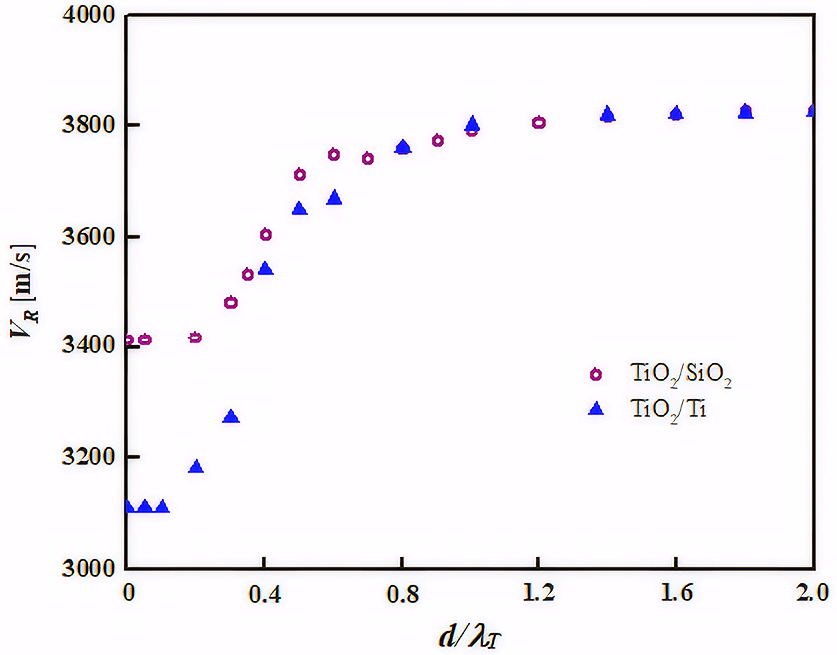
Figure 6 illustrates the variation in Rayleigh velocities with film thickness for the TiO2/SiO2 structure and the TiO2/Ti configuration. Both layer/substrate systems show similar increasing trends. It is worth noting that when the SAW velocity as a function of thickness exceeds the Rayleigh velocity of the substrate, the deposited film is said to stiffen the substrate, and the layer/substrate combination is termed a fast-on-slow system. In fact, the stiffening effect is observed when (VT)Layer > √2 (VT)Substrate [56,57,58,59].
For a clearer discussion of this dispersion, it is useful to consider three regions. In the initial region of very small thicknesses (from 0 to ≈0.2), the Rayleigh velocity remains at its lowest value—3415 m/s for TiO2/SiO2 and 3109 m/s for TiO2/Ti. In this region, most of the energy is carried in the substrate [28]; therefore, these values correspond to the Rayleigh velocity in bulk SiO2 and bulk Ti, respectively.
In the intermediate region (from ≈0.2 to about unity), the Rayleigh-wave velocity increases sharply with the thickness. This velocity reflects the combined response of the entire layer/substrate system: the wave propagates partly in the film and partly in the substrate. A closer look at the sharp rises for the TiO2/SiO2 and TiO2/Ti configurations reveals differences in (i) onset, (ii) final value, and (iii) slope. These discrepancies arise because the velocity variations depend on several elastic and physical parameters, such as bulk material properties, interface mismatch and adhesion, and differential stress [56,57,58,59].
In the third region, for large normalized thicknesses (dT ≥ 1), the Rayleigh velocity tends toward the same constant value for both TiO2/SiO2 and TiO2/Ti. Here, the TiO2 thickness exceeds the propagating wavelength, so the mode energy is confined to about one wavelength within the thick layer near the free surface. Consequently, surface-wave propagation in this relatively thick layer behaves as in the bulk, and the constant value of 3830 m/s represents bulk TiO2.
Establishing such a dispersion curve for a given layer/substrate configuration is valuable because it provides a theoretical thickness–velocity relationship for the idealized system considered here. The characteristic velocity may, in principle, be obtained independently, for example, from experimental V(z) curves using the SAM technique, although such validation is beyond the scope of the present study.

3.4.2. TiO2 Film Loading Effect

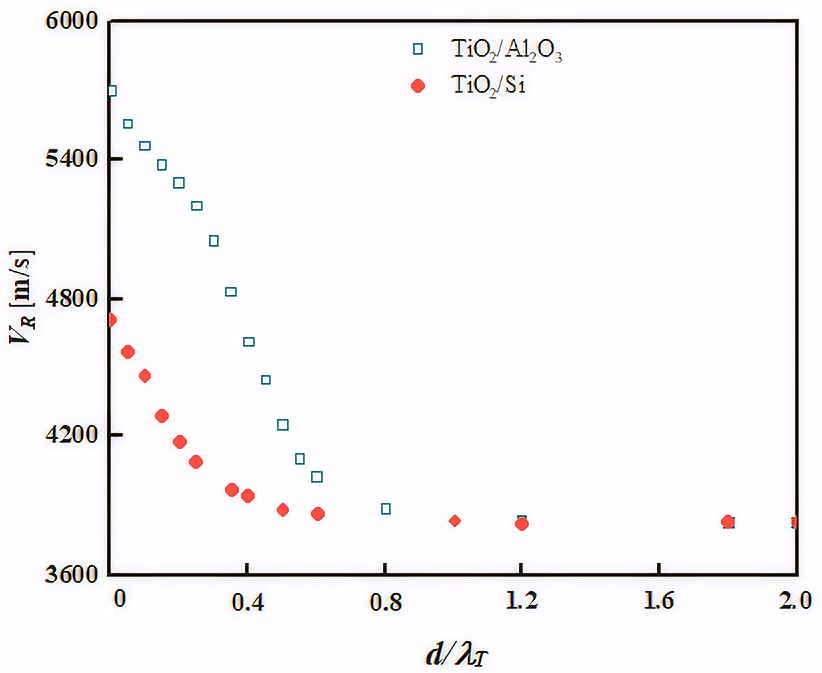
Figure 7 shows the variations in Rayleigh-wave velocity as a function of film thickness for the TiO2/Al2O3 and TiO2/Si configurations. The general trend exhibits an initial decrease with a negative slope, followed by a saturation region at higher thicknesses. The decrease in SAW velocity with layer thickness, indicating that the film loads the substrate, occurs for slow-on-fast systems when (VT)substrate > √2 (VT)layer [56,57,58,59].
For bare substrates (zero thickness), the Rayleigh velocity corresponds to that of the bulk substrate. Thus, under loading, the Rayleigh velocity decreases quasi-linearly from that of the Al2O3 substrate (VR = 5700 m/s) or Si (VR = 4712 m/s).
The initial decreasing trend is observed for thicknesses d/λT ≈ 1. In this regime—where the film is thinner than the transverse wavelength—the wave motion penetrates through the film into the substrate, so the determined reflection coefficient reflects the combined response of the entire layer/substrate structure. Each curve decreases sharply with a characteristic slope, and the differences between TiO2 on Al2O3 and on Si arise from the distinct acoustic properties of the substrates. In particular, density and SAW velocities influence the sharpness of the initial decrease in the dispersion curves. In all cases, the Rayleigh velocity tends toward a constant value of VR  3830 m/s, corresponding to bulk TiO2.
Once velocity–dispersion curves are established for a given film/substrate system, they provide theoretical reference trends relating film thickness and characteristic velocity under the assumptions of the present model. In principle, such trends may also be useful for parameter interpretation in conjunction with independent measurements, although quantitative estimation of elastic constants would require additional validation beyond the scope of this study. These relationships are of general interest for understanding the acoustic behavior of TiO2-based film/substrate systems [60].
Although the present velocity–thickness dispersion charts are established at the material/characterization level, they also have practical implications for SAW device operation. For a fixed acoustic wavelength, the operating frequency is directly related to the surface-wave phase velocity through f = VR/λ; therefore, thickness-induced variations in VR may shift the resonance condition. In water/droplet operation, the surface-wave phase velocity also governs liquid-coupling characteristics through phase-matching or leaky-wave radiation since the radiation angle in the liquid depends on cliquid/VR. Hence, accurate velocity–thickness maps are important for predicting coupling efficiency and device performance in aqueous SAW and acoustofluidic applications [60,61].
A comparative interpretation of the four TiO2/substrate systems shows that the observed differences in critical angles and velocity–thickness dispersion arise from the combined effect of acoustic impedance contrast and relative wave velocities in the film and substrate. The impedance mismatch influences the reflectance strength, whereas the relative longitudinal and transverse velocities govern the critical-angle positions and the leaky-wave contribution to the V(z) response. For small d/λT, the acoustic field remains mainly substrate-dominated, while increasing thickness progressively enhances the film contribution. As a result, TiO2/Al2O3 and TiO2/Si exhibit stronger thickness sensitivity associated with a loading-type behavior, whereas TiO2/SiO2 and TiO2/Ti show a stiffer response with comparatively more stable Rayleigh-wave velocities over the investigated range.

4. Limitations

The present study is based on a numerical SAM forward model using literature material constants for an idealized TiO2 layer. Therefore, the reported critical angles, V(z) responses, and leaky Rayleigh-wave velocities should be interpreted as theoretical trends under the stated assumptions, rather than as experimentally validated values for real coatings. In practice, TiO2 thin films may differ from this idealized description because of phase state, porosity, packing density, residual stress, surface/interface defects, and deposition-dependent microstructure, all of which may modify the effective elastic and acoustic properties. The TiO2 layer was modeled using literature bulk elastic constants as a first-order approximation. Although the thickness range considered here is in the microscale regime (8.7–57.6 µm), the effective properties of real films may still differ from bulk values because of the microstructural and deposition-related factors described above. Accordingly, the present analysis should be regarded as a theoretical baseline for ideal TiO2/substrate systems, while real coatings containing defects or heterogeneities may exhibit acoustic responses that depart from the predicted trends. No experimental SAM measurements were included in this work; therefore, the model predictions remain to be validated for fabricated TiO2/substrate systems. In addition, no quantitative sensitivity analysis was performed with respect to TiO2 elastic constants, density, coupling-liquid properties, or FFT-derived quantities. These limitations define the scope of the present contribution and should be taken into account in future experimental and sensitivity-based studies.

5. Conclusions

Numerical calculations of R(θ) and V(z), under normal SAM operating conditions, were performed for TiO2 thin films of different thicknesses deposited on Ti, Si, SiO2, and Al2O3 substrates—covering conductors, semiconductors, insulators, and fast/slow materials. Both R(θ) and V(z) curves highlight the strong influence of increasing TiO2 thickness on (i) the critical angles at which SAW modes are excited, (ii) the spatial periods, and (iii) the Rayleigh-wave velocity. A systematic examination of all layer/substrate combinations reveals positive (stiffening) or negative (loading) dispersion: an initial change in velocity from the substrate value toward that of the layer, followed by a saturation region. A saturation regime appears for thicker layers when d ≥ λT, beyond which the acoustic response approaches that of bulk TiO2, with a Rayleigh velocity close to 3830 m/s. The stiffening effect is obtained for TiO2/Ti and TiO2/SiO2, where VR increases from the substrate values—SiO2 (VR = 3415 m/s); Ti substrates (VR = 2965 m/s)—toward bulk TiO2. Conversely, the loading effect associated with slow-layer/fast-substrate systems appears for TiO2/Al2O3 and TiO2/Si, where VR decreases from Al2O3 (VR = 5700 m/s) or Si (VR = 4712 m/s) toward bulk TiO2. These dispersion curves provide theoretical reference trends relating film thickness and Rayleigh-wave velocity for the idealized TiO2/substrate systems considered here.

Author Contributions

H.E.D.: Formal analysis, Writing—original draft, Writing—review & editing; E.S.: Validation and Conceptualization; D.N.: Methodology; I.T.: Investigation; D.B.O.: Formal analysis; T.T. (Tourkia Tahri): Validation; T.T. (Talia Tene): Writing—review & editing. C.V.G.: Visualization, Conceptualization, and Writing—review & editing; L.G.: Visualization, Conceptualization, and Writing—review & editing; R.K.: Writing—review & editing; A.D.: Supervision and Writing—review. All authors have read and agreed to the published version of the manuscript.

Funding

This work has been partially supported by (i) DGRSDT, UBMA-Annaba (PRFU No. B00L02UN230120220009) and (ii) Universidad Técnica Particular de Loja under Grant No. POA VIN 54.

Institutional Review Board Statement

Not applicable.

Informed Consent Statement

Not applicable.

Data Availability Statement

Data will be made available upon reasonable request.

Conflicts of Interest

The authors declare no conflicts of interest.

References

  1. Romero Montalvo, C.; Aguilar, C.; Moctezuma, E. (Eds.) Titanium Dioxide; IntechOpen: London, UK, 2025. [Google Scholar] [CrossRef] [Scilit]
  2. Parrino, F.; Palmisano, L. (Eds.) Titanium Dioxide (TiO2) and Its Applications; Elsevier: Amsterdam, The Netherlands, 2021. [Google Scholar] [CrossRef] [Scilit]
  3. Samir, M.; Ismail, Z.; Agour, A.M.; Nageh, H.; Abdellatif, S.O. Exploring forward scattering mechanisms in TiO2 with carbon quantum dots: Insights into photovoltaic applications. Opt. Mater. 2024, 148, 114922. [Google Scholar] [CrossRef] [Scilit]
  4. Sunil, A.; Gopika, M.S.; Jayasudha, S.; Nair, P.B. Multifunctional applications of TiO2 thin films synthesized by sol–gel dip coating technique. J. Sol. Gel. Sci. Technol. 2024, 110, 326–342. [Google Scholar] [CrossRef] [Scilit]
  5. Hegeman, I.; Dijkstra, M.; Segerink, F.B.; Lee, W.; Garcia-Blanco, S.M. Development of low-loss TiO2 waveguides. Opt. Express 2020, 28, 5982–5990. [Google Scholar] [CrossRef] [Scilit]
  6. Zhou, M.; Liu, Y.; Wu, B.; Zhang, X. Different crystalline phases of aligned TiO2 nanowires and their ethanol gas sensing properties. Phys. E Low-Dimens. Syst. Nanostructures 2019, 114, 113601. [Google Scholar] [CrossRef] [Scilit]
  7. Butt, M.A.; Kazanskiy, N.L.; Khonina, S.N.; Voronkov, G.S.; Grakhova, E.P.; Kutluyarov, R.V. A review on photonic sensing technologies: Status and outlook. Biosensors 2023, 13, 568. [Google Scholar] [CrossRef] [Scilit]
  8. Dou, H.; Long, D.; Rao, X.; Zhang, Y.; Qin, Y.; Pan, F.; Wu, K. Photocatalytic degradation kinetics of gaseous formaldehyde flow using TiO2 nanowires. ACS Sustain. Chem. Eng. 2019, 7, 4456–4463. [Google Scholar] [CrossRef] [Scilit]
  9. Wang, C.; Yin, L.; Zhang, L.; Qi, Y.; Lun, N.; Liu, N. Large scale synthesis and gas-sensing properties of anatase TiO2 three-dimensional hierarchical nanostructures. Langmuir 2010, 26, 12841–12848. [Google Scholar] [CrossRef] [Scilit]
  10. Katal, R.; Masudy-Panah, S.; Tanhaei, M.; Hossein, M.; Farahani, D.A.; Jiangyong, H. A review on the synthesis of the various types of anatase TiO2 facets and their applications for photocatalysis. Chem. Eng. J. 2020, 384, 123384. [Google Scholar] [CrossRef] [Scilit]
  11. Fahmi, A.; Minot, C.; Silvi, B.; Causa, M. Theoretical analysis of the structures of titanium dioxide crystals. Phys. Rev. B 1993, 47, 11717. [Google Scholar] [CrossRef] [Scilit] [PubMed]
  12. Fouda, A.N. Influence of deposition temperature on the structural and dispersion parameters of TiO2 thin films. Appl. Phys. A 2020, 126, 48. [Google Scholar] [CrossRef] [Scilit]
  13. Beltran, A.; Sambrano, J.R.; Calatayud, M.; Sensato, F.R.; Andres, J. Static simulation of bulk and selected surfaces of anatase TiO2. Surf. Sci. 2001, 490, 116–124. [Google Scholar] [CrossRef] [Scilit]
  14. Kumar, A.; Pandey, G. Different methods used for the synthesis of TiO2 based nanomaterials: A review. Am. J. Nano Res. Appl. 2018, 6, 1–10. [Google Scholar] [CrossRef] [Scilit]
  15. Doghmane, H.E.; Challali, F.; Touam, T.; Chelouche, A.; Djouadi, D. Radio frequency magnetron sputtering growth of titanium dioxide thin films: Effects of substrate temperature on microstructural and optical properties. J. Nano Res. 2021, 70, 1–14. [Google Scholar] [CrossRef] [Scilit]
  16. Shamma, K.; Aldwayyan, A.; Albrithen, H.; Alodhayb, A. Exploiting the properties of TiO2 thin films as a sensing layer on (MEMS)-based sensors for radiation dosimetry applications. AIP Adv. 2021, 11, 025209. [Google Scholar] [CrossRef] [Scilit]
  17. Seo, K.-H.; Feng, J.; Bae, J.-H. In-depth analysis on the Fabry–Perot effect of Cs2AgBiBr6 double perovskite-based solar cells via optical path length modulation. Int. J. Energy Res. 2024, 2024, 9935893. [Google Scholar] [CrossRef] [Scilit]
  18. Duda, A.; Kopyciński, B.; Hawelek, Ł.; Lis, M.; Muzia, G.; Morin, A. Preparation, characterization, and photocatalytic performance of atmospheric plasma-sprayed TiO2/Al2O3 coatings on glass substrates. Arch. Civ. Mech. Eng. 2024, 24, 142. [Google Scholar] [CrossRef] [Scilit]
  19. Ungureanu, C.; Dumitriu, C.; Popescu, S.; Enculescu, M.; Tofan, V.; Popescu, M.; Pirvu, C. Enhancing antimicrobial activity of TiO2/Ti by torularhodin bioinspired surface modification. Bioelectrochemistry 2016, 107, 14–24. [Google Scholar] [CrossRef] [Scilit] [PubMed]
  20. Tsotetsi, D.; Noto, L.; Idisi, D.; Benecha, E.; Dhlamini, M.; Mbule, P. Computational and experimental investigation of the structure, morphology, optical and electrical properties of TiO2 and caffeine adsorbed TiO2 in methyl ammonium lead iodide. Mater. Today Commun. 2024, 38, 108453. [Google Scholar] [CrossRef] [Scilit]
  21. Jolivet, A.; Labbé, C.; Frilay, C.; Debieu, O.; Marie, P.; Horcholle, B.; Lemarié, F.; Portier, X.; Grygiel, C.; Duprey, S.; et al. Structural, optical, and electrical properties of TiO2 thin films deposited by ALD: Impact of the substrate, the deposited thickness and the deposition temperature. Appl. Surf. Sci. 2023, 608, 155214. [Google Scholar] [CrossRef] [Scilit]
  22. Ottermann, C.R.; Rucknerhect, R.; Anderson, O.; Hess, P.; Bange, K. Young’s modulus and density of thin TiO2 films produced by different methods. MRS Proc. 1996, 436, 251. [Google Scholar] [CrossRef] [Scilit]
  23. Hussain, A.; Rauf, A.; Ahmed, E.; Khan, M.S.; Mian, S.A.; Jang, J. Modulating Optoelectronic and Elastic Properties of Anatase TiO2 for Photoelectrochemical Water Splitting. Molecules 2023, 28, 3252. [Google Scholar] [CrossRef] [Scilit]
  24. Olayinka, A.S.; Adetunji, B.I.; Idiodi, J.O.A.; Aghemelon, U. Ab initio study of electronic and optical properties of nitrogen-doped rutile TiO2. Int. J. Mod. Phys. B 2019, 33, 1950036. [Google Scholar] [CrossRef] [Scilit]
  25. Nawaf, S.; Ibrahim, A.K.; Al-Jobory, A.A. Electronic structure and optical properties of Fe-doped TiO2 by ab initio calculations. Int. J. Mod. Phys. C 2023, 34, 2350016. [Google Scholar] [CrossRef] [Scilit]
  26. Briggs, G.A.D.; Kolosov, O.V. Acoustic Microscopy, 2nd ed.; Oxford University Press: Oxford, UK, 2010. [Google Scholar]
  27. Yu, H. Scanning acoustic microscopy for material evaluation. Appl. Microsc. 2020, 50, 25. [Google Scholar] [CrossRef] [Scilit] [PubMed]
  28. Maev, R.G. Advances in acoustic microscopy and high resolution ultrasonic imaging: From principles to new applications. In Proceedings of the SPIE Medical Imaging 2014: Ultrasonic Imaging and Tomography, San Diego, CA, USA, 20 March 2014; SPIE: San Diego, CA, USA, 2014; Volume 9040, p. 904007. [Google Scholar] [CrossRef] [Scilit]
  29. Auld, B.A. Acoustic Fields and Waves in Solids; Wiley-Interscience: New York, NY, USA, 1973; Volume 1. [Google Scholar]
  30. Brekhovskikh, L.M.; Godin, O.A. Acoustics of Layered Media I: Plane and Quasi-Plane Waves; Springer: Berlin/Heidelberg, Germany, 1990. [Google Scholar] [CrossRef] [Scilit]
  31. Weglein, R.D.; Mal, A.K. Elastic characterization of diamond films by acoustic microscopy. Surf. Coat. Technol. 1991, 47, 677–686. [Google Scholar] [CrossRef] [Scilit]
  32. Dubey, P.; Declercq, N.F.; Zhai, M.; Locquet, A.; Jung, M.; Woo, D.; Citrin, D.S. Acoustic microscopy characterization of highly-ordered anodized nanoporous alumina films for nanotechnology applications. Surf. Interfaces 2023, 42, 103450. [Google Scholar] [CrossRef] [Scilit]
  33. Lafrance, S.; Bernadin, S. Scanning acoustic microscopy for 3D print quality control. In Proceedings of the SoutheastCon 2024, Atlanta, GA, USA, 15–24 March 2024; pp. 1250–1255. [Google Scholar] [CrossRef] [Scilit]
  34. Pan, J.Z.; Jenkins, P.J.; de los Rios, E.R.; Miller, K.J. Detecting small fatigue cracks by acoustic microscopy. Fatigue Fract. Eng. Mater. Struct. 1993, 16, 1329–1337. [Google Scholar] [CrossRef] [Scilit]
  35. Briggs, A. (Ed.) Advances in Acoustic Microscopy; Springer Science+Business Media: New York, NY, USA, 1995; Volume 1. [Google Scholar]
  36. Doghmane, A.; Hadjoub, Z. Theoretical and experimental investigations of acoustic signatures of materials using scanning microscopes with variable lens illumination. J. Phys. D Appl. Phys. 1997, 30, 2777–2782. [Google Scholar] [CrossRef] [Scilit]
  37. Hadjoub, I.; Doghmane, A.; Hadjoub, Z. Microacoustic investigations of different structural forms of silicon. J. Phys. IV 2005, 124, 141–146. [Google Scholar] [CrossRef] [Scilit]
  38. Doghmane, A.; Hadjoub, Z.; Hadjoub, F. Nondestructive acoustic microcharacterisation of heteropolysiloxane thin films. Thin Solid Films 1997, 310, 203–207. [Google Scholar] [CrossRef] [Scilit]
  39. Boumaiza, Y.; Hadjoub, Z.; Doghmane, A.; Deboub, L. Porosity effects on different measured acoustic parameters of porous silicon. J. Mater. Sci. Lett. 1999, 18, 295–297. [Google Scholar] [CrossRef] [Scilit]
  40. Morales, J.G.; Rodriguez, R.; Durand, J.; Ferdj-Allah, H.; Hadjoub, Z.; Attal, J.; Doghmane, A. Characterization and identification of berlinite crystals by acoustic microscopy. J. Mater. Res. 1991, 6, 2484–2489. [Google Scholar] [CrossRef] [Scilit]
  41. Bouhedja, S.; Hadjoub, I.; Doghmane, A.; Hadjoub, Z. Investigation of Rayleigh wave attenuation via annular lenses in acoustic microscopy. Phys. Status Solidi A 2005, 202, 1025–1032. [Google Scholar] [CrossRef] [Scilit]
  42. Doghmane, A.; Douafer, S.; Hadjoub, Z. Investigation of pressure effects on elastic parameters of isotropic and anisotropic MgO. J. Optoelectron. Adv. Mater. 2014, 16, 1339–1343. [Google Scholar]
  43. Sheppard, C.J.R.; Wilson, T. Effects of high angles of convergence on V(z) in the scanning acoustic microscope. Appl. Phys. Lett. 1981, 38, 858–859. [Google Scholar] [CrossRef] [Scilit]
  44. Brekhovskikh, L.M.; Godin, O.A. Acoustics of Layered Media II: Point Sources and Bounded Beams, 2nd ed.; Springer: Berlin/Heidelberg, Germany, 1999. [Google Scholar]
  45. Briggs, A. Acoustic microscopy—A summary. Rep. Prog. Phys. 1992, 55, 851. [Google Scholar] [CrossRef] [Scilit]
  46. Kushibiki, J.; Chubachi, N. Material characterization by line-focus-beam acoustic microscope. IEEE Trans. Sonics Ultrason. 1985, 32, 189–212. [Google Scholar] [CrossRef] [Scilit]
  47. Ohashi, Y.; Kushibiki, J. Development of an improved calibration method for the LFB ultrasonic material characterization system. IEEE Trans. Ultrason. Ferroelectr. Freq. Control 2004, 51, 686–694. [Google Scholar] [CrossRef] [PubMed]
  48. Lemons, R.A.; Quate, C.F. Acoustic microscopy. In Physical Acoustics; Academic Press: Cambridge, MA, USA, 1979; Volume 14, pp. 1–92. [Google Scholar]
  49. Zinin, P.V. Handbook of Elastic Properties of Solids, Liquids and Gases; Levy, M., Bass, H.E., Stern, R., Eds.; Academic Press: New York, NY, USA, 2001. [Google Scholar]
  50. Bertocci, F.; Grandoni, A.; Djuric-Rissner, T. Scanning Acoustic Microscopy (SAM): A Robust Method for Defect Detection during the Manufacturing Process of Ultrasound Probes for Medical Imaging. Sensors 2019, 19, 4868. [Google Scholar] [CrossRef] [Scilit]
  51. Atalar, A.; Oymen, H.K.; Bozkurt, A.; Yaralıoğlu, G. Lens geometries for quantitative acoustic microscopy. In Advances in Acoustic Microscopy; Briggs, A., Ed.; Plenum Press: New York, NY, USA, 1995; pp. 117–151. [Google Scholar]
  52. Hadjoub, Z.; Alami, K.; Doghmane, A.; Saurel, J.M.; Attal, J. Acoustic microscopy skimming mode generation using small aperture lenses. Electron. Lett. 1991, 27, 773–775. [Google Scholar] [CrossRef] [Scilit]
  53. Ottermann, C.R.; Bange, K. Correlation between the density of TiO2 films and their properties. Thin Solid Films 1996, 286, 32–34. [Google Scholar] [CrossRef] [Scilit]
  54. Grimsditch, M.; Zouboulis, E.S.; Polian, A. Elastic constants of boron nitride. J. Appl. Phys. 1994, 76, 832–834. [Google Scholar] [CrossRef] [Scilit]
  55. Khamdi, O.; Marjouri, A.; Larki, T. Theoretical and experimental investigation of the electronic, optical, electric, and elastic properties of Zn-doped anatase TiO2 for photocatalytic applications. Appl. Phys. A 2021, 127, 557. [Google Scholar] [CrossRef] [Scilit]
  56. Mahmood, T.; Malik, H.; Batool, R.; Perveen, Z.; Saleemi, F.; Rasheed, H.; Saeed, M.A.; Cao, C.; Rizwan, M. Elastic, electronic and optical properties of anatase TiO2 under pressure: A DFT approach. Chin. J. Phys. 2017, 55, 1252–1263. [Google Scholar] [CrossRef] [Scilit]
  57. Farnell, G.W.; Adler, E.L. Elastic Wave Propagation in Thin Layers. In Physical Acoustics: Principles and Methods; Mason, W.P., Thurston, R.N., Eds.; Academic Press: New York, NY, USA, 1972; Volume 9, pp. 35–127. [Google Scholar]
  58. Achenbach, J.D. The Evaluation of Materials and Structures by Quantitative Ultrasonics; CISM International Centre for Mechanical Sciences; Springer: Vienna, Austria, 1993; Volume 330. [Google Scholar]
  59. Hadjoub, Z.; Beldi, I.; Doghmane, A. Origin and quantification of anomalous behaviour in velocity dispersion curves of stiffening layer/substrate configurations. Comptes Rendus. Phys. 2007, 8, 948–954. [Google Scholar] [CrossRef] [Scilit]
  60. Priya, R.B.; Venkatesan, T.; Pandiyarajan, G.; Pandya, H.M. A short review of saw sensors. J. Environ. Nanotechnol. 2015, 4, 15–22. [Google Scholar] [CrossRef] [Scilit]
  61. Friend, J.; Yeo, L.Y. Microscale acoustofluidics: Microfluidics driven via acoustics and ultrasonics. Rev. Mod. Phys. 2011, 83, 647–704. [Google Scholar] [CrossRef] [Scilit]
Figure 1. Schematic diagram showing different calculation steps.
Coatings 16 00410 g001
Figure 2. Amplitude (______) and phase (- - -) of reflection coefficients of TiO2/SiO2 structures as a function of incidence angles at different normalized layer thicknesses; (a) d/λT = 0, (b) d/λT = 0.3, (c) d/λT = 0.4, (d) d/λT = 0.6, (e) d/λT = 1, (f) d/λT = 2.
Coatings 16 00410 g002
Figure 3. Acoustic signatures (a) and corresponding FFT spectra (b) of TiO2/SiO2 structures at different normalized layer thicknesses, d/λT = 0, d/λT = 0.3, d/λT = 0.4, d/λT = 0.6, d/λT = 1, d/λT = 2.
Coatings 16 00410 g003
Figure 4. Phase of reflection coefficients of TiO2 thin films at d/λT = 0.3 deposited on different substrates: Al2O3, Si, SiO2, and Ti.
Coatings 16 00410 g004
Figure 5. V(z) of TiO2 thin films, at d/λT = 0.3, deposited on different substrates: (a) SiO2, (b) Ti, (c) Al2O3, and (d) Si.
Coatings 16 00410 g005
Figure 6. Rayleigh-wave velocity of TiO2/SiO2 and TiO2/Ti configurations as a function of normalized layer thicknesses.
Coatings 16 00410 g006
Figure 7. Rayleigh-wave velocity of TiO2/Al2O3 and TiO2/Si configurations as a function of normalized layer thicknesses.
Coatings 16 00410 g007
Table 1. Elastic characteristics of different substrates: SiO2, Al2O3, Ti, and Si.
Substratesρ (kg/m3)VL (m/s)VT (m/s)Ref.
SiO2215059683764[26]
Al2O3397010,8226163[26]
Ti450861303182[26]
Si230091605085[37]
Table 2. Determined parameters for TiO2/different substrates at d/λT = 0.3.
StructureθR (deg.)Δz (µm)VR (m/s)
TiO2/Al2O317.4118.75051
TiO2/Si22.180.14174
TiO2/SiO225.654.93483
TiO2/Ti25.848.13272
Disclaimer/Publisher’s Note: The statements, opinions and data contained in all publications are solely those of the individual author(s) and contributor(s) and not of MDPI and/or the editor(s). MDPI and/or the editor(s) disclaim responsibility for any injury to people or property resulting from any ideas, methods, instructions or products referred to in the content.