1. Introduction
Surface engineering plays a central role in improving the durability, efficiency, and functionality of metallic components operating under demanding mechanical or environmental conditions [
1,
2,
3,
4,
5]. In sectors such as automotive, aerospace, manufacturing, and construction, the optimization of surface properties, including hardness, tribological behaviour, and wetting response, is essential for extending service life and reducing maintenance costs [
6,
7]. In this context, electrodeposited metallic and alloy coatings continue to attract significant attention due to their versatility, low processing cost, low energy consumption, scalability, and ability to tailor composition, microstructure and thickness of the coatings through electrolyte chemistry and deposition parameters [
8,
9,
10].
Among the various electrodeposited alloys, Ni–P coatings have emerged as particularly relevant due to the advantageous combination of mechanical strength, corrosion resistance, and tribological performance associated with their amorphous or nanocrystalline structures [
11]. The incorporation of phosphorus fundamentally alters the growth mechanism and local atomic arrangement of nickel, enabling enhanced wear resistance, reduced coefficient of friction, and improved chemical stability [
6]. Despite the maturity of Ni–P technology, the relationship between electrolyte composition, bath pH, deposition efficiency, and the resulting functional properties remains an active field of investigation. This is especially true for systems where phosphorous acid (H
3PO
3) is used as the phosphorus source, as its dual role, introducing reducible P species while simultaneously modifying the bath acidity, affects both deposition kinetics and coating structure in a highly nonlinear way [
12]. Further systematic studies are, therefore, needed to clarify how variations in H
3PO
3 concentration govern current efficiency, alloy formation, microstructural evolution, and the mechanical and tribological behaviour of the resulting coatings.
Beyond mechanical and structural attributes, surface wettability is increasingly relevant for engineering applications involving lubrication, anti-fouling behaviour, moisture control, or self-cleaning performance [
13,
14]. Achieving controlled hydrophobicity on Ni–P coatings may provide additional functional value, but the influence of deposition conditions on the surface’s ability to support chemical functionalization remains largely unexplored.
Despite extensive research on Ni–P electrodeposition using phosphorous acid (H3PO3) as the phosphorus source, most previous studies have considered bath pH either as a secondary variable or as an independently adjusted parameter, typically controlled using conventional acids or buffer systems.
For example, Hu and Bai [
15] adjusted the bath pH to deposit Ni–P coatings and examined the dependence of microhardness and magnetic properties on the phosphorus content of the deposits. Similarly, Jeong et al. [
16] adjusted the bath pH to study hardness and Taber abrasive wear resistance as a function of incorporated phosphorus. Yuan et al. [
17] further explored the effects of bath pH and H
3PO
3 concentration on the phosphorus content in Ni–P deposits. Using response surface methodology, temperature, current density, pH, phosphorous acid concentration, and agitation rate were analyzed simultaneously, leading to the formulation of a predictive model for controlling phosphorus content in Ni–P deposits. Nava et al. [
18], working at a bath pH of 1.5, studied the influence of thermal treatment on the tribological properties (hardness, wear resistance, and coefficient of friction) and corrosion resistance of electrodeposited Ni–P coatings containing 10.6 at.% phosphorus. In sulfamate-based electrolytes, Chang et al. [
19] investigated the relationship between bath pH and structural characteristics of Ni–P deposits. In their work, pH values ranging from 1.5 to 3.5 were adjusted using sulfamate acid or nickel carbonate, and the effects of electrolyte pH on phosphorus content, residual stress, and microstructure of Ni–P deposits were systematically examined. Kurowski et al. [
20] investigated the evolution of growth morphology and composition during the initial stages of Ni–P electrodeposition. Other works have focused on electrochemical parameters and pulse plating effects. Pillai et al. [
21] systematically studied the influence of current density, phosphorous acid concentration, phosphoric acid concentration, and plating temperature on both the phosphorus content and deposition rate. Their results demonstrated that the effect of current density on phosphorus incorporation strongly depends on the phosphorous acid concentration in the bath, with corresponding changes in surface morphology, microstructure, microhardness, and elastic modulus. Chen et al. [
22] electrodeposited Ni–P coatings with varying phosphorus content and internal stress from a nickel sulfamate bath without additives by adjusting pulse current duty cycle and frequency. Similarly, Lin et al. [
23] investigated pulse-current electrodeposition of Ni–P from a nickel sulfamate bath containing phosphorous acid, emphasizing the effects of current density, duty cycle, and pulse frequency.
Studies specifically addressing the coefficient of friction have been predominantly focused on electroless Ni–P coatings [
24,
25,
26,
27] or on electrodeposited Ni–P systems in which phosphorus incorporation was achieved without the use of phosphorous acid [
28].
In contrast, the direct coupling between phosphorus incorporation, bath acidification, and deposition efficiency when phosphorous acid is used as the phosphorus source has not been fully isolated or quantitatively assessed. While several studies have reported the influence of pH or phosphorus content on growth morphology and mechanical properties, a combined and fully correlated analysis of current efficiency, alloy composition, microstructure, tribological behavior, and post-deposition surface functionalization within a single experimental framework remains limited.
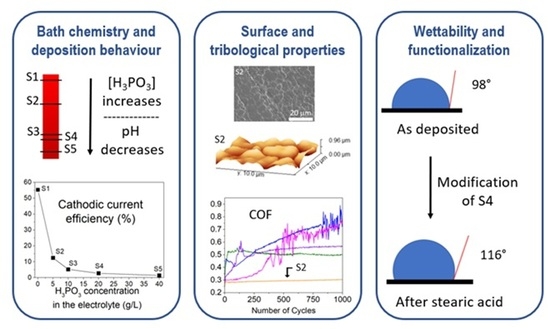
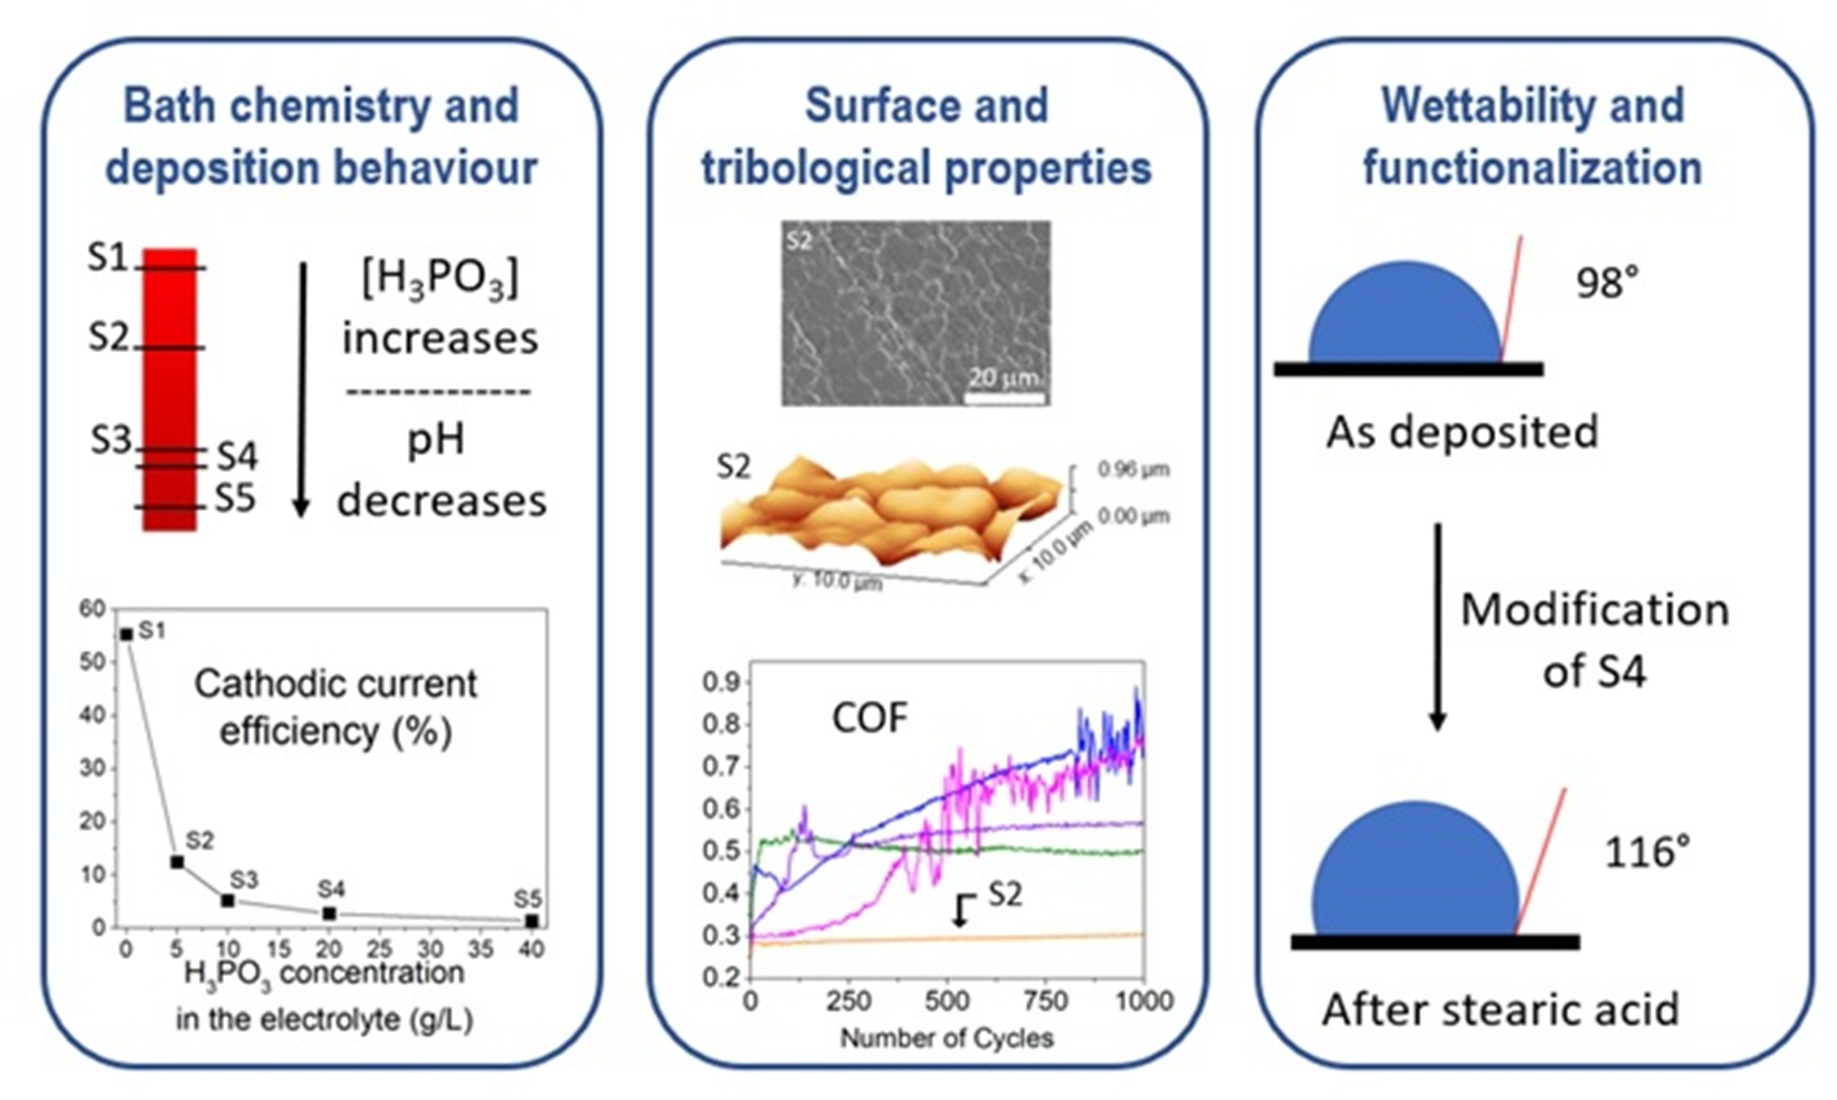
In this work, we systematically investigate the effect of H3PO3-induced pH variation on the electrodeposition behaviour, structural development, and functional performance of Ni–P coatings. By adjusting phosphorous acid concentration from 0 to 40 g/L, we quantify the resulting changes in cathodic current efficiency, deposition rate, alloy composition, and morphology. We further assess how these variations influence tribological performance, identifying the conditions leading to the lowest coefficient of friction. Finally, to evaluate the functionalization potential of the coatings, a post-deposition stearic acid treatment is applied to probe the relationship between deposition conditions and the coating’s ability to support hydrophobic chemisorption.
This integrated approach provides new insights into the interplay between bath acidity, phosphorus incorporation, film microstructure, and the resulting tribological and surface properties. The findings contribute both to fundamental understanding and to the practical optimization of Ni–P electroplating processes for applications requiring controlled friction behaviour, enhanced wear resistance, or tailored wettability.
2. Materials and Methods
2.1. Chemical Bath and Electrodeposition Process
Ni and Ni–P films were electrodeposited on 316L stainless steel quadrangular substrates (20 × 20 × 1 mm
3). During the electrodeposition process, a delimited surface area of 6 cm
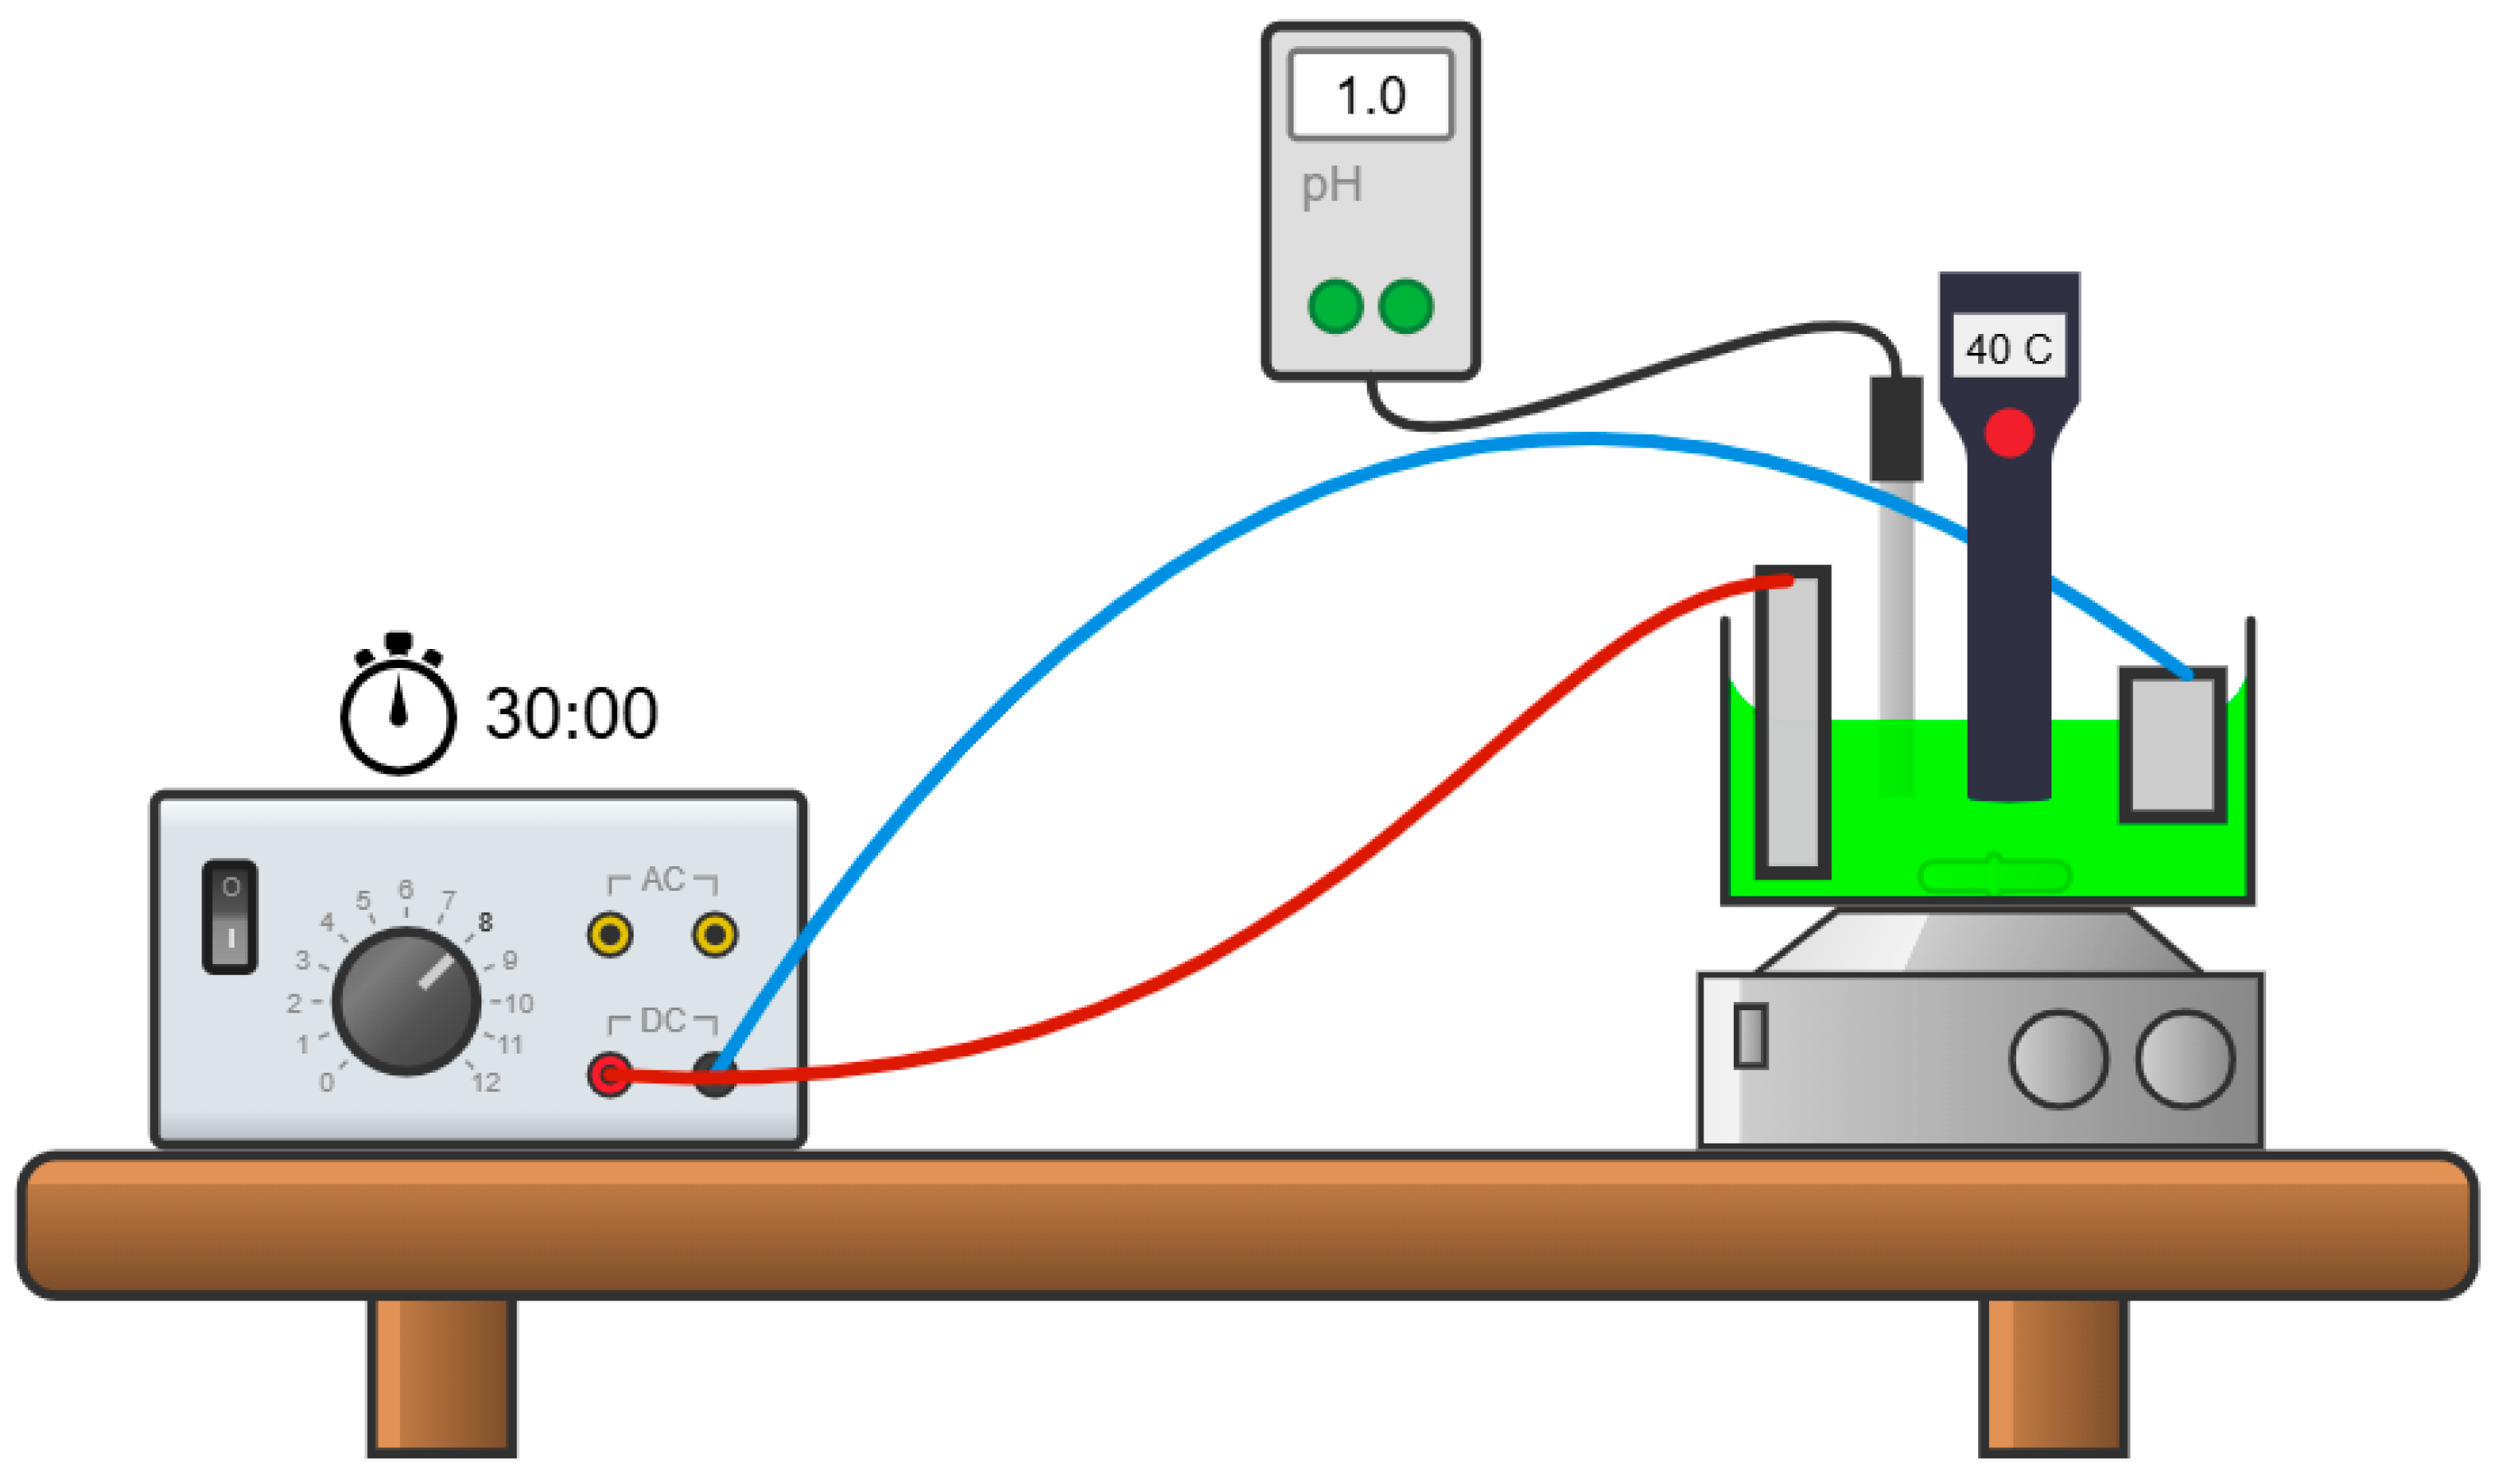
2, defined by Kapton tape, was immersed in the electrolyte contained in a polyethylene vessel. The substrate was connected to the negative terminal of a programmable power supply (EA-PSI 9360-15, Elektro-Automatik, Viersen, Germany), serving as cathode, while a pure nickel sheet served as the anode and was connected to the positive terminal. The electrodeposition setup used in this work is schematically represented in
Figure 1.
To properly activate the metallic surfaces for electrodeposition and effectively remove the protective oxide layer that could hinder adhesion, a multi-stage surface preparation procedure was performed, interspersed with deionized water rinses. This procedure included 30 s of acetone degreasing followed by 30 s of hydrochloric acid (HCl, 37% w/w, Panreac, Barcelona, Spain) etching. The substrate was then immediately immersed in the electrolytic bath.
The electrodeposition bath contained nickel sulfate hexahydrate (NiSO
4·6H
2O, 98%, Thermo Scientific, Waltham, MA, USA) as the primary Ni source [
29]; nickel chloride hexahydrate (NiCl
2·6H
2O, 98%, Thermo Scientific) to increase solution conductivity thereby reducing voltage requirements and it is also important in obtaining satisfactory dissolution of nickel anodes [
29]; phosphorous acid (H
3PO
3, >98%, Thermo Scientific) as the P source [
11]; and phosphoric acid (H
3PO
4, >98%, Thermo Scientific) as a pH buffer and to prevent H
3PO
3 oxidation [
11]. Five different concentrations of H
3PO
3, ranging from 0 to 40 g/L, were used, selected on the basis of values reported in the literature for Ni–P electrodeposition using phosphorous acid [
30]. Electrodeposition was carried out for 30 min at (40 ± 1) °C, with continuous magnetic stirring at 200 rpm, under a direct current density of 0.100 A/m
2. The composition of the electrodeposition baths, the experimental conditions used for the development of the coatings, and the sample designations are listed in
Table 1.
2.2. Post-Treatment of the Coatings
For the post-treatment, the samples were immersed in a 0.05 mol·L−1 ethanolic stearic acid solution (≥97%, Chemlab, Bensheim, Germany) for 20 h. Subsequently, the samples were dried at 150 °C for 1 h at a heating rate of 10 °C/min.
2.3. Characterization Techniques
The surface morphology of the coatings was analyzed by scanning electron microscopy (SEM) using a Hitachi SU3800 microscope (Tokyo, Japan) equipped with an energy-dispersive spectroscopy (EDS) system (Bruker Nano) (Berlin, Germany) for chemical composition analysis at an accelerating voltage of 15 kV. For each sample, SEM imaging and EDS analyses were performed on three independent surface areas to ensure representativeness and reproducibility of the results.
The surface topography of the coatings was analyzed using atomic force microscopy (AFM) in tapping mode. Topographic scans were acquired over 10 × 10 μm2 areas using a Veeco Innova system (New York, NY, USA), and both 2D and 3D surface profiles were generated for each sample. The average roughness (Sa), root mean square roughness (Sq), and maximum peak height (Sp) were extracted using the instrument’s roughness analysis module, based on three independent measurements per sample.
The coating thickness was quantified from the mass gain of the specimens (for each condition, mass gain was determined from three independently coated specimens), measured using an OHAUS Analytical Plus microbalance (OHAUS Corporation, Parsippany, NJ, USA) with a precision of ±0.00001 g, together with the calculated alloy density. To validate this indirect method, the thickness of sample S1 was independently assessed using a calibrated 3D digital microscope (RX 100, Hirox, Tokyo, Japan), from which the reconstructed 3D topography and corresponding surface height profile enabled an accurate determination of the coating thickness.
To study the structure of the electrodeposited coatings, the samples were analyzed by X-ray diffraction (XRD) in grazing incidence mode at 2°, using a Philips X’Pert PRO diffractometer (Almelo, The Netherlands) with Cu Kα radiation (λ = 1.54060 Å), operating at 45 kV and 40 mA. Measurements were performed over a 2θ range of 10–80°, with a step size of 0.05° and an exposure time of 0.3 s per step.
The reflectivity of the coatings was measured in the 360–750 nm range using a Gretagmacbeth ColorEye
® XTH spectrophotometer (Grand Rapids, MI, USA) under the CIE D65 illuminant. The color coordinates were then determined in the CIE-Lab* space, the most widely applied system for describing human color perception, with three measurements performed per sample to ensure reliability [
31].
The wettability of the coatings as deposited was assessed using the sessile drop method with an Attension
® Theta Flex (Biolin Scientific, Gothenburg, Sweden) contact angle system. Distilled water, diiodomethane and bromonaphthalene were used to determine the surface free energy (SFE) by calculating the polar (γ
p) and non-polar (γ
d) components using the Owens-Wendt-Rabel-Kaelble (OWRK) method, following the international standard ISO 19403-2 [
32]. For each sample, three independent measurements were performed for each probe liquid, and the reported values correspond to the averaged results.
The adhesion of the coatings to the steel substrates was evaluated using the tape test in accordance with ISO 2409 [
33]. Following the procedures prescribed by the standard, two sets of six incisions were made, perpendicular to one another and spaced 2 mm apart, thereby forming a grid. A standardized adhesive tape was then applied for 5 min and subsequently removed with constant force at an angle of approximately 60°. As outlined in the standard, the amount of coating detached during this process determines a rating from zero to five, which reflects the quality of adhesion to the substrate. A rating of zero indicates perfect adhesion, characterized by completely smooth cut edges and the absence of any detached grid squares. In contrast, a rating of five denotes severely compromised adhesion, with coating removal occurring along the cut edges in large strips and/or squares that have partially or fully detached over more than 65% of the tested area [
33].
The tribological behavior of the coated samples was evaluated through friction experiments conducted on a homemade pin-on-disc tribometer. All tests were carried out under dry sliding conditions (without lubrication) at room temperature and around 45%–50% relative humidity. A normal load of 2 N was applied, with a 100Cr6 bearing steel ball serving as the counter body. During the tests, the coefficient of friction (COF) as a function of time was automatically recorded by the system. The morphology of the worn surfaces was subsequently examined using scanning electron microscopy.
3. Results
The characterization sequence was designed to establish the relationship between electrolyte composition, deposition behavior, and the resulting structural and surface properties of the coatings. The influence of H3PO3 concentration on bath pH, phosphorus incorporation, and cathodic current efficiency was first examined. Coating thickness and deposition rate were subsequently determined to quantify the impact of these parameters on film growth. Structural and morphological features were characterized by XRD and SEM, followed by optical assessment through reflectivity and CIE Lab analyses. Adhesion and tribological tests were conducted to evaluate the mechanical integrity and functional performance of the coatings. Finally, wettability measurements were performed to compare the intrinsic surface behavior of the as-deposited coatings with that of the stearic-acid-modified surfaces, thereby enabling a direct assessment of the post-treatment’s influence on hydrophobicity.
3.1. Effect of H3PO3 Concentration on Bath pH and Phosphorus Incorporation
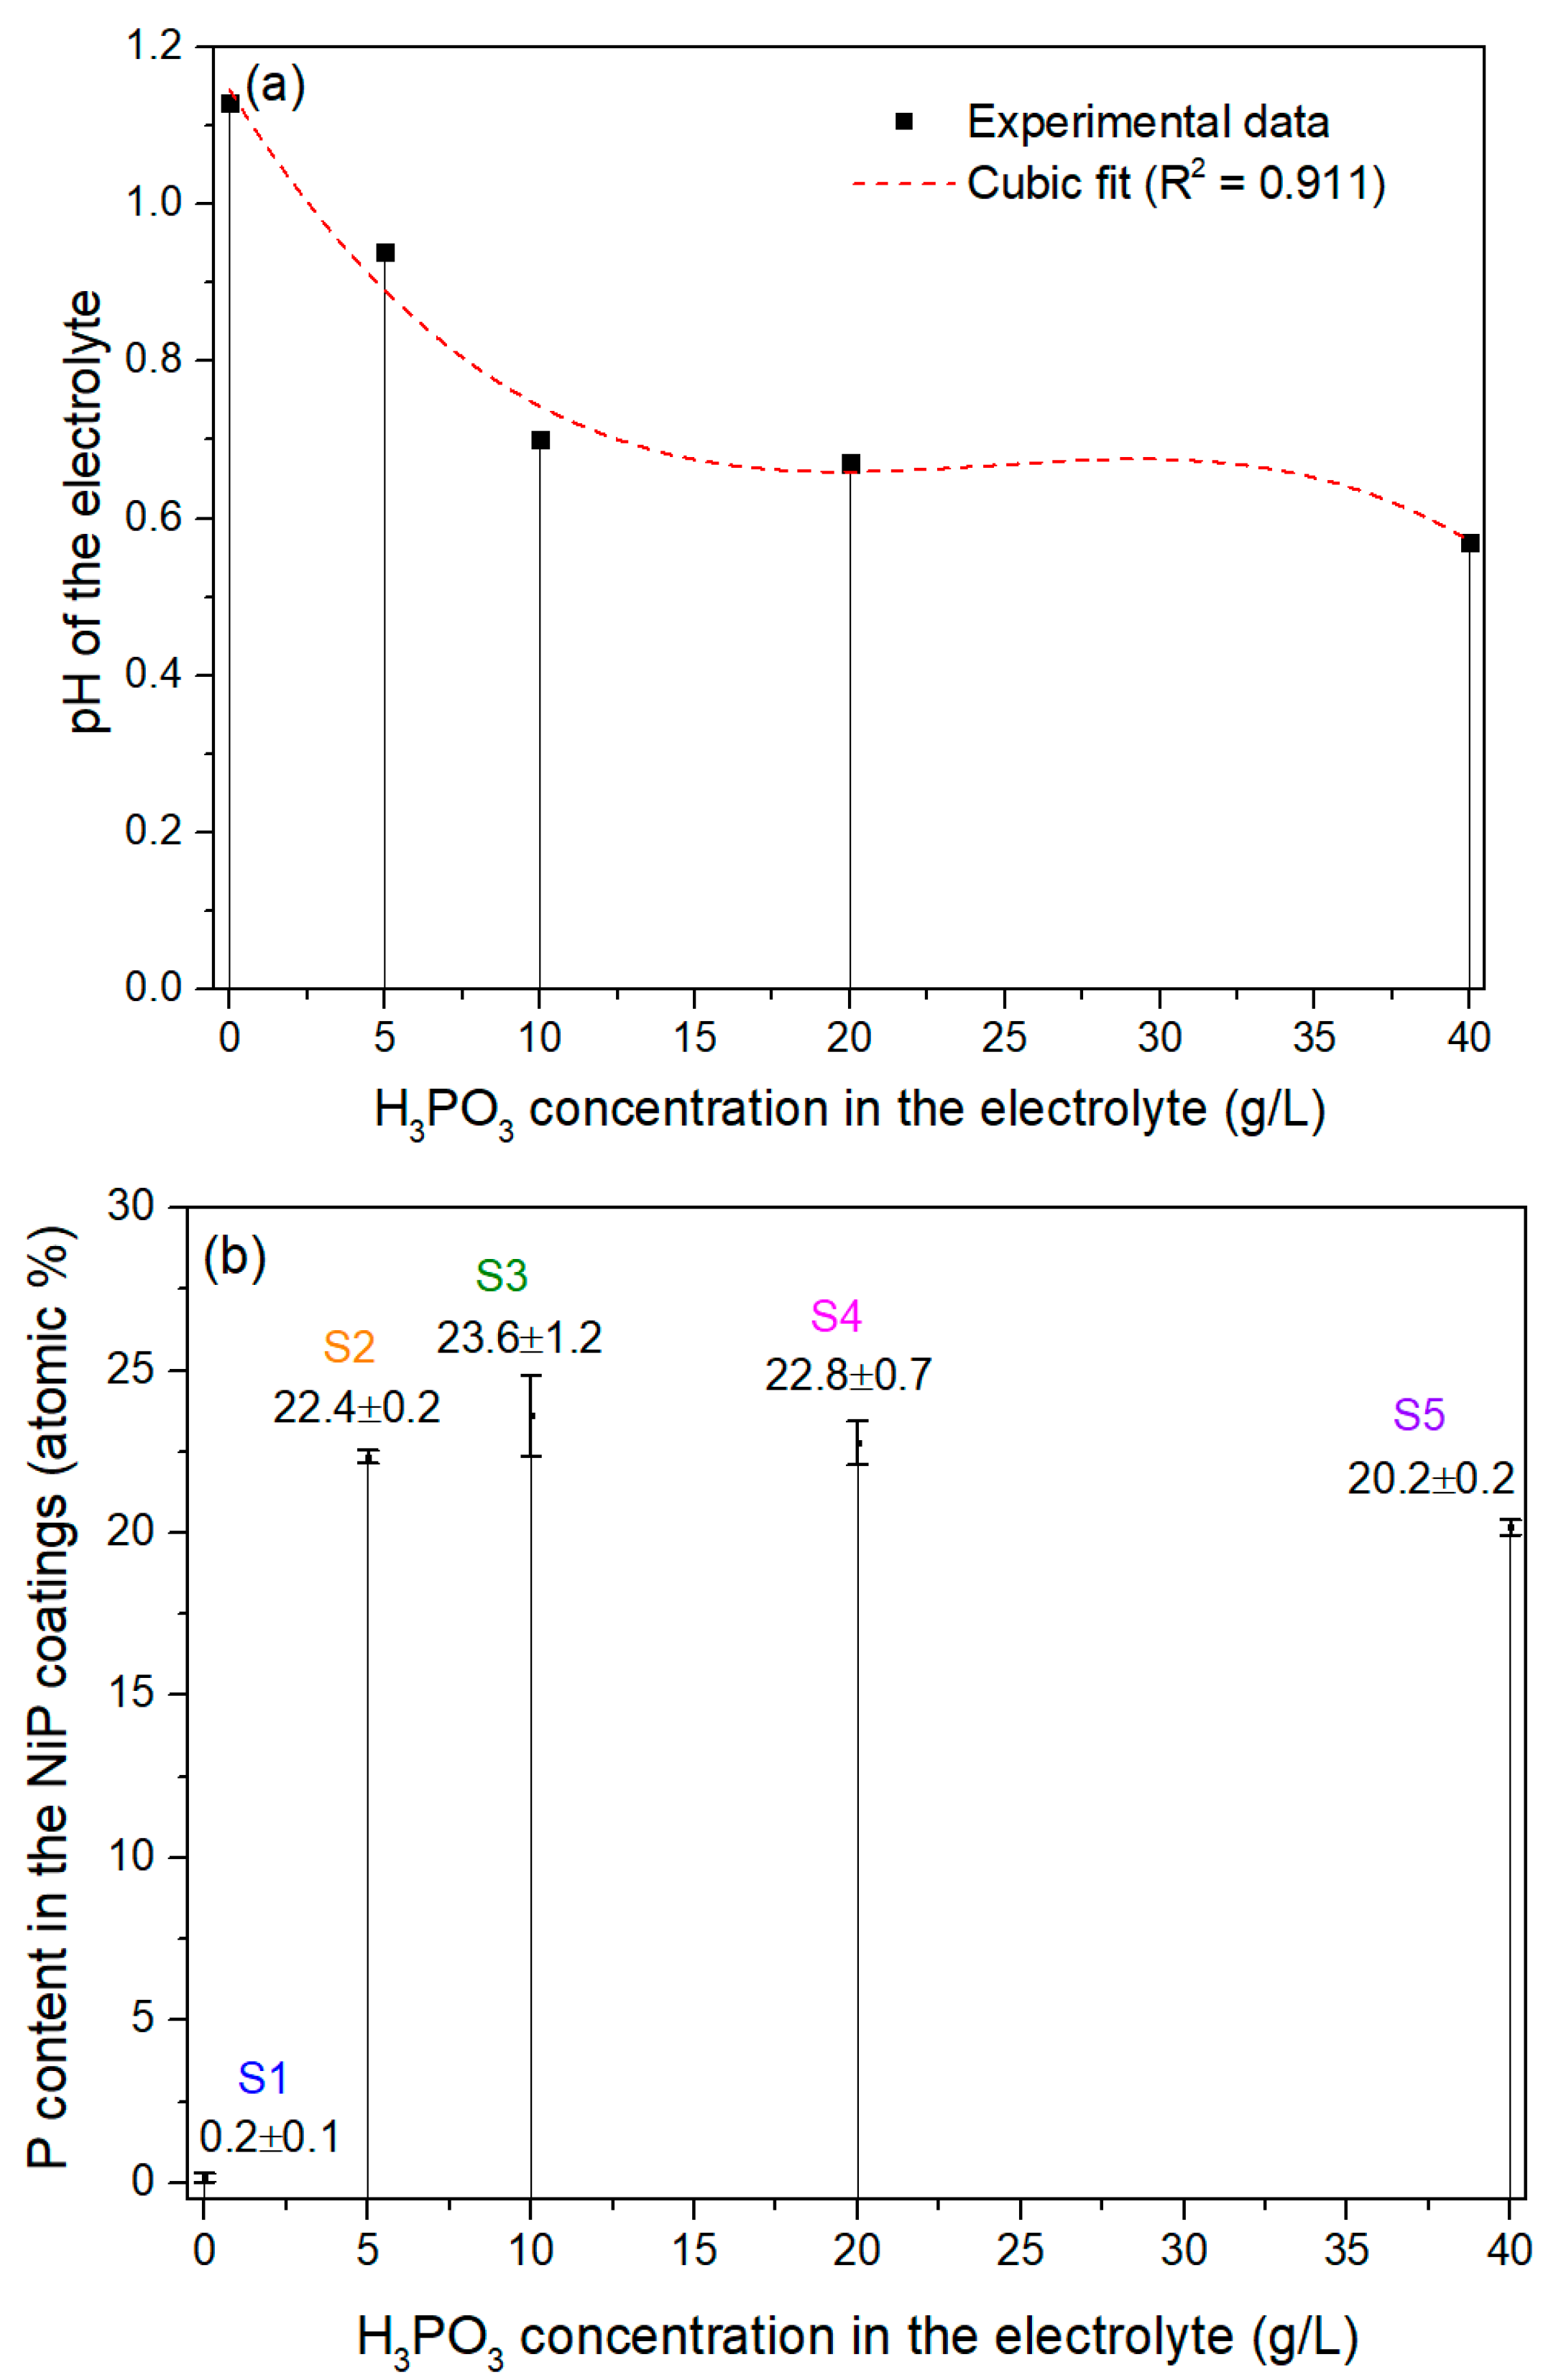
Figure 2a shows the measured pH of the electrolyte as a function of H
3PO
3 concentration. The pH decreases nonlinearly with increasing H
3PO
3 content, and a cubic regression (R
2 = 0.911) satisfactorily describes the observed trend. The sharpest pH drop occurs between 0 and 10 g/L of H
3PO
3, after which further additions produce progressively smaller changes. This attenuation of pH sensitivity at higher H
3PO
3 levels reflects the diminishing effect of additional phosphorous acid on the overall acidity of the electrolyte.
Phosphorus incorporation into Ni–P coatings occurs via the electrochemical reduction of phosphorous acid at the cathode, and the process of phosphorus incorporation during Ni–P alloy electrodeposition has been described by two different mechanisms: direct and indirect [
34].
In the direct mechanism, the phosphorous acid is reduced directly to the elemental state, as described in Equation (1) [
30,
35]:
At the cathode, the main reaction is nickel deposition, shown in Equation (2), and, as a secondary reaction, hydrogen evolution occurs, as presented in Equation (3):
In the indirect mechanism, phosphorous acid is initially reduced at the cathode to generate phosphine (Equation (4)). The phosphine formed subsequently reacts chemically with Ni
2+ ions near the electrode surface through a redox process, yielding elemental nickel and phosphorus (Equation (5)). This sequence of reactions results in the incorporation of phosphorus into the deposit as the Ni–P alloy layer develops [
30,
35]:
Figure 2b displays the phosphorus content in the deposited Ni–P coatings (atomic %) as a function of the H
3PO
3 concentration in the bath. In the absence of H
3PO
3 (sample S1), the P content is negligible (≈0.2 at.%). This confirms that phosphorous acid is the only electrochemically active phosphorus species in the electrolyte and the sole source of phosphorus incorporation under the present deposition conditions. Similar observations were reported by Pillai et al. [
21], who showed that when an electrodeposition bath containing both phosphorous acid and phosphoric acid was used, a pure nickel coating with no phosphorus incorporation was obtained when the plating was carried out without H
3PO
3.
The introduction of H3PO3 at 5 g/L (sample S2) produces a dramatic increase in deposited P (≈22.4 at.%). Between 5 and 20 g·L−1 (samples S2–S4), the P content remains essentially constant within experimental uncertainty (≈22–24 at.%). At the highest tested concentration (40 g·L−1, sample S5), the P level shows a small but reproducible decrease (≈20.2 at.%).
These observations can be interpreted as follows. H3PO3 acts as the phosphorus source in the electrolyte, and its addition both acidifies the bath and supplies reducible phosphorus species that co-deposit with Ni. The initial introduction of H3PO3, therefore, yields a large increase in P incorporation because previously negligible available phosphorus species become available for deposition. Once a threshold concentration of H3PO3 is reached (between ~5 and 20 g·L−1 in the present study), P incorporation into the deposit reaches a plateau. This plateau behaviour indicates that, beyond a certain bath concentration, phosphorus incorporation becomes limited by surface kinetics or by the availability of active surface sites rather than by the electrolyte concentration of phosphorus species.
The slight decline in P atomic % at the highest H
3PO
3 concentration (40 g·L
−1, sample S5) likely reflects one or more inhibitory effects that emerge at high acid loadings: excessive acidity can alter the mechanism or rate of the surface reduction reactions that produce phosphorus incorporation (for example, by favoring hydrogen evolution or by protonating intermediate species); changes in ionic strength or complexation may reduce the fraction of phosphorus present in a form that is efficiently incorporated; or surface poisoning or blocking of catalytic sites by side products or adsorbed species can reduce the relative rate of P co-deposition [
36,
37].
These results contrast with those reported by Mondal et al. [
36], who observed a decrease in phosphorus content from 20.5 at.% to 12 at.% as the pH increased from 0.7 to 1.75, but they are consistent with the findings of Lew et al. [
38], who reported an increase in phosphorus content from 2.98% to 9.82% as the pH increased from 1.5 to 5. A primary difference between those two studies and the present work is that both Mondal and Lew investigated the electrodeposition of NiCoP, whereas the present study focuses on Ni–P.
On the other hand, Brenner et al. [
39] concluded that, within the operable pH range (0.5 to 2.0), the bath pH does not have an appreciable effect on the phosphorus content of Ni–P deposits, further noting that for pH values much above 1, it becomes difficult to obtain uniformly bright deposits.
3.2. Cathodic Current Efficiency
The cathodic current efficiency (CCE) was calculated by relating the measured mass change to the applied current and deposition time, providing an estimate of the fraction of the total charge that resulted in the actual deposition of the coating, rather than in side reactions [
40]:
Here, Δm is the mass of the electrodeposited film, defined as the change in mass after electrodeposition (g); n is the ionic valence of Ni (dimensionless); F is the Faraday constant (C/mol); M is the molar mass of the Ni–P alloy, calculated from the chemical composition measured by EDS (g/mol); I is the applied current (A); and t is the electrodeposition time (s).
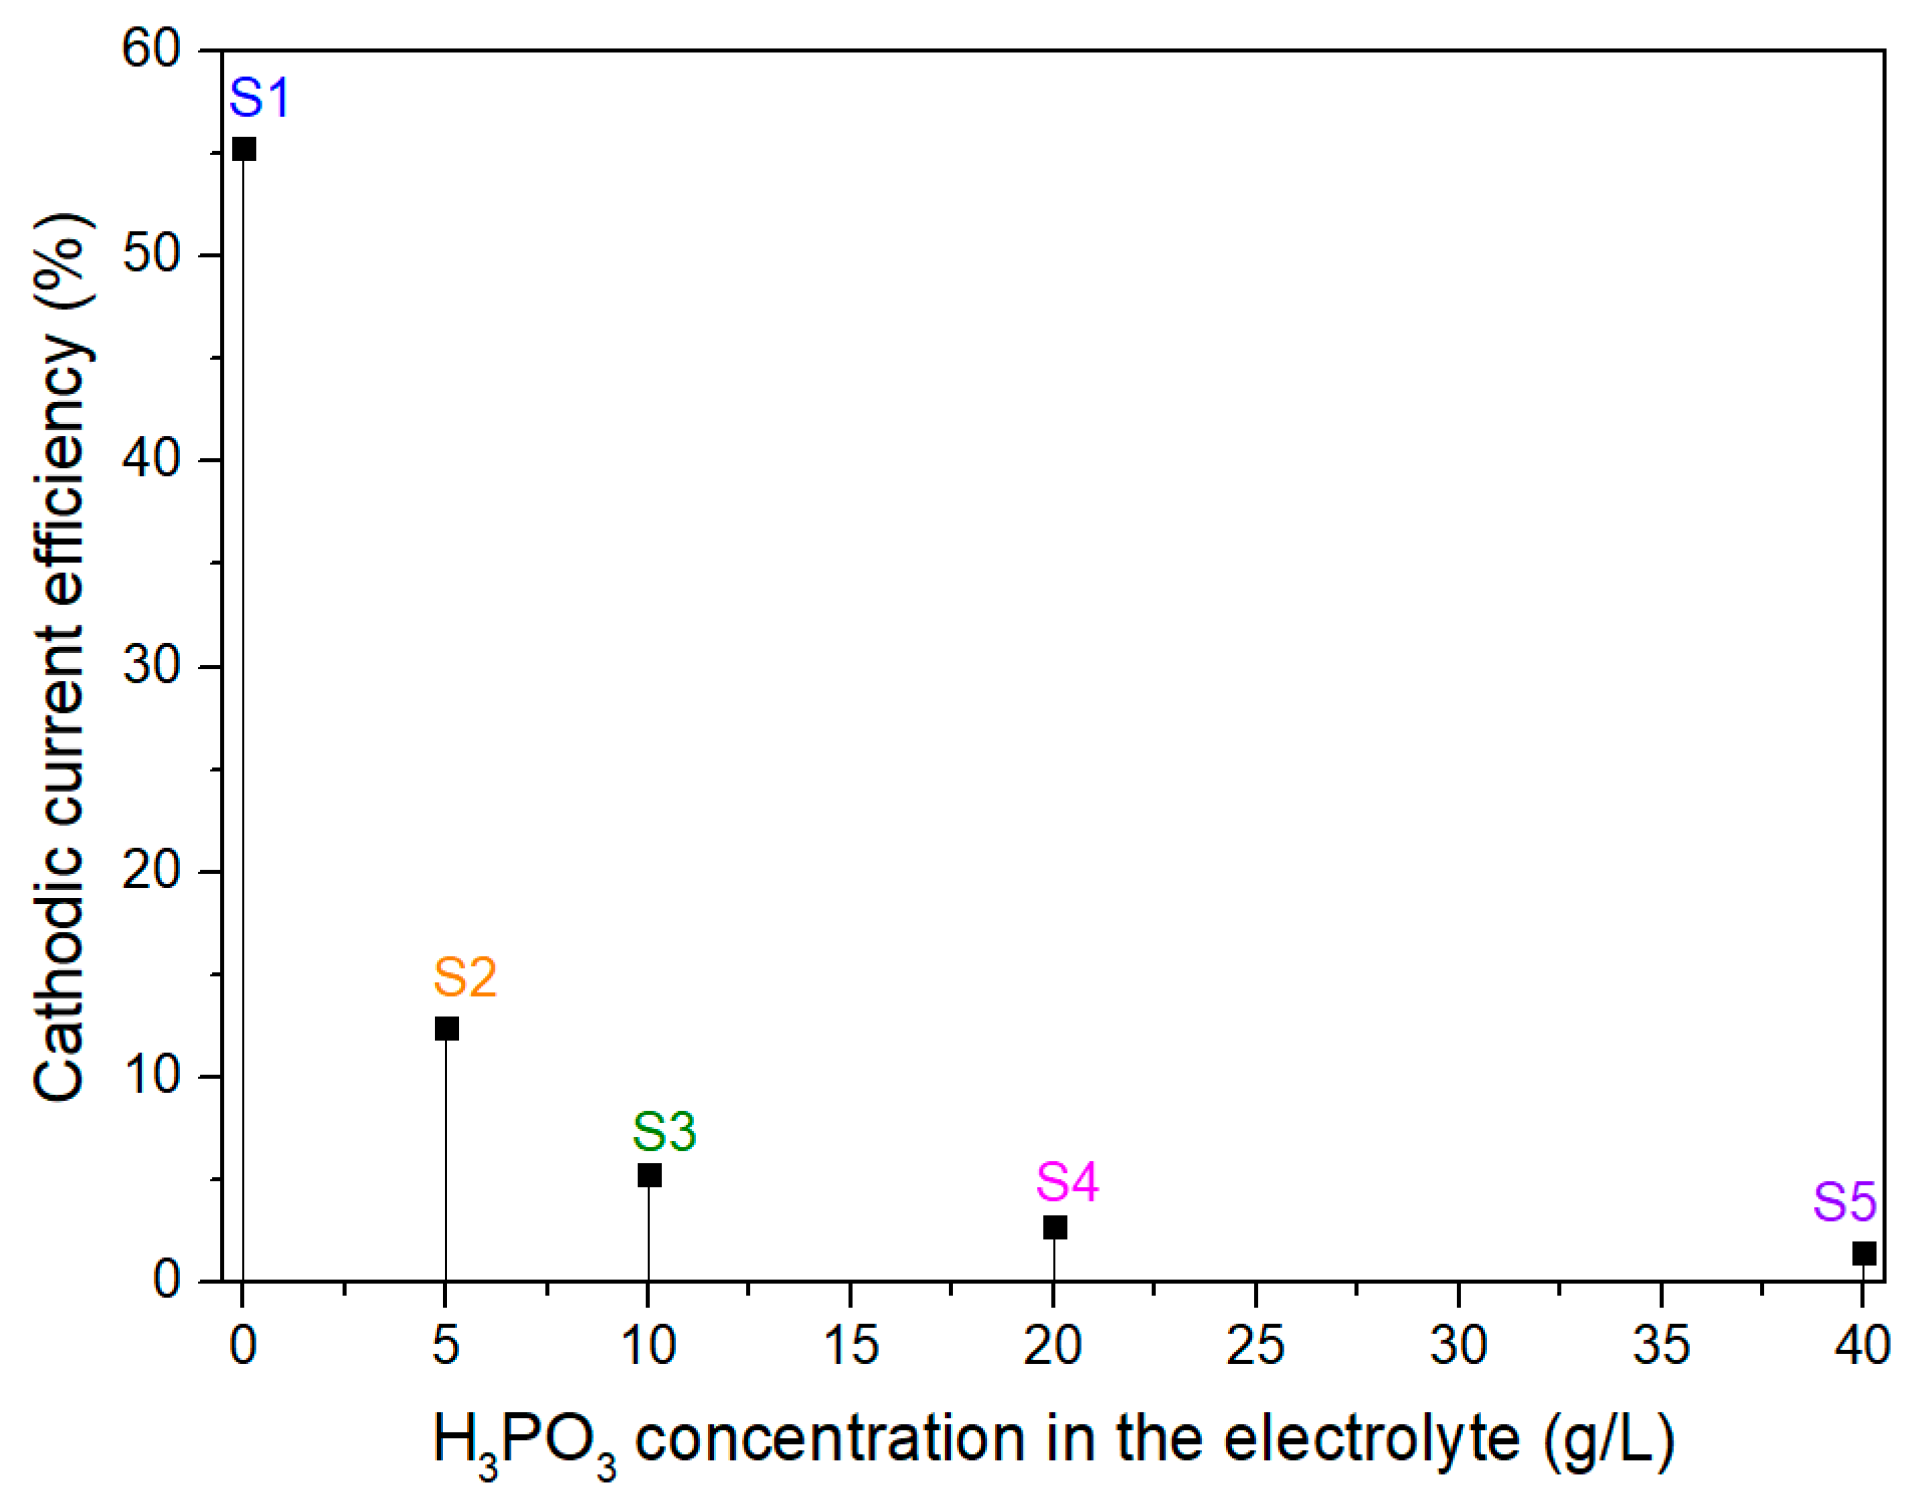
Figure 3 shows the evolution of cathodic current efficiency (CCE) as a function of H
3PO
3 concentration in the electrolyte. In the absence of H
3PO
3 (sample S1), the CCE is moderate (≈55%), indicating that although Ni
2+ reduction accounts for the majority of the cathodic reaction, a considerable portion of the current is still diverted to hydrogen evolution from water, as described by Equation (3).
The introduction of 5 g/L of H
3PO
3 (sample S2) causes a sharp decline in efficiency to below 15%, indicating a strong shift in the cathodic reaction balance toward hydrogen evolution. This behaviour reflects the combined effects of the increased acidity of the bath, the promotion of proton reduction, and the changes in Ni
2+ speciation induced by phosphorous acid addition. Further increases in H
3PO
3 concentration (samples S3–S5) reduce the CCE to ≈5%–1%, showing that the cathodic process becomes overwhelmingly dominated by hydrogen evolution at high acid loadings [
11,
37,
39]. Such a monotonic and highly non-linear decrease in efficiency is consistent with established behaviour of Ni–P electrodeposition from nickel-sulfate baths at very low pH, where hydrogen evolution strongly competes with metal-ion reduction and surface adsorption effects increasingly inhibit nickel deposition [
39].
This pronounced loss in efficiency is fully consistent with both direct and indirect phosphorus-incorporation mechanisms, since each relies on proton reduction that simultaneously promotes P co-deposition and accelerates hydrogen evolution [
11,
23].
From a practical and industrial perspective, the very low cathodic current efficiencies observed at high H
3PO
3 concentrations reflect intensified parasitic reactions, particularly hydrogen evolution, that reduce metal utilization efficiency and increase energy consumption during electrodeposition. In electrochemical alloy electrodeposition, such competing reactions are known to compromise coating uniformity and cost-effectiveness when scaling up processes. These constraints must be balanced against functional benefits such as tailored composition or mechanical performance. Recent reviews of Ni–P electrodeposition underscore how key bath chemistry factors, including acidity and phosphorus source, influence both alloy formation and electrochemical efficiency, with direct implications for industrial viability [
30].
3.3. Thickness and Deposition Rate
The average coating thickness can be obtained by dividing the mass of the electrodeposited film (g) by the product of the density of the Ni–P alloy (g/cm
2) and the surface area to be electroplated (cm
2) [
29].
The density of the Ni–P coating was calculated from the chemical composition measured by EDS and the densities of Ni (8.907 g/cm
3 [
29]) and P (1.82 g/cm
3 [
41]).
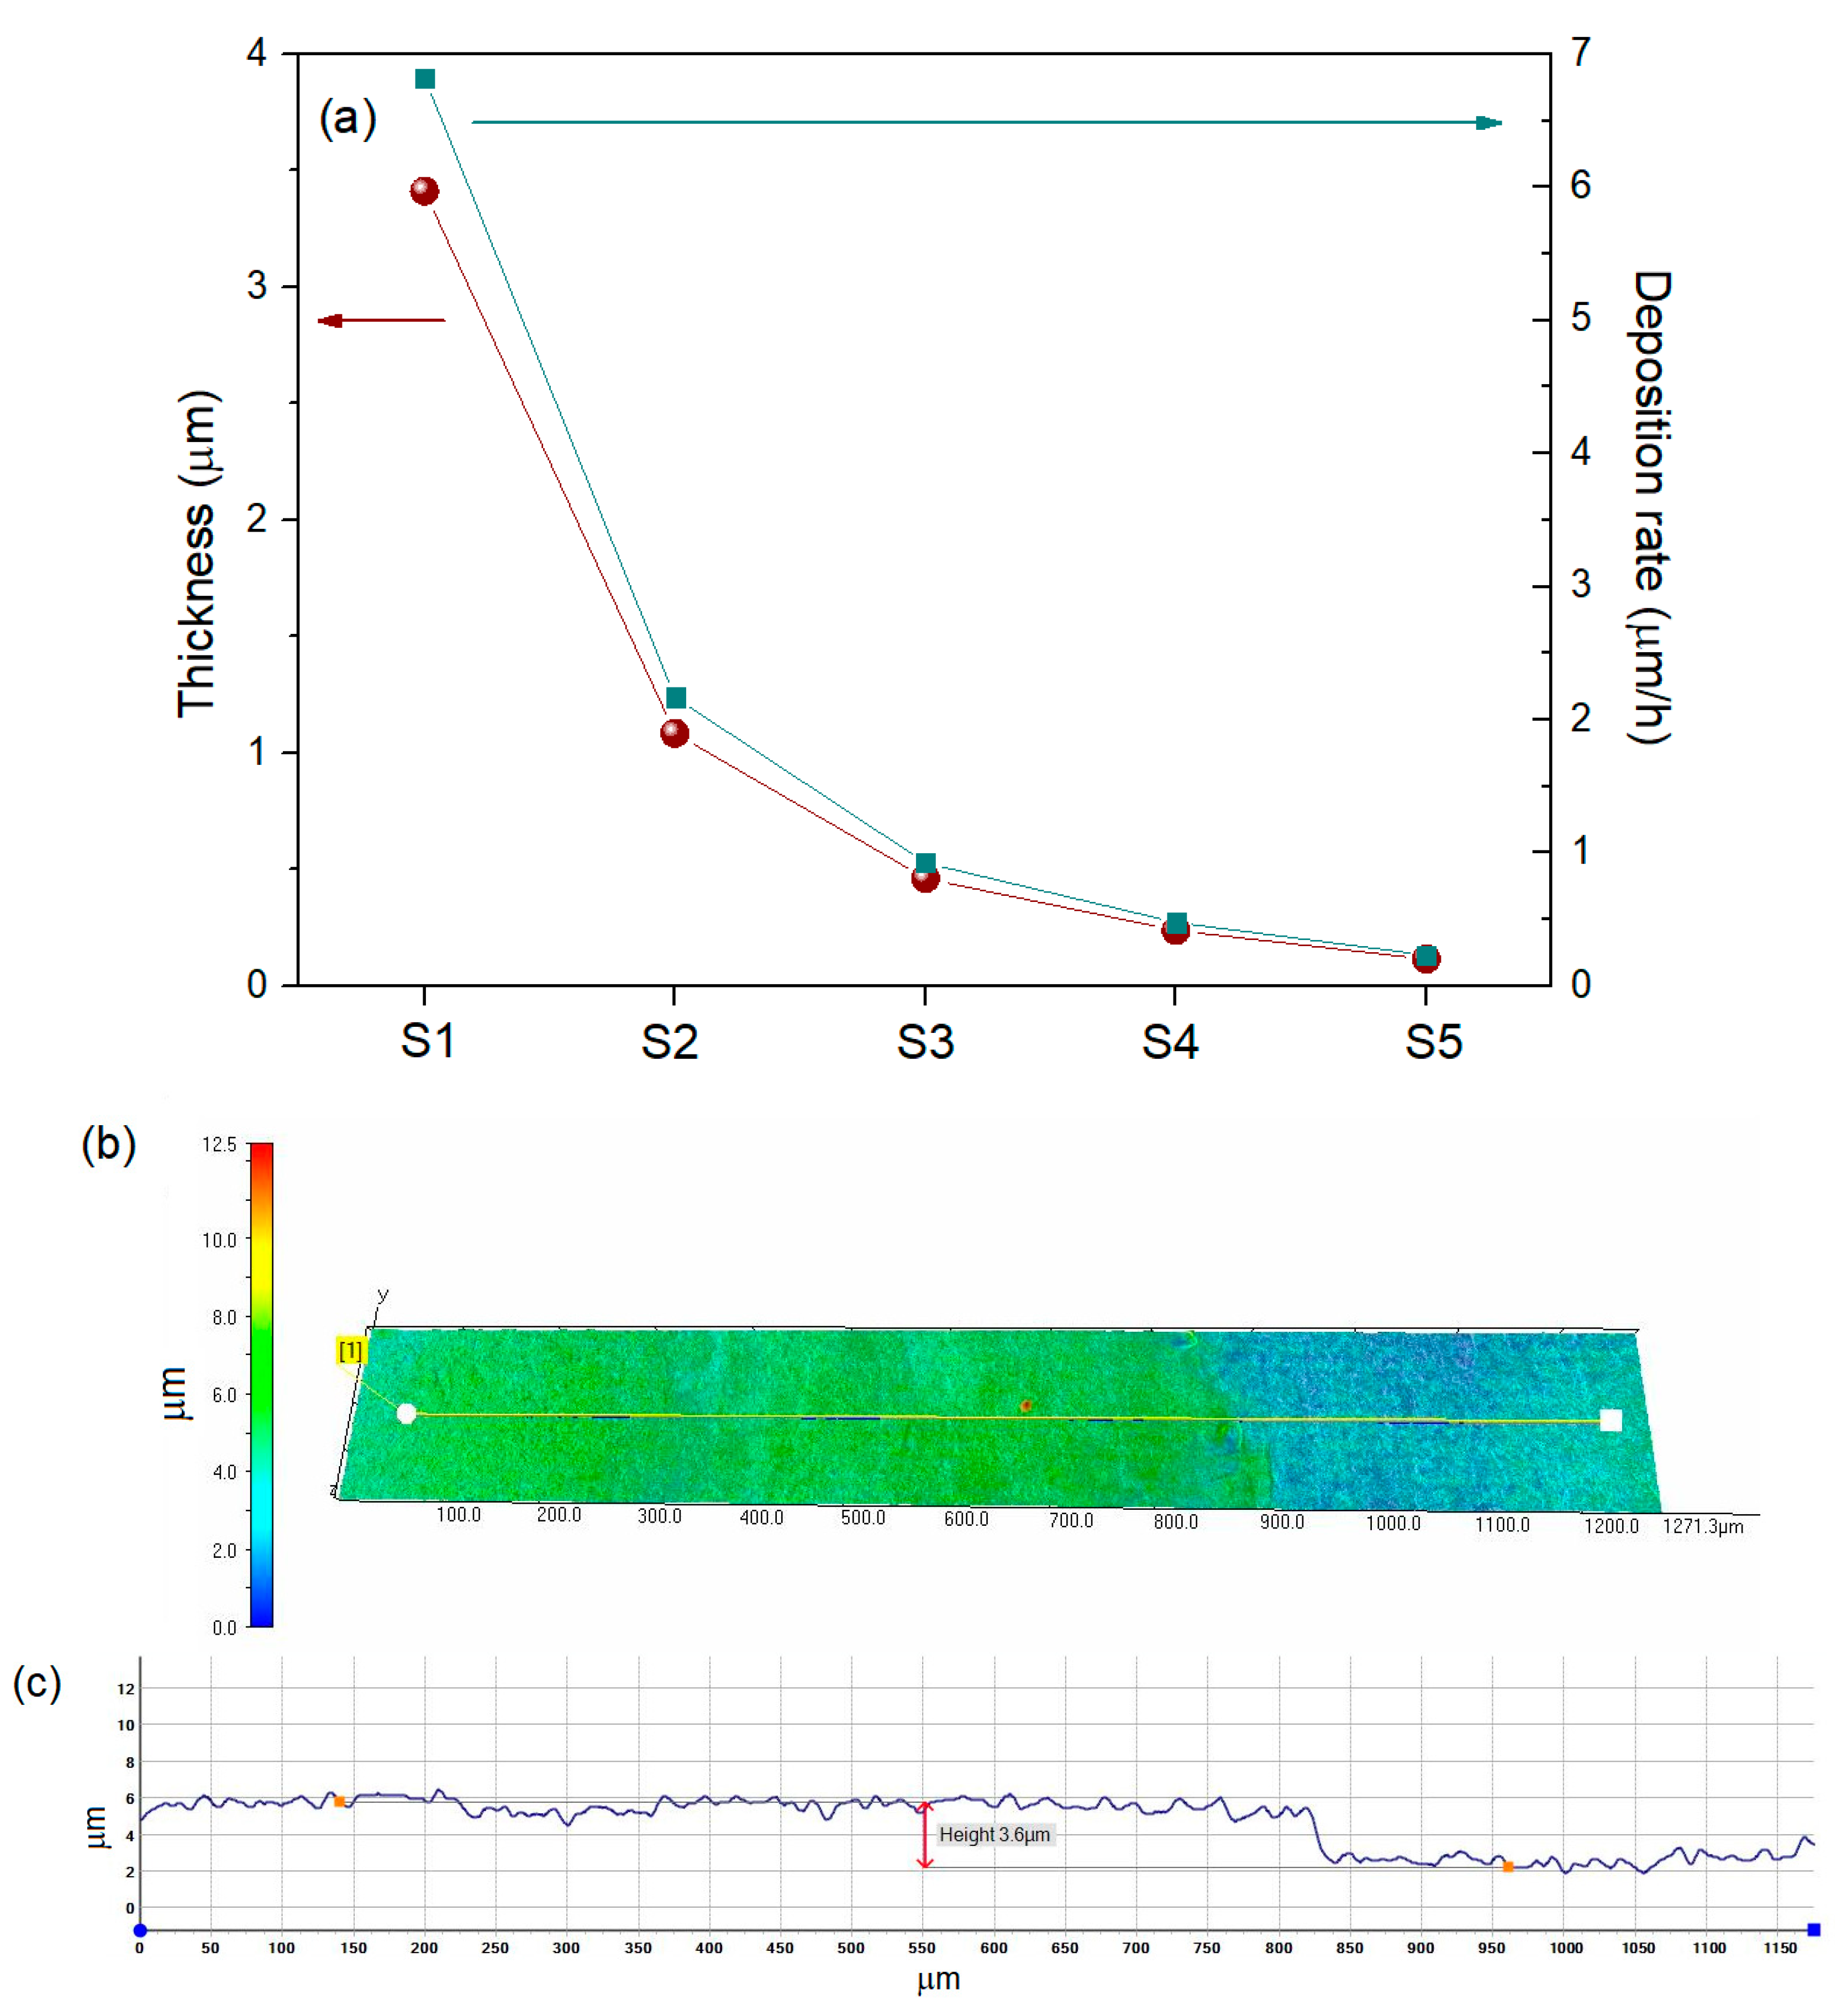
The coating thicknesses obtained from the density-based calculation are shown in
Figure 4a. A strong monotonic decrease in thickness is observed as the H
3PO
3 concentration increases across the series. This trend directly reflects the measured cathodic current efficiencies, which also decrease sharply with increasing phosphorus content in the electrolyte.
The deposition rate of the Ni–P coatings, also presented in
Figure 4a, was determined from the measured coating thickness divided by the total deposition time, a standard approach widely used in electrodeposition studies.
The deposition rate decreases sharply from S1 to S5, mirroring the reduction in coating thickness, with the highest rate obtained for the pure Ni deposit (sample S1) and progressively lower rates for the Ni–P coatings as the H3PO3 concentration and corresponding loss of cathodic current efficiency increase.
The surface profile of sample S1 was examined using a 3D digital microscope.
Figure 4b presents the corresponding 3D topography, while
Figure 4c shows the extracted surface profile. From this profile, the coating thickness is estimated to be approximately 3.6 μm, which is in good agreement with the value obtained from the thickness calculation.
3.4. X-Ray Diffraction Analysis
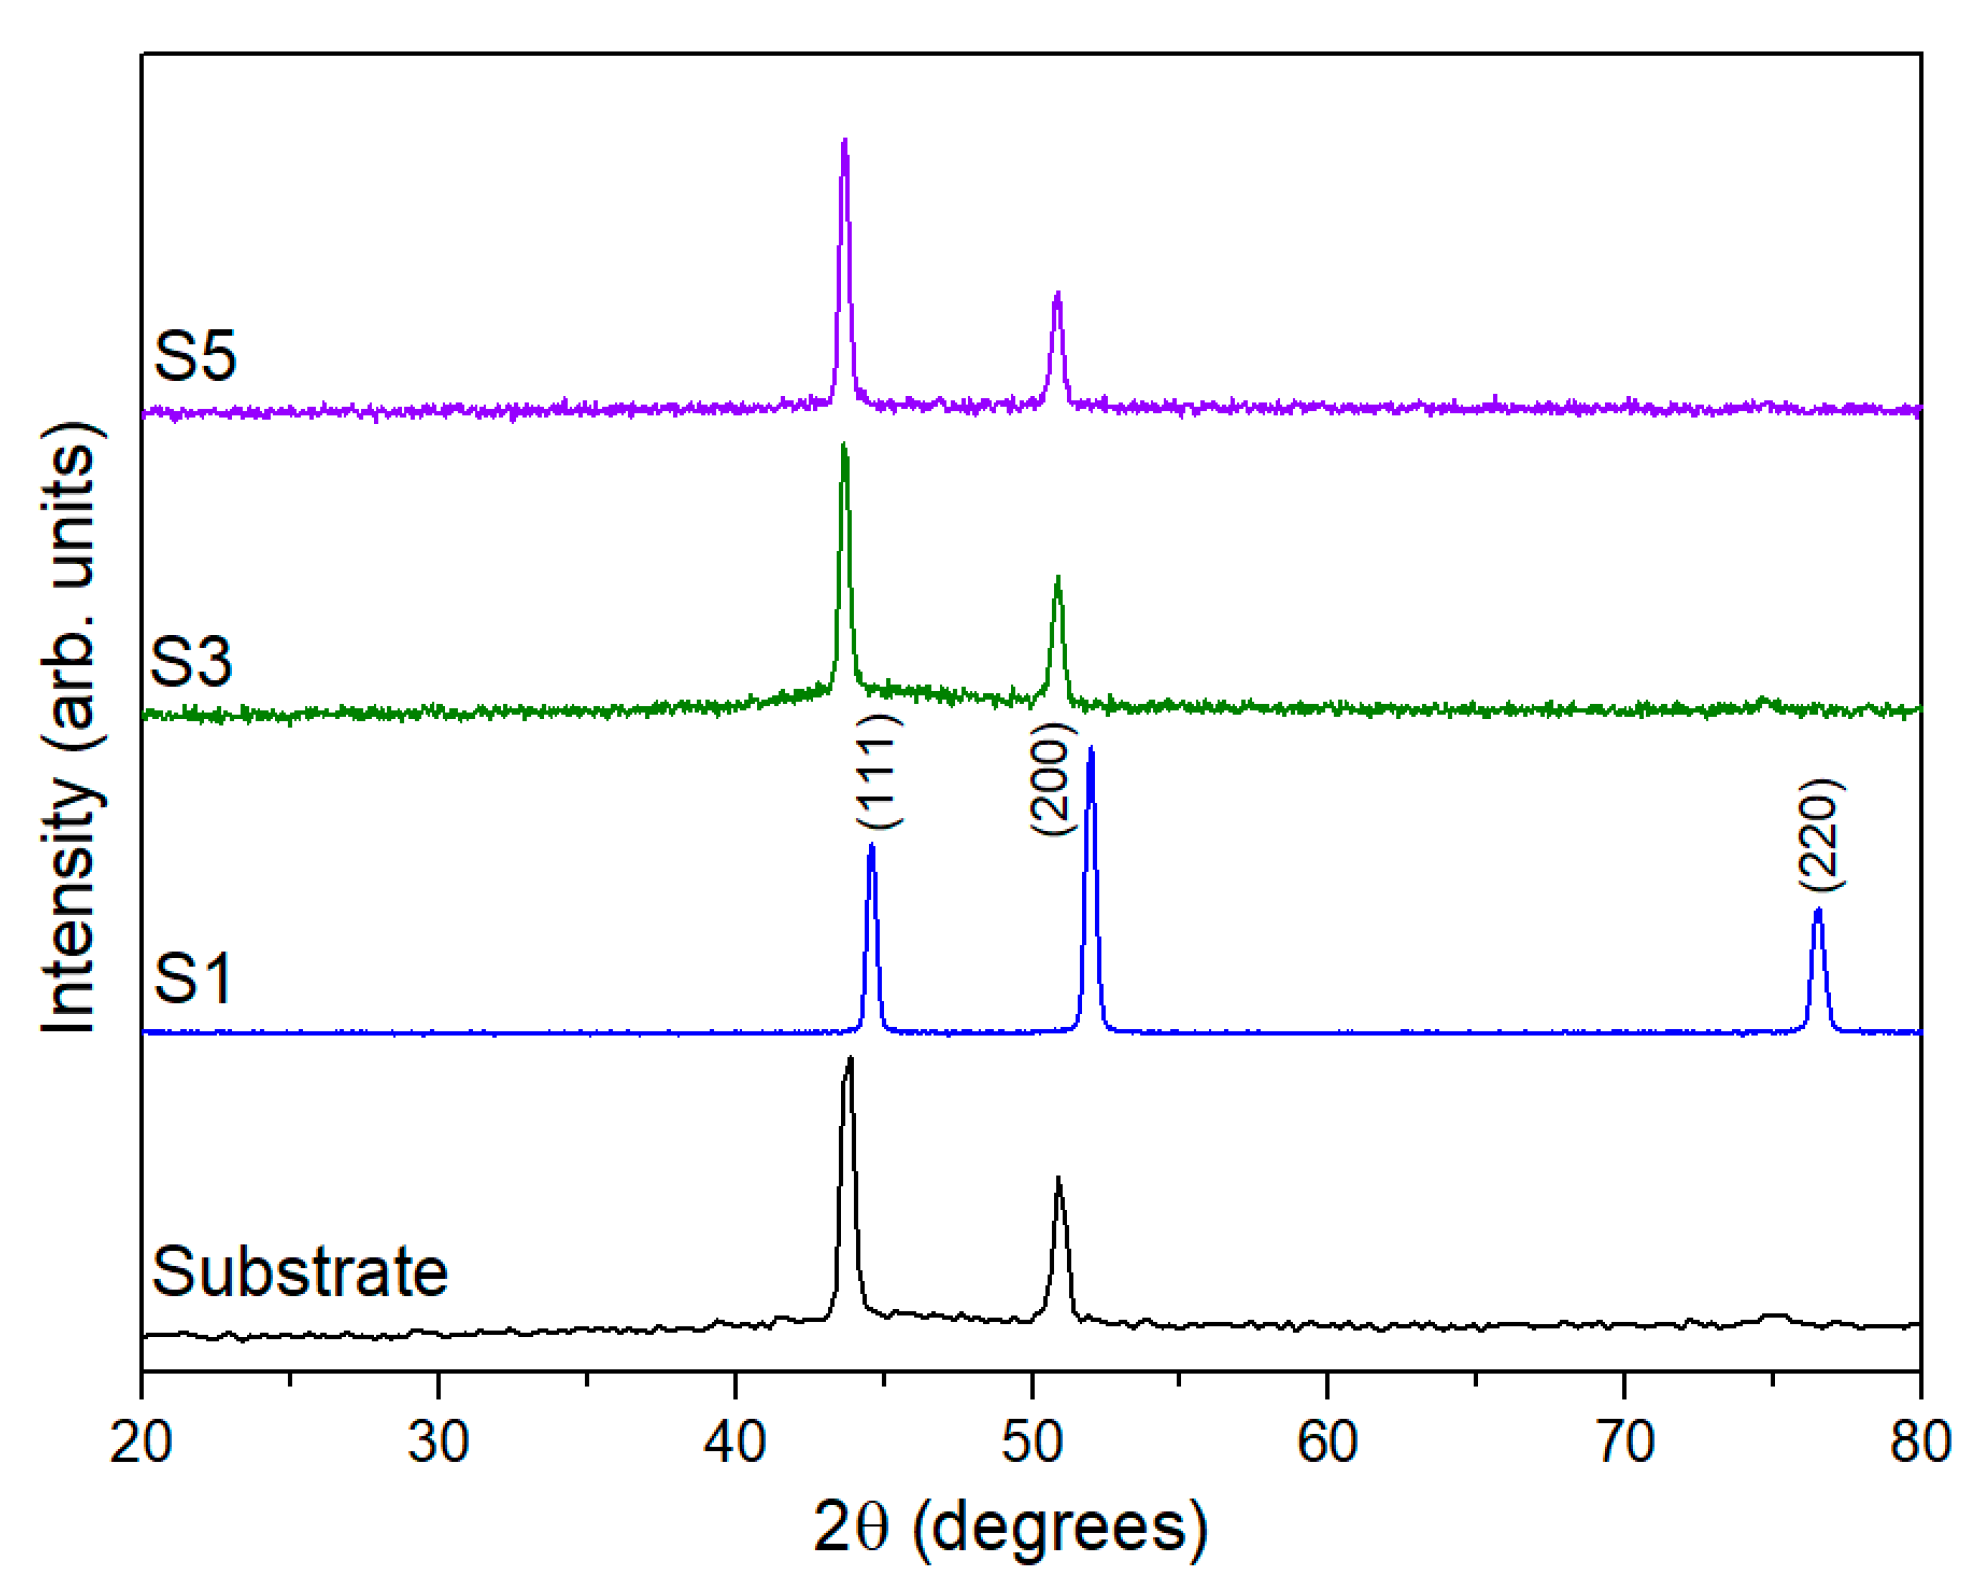
Figure 5 presents the XRD patterns of the 316L stainless steel substrate, pure Ni coating (S1), and the representative Ni–P coatings (S3 and S5). Samples S2 and S4 are omitted, as their diffractograms closely overlapped with those of S3 and S5, providing no additional structural information.
The substrate diffractogram displays the characteristic reflections of austenitic stainless steel, with prominent peaks located near 43.9° and 50.9°, followed by a very weak feature around 74.9°, corresponding to the (111), (200), and (220) planes of the FCC γ-Fe structure [
42,
43]. These peaks serve as a reference for evaluating the contribution of the electrodeposited layers.
The pattern for S1 shows sharp and intense reflections at approximately 44.6°, 51.9°, and 76.4°, matching the (111), (200), and (220) planes of crystalline FCC Ni, in accordance with the reference pattern ICDD 04-010-6148 [
44]. The high peak intensity and narrow peak width confirm a highly crystalline Ni coating, consistent with the negligible phosphorus content measured for S1 (~0 at.% P).
In contrast, samples S3 and S5 contain high levels of phosphorus—approximately 23 at.% and 20 at.%, respectively. At such P concentrations, Ni–P alloys are generally expected to exhibit an amorphous or nanocrystalline structure, typically manifested as a broad diffuse halo in the 40–50° 2θ range [
34,
45]. However, no clearly defined amorphous halo is observed in the diffractograms of S3 or S5. Instead, their patterns are dominated by the intense reflections of the stainless steel substrate, which largely overshadow the weak scattering from the coating. This absence of an identifiable amorphous Ni–P feature is attributed to the extremely low cathodic current efficiencies during deposition, which result in ultrathin coatings. These thin layers produce insufficient diffracted intensity to compete with the much stronger substrate signal, preventing the amorphous nature of the Ni–P from being resolved by XRD.
In summary, while S1 forms a fully crystalline Ni coating, the high-P layers in S3 and S5 are too thin for their expected amorphous characteristics to be detected, and their diffractograms are largely governed by the underlying 316L stainless steel substrate.
3.5. Surface Morphology
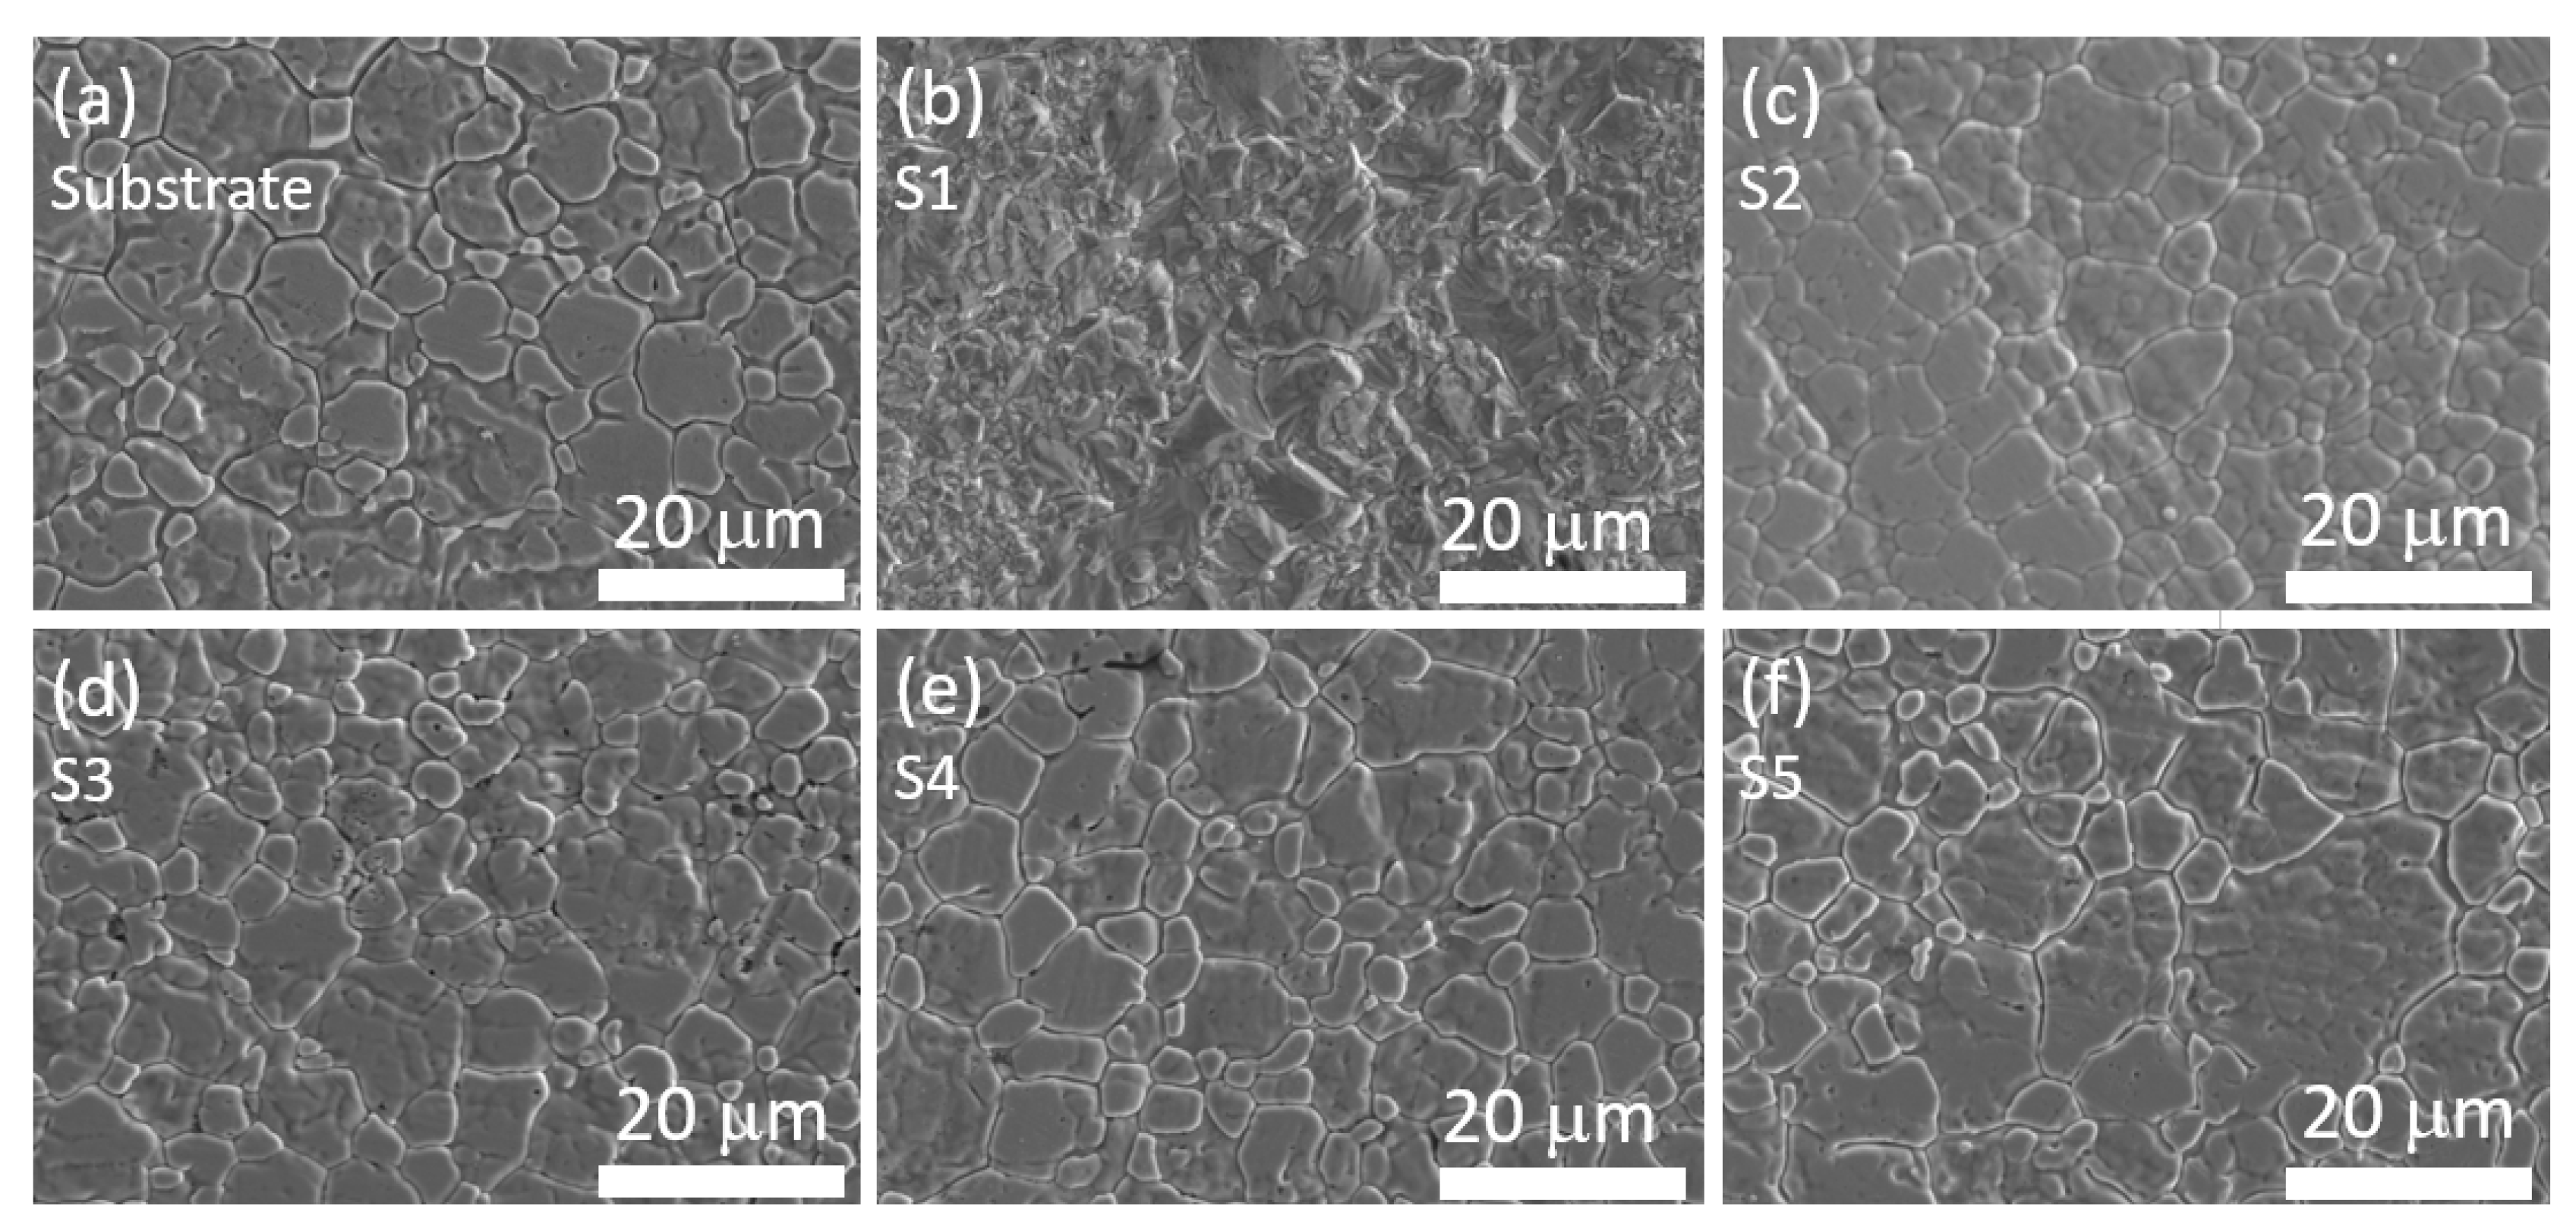
Figure 6 presents the surface morphology of the 316L substrate, the Ni coating without phosphorus (S1), and the Ni–P coatings obtained at increasing H
3PO
3 concentrations (S2–S5). All micrographs were acquired using the secondary electron (SE) detector at an accelerating voltage of 15 kV.
The polished 316L stainless steel substrate (
Figure 6a) exhibits the typical polygonal grains of austenitic steel, with well-defined grain boundaries and minimal surface relief [
46]. This microstructure serves as a reference to evaluate the coverage and morphological evolution of the electrodeposited layers.
The surface of sample S1 (
Figure 6b), deposited in the absence of H
3PO
3, shows a markedly different morphology compared to the substrate. The deposit consists of coarse, faceted crystalline features characteristic of electrodeposited Ni [
21,
47]. The pronounced crystallinity and rough surface topography are consistent with the high cathodic current efficiency and the fully crystalline Ni structure revealed by XRD.
In contrast, the introduction of H
3PO
3 into the electrolyte produces a substantial change in surface morphology. Sample S2 (
Figure 6c), corresponding to the lowest H
3PO
3 concentration, displays the onset of a rounded, nodular surface structure typical of Ni–P alloys [
34]. Although the faceted morphology of pure Ni is largely suppressed, traces of the underlying substrate grain pattern remain faintly visible, suggesting either conformal growth or the presence of a relatively thin coating.
Samples S3–S5 (
Figure 6d–f) further highlight this effect. Although these deposits exhibit the characteristic fine, globular nodules associated with high-P Ni–P alloys, the surface morphology increasingly resembles that of the underlying 316L substrate. This strong substrate influence indicates that these coatings are extremely thin, which is consistent with the very low cathodic current efficiencies measured for these conditions. At such low efficiencies, the net amount of Ni–P deposited is minimal, resulting in coating thicknesses insufficient to completely mask the substrate topography under the SEM imaging conditions used. As a result, the observed morphology represents a combination of the Ni–P nodular texture and the residual relief of the polished steel substrate.
Overall, the SEM analysis demonstrates a clear transition from crystalline Ni (S1) to the amorphous Ni–P morphology (S2–S5), while also revealing that extremely low current efficiencies at high H3PO3 concentrations result in coatings whose thickness is insufficient to obscure the substrate microstructure.
3.6. Surface Topography
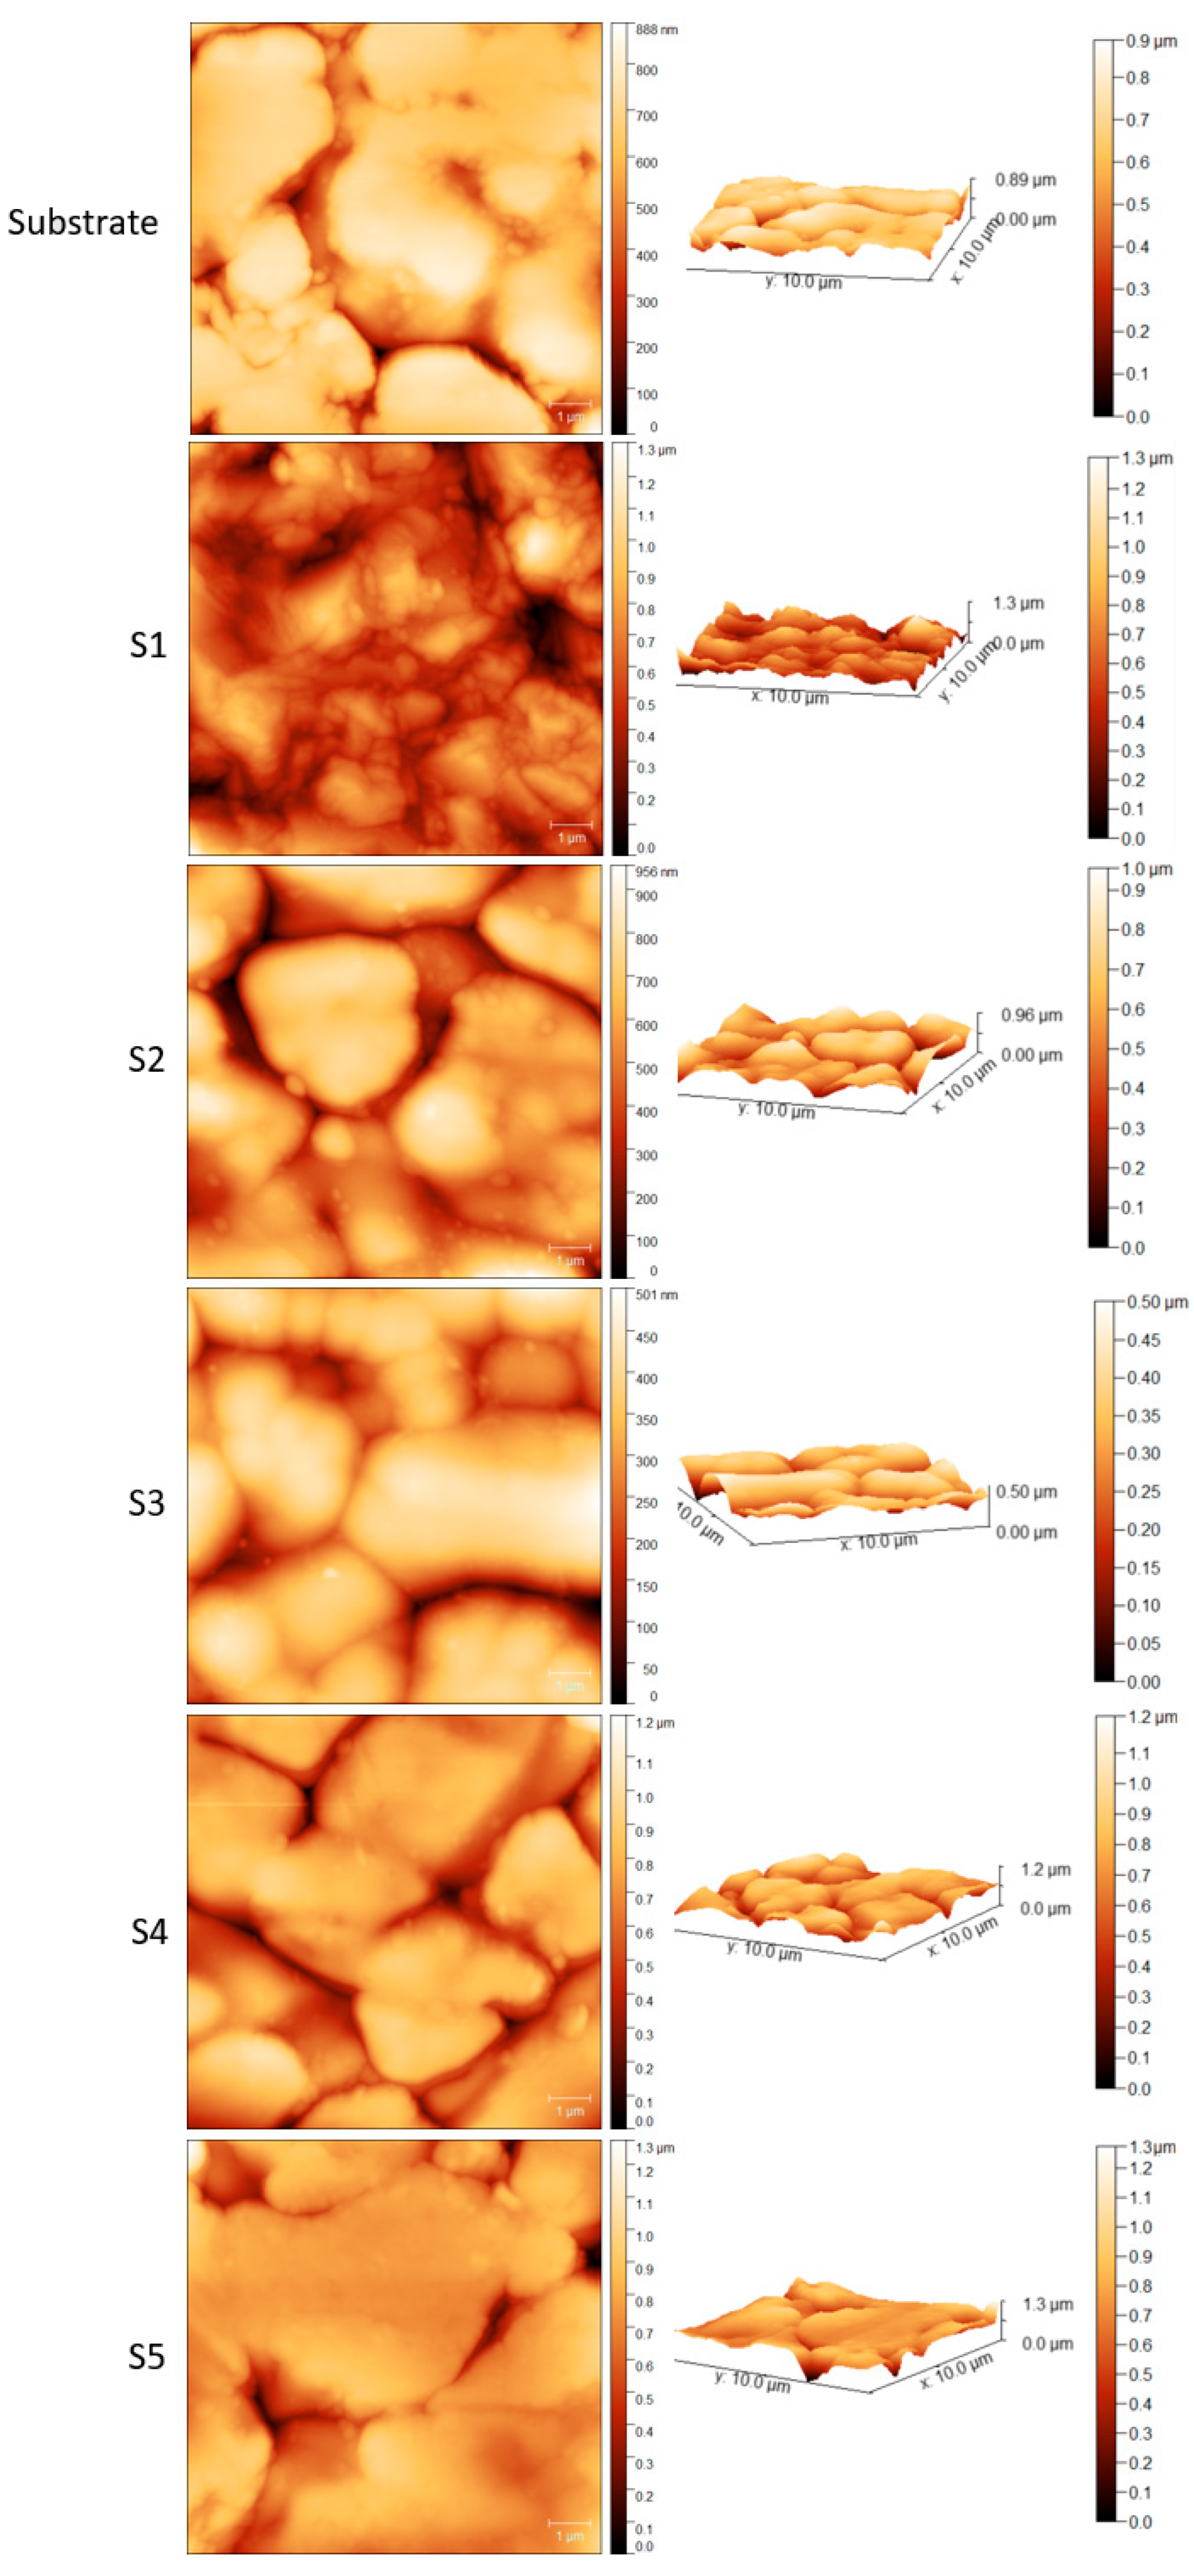
The surface topography of the Ni–P coatings was investigated by Atomic Force Microscopy (AFM), and representative 2D and 3D images over 10 μm × 10 μm areas are presented in
Figure 7. Quantitative roughness parameters—arithmetic mean height (Sa), root mean square roughness (Sq), and maximum peak height (Sp)—are summarized in
Table 2 for the uncoated 316L stainless steel substrate, the pure Ni coating (S1), and the Ni–P coatings deposited with increasing H
3PO
3 concentrations (S2–S5).
The Ni coating without phosphorus (S1) exhibits the highest roughness among all samples (Sa = 138 nm, Sp = 719 nm), which is consistent with its faceted crystalline morphology observed in SEM micrographs and with the high deposition rate. The introduction of phosphorus acid into the bath leads to a general reduction in roughness, reflecting a transition toward amorphous or nanocrystalline microstructures and lower deposition rates. This effect is particularly evident in sample S3, which exhibits the lowest roughness (Sa = 62 nm, Sp = 204 nm) and a smooth, conformal surface in both AFM and SEM images. Interestingly, although S4 and S5 were deposited at higher H3PO3 concentrations and exhibited the lowest deposition rates and coating thicknesses, their surface roughness increased once again (Sa = 86–99 nm, Sp = 443–575 nm). This unexpected rise in roughness, despite thinner films, suggests that under extremely low deposition rates, the underlying substrate topography may exert a greater influence on the growing film. Additionally, reduced nucleation density or localized growth instabilities could contribute to a more uneven surface at the nanoscale.
3.7. CIE L*a*b* Color Metrics and Surface Reflectivity
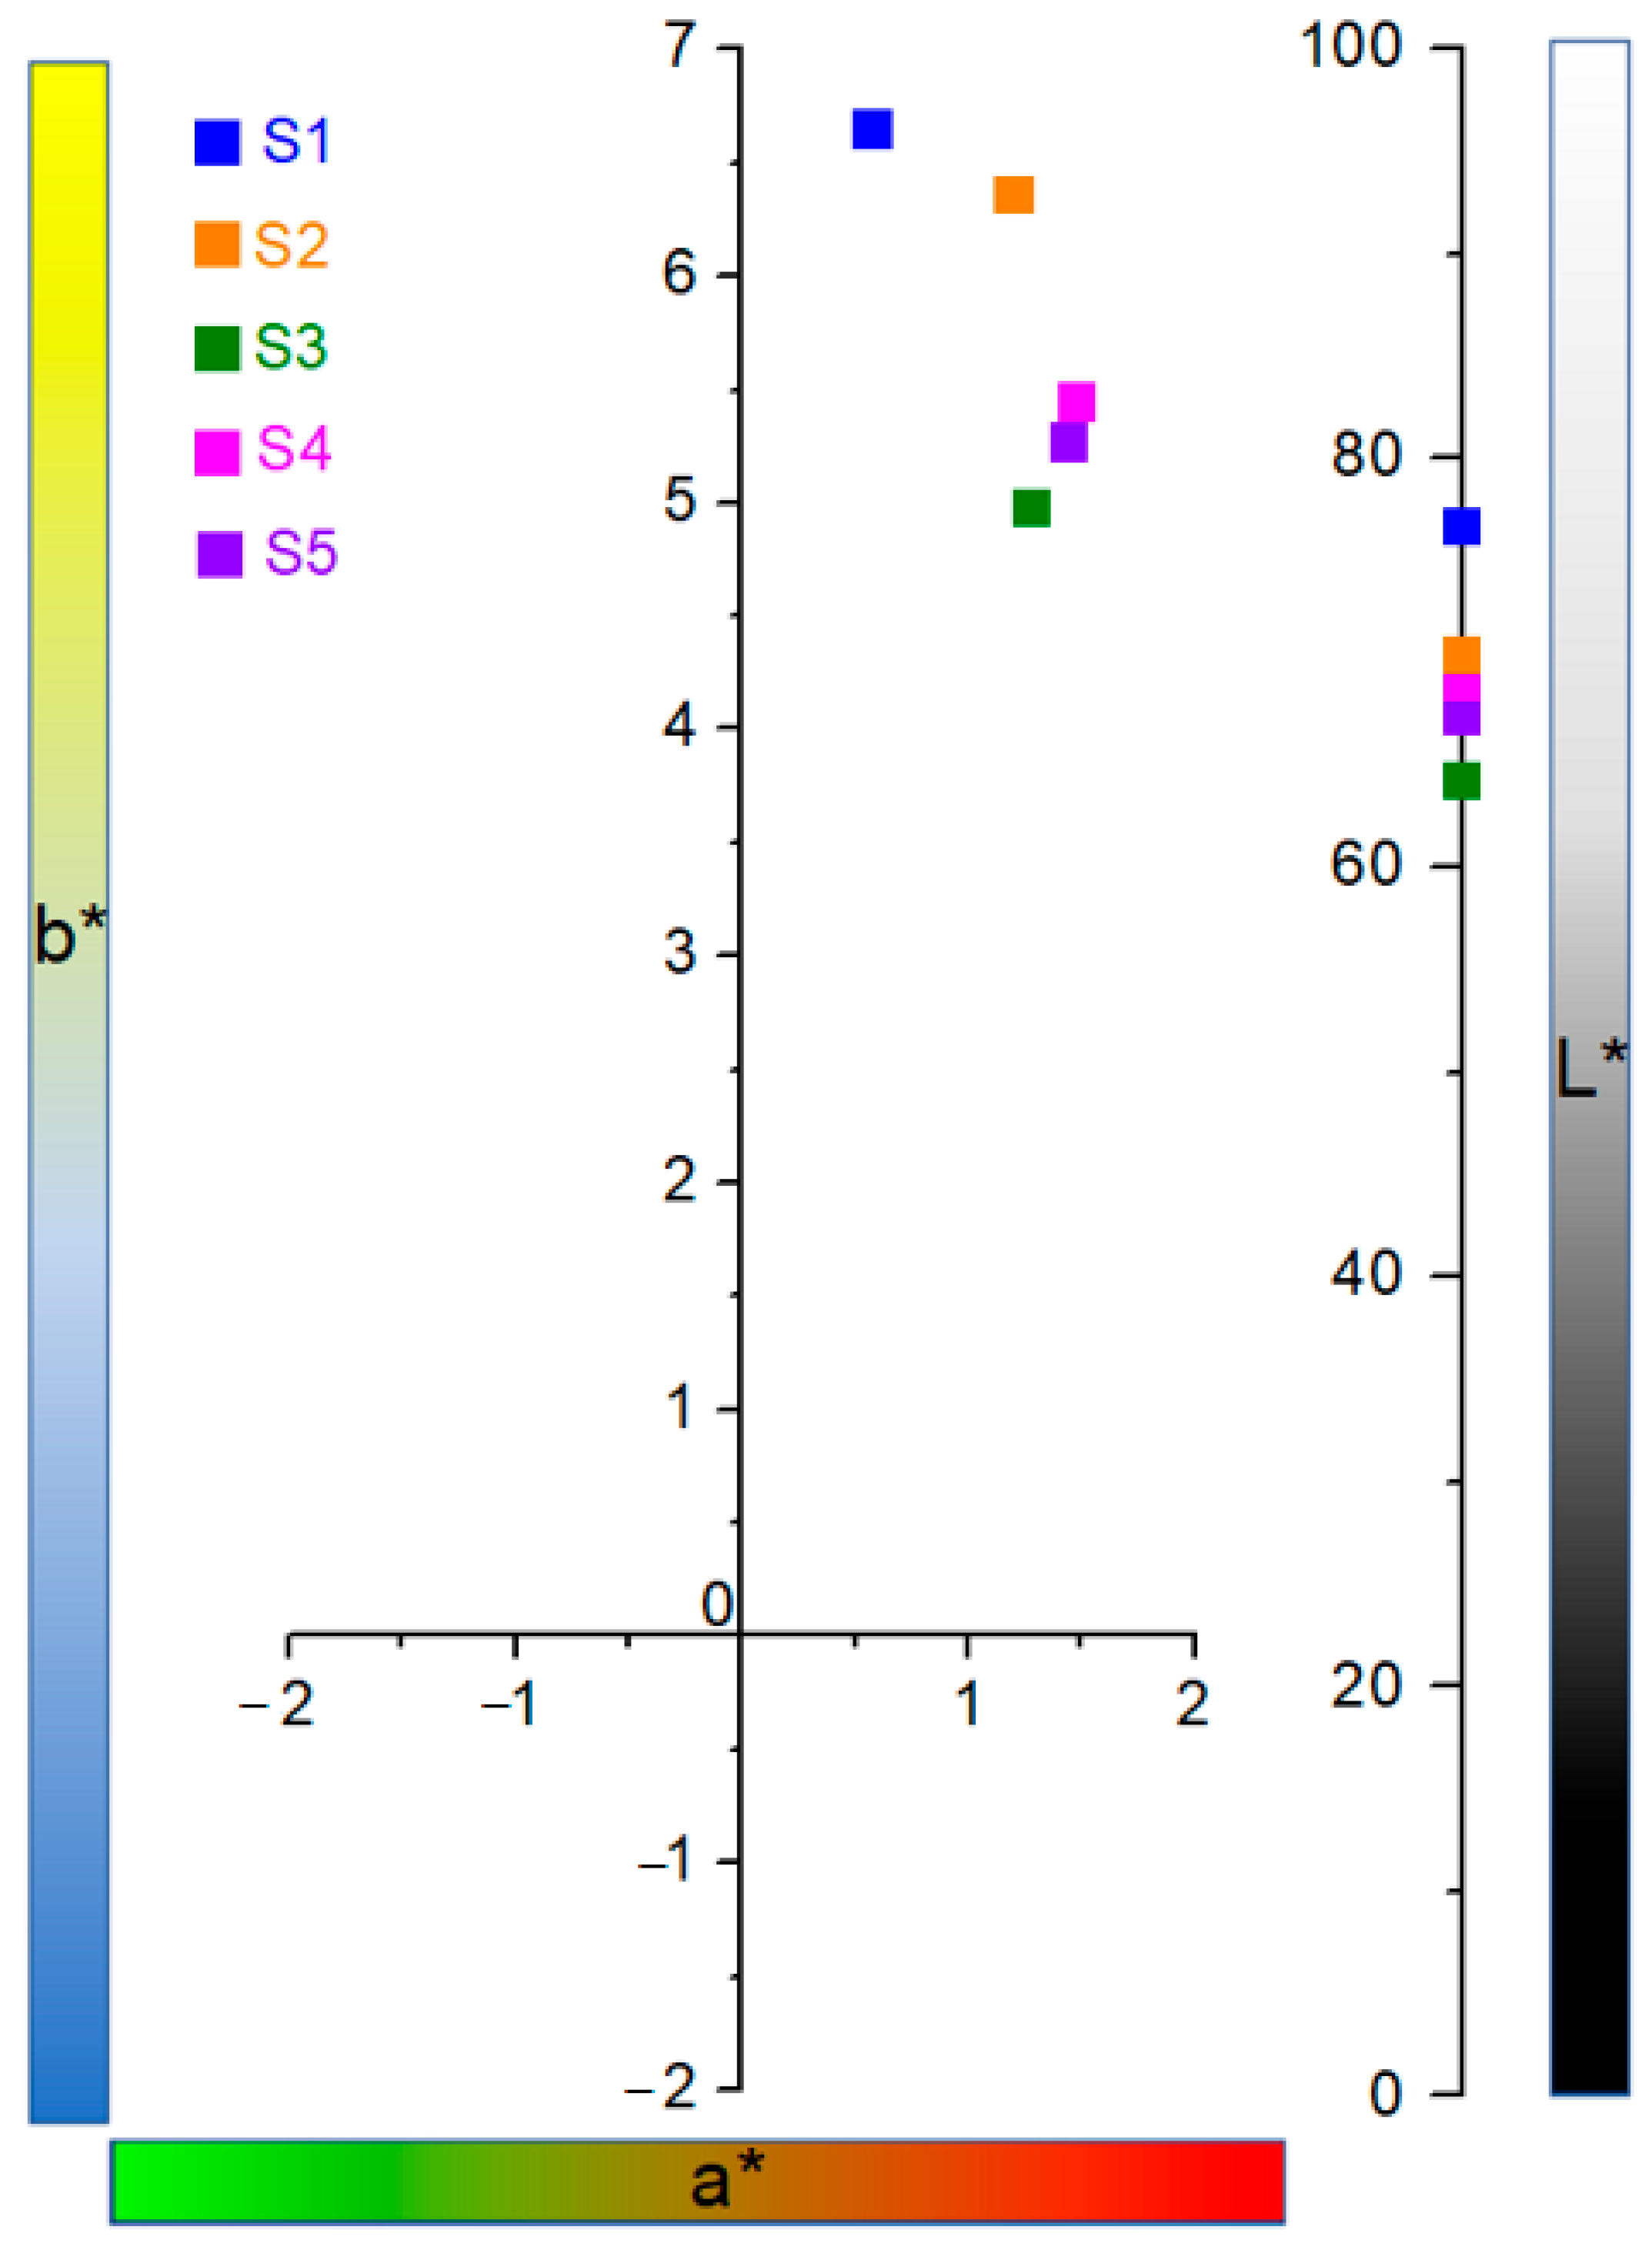
The CIE L*a*b* measurements, presented in
Figure 8, reveal clear optical distinctions between the pure Ni coating (S1) and the Ni–P deposits (S2–S5). Sample S1 exhibits the highest L* value, indicating a noticeably brighter and more reflective surface, together with a higher b* coordinate associated with a slightly yellowish hue. In contrast, all Ni–P coatings display lower L* values and reduced b*, resulting in a darker and more neutral visual appearance. The a* coordinate remains close to zero for all samples, showing that neither Ni nor Ni–P coatings exhibit meaningful shifts along the red–green axis. Among the Ni–P samples, which share similar Ni/P ratios, the L* and b* values remain relatively close to one another, indicating that variations in pH within the S2–S5 range do not produce a systematic darkening or yellow–blue shift. Instead, the Ni–P samples group tightly in color space, suggesting that once phosphorus is incorporated into the deposit, the resulting surface exhibits a consistently darker and optically neutral appearance, independent of the specific pH conditions used.
3.8. Adhesion
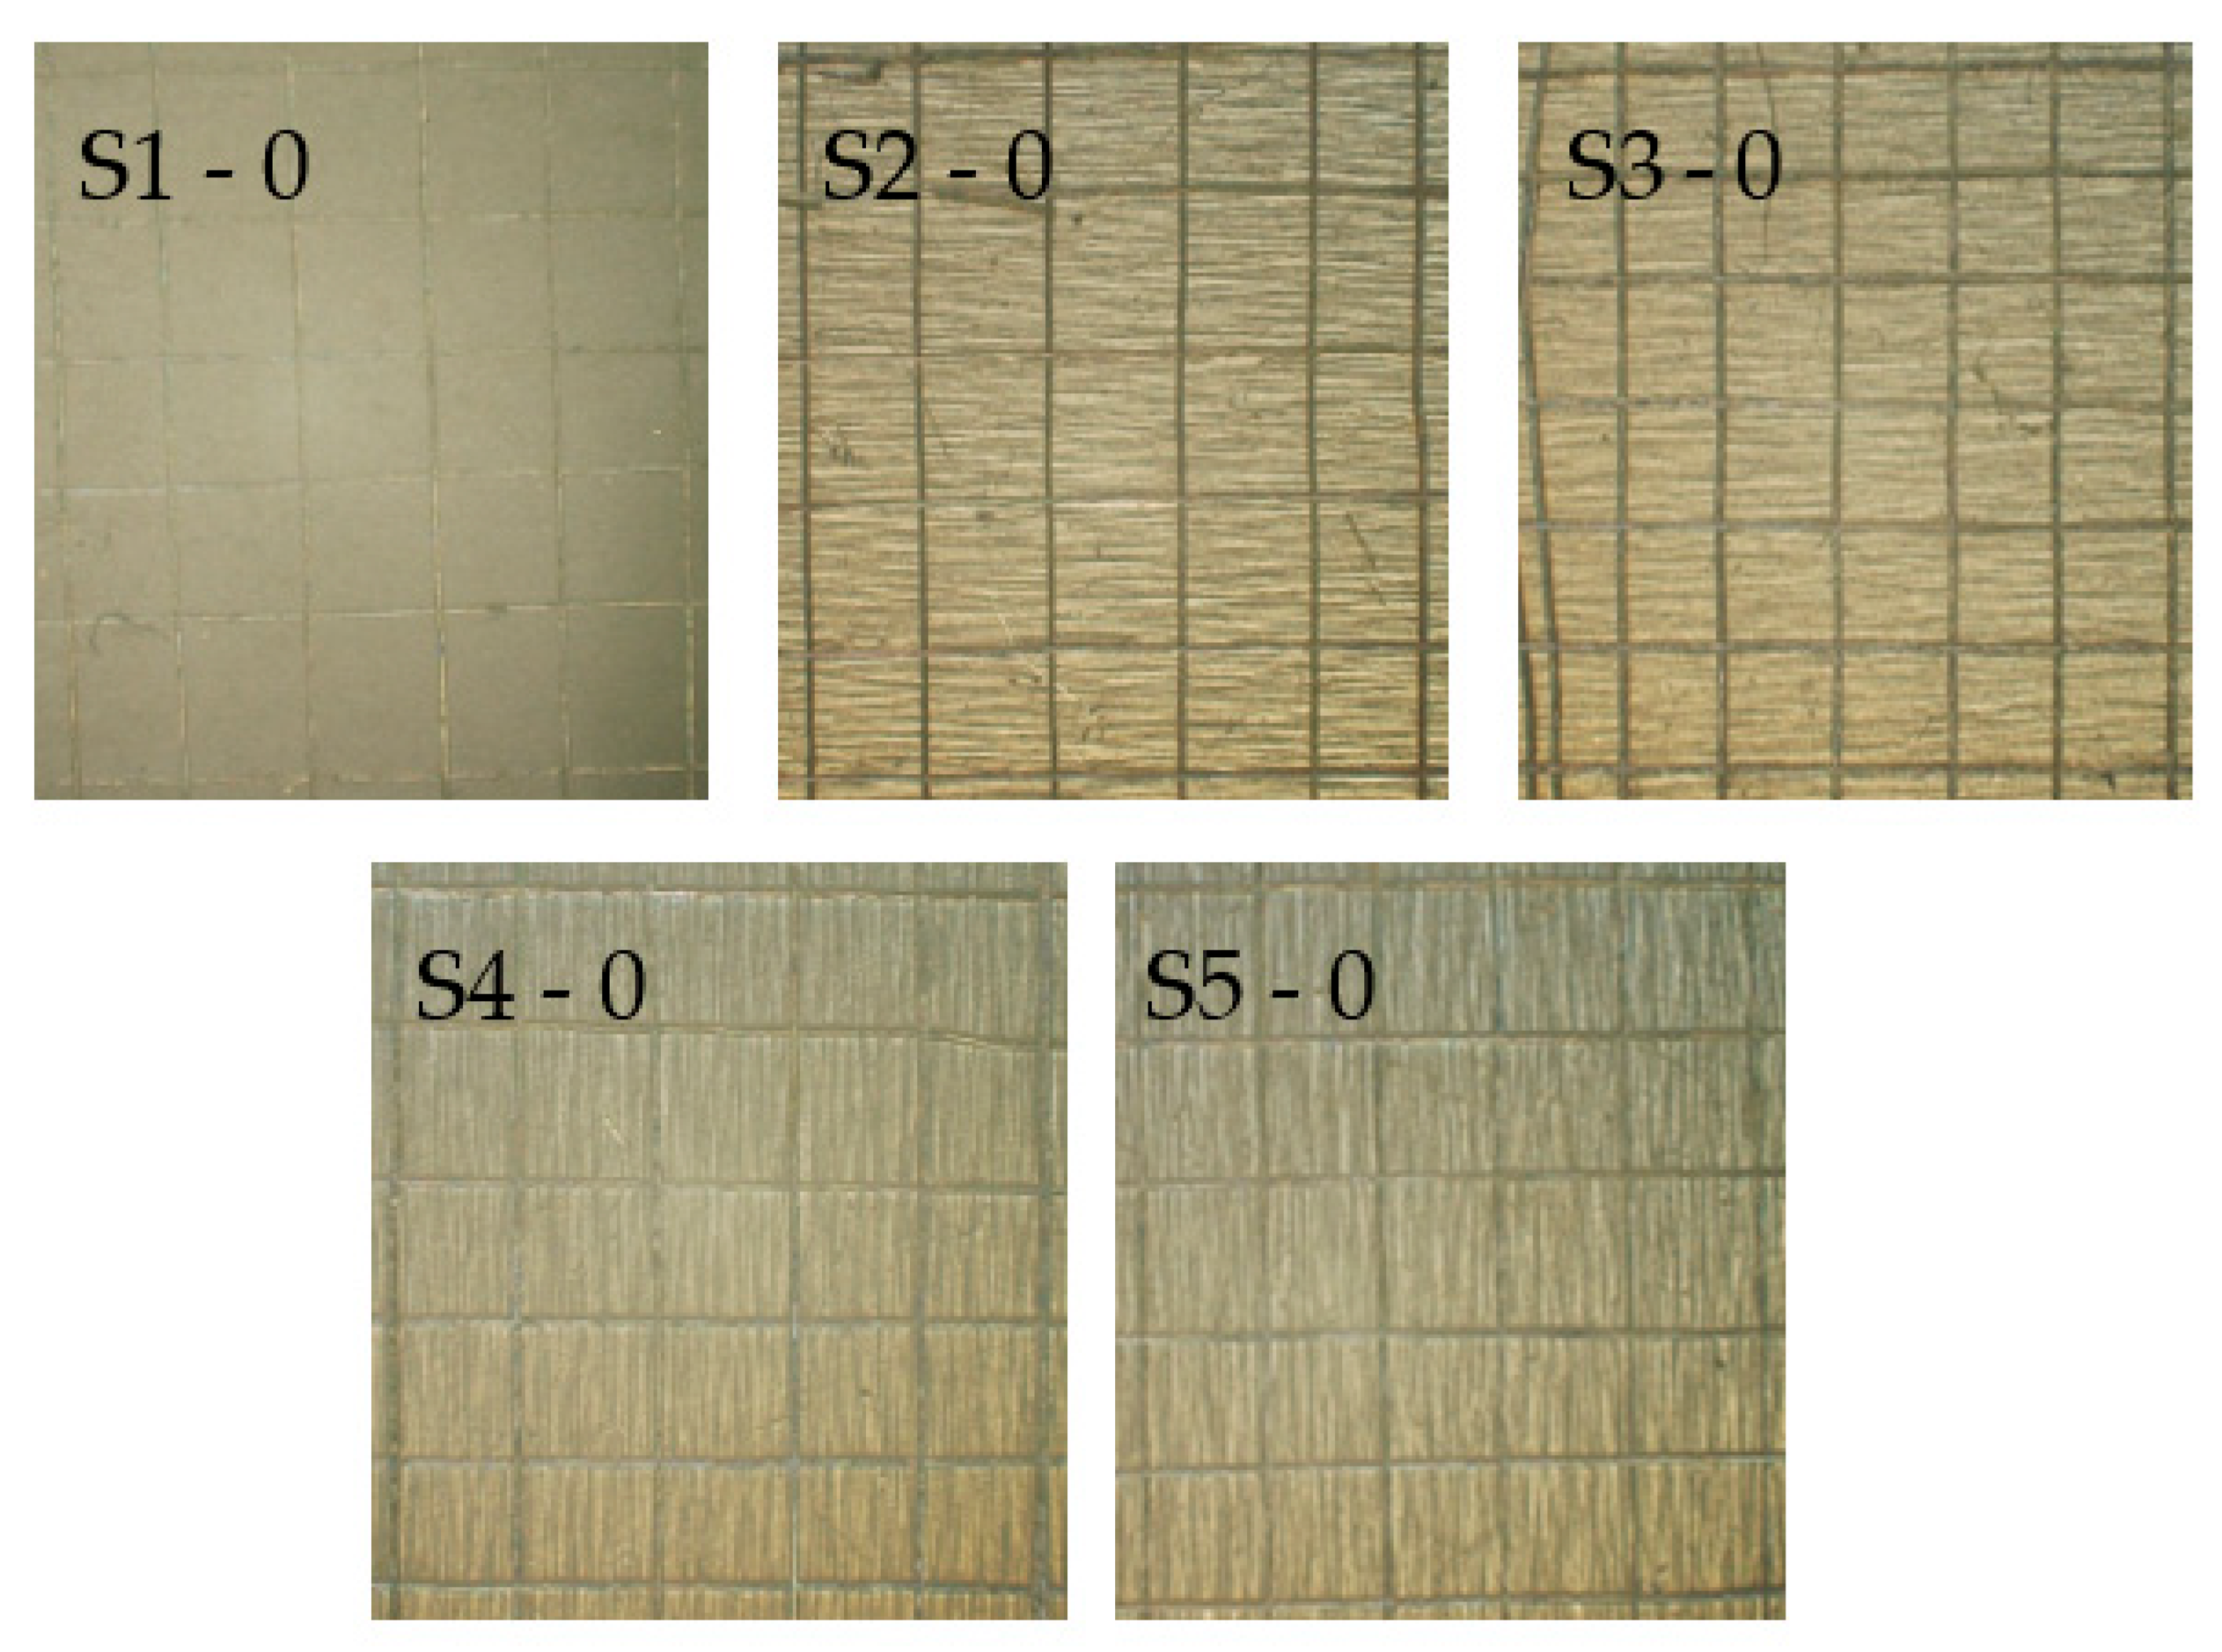
Adhesion is a critical parameter for evaluating the durability and overall performance of coatings when subjected to mechanical stress. The results of the adhesion tape tests conducted are presented in
Figure 9.
In all samples, no signs of delamination were detected. Based on the standard rating system, the coatings received a rating of zero (the highest possible), indicating excellent adhesion under all evaluated conditions.
The strong adhesion observed can be attributed to effective mechanical interlocking and interfacial bonding of both the Ni coating (sample S1) and the Ni–P alloys (samples S2–S5) [
48].
3.9. Tribological Behavior
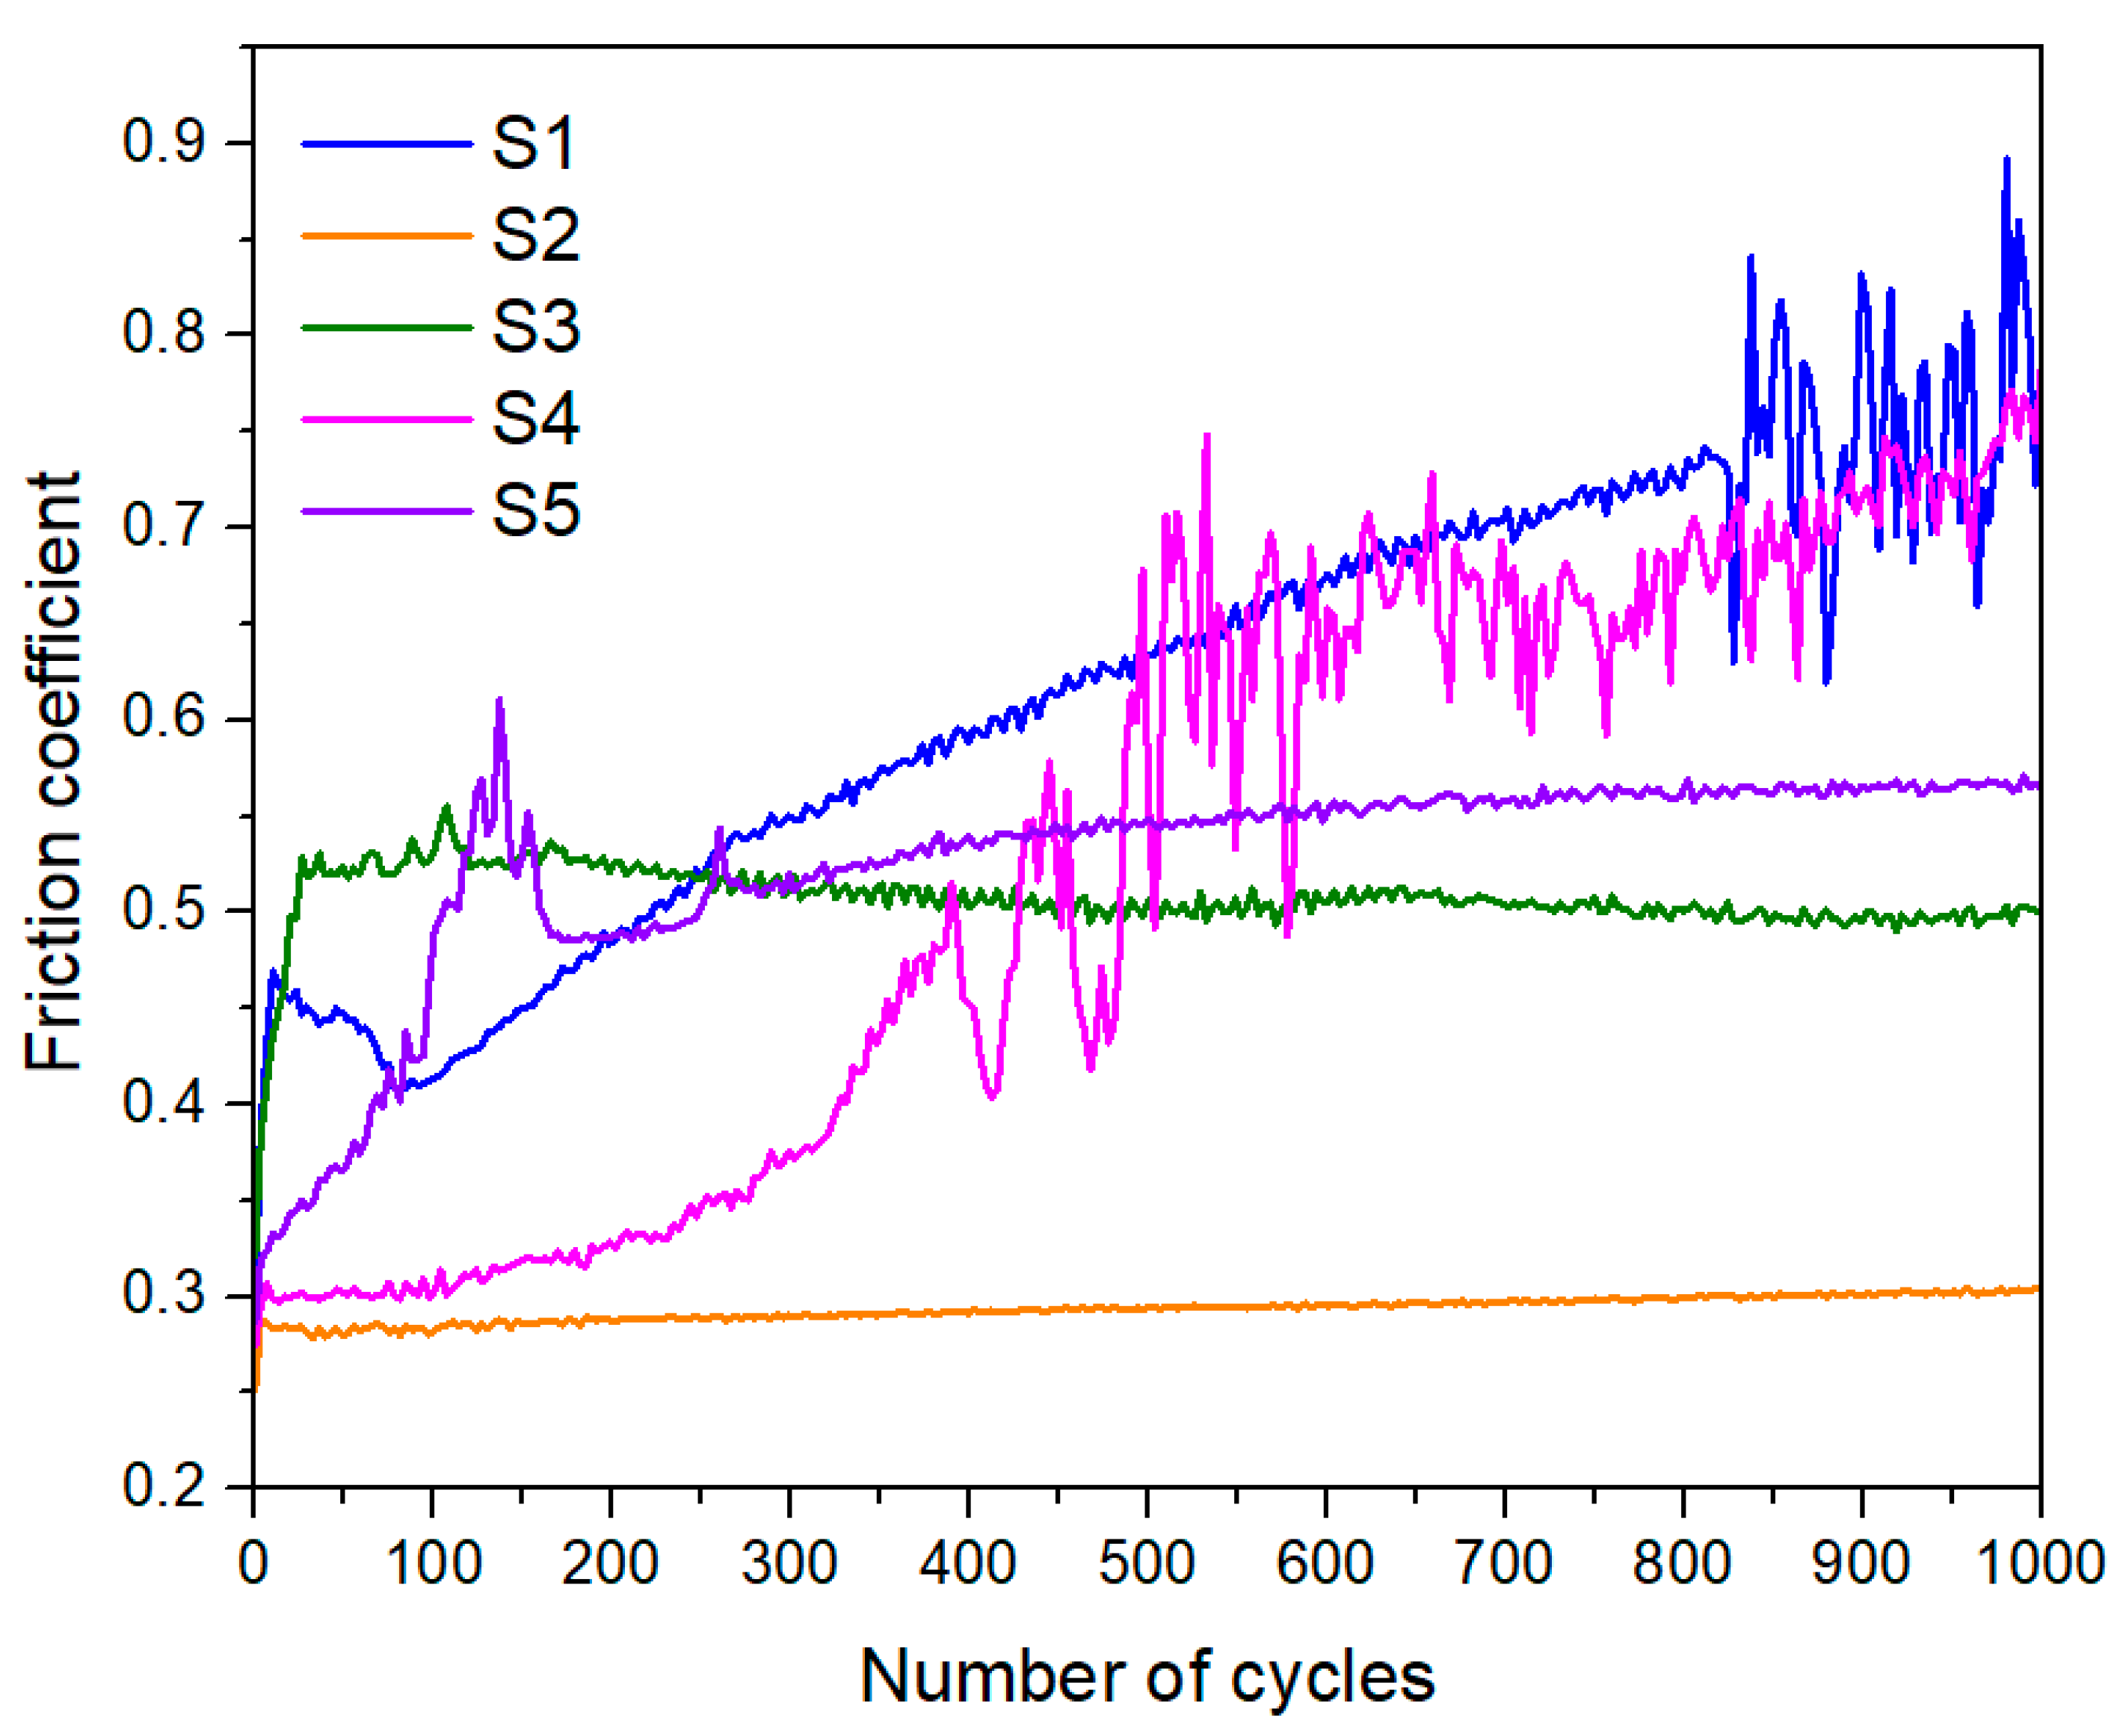
The COF evolution for all the samples is shown in
Figure 10. All curves exhibit the typical running-in stage followed by a more stable regime [
49], although the extent and stability of these regimes strongly depend on the coating composition. The pure Ni coating (S1) shows a gradual and smooth increase in the COF up until around 800 cycles, suggesting a severe adhesion wear mechanism (as will be shown later) with the formation of a tribofilm. At around the 800-cycle mark, the signal becomes highly unstable, pointing towards rough asperity generation and subsequent unstable contact and high wear rates, finally reaching a value around 0.80, typical of non-lubricated metal-to-metal contacts.
The addition of phosphorus seems to have a positive effect on the friction with all Ni–P samples (S2–S5) showing a clear decrease in the COF, except for the S4 sample. Sample S2, especially, shows the lowest observed COF of all the samples, with a value around 0.30 and a smooth curve, suggesting the formation of a stable and low-shear tribolayer in the contact. Samples S3 and S5 seem to follow the same trend with smooth curves but with higher COF values (around 0.50 and 0.55, respectively). Since the phosphorus amount is roughly identical, the higher value might be tentatively explained by the lower thickness of the films and the subsequent influence of the substrate, increasing the shear resistance and leading to higher COF values. Interestingly, sample S4 initially shows the same trend but then breaks apart and starts to form rough asperities, leading to the same behaviour as observed for sample S1 and eventual catastrophic failure of the film (as shown later when discussing wear mechanisms in more detail). With both S3 (thicker than S4) and S5 (thinner than S4) showing stable COF regimes, it is likely that the thickness of this film is in the “critical” thickness zone where the film is too thin to last, but thick enough to fail structurally. If this growth produced high enough internal stresses and, since the adhesion to the substrate was perfect (Class 0), the failure of S4 was likely cohesive related (internal “shattering” of the film).
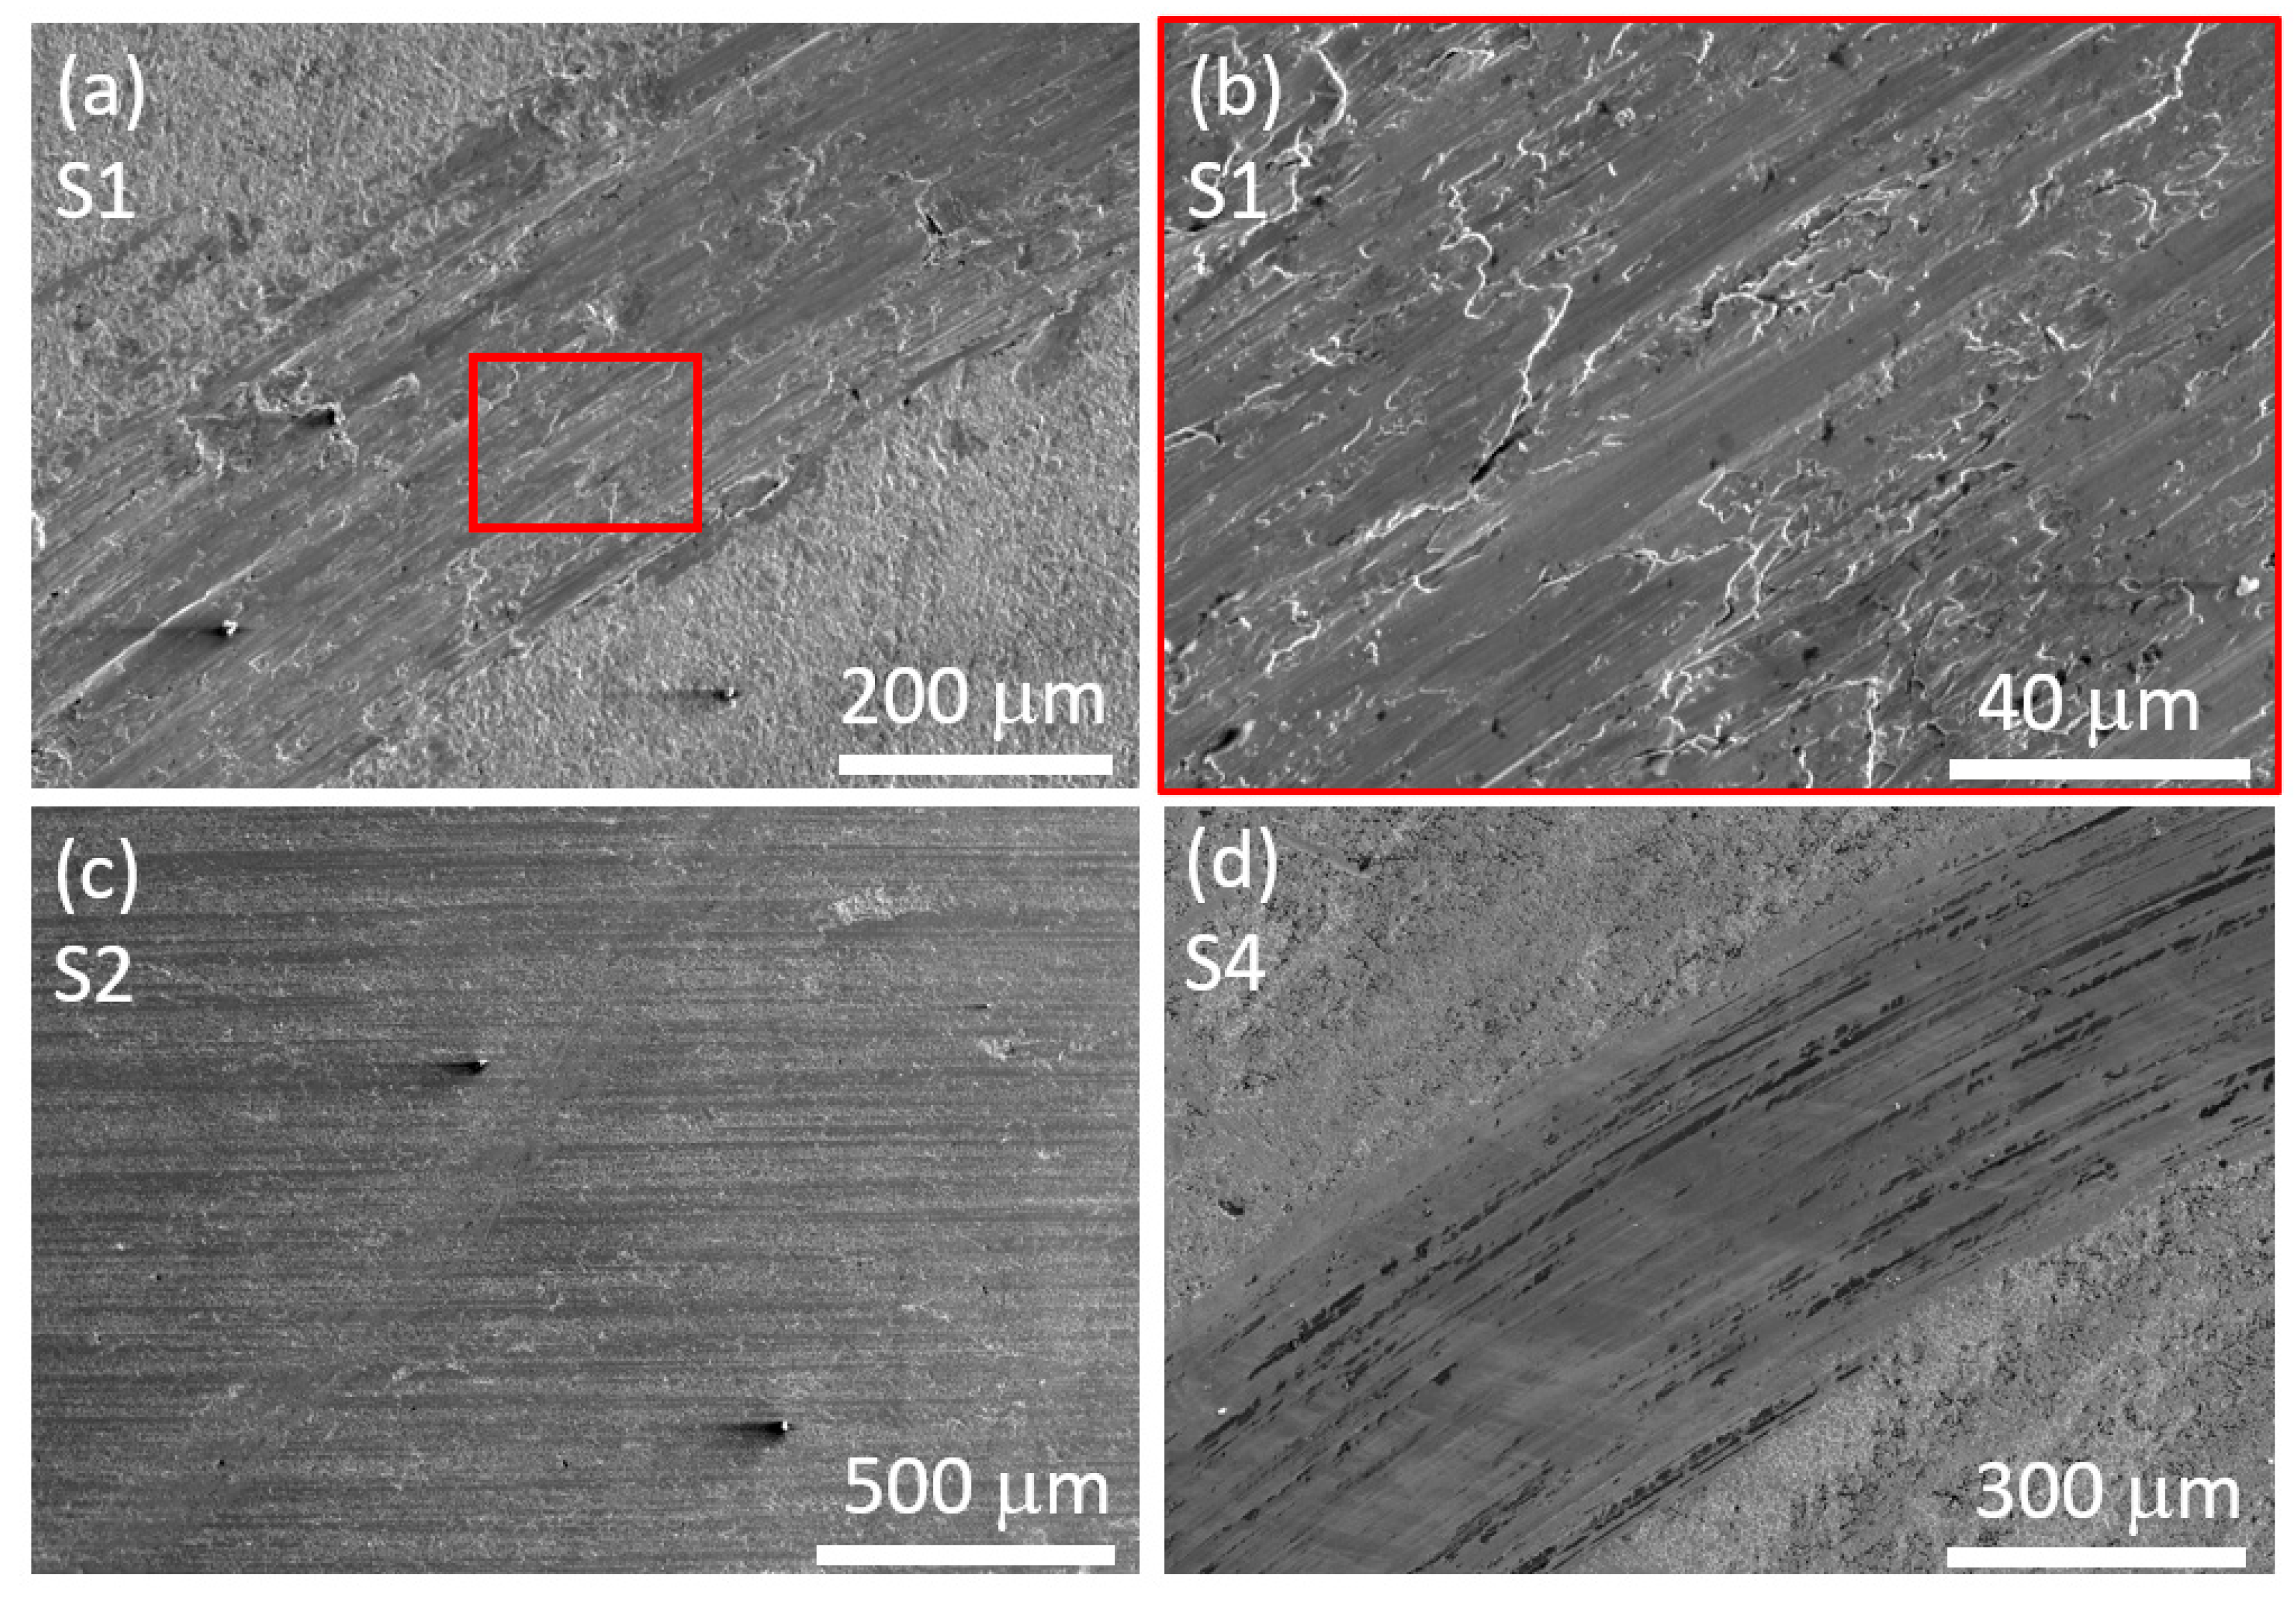
To better understand the underlying wear mechanisms, the wear tracks of the samples were analyzed and are shown in
Figure 11. As expected from the friction behaviour, the sample S1 wear track shows evident signs of pronounced adhesive wear. This results from severe deformation in the sliding track under combined compression and shear stresses, leading to a high wear rate and a strong tendency for plastic deformation. Consequently, numerous rough asperity spots are generated, which in turn cause a high and unstable friction coefficient in Ni coatings, as observed previously for S1 (see
Figure 10). Sample S2 shows, as expected, an extremely low wear with a barely visible wear track and no clear signs of abrasion or adhesive wear. This suggests that the thickness of the film was enough to form a stable and low-shear tribolayer that protects the surface and minimizes wear, leading to the lowest and most stable friction observed. Similar micrographs were observed for the S3 and S4 samples with no clear signs of abrasion or adhesive wear, but, as explained before, having higher COF values due to the lower thickness, which makes the wear quickly transition to substrate-influenced contact. The underlying 316L substrate begins to influence the wear dynamics due to a composite contact mechanism (ultrathin Ni–P layer + steel substrate) that increases the shear resistance and leads to the higher COF values observed (see
Figure 10). Finally, looking at the S4 sample wear track helps corroborate the COF observed for this sample. The track shows clear signs of abrasion and some adhesive debris. As referred before, S4 starts with a functioning tribolayer (initial low friction around 0.30) and then (around 400 cycles) the film starts suffering from intermittent disruption of this tribolayer and likely starts failing cohesively and releasing debris particles or flakes (as observed in the wear track) that get trapped in the contact zone, creating three-body abrasion (see abrasion signs on the wear track) and leading to the continuous and rough signal increase observed.
Although from a general perspective, the introduction of phosphorus shows a clear benefit in reducing friction, thickness seems to be the dominant factor governing and explaining the wear behaviour differences observed among the samples.
The tribological behaviour of sample S2 compares favourably with values typically reported for Ni–P coatings under similar dry sliding conditions. Whereas many studies describe equilibrium friction coefficients in the 0.40–0.60 range for as-deposited amorphous Ni–P alloys sliding against steel [
11,
24,
25,
27,
28,
30], the S2 coating in this work stabilized near 0.30 with minimal fluctuation. This lower and exceptionally stable response suggests that the microstructural uniformity of S2 promotes a highly consistent tribological interface, enabling friction levels at the lower end, or below, those typically achieved in comparable Ni–P systems reported in the literature.
3.10. Wettability
Wettability was assessed through static contact angle measurements using water (θw), diiodomethane (θD), and α-bromonaphthalene (θB) droplets. These values were subsequently used to estimate the total surface energy (γ_tot) and its dispersive (γ_d) and polar (γ_p) components via the Owens–Wendt–Rabel–Kaelble (OWRK) model [
34].
Table 3 summarizes the results for the as-deposited coatings.
All samples exhibit water contact angles between 98° and 109°, indicating that both Ni and Ni–P coatings are inherently weakly hydrophobic. Interestingly, despite noticeable differences in roughness and microstructure, the variations in contact angle remain within a relatively narrow range (±5–6°). This suggests that surface chemistry, particularly the metallic and low-polar nature of the as-deposited Ni–P surfaces, plays a dominant role in dictating wettability, rather than roughness alone.
For instance, sample S3, which exhibits the lowest roughness (Sa = 62 nm) and lowest surface energy (28.9 mN/m), presents one of the highest contact angles (109°). This indicates that its smooth, amorphous surface with high phosphorus content minimizes polar interactions with water. On the other hand, sample S4 shows a higher roughness (Sa = 86 nm) but a lower contact angle (98°) and the highest surface energy (35.7 mN/m), highlighting a possible increase in polar surface sites or a reduction in surface passivation. These observations reinforce the notion that chemical composition, rather than topographic effects captured by SEM or AFM, governs the wetting behavior of the as-deposited Ni–P coatings. The negligible γ_p values across all samples (≤0.1 mN/m) further confirm the low polarity of the surfaces, characteristic of metallic coatings with minimal surface oxidation or functional groups [
50].
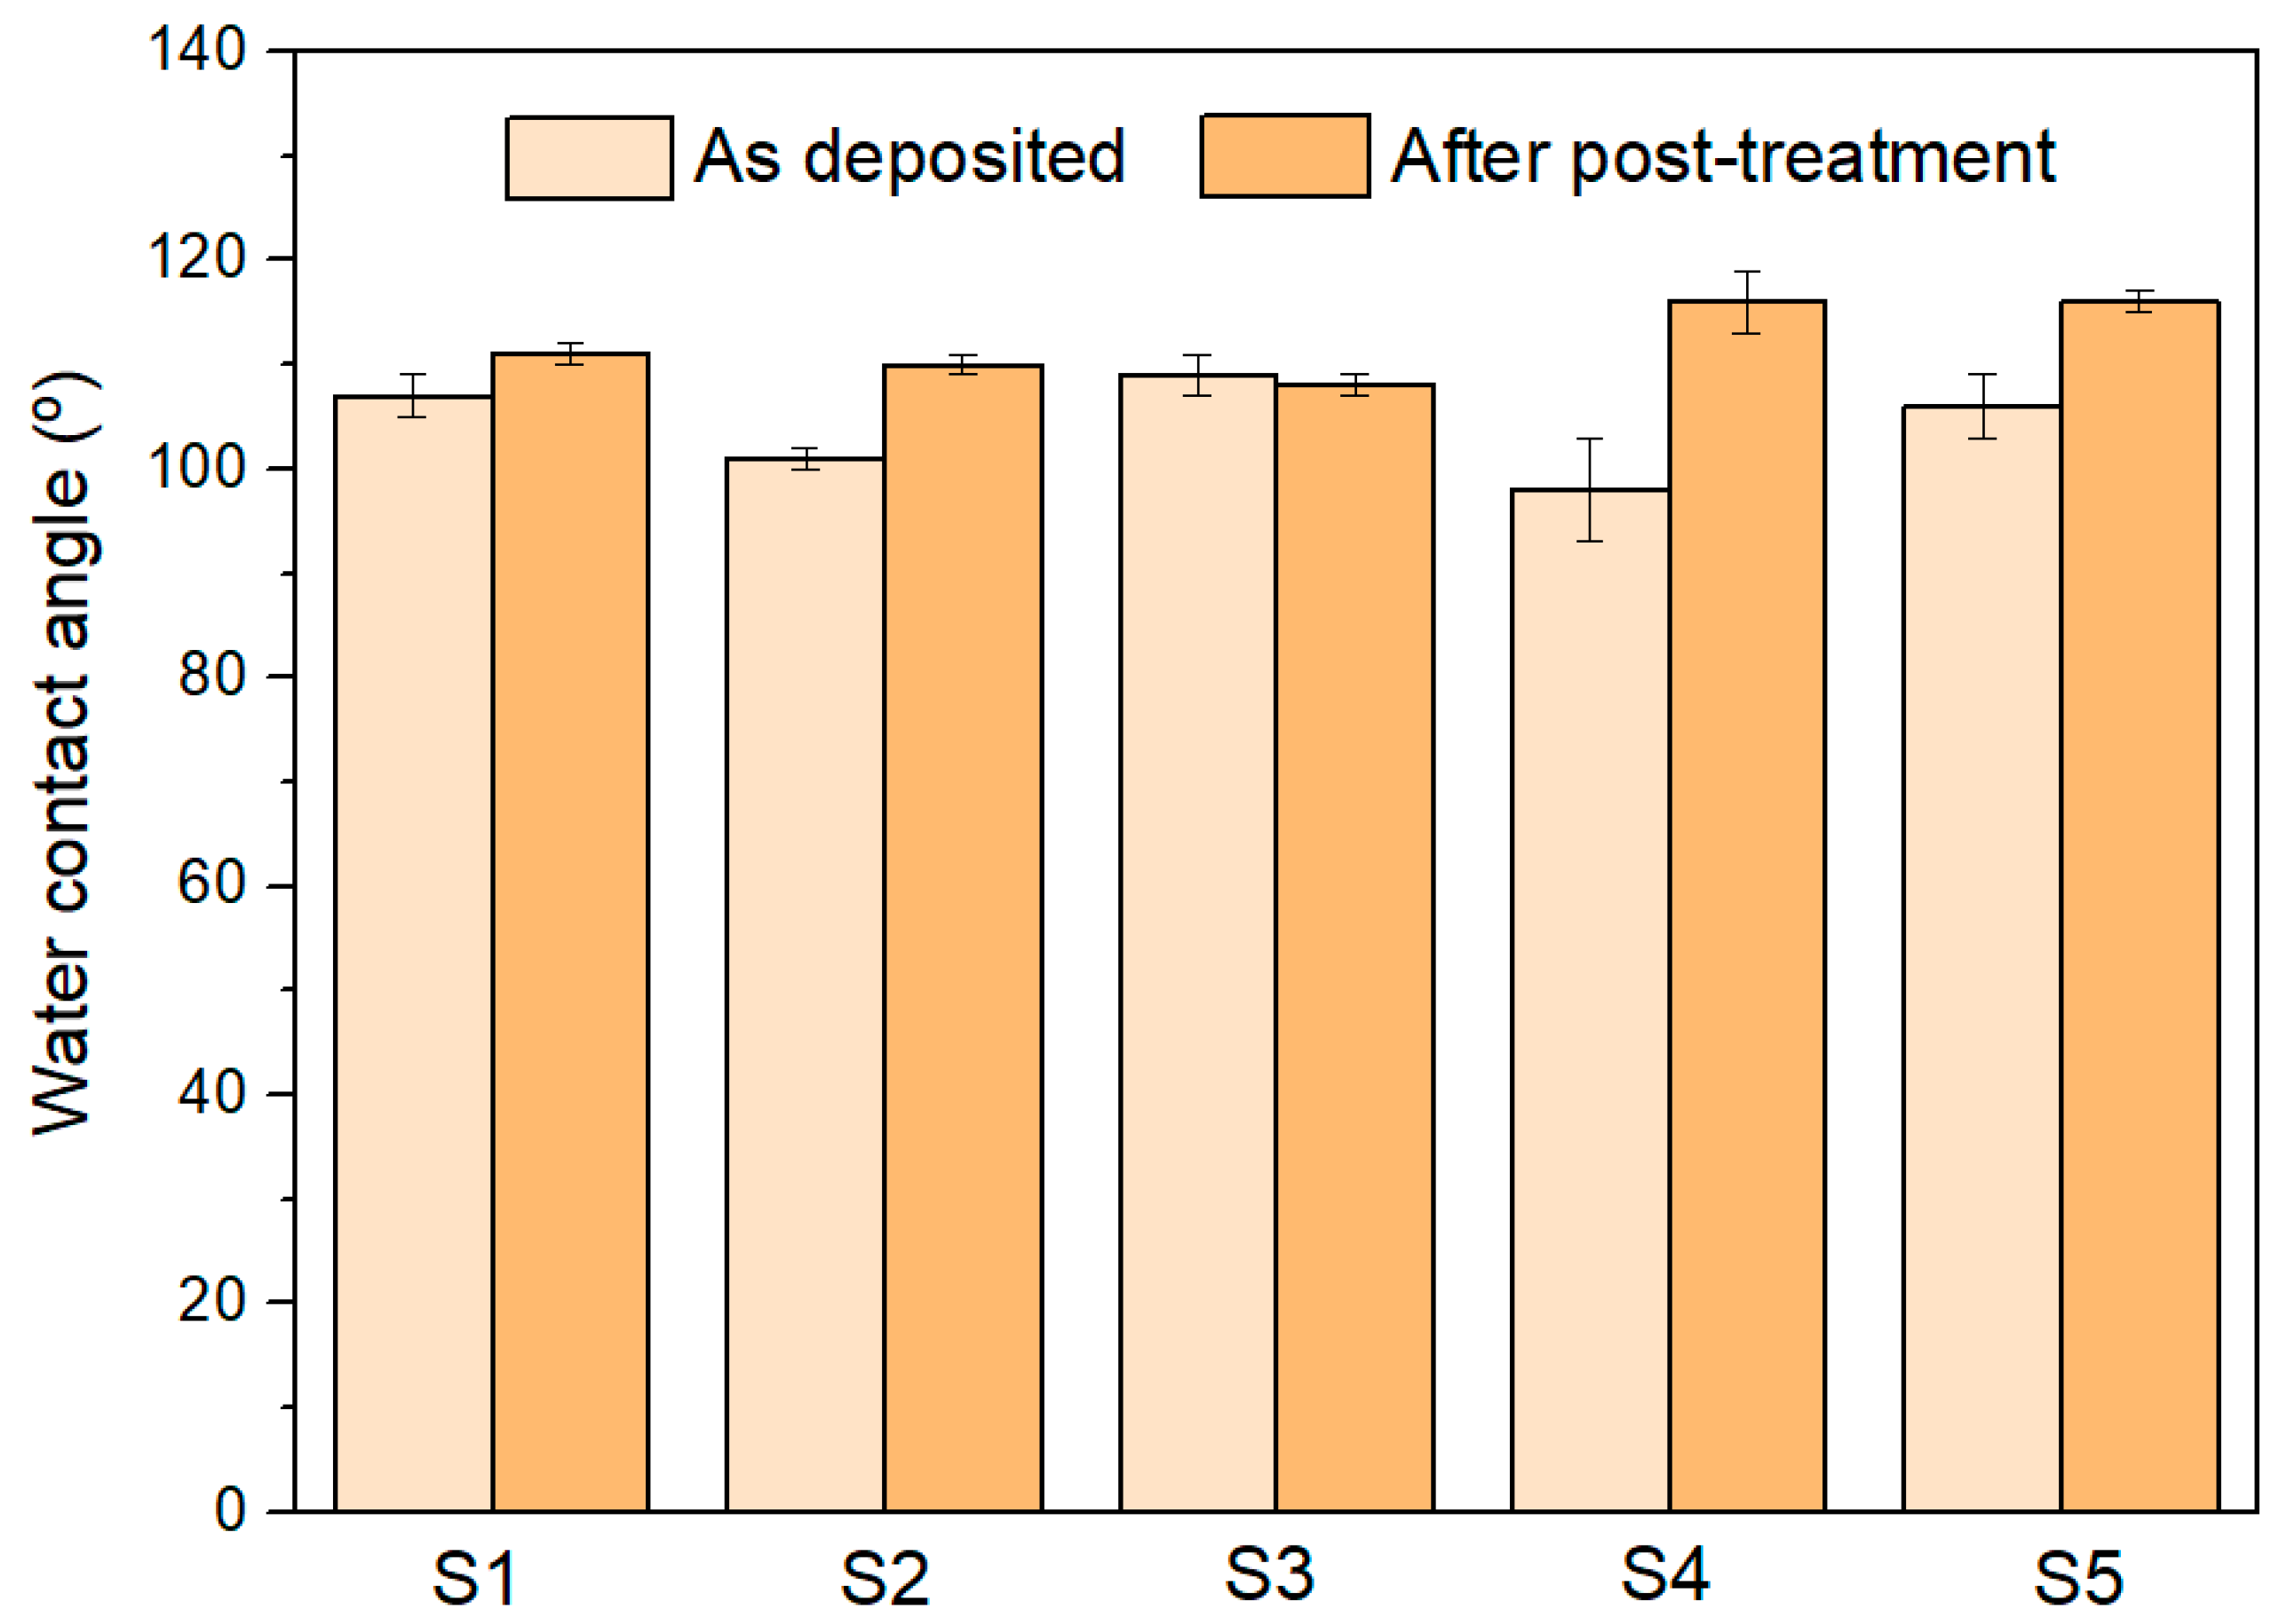
To evaluate the influence of the stearic acid post-treatment on the wettability of the developed coatings, water contact angle measurements were performed before and after surface modification. As shown in
Figure 12, the treatment led to a systematic increase in contact angle for samples S1, S2, S4, and S5, with values rising by approximately 5° to 10°. This modest yet consistent shift is attributed to the adsorption of long-chain alkyl groups from stearic acid, which reduces surface energy and enhances hydrophobicity [
50]. Notably, S4 and S5 reached contact angles close to 116°, placing them clearly in the hydrophobic regime.
Sample S3, however, showed no measurable change after stearic acid treatment, despite its initially high contact angle. This could be due to its already low surface energy and minimal polar functionality, which limit further reductions in wettability. Alternatively, its smooth and highly amorphous surface may reduce the available anchoring sites for stearic acid molecules, or its chemistry may already be near the saturation point for hydrophobization.
Importantly, the fact that four out of five samples responded similarly to surface modification indicates that the adsorption mechanism is generally effective across the range of Ni–P coatings, despite variations in phosphorus content or deposition pH. This also suggests that the chemical environment of the as-deposited films remains sufficiently consistent to support chemisorption or physisorption of the fatty acid.
4. Conclusions
The present work provides a systematic assessment of how variations in bath pH, induced through the addition of phosphorous acid, affect the electrodeposition process and the resulting functional properties of Ni–P coatings. Increasing H3PO3 concentration produced a strong nonlinear decrease in electrolyte pH, which in turn dramatically reduced the cathodic current efficiency and deposition rate. The coatings transitioned from fully crystalline Ni to amorphous Ni–P layers with 20–24 at.% P, although the extremely low deposition efficiency at high acid loadings yielded ultrathin films.
Morphological analysis revealed the progressive development of fine, nodular Ni–P textures, while CIE-Lab measurements showed that phosphorus incorporation consistently resulted in darker, optically neutral surfaces. Tribological tests confirmed the beneficial effect of phosphorus on sliding behaviour, with all Ni–P coatings exhibiting lower and more stable friction than pure Ni. Sample S2 showed the most favourable response, stabilizing at a coefficient of friction near 0.30.
Wettability analysis demonstrated that all as-deposited surfaces were weakly hydrophobic, with negligible polar surface energy components. A stearic acid post-treatment increased the water contact angle for most samples, consistent with effective surface functionalization. Overall, the results reveal that phosphorous acid plays a central role in determining deposition efficiency, structural development, and the key functional properties of Ni–P coatings.




 ,
,