Article

Unveiling the Microstructure Evolution Mechanism of A356 Aluminum Alloy During Squeeze Casting Torsional Formation

by
Zhenhu Wang
1,2,3,
Biwu Zhu
4,
Heng Li
5,
Xiao Liu
2,4,*,
Guoqiang Chen
1,
Shengkai Xiong
4,
Wenhui Liu
4,
Ganlin Qin
2,*,
Congchang Xu
2 and
Luoxing Li
2
1
School of Mechanical Engineering, Hunan Institute of Engineering, Xiangtan 411104, China
2
Research Institute of HNU in Chongqing, Hunan University, Chongqing 401135, China
3
Jiangnan Industries Group Co., Ltd., Xiangtan 411200, China
4
Hunan Engineering Research Center of Forming Technology and Damage Resistance Evaluation for High Efficiency Light Alloy Components, Hunan University of Science and Technology, Xiangtan 411201, China
5
School of Materials Science and Engineering, Northwestern Polytechnical University, Xi’an 710072, China
*
Authors to whom correspondence should be addressed.
Coatings 2025, 15(9), 1099; https://doi.org/10.3390/coatings15091099
Submission received: 31 July 2025 / Revised: 5 September 2025 / Accepted: 17 September 2025 / Published: 19 September 2025
(This article belongs to the Section Surface Characterization, Deposition and Modification)

Abstract

In this study, a novel casting–forging hybrid forming technique, introducing torsional shear during squeeze casting, was investigated. This approach enhances the forming efficiency and refines the grain size. Using a finite element method coupled with a viscoplastic self-consistent model, a macro-microscopic simulation model of the squeeze casting torsional forming process was established. The introduction of torsional shear in SQ results in a more uniform distribution and lower equivalent stress, thereby improving the forming efficiency. Additionally, the shear force is increased during the forming process, the shear force is greater with the distance from the torsional axis increasing, and the great shear force could be maintained for a long time. Ultimately, this leads to a thinner wall thickness, finer secondary dendrites, and eutectic Si in the workpiece. During the SQT process, for introducing ( 1 1 ¯ 1 ) [ 10 1 ¯ ] slip during the late stage of deformation, a significant shift in grain rotation directions happens and the grain rotation angles increase, finally attributed to the development of the ( 1 1 ¯ 1 ¯ ) [ 0 1 ¯ 1 ] texture.

1. Introduction

The casting–forging hybrid forming technique, which combines the advantages of casting and plastic forming, has emerged as a promising direction for the development of efficient processing methods for high-performance aluminum alloy components [1,2,3,4,5]. Introducing torsional shear deformation into squeeze casting (SQ) is a novel casting–forging hybrid forming technique, enabling the efficient production of high-performance aluminum alloy rotational parts. During the squeeze casting torsional forming (SQT) process, the introduction of shear forces results in a strong thermal–mechanical coupling effect, making the forming mechanisms complex, including the mechanical response, grain refinement, grain rotation, and texture evolution [6,7,8,9,10]. In the SQT process, the punch exerts extrusion and torsional shear on the semi-solid metal slurry, inducing internal shearing that breaks coarse dendrites and refines the grains. NaghdyS et al. [6] found severe grain refinement from ~85 μm to ~1.22 μm and the development of a weak simple shear texture in commercially aluminum (Al-0.28%Fe-0.05%Si-0.05%Cu, wt%) processed using high pressure torsion (HPT) at room temperature under semi-constrained conditions (450 kN force, 1 rpm), with 1/8 to 5 revolutions leading to equivalent strains up to 99. Ma et al. [8] examined the partially solidified A356 alloy under rotational shear with shear rates of 0.1–1000 s−1 and temperatures of 580–610 °C, demonstrating that higher shear rates lead to the more thorough breakdown of dendritic α-Al, resulting in smaller and rounder solid particles. Ostad et al. [9] found that for A356-Al2O3 composites, compared with gravity sand casting and squeeze casting, semi-solid compo-casting with electromagnetic stirring (70 A for 60 s) could generate stronger shear forces, which more effectively broke and refined dendrites, reduced the dendrite arm spacing, and promoted the formation of a globular-like microstructure with a higher shape factor. It is challenging to quantitatively investigate these various stages of the hybrid-forming process solely through experiments. In addition, collaborative control for geometry accuracy and performance is difficult in the SQT process.
The Viscoplastic Self-Consistent Model (VPSC), which is a simulation program capable of coupling macroscopic finite element analysis and user-defined crystal plasticity models, could simulate texture evolution and is widely used in analyzing the deformation texture and non-uniformity deformation of polycrystalline materials [11,12,13]. Pandey et al. [14] studied the influence of the strain rate and temperature on the yield strength and flow behavior of the 5754 aluminum alloy under uniaxial (tensile and compressive) and simple shear loading conditions and investigated the evolution of initial texture components applying the VPSC. Tabei et al. [15] employed finite element method (FEM) analysis to study the processing of the 7075 aluminum alloy and researched the evolution of microtexture below the processing surface employing the VPSC method. They indicated that a unique texture component formed because of high strains and strain rates produced in the processing surface and the subsurface during the machining process and the activation of dynamic recrystallization or twinning, resulting in larger discrepancies between experimental and simulated textures. Suresh et al. [16] studied the texture evolution of the AA2195 aluminum alloy using VPSC under Equal Channel Angular Pressing (ECAP) at 250 °C and found that the simulated and experimental texture strengths were inconsistent, attributed to the fact that continuous dynamic recrystallization and {111}<110> octahedral slip were neglected during the ECAP process during VPSC simulation. Xie et al. [12] established the transition of dynamic recrystallization (DRX) model and coupled VPSC to investigate the texture evolution and mechanical response of the as-cast AZ31 magnesium alloy during hot compression at 300 °C. They found that considering the transition of DRX could more accurately simulate the texture evolution process and mechanical response during hot deformation.
The finite element method (FEM) is an effective method for studying the plastic-forming processes [17,18,19,20]. In recent years, researchers have combined FEM with VPSC to study the forming process of metal materials [21,22]. Chen et al. [21] coupled FEM with VPSC to study the dominant initiated slip system in an Mg-3Al-1Zn alloy during the rolling process from macro-scale and meso-scale and indicated that the main DRX mechanism changed from twin-induced DRX at 150 °C to continuous DRX at 250 °C, attributed to the change in the dominant activated slip system. Li et al. [22,23] used FEM-VPSC to study the surface plastic deformation and texture evolution of the Ti-6Al-4V titanium alloy during high-speed machining and suggested that the effect of plastic shear strain on texture evolution was significantly larger than that of other strain. Liu et al. [13] investigated the influence of the deformation mode on the texture type during high-speed loading via FEM-VPSC and found that texture formation was cooperatively affected by the relative activity difference between basal and pyramidal slips, twin density, and grain orientation.
In the present study, aiming to address the complexities of microstructural evolution and the difficulties in collaborative control for geometry accuracy and performance in the SQT of A356 aluminum alloy, the SQT deformation process is investigated combining experimental data with multi-scale simulations. A predictive method for macro-microscopic deformation during the SQT process is established coupling FEM with VPSC modeling. The mechanism of SQT, is revealed and a novel shape control techniques is explored.

2. Experimental Method

The A356 aluminum alloy in the current study was sourced from Yunnan Aluminum Co., Ltd. (Kunming, China), and its chemical composition, characterized via OES (SPECTRO Analytical Instruments, SpectroMaxx LMF08, Kleve, Germany), is shown in Table 1. A 25 kg A356 alloy ingot was melted in a resistance furnace (Model 99-8-12, Mita, Hong Kong, China) at 720 °C and held for 30 min to ensure complete melting and homogenization of the melt. The melt was then degassed with argon. All casting tools and casting mold were coated with ZnO to prevent the introduction of excess Fe element. The melt was poured at 600 °C into the mold preheated to 300 °C. During the squeeze casting process, a force of 2 kN was applied to the end face of the punch, and the dimensions of the resulting casting are shown in the figure. The materials for the punch and die were 45# steel. The main steps of the SQT forming process and the positions for optical metallographic (OM, Axio Vert 40MAT, Mosbach, Germany) observation and X-ray diffraction (XRD, Bruker D8 Focus, Ettlingen, Germany) observation are displayed in Figure 1. The texture of the experimental samples was determined via X-ray diffraction (XRD). Specifically, XRD pole figure measurements were carried out to analyze the crystallographic orientation distribution of the grains. From these data, the orientation distribution function (ODF) was calculated, which enabled the quantitative characterization of the texture in the samples. The distance the from torsional axis of 2 mm, 10 mm, and 14 mm is labeled as R2, R10, and R14, respectively. In the SQT process, the punch is rotated 90° under pressure within 2.5 s. However, in the QT process, the casting is formed solely under pressure, without torsional action.

3. Macroscale and Mesoscale Modeling

A two-scale computational approach coupling the FEM and VPSC model, representing the macroscale and mesoscale, respectively, was applied to numerically link the deformation history of material points and microstructure activities with texture evolution. In this study, FEM simulation was performed using Abaqus 2017. The VPSC model simulates the plastic deformation process of polycrystals and requires three input variables: initial texture, materials parameters, and velocity gradient tensor. The velocity gradient tensor links the macroscale simulation and mesoscale simulation.

3.1. Finite Element Modeling

The mold for SQ and SQT consists of two parts: the concave mold and the convex mold. In the meshing model, a temperature-displacement coupled element type C3D8RT was selected, with a grid size of 1 mm for the aluminum alloy, resulting in 6660 grid elements. The punch had a mesh size of 2 mm, comprising 9776 elements, while the die had a mesh size of 2.5 mm and 13,172 elements. To predict the history of the deformation gradient tensor during the SQ and SQT process, the loading process was simulated by applying a dynamic explicit finite element analysis with a 3D ABAQUS/Explicit model. In the material properties module, the material properties for both the die and the punch were specified as 45# steel. In the interaction module, the die and the punch were coupled as rigid bodies. In the analysis step module, the analysis step was defined as the dynamic–temperature–displacement algorithm (Dynamic, Temp-disp, Explicit).

3.2. Material Constitutive for FEM

The previous high-temperature deformation constitutive equation material constitutive model of A356 aluminum alloy is employed in this study, as represented by Equation (1) [24].
σ = [ σ s a t 2 + ( σ 0 2 σ s a t 2 ) e Ω ε ] 0.5 ( 1 + C ln ε · * ) exp [ ( λ 1 + λ 2 ln ε · * ) ( T T τ ) ]
where σ denotes stress, ε represents strain, σsat corresponds to the saturation stress, and σ0 stands for the yield stress. Ω represents the dynamic recovery coefficient. C is the strain rate hardening coefficient. ε* is the dimensionless strain rate. λ1 and λ2 are both material constants. T signifies the deformation temperature. Tτ is the reference temperature.

3.3. Velocity Gradient Tensor

The velocity gradient tensor L, which can be derived from the deformation gradient F, is represented as follows:
L = F τ · F t 1 I t
where F t and F τ , obtained from the ABAQUS main routine, are the deformation gradient tensors at the beginning and end of the time increment, respectively, t is the time increment, and I is the identity tensor. With the application of the ABAQUS-VUMAT subroutine, information regarding the velocity gradient tensor can be obtained during SQT.

3.4. VPSC Modeling

Plastic deformation in aluminum alloys is achieved through slip, and in the VPSC model, the Voce hardening model is employed to simulate the texture evolution during SQT in aluminum alloy. The stress imposed on the slip plane is required to reach a critical shear stress for the initiation of slip. The Voce hardening model is used to describe the critical shear stress evolution of each grain as shear strain accumulates. The initial critical shear stress value τ0 is related to the yield strength of materials. As deformation continues, the critical shear stress for the deformation mechanism changes with strain, as expressed in Equation (3):
τ c s = τ 0 s + ( τ 1 s + θ 1 s Γ ) 1 exp Γ θ 0 s τ 1 s
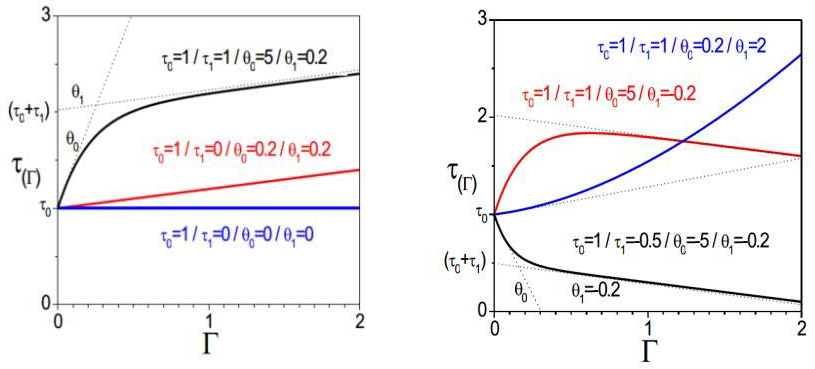
where, for a certain deformation mode, Γ is the accumulated amount of shear within the grain, τ 0 s is the initial critical shear stress value, τ 0 s + τ 1 s is the back-extrapolated CRSS, θ 0 s is the initial hardening rate, and θ 1 s is the hardening rate at large deformation. As shown in Figure 2, according to Equation (3), when τ0 + τ1 is reached, the yield stress increases, and the hardening rate decreases, gradually approaching θ1 from the initial hardening rate θ0.

4. Results and Discussion

4.1. Microstructure Under SQ and SQT Process

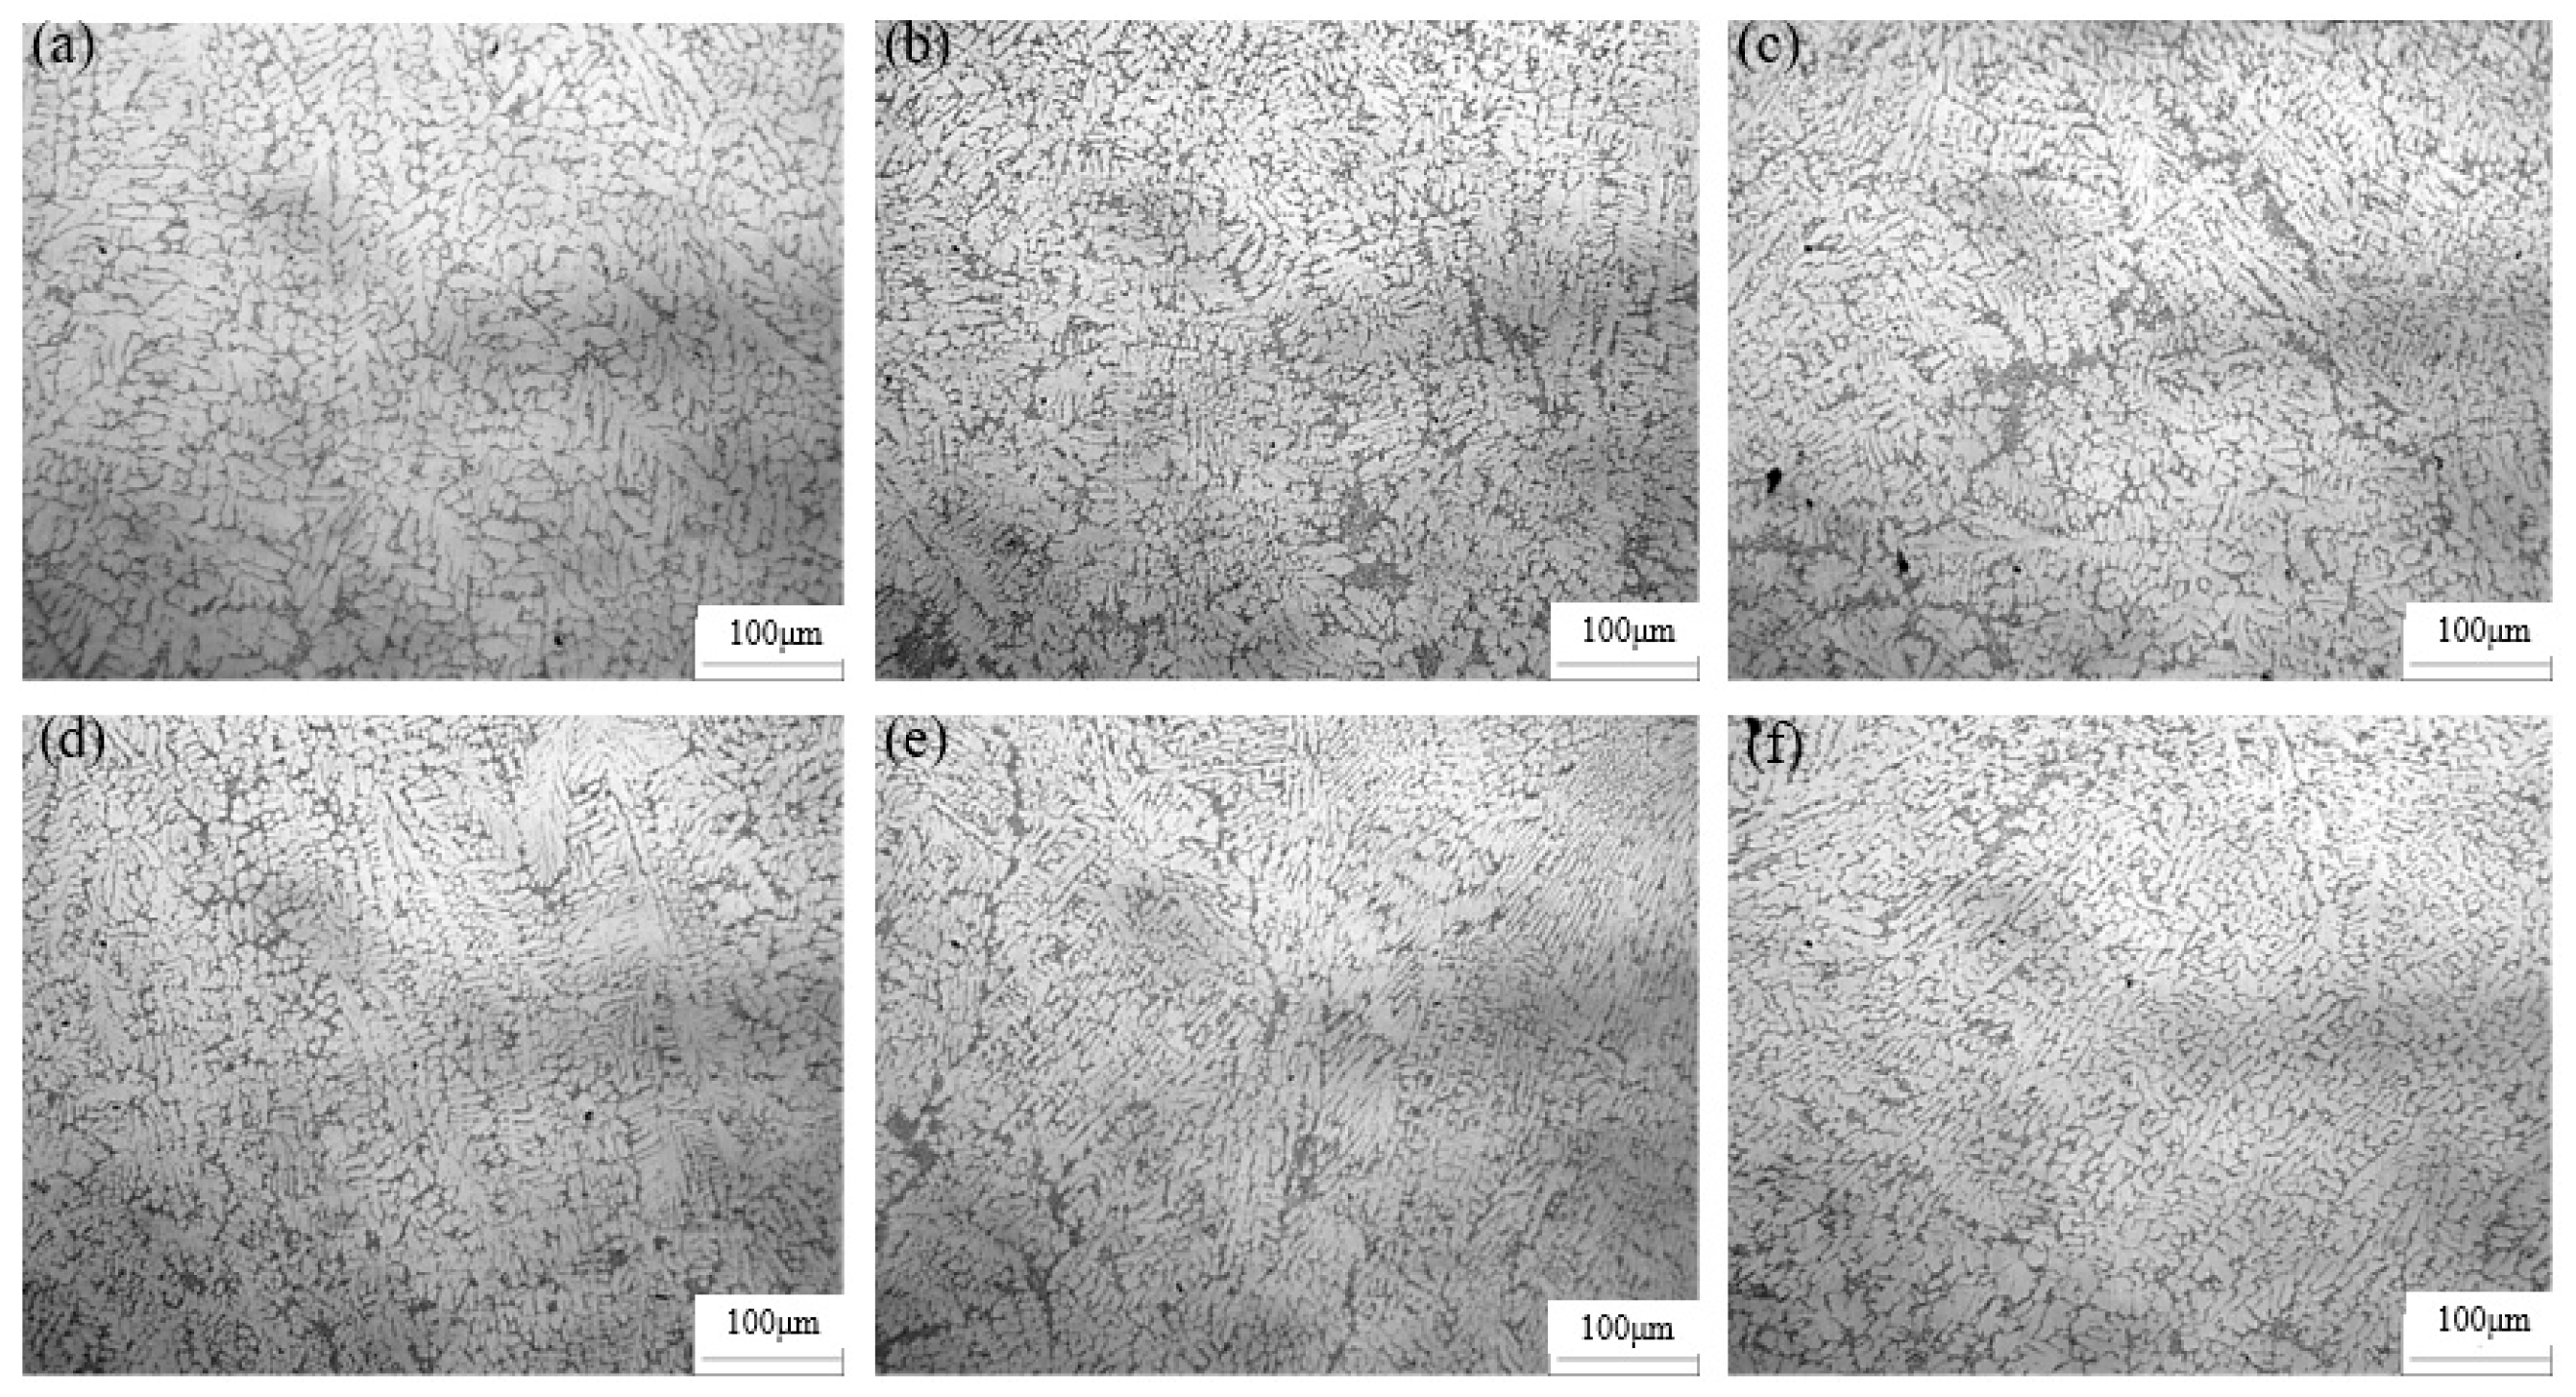
The microstructures of different regions in the A356 aluminum alloy workpieces formed via SQ and SQT processes at a pouring temperature of 600 °C and a mold temperature of 300 °C are illustrated in Figure 3. It can be observed from Figure 3 that the secondary dendrites in the SQT-formed workpieces are refined, while the secondary dendrites in SQ-formed workpieces still exhibit noticeable coarse primary dendrites. As the distance from the torsional axis increases, the secondary dendrites in the SQT-formed workpieces are significantly refined, while the change in secondary dendrites of the SQ-formed workpieces is neglected. As shown in Figure 3, the breakage and refinement of secondary dendrites of the SQT-formed workpieces are more effective than those of the SQ-formed workpieces, and the eutectic Si clustering is apparently improved. As the distance from the torsional axis increases, the breakage and refinement of eutectic Si in the SQT-formed workpieces is more evident, while a tendency for an increase in eutectic Si clustering in the SQ-formed workpieces is observed.
The torsional shear is introduced in SQ, causing the workpiece to be subjected to both squeezing and torsional shear forces. Therefore, the secondary dendrites and eutectic Si undergo fragmentation, resulting in grain refinement. In the R2 region, close to the torsional axis, the microstructure of SQT-formed and SQ-formed workpieces is similar. The influence of torsional shear increases with the distance from the torsional axis. Therefore, in the R2 region, the effects of torsional shear are limited and the breakage of the secondary dendrites and eutectic Si is mainly affected by the extrusion force. In the R14 region at the leading edge of SQ-formed workpieces, the initial α-aluminum and eutectic Si experienced eutectic Si clustering during the forming process due to inconsistent rheological characteristics. In contrast, in the SQT forming process, the effect of torsional shear increases with the distance from the torsional axis, leading that the fragmentation of secondary dendrites, and eutectic Si is enhanced. Then, grain refinement in the R14 region of SQT is obvious.

4.2. Evolution of Stress Distribution Under SQ and SQT Process

The experimental and simulated macroscopic morphology of the A356 aluminum alloy after SQ and SQT processes at a pouring temperature of 600 °C and a mold temperature of 300 °C are presented in Figure 4. It can be observed for Figure 4 that the experimental wall thickness of the SQ is 3.74 mm, while the simulated wall thickness of the workpiece is 3.60 mm. For the SQT, the experimental wall thickness of the workpiece is 3.22 mm, while the simulated wall thickness of the workpiece is 3.23 mm. These indicate that the FEM of the SQ and SQT is accurate and reliable. The experimental results in Figure 4 also show that the introduction of torsional shear during SQ allows the workpiece to undergo more plastic deformation, resulting in a thinner wall thickness and finer secondary dendrites and eutectic Si, consistent with the results in Figure 4.
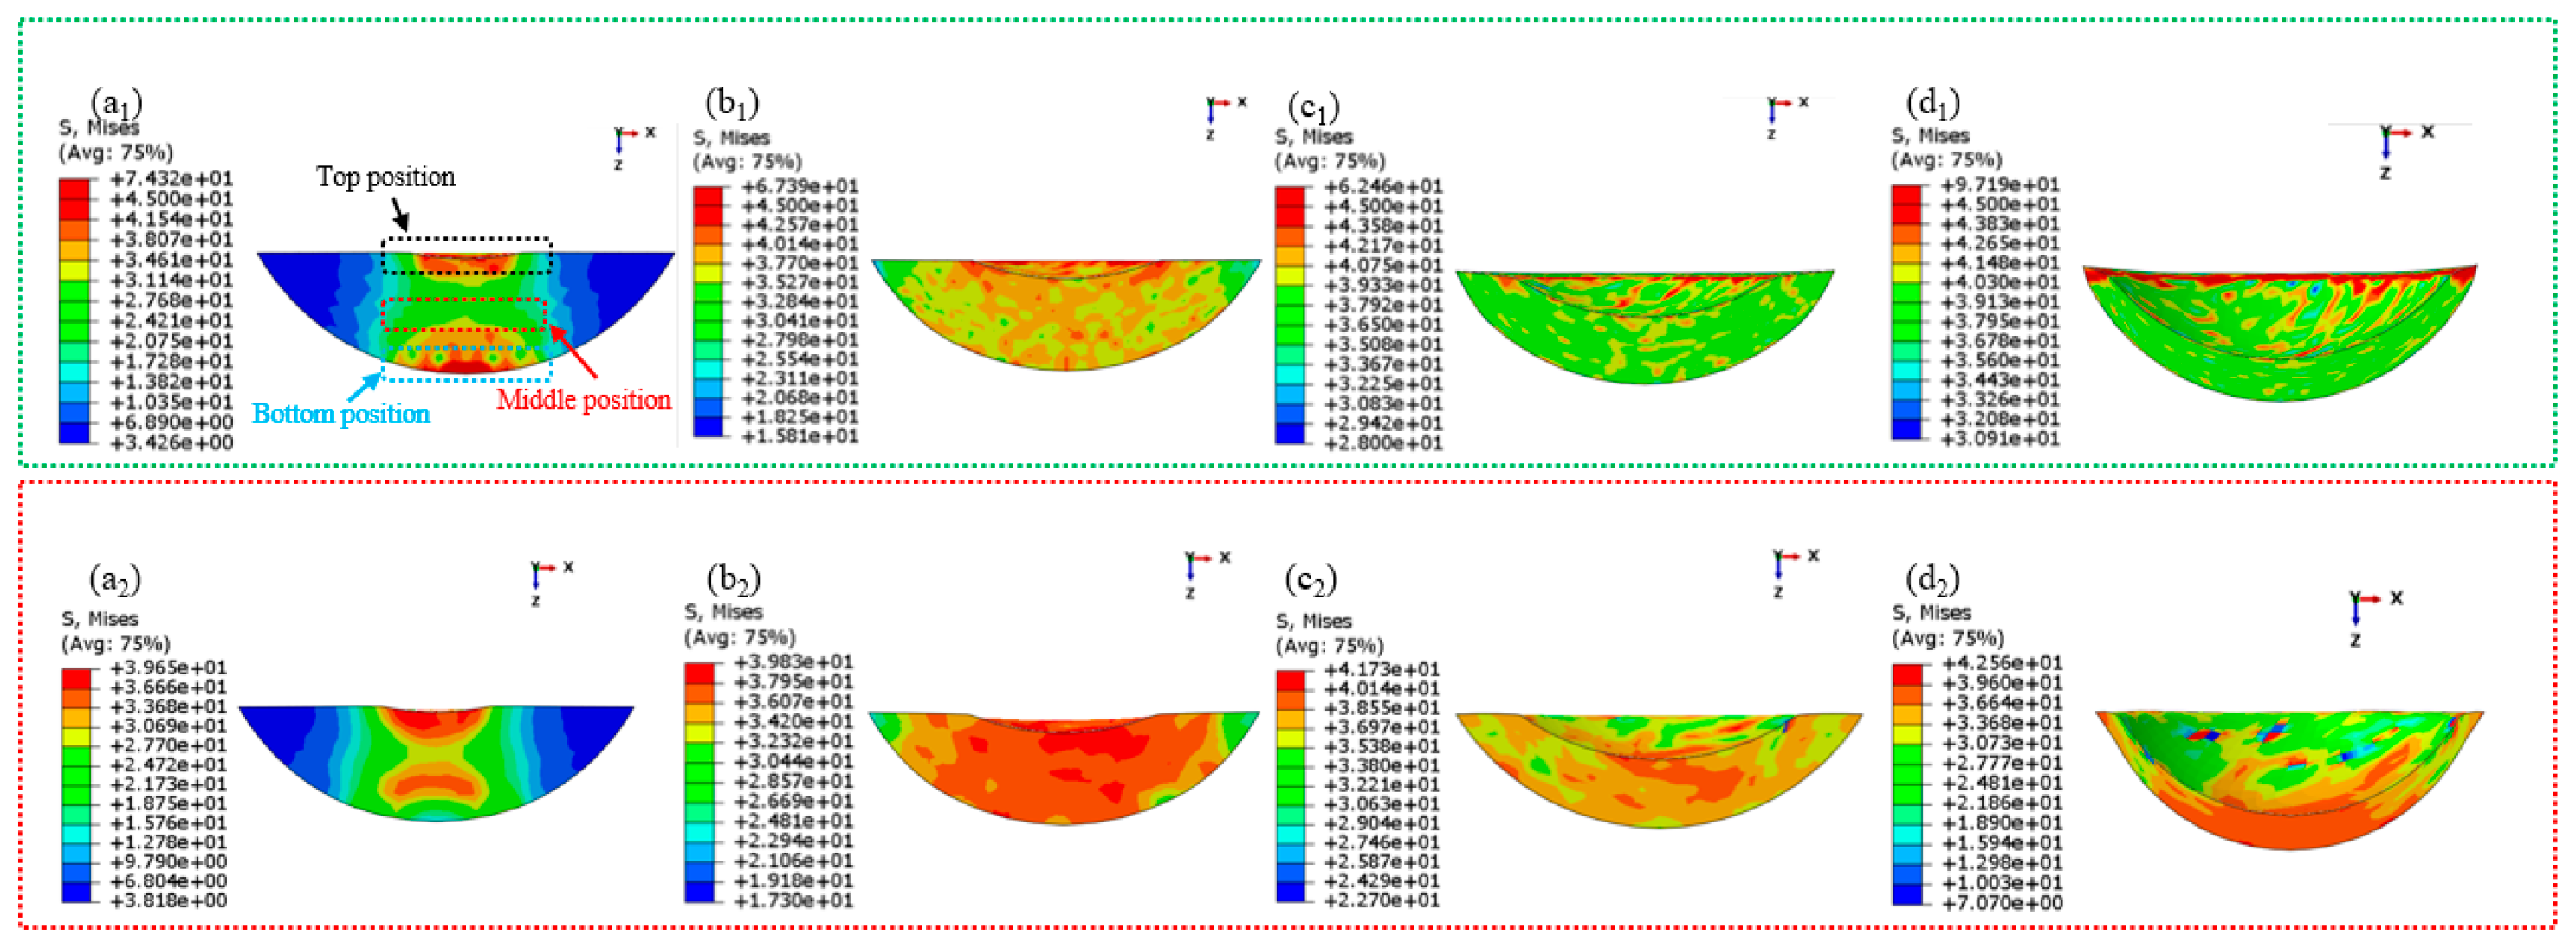
The simulated results of the equivalent stress at different times during the SQ and SQT of A356 aluminum alloy at a pouring temperature of 600 °C and a mold temperature of 300 °C are shown in Figure 5. From Figure 5(a1,a2), it can be observed that at the initial deformation stage, stress concentration mainly occurs in the top position and the bottom position of the R2 region in SQ, while in SQT, stress concentration is primarily in the top and the middle position of the R2 region. As the forming time increases, in the SQ forming process, the location of stress concentration shifts from the torsional axis to the surrounding areas. The maximum equivalent stress firstly slightly decreases and then rapidly increases. In the final deformation stage, stress concentration mainly occurs at the edge of the workpiece, and the maximum equivalent stress exceeds 91 MPa. In contrast, during the SQT, as the forming time increases, stress concentration is significantly reduced, and the distribution of equivalent stress becomes more uniform. The maximum equivalent stress does not display a significant increase and approximately remains at 40 MPa, which is at a lower level.
The introduction of torsional shear in SQ (see Figure 5) allows the workpiece to reduce stress concentration and obtains a uniform distribution of equivalent stress during the deformation process. The equivalent stress could be stably kept at a lower level, contributing to a reduction in the deformation resistance. This leads to an improvement in the forming efficiency. Additionally, the low and uniformly distributed equivalent stress significantly reduces residual stresses of the formed workpiece. This reduction in residual stresses helps minimize shape change and the occurrence of cracks in the workpiece, finally realizing collaborative control for geometry accuracy and performance during the SQT forming process.
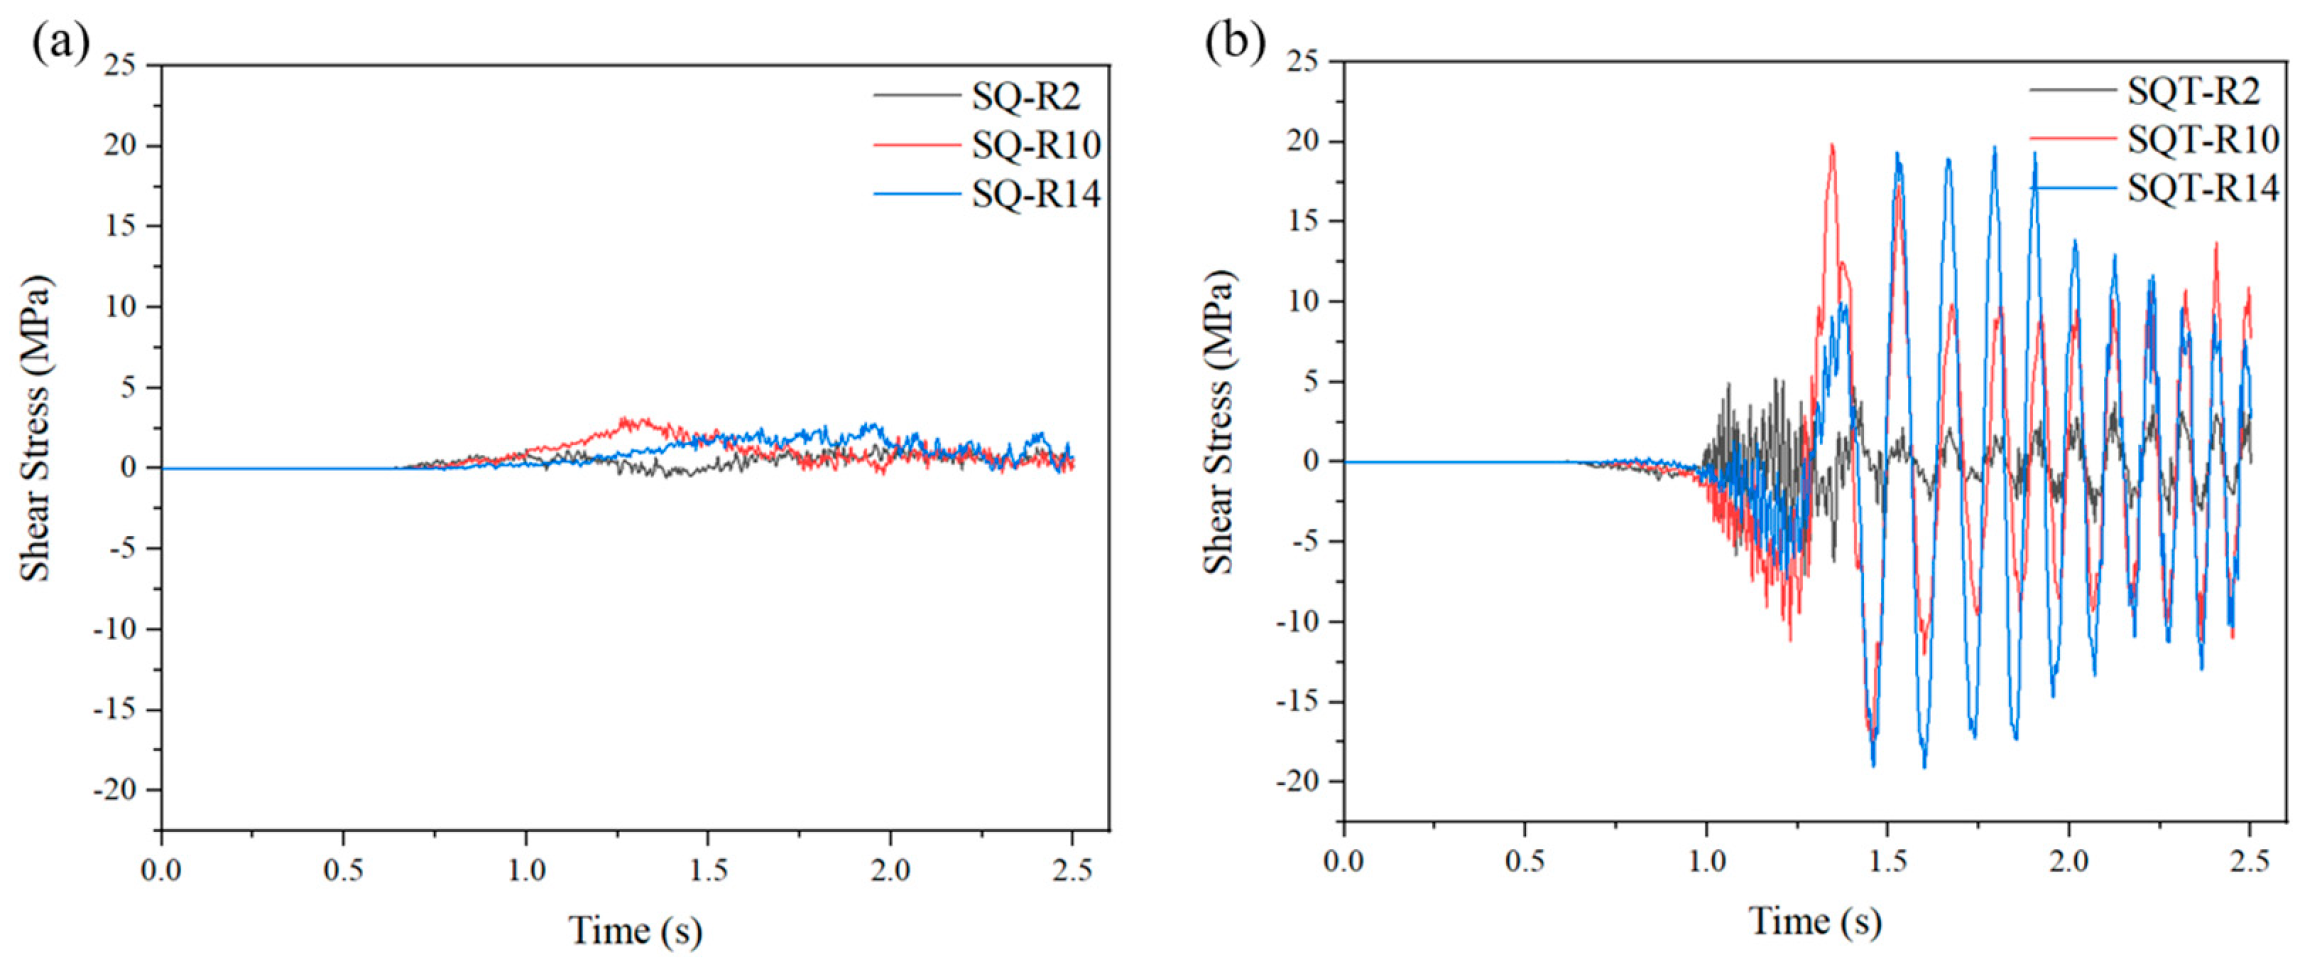
The simulated shear stress in different regions of the A356 aluminum alloy after the SQ and SQT at a pouring temperature of 600 °C and a mold temperature of 300 °C is presented in Figure 6. It can be observed from Figure 6 that during the initial 1 s of the forming process, the shear stress in various regions of both SQ and SQT is very low. Combining this with the simulated results shown in Figure 5(a1,a2), it is evident that at the initial deformation stage, the punch firstly contacts the workpiece, the deformation of the workpiece is minimal, and shear forces are insignificant in all regions. As shown in Figure 6a, as the forming time increases, the shear forces in various regions of SQ-formed workpieces initially increase and then decrease. The peak shear force does not exceed 3 MPa. During SQ forming, the primary force acting on the metal is the squeezing force, while shear forces have a minimal effect on the refinement of secondary dendrites and eutectic Si. It is evident from Figure 6b that, as the forming time increases, during SQT, the shear forces in various regions of the workpiece significantly increase and peak shear forces exceed 20 MPa. Furthermore, with the distance from the torsional axis increasing, the maintained time of shear forces increases. With shear forces increasing, the maintained time of shear forces increases, resulting in a pronounced refinement effect on secondary dendrites and eutectic Si, finally leading to a finer microstructure. This finding is consistent with the results shown in Figure 3.
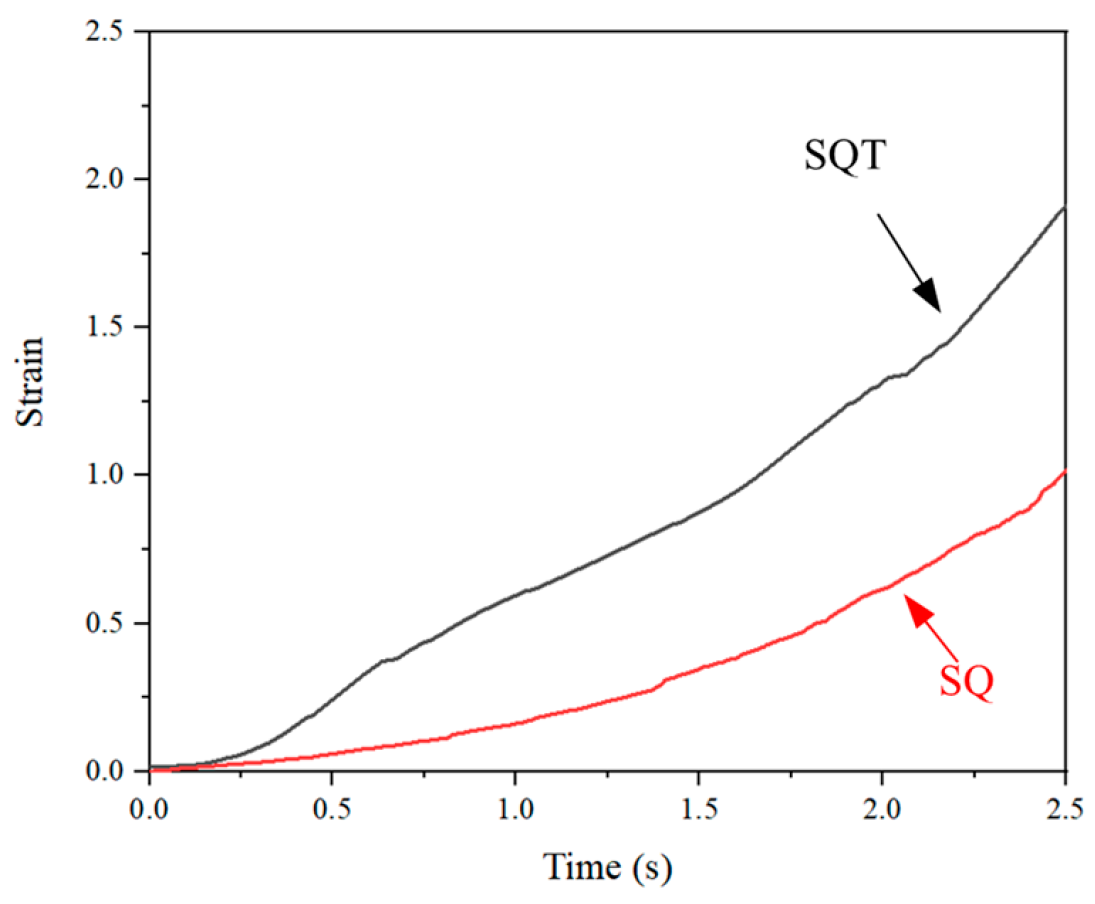
The simulated strain vs. time in the R14 region of A356 aluminum alloy workpieces during SQ and SQT at a pouring temperature of 600 °C and a mold temperature of 300 °C is illustrated in Figure 7. With the forming time increasing, the strain in the R14 region gradually increases and the strain for SQT is always bigger than that for SQ. The maximum strain for SQT in the R14 region is 1.9, while the maximum strain for SQ in the R14 region is 1.0. When the torsional shear strain is introduced into extrusion casting, the plastic deformation obviously increase thereby refining secondary dendrites and eutectic Si.

4.3. Texture Under SQ and SQT Process

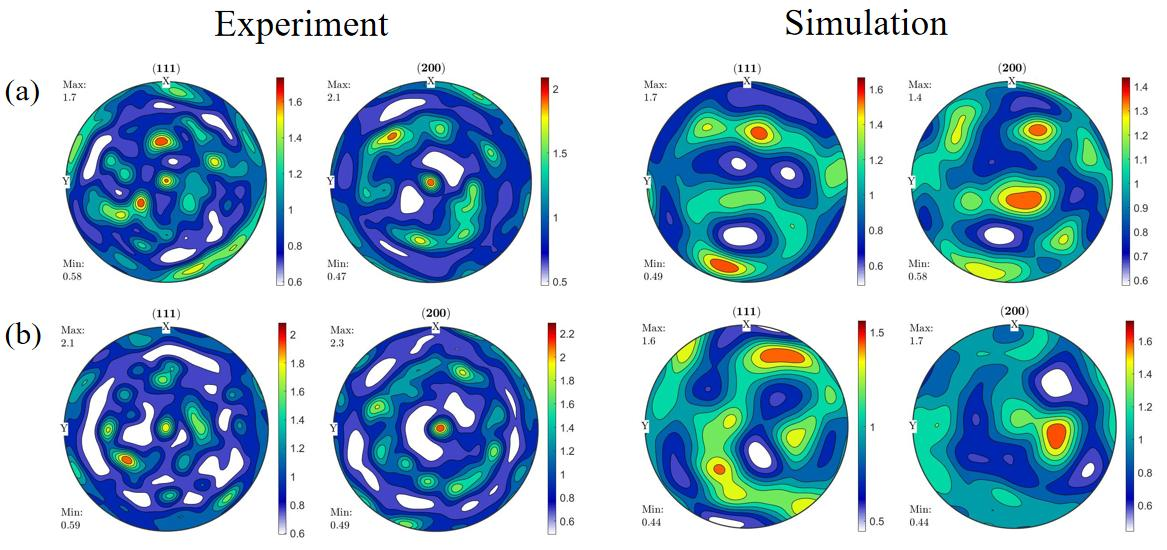
The experimental and simulated textures in the R14 region of A356 aluminum alloy workpieces after SQ and SQT at a pouring temperature of 600 °C and a mold temperature of 300 °C are illustrated in Figure 8. It can be seen that the simulated textures are well matched with the experimental textures. Therefore, the present two-scale computational approach coupling the FEM and VPSC model is suitable for analyzing the texture evolution of the A356 aluminum alloy in SQ and SQT processes at a pouring temperature of 600 °C and a mold temperature of 300 °C.
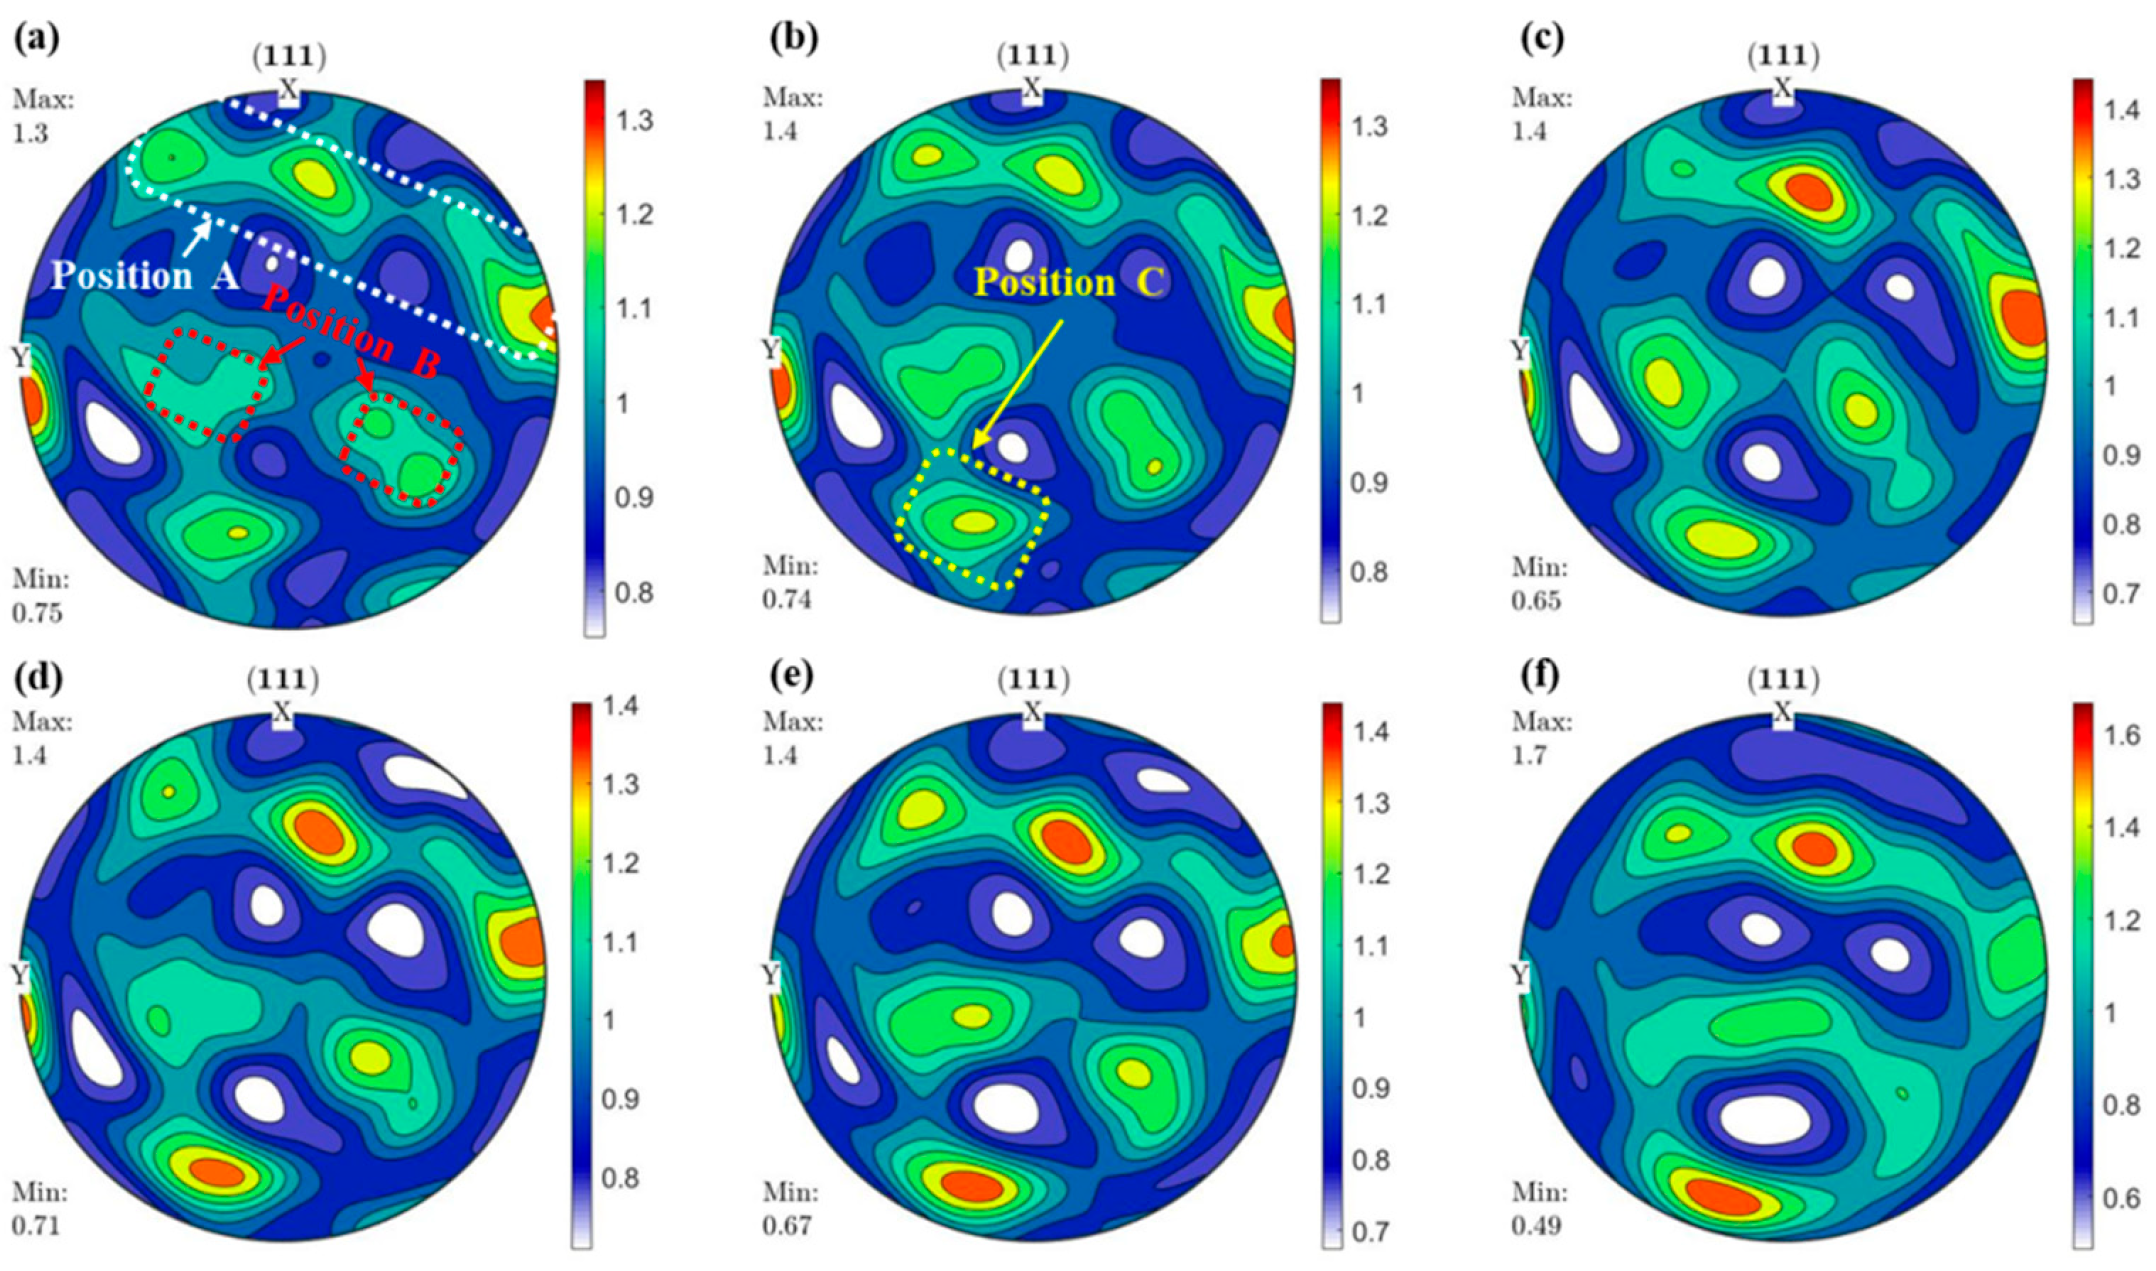
The simulated texture evolution in the R14 region of the A356 aluminum alloy workpieces after SQ at a pouring temperature of 600 °C and a mold temperature of 300 °C is depicted in Figure 9. When the strain is at 0.1, the change in the texture composition and pole density is neglected. At a strain of 0.5, texture components in regions A, B, and C become strengthened (see Figure 9c) and a strong texture component forms in region A. At a strain of 0.7, region C develops a strong texture component, while the texture component in region B is weakened. At a strain of 0.9, the texture component in region B starts to strengthen again. At a strain of 1, the texture component in region B approaches the center of the pole figure, while texture components in regions A and C continue to strengthen. The pole density reaches 1.7, and a ( 3 ¯ 2 ¯ 1 ¯ ) [ 1 ¯ 11 ] texture ultimately forms.
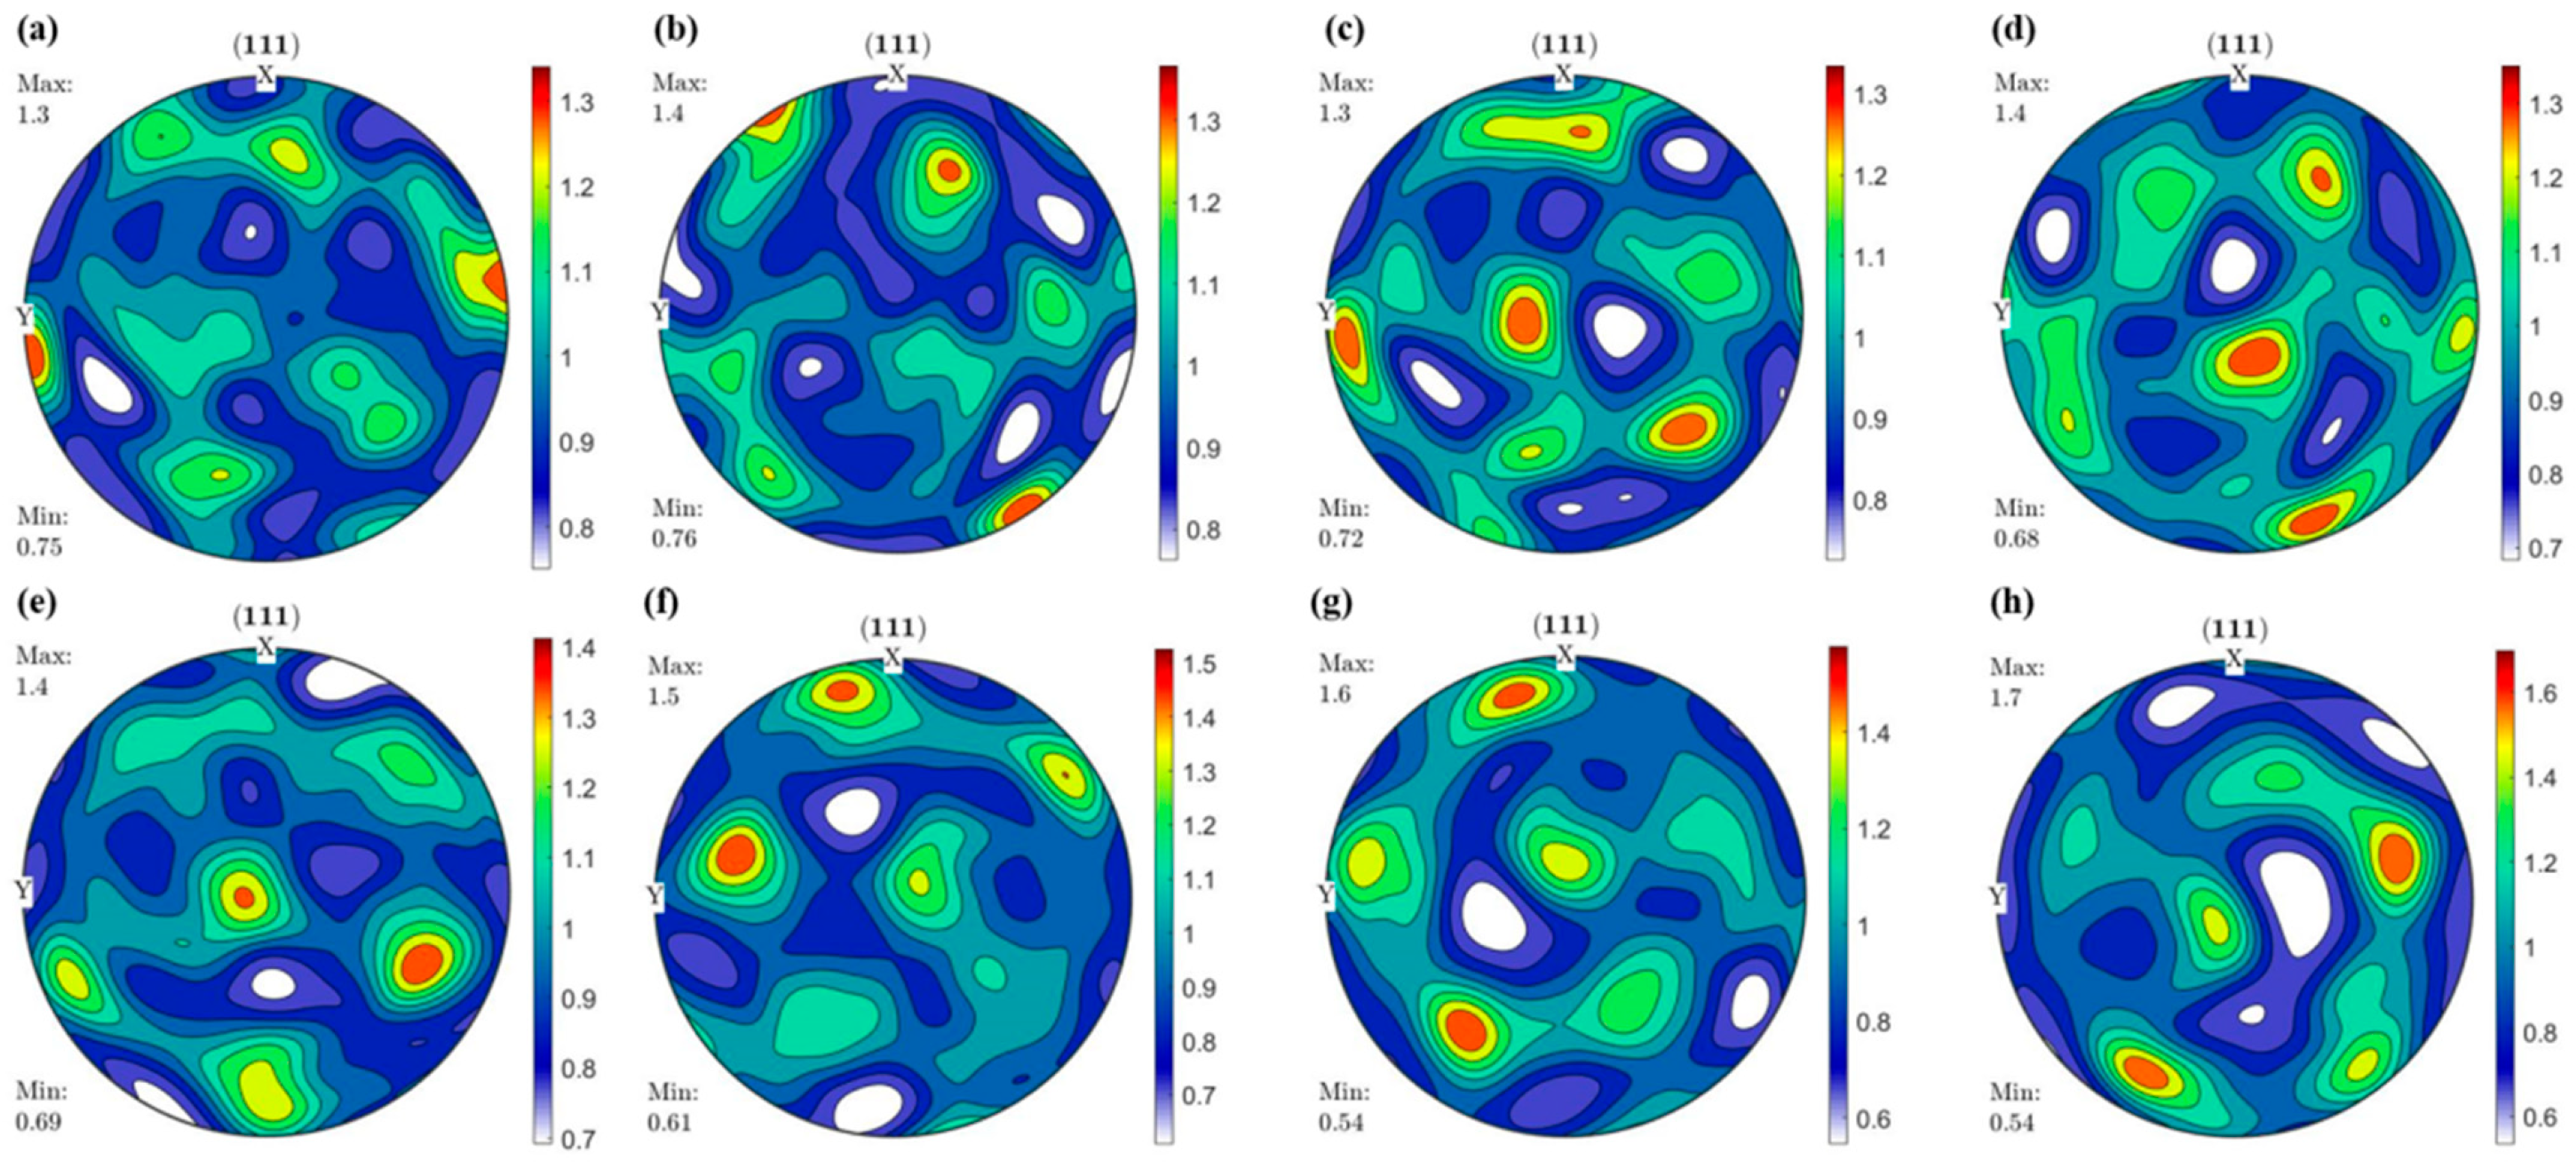
The texture evolution in the R14 region of the A356 aluminum alloy workpieces after SQT at a pouring temperature of 600 °C and a mold temperature of 300 °C is illustrated in Figure 10. At a strain of 0.3, many grains rotate around the torsional axis. As a result, the region with the highest pole density of the initial texture has rotated 60° around the torsional axis (z axis) (see Figure 10a,b). When the strain reaches 0.64, the majority of grains have rotated approximately 180° around the torsional axis (z axis of pole figure), causing the formation of four strong texture components (see Figure 10c). When the strain reaches 0.77, grains rotate counterclockwise by about 90° around the torsional axis (z axis of pole figure) (see Figure 10d). In the strain range from 0.77 to 1.9, the strong texture components move counterclockwise around the torsional axis (z axis of pole figure). The pole density of the strong texture components gradually increases and, ( 1 1 ¯ 1 ¯ ) [ 0 1 ¯ 1 ] and ( 1 ¯ 1 ¯ 4 ) [ 4 ¯ 0 1 ¯ ] textures eventually form.

4.4. The Role of Shear Stress in the Texture Evolution SQT Process

To investigate the influence of shear forces on texture evolution during the composite forming process, texture evolution after removing shear stress in the R14 region of A356 aluminum alloy workpieces during SQT at a pouring temperature of 600 °C and a mold temperature of 300 °C is shown in Figure 11. In the strain range from 0 to 0.6, the texture component hardly changes, while the pole density slightly increases. In the strain range of 0.6 to 1.17, strong texture components start to form within the circular region. In the strain range from 1.17 to 1.7, the pole density of the texture components within the red circular region continues to increase, indicating a trend toward forming the (100)[001] texture. In summary, the introduction of torsional shear in SQ weakens the (100)[001] texture, causing the formation of ( 1 1 ¯ 1 ¯ ) [ 0 1 ¯ 1 ] and ( 1 ¯ 1 ¯ 4 ) [ 4 ¯ 0 1 ¯ ] texture.

4.5. Evolution of Deformation Mode Under SQ and SQT Process

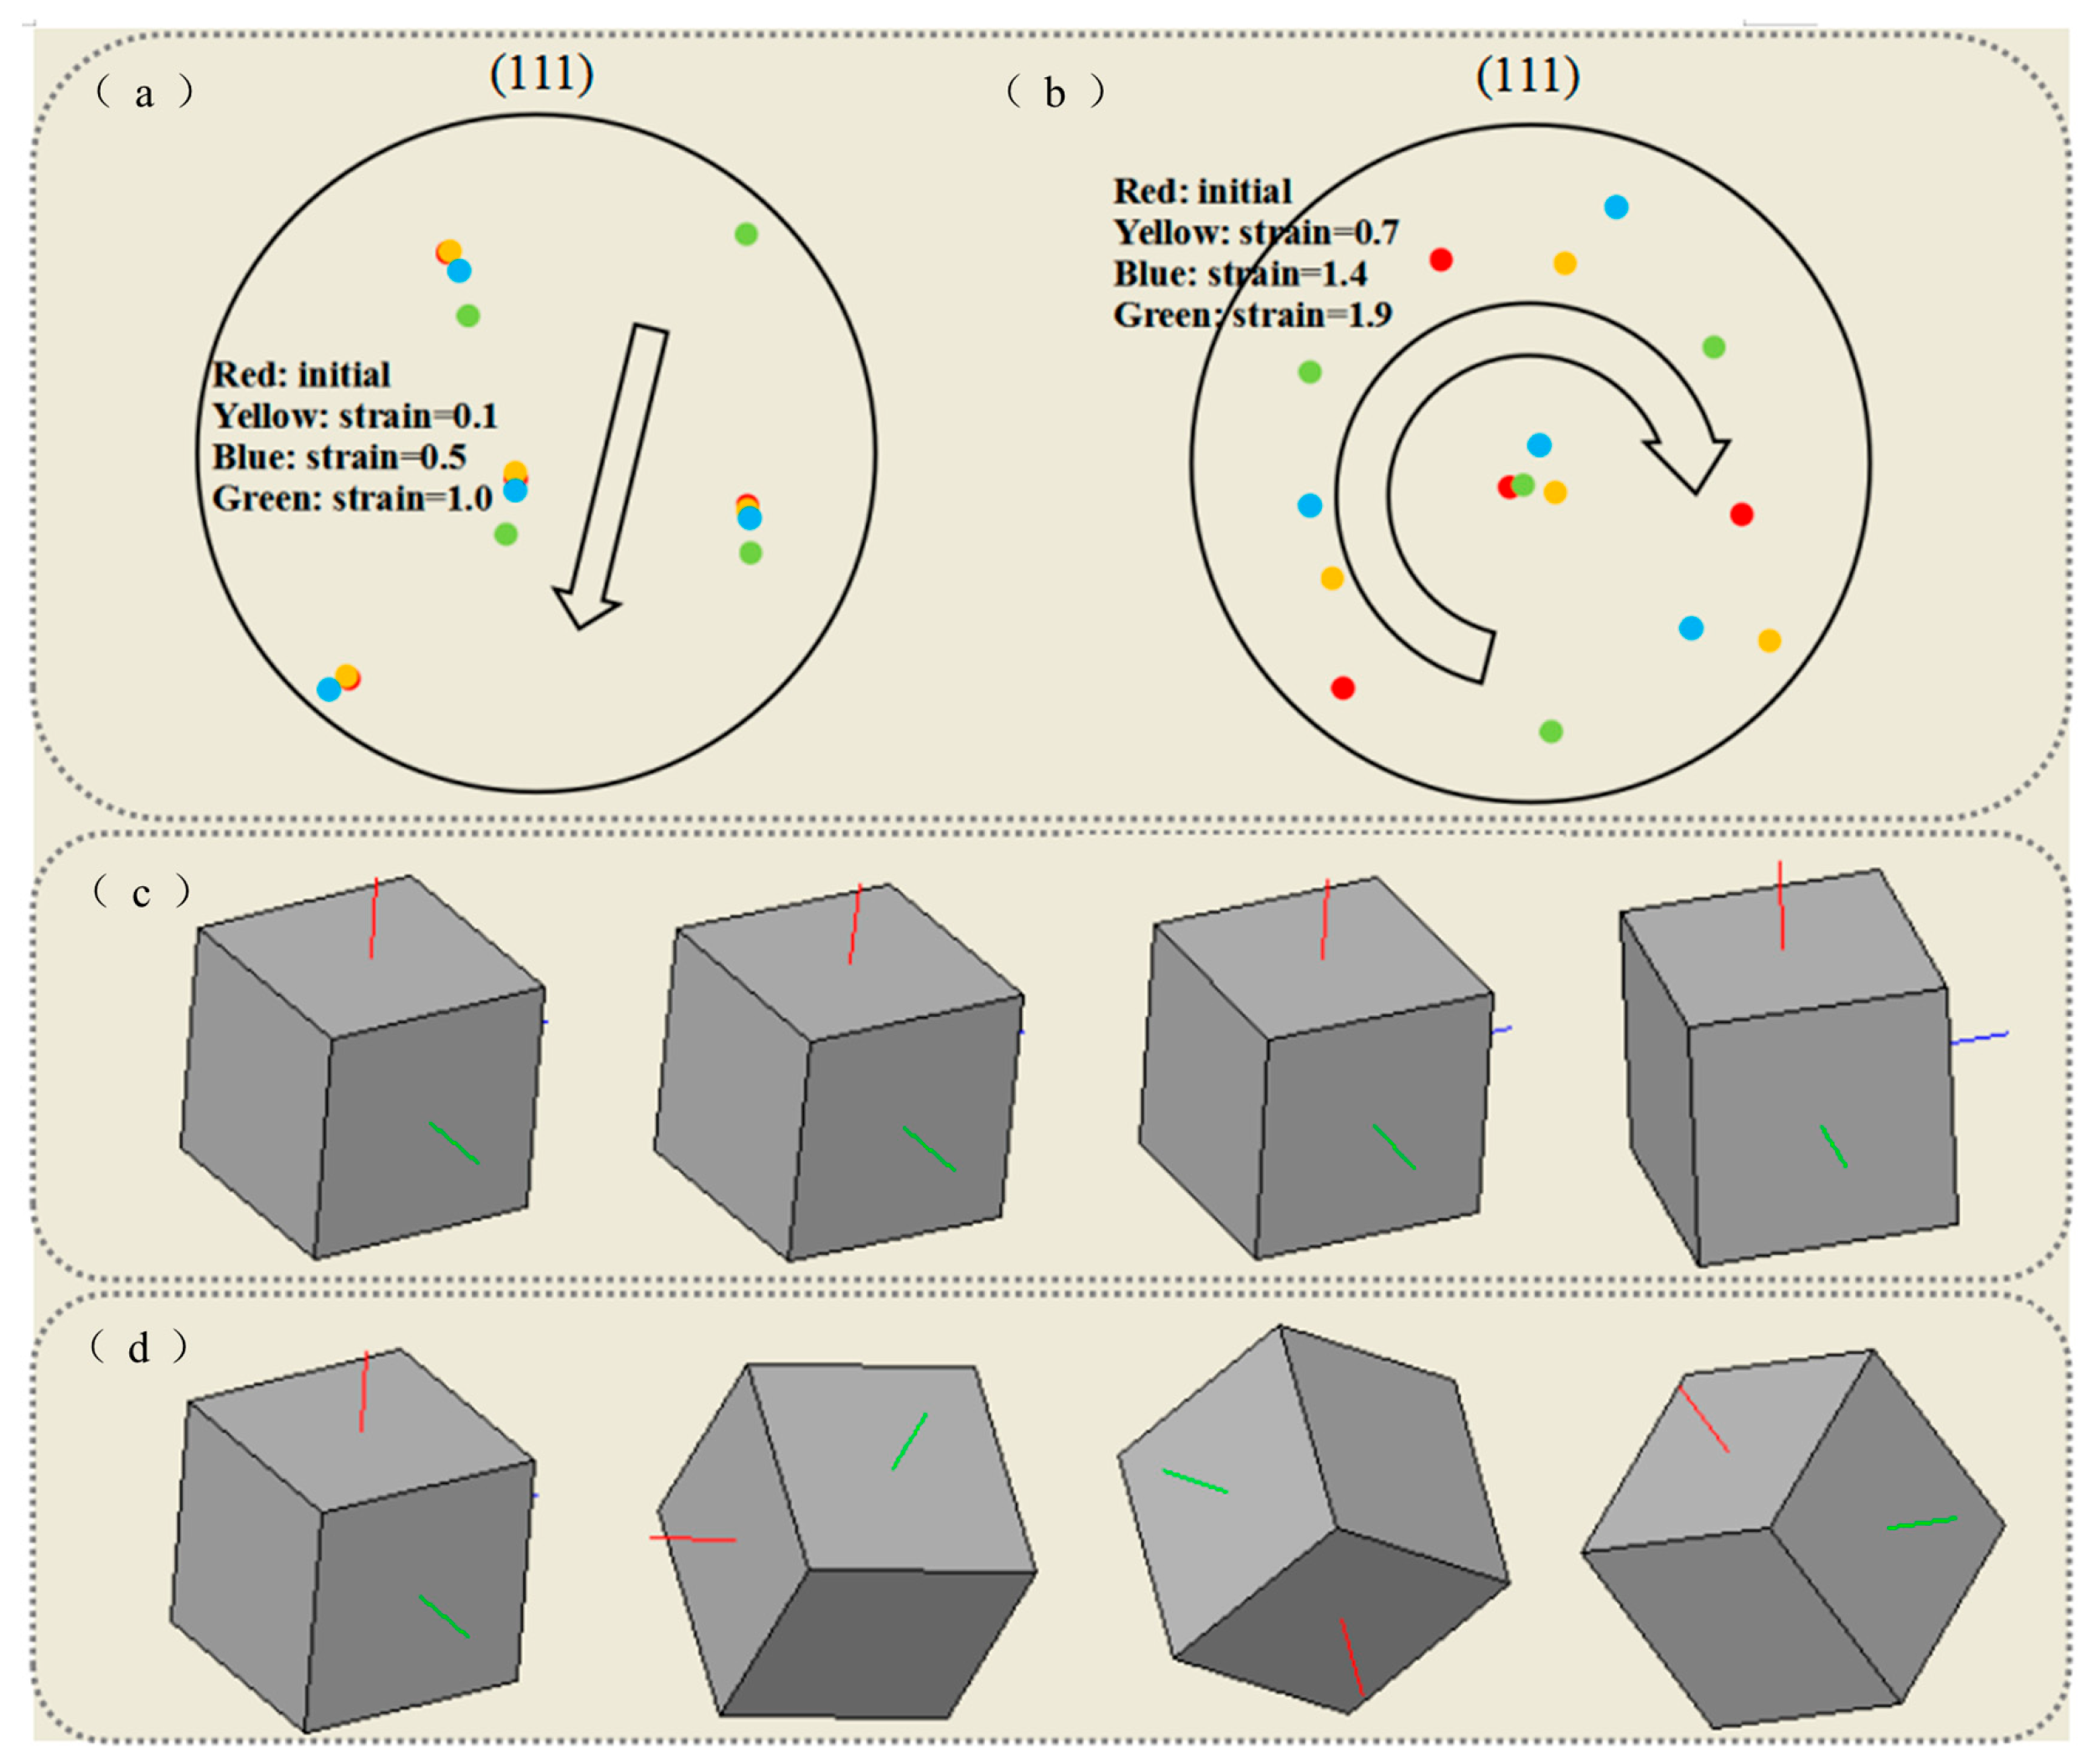
To study the influence of torsion on the rotation of grains, a typical grain in the R14 region of SQ and SQT-formed workpieces at a pouring temperature of 600 °C and a mold temperature of 300 °C was tracked and plotted in the pole figure, as depicted in Figure 12. The typical grain selected in the SQ and SQT process is the same. Under the condition of extrusion only, the grain rotates around the torsional axis and the rotation angles are relatively small. Eventually, this leads to the formation of a ( 2 1 ¯ 0 ) [ 001 ] texture. When torsional shear is introduced during the SQ, the rotation axes of the grains are not fixed, and the rotation angles are much larger than those observed under extrusion-only conditions. This eventually leads to the formation of a ( 1 1 ¯ 1 ¯ ) [ 0 1 ¯ 1 ] texture. After calculating the Schmid factors for 12 slip systems of the same typical grain in the R14 region of SQ and SQT-formed workpieces (as shown in Table 2 and Table 3), it can be concluded that in SQT, at the early deformation stage, ( 111 ) [ 01 1 ¯ ] and ( 1 1 ¯ 1 ) [ 110 ] are the dominant slip system, while at the later deformation stage, ( 111 ) [ 01 1 ¯ ] , ( 1 1 ¯ 1 ) [ 110 ] , ( 111 ) [ 10 1 ¯ ] , and ( 1 1 ¯ 1 ) [ 10 1 ¯ ] slip systems become predominant. In SQ, at the early deformation stages, ( 111 ) [ 01 1 ¯ ] and ( 1 1 ¯ 1 ) [ 110 ] slip systems are dominant, while in the later deformation stage, ( 111 ) [ 01 1 ¯ ] , ( 1 1 ¯ 1 ) [ 110 ] , and ( 111 ) [ 10 1 ¯ ] slip systems become predominant. Therefore, the introduction of torsion activates ( 1 1 ¯ 1 ) [ 10 1 ¯ ] slip systems and increases the rotation angles of grains, resulting in the formation of a ( 1 1 ¯ 1 ¯ ) [ 0 1 ¯ 1 ] texture.

5. Conclusions

An accurate macro–micro simulation model of SQT in the A356 aluminum alloy is established. The forming mechanism and microstructural evolution during the composite forming process is revealed. The study provides theoretical guidance for the collaborative control for geometry accuracy and performance of composite forming. The main conclusions are as follows:
(1)
After the introduction of torsion shear in SQ, the stress concentration during the forming process is reduced, and low and uniform distributed equivalent stresses are obtained, reducing deformation resistance. Consequently, plastic deformation and forming efficiency is enhanced, ultimately producing thinner-walled workpieces with finer secondary dendrites and eutectic silicon.
(2)
After the introduction of torsion shear in SQ, the shear forces during the forming process is increased. As the distance from the torsion axis increases, shear forces increase and the maintained time of shear forces increases. This causes more a pronounced refinement effect on secondary dendrites and eutectic silicon, leading to the formation of a finer microstructure.
(3)
After the introduction of torsion shear in SQ, a ( 1 1 ¯ 1 ) [ 10 1 ¯ ] slip system is introduced. At the early deformation stage, ( 111 ) [ 01 1 ¯ ] and ( 1 1 ¯ 1 ) [ 110 ] are the dominant slip systems. In the later deformation stages, ( 111 ) [ 01 1 ¯ ] , ( 1 1 ¯ 1 ) [ 110 ] , ( 111 ) [ 10 1 ¯ ] , and ( 1 1 ¯ 1 ) [ 10 1 ¯ ] become the prevalent slip systems. This change in slip systems results in a noticeable alteration in the direction of grain rotation, leading to an increase in the grain rotation angle. Ultimately, this process leads to the development of a distinct ( 1 1 ¯ 1 ¯ ) [ 0 1 ¯ 1 ] texture.

Author Contributions

Z.W.: methodology and conceptualization; B.Z., H.L. and X.L.: investigation, data curation, formal analysis, and funding acquisition; G.C., S.X., G.Q. and W.L.: validation, visualization, and supervision; Z.W., G.Q., C.X. and L.L.: writing—original draft, writing—review and editing. All authors have read and agreed to the published version of the manuscript.

Funding

This study was supported by the National Natural Science Foundation of China (52471132, 52475356, U21A20130), the Natural Science Foundation of Fujian Province for Distinguished Young Scholars (2024J010031), Hunan Provincial Education Department of China [22B0742], and the Natural Science Foundation of Chongqing (grant number CSTB2023NSCQ-MSX0886), as well as the High-level Talent Gathering-Innovative Talent Project of 2021 Hunan (No. 2021RC5010).

Institutional Review Board Statement

The authors understand and approve the ethical responsibilities of the authors.

Informed Consent Statement

The authors consent to participate. The authors consent to transfer copyright of the article to publish.

Data Availability Statement

All data generated or analyzed during this study are included in this published article. The code availability is not applicable in this work.

Conflicts of Interest

Author Zhenhu Wang was employed by the company Jiangnan Industries Group Co., Ltd. The remaining authors declare that the research was conducted in the absence of any commercial or financial relationships that could be construed as a potential conflict of interest.

References

  1. Wang, Y.; Xing, S.M.; Ao, X.H.; Wang, T.Y. Microstructure evolution of A380 aluminum alloy during rheological process under applied pressure. China Foundry 2019, 16, 371–379. [Google Scholar] [CrossRef]
  2. Liu, Y.Y.; Li, J.K.; Sun, H.W.; Cheng, J.X.; Ren, X.P.; Jiang, P. Improving ductility of AlSi7Mg alloy by casting-forging process: Effect of deformation degree. Mater. Res. Technol. 2021, 14, 2571–2578. [Google Scholar] [CrossRef]
  3. Wang, S.C.; Song, D.F.; Xu, J.; Zheng, K.H. Microstructure and Mechanical Properties of Al-1.1Mg-0.6Si-0.4Cu Alloy Manufactured by Casting-Forging Integrated Technology. Mater. Sci. Forum. 2016, 850, 762–767. [Google Scholar] [CrossRef]
  4. Jiang, J.F.; Yan, J.; Liu, Y.Z.; Hu, G.Q.; Wang, Y.; Ding, C.J.; Zou, D.C. Investigation on heat treatment of large-sized and complex AlSi9Mg aluminum alloy components formed by squeeze casting. J. Alloys Compd. 2022, 924, 166504. [Google Scholar] [CrossRef]
  5. Chen, Q.; Zhao, W.W.; Jiang, J.F.; Huang, M.J.; Li, M.X.; Wang, Y.; Ding, C.J.; Zou, D.C. Effect of T6 heat treatment on microstructure and mechanical properties of large-weight aluminum alloy flywheel housing parts formed by local-loading squeeze casting. J. Mater. Res. Technol. 2023, 24, 1612–1625. [Google Scholar]
  6. Naghdy, S.; Kestens, L.; Hertelé, S.; Verleysen, P. Evolution of microstructure and texture in commercial pure aluminum subject to high pressure torsion processing. Mater. Charact. 2016, 120, 285–294. [Google Scholar] [CrossRef]
  7. Kocich, R.; Kunčická, L.; Král, P.; Macháčková, A. Sub-structure and mechanical properties of twist channel angular pressed aluminum. Mater. Charact. 2016, 119, 75–83. [Google Scholar] [CrossRef]
  8. Ma, Z.; Zhang, H.R.; Zhang, X.L.; Wu, X.Y.; Fu, H.W.; Jia, L.N.; Zhang, H. Rheological behaviour of partially solidified A356 alloy: Experimental study and constitutive modelling. J. Alloys Compd. 2019, 803, 1141–1154. [Google Scholar] [CrossRef]
  9. Ostad, S.M.; Baghani, A.; Rahimipour, M.R.; Razavi, M.; Zakeri, M.; Heydari, F. Effect of temperature, time, and shear force on the morphology and size of dendrites in A356-Al2O3 composites. J. Compos Mater. 2022, 56, 329–338. [Google Scholar] [CrossRef]
  10. MartinRaya, O.; Menargues, S.; Martin, E.; Baile, M.T.; Picas, J.A. Rheological Behavior of the A356 Alloy in the Semisolid State at Low Shear Rates. Materials 2023, 16, 2280. [Google Scholar] [CrossRef]
  11. Lebensohn, R.A.; Tomé, C.N. A self-consistent anisotropic approach for the simulation of plastic deformation and texture development of polycrystals-Application of zirconium alloys. Acta Metal. Mater. 1993, 41, 2611–2624. [Google Scholar] [CrossRef]
  12. Xie, C.; He, J.M.; Zhu, B.W.; Liu, X.; Zhang, J.; Wang, X.F.; Shu, X.D.; Fang, Q.H. Transition of dynamic recrystallization mechanisms of as-cast AZ31 Mg alloys during hot compression. Int. J. Plast. 2018, 111, 211–233. [Google Scholar] [CrossRef]
  13. Liu, X.; Li, H.; Hu, M.Y.; Zhu, B.W.; Xie, C.; Zhang, X.F.; Liu, W.H. Effect of deformation mode on double-peak texture evolution in pre-twinning Mg-3Al-1Zn alloy during high-speed impacting loading. J. Alloys Compd. 2023, 968, 172122. [Google Scholar] [CrossRef]
  14. Pandey, A.; Khan, A.S.; Kim, E.Y.; Choi, S.H.; Herold, T.G. Experimental and numerical investigations of yield surface, texture, and deformation mechanisms in AA5754 over low to high temperatures and strain rates. Int. J. Plast. 2013, 41, 165–188. [Google Scholar] [CrossRef]
  15. Tabei, A.; Shih, D.S.; Garmestani, H.; Liang, S.Y. Derivation of Process Path Functions in Machining of Al Alloy 7075. J. Mater. Eng. Perform. 2015, 24, 4503–4509. [Google Scholar] [CrossRef]
  16. Suresh, M.; Sharma, A.; Morea, A.M.; Kalsar, R.; Bisht, A.; Nayan, N.; Suwas, S. Effect of equal channel angular pressing (ECAP)on the evolution of texture, microstructure and mechanical properties in the Al-Cu-Li alloy AA2195. J. Alloys Compd. 2019, 785, 972–983. [Google Scholar] [CrossRef]
  17. Nitish, R.; Atul, K.; Premanand, S.C.; Anupma, A. Finite element modelling and microstructural correlation of hot forged Al-Zn-Mg-Cu alloy (T6) using DEFORM-3D. Mater Today Proceed 2024, 103, 328–335. [Google Scholar]
  18. Yi, J.; Liu, Z.W.; Zeng, W.Q. Isothermal extrusion speed curve design for porthole dieextrusion of hollow aluminum profile based on PID algorithm and finite element simulations. Trans. Nonferr. Metal. Soc. 2021, 31, 1939–1950. [Google Scholar] [CrossRef]
  19. Li, G.; Cui, S.S. Grain modeling and finite element simulation of damage evolution for AA5182-O aluminum alloy sheet. J. Mater. Res. Technol. 2020, 9, 10559–10575. [Google Scholar] [CrossRef]
  20. Yuan, Z.P.; Tu, Y.Y.; Yuan, T.; Zhang, Y.H.; Huang, Y.H. Size effects on mechanical properties of pure industrial aluminum sheet for micro/meso scale plastic deformation: Experiment and modeling. J. Alloys Compd. 2020, 859, 157752. [Google Scholar] [CrossRef]
  21. Chen, S.F.; Song, H.W.; Zhang, S.H.; Cheng, M.; Lee, M.G. Effect of shear deformation on plasticity, recrystallization mechanism and texture evolution of Mg–3Al–1Zn alloy sheet: Experiment and coupled finite element-VPSC simulation. J. Alloys Compd. 2019, 805, 138–152. [Google Scholar] [CrossRef]
  22. Li, A.; Pang, J.M.; Zhao, J.; Zang, J.; Wang, F.Z. FEM-simulation of machining induced surface plastic deformation and microstructural texture evolution of Ti-6Al-4V alloy. Int. J. Mech. Sci. 2017, 123, 214–223. [Google Scholar] [CrossRef]
  23. Li, A.; Pang, J.M.; Zhao, J. Crystallographic texture evolution and tribological behavior of machined surface layer in orthogonal cutting of Ti-6Al-4V alloy. J. Mater. Res. Technol. 2019, 8, 4598–4611. [Google Scholar] [CrossRef]
  24. Huang, X.H.; Hu, Z.J.; Zhu, B.W.; Chen, Y.Q.; Liu, W.H.; Li, Y.X.; Li, N.B. High temperature flow behavior of A356 aluminum alloy based on modified Johnson-Cook model and recrystallization model. J. Plast. Eng. 2021, 28, 115–124. [Google Scholar]
Figure 1. The main steps of the SQT forming process.
Coatings 15 01099 g001
Figure 2. The significance of parameters in the hardening process.
Coatings 15 01099 g002
Figure 3. The microstructure of A356 aluminum alloy at different positions of the cross section after SQ and SQT at a pouring temperature of 600 °C and a mold temperature of 300 °C: (a) SQ in R2 region; (b) SQ in R10 region; (c) SQ in R14 region; (d) SQT in R2 region; (e) SQT in R10 region; (f) SQT in R14 region.
Coatings 15 01099 g003
Figure 4. The comparison between experimental and simulated results for SQ and extrusion SQT of A356 aluminum alloy at a pouring temperature of 600 °C and a mold temperature of 300 °C: (a) SQ; (b) SQT.
Coatings 15 01099 g004
Figure 5. The stress cloud diagram of A356 aluminum alloy in SQ and SQT at a pouring temperature of 600 °C and a mold temperature of 300 °C:(a1) 1 s in SQ; (b1) 1.5 s in SQ; (c1) 2 s in SQ; (d1) 2.5 s in SQ; (a2) 1 s in SQT; (b2) 1.5 s in SQT; (c2) 2 s in SQT; (d2) 2.5 s in SQT.
Coatings 15 01099 g005
Figure 6. The simulated shear stress evolution at different positions during the SQ and SQT process of A356 aluminum alloy at a pouring temperature of 600 °C and a mold temperature of 300 °C: (a) SQ; (b) SQT.
Coatings 15 01099 g006
Figure 7. The simulated strain vs. time in the R14 region of A356 aluminum alloy workpieces during SQ and SQT at a pouring temperature of 600 °C and a mold temperature of 300 °C.
Coatings 15 01099 g007
Figure 8. The experimental and simulated textures in the R14 region of A356 aluminum alloy workpieces after SQ and SQT at a pouring temperature of 600 °C and a mold temperature of 300 °C: (a) SQ; (b) SQT.
Coatings 15 01099 g008
Figure 9. The simulated texture evolution in the R14 region of the A356 aluminum alloy during SQ at a pouring temperature of 600 °C and a mold temperature of 300 °C: (a) ε = 0; (b) ε = 0.1; (c) ε = 0.5; (d) ε = 0.7; (e) ε = 0.9 (f) ε = 1.
Coatings 15 01099 g009
Figure 10. The simulated texture evolution in the R14 region of the A356 aluminum alloy during SQT at a pouring temperature of 600 °C and a mold temperature of 300 °C: (a) ε = 0; (b) ε = 0.3; (c) ε = 0.64; (d) ε = 0.77; (e) ε = 1.17; (f) ε = 1.4; (g) ε = 1.62; (h) ε = 1.9.
Coatings 15 01099 g010
Figure 11. The simulated texture evolution in the R14 region of the A356 aluminum alloy during SQT process after removing shear stress at a pouring temperature of 600 °C and a mold temperature of 300 °C: (a) ε = 0; (b) ε = 0.6; (c) ε = 0.97 (d) ε = 1.17; (e) ε = 1.4; (f) ε = 1.7.
Coatings 15 01099 g011
Figure 12. Trace of typical grain rotation and its corresponding rotation trajectory of (111) the surface in SQ and SQT at a pouring temperature of 600 °C and a mold temperature of 300 °C: (a) the trace of typical grain in SQ; (b) the trace of typical grain in SQT; (c) the corresponding trajectory rotation of (111) surface of SQ; (d) the corresponding trajectory rotation of (111) surface of SQT.
Coatings 15 01099 g012
Table 1. Actual chemical composition of A356 aluminum alloy (composition, wt.%).
SiMgTiSrFeCuZnMnAl
7.430.410.140.040.100.100.050.05Bal.
Table 2. The Schmidt factor for 12 slip systems of characteristic grain during SQ.
SlipSchmidt Factor
Strain = 0Strain = 0.4Strain = 0.7
( 111 ) [ 1 1 ¯ 0 ] 0.07010.06860.0921
( 111 ) [ 10 1 ¯ ] 0.28400.2784 0.3137
( 111 ) [ 01 1 ¯ ] 0.3541 0.3470 0.4059
( 11 1 ¯ ) [ 1 1 ¯ 0 ] 0.16720.16790.1826
( 11 1 ¯ ) [ 101 ] 0.00760.01730.0554
( 11 1 ¯ ) [ 011 ] 0.15970.15070.2380
( 1 1 ¯ 1 ) [ 110 ] 0.3617 0.3643 0.3505
( 1 1 ¯ 1 ) [ 10 1 ¯ ] 0.29270.29830.2535
( 1 1 ¯ 1 ) [ 011 ] 0.06900.06600.0970
( 1 ¯ 11 ) [ 110 ] 0.12430.12780.0757
( 1 ¯ 11 ) [ 101 ] 0.00110.00270.0049
( 1 ¯ 11 ) [ 01 1 ¯ ] 0.12540.13040.0709
Table 3. The Schmidt factor for 12 slip systems of characteristic grain during SQT.
SlipSchmidt Factor
Strain = 0Strain = 0.7Strain = 1.4
( 111 ) [ 1 1 ¯ 0 ] 0.07010.07570.0371
( 111 ) [ 10 1 ¯ ] 0.28400.2495 0.2843
( 111 ) [ 01 1 ¯ ] 0.3541 0.3252 0.3214
( 11 1 ¯ ) [ 1 1 ¯ 0 ] 0.16720.20240.0971
( 11 1 ¯ ) [ 101 ] 0.00760.06540.0038
( 11 1 ¯ ) [ 011 ] 0.15970.13700.0932
( 1 1 ¯ 1 ) [ 110 ] 0.3617 0.3906 0.3253
( 1 1 ¯ 1 ) [ 10 1 ¯ ] 0.29270.3240 0.2890
( 1 1 ¯ 1 ) [ 011 ] 0.06900.06660.0363
( 1 ¯ 11 ) [ 110 ] 0.12430.11250.1911
( 1 ¯ 11 ) [ 101 ] 0.00110.00920.0008
( 1 ¯ 11 ) [ 01 1 ¯ ] 0.12540.12170.1919
Disclaimer/Publisher’s Note: The statements, opinions and data contained in all publications are solely those of the individual author(s) and contributor(s) and not of MDPI and/or the editor(s). MDPI and/or the editor(s) disclaim responsibility for any injury to people or property resulting from any ideas, methods, instructions or products referred to in the content.