Abstract
This study develops a low-energy, high-precision nanoporous silicon process technology combining electrochemical etching with multi-wavelength laser irradiation and ultrasonic vibration to precisely control the size, porosity, and distribution of the nanoporous silicon structure and examines its potential applications in next-generation optoelectronic devices. This approach overcomes the challenges of poor pore uniformity and structural stability in conventional processes. The effects of different laser parameters, electrochemical conditions, and plasma bonding on the morphology are systematically analyzed. Additionally, the luminescence of the nanoporous silicon layer and its effectiveness in porous silicon diode devices were evaluated. Under 633 nm laser irradiation at 20 mW, the porosity reached 31.24%, exceeding that obtained with longer-wavelength lasers. The PS diode devices exhibited stable electroluminescence with a clear negative differential resistance (NDR) effect at 0~5.6 V. This technique is expected to significantly reduce energy consumption and simplify the manufacturing of silicon-based light-emitting devices. It also offers a scalable solution for next-generation silicon-based optoelectronic devices and advances the development of solid-state lighting and optoelectronics research.
1. Introduction
Porous silicon (PS) was first discovered by Uhlir in 1956. During his experiments, hydrofluoric acid (HF) was used to electrochemically polish the silicon wafer, forming a black PS film on the surface [1]. A fine pore structure with nanometer-level control of the pore size allows one to achieve the quantum confinement effects [2] which are utilized in optoelectronic applications [3]. Electrical chemical etching is currently the primary method for preparing PS. In this method, an external voltage is applied to the silicon, which drives a reaction with the ions in the etching solution and leads to the formation of pores. Advancement of the electrochemical etching processes enables researchers to adjust the shape, size, and density of these pores, thereby expanding the range of PS applications. The structure of the PS layer formed by conventional electrochemical etching depends on the nature of the manufacturing process, and accurate control of the particle size and porosity during the etching process remains challenging.
A research team led by Professor Ulrich Gösele of Duke University and Professor L.T. Canham of the University of Birmingham proposed a new theory [4,5]. They argued that the nanoscale interlayers form walls in the pore structure of PS, and these walls cause the material to exhibit the quantum confinement effect. This effect transforms the energy gap of silicon from an indirect to a direct bandgap. Regardless, a complete explanation for the luminescence properties of PS is still lacking. Some of the interesting properties of this material include quasi-radiative electron emission [6], electric field-induced diode polarization effects [7], visible light photoluminescence [8], and tunable optical properties [9]. Nanoporous silicon (NPS) has already found a wide range of applications due to its low production cost and versatility.
Negative differential resistance (NDR) [10,11] is a nonlinear phenomenon in which the voltage increases but the current decreases within a certain voltage range. This behavior violates the intuitive understanding of Ohm’s law, but is quite common in nanoscale components, especially for applications in memory, oscillators, and logic devices [12]. This phenomenon has been confirmed to occur in a wide range of optoelectronic devices, including PIN diode-integrated [13] and silicon molecular nanowire junctions [14]. NDR has also been observed in silicon-based devices [15], Si/SiO2 nanowire and quantum dot devices [16], and PS devices [17].
The aim of this study is to develop a more efficient process for producing NPS structures and demonstrate the potential application of the NDR phenomenon in photodiode devices. The NDR effect is related to physical mechanisms, like the tunneling effect [18], the Coulomb blockade effect [19], the charge storage effect [20], etc. All are considered possible causes of NDR. The NDR behavior observed in NPS diode devices is discussed below. The NPS multilayer structure, which is reported to be an efficient electron emitter [21], is a single-sided, single-layer device. Multi-porous diode devices exhibit similar transmission characteristics in the NDR state, likely due to a shared mechanism dominated by Coulomb repulsion [22]. The nanoscale pores and nanocrystals formed in silicon crystals by electrochemical etching have obvious quantum confinement effects, controlling the mobility of electrons and holes to produce discrete energy levels. This type of confining structure is a necessary condition for the NDR effect. In addition, the nanoholes and pores of PS act as nanocapacitor regions. When electrons enter, they will be repelled due to the charge accumulation, which will produce a Coulomb blockade leading to nonlinear current-voltage characteristics. Another important condition for the formation of NDR after photoelectric etching of the PS layer is the passage of carriers through nanoscale quantum dots or nanostructures. This electron transmission behavior results in the tunneling effect. Under a specific bias voltage, electrons will cross the energy barrier to generate a current peak. However, as the bias voltage continues to increase, the tunneling mechanism becomes weaker, the current decreases, generating the NDR effect. The NDR effect observed in the single-layer PS of the NPS device is affected by the structural state and etching parameters (including nanopore diameter, depth, porosity, and type of conductivity). This study applies photoelectrochemical etching and ultrasonic vibration (PEEU) to make adjustments for different applications. It is known that ultrasonic vibration can reduce the accumulation of bubbles in the photoelectrochemical etching area, thereby enhancing the band gap energy absorption (BEA) reaction [23], as well as the overall photoluminescence performance of the nanocrystalline porous silicon (NC-PS) layer. Each diode element consists of a metal film surface electrode, an NC-PS layer, and a back contact that acts as a planar cold cathode [24]. The quantum-size of the NPS structure encourages tunneling effects within the structure which accelerate the movement of electrons through the NC-PS layer to the surface, facilitating the luminescence effect.
Previous studies have shown that the electrochemical etching process can be modified to produce red photoluminescence (PL) by nanocrystalline PS. Although this improves electroluminescent (EL) emission, the efficiency is still too low for practical purposes [25]. Pore size distribution has a significant impact on the luminescence properties. Porosity measurement was used to analyze the pore structure of the materials in this study. The material is then integrated into a PS diode component using plasma bonding. Laser irradiation is also applied to reduce the etching rate for more accurate control of the size and porosity of the PS. Here, porosity is defined as the volume fraction of pores in the material [26,27]. An increase in porosity allows the formation of larger channels, which is conducive to electron migration within the material [28], thereby improving the conductivity of the diode. Earlier investigations have shown that when silicon is electrochemically etched in HF solution, PS layers can be formed that exhibit visible PL, a behavior commonly linked to quantum confinement effects [2,4,5]. Canham [5] was the first to demonstrate efficient room-temperature PL from PS, and Lehmann and Gösele [4] later provided a theoretical explanation based on the concept of quantum wires. Subsequent studies further revealed that PS is also capable of electroluminescence (EL) under electrical excitation, highlighting its potential for light-emitting applications [25]. Despite these promising findings, conventional electrochemical etching methods still suffer from several disadvantages that limit their broader application.
The steps of photoelectrochemical etching and wafer bonding for the fabrication of NC-PS diode components are detailed below. The photoelectrochemical etching process is designed to control the nanoscale porosity of the PS layer. The bonding of NC-PS involves the bonding of the P-type PS and the N-type wafer layers through H2O plasma bonding [26,27]. This step is essential for producing high-performance components. Precise control of the H2O plasma treatment parameters, including the plasma treatment time, power, and pressure, is required to ensure strong, consistent wafer bonds. After wafer bonding, the PS diodes are fabricated. The thickness of the porous silicon layer (PSL) must be kept at the nanoscale. The NC-Si layer is formed by a photoelectrochemical etching, followed by plasma bonding to transfer the metal electrode layer to the surface of the PSL. A glass film is added at the same time to protect the component from environmental pollution. The goal is to produce stable and efficient nanocrystalline PS diode components. By following these steps, we can better control the photoelectrochemical etching process, ensuring optimal etching and plasma bonding parameters and improving process stability. This new process enables the development of better PS diode components and technology and offers practical solutions for future optoelectronic advances. In recent years, researchers have made significant advancements in understanding and applying porous silicon. For example, researchers have utilized surface engineering and microfluidic techniques to enhance its sensing performance [17] and have investigated the temperature dependence of its luminescence properties [18]. Furthermore, some studies have focused on using porous silicon as a stable electronic material [28] and in microfluidic devices [26]. In addition, researchers have focused on photoelectrochemical methods to improve luminescence efficiency and to elucidate the role of quantum confinement effects [23,27]. These research findings highlight the importance of porous silicon research in recent years and provide a foundation for our current study.
2. Experimental Procedure
In 1801, thermoelectric currents were first experimentally observed, and the thermoelectric effect was discovered by Thomas Johann Seebeck [28], which opened the way for electrochemical etching. The photoelectrochemical etching process has been developed to control the formation of nanoscale PS, overcoming difficulties encountered in the past. Electrochemical anodization is used to etch silicon wafers to obtain a fine PS.
The goal of this study is to overcome the shortcomings of the conventional electrochemical etching process, especially the difficulty in controlling the size range of the PS structure. We first measure the PL trend of the PS components. The BEA electrothermal reaction is improved for the preparation of light-assisted NC-PS, to enable precise control of the light flux characteristics. The photoelectrochemical etching equipment used comprises two systems: an electrochemical etching system combined with an ultrasonic oscillator (Model: LEO-803H, maximum capacity: 2 L, frequency: 120 kHz, LEO ULTRASONIC Co., Ltd., New Taipei City, Taiwan); a laser platform using lasers with wavelengths of 633, 830, 1064 and 1310 nm and a power range of 1–20 mW to form PS nanocrystals. The laser platform was also equipped with a new polarizer (high-energy Glan laser polarizer, wavelength range: 350–2300 nm (Unice 2-GL-3522-3, Edmund Optics in NJ, USA) to precisely control the laser energy. A PM100D laser power meter (THORLA, NJ, USA) was added to the optical path to produce a light spot with a diameter of 5.0 mm.
A power supply system (model ABM-PR8363) (ABM, New Taipei City, Taiwan) was used to set the current and voltage values applied in the experiments. The effect of laser power on the formation of PS nanostructures is significant. When the anodization process is combined with laser irradiation, the electrochemical etching solution produces a low-concentration electrothermal reaction, which induces the BEA reaction. Laser irradiation strongly suppresses the formation of general-grade and micro-scale PS structures. The laser-generated electrons accumulate on the P-type surface, forming an electron-hole depletion region, which overpowers the electrothermal etching process and slows it down. The resistivity of our boron-doped (B) P-type single-crystal silicon wafer (100) test sample (sample size is 5 × 5 cm2) ranged from 1 to 10 Ωcm, B = (1.34–14.6) × 1015 cm−3 (Ingentec Corporation, Miaoli County, Taiwan). To prevent contamination, the wafer surface was thoroughly cleaned prior to photoelectrochemical etching. The single-crystal silicon surface of the 2-inch silicon wafer was cleaned in a Piranha solution using the sulfuric peroxide mixture (SPM) cleaning process, followed by RCA-1 cleaning in a boiling solution (NH4OH:H2O2:H2O = 1:1:5, by volume ratio, cleaning time 160 s) and RCA-2 (HCl:H2O2 = 1:6, by volume ratio, for 300 s). Finally, the sample was immersed in diluted HF (DHF; 1:100, cleaning time 10 s) to remove the native surface oxide and residues. Then, it was dried and stored in a filtered vacuum desiccator (model: 550, Kartell®, Noviglio, Italy). The etching solution was a mixture of 49.5% HF and 99.5% ethanol (volume ratio 1:1). The etching process was carried out using a two-electrode electrochemical method, with a gold electrode (Au purity 99%, conductivity: 63.01 × 10⁶ S·m−1 at 20 °C) as the cathode; the sample etching area was 1.75 × 1.75 × π (cm2), as shown in Figure 1.
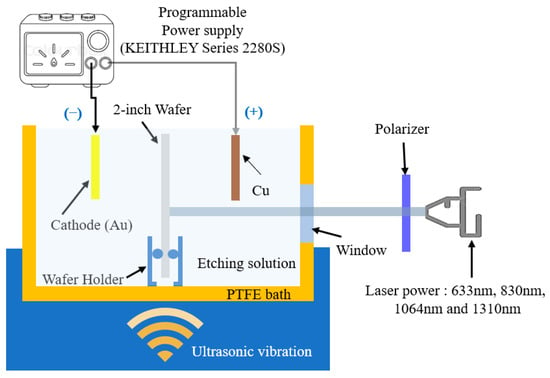
Figure 1.
Schematic illustration of the photoelectrochemical etching system and ultrasonic vibration equipment [23].
When a silicon wafer is placed in an HF acid solution and an anode potential is applied to generate holes, a dissolution reaction occurs between the electrolyte and the surface of the silicon wafer. According to T. Unagami [29], during the formation of PS, a porous silicon film first forms on the surface of the silicon wafer. As etching continues, a PSL will be produced. The porous silicon film becomes saturated in the HF acid solution at this time. The chemical reaction for the formation of porous silicon film is formulated in Equations (1)–(3). Under laser energy irradiation, boron-silicon bonds (B-Si) accumulate on the surface and in the deeper layers of the silicon, with some B atoms blocked, effectively reducing the etching rate [29]. During the photoelectrochemical silicon etching process, the oxidation reaction produces hydrogen (H2), as shown in Equation (4) [30].
During the photoelectrochemical etching reaction, holes penetrate the silicon surface through the depletion layer, initiating the BEA reaction [23]. The PEEU influences the BEA effect by enhancing the interaction between B atoms and photons. The combination with PEEU encourages the formation of a more uniform and intense emission area. In P-type silicon, holes serve as the primary carriers. The BEA effect at the silicon/HF interface [27] depends on hole migration from the valence band to the surface, where holes accumulate under forward bias. However, higher laser powers hinder etching of the P-type PSL, and a B-excited state absorption reaction is triggered. The B atoms surrounded by silicon atoms cannot jump to a higher energy level. The bubbles produced by the chemical reaction can be discharged through ultrasonic vibration. At the same time, the mutual attraction between B and the silicon’s internal electrons (B-e-tow Si-e-) affects the external Si-Si bonds [30], and SiF2 in turn affects the external Si-Si bonds. This process releases electrons and bubbles simultaneously, effectively enhancing the photoelectrochemical reaction, as shown in Figure 2.
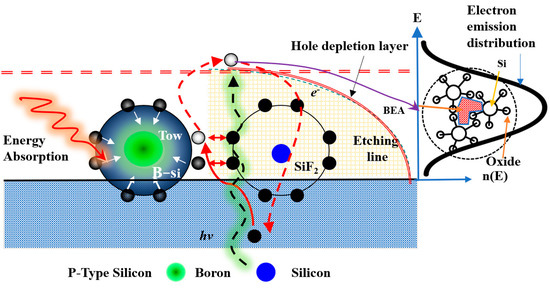
Figure 2.
Schematic illustration of the BEA phenomenon during photoelectrochemical etching on a P-type silicon wafer [23].
Wafer bonding is the process of attaching two wafers [31], where the surface atoms react to producing covalent bonds. Through H2O plasma activation, sufficient bonding energy forms between the two planes, allowing the two wafers to join via atomic bonding without the use of bonding media. Controlling temperature based on the material’s properties can further enhance atomic bonding at the interface. After surface treatment, the silicon wafer is cleaned using acetone (95%) and deionized water (1:50) to remove any oil or grease. The substrate is then immersed in alcohol (95%) for 20 s to remove any native material or residual contaminants, and the silicon surface was cleaned with an SPM Piranha solution and RCA-1 (NH4OH:H2O2:H2O = 1:1:5, by volume ratio) and RCA-2 (HCl:H2O2 = 1:6, by volume ratio) boiled solutions. The sample is then immersed in diluted HF acid (DHF; 1:200) for a few seconds to remove any native surface oxides and any residual contaminants. The role of the H2O plasma treatment is to break down the chemical bonds on the polymer and silicon surface, separating the original molecular bonds. It is known that plasma treatment using water vapor as the processing gas can enhance covalent bonding. The sequential plasma-activated bonding (SPAB) [32] process can be explained as a reaction between two metastable surfaces that allows the removal of water from the interface to form covalent Si–O–Si bonds. The surface diffuses through the interface of covalent bonds. The water vapor produces reactive oxygen species and hydroxyl radicals that facilitate covalent bonding at the interface, while the molecular bond energy secures the silicon wafers together. Plasma treatment of silicon surfaces can increase the total surface energy and bond strength. Polar groups, including OH, C=O, and C–H [33,34], are related to the covalent bond molecular structure required to achieve a lossless bonding process.
In the experiments, the H2O plasma treatment was performed using 99.5% water vapor in a flat-plate H2O plasma cleaning chamber (Aqua Plasma, AQ-2000, Kyoto, Japan). The radio frequency (RF) of the plasma reactor was 13.56 MHz. The temperature in the chamber was monitored by a resistance sensor connected to the sample surface and a precise temperature controller (temperature uniformity less than ±0.5 °C). The H2O plasma pressure was maintained at 3.5 kg/cm2, and the treatment time was 300 s under constant pressure. As shown in Figure 3, the water vapor flow rate was 160 sccm, and the applied power was 100 and 120 W under near room temperature conditions. Under the action of H2O plasma, the decomposition products from the silicon surface are H–O and O=C. The release of OH + e bonds is known to produce free radicals [35]. At the same time, the surface energy of the OH bonds is very high. One of the factors affecting the bonding with silicon is the silanol Si–OH bonds on the surface. The H2O plasma activates the surface by facilitating hydrogen bonds between the surface OH groups and water molecules. The high energy of plasma induces the formation of an irregular network of H and O bonds on the silicon surface, which destroys the structure of the surface bonds. Water vapor dissociates from the plasma, allowing hydrogen atoms to combine with the OH groups. When surface activation occurs at room temperature, the interfacial water enters the surrounding silicon interface layer, increasing surface roughness. At the same time, Si–O exists in the form of positive cations, which can move freely in the interface as O bonds and connect to the positive charge of the bridging oxygen. In particular, the OH groups from the surface of the silicon wafer move closer. Once the OH groups are close enough, the connections between the molecules bring about bonding, forming covalent Si–O–Si bonds between the two interfacial surfaces through polymerization, as shown in Figure 4.
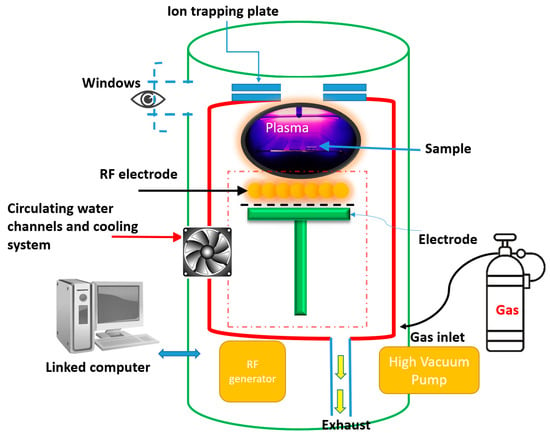
Figure 3.
Schematic diagram of H2O plasma treatment for NPS and N-type silicon bonding activation [26].

Figure 4.
H2O Chemical reaction anticipated to occur on the surfaces of the silicon and silicon substrates after H2O plasma treatment, resulting in bonded H2O–OH+ radicals [36].
This process induces chemical reactions on the silicon surface due to oxidation, forming a bonding interface with high surface energy. The generation of Si–O–Si bonds triggers a chain reaction (see Equations (5) and (6)). The increase in OH radicals driven by the strong electric fields may be the reason for the removal of the oxide layer [36]. Evidence is provided by the presence of large-charge electrons (e) in the oxide produced by H2O plasma exposure. The high bond strength is due to the formation of covalent bonds because of the increase in the number of OH–OH bonds at the bonding interface. The process involves the creation of Si–O–Si bonds through oxygen linkage and the generation of active intermediate H2O–OH+ bonds, as illustrated in Equation (7).
3. Results and Discussion
The addition of ultrasonic vibration during the photoelectrochemical etching process has a significant impact on the etching process. In the experiment, electrochemical etching combined with ultrasonic vibration at a frequency of 120 kHz was used to remove bubbles generated during the chemical reaction. The etching process can be optimized by adjusting the frequency to ensure the removal of bubbles that have accumulated during the BEA reaction. The main reasons for the generation of bubbles in an HF solution during electrochemical etching are twofold: the etching solution contains acidic components, such as HF, which are affected by electrolysis under an electric current, generating hydrogen (H+) and hydroxide (OH-) ions which will be reduced to produce hydrogen (H2) [37]; oxidation reactions occur in the etching solution, resulting in bubbles in the anode area. The use of high-frequency ultrasonic vibration to remove bubbles from the etching area improves the uniformity and etching efficiency, thereby enhancing the BEA reaction mechanism. Ultrasonic vibration can also enhance convection in the solution and fully react to the etching mechanism. It also enhances the delivery of a fresh solution to the etching area. This method alleviates the problem of uneven etching caused by bubble accumulation and prevents the thermal accumulation effect.
Compare this with the FE-SEM images in Figure 5a, Figure 6a, Figure 7a and Figure 8a, which show the surface morphology of the NPS structure prepared using the combined PEEU process. There is a clear improvement in the uniformity of the pore size and control of the porosity.
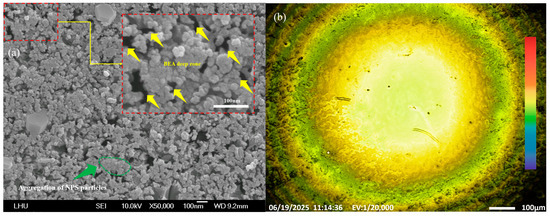
Figure 5.
(a) FE-SEM image showing the aggregation of PS particles and cavities in NPS fabricated by the novel PEEU process using a 633 nm laser; (b) PL yellow emission of PS after PEEU.
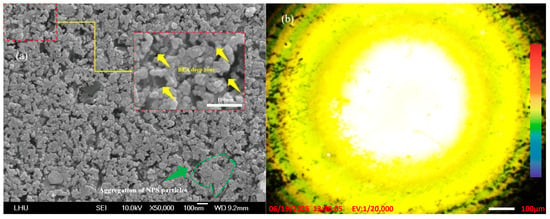
Figure 6.
(a) FE-SEM image showing the aggregation of PS particles and cavities in NPS fabricated by the novel PEEU process using an 830 nm laser; (b) PL yellow emission of PS after PEEU.
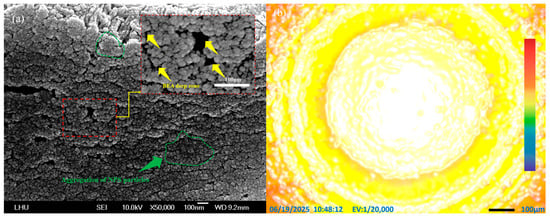
Figure 7.
(a) FE-SEM image showing the aggregation of PS particles and cavities in NPS fabricated by the novel PEEU process using a 1064 nm laser; (b) PL yellow and red emission of PS after PEEU.
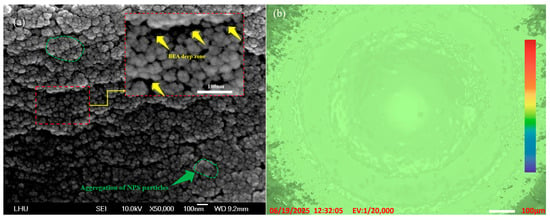
Figure 8.
(a) FE-SEM image showing the aggregation of PS particles and cavities in NPS fabricated by the novel PEEU process using a 1310 nm laser; (b) PL green emission of PS after PEEU.
From a comparison of the FE-SEM images in Figure 7a and Figure 8a, it can be seen that the PS produced by PEEU has more cavity structures. As the boron atoms absorb photon energy, they aggregate with the silicon atoms, and the silicon atoms will be corroded and removed from the surface by HF. The etched holes in silicon confirm that PEEU has effectively discharged bubbles through vibration. At this time, the BEA reaction occurs in the area of laser irradiation. The phenomenon of silicon agglomeration during photoelectrochemical etching, as evidenced by the deeper PS, is suppressed by laser energy. This structure is caused by the free carrier absorption phenomenon, which induces HF corrosion at the periphery of silicon-boron atom clusters, leading to the agglomeration and formation of numerous small pore structures [38]. The extensive agglomeration of PS particles almost fills the entire image field in the FE-SEM images in Figure 7a and Figure 8a. This confirms the free carrier absorption effect and further supports the existence of borosilicate aggregation (see the marked green areas).
The areas marked by the yellow arrows in the FE-SEM images in Figure 5a, Figure 6a, Figure 7a and Figure 8a indicate areas, BEA deep zones, where etching has penetrated further into the silicon substrate, achieved through the synergistic effect of the novel PEEU process. As can be seen, there are fewer of these deep BEA zones distributed in the material produced by low-wavelength lasers (633 nm and 830 nm), where band-to-band absorption dominates, as in Figure 5a and Figure 6a, than long-wavelength lasers (1064 nm and 1310 nm), as in Figure 7a and Figure 8a. Furthermore, the deep BEA zone holes are larger, which means that they were generated in the silicon surface during etching. This reduces the influence of free carrier absorption, which influences the quantum confinement effect. This interpretation is consistent with the known Si absorption spectrum, where interband absorption dominates at λ < 1100 nm, while free carrier absorption becomes more relevant at λ > 1100 nm. This can also be attributed to the difference in silicon energy gap for light absorption, which directly affects the current density (Jd) of the device in the subsequent PS diode current-voltage characteristic test (I–V Tester). This means that, with a decrease in the pore size and porosity of the PS structure, electron injection in the emission current density (Je) section needs to overcome a higher energy barrier. The quantum confinement effect increases the corresponding bias value, resulting in a decrease in the peak and minimum values of the curve. This limits current transmission, which will degrade the luminescence characteristics of the device. The PL effect is also closely related to the pore size distribution. In areas with smaller pore sizes, there is greater separation between electron and hole energy levels, resulting in a blue shift in the PL emission [39]. The emission intensity also changes as a function of the pore size. Controlling the pore size and distribution is crucial for controlling the optical properties of NC-PS materials. The PL images of the emission area shown in Figure 5b, Figure 6b, Figure 7b and Figure 8b reveal the uniformity of the electron emission without distortion or noise. The findings demonstrate the advantages of using this novel PEEU process for the manufacture of optoelectronic light-emitting devices. It improves the emission characteristics of the prepared NPS samples, enhancing the PL characteristics of the NPS and improving emission efficiency, it can be applied to the manufacture. PL fluorescence microscopic observations of the BEA reaction area of the NPS sample show more uniform and stronger yellow light and green light emission areas, as illustrated in Figure 5b, Figure 6b, Figure 7b and Figure 8b.
The red-light emission phenomenon at the edge in Figure 7b may be due to the relatively large size of the nanostructure in this region. The relatively weak quantum confinement effect would lead to a narrowing of the energy gap and a red shift in the emission wavelength. In addition, the edge region may also have a higher density of surface defects or trap states, providing low-energy emission channels, which would further encourage red-light emission. This phenomenon is indicative of the spatial variability of the nanostructure generated by the PEEU process in different regions. It also reflects the close relationship between the PL luminescence characteristics and the nano-sized pore distribution. Due to the quantum confinement effect, samples prepared using 633 nm laser etching should have stronger PL luminescence intensity. However, the PL image of the 830 nm laser sample (Figure 6b) appears brighter. We believe that this phenomenon may be related to the difference in sensitivity of the device’s digital sensor to different wavelengths. The PL luminescence band generated by the 830 nm laser sample tends to show yellow-red light, which is usually located in the high-sensitivity area of the image sensor. Therefore, even if the actual luminous efficiency is low, it may still appear much brighter in the image. In contrast, the PL spectrum emitted by the 633 nm laser sample tends to be yellow-green light, and a light green aperture appears on the edge of the image. This is located in the relatively low-sensitivity section of the sensor, resulting in its brightness performance being suppressed in the fluorescent image.
This phenomenon can be regarded as a spatial extension of the BEA effect. The changes in PL luminescence intensity and wavelength reflect the gradient distribution of the nanostructure in the luminescent area. The red-light edge area may represent the existence of nanoholes with a weaker confinement effect in the BEA peripheral structure, which helps to estimate the size of the nanostructure and its distribution trend in the overall sample. These characteristics further verify the potential and accuracy of the PEEU process in preparing NPS structures with high uniformity and controllability. To further improve the uniformity of the nanostructure distribution and suppress the appearance of red-light emission in the edge area, further measurements are required. A critical aspect to address is the spatial energy distribution profile of the laser light source, which must be considered. Since the laser light has a Gaussian intensity distribution, the radiation energy is higher in the center area, gradually weakening towards the edge. This can easily induce different formation conditions in different areas of the sample, resulting in a slight unevenness in the nanostructure. The Gaussian distribution of the laser can be adjusted or flattened using optical filters or a beam conversion optical design to achieve more uniform illumination, thereby improving the stability of the structure and luminescence characteristics. This occurrence confirms that the BEA region on the NPS surface is affected by quantum confinement effects, which depend on the size and aggregation ratio of the nanostructures on the surface. However, these nanostructures can be more precisely controlled through the PEEU process. The agglomeration of PS particles is evident in the FE-SEM images, as outlined by green in Figure 5a, Figure 6a, Figure 7a and Figure 8a. Further analysis reveals that the enhancement of luminescence intensity due to the BEA effect not only results from photon-electron conversion but also reflects the optimization of the band structure, surface state, and trap state filling in the internal electronic structure of the NPS material. These factors not only affect the luminescence properties of the material but also directly impact its practical application in optoelectronic devices. The BEA effect can simultaneously increase electron injection and improve luminescence efficiency to enhance the performance and stability of PS diode components. The results obtained in this study confirm the significant improvement in controllability and repeatability of the PEEU process for the preparation of NPS samples.
Measurement of porosity is an important indicator for examining the impact of structural changes and the optical properties (PL efficiency and uniformity) of NPS fabricated under different photoelectrochemical etching processes. Porosity not only reflects the degree of material removed from the silicon substrate during the electrochemical etching process, but it is also closely related to the size, distribution, and luminescence efficiency of the resulting nanopore structure of the PS device. Ultrasonication was integrated into the PEEU process to help remove bubbles, to generate a porous structure with a more consistent nanopore size, and uniform distribution. This, in turn, will improve the structural reproducibility of the material and the stability of its luminescence performance.
Porosity (p%) is the ratio of the volume of voids in a material to the total volume. It can be calculated indirectly from the change in sample mass. For quantitative analysis, the porosity is calculated based on the sample mass before (M1), and after etching (M2), and after removal of the porous layer with potassium hydroxide (KOH) (M3), as shown in Equation (8) [4].
In this study, the mass was measured using an electronic balance with an accuracy of four decimal places (Shimadzu Amidia ATX 224, Shimadzu Corporation, Kyoto, Japan). The KOH etching solution was prepared by dissolving 20 g of KOH in 100 mL of deionized water for 100 s to completely remove the porous layer. The sample area was precisely cut using a UV-YAG laser cutter (wavelength: 355 nm, power: 65 W, beam width: 0.02 mm, cutting depth: 525 μm, speed: 0.3 mm/s) to ensure that the etching area was consistent with the measurement area (Figure 9). This procedure, carried out to accurately evaluate the effect of PEEU on the formation of the PS structures and changes in porosity, helps to establish a more reliable correlation between the quantum confinement effect and the PL behavior.
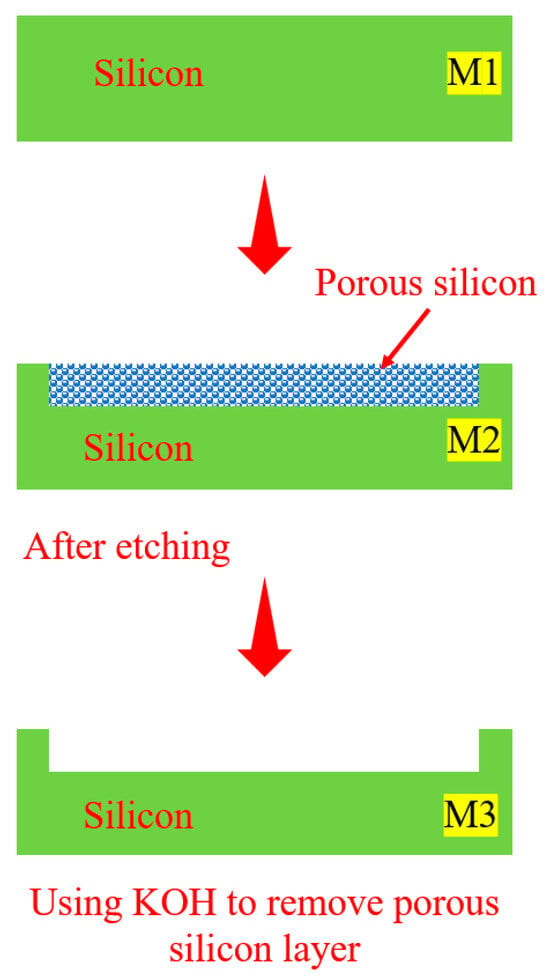
Figure 9.
Porosity measurement procedures and laser cutting parameters [23].
The pore size distribution significantly affects the measured porosity, related surface area, and emission intensity. The increase in the thickness of the PS layer in the experiments led to obtaining a larger silicon mass. The experimental conditions were as follows: each PEEU experiment consisted of three samples; the standard deviation (SD) of the porosity was measured at the same time. The electrochemical etching current was 120 mA/cm2, the etching time was 40 min, and the laser powers were 1.0, 5.0, 10.0, and 20.0 mW. The laser wavelengths were 633, 830, 1064, and 1310 nm, respectively, for repeatability verification.
The p% measurements of PS produced under various wavelengths of laser irradiation for 40 min are shown in Table 1. The results show an increase in the porosity with the laser power during photoelectrochemical etching. Experimental findings confirm that, under the same power conditions, the porosity generated by a 633 nm laser is always higher than that of other wavelength lasers (830 nm, 1064 nm, 1310 nm). As the power increases, the difference between porosity and other wavelengths gradually expands, as shown in Figure 10.

Table 1.
Emission characteristics of PS diodes fabricated by photoelectrochemical etching with various laser wavelengths, highlighting porosity (%) versus laser power.
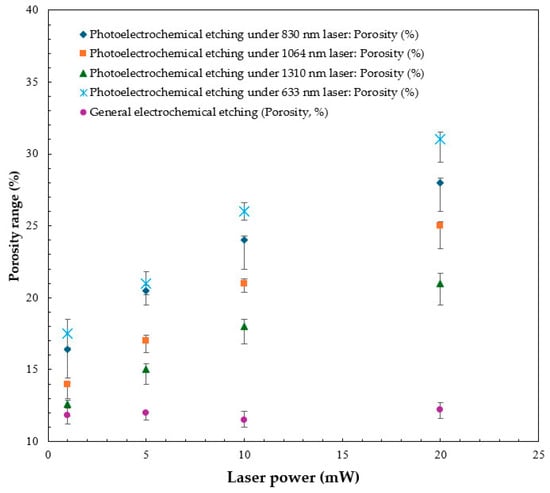
Figure 10.
Trend of increasing PS porosity with the standard deviation as a function of laser power.
Compare 633 and 830 nm as an example. At 1.0 mW, the porosity difference is only +1.10%, but it widens to +2.89% at 20.0 mW; compared with 1310 nm, the difference increases from +4.92% to +10.04%. The analysis shows that lasers with shorter wavelengths can more effectively excite photogenerated carriers at high power, promoting photoelectrochemical reactions between the silicon surface and the electrolyte. Controlling the porosity and uniformity of the agglomeration of particles in the PS to the nanoscale effectively increases the porosity per unit volume. This process encourages the formation of a more uniform and delicate pore structure with a clear distribution of pores on the surface and deep cavities.
At low power, the difference in porosity is relatively small, but at high power, it increases significantly, indicative of the advantages of short-wavelength lasers (such as 633 nm) for improving the photoelectrochemical reaction rate and the efficiency of PS formation. The higher energy of short-wavelength photons is sufficient to overcome the energy gap of silicon and promote carrier generation and transfer. Analysis of the experimental results shows that under the same power conditions, short-wavelength lasers have a greater effect on porosity improvement. The porosity of samples prepared using a 633 nm laser is always higher than that of long-wavelength lasers such as 830 nm, 1064 nm, and 1310 nm, and the difference increases with increasing power. For example, at 1.0 mW, the porosity difference between 633 nm and 830 nm lasers is +1.10%, but at 20.0 mW it expands to +2.89%. Compared with the 1310 nm lasers, the difference increases from +4.92% to +10.04%. This trend further confirms that short wavelengths (such as 633 nm) have higher photon energy, which can more effectively excite photogenerated carriers. This enhances the reaction kinetics between silicon and hydrofluoric acid, promoting the formation of porous structures and increasing density, as shown in Table 2.

Table 2.
Porosity comparison table for different laser wavelengths (including differences from 633 nm).
Studies have shown that this mechanism can be suppressed by using longer or shorter wavelength laser powers to achieve the same effect as non-intrinsic absorption. It should be noted that an increase in porosity promotes the discharge of bubbles in the BEA reaction area. This is mainly attributed to the combined effect of ultrasonic vibration and the etching reaction during photoelectrochemical etching, which enables rapid removal of bubbles from the laser irradiation area and prevents their accumulation around it. This ensures uninhibited progress of the BEA reaction and effectively prevents heat accumulation. PEEU plays a crucial role in NPS formation. Quantum effects occur when the aperture size is close to the wavelength scale of the electrons or photons in the material. The electrons or holes are confined in a space smaller than their wavelength, resulting in a change in energy state, a phenomenon known as the BEA reaction. The PS produced by the PEEU technology exhibits a higher specific surface area. The combination of quantum confinement and high specific surface area improves the optical performance of the PS diode element. The free carrier absorption mechanism, occurring only under long-wavelength laser irradiation, causes corrosion around the silicon-boron atoms aggregating in HF, leading to the agglomeration and formation of many small pore structures.
The structure of the PS diode device prepared in this study is shown in Figure 11a, from top to bottom: P-type NPS, N-type Silicon Substrate, metal film layer (<20 nm), and glass Substrate. The surface electrode material is gold (Au), with the layer thickness controlled below 20 nm. This thin film layer allows both conductive and partial light transmittance, which is conducive to the measurement of electroluminescence and I–V characteristics. In this structure, the N-type silicon substrate (blue block) serves as the supporting platform of the entire device and provides the electron source. It forms a PN heterojunction with the upper P-type NPS layer, which is the key to carrier injection and the establishment of a built-in electric field.
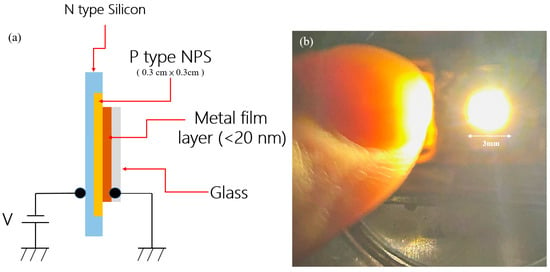
Figure 11.
(a) Schematic diagram of the experimental emission element using NPS surface electrodes; (b) A photograph of the image on the phosphor screen observed in the NPS emission element.
The P-type nanoporous silicon layer (orange block in the figure) was formed by electrochemical etching of P-type silicon. It has a high specific surface area and a quantum confinement effect. These characteristics enhance the luminescence efficiency and carrier recombination rate and can also produce an NDR effect in the I–V curve. Its thickness and porosity are the key parameters affecting electron transport and luminescence efficiency. The metal film electrode (brown block in the figure) was formed by evaporation from the surface of the NPS layer. In addition to providing good conductivity, it also has a significant effect on electron emission behavior and energy loss. The thickness of the Au electrode layer has a significant effect on the emission characteristics. The energy distribution and output efficiency at room temperature are also explored. The glass support layer (gray block in the figure) provides mechanical stability and insulation for the device, which facilitates the measurement process. In terms of electrode and bias design, electrons are injected from the N-type silicon end by applying an external bias (V value), and the metal film layer is used as the corresponding terminal to allow bipolar carriers to enter the active region (NPS layer). Under certain conditions, this structure can induce band overlaps and quantum tunneling behavior, leading to the observation of the NDR effect. After the application of an external bias (V), electrons are injected from the N-type silicon to recombine with holes injected from the metal electrode in the NPS layer to emit light, thereby triggering phenomena such as quantum tunneling and NDR effects. Figure 11b shows a photo of visible light emission generated by the device driven by the bias current. It can be observed from the figure that bright spots are emitted from the surface of the device, confirming that it has electroluminescent abilities. The fingertip serves as a reference for the size of the luminescent area, which is about several millimeters (3 mm on the scale bar). Visible luminescence is confirmed, indicating that the PS diode prepared in this study has potential for optoelectronic applications.
The component bond strength was measured using a tensile electromechanical test system (MTS Co., Ltd., Model C43, Eden Prairie, MI, USA). The tensile test data parameters are as follows: load cell: maximum 10 kN; pneumatic gripper controller: 20 psi. The main purpose of the analysis was to find the optimal parameters under the bonding plasma conditions. We evaluated the relationship between the bond strength and the plasma treatment power (100 W and 120 W) with a gas flow rate ranging from 30 to 120 sccm. The results of the two processes at gas flow rates of 30, 50, 60, 90, and 120 sccm were obtained. After plasma bonding, the bond strengths at a power of 120 W were 11.5, 12.1, 12.84, 13.42, and 13.56 N/mm2, respectively. At 100 W, the heterogeneous bond strengths after plasma treatment were 9.89, 10.2, 10.76, 11.25, and 11.62 N/mm2, respectively. The results show that at higher gas flow rates (90–120 sccm), the maximum percentage difference in bond strength between the two plasma power methods is about 19.33% (occurring at 60 sccm), which is equal to 2 N/mm2 overall. Low gas flow treatment leads to plasma ionization, and water vapor dissociates from H atoms and OH bonds. The formation of free radicals on the surface of the silicon sample results in little energy without saturated bonds; the discharge energy of OH–e–bonds is insufficient at this gas flow rate. On the other hand, for the thermal reaction process at room temperature, if the OH aggregation of the functional group does not change, it will lead to bond failure. The bond strength obtained following H2O plasma treatment with different holding times was investigated. As water molecules penetrate the surface of the silicon-oxygen network, wetting causes loosening of the original structure. This interaction affects the silicon-oxygen-silicon (Si–O–Si) bridging bonds, which may also be affected by the expansion or breakage of water molecules, to be transformed into a dihydroxy-bridging intermediate state (Si–HO–OH–Si), as shown in Equation (9) [26].
This situation can be regarded as a transition state in the bonding process. Finally, the silicon atom bonds can be cleaved into two functional groups with Si-OH at the ends, thereby providing the conditions for bonding between the silicon and silicon surfaces. This process plays a role in achieving chemical activation of silicon-silicon bonding. The standard deviation curve in Figure 12a shows the bonding strength of heterogeneous substrates prepared by plasma treatment. The bonding interfaces of plasma-treated samples were examined using a high-resolution transmission electron microscope (HR-TEM) (JEOL JEM-2100, Tokyo, Japan) (Figure 12b). There is no oxide layer on the bonding interface. The plasma treatment process carried out at room temperature does not easily produce an oxide layer on the silicon surface. Plasma bombardment of the silicon surface renders the sample surface hydrophilic and covered with a large number of OH radicals. Plasma treatment makes the sample surface very clean, which helps to increase the bonding strength. The HR-TEM image shows that there is no damage to the silicon sample after bonding.
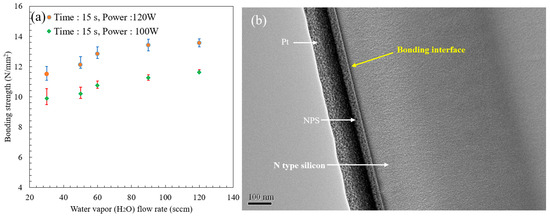
Figure 12.
(a) Bonding strength as a function of H2O plasma water vapor flow rate; (b) Bonding interface image observed by HR-TEM.
The I–V curve and emission characteristics of the PS device were measured, including the emission current and output electron energy distribution curves. First, the NPS sample was installed in the test equipment. The energy distribution (ED) in the vacuum chamber was measured using an energy analyzer system (EAS) (Omicron Nanotechnology, Inc., EA125, Taunusstein, Germany). The NPS diode, its emissions and the NDR behaviors could be obtained.
When the device is operated to a certain critical bias, it can be affected by factors such as the single-electron effect or charge trap saturation. The current may show an abnormal decrease, i.e., the typical NDR characteristic appears. This is a phenomenon where the voltage continues to rise but the current decreases, as shown in Figure 13a, Figure 14a, Figure 15a and Figure 16a. On the other hand, as shown in the histograms in Figure 13b, Figure 14b, Figure 15b and Figure 16b, the overall uniformity of the pore size and distribution indicates that the process effectively controls the formation and distribution of particles (distributed between 5 and 20 nm). This clear pore size range is crucial to understanding the quantum confinement effect in the NPS structure and affects the I–V measurement characteristics, as shown in Table 3 and Table 4.
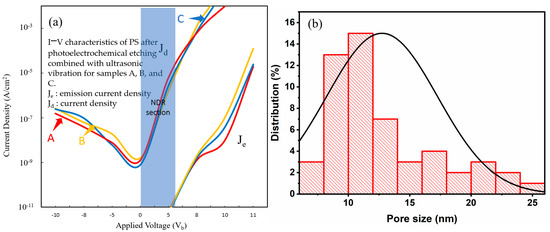
Figure 13.
(a) I–V characteristics of PS devices fabricated with the PEEU process assisted by a 633 nm laser; (b) NPS pore size distribution.
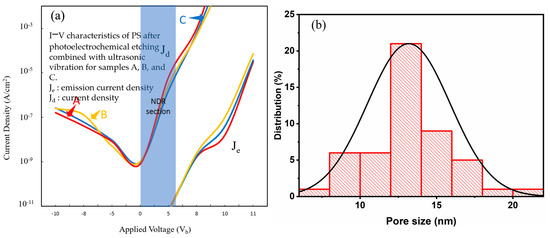
Figure 14.
(a) I–V characteristics of PS devices fabricated with the PEEU process assisted by an 830 nm laser; (b) NPS pore size distribution.
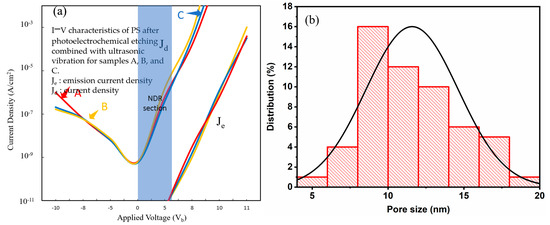
Figure 15.
(a) I–V characteristics of PS devices fabricated with the PEEU process assisted by a 1064 nm laser; (b) NPS pore size distribution.
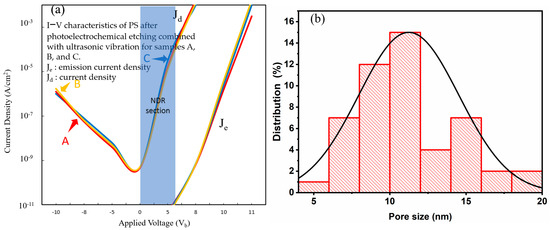
Figure 16.
(a) I–V characteristics of PS devices fabricated with the PEEU process assisted by a 1310 nm laser; (b) NPS pore size distribution.

Table 3.
Summary of the emission characteristics of PS diodes fabricated using the PEEU process combined with four different laser wavelengths, highlighting the correlation between onset voltage and emission efficiency.

Table 4.
Numerical values of Jd and Je at Vb = 10 V.
The I–V curves are shown in Figure 13a, Figure 14a, Figure 15a and Figure 16a. We can see that each curve first rises and then becomes concave (showing reverse curvature), particularly between 0 V and about 5–6 V (NDR section). Figure 13a illustrates the I–V characteristics of PS devices fabricated with the PEEU process assisted by a 633 nm laser. Curves A, B, and C enter the light-emitting region after a relatively low starting voltage (about 5.1~5.3 V). The significant stable light emission occurs between 5.1 and 11 V (for a given current density). The Je and Jd represent the emission and driving current densities, respectively. Figure 13b shows the aperture distribution. The average pore size is approximately 10–14 nm, and the distribution is relatively narrow and concentrated. These findings indicate that using 633 nm, the PEEU process can form smaller and more uniform nanopores, which is conducive to the formation of a porous structure with strong quantum confinement and stable luminescence efficiency effects. Figure 14a shows the I–V characteristics for devices fabricated with an 830 nm laser. There is a slight increase in the start-up voltage, to 5.2–5.3 V. Although the NDR segment still exists, it is slightly less obvious than at 633 nm, resulting in a decrease in carrier transfer efficiency and a clearer NDR segment. When the current drops below 10 V, sample A shows a slow, gradual increase in the graph. The emission efficiency at 633 nm is only 0.1% lower than that at 830 nm, indicating reflection or carrier retention within the structure. The overall curve shows a trend of decreasing emission efficiency. Figure 14b shows the aperture distribution range, which is relatively wide, ranging from 10 to 18 nm. The increase in aperture leads to a weakening of the quantum confinement effect, a decrease in the efficiency of photogenerated carrier recombination, and a blunting of the NDR [40]. Although the uniform aperture control of the BEA deep etched area in the original design is meant to improve the optical properties, the results show that this structural control also affects the electron transfer behavior and promotes the phenomenon of NDR. The PL image of this sample appears yellowish-red, indicating that the emission wavelength is relatively long and is located in the high response area of the sensor. Therefore, although the image brightness is high, it suggests a relatively large structure size, which would suppress the quantum confinement effects.
Figure 15a shows the I–V characteristics for devices fabricated with a 1064 nm laser. The start-up voltage increases to 5.4–5.5 V further flattening the NDR section. The curve illustrates the continuous decline in photoelectric conversion efficiency. Figure 15b illustrates the aperture distribution, showing a larger and more dispersed pore size distribution (7–18 nm). This indicates that photogenerated carrier generation at this wavelength is weak, resulting in slower etching and uneven pore generation. The pore structure formed is loose or too large, lacking quantum energy level discreteness and carrier shielding effects. This hinders the current from dropping in the reverse direction, once again confirming that short-wavelength lasers (such as 633 nm) are better for the formation of appropriate nanostructures and are one of the key factors influencing the NDR phenomenon. Figure 16a shows the I–V characteristics for devices fabricated with a 1310 laser. The start-up voltage again rises to 5.5–5.6 V. The NDR segment is even more inconspicuous, close to disappearing, indicating that the quantum confinement and emission efficiency are the weakest. The Je/Jd value difference is large, indicating poor carrier injection efficiency [41]. Figure 16b shows the aperture distribution diagram. A large number of even larger pores are distributed between 8 and 18 nm. The large aperture causes a weakening of the blue shift effect and a decrease in carrier localization, resulting in a less obvious NDR. The influence of quantum confinement structure and aperture also needs to be considered in the PL emission intensity. The short-wavelength (633 nm) laser forms a smaller aperture and a more concentrated distribution, with a strong quantum confinement effect and obvious NDR, which is an important condition for the observed PL and electronic structure. Long-wave lasers have dispersed apertures and looser structures, which cause the NDR segment to gradually weaken or even disappear. When the bias voltage is increased to a certain energy level, carrier blocking occurs, causing the current to drop. As shown in Figure 14a, the Je segment is the turning point from high-field injection to the NDR state, while the Jd segment reflects the initial tunneling transmission behavior.
The study concluded that the presence of the NDR segment is an important indicator of the performance and quantum confinement effect of the light-emitting diode. The porosity can block carrier transmission, or the PS trap state causes temporary capturing of the carriers, resulting in a reverse decrease in the current. This is closely positively correlated with the BEA area and the pore size distribution. On the other hand, the emission and carrier injection efficiency can be quantified by defining the emission efficiency η = Je/Jd [24]. Findings show that performance is closely related to the size and arrangement of the nanostructure. Therefore, the selection of the appropriate laser wavelength for the PEEU process to control the structure not only affects the optical properties but also profoundly influences the nonlinear electron transmission characteristics of the PS diode components. This is especially important for electron beam emission and nano-electronic component applications.
4. Conclusions
This study developed a PEEU process that successfully produced PS for NPS diode devices with excellent structural uniformity and optoelectronic properties. By adjusting the laser wavelength and power, the pore size distribution can be effectively controlled to 5–20 nm. The highest porosity of 31.24%, achieved under 633 nm laser conditions, indicates that short-wavelength lasers have obvious advantages in promoting photogenerated carrier production and enhancing etching efficiency. The device exhibits obvious electroluminescence under a bias drive, and a stable observable NDR phenomenon between 0~5.6 V, confirming the occurrence of the quantum confinement effect in the porous structure. A H2O plasma treatment is used to bond P-type NPS and N-type silicon substrate at low temperatures. The bonding strength reaches 13.56 N/mm2 at 120 W plasma power, which is about 19.3% higher than that at 100 W, verifying the feasibility of this process for high-strength bonding at low temperature. Overall, the images and measurement results further verify that short-wavelength lasers (such as 633 nm) exhibit higher photogenerated carrier generation efficiency. However, band-to-band absorption dominates, leading to even more efficient carrier excitation, thereby further improving luminescence intensity and device stability compared to free carrier absorption. This method has great potential for the development of a new generation of silicon-based light-emitting devices and NDR-related applications.
Author Contributions
C.-C.C. contributed to the design, experimental work, and data collection for this article; P.N.I. and C.-C.C. contributed to writing the original draft, preparation for this article, and validation; P.N.I. and C.-C.C. contributed the software; C.-C.C. offered supervision and funding acquisition. All authors have read and agreed to the published version of the manuscript.
Funding
This research received no external funding.
Data Availability Statement
Data are contained within the article.
Conflicts of Interest
The authors declare no conflicts of interest.
References
- Uhlir, A. Electrolytic shaping of germanium and silicon. Bell Syst. Tech. J. 1956, 35, 333–347. [Google Scholar] [CrossRef]
- Voos, M.; Uzan, P.; Delalande, C.; Bastard, G.; Halimaoui, A. Visible photoluminescence from porous silicon: A quantum confinement effect mainly due to holes? Appl. Phys. Lett. 1992, 61, 1213–1215. [Google Scholar] [CrossRef]
- Canham, L.; Cox, T.; Loni, A.; Simons, A. Progress towards silicon optoelectronics using porous silicon technology. Appl. Surf. Sci. 1996, 102, 436–441. [Google Scholar] [CrossRef]
- Lehmann, V.; Gösele, U. Porous silicon formation: A quantum wire effect. Appl. Phys. Lett. 1991, 58, 856–858. [Google Scholar] [CrossRef]
- Canham, L.T. Silicon quantum wire array fabrication by electrochemical and chemical dissolution of wafers. Appl. Phys. Lett. 1990, 57, 1046–1048. [Google Scholar] [CrossRef]
- Dong, Z.; Mahfoud, Z.; Paniagua-Domínguez, R.; Wang, H.; Fernández-Domínguez, A.I.; Gorelik, S.; Ha, S.T.; Tjiptoharsono, F.; Kuznetsov, A.I.; Bosman, M. Nanoscale mapping of optically inaccessible bound-states-in-the-continuum. Light. Sci. Appl. 2022, 11, 20. [Google Scholar] [CrossRef]
- Marín Ramírez, O.A.; Urteaga, R.; Comedi, D.M.; Koropecki, R.R. Switchable Electric Field Induced Diode Effect in Nanostructured Porous Silicon. IEEE Electron Device Lett. 2013, 34, 590–592. [Google Scholar] [CrossRef]
- Noguchi, N.; Suemune, I. Luminescent porous silicon synthesized by visible light irradiation. Appl. Phys. Lett. 1993, 62, 1429–1431. [Google Scholar] [CrossRef]
- Canham, L. Tunable properties of porous silicon. In Handbook of Porous Silicon; Springer: Cham, Switzerland, 2018; pp. 283–290. [Google Scholar] [CrossRef]
- Nam Do, V.; Dollfus, P. Negative differential resistance in zigzag-edge graphene nanoribbon junctions. J. Appl. Phys. 2010, 107, 063705. [Google Scholar] [CrossRef]
- Marin, O.; Toranzos, V.; Urteaga, R.; Comedi, D.; Koropecki, R.R. Negative differential resistance in porous silicon devices at room temperature. Superlattices Microstruct. 2015, 79, 45–53. [Google Scholar] [CrossRef]
- Restad, O. Simulation and Analysis of InP/GaInP Nanowire Esaki Diodes for Photovoltaic Device Applications. Master’s Thesis, NTNU, Trondheim, Norway, 2017. [Google Scholar]
- Day, A.M.; Zhang, C.; Jin, C.; Song, H.; Sutula, M.; Sipahigil, A.; Bhaskar, M.K.; Hu, E.L. Probing negative differential resistance in silicon with a PIN diode-integrated T center ensemble. arXiv 2025, arXiv:2501.11888. [Google Scholar]
- Suchikova, Y.; Nazarovets, S.; Popov, A.I. Electrochemical Etching vs. Electrochemical Deposition: A Comparative Bibliometric Analysis. Electrochem 2025, 6, 18. [Google Scholar] [CrossRef]
- Lin, J.-C.; Wan, L.-F.; Liu, K.-W.; Lo, K.-C.; Yeh, M.-L.; Wang, S.-J. Porous silicon NDR-based high power RF oscillator diode. IEEE Electron. Device Lett. 2017, 38, 701–704. [Google Scholar] [CrossRef]
- Mulloni, V.; Chierchia, R.; Mazzoleni, C.; Pucker, G.; Pavesi, L.; Bellutti, P. Porous silicon optical devices and Si/SiO2 quantum wells: Recent results. Philos. Mag. B 2000, 80, 705–718. [Google Scholar] [CrossRef]
- Awawdeh, K.; Buttkewitz, M.A.; Bahnemann, J.; Segal, E. Enhancing the performance of porous silicon biosensors: The interplay of nanostructure design and microfluidic integration. Microsyst. Nanoeng. 2024, 10, 100. [Google Scholar] [CrossRef]
- Rahmouni, S.; Boubekri, H.; Bendjeffal, H.; Mamine, H.; Boukhenoufa, N.; Tifouti, I.; Mariane, B.; Nasri, N.; Zighed, L. The temperature effect on the photoluminescence of porous silicon films obtained from an N-type silicon substrate. Silicon 2024, 16, 4253–4261. [Google Scholar] [CrossRef]
- Boarino, L.; Borini, S.; Amato, G. Electrical properties of mesoporous silicon: From a surface effect to Coulomb blockade and more. J. Electrochem. Soc. 2009, 156, K223. [Google Scholar] [CrossRef]
- Oakes, L.; Westover, A.; Mares, J.W.; Chatterjee, S.; Erwin, W.R.; Bardhan, R.; Weiss, S.M.; Pint, C.L. Surface engineered porous silicon for stable, high performance electrochemical supercapacitors. Sci. Rep. 2013, 3, 3020. [Google Scholar] [CrossRef]
- Chen, H.; Huang, W.; Marks, T.J.; Facchetti, A.; Meng, H. Recent Advances in Multi-Layer Light-Emitting Heterostructure Transistors. Small 2021, 17, 2007661. [Google Scholar] [CrossRef]
- Kiazadeh, A. Fabrication and Characterization of Memory Devices Based on Nanoparticles. Ph.D. Thesis, Universidade do Algarve, Faro, Portugal, 2013. [Google Scholar]
- Chiang, C.-C.; Immanuel, P.N. Advanced Techniques for the Fabrication of Nanostructured Porous Silicon Using Photoelectrochemical Etching and Ultrasonic Vibration. Coatings 2025, 15, 179. [Google Scholar] [CrossRef]
- Kojima, A.; Suda, R.; Koshida, N. Improved quasiballistic electron emission from a nanocrystalline Si cold cathode with a monolayer-graphene surface electrode. Appl. Phys. Lett. 2018, 112, 131601. [Google Scholar] [CrossRef]
- Mimura, H.; Matsumoto, T.; Kanemitsu, Y. Si-based optical devices using porous materials. Appl. Surf. Sci. 1996, 92, 598–605. [Google Scholar] [CrossRef]
- Chiang, C.-C.; Immanuel, P.N.; Chiu, Y.-H.; Huang, S.-J. Heterogeneous bonding of PMMA and double-sided polished silicon wafers through H2O plasma treatment for microfluidic devices. Coatings 2021, 11, 580. [Google Scholar] [CrossRef]
- Chiang, C.-C.; Immanuel, P.N. Investigating quantum confinement and enhanced luminescence in nanoporous silicon: A photoelectrochemical etching approach using multispectral laser irradiation. Optics 2024, 5, 465–476. [Google Scholar] [CrossRef]
- Sun, X.; Sharma, P.; Parish, G.; Keating, A. Enabling high-porosity porous silicon as an electronic material. Microporous Mesoporous Mater. 2021, 312, 110808. [Google Scholar] [CrossRef]
- Immanuel, P.N.; Chiang, C.-C.; Lee, T.-H.; Midyeen, S.D.; Huang, S.-J. Utilization of low wavelength laser linking with electrochemical etching to produce nano-scale porous layer on p-type silicon wafer with high luminous flux. ECS J. Solid State Sci. Technol. 2021, 10, 016003. [Google Scholar] [CrossRef]
- Pietsch, G. Hydrogen on Si: Ubiquitous surface termination after wet-chemical processing. Appl. Phys. A 1995, 60, 347–363. [Google Scholar] [CrossRef]
- Khan, A.A.; Nguyen, T.-K.; Trinh, Q.T.; Nguyen, N.-T.; Dao, D.V.; Zhu, Y. Wafer Bonding Technologies for Microelectromechanical Systems and 3D ICs: Advances, Challenges, and Trends. Adv. Eng. Mater. 2025, 2500342. [Google Scholar] [CrossRef]
- Matsumae, T.; Fengwen, M.; Fukumoto, S.; Hayase, M.; Kurashima, Y.; Higurashi, E.; Takagi, H.; Suga, T. Heterogeneous GaN-Si integration via plasma activation direct bonding. J. Alloys Compd. 2021, 852, 156933. [Google Scholar] [CrossRef]
- Annušová, A.; Krištof, J.; Veis, P.; Foissac, C.; Supiot, P. Spectroscopic study of an Ar-H2O discharge excited by a RF helical cavity. In WDS; MatfyzPress: Prague, Czech Republic, 2012; Volume 12, pp. 99–104. [Google Scholar]
- Tennico, Y.H.; Koesdjojo, M.T.; Kondo, S.; Mandrell, D.T.; Remcho, V.T. Surface modification-assisted bonding of polymer-based microfluidic devices. Sens. Actuators B Chem. 2010, 143, 799–804. [Google Scholar] [CrossRef]
- Terai, H.; Funahashi, R.; Hashimoto, T.; Kakuta, M. Heterogeneous bonding between cyclo-olefin polymer (COP) and glass-like substrate by newly developed water vapor-assisted plasma, Aqua Plasma Cleaner. Electr. Eng. Jpn. 2018, 205, 48–56. [Google Scholar] [CrossRef]
- Zeng, W.; Li, S.; Chow, W.K. Review on chemical reactions of burning poly(methyl methacrylate) PMMA. J. Fire Sci. 2002, 20, 401–433. [Google Scholar] [CrossRef]
- Bamshad, A.; Nikfarjam, A.; Khaleghi, H. A new simple and fast thermally-solvent assisted method to bond PMMA–PMMA in microfluidic devices. J. Micromech. Microeng. 2016, 26, 065017. [Google Scholar] [CrossRef]
- Tai, H.-C.; Chiang, C.-C.; Lee, B.T.-H. Forming a photoluminescent layer on another surface in the dark through lasering of n-type silicon in an electrolyte. ACS Omega 2020, 5, 26497–26503. [Google Scholar] [CrossRef]
- Xie, Y.; Wilson, W.L.; Ross, F.M.; Mucha, J.A.; Fitzgerald, E.A.; Macaulay, J.M.; Harris, T.D. Luminescence and structural study of porous silicon films. J. Appl. Phys. 1992, 71, 2403–2407. [Google Scholar] [CrossRef]
- Chakrabarty, S.; Hossain, S.M. Negative differential resistance in Si nanostructure: Role of interface traps. Phys. Scr. 2023, 98, 085909. [Google Scholar] [CrossRef]
- Biswas, S.; Nandi, A.; Basu, S.; Chakrabarty, S.; Mukhopadhyay, S.; Saha, H.; Hossain, S.M. Photo assisted negative differential resistance in porous silicon: A potential nano-structure for hot carrier solar cell. Mater. Today Proc. 2021, 39, 1930–1933. [Google Scholar] [CrossRef]
Disclaimer/Publisher’s Note: The statements, opinions and data contained in all publications are solely those of the individual author(s) and contributor(s) and not of MDPI and/or the editor(s). MDPI and/or the editor(s) disclaim responsibility for any injury to people or property resulting from any ideas, methods, instructions or products referred to in the content. |
© 2025 by the authors. Licensee MDPI, Basel, Switzerland. This article is an open access article distributed under the terms and conditions of the Creative Commons Attribution (CC BY) license (https://creativecommons.org/licenses/by/4.0/).