Article

Characterizing Asphalt Binder Phase Transitions via Dynamic Mechanical Analysis: Performance Implications and SARA Fraction Correlations

1
Shandong Transportation Institute, Jinan 250102, China
2
Department of Highway Engineering, Shandong College of Highway Technician, Jinan 250104, China
*
Authors to whom correspondence should be addressed.
Coatings 2025, 15(9), 1046; https://doi.org/10.3390/coatings15091046
Submission received: 14 August 2025 / Revised: 2 September 2025 / Accepted: 5 September 2025 / Published: 6 September 2025

Abstract

Asphalt is widely used as a binder in pavement engineering. The temperature-dependent phase transition behavior of asphalt binders critically influences pavement performance. This study comprehensively evaluates phase transition characteristics to establish robust performance indicators. Dynamic mechanical analysis (DMA) was employed to characterize 30 neat asphalt binders across a broad temperature range. Phase transition temperatures and moduli were derived from complex and loss modulus curves. Correlations with saturate, aromatic, resin, and asphaltene (SARA) fractions and conventional properties (penetration, viscosity, ductility) were statistically analyzed. The results revealed significant performance variations among binders of identical penetration grades. Tg effectively differentiated low-temperature behavior, overcoming empirical limitations. High-temperature indicators (T2, E20) strongly correlated with viscosity (R2 > 0.96). SARA analysis showed that saturates reduced Tg (r = −0.566) while asphaltenes increased E20 (r = 0.804). Multiple regression models confirm synergistic interactions among SARA fractions, although low-temperature indices exhibit a weaker dependence on composition. DMA-derived phase transition parameters provide physically meaningful performance indicators, superior to conventional metrics. Incorporating Tg and T2/E20 into grading systems can enhance asphalt selection for thermal susceptibility, advancing pavement durability design.

1. Introduction

Asphalt binders are an engineering material commonly used as a binder in road construction. Its rheological properties are significantly affected by temperature. At elevated temperatures, asphalt binders exhibit fluid behavior, whereas they deform easily at intermediate temperatures and become solid and brittle at low temperatures. Based on these characteristics, asphalt binders can be categorized into three states: Newtonian liquid, viscoelastic, and glassy [1]. The transition of a thermodynamic system from one state to another is termed phase transition. For example, the change in asphalt binders from a glassy state to a viscoelastic state is known as glass transition, whereas the transition from the viscoelastic state to the viscous state is referred to as flow transition. The specific temperatures at which these transitions occur are designated the glass transition temperature and flow transition temperature [2,3]. Liu [1] determined the glass transition temperatures of three typical asphalt binders with penetration grades of 20/40, 40/60, and 60/80 through measurement and calculation; they were approximately −1 °C, −8 °C, and −10 °C, respectively.
The role of the phase transition properties In asphalt binders Is widely acknowledged as a critical factor affecting the performance of mixtures. At low temperatures, a compliant binder with enhanced viscoelastic relaxation capabilities exhibits superior thermal stress accommodation, effectively reducing the risk of cryogenic cracking through stress dissipation. At intermediate temperatures, an optimally balanced viscoelastic binder facilitates energy dissipation via controlled deformation mechanisms, thereby preventing stress concentration and the initiation of fatigue cracks under cyclic loading. At high temperatures, an increased stiffness combined with elastic recovery characteristics is essential for resisting cumulative plastic deformation under sustained traffic loads. Therefore, it is essential to develop an effective methodology for characterizing the phase transition performance of asphalt binders in relation to the expected performance of the mixture [4].
Dynamic mechanical analysis (DMA) has been extensively employed to evaluate the rheological properties and determine the phase transition temperature (PTT) of asphalt binders [5,6,7,8,9]. Asphalt binders, representative viscoelastic materials, exhibit a mechanical response consistent with the time–temperature superposition principle (TTSP). According to the TTSP, when dynamic tests are performed at small strain levels (within the linear viscoelastic range), the rheological data obtained at both elevated and reduced temperatures can be graphically correlated to high or low frequencies (which correspond to short or long loading durations), and vice versa. Therefore, a more comprehensive rheological curve in either the time or frequency domains can be constructed by shifting the rheological data from various test temperatures to a defined reference temperature. This curve is referred to as the master curve of the viscoelastic characteristic function of the asphalt material at a reference temperature. Ultimately, the glass transition temperature (Tg) of the asphalt material can be inferred from the master curve, allowing for the evaluation of the low-temperature performance of asphalt binders [10,11,12]. In addition to this method, temperature scanning provides a more direct method for obtaining the glass transition temperature. The mechanical response curve of the material is acquired by temperature scanning under controlled conditions, with the peak temperature of the loss modulus defined as Tg. This feature is significantly easier to identify in this way than through using the differential scanning calorimetry (DSC) method. In contrast to other techniques, the mechanical properties measured by DMA are more sensitive to changes in the microstructure [13,14,15,16,17,18]. Currently, there is a substantial body of research on the glass transition temperature of asphalt binders [19,20], yet there is comparatively limited investigation into the phase transition characteristics across a wide temperature range, such as the flow transition temperature.
The correlation between the PTT of asphalt binders and their chemical composition requires further investigation. The phase-transition characteristics of asphalt binders serve as a macroscopic representation of their microscopic molecular movements. Given the diversity and complexity of the molecular structure of asphalt binders, accurately modeling their chemical composition and its relationship with engineering properties presents significant challenges. A more pragmatic approach to elucidating the relationship between the chemical composition of asphalt binders and their engineering properties is to categorize the chemical composition based on various properties rather than attempting to determine the precise molecular structure of any specific binder [21,22]. Chromatographic separation remains the most effective and practical method for isolating asphalt binders [23,24,25]. Currently, asphalt binders are primarily separated into four fractions—saturates, aromatics, resins, and asphaltenes (SARA)—to facilitate comparisons regarding their chemical composition [26,27]. The relationship between the SARA fractions of asphalt binders and their physical and engineering properties has been extensively studied by numerous researchers [28,29,30]. It has been established that the SARA fraction content significantly affects the stiffness, viscosity, deformation behavior, and temperature sensitivity of asphalt binders. Specifically, the complex modulus of asphalt binders increases with higher asphaltene or resin content, whereas it decreases with elevated saturate or aromatic content [31,32,33]. Additionally, an increased asphaltene content results in a reduction in the creep stiffness modulus and m-value under low-temperature conditions [34]. With regard to phase transition characteristics, several scholars have conducted preliminary investigations into the effect of SARA components on the glass transition temperature. Wang et al. [34] demonstrated that the Tg of asphalt binders is primarily influenced by the saturates and aromatics fractions, yet it increases with higher asphaltene content. Their linear regression analysis also revealed a significant correlation between Tg and the colloidal instability index, which is derived from SARA fractions. Wieser et al. [35] indicated that saturation lowers the glass transition temperature of neat asphalt binders. For modified asphalt, the glass transition temperature increases for low saturate contents and decreases for high saturate contents. However, a comprehensive understanding of how each SARA fraction influences a broader range of phase transition temperatures and moduli—especially across a wide temperature spectrum—remains limited.
Therefore, this study acquired the phase transition characteristics of 30 types of base asphalt binders over a broad temperature range using the DMA method. The performance of the asphalt binders was evaluated based on the characteristic temperature and modulus as key indicators. An analysis was conducted to assess the correlation between the phase-transition characteristic indicators and the evaluation results of conventional indicators, demonstrating the necessity and applicability of evaluating asphalt binder phase-transition characteristics using the DMA method. Finally, a statistical analysis was performed to explore the relationship between the phase-transition characteristic indicators and the SARA fraction of asphalt binders, providing theoretical support for the evaluation of these characteristic indicators.

2. Materials and Methods

2.1. Asphalt Binder Samples

In this study, 30 types of neat asphalt binders sourced from various regions and manufacturers were evaluated. The asphalt binders were categorized by source as follows: Asphalts sourced from China Petroleum Fuel Asphalt Co., Ltd. (Qinhuangdao, Hebei, China), produced from Venezuelan crude oil via straight-run process, with penetration grades of 20/40, 40/60, and 60/80, were labeled as A1, A2, and A3, respectively. Asphalts were also provided by the Research Institute of CNPC Fuel Oil Co., Ltd. (Beijing, China), produced from Venezuelan crude oil through straight-run and blending processes, with penetration grades ranging from 20 to 90 (0.1 mm); among these, straight-run asphalts were labeled as B1, B2, B3, B4, and B5, while blended asphalts were labeled as C1, C2, C3, C4, and C5. Hard asphalts from Zhenjiang Special Asphalt Co., Ltd. (Zhenjiang, Jiangsu, China), with penetration grades ranging from 10 to 50 (0.1 mm), were labeled as D1, D2, D3, D4, D5, and D6. Straight-run asphalts from Senegal, Africa, with penetration grades ranging from 20 to 50 (0.1 mm), were labeled as E1, E2, E3, E4, and E5. Three commonly used straight-run asphalts with penetration grade 60/80, provided by Hainan Province from Foshan Gaofu China Petroleum Fuel Asphalt Co., Ltd. (Foshan, Guangdong, China), TPC Asphalt Co., Ltd. (Bangkok, Thailand), and IRPC Public Co., Ltd. (Bangkok, Thailand), were labeled as F1, F2, and F3, respectively. Three batches of straight-run asphalt with penetration grade 80/100, provided by Sinopec, were labeled as G1, G2, and G3. The fundamental physical properties and SARA fraction content are listed in Table 1.

2.2. Test and Analysis Methods

2.2.1. Basic Performance Test

The penetration, softening point, ductility, dynamic viscosity and four fractions of asphalt binders were measured according to the Standard Test Methods of Bitumen and Bituminous Mixtures for Highway Engineering (JTG E20-2011) [36].

2.2.2. DMA Test

DMA Q800 (TA Instruments, New Castle, DE, USA) was used to investigate the phase transition characteristics of the asphalt binders. Testing was conducted using a dual-cantilever clamp with asphalt binder specimens prepared in thin sheets measuring 60 mm in length, 13 mm in width, and 3 mm in thickness (L60 mm × W13 mm × D3 mm). The dual-cantilever clamp and asphalt binder samples are illustrated in Figure 1. The temperature spectrum of the dynamic mechanical parameters of the asphalt binder was obtained using a temperature scanning mode with a fixed frequency, strain, and heating rate. The test conditions are listed in Table 2.
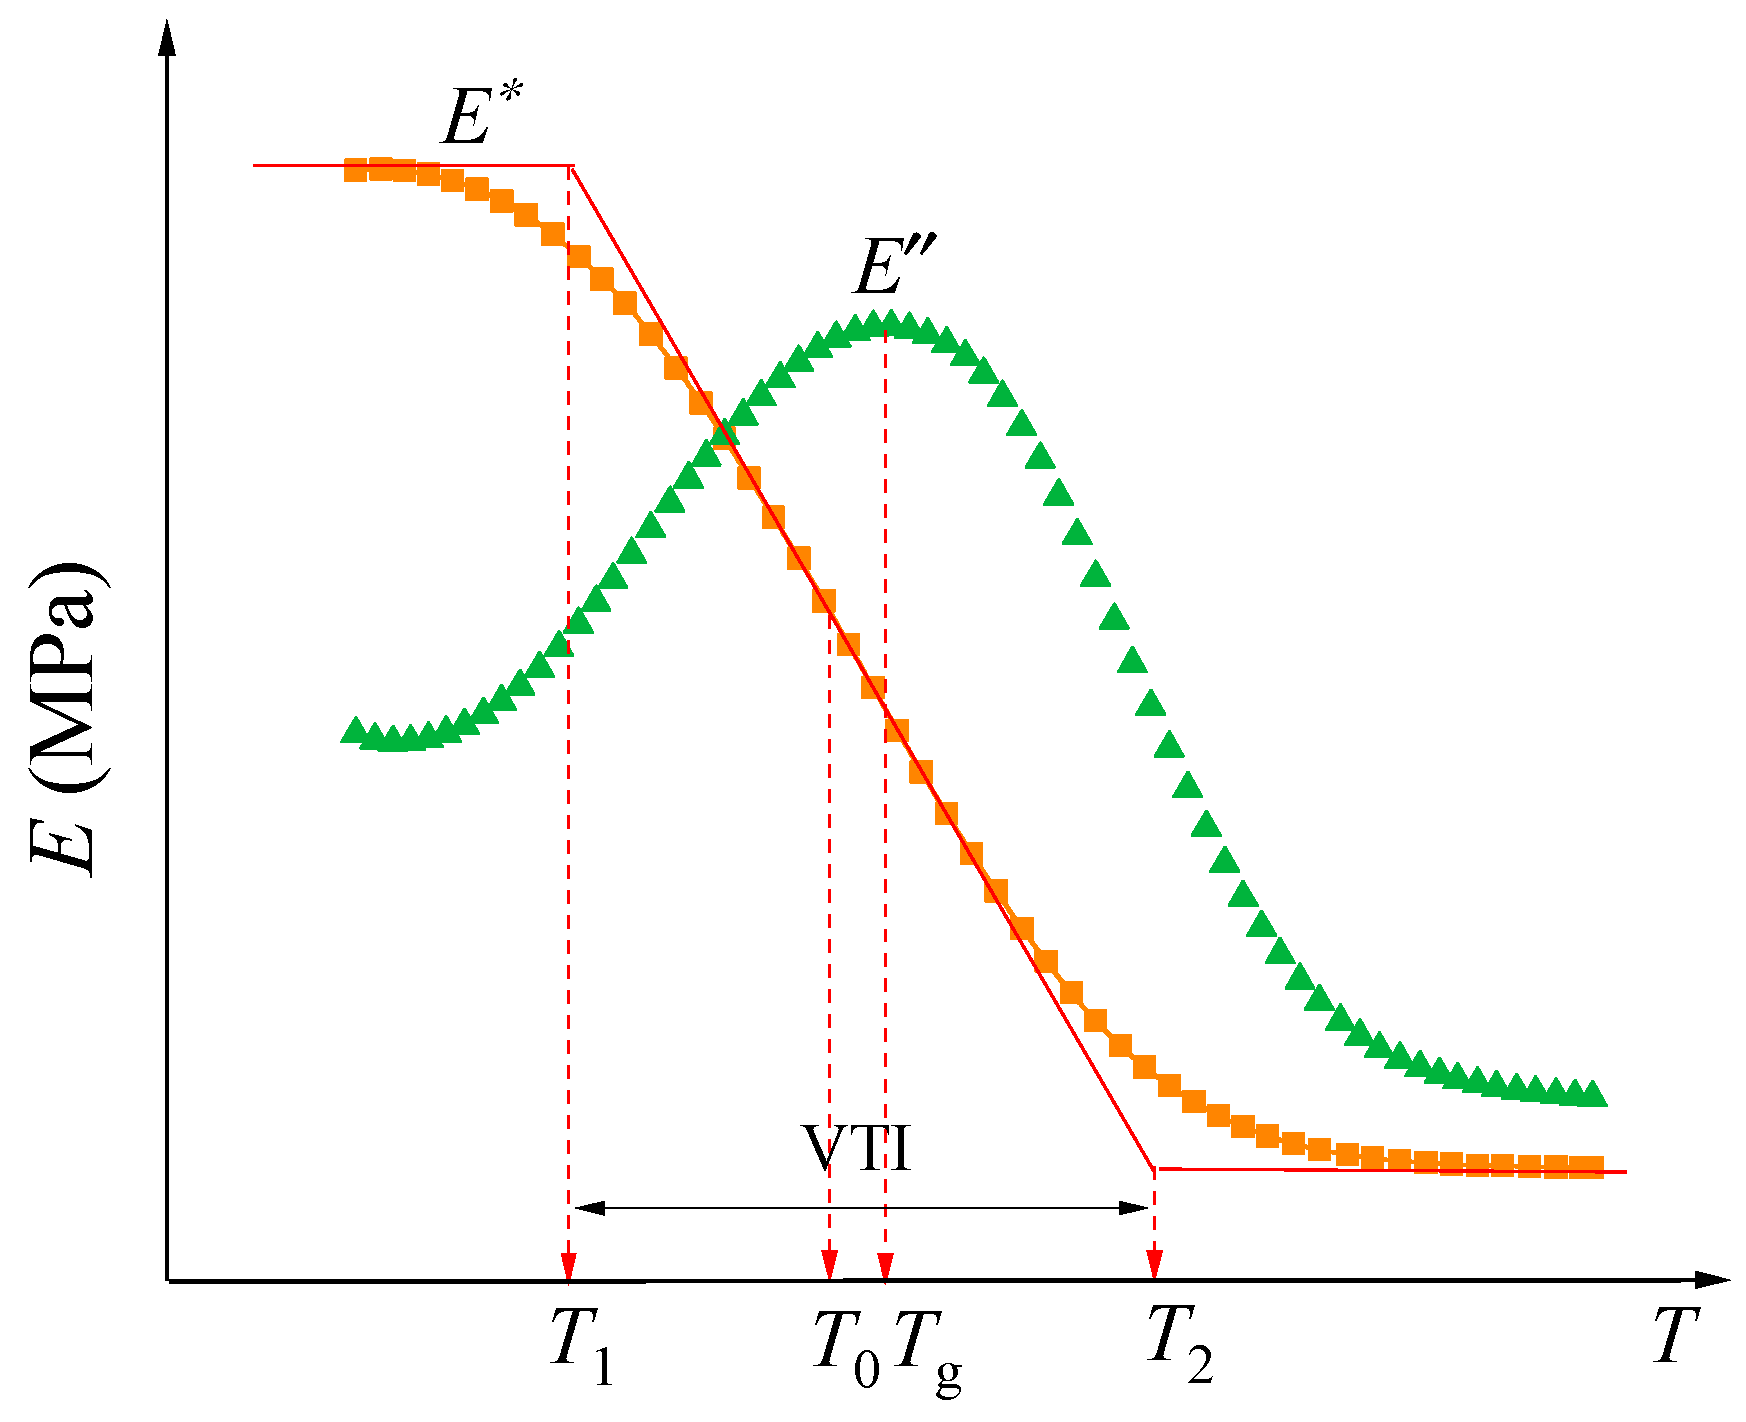
The complex modulus, storage modulus, loss modulus, and phase angle tangent value curves were derived using the dynamic mechanical test method. Figure 2 illustrates the modulus curve of the viscoelastic material over a wide temperature range. The curve representing the change in complex modulus with temperature typically exhibits an inverse S-shape. The Boltzmann function was applied to fit this curve using the function equation specified in Equation (1) [18].
y = A 1 A 2 1 + e ( x x 0 ) / d x + A 2
where A 1 and A 2 are the maximum and minimum moduli, respectively, MPa; x0 and dx are the shape parameters of the curve. x0 is the parameter that represents the inflection point temperature of the sigmoidal curve, °C; dx is the parameter that controls the steepness (slope) of the viscoelastic states, °C.
Utilizing the characteristics of the complex modulus test curve and the fitting parameters derived from the Boltzmann function, three PTTs can be defined from the complex modulus curve to characterize the phase transition properties of asphalt binders. These three characteristic temperatures are as follows:
  • The temperatures corresponding to the midpoint ( x 0 , y 0 ) of the complex modulus curve are defined as T 0 and T 0 = x 0 ;
  • The temperature at which the midpoint tangent of the complex modulus curve intersects the low-temperature asymptote is designated T1, T 1 = x 0 2 d x ;
  • The temperature at which the midpoint tangent of the complex modulus curve intersects the high-temperature asymptote is denoted as T2, T 2 = x 0 + 2 d x .
  • The temperature interval between T1 and T2 is the viscoelastic temperature interval (VTI) of the asphalt binder. During this phase, the asphalt binder exhibits certain deformation resistance and elastic recovery capabilities. VTI = ( T 2 T 1 ) .
The loss modulus curve displays a prominent peak, commonly identified as the glass transition temperature (Tg) in polymer material studies. The loss modulus curve exhibits a degree of asymmetry. In this study, a BiGaussian function was utilized to fit the loss modulus curve, yielding the PTT Tg, T g = x c .
The BiGaussian function equation is as follows:
y = y 0 + H e 0.5 ( x x c w 1 ) 2 ( x < x c ) y = y 0 + H e 0.5 ( x x c w 2 ) 2 ( x x c )
where y0 represents the offset in the data, MPa; xc is the peak center temperature, °C; H represents the height of the peak above the baseline y0, MPa; w1 controls the width of the left side of the peak, °C; w2 controls the width of the right side of the peak, °C.
In summary, the characteristic temperatures of the phase transitions (T1, T0, T2, and Tg) can be determined from the curves of the complex modulus and loss modulus of the material. The characteristic moduli E1, E0, E2, and Eg, corresponding to the characteristic temperatures, are obtained by substituting the characteristic temperatures into the complex modulus fitting equation. In addition to the characteristic moduli, the modulus values at specific temperatures of −20 °C and 20 °C (E−20 and E20) can also be derived from the complex modulus fitting equation.

3. Results and Discussion

The PTTs and characteristic modulus data for the 30 asphalt binders obtained through DMA testing are presented in Table 3. The subsequent analyses and discussions were based on the data in Table 1 and Table 3.

3.1. Evaluation of Asphalt Binder Phase Transition Characteristics

3.1.1. PTTs of Asphalt Binder

(1) Evaluation of the low-temperature performance
The low-temperature performance of asphalt binders is a crucial factor affecting pavement-cracking in cold environments. As a viscoelastic material, asphalt binders transition into a rigid “glassy state” with frozen molecular segments when the temperature drops below their glass transition temperature, leading to increased modulus and brittleness. Glass transition temperature is a key parameter for material selection in practical engineering applications. In DMA, various definitions of the glass transition temperature exist. For instance, the inflection point on the complex modulus curve is identified as the glass transition temperature, aligned with T1 and T0. Alternatively, the peak point temperature of the loss modulus curve is considered to be the glass transition temperature corresponding to the PTT Tg. Thus, in this study, T1, T0, and Tg were utilized as indicators of the glass transition temperature of asphalt binder to evaluate low-temperature performance.
The significance of differences and correlations between the PTTs were assessed using Pearson correlation analysis, and the results are presented in Figure 3. The Pearson correlation analysis demonstrated the strength of the linear relationships and their statistical significance among the variables. With the exception of a smaller correlation coefficient of 0.402 between T1 and T2, the correlation coefficients (r) between all other variables exceeded 0.7. All were statistically significant at the 1% level (p < 0.001), indicating strong positive correlations. Therefore, this study evaluates the low-temperature performance of asphalt binder using Tg as the indicator; a smaller Tg value indicates better low-temperature performance.
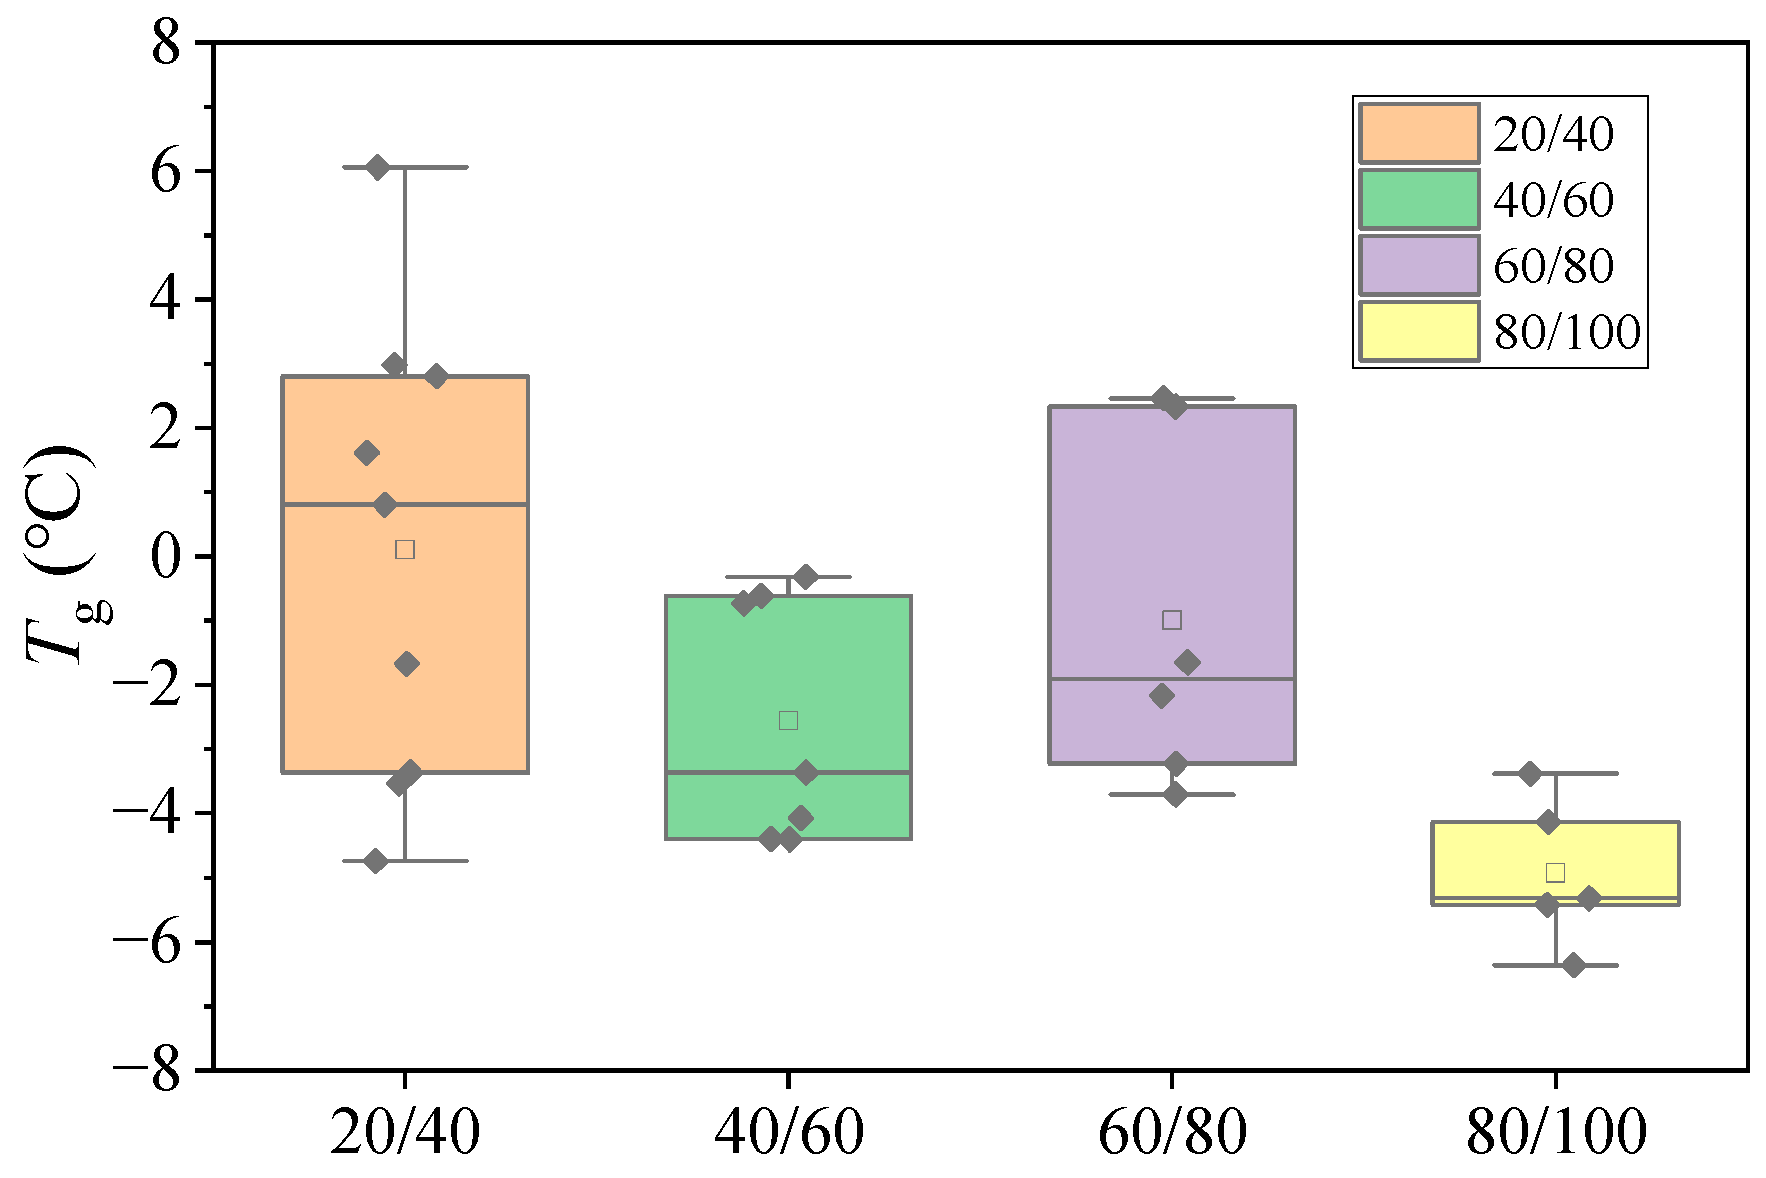
The ranges of the Tg indicators for the 30 asphalt binder types studied, classified by penetration grade, are illustrated in Figure 4. The Tg spans for 20/40, 40/60, 60/80, and 80/100 penetration-grade asphalt binders are −4.7 °C to 6.1 °C, −4.4 °C to −0.3 °C, −3.7 °C to 2.5 °C, and −6.4 °C to −3.4 °C, respectively. The results indicate a significant variation in Tg values among asphalt binders of the same penetration grade, and the expected trend of lower penetration grades correlating with higher Tg values was not observed. Furthermore, the conventional penetration-grade evaluation system primarily relies on ductility values to assess the low-temperature performance. However, ductility, as an empirical indicator, fails to differentiate low-temperature performance when ductility exceeds 100 cm or when brittle fracture occurs. This highlights the limitations of the current grading framework for evaluating asphalt binder behavior under low-temperature conditions.
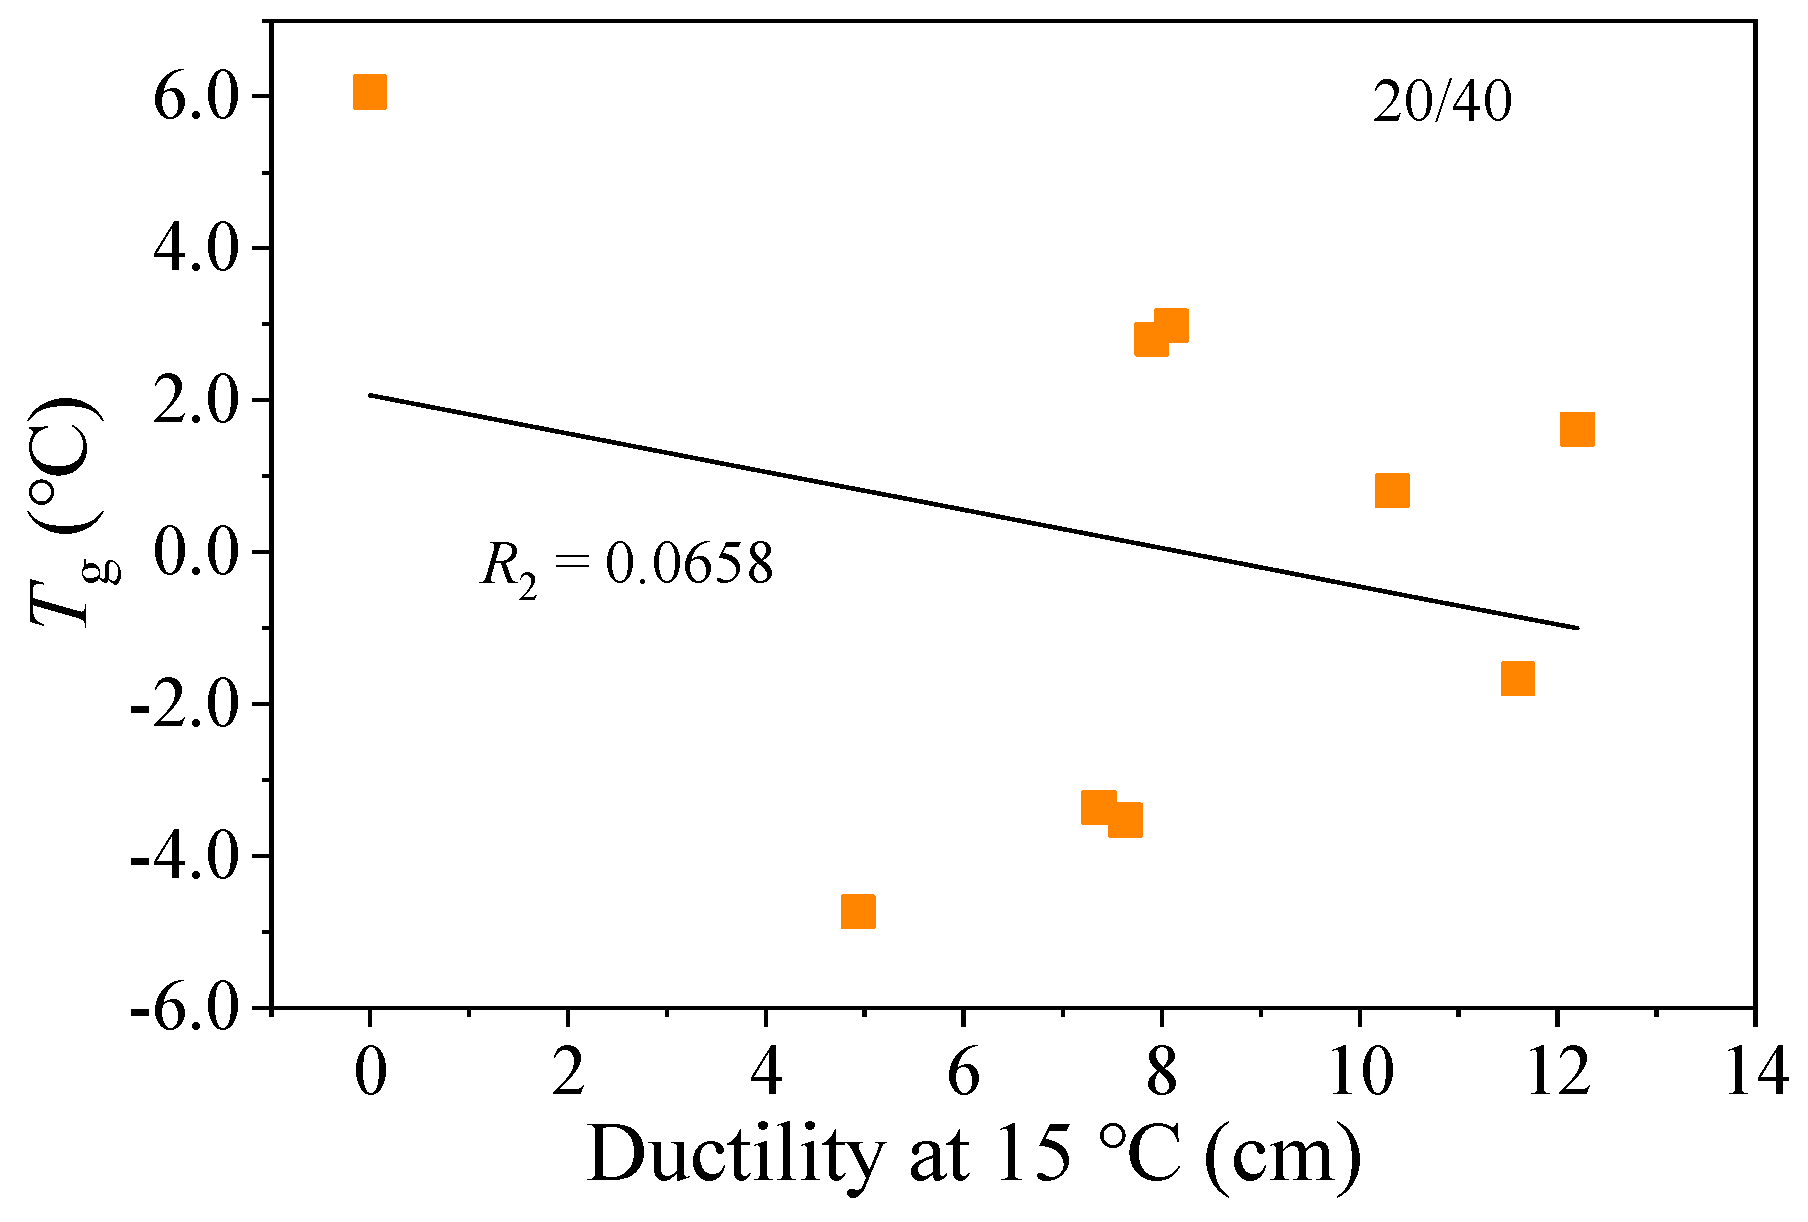
The 20/40-grade asphalt binder specimens exhibited brittle fractures during ductility testing at 10 °C, resulting in zero ductility (0 cm). Furthermore, the ductility values at 15 °C showed no clear correlation with the PTT (Tg), as illustrated in Figure 5. For example:
  • Asphalt binder A1 displayed a ductility of 0 cm at 15 °C, indicating the poorest low-temperature performance, consistent with its PTT evaluation.
  • Asphalt binder E1, conversely, showed a ductility of 5 cm at 15 °C—lower than other 20/40-grade asphalt binders—but exhibited the lowest Tg, which contradicts the PTT assessment.
  • Asphalt binders B1, C1, and D5 all recorded identical ductility values (8 cm), yet their PTTs differed by 6.5 °C.
These results reveal a significant discrepancy between the Tg-based evaluation and ductility-based assessment for 20/40-grade asphalt binders, highlighting limitations in relying solely on ductility for characterizing low performance.
In the 40/60-grade asphalt binders, the minimum ductility at 15 °C for D6 was 9 cm, yet their Tg values were relatively low at −4.1 °C. In contrast, asphalt binder A2 demonstrates superior ductility performance, with a 15 °C ductility exceeding 100 cm, although its Tg value was the highest among the 40/60-grade asphalt binders. For the 60/80-grade asphalt binders, all 15 °C ductility values exceeded 100 cm, with three types maintaining ductility above 100 cm at 10 °C, complicating accurate assessments of low-temperature performance. However, Tg effectively distinguishes variations in the low-temperature performance of asphalt binders. Among the five 80/100-grade asphalt binders studied, the glass transition temperatures differed by approximately 3 °C, indicating relatively minor differences in low-temperature performance. A comprehensive analysis revealed that the glass transition temperature serves as an effective and scientifically valid parameter for evaluating the low-temperature properties of asphalt binders, possessing clear physical significance. This metric offers greater scientific rigor and effectiveness for assessing the low-temperature performance characteristics of asphalt materials.
(2) Evaluation of high-temperature performance
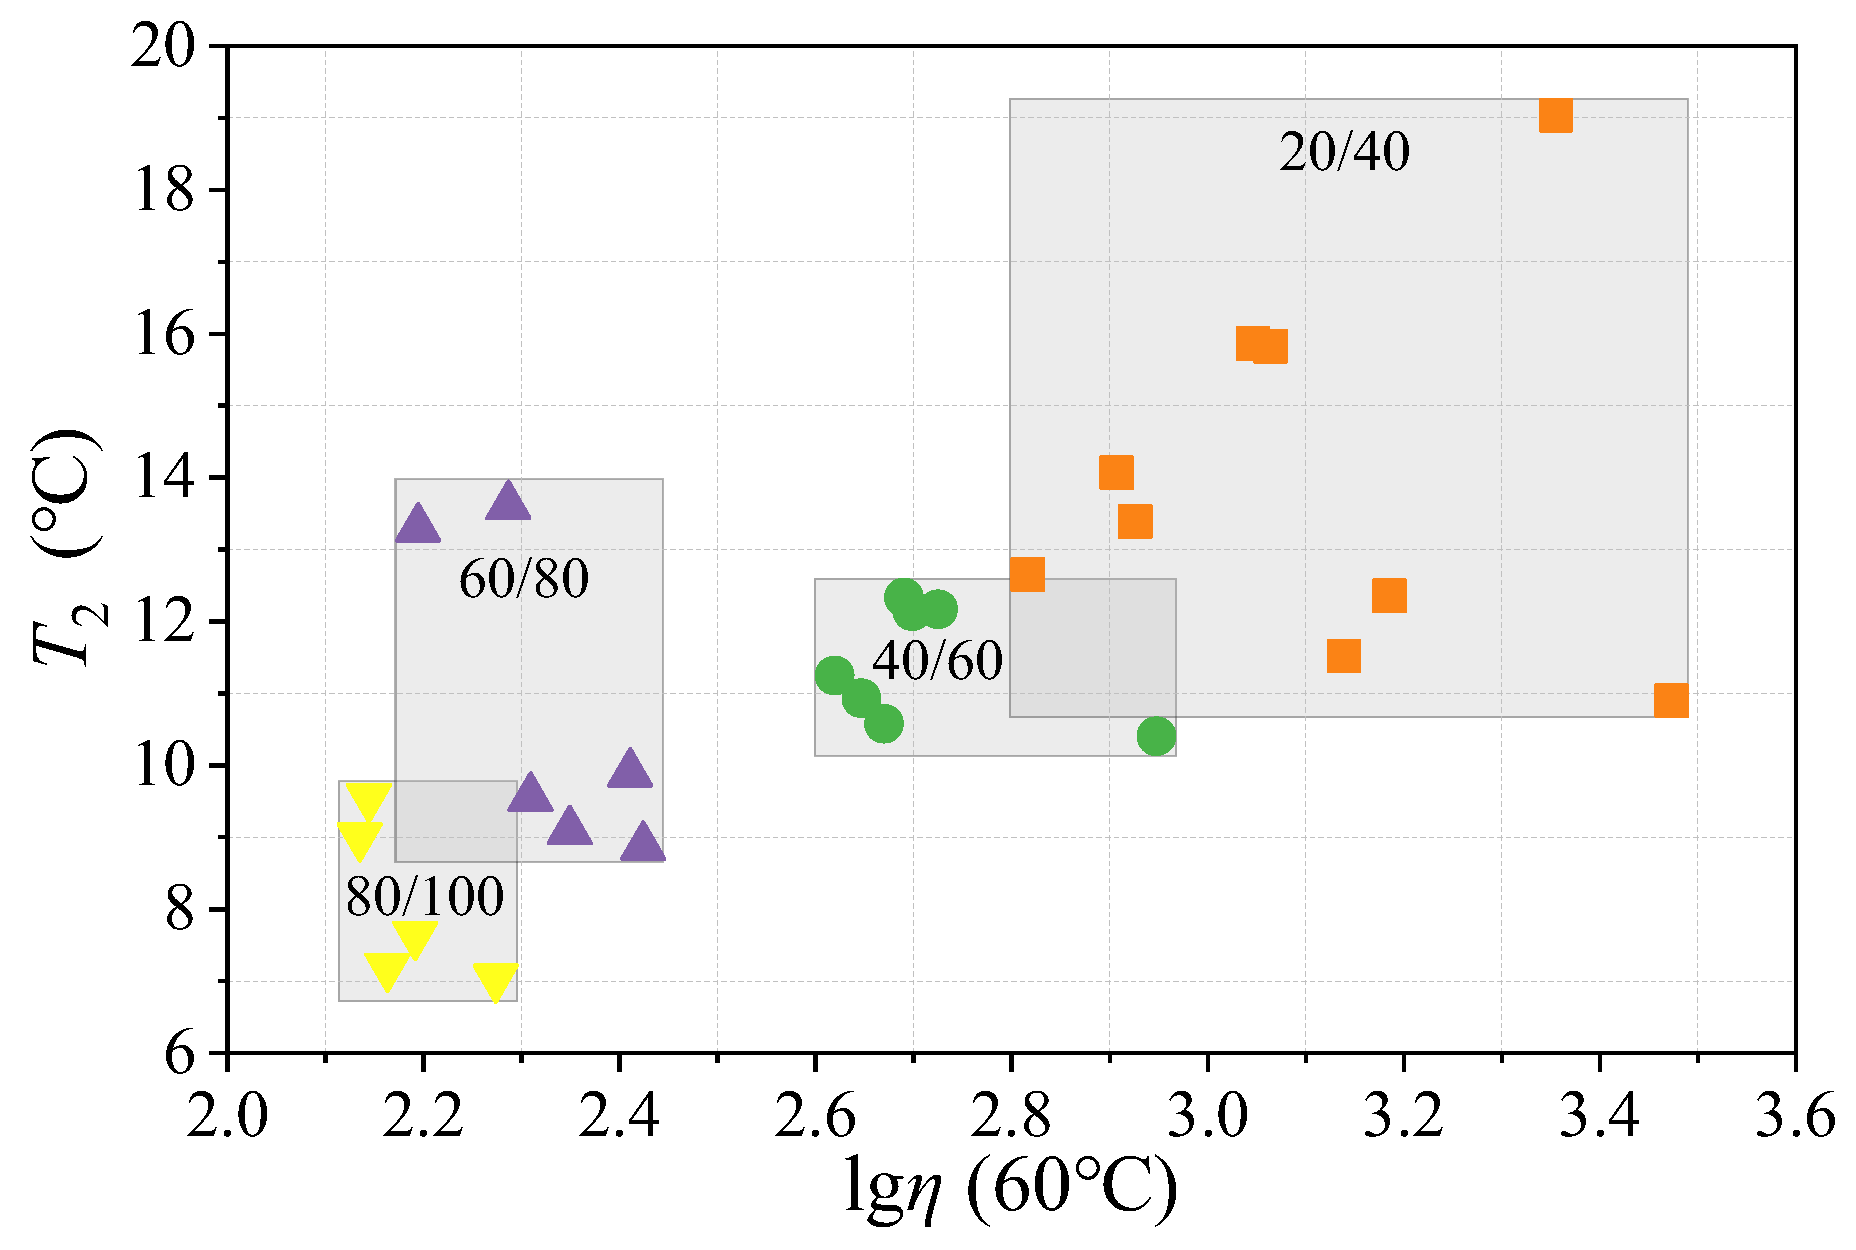
PTT (T2), also referred to as the flow transition temperature, signifies the temperature at which an asphalt binder transitions from a viscoelastic state to a viscous flow state. An elevated T2 indicates superior high-temperature performance of the asphalt binder. A comparison between the T2 metric and the conventional high-temperature indicator viscosity (η) is shown in Figure 6. The analysis reveals overlapping numerical ranges of T2 and η across asphalt binders of varying penetration grades, diverging from the expected trend of decreasing values with increased penetration. Moreover, higher viscosity does not necessarily correlate with elevated T2 values. For instance, 20/30-grade asphalt binder E1, which demonstrated the highest viscosity in this study, possesses the lowest T2 value within its grade, which was even lower than that of certain 40/60-grade asphalt binders. Similarly, among the 60/80-grade asphalt binders, F2 and F3 exhibit viscosity values that are lower than those of the 90-grade asphalt binders, yet their T2 values exceed those of the 40/60-grade asphalt binders. Viscosity quantifies the resistance of asphalt binder to flow, reflecting its flow behavior at specific temperatures, whereas the flow transition temperature T2 denotes the critical temperature at which viscosity markedly decreases. The proper interpretation and application of these two metrics offers vital guidance for material selection and engineering practices.
(3) Evaluation of viscoelastic temperature interval
The viscoelastic temperature interval (VTI) between the PTTs (T1 and T2) is characterized by asphalt binders existing in a viscoelastic state. During this phase, the asphalt binders display a certain degree of deformation resistance and elastic recovery capability. This viscoelastic temperature range can be considered the optimal service temperature range for asphalt binders; a broader temperature range signifies enhanced performance, with improved low-temperature crack resistance and high-temperature rutting resistance. As illustrated in Figure 7, the viscoelastic state temperature interval for base asphalt binders ranges from 23 °C to 33 °C. Within the same penetration grade, variations in the VTI of asphalt binders are observed, with the 60/80-grade asphalt binders showing particularly significant dispersion. Nevertheless, the overall trend indicates that the VTI of the asphalt binders decreases as the penetration grade increases. When selecting an asphalt binder grade, it is crucial to assess its viscoelastic temperature range to ensure a wider operational temperature service range is obtained, allowing for adaptability to fluctuations in pavement temperature environments.

3.1.2. Characteristic Modulus of Asphalt Binders

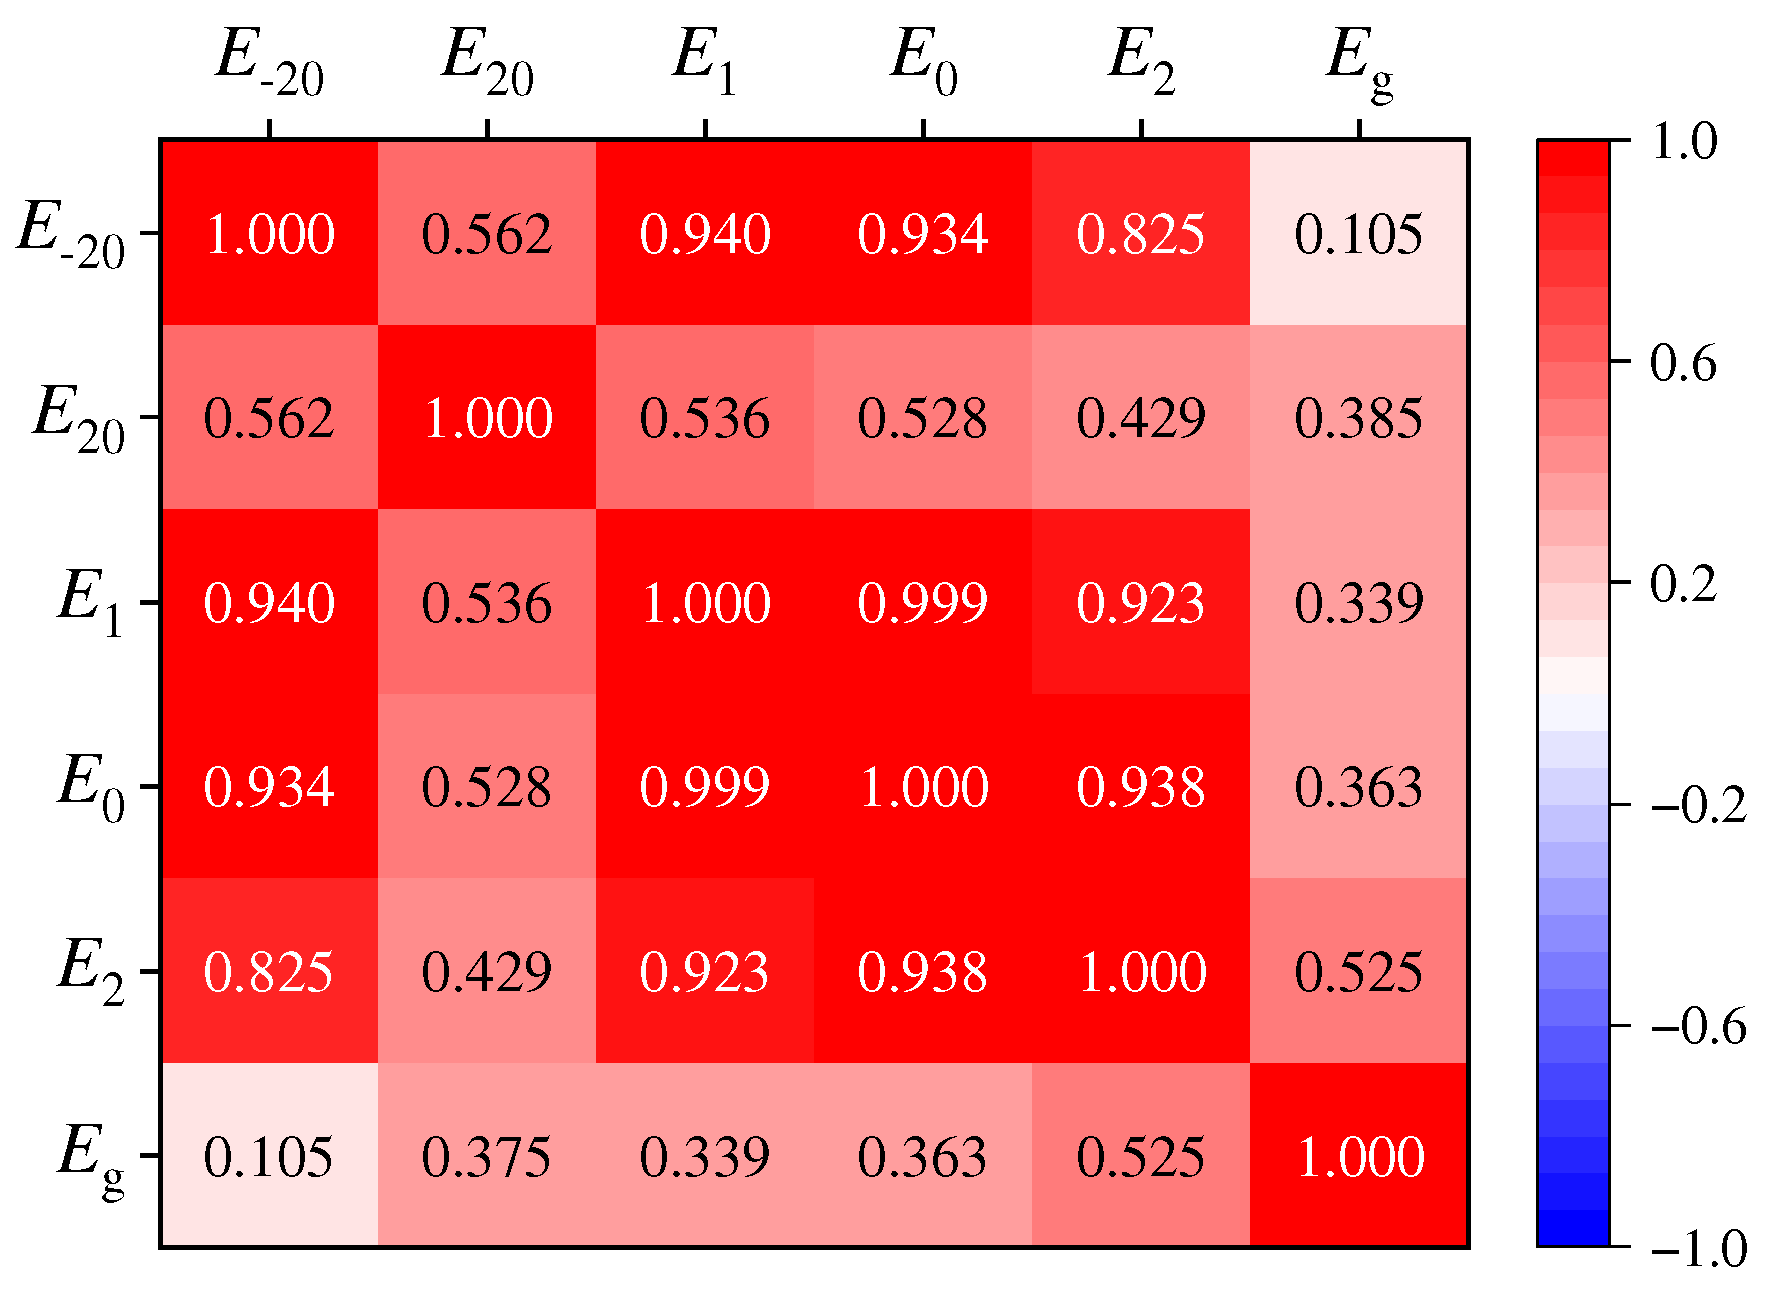
The modulus serves as a parameter reflecting the mechanical response of materials under specific conditions, wherein characteristic modulus values across varying temperature ranges reveal the macroscopic properties of the materials. The study commenced with a correlation analysis of the characteristic moduli, and the results are detailed in Figure 8. Parameters E1, E0, and E2 correspond to characteristic moduli linked to PTTs derived from complex modulus curves, exhibiting correlation coefficients exceeding 0.92, indicating significant linear relationships among them. Parameters T1, T0, and Tg are utilized to evaluate the low-temperature performance of asphalt binders; however, the corresponding moduli E1, E0, and Eg demonstrate correlation coefficients below 0.37, suggesting a lack of correlation. Notably, the low-temperature modulus E−20 at −20 °C reveals strong correlations with E1 and E0 (r > 0.93) but shows no linear relationship with Eg (r = 0.105). Similarly, the high-temperature modulus, E20 at 20 °C, displays minimal correlation with E2 (r < 0.43). This is primarily due to the fact that the characteristic moduli correspond to different temperature benchmarks, complicating the comparison of modulus variations across various asphalt materials.
Therefore, this section predominantly employed the low-temperature modulus E−20 (−20 °C) and the high-temperature modulus E20 (20 °C) as indicators to assess asphalt binders’ performance under low and high temperatures. At low temperatures, the asphalt binders primarily exhibited elastic characteristics; higher modulus values signify a greater internal stress concentration and susceptibility to failure, reflecting the poor low-temperature performance. Conversely, at high temperatures, materials require adequate strength, and higher modulus values correspond to reduced deformations under load, indicating a superior high-temperature performance.
(1) Evaluation of the low-temperature performance
Figure 9 compares the low-temperature moduli range of the neat asphalt binders analyzed in this study. The results reveal significant variability in the low-temperature characteristic moduli within the same penetration grade, whereas the modulus values for the 20/40-, 40/60-, and 60/80-grade asphalt binders reside within similar numerical ranges. This finding indicates that there is no direct correlation between the low-temperature modulus and the penetration grade of asphalt binders (e.g., 20/40), with low-penetration-grade binders not necessarily exhibiting higher E−20 values than higher-grade asphalt binders (e.g., 60/80). From a modulus perspective, lower-grade asphalt binders may not have an inferior low-temperature performance. Figure 10 illustrates the correlation between the Tg of an asphalt binder and E−20. While PTT and characteristic modulus show some association with low-temperature performance (R2 = 0.5355), their correlation remains relatively weak. Practical engineering applications should therefore implement quality control by considering both PTT and modulus parameters to optimize the low-temperature performance of asphalt binders.
(2) Evaluation of high-temperature performance
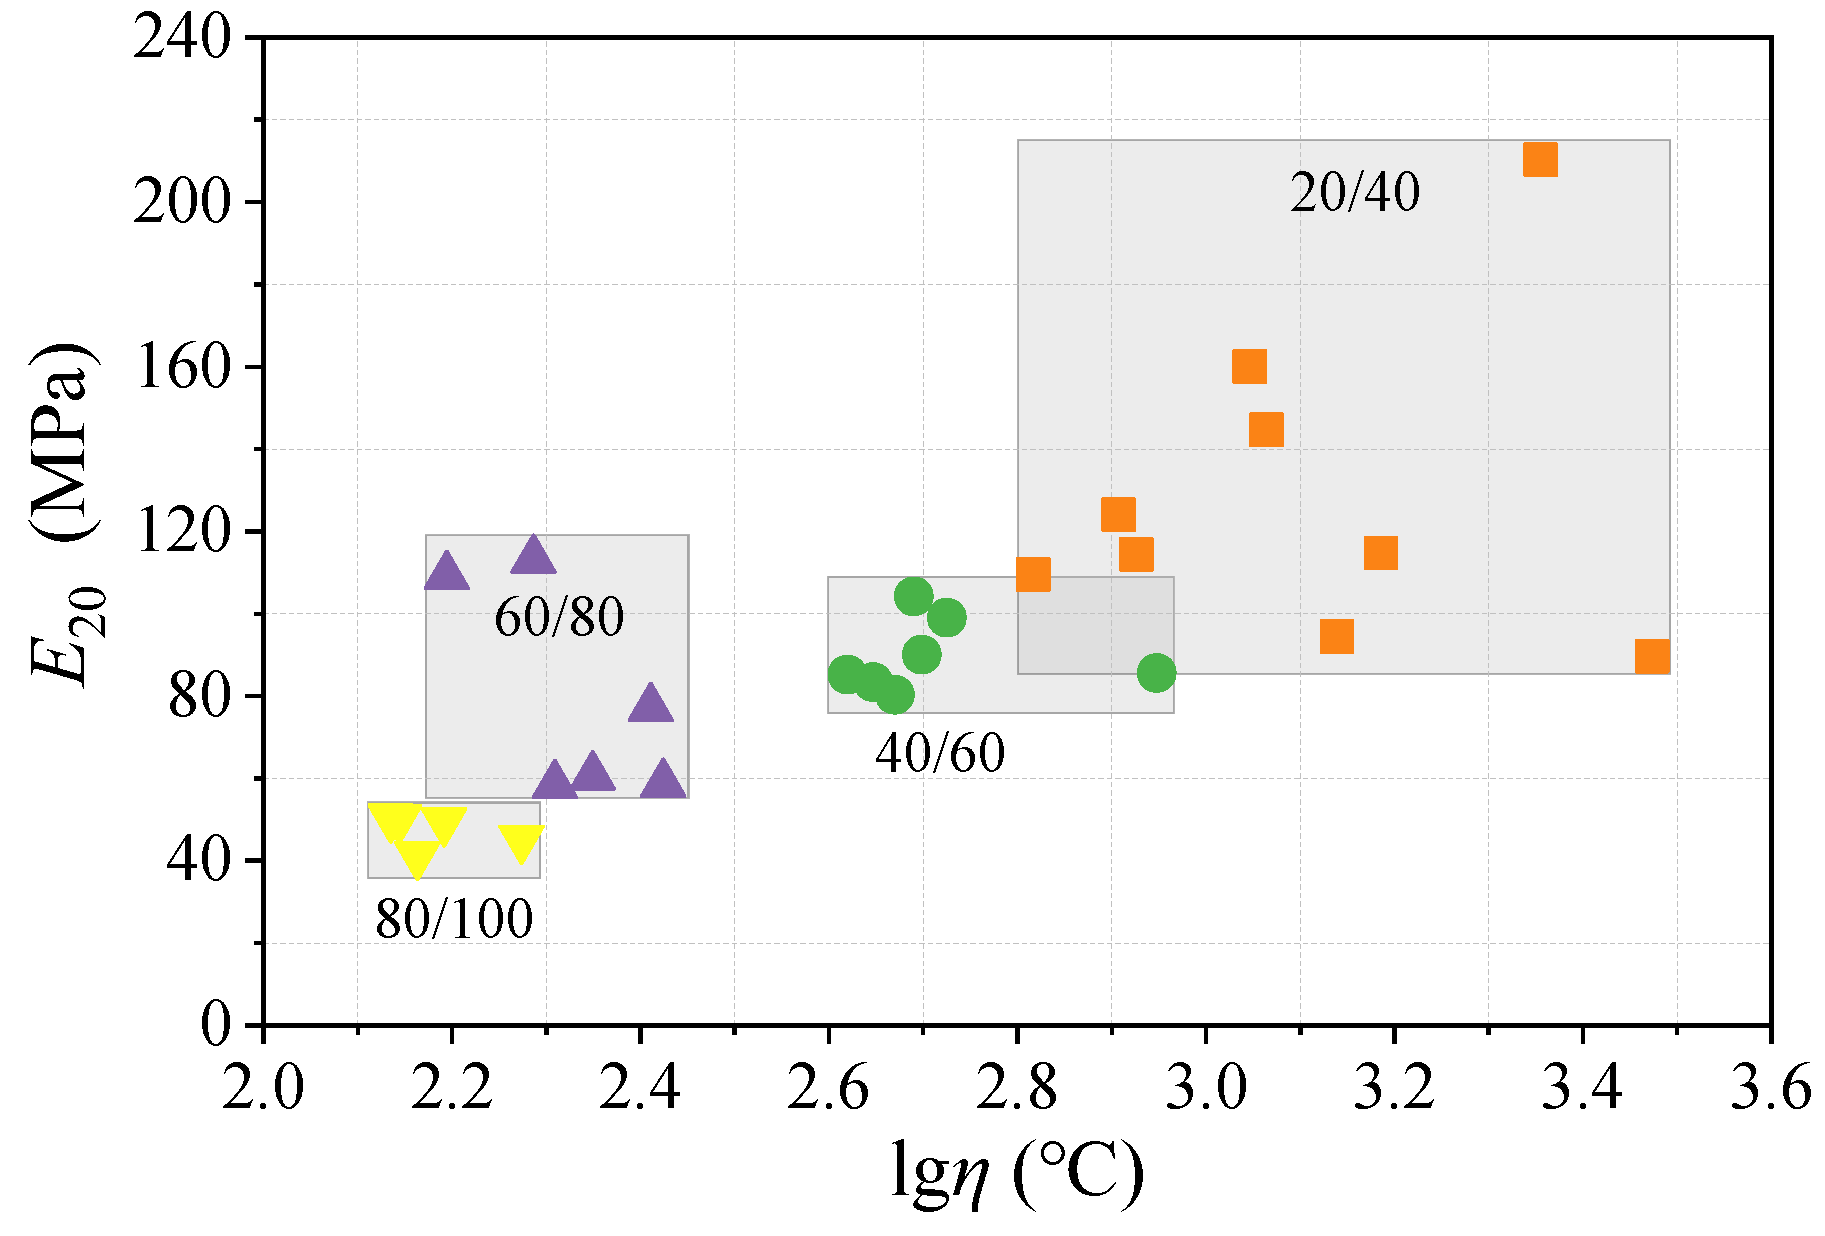
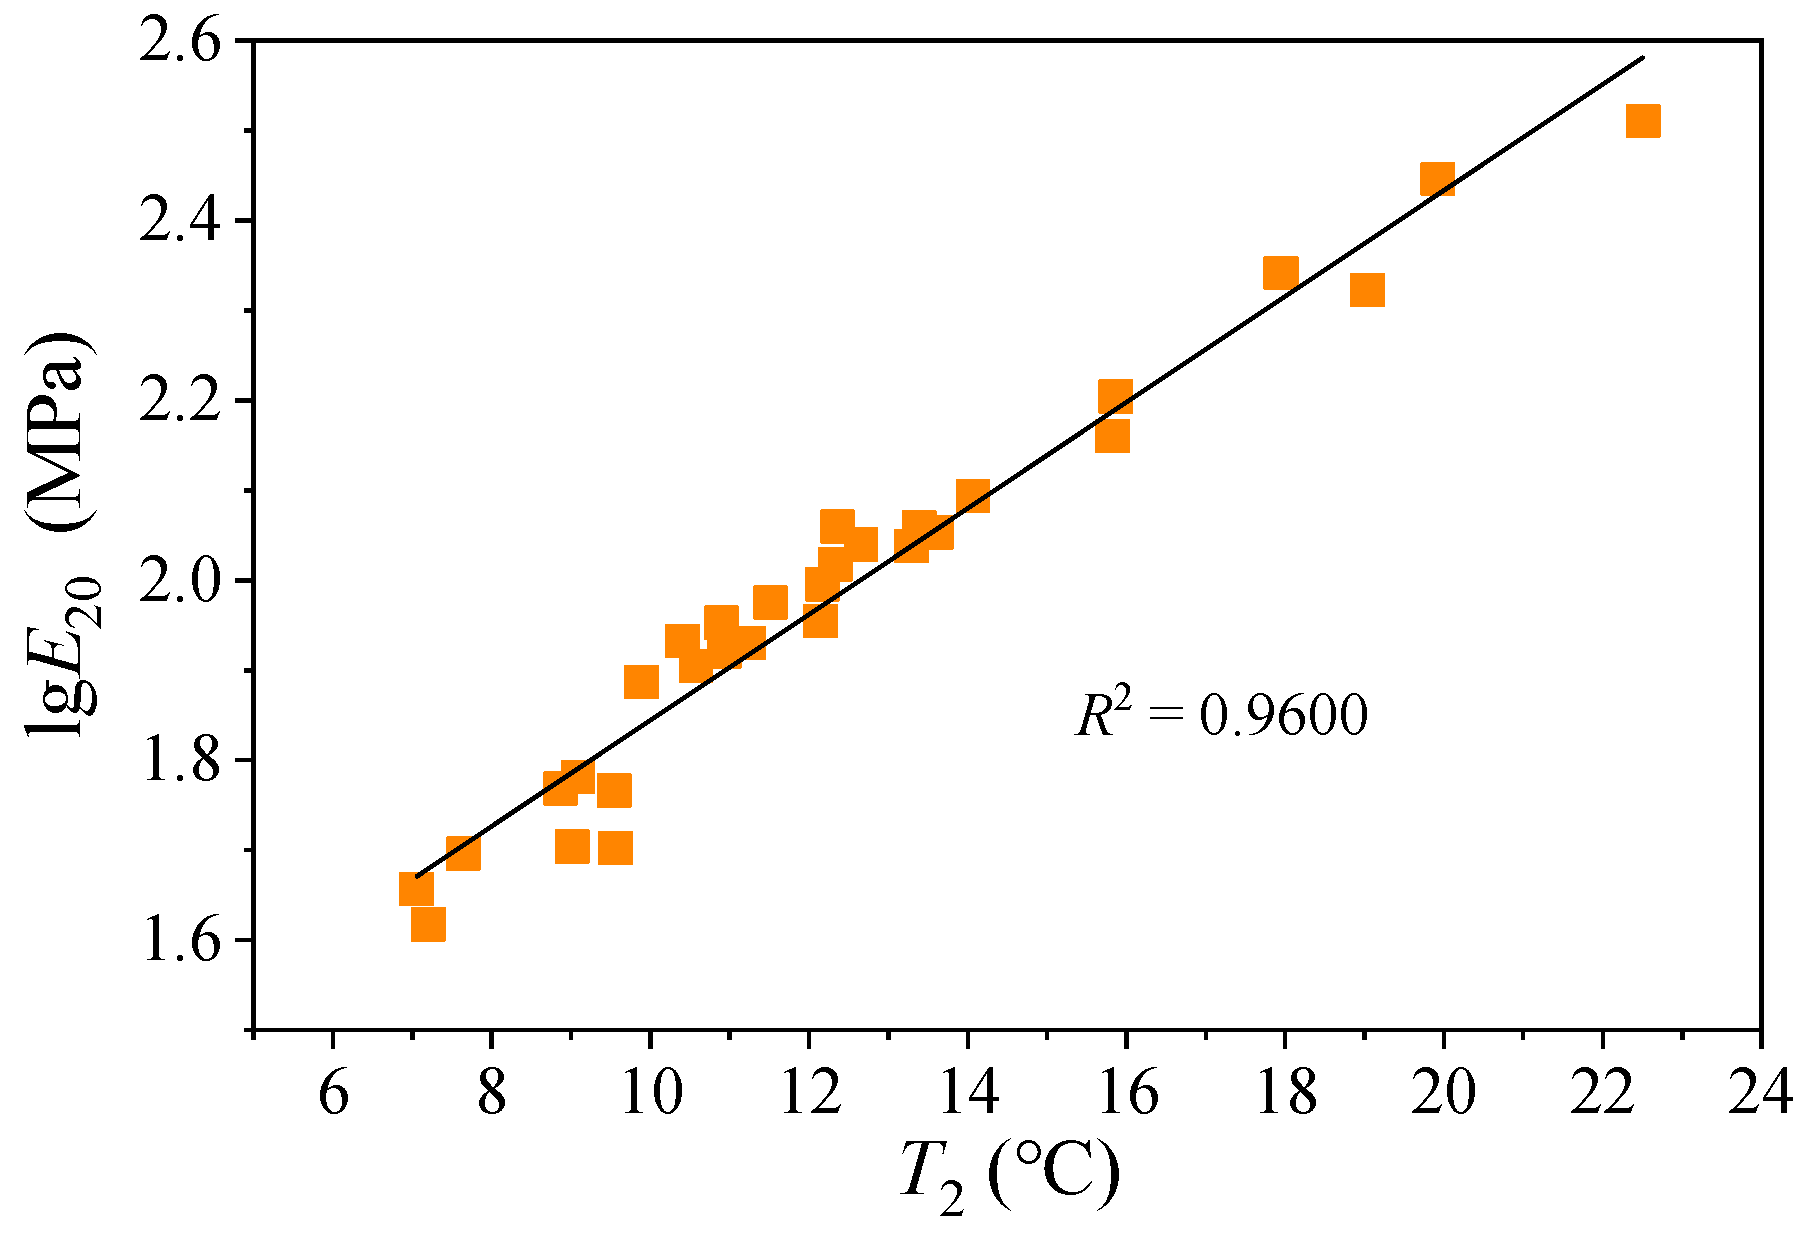
A comparison between the E2 indicator and conventional high-temperature parameter η is shown in Figure 11. The results indicate a general correlation between the modulus values and asphalt binder penetration grades, with higher penetration grades typically exhibiting lower modulus values. However, the overlapping ranges between E20 and η suggest that high-viscosity asphalt binders do not necessarily correspond to elevated E20 values. The E20 indicator is closely aligned with the T2 evaluation results presented in Figure 6. Figure 12 shows the relationship between asphalt binder’s T2 and log E20, revealing a strong linear correlation (R2 = 0.96). This confirms a solid association between PTT and the characteristic modulus in assessing the high-temperature performance of asphalt binders, with consistent evaluation results. For practical engineering applications, either PTT or modulus parameters can be selected for the quality control of asphalt binders’ high-temperature performance.

3.2. The Relationship Between Phase Transition Characteristic Index and Conventional Performance Index

Under the penetration grading system, asphalt binder performance is primarily assessed through penetration, softening point, ductility, and viscosity. Typically, asphalt binders with lower penetration, a higher softening point, and greater viscosity demonstrate superior high-temperature performance. Within the same penetration grade, higher ductility correlates with improved low-temperature performance. However, evaluations based on the phase transition characteristic temperatures and modulus values reveal significant variations in the high- and low-temperature performance among asphalt binders with identical penetration grades. The penetration grading system does not limit phase transition-based evaluations; lower-grade asphalt binders may not necessarily exhibit better high-temperature performance or poorer low-temperature performance than their higher-grade counterparts. Correlation analyses were conducted for the representative low-temperature indicators (Tg and E−20) and high-temperature indicators (T2 and E20), and the results are summarized in Figure 13.
The absolute correlation coefficients between Tg/E−20 and conventional performance indicators are all below 0.53, indicating negligible linear correlations. This suggests inconsistencies between the phase transition characteristics derived from DMA and empirical asphalt binder performance metrics. Although ductility is a conventional low-temperature indicator, technical specifications define the ductility ranges for different penetration grades. However, ductility testing is challenging for distinguishing low-temperature performance when high-grade asphalt binders exceed the upper limit of 100 cm or when low-grade asphalt binders exhibit brittle fracture. In contrast, PTTs and characteristic moduli, grounded in clear physical significance, offer broad applicability and effectiveness for low-temperature performance assessments.
For the high-temperature performance indicators T2 and E20, significant correlations with conventional metrics (excluding ductility) are observed at the 1% significance level, with correlation coefficients of approximately 0.8, indicating strong alignment. This consistency confirms that the phase transition characteristics and empirical metrics yield coherent evaluations of high-temperature performance. Therefore, this study proposes an evaluation index of the phase transition characteristics based on DMA, which provides valuable guidance for the selection and application of asphalt materials in actual pavement engineering.

3.3. Relationship Analysis Between Phase Transition Characteristics and Asphalt Binder Components

The phase transition characteristics represent macroscopic manifestations of the microscopic molecular motion of materials. Currently, asphalt binders are primarily SARA to compare differences in chemical composition. This section focuses on analyzing the relationships between the asphalt binders’ phase transition characteristic temperatures (Tg, T2), characteristic moduli (E−20, E20), and their four fractions, with the aim of investigating the effects of an asphalt binder’s microscopic molecular structure on dynamic mechanical response parameters.

3.3.1. Single Factor Correlation Analysis

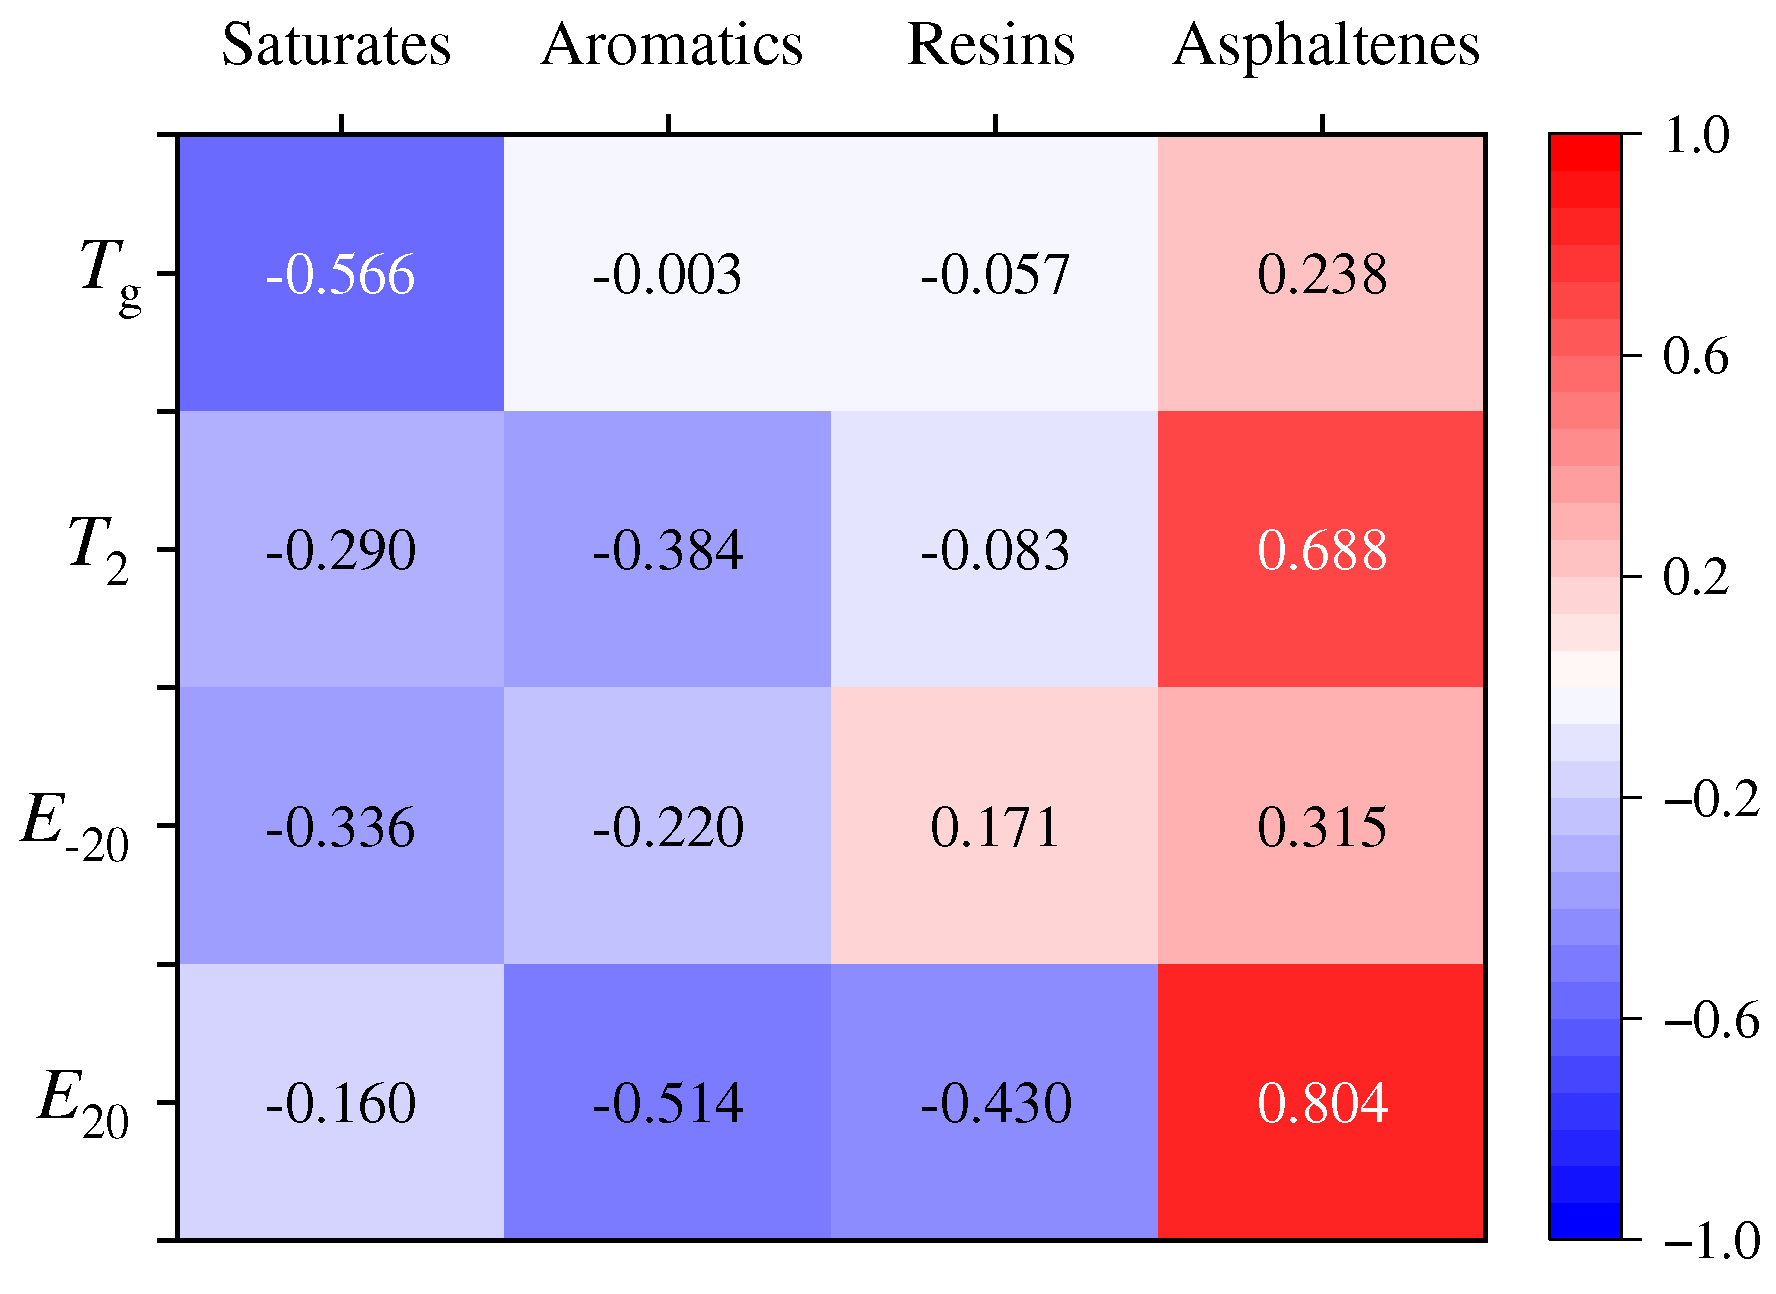
Figure 14 presents the results of the correlation analysis of the dynamic mechanical indicators of an asphalt binder and its four-component composition. Tg shows a statistically significant negative correlation with saturates at the 0.01 significance level (r = −0.566). However, Tg exhibits no meaningful correlations with aromatics, resins, or asphaltenes, as indicated by p-values exceeding 0.2 and absolute correlation coefficients below 0.3. The characteristic temperature T2 demonstrates a weak positive correlation with asphaltenes, at the 0.01 significance level (r = 0.688), and a very weak negative correlation with aromatics, at the 0.05 level (r < −0.4). No significant correlations are observed between T2 and saturates or resins, with p-values greater than 0.1 and absolute correlation coefficients below 0.3.
For the low-temperature characteristic modulus E−20, no statistically significant correlations with any of the four components are identified at the 0.05 significance level (|r| < 0.34). In contrast, the high-temperature characteristic modulus E20 shows significant correlation with aromatics and asphaltenes at the 0.01 level. Specifically, E20 exhibits a weak negative correlation with aromatics (r = −0.514) and a strong positive linear correlation with asphaltenes (r = 0.804). No significant relationships are observed between E20 and saturates or resins.
Saturates, which are relatively light components in asphalt binders, with low molecular weight, function as softening agents. Their short molecular chains and low activation energy for segmental motion lead to a reduction in the Tg of asphalt binders with increasing saturate content, which aligns with the observed negative correlation between the saturates and Tg. Conversely, asphaltenes, which are characterized by a high molecular weight and elevated activation energy for chain movement, enhance the viscosity and high-temperature performance of asphalt binders. This is reflected in dynamic mechanical parameters, such as elevated T2 and increased E20, consistent with the results of the correlation analysis. While a higher saturate content benefits low-temperature performance and an increase in asphaltenes improves high-temperature performance, the correlation analysis indicates relatively weak associations between the phase transition characteristics and individual asphalt binder fractions.

3.3.2. Multiple Linear Regression Analysis

The macroscopic mechanical response of asphalt materials arises from synergistic interactions between their microscopic molecular components. This study employs multiple regression analysis to investigate the comprehensive relationships between the phase-transition characteristic indicators of asphalt binders (Tg, T2, E−20, E20) and the content of their four fractions. The dependent variables are defined as the dynamic mechanical parameters Tg (Y1), T2 (Y2), E−20 (Y3), and E20 (Y4), while the independent variables comprise the four fractions of saturates (X1), aromatics (X2), resins (X3), and asphaltenes (X4). Multiple regression analysis (at the 95% confidence level) was performed separately for each dependent variable to establish statistical dependencies on the compositional variables. The Data Analysis Tool in Microsoft Excel 2016 was used to analyze the sample data presented in Table 1 and Table 3.
The multiple regression analysis of the dynamic mechanical indicators of asphalt binders (Tg, T2, E−20, E20) and the four fractions generated the following models:
T g = 214.5 3.52 X 1 2.13 X 2 1.93 X 3 1.80 X 4
T 2 = 187.7 2.99 X 1 1.75 X 2 1.73 X 3 0.98 X 4
E 20 = 14399.9 172.86 X 1 128.58 X 2 109.43 X 3 115.03 X 4
E 20 = 1592.6 33.48 X 1 15.24 X 2 15.33 X 3 + 0.15 X 4
The regression equations reveal that the four fractions exhibit negative effects on the PTTs (Tg, T2) and low-temperature modulus (E−20), whereas only asphaltenes have a positive influence on the high-temperature modulus (E20). These results partially contradict the findings of single-factor correlation analyses. Specifically, the sign of the coefficient for saturates in the multiple regression model for Tg is positive, whereas the Pearson correlation indicated a negative linear relationship. This apparent discrepancy is a known statistical phenomenon often arising from multicollinearity among the independent variables. The SARA fractions are compositional variables that sum to a constant, meaning they are inherently inter-correlated. The multiple regression model estimates the unique contribution of each fraction while holding the others constant, a condition that is difficult to achieve physically. Therefore, the multiple regression coefficients should be interpreted as indicators of synergistic and competing interactions within the asphalt’s chemical system rather than as direct, isolated effects. The single-factor correlation, on the other hand, reflects the stronger, net-observable trend where an increase in saturates typically coincides with a decrease in other fractions, leading to an overall reduction in Tg. The next step was to conduct a significance test for this model, including the goodness of fit test and analysis of variance.
(1) Goodness-of-fit test
The goodness-of-fit test evaluates the extent to which a model aligns with a given set of observations. Measures of goodness-of-fit typically summarize the discrepancy between the observed values and those predicted by the model. Table 4 presents the regression statistics. It is evident that the Multiple R values for all the fitted models exceed 0.70. Multiple R serves as an indicator of how effectively a specific variable can be predicted using a linear function derived from a set of other variables, with a high Multiple R indicating a strong correlation. A Multiple R greater than 0.70 suggests a robust linear relationship between the four fractions and the dynamic mechanical index. R2 quantifies the extent to which the observed results are replicated by the model, representing the proportion of total variation in the outcomes explained by the model. Specifically, 57.63%, 77.89%, 49.60%, and 83.70% of the Tg, T2, E−20, and E20 values, respectively, can be accounted for by the fitted model. The goodness-of-fit analysis reveals that the high-temperature indices T2 and E20 exhibit strong alignment with the four-component regression model, whereas the low-temperature indices Tg and E−20 demonstrate relatively weaker alignment with the same model.
(2) ANOVA
Analysis of variance (ANOVA) was used to assess the significance of linear regression. This technique utilizes the variance of the observed data and the p value to determine the applicability of a linear regression model to the observed data.
The results of the analysis are presented in Table 5. When the significance level α is 0.05, F 0.05 ( 4 , 25 ) = 2.76 . The F values of Tg, T2, E−20 and E20 were 8.50, 22.13, 6.15, and 32.10, respectively. All are greater than F 0.05 ( 4 , 25 ) . The p value is the critical value of F α at the corresponding significance level, which represents the probability of rejecting the truth; therefore, the smaller the p value, the better. In this analysis, the p value is less than 0.001, and the confidence is 99.9%. This provides strong evidence that a linear relationship exists. From the test point of F-value and p-value, Tg, T2, E−20, and E20 show significant multivariate fitting potential with the four components.

4. Conclusions

This research highlights the limitations of traditional penetration grading systems in capturing the temperature-dependent performance of asphalt binders, particularly under low-temperature conditions, where ductility fails to differentiate materials. The Tg and E20 values derived from DMA offer robust physics-based alternatives, demonstrating superior sensitivity to molecular dynamics and phase transitions. Key findings include the following:
  • Low-temperature performance: Tg effectively distinguishes asphalt binder behavior even when ductility values exceed 100 cm or brittle fracture is observed, addressing empirical limitations.
  • High-temperature performance: Strong correlations between T2, E20, and viscosity validate their utility in predicting rutting resistance; however, overlapping ranges with penetration grades suggest complementary use.
  • Chemical composition: Saturates reduce Tg, enhancing low-temperature flexibility, while asphaltenes elevate E20, improving high-temperature stiffness. Nonetheless, the weak correlations between individual SARA fractions and low-temperature indices highlight the necessity for a holistic compositional analysis.
  • Integration into existing grading systems: The proposed DMA-based phase-transition indicators (Tg, T2, E−20, E20) can be incorporated into current binder specifications as supplementary performance criteria. For instance, Tg could serve as a low-temperature performance grade supplement, especially for regions experiencing extreme cold, while T2 and E20 could enhance high-temperature performance grade classification. This dual approach—combining empirical metrics with mechanistic indicators—would provide a more comprehensive evaluation framework, enabling better material selection tailored to specific climatic and loading conditions.
  • Practical implications: DMA-based phase-transition indicators bridge the gap between empirical specifications and mechanistic understanding, facilitating precise material selection for diverse climatic conditions. It should be noted that the findings and models presented in this study are based on laboratory testing of neat asphalt binders under controlled conditions. The applicability to modified asphalt binders or real-world pavement environments may require further validation. Future work should explore modified asphalt binders and conduct a field validation to refine these models for broader engineering applications.

Author Contributions

Conceptualization, Y.W., J.W. and X.X.; methodology, Y.W., X.X. and Q.X.; formal analysis, Y.W. and X.X.; investigation, Q.X. and Z.Z.; resources, Y.S. and N.L.; data curation, Y.S. and Z.Z.; writing—original draft, Y.W. and J.W.; writing—review and editing, Y.W., J.W. and Q.X. All authors have read and agreed to the published version of the manuscript.

Funding

This research was funded by Shandong Provincial Natural Science Foundation, grant number: ZR2024QE425.

Institutional Review Board Statement

Not applicable.

Informed Consent Statement

Not applicable.

Data Availability Statement

Data are contained within the article.

Conflicts of Interest

The authors declare no conflicts of interest.

Abbreviations

The following abbreviations are used in this manuscript:
DMADynamic Mechanical Analysis
SARASaturate, Aromatic, Resin, and Asphaltene
PTTPhase Transition Temperature
TTSPTime–Temperature Superposition Principle
DSCDifferential Scanning Calorimetry
VTIViscoelastic Temperature Interval

References

  1. Liu, J.; Sun, Y.; Wang, W.; Chen, J. Using the viscoelastic parameters to estimate the glass transition temperature of asphalt binders. Constr. Build. Mater. 2017, 153, 908–917. [Google Scholar] [CrossRef]
  2. Tan, Y.; Guo, M. Study on the phase behavior of asphalt mastic. Constr. Build. Mater. 2013, 47, 311–317. [Google Scholar] [CrossRef]
  3. Guo, M. Dynamic Mechanical Thermal Analysis of Polymers and Composites; Chemical Industry Press: Beijing, China, 2002. [Google Scholar]
  4. Elseifi, M.A.; Mohammad, L.N.; Glover, I.; Negulescu, I.; Daly, W.H.; Abadie, C. Relationship between Molecular Compositions and Rheological Properties of Neat Asphalt Binder at Low and Intermediate Temperatures. J. Mater. Civ. Eng. 2010, 22, 1288–1294. [Google Scholar] [CrossRef]
  5. Kriz, P.; Stastna, J.; Zanzotto, L. Glass Transition and Phase Stability in Asphalt Binders. Road Mater. Pavement Des. 2008, 9 (Suppl. 1), 37–65. [Google Scholar] [CrossRef]
  6. Sun, Y.; Huang, B.; Chen, J.; Jia, X.; Ding, Y. Characterizing rheological behavior of asphalt binder over a complete range of pavement service loading frequency and temperature. Constr. Build. Mater. 2016, 123, 661–672. [Google Scholar] [CrossRef]
  7. Wang, Y.; Wang, X.; Ma, Z.; Shan, L.; Zhang, C. Evaluation of the High- and Low-Temperature Performance of Asphalt Mortar Based on the DMA Method. Materials 2022, 15, 3341. [Google Scholar] [CrossRef]
  8. Caro, S.; Sánchez, D.B.; Caicedo, B. Methodology to characterise non-standard asphalt materials using DMA testing: Application to natural asphalt mixtures. Int. J. Pavement Eng. 2014, 16, 1–10. [Google Scholar] [CrossRef]
  9. Kang, Y.; Song, M.; Pu, L.; Liu, T. Rheological behaviors of epoxy asphalt binder in comparison of base asphalt binder and SBS modified asphalt binder. Constr. Build. Mater. 2015, 76, 343–350. [Google Scholar] [CrossRef]
  10. Wang, D.; Falchetto, A.C.; Riccardi, C.; Wistuba, M.P. Investigation on the low temperature properties of asphalt binder: Glass transition temperature and modulus shift factor. Constr. Build. Mater. 2020, 245, 118351. [Google Scholar] [CrossRef]
  11. Xu, J.; Fan, Z.; Lin, J.; Yang, X.; Wang, D.; Oeser, M. Predicting the low-temperature performance of asphalt binder based on rheological model. Constr. Build. Mater. 2021, 302, 124401. [Google Scholar] [CrossRef]
  12. Gunay, T.; Tomkovic, T.; Hatzikiriakos, S.G. Thermorheological properties of asphalt binders. Can. J. Chem. Eng. 2020, 98, 1803–1814. [Google Scholar] [CrossRef]
  13. Ayanarayanan, K.; Rasana, N.; Mishra, R.K. Chapter 6-Dynamic Mechanical Thermal Analysis of Polymer Nanocomposites. In Thermal and Rheological Measurement Techniques for Nanomaterials Characterization; Elsevier: Amsterdam, The Netherlands, 2017; pp. 123–157. [Google Scholar] [CrossRef]
  14. Yuan, Q.; Liu, W.; Pan, Y.; Deng, D.; Liu, Z. Characterization of Cement Asphalt Mortar for Slab Track by Dynamic Mechanical Thermoanalysis. J. Mater. Civ. Eng. 2016, 28, 04015154. [Google Scholar] [CrossRef]
  15. Zhang, Z.; Wang, P.; Wu, J. Dynamic Mechanical Properties of EVA Polymer-Modified Cement Paste at Early Age. Phys. Procedia 2012, 25, 305–310. [Google Scholar] [CrossRef]
  16. Fu, Q.; Xie, Y.; Long, G.; Niu, D.; Song, H. Dynamic mechanical thermo-analysis of cement and asphalt mortar. Powder Technol. 2017, 313, 36–43. [Google Scholar] [CrossRef]
  17. Morlat, R.; Godard, P.; Bomal, Y.; Orange, G. Dynamic mechanical thermoanalysis of latexes in cement paste. Cem. Concr. Res. 1999, 29, 847–853. [Google Scholar] [CrossRef]
  18. Yang, G.; Wang, X.; Zhou, X.; Wang, Y. Experimental Study on the Phase Transition Characteristics of Asphalt Mixture for Stress Absorbing Membrane Interlayer. Materials 2020, 13, 474. [Google Scholar] [CrossRef]
  19. You, L.; Spyriouni, T.; Dai, Q.; You, Z.; Khanal, A. Experimental and molecular dynamics simulation study on thermal, transport, and rheological properties of asphalt. Constr. Build. Mater. 2020, 265, 120358. [Google Scholar] [CrossRef]
  20. Apostolidis, P.; Elwardany, M.; Porot, L.; Vansteenkiste, S.; Chailleux, E. Glass transitions in bituminous binders. Mater. Struct. 2021, 54, 132. [Google Scholar] [CrossRef]
  21. Sultana, S.; Bhasin, A. Effect of chemical composition on rheology and mechanical properties of asphalt binder. Constr. Build. Mater. 2014, 72, 293–300. [Google Scholar] [CrossRef]
  22. Oyekunle, L.O. Influence of Chemical Composition on the Physical Characteristics of Paving Asphalts. Pet. Sci. Technol. 2007, 25, 1401–1414. [Google Scholar] [CrossRef]
  23. Zhang, M.; Hao, P.; Dong, S.; Li, Y.; Yuan, G. Asphalt binder micro-characterization and testing approaches: A review. Meas. J. Int. Meas. Confed. 2020, 151, 107255. [Google Scholar] [CrossRef]
  24. Guo, M.; Liang, M.; Sreeram, A.; Bhasin, A.; Luo, D. Characterisation of rejuvenation of various modified asphalt binders based on simplified chromatographic techniques. Int. J. Pavement Eng. 2022, 23, 4333–4343. [Google Scholar] [CrossRef]
  25. Handle, F.; Füssl, J.; Neudl, S.; Grossegger, D.; Eberhardsteiner, L.; Hofko, B.; Hospodka, M.; Blab, R.; Grothe, H. The bitumen microstructure: A fluorescent approach. Mater. Struct. 2016, 49, 167–180. [Google Scholar] [CrossRef]
  26. Wei, J.; Dong, F.; Li, Y.; Zhang, Y. Relationship analysis between surface free energy and chemical composition of asphalt binder. Constr. Build. Mater. 2014, 71, 116–123. [Google Scholar] [CrossRef]
  27. Wang, J.; Wang, T.; Hou, X.; Xiao, F. Modelling of rheological and chemical properties of asphalt binder considering SARA fraction. Fuel 2019, 238, 320–330. [Google Scholar] [CrossRef]
  28. Weigel, S.; Stephan, D. Relationships between the chemistry and the physical properties of bitumen. Road Mater. Pavement Des. 2018, 19, 1636–1650. [Google Scholar] [CrossRef]
  29. Wang, Y.; Wang, W.; Wang, L. Understanding the relationships between rheology and chemistry of asphalt binders: A review. Constr. Build. Mater. 2022, 329, 127161. [Google Scholar] [CrossRef]
  30. Wang, C.; Wang, Y. Physico-chemo-rheological characterization of neat and polymer-modified asphalt binders. Constr. Build. Mater. 2019, 199, 471–482. [Google Scholar] [CrossRef]
  31. Jiang, J.; Lu, F.; Guo, X.; Hao, P.; Wang, W.; Yu, J. Effect of SARA Fractions on Fatigue Properties of Hard Asphalt. Materials 2024, 17, 2713. [Google Scholar] [CrossRef] [PubMed]
  32. Xu, Y.; Zhan, E.; Shan, L. Effect of SARA on Rheological Properties of Asphalt Binders. J. Mater. Civ. Eng. 2019, 31, 4019086. [Google Scholar] [CrossRef]
  33. Zhang, H.; Li, Y.; Zhang, J.; Li, Z.; Chen, Z.; Pei, J.; Wang, M. Examining the rheological and adhesion performance of asphalt: Insights into the influence of SARA components. Case Stud. Constr. Mater. 2024, 21, e03427. [Google Scholar] [CrossRef]
  34. Wang, T.; Wang, J.; Hou, X.; Xiao, F. Effects of SARA fractions on low temperature properties of asphalt binders. Road Mater. Pavement Des. 2021, 22, 539–556. [Google Scholar] [CrossRef]
  35. Martin Wieser, A.; Schaur, S.H. Unterberger, Polymer-Bitumen Interaction: A Correlation Study with Six Different Bitumens to Investigate the Influence of SARA Fractions on the Phase Stability, Swelling, and Thermo-Rheological Properties of SBS-PmB. Materials 2021, 14, 1273. [Google Scholar] [CrossRef]
  36. JTG E20-2011; Standard Test Methods of Bitumen and Bituminous Mixtures for Highway Engineering. China Communications Press: Beijing, China, 2011.
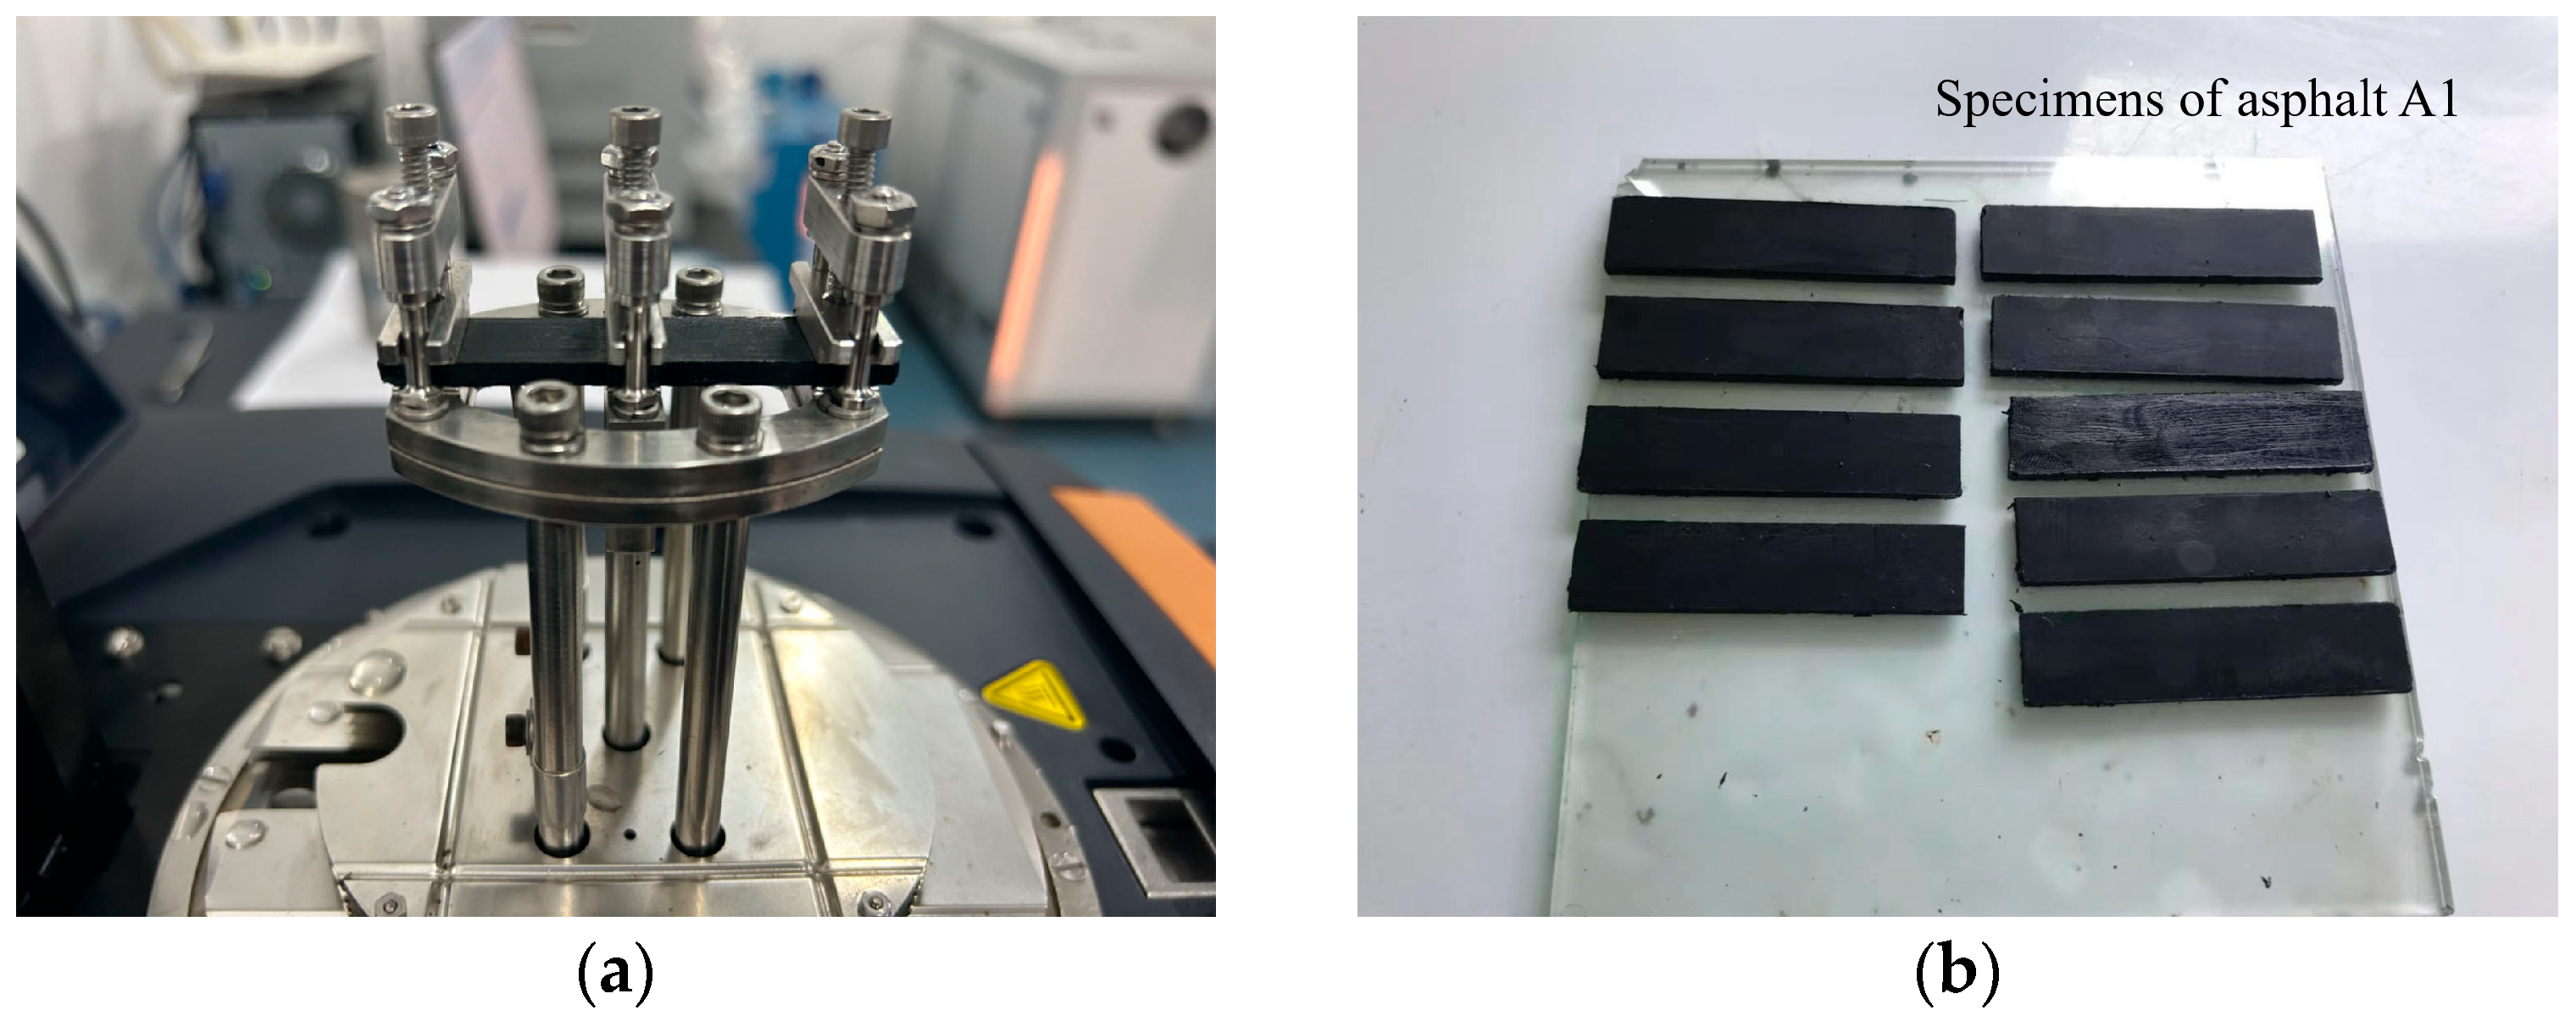
Figure 1. Double cantilever clamp (a) and asphalt binder specimens (b).
Coatings 15 01046 g001
Figure 2. Temperature spectrum of the dynamic mechanical property parameters.
Coatings 15 01046 g002
Figure 3. Pearson correlation matrix of PTTs.
Coatings 15 01046 g003
Figure 4. The range of Tg values.
Coatings 15 01046 g004
Figure 5. Relationship between Tg and ductility (15 °C) of 20/40 asphalt binders.
Coatings 15 01046 g005
Figure 6. Schematic comparison of T2 and viscosity.
Coatings 15 01046 g006
Figure 7. The range of VTI values.
Coatings 15 01046 g007
Figure 8. Pearson correlation matrix of characteristic modulus.
Coatings 15 01046 g008
Figure 9. The range of E−20 values.
Coatings 15 01046 g009
Figure 10. Relationship between Tg and E−20.
Coatings 15 01046 g010
Figure 11. Schematic comparison of E20 and lgη.
Coatings 15 01046 g011
Figure 12. Relationship between T2 and E20.
Coatings 15 01046 g012
Figure 13. The Pearson correlation between phase transition characteristics and conventional indicators.
Coatings 15 01046 g013
Figure 14. The Pearson correlation between the phase transition characteristics and the four fractions.
Coatings 15 01046 g014
Table 1. Physical properties and components of asphalt binders.
Asphalt BinderPen. (25 °C)
/0.1 mm
Softening Point/°CDuctility (15 °C)
/cm
Ductility (10 °C)
/cm
Dynamic Viscosity
(60 °C)/Pa∙s
Component Analysis/%
SaturatesAromaticsResinsAsphaltenes
A12261.10022667.738.837.316.2
A24952.2>1001050010.240.235.014.6
A36749.0>100>10022411.841.034.312.9
B13059.080115911.143.330.914.7
B23757.21008439.741.034.714.6
B34653.253053111.440.034.414.2
B47045.4>1006926612.137.737.013.2
B58844.0>1003818810.942.035.513.6
C13159.68011138.640.835.115.5
C23757.712080810.440.833.815.0
C34753.74804909.640.535.314.6
C47146.1>1008519811.043.432.013.6
C59044.7>1005114611.139.535.813.6
D11198.900-10.629.432.127.9
D21680.20059,21411.132.531.824.6
D31680.40052,80911.132.532.224.2
D43459.870153311.737.232.918.2
D53560.080137711.637.633.417.4
D64256.79088711.638.633.116.7
E12764.350340310.139.532.517.9
E24754.624846811.241.430.716.7
E34750.517541710.940.533.415.2
E44750.237044310.047.031.711.3
E53753.712065611.242.632.813.4
F16946.9>100882589.540.636.113.8
F27146.7>100>1001946.256.127.310.4
F37446.8>100>1001576.056.128.69.3
G18743.7>100551379.550.428.911.2
G28843.7>100>1001399.549.030.411.1
G38744.3>100>10015613.940.532.013.6
Table 2. Temperature scanning test setup.
Strain AmplitudeFrequencyHeating RateTemperature Range
25 με10 Hz2 °C/min−35 °C to 35 °C
Table 3. Phase transition temperature and modulus.
Asphalt BinderPhase Transition Temperature/°CVTI/°CCharacteristic Modulus/MPa
T1T0T2TgE1E0E2EgE−20E20
A1−13.52.819.06.132.5191010732368542046210
A2−16.4−2.112.1−0.328.618381043249911192890
A3−18.6−4.89.1−3.227.718641060255942190560
B1−14.90.515.83.030.7180610232408561917145
B2−16.3−1.513.40.829.7189710772589141989114
B3−17.2−2.512.2−0.629.419281095262955200499
B4−17.7−4.48.9−3.726.617771012248959184059
B5−19.1−6.07.1−6.426.11641936232960166645
C1−16.2−0.215.92.832.0201811402639302114160
C2−16.4−1.214.11.630.5195111052599042043124
C3−17.6−2.612.3−0.729.9199311312699892062104
C4−14.2−2.39.5−1.623.71698970243918183458
C5−18.5−5.77.2−5.325.717921019246992181041
D1−16.23.222.52.438.71887107326011171963324
D2−18.60.719.91.638.52069117528111182102279
D3−18.7−0.417.90.336.61965111626810751997219
D4−19.5−3.612.4−3.431.82020114727511342035115
D5−20.2−4.311.5−3.531.718501051252999184695
D6−20.3−4.910.4−4.130.7195011092671046194186
E1−21.4−5.310.9−4.732.3184410472511013180290
E2−20.1−4.810.6−3.430.718801067253969187680
E3−19.8−4.311.2−4.431.01692963233971169885
E4−20.2−4.610.9−4.431.11733986238971172883
E5−19.5−3.412.7−1.732.1192310902589721937110
F1−18.3−4.29.9−2.228.1204911652811000210477
F2−15.4−0.913.62.529.0191610872578382029113
F3−15.6−1.213.32.328.9189910782578222007109
G1−18.0−4.59.0−4.127.01662944226920171551
G2−17.9−4.29.6−3.427.41650935220882170450
G3−18.3−5.37.6−5.425.91699970240978174850
Table 4. Goodness of fit results.
Goodness of Fit Results
TgT2E−20E20
Multiple R0.75910.88300.70430.9149
R20.57630.77980.49600.8370
Adjusted R20.50850.74450.41540.8109
Standard error2.21361.9071102.329.4
Observations30303030
Table 5. ANOVA results.
DSSSMSFp
TgRegression4166.641.78.501.8 × 10−4
Residual25122.54.9
Total29289.1
T2Regression4321.980.522.136.6 × 10−8
Residual2590.93.6
Total29412.9
E−20Regression4257,519.064,379.76.151.4 × 10−3
Residual25261,632.410,465.3
Total29519,151.4
E20Regression4111,246.127,811.532.101.6 × 10−9
Residual2521,662.3866.5
Total29132,908.4
Disclaimer/Publisher’s Note: The statements, opinions and data contained in all publications are solely those of the individual author(s) and contributor(s) and not of MDPI and/or the editor(s). MDPI and/or the editor(s) disclaim responsibility for any injury to people or property resulting from any ideas, methods, instructions or products referred to in the content.