
Grain Refinement Caused by Dynamic Recrystallization Under Pulsed-Wave Laser Multi-Layer Cyclic Thermal Load

 ,
,
Abstract
1. Introduction
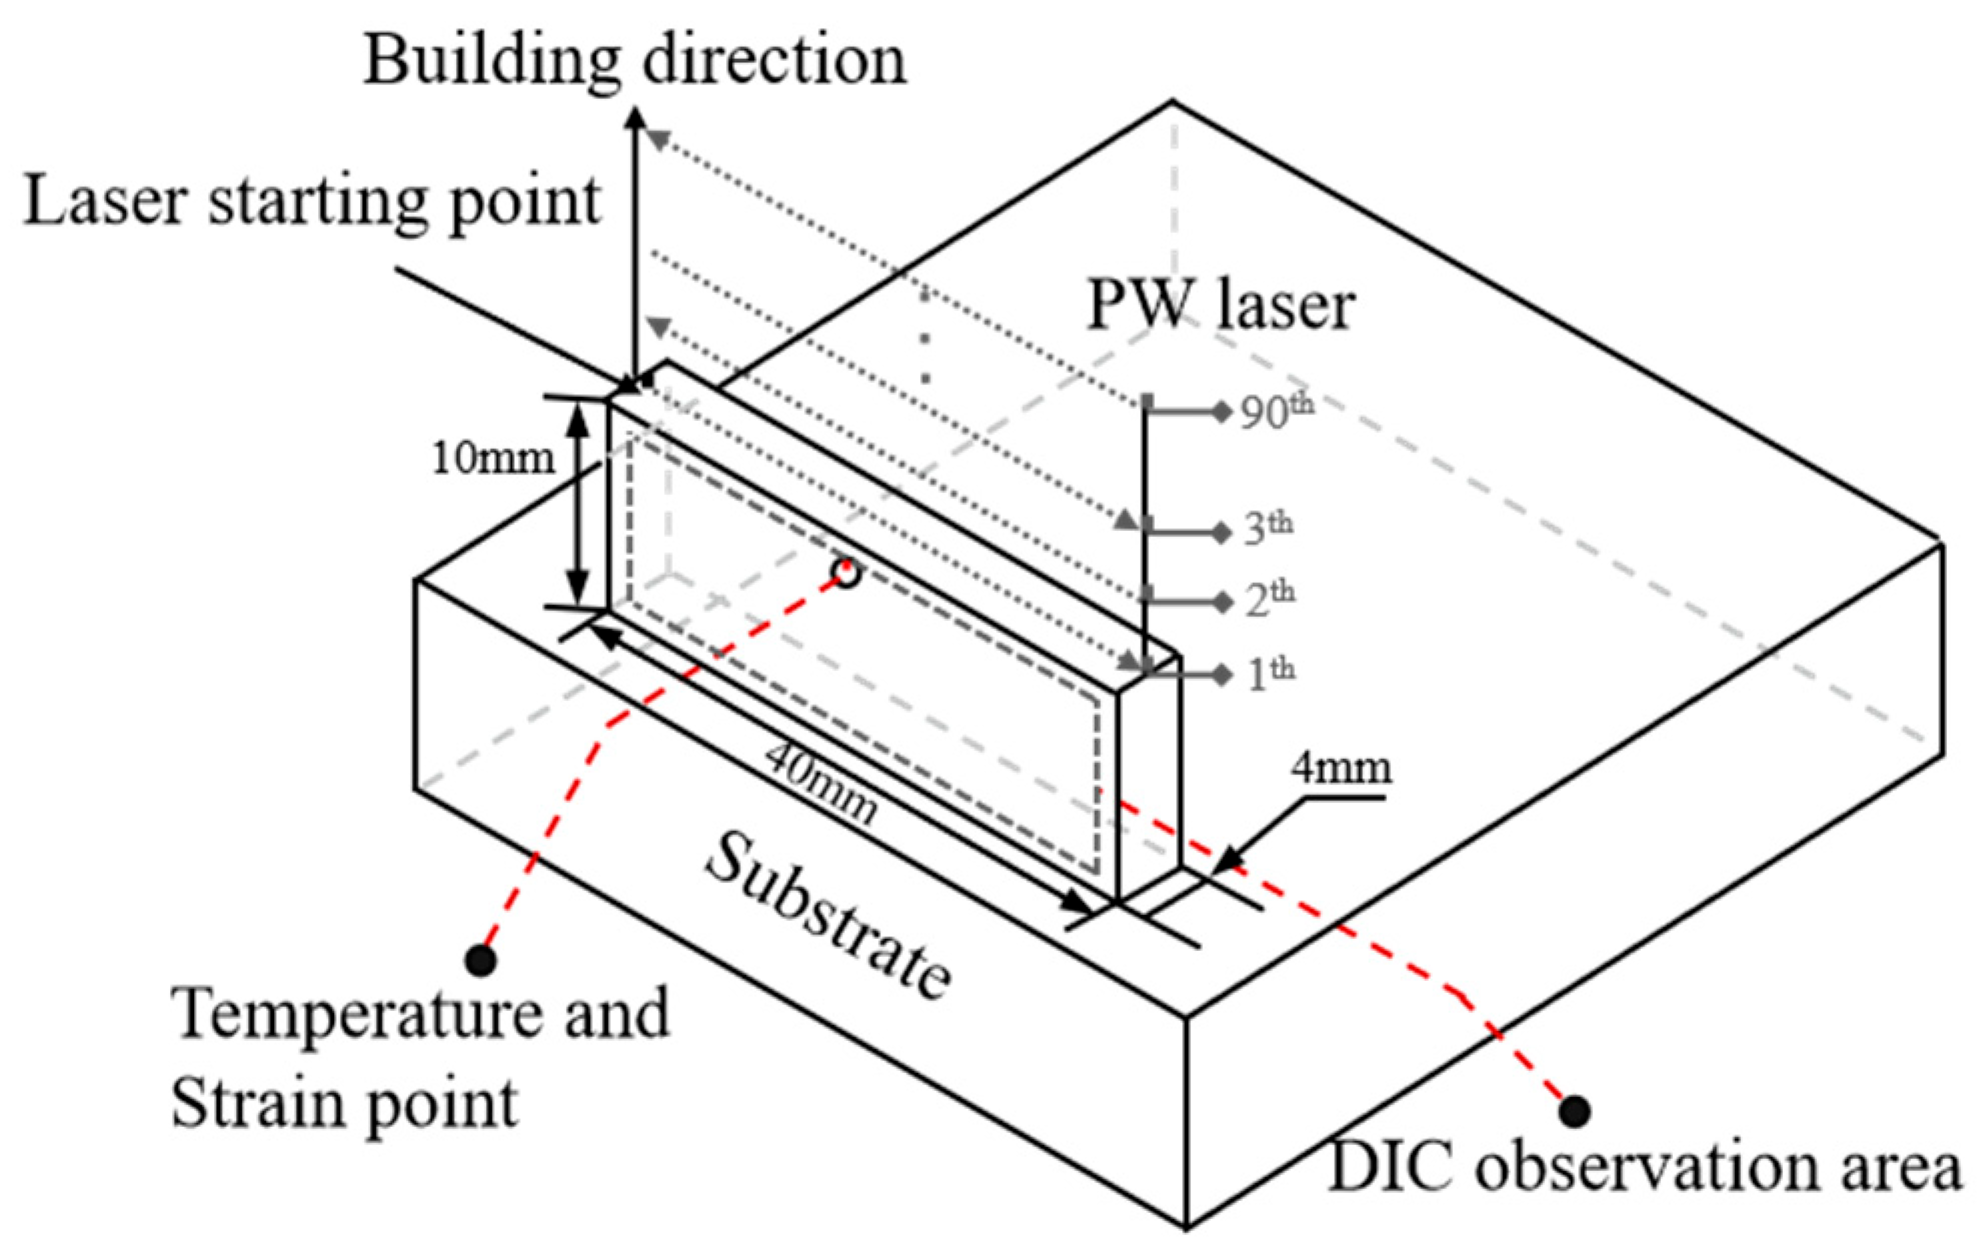
2. Experimental
3. Results and Discussion
3.1. Thermo-Mechanical Response
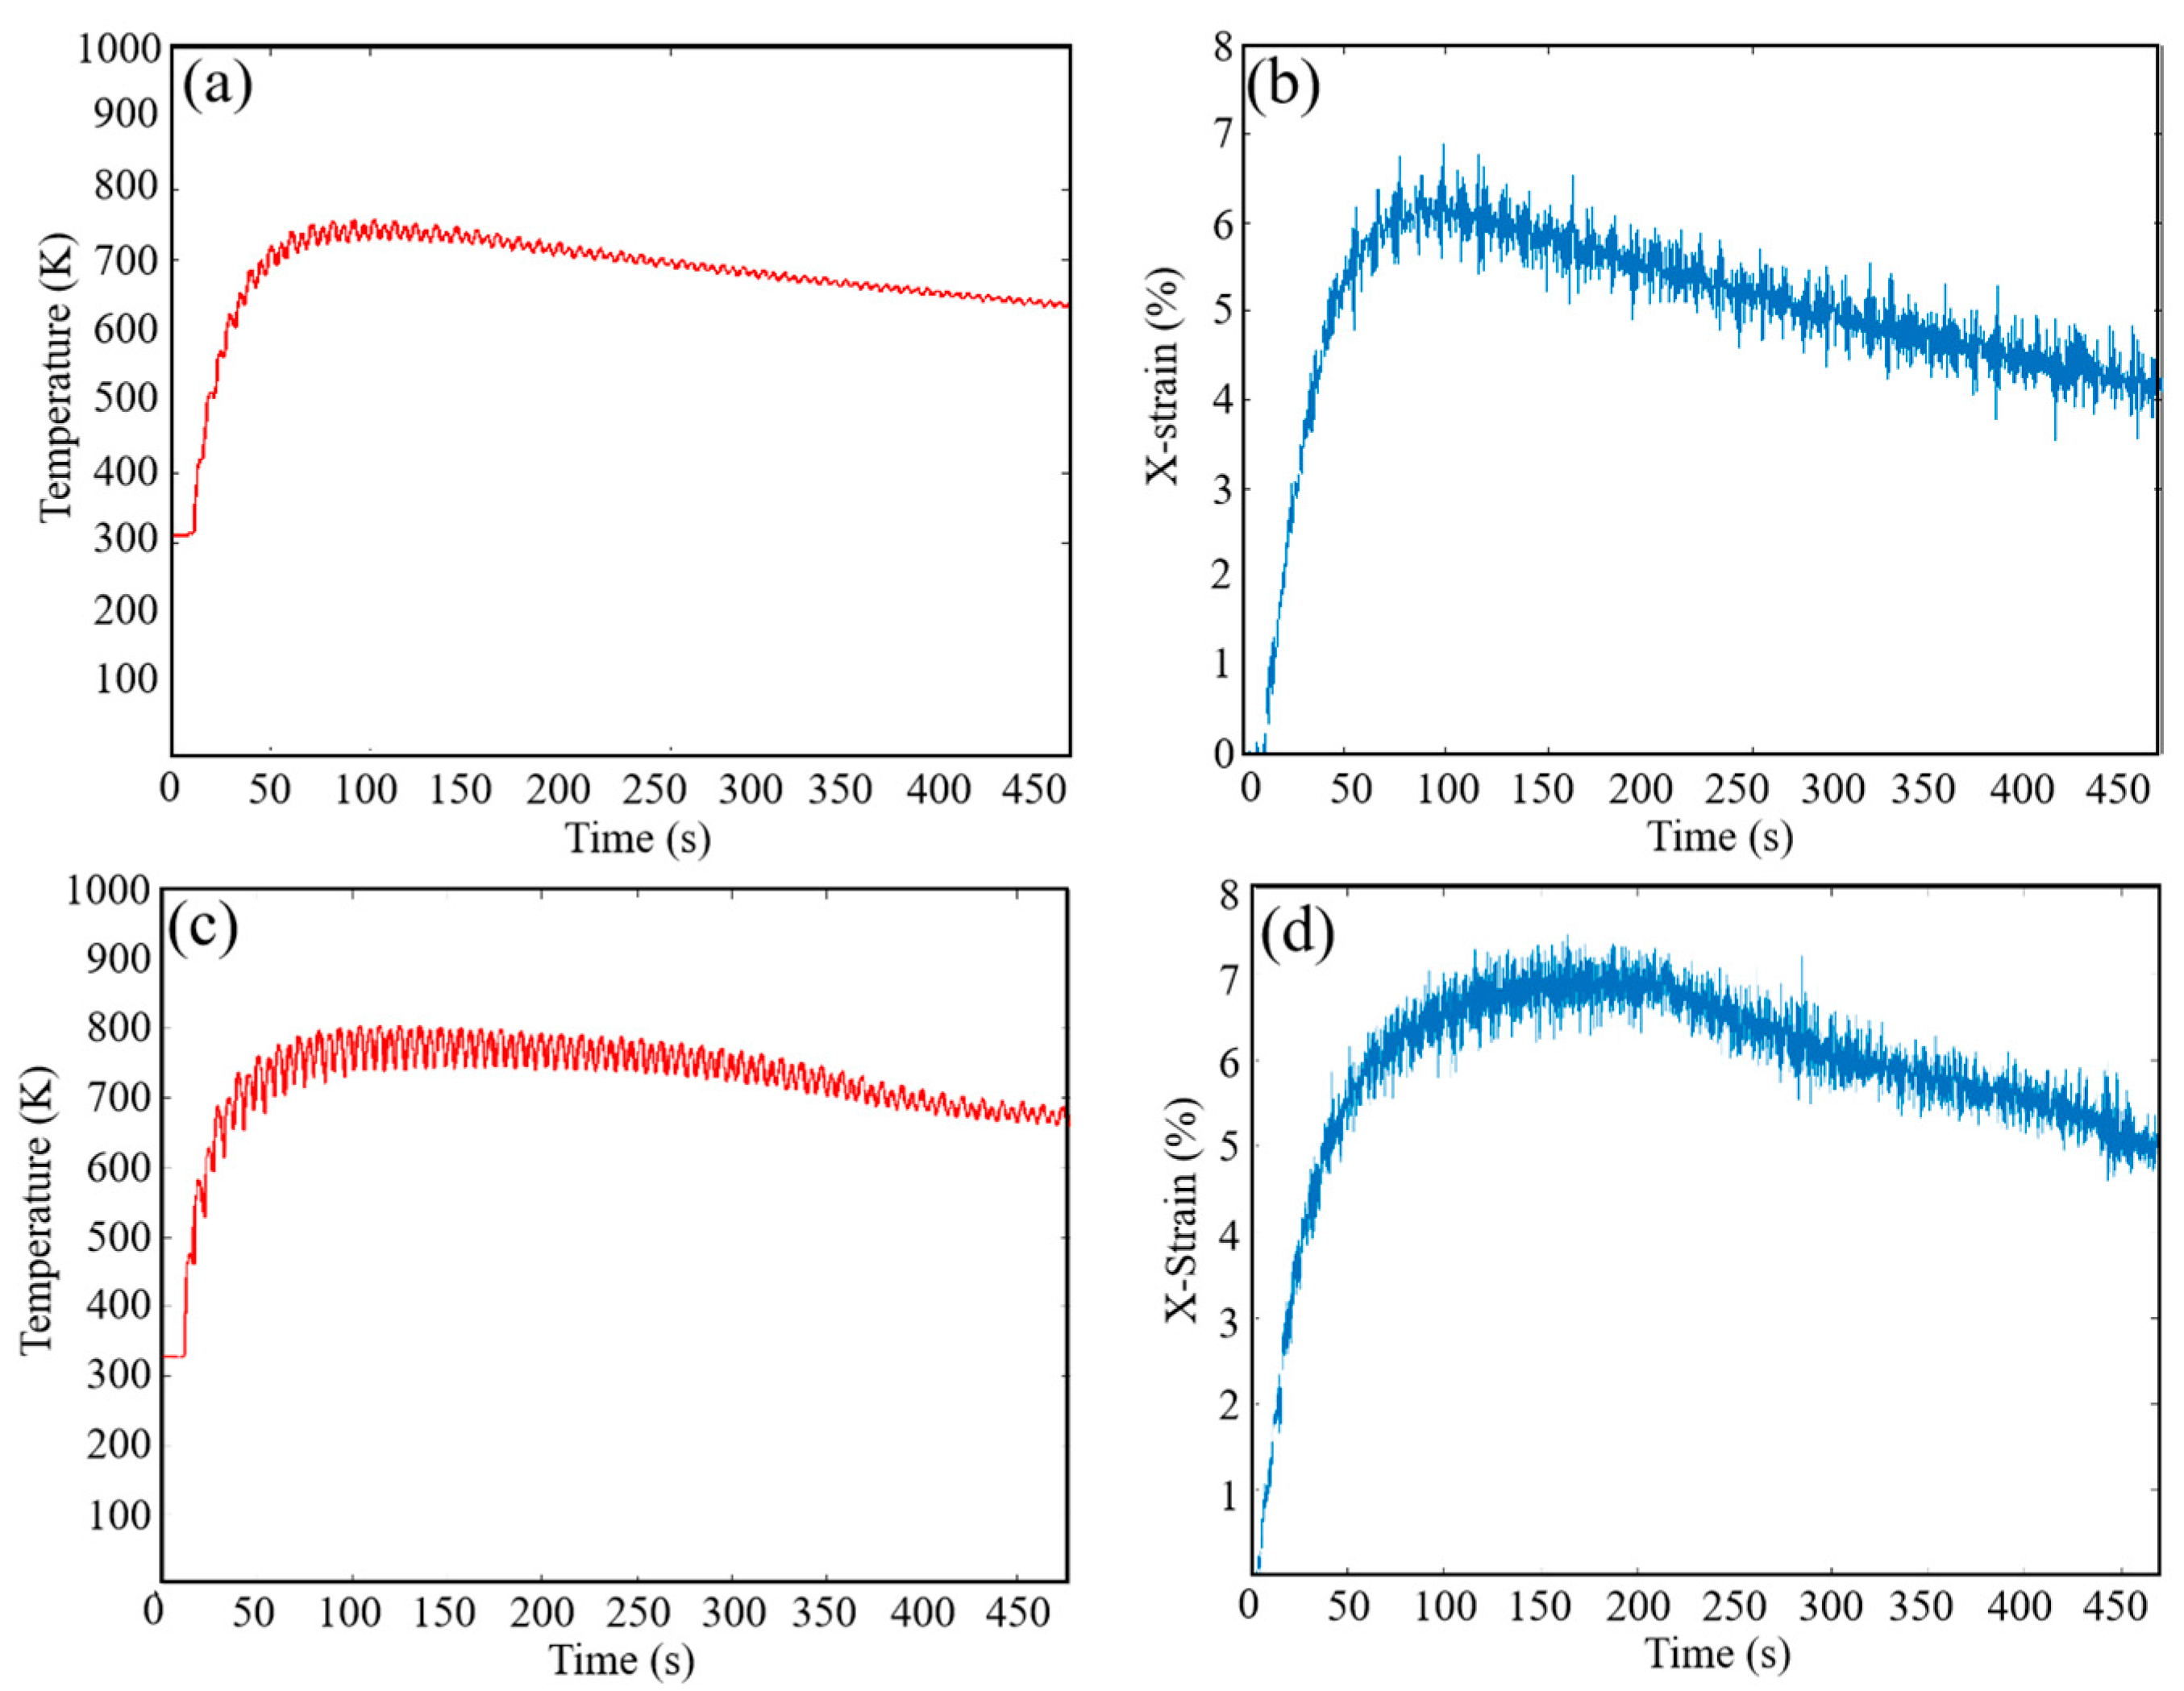
3.1.1. In Situ Temperature
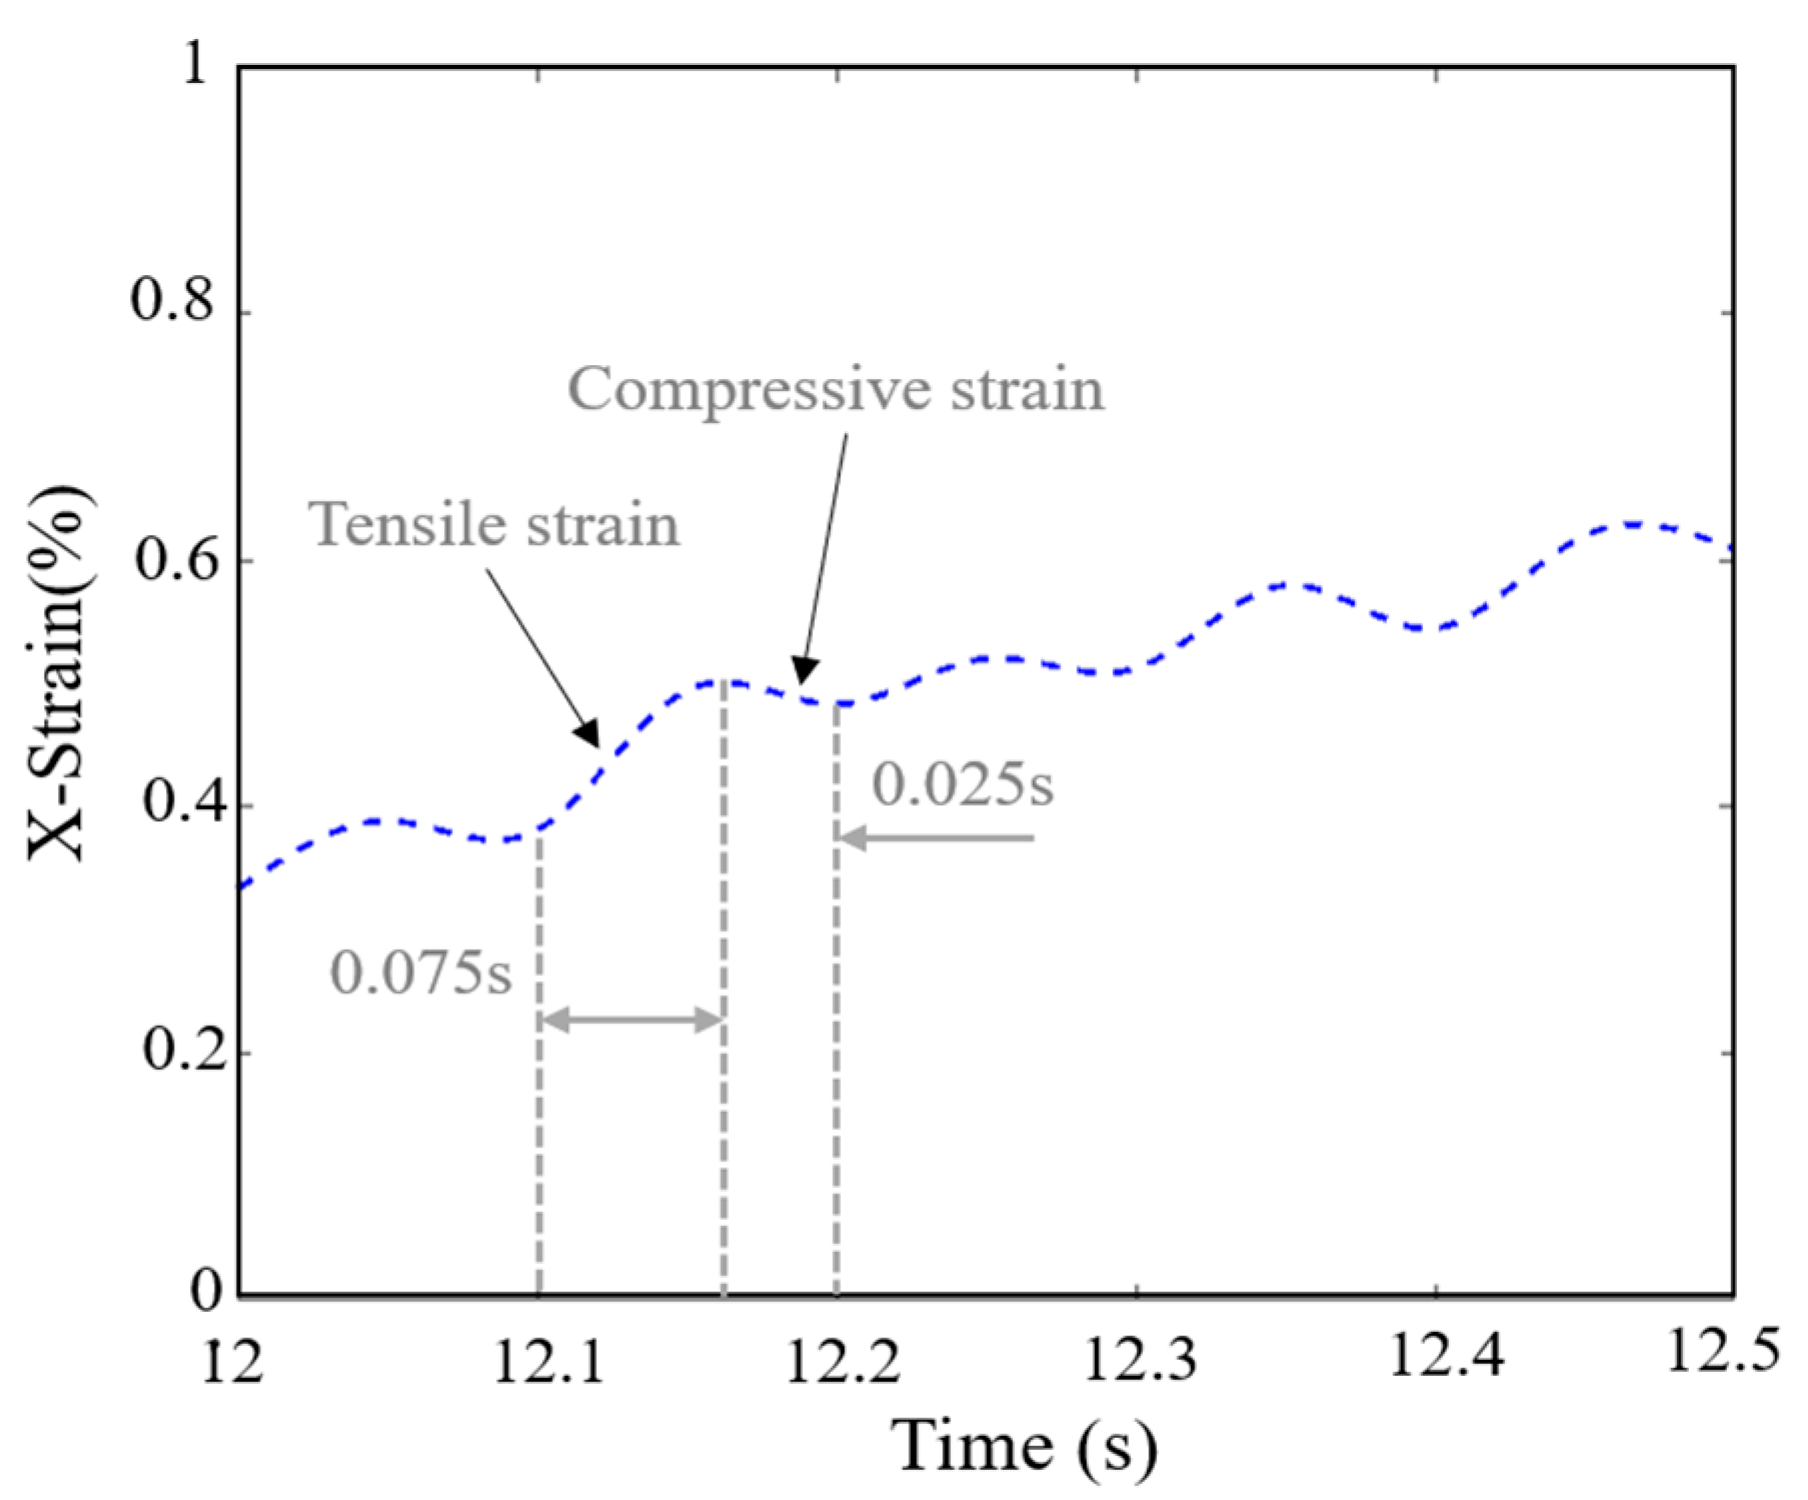
3.1.2. In Situ Strain
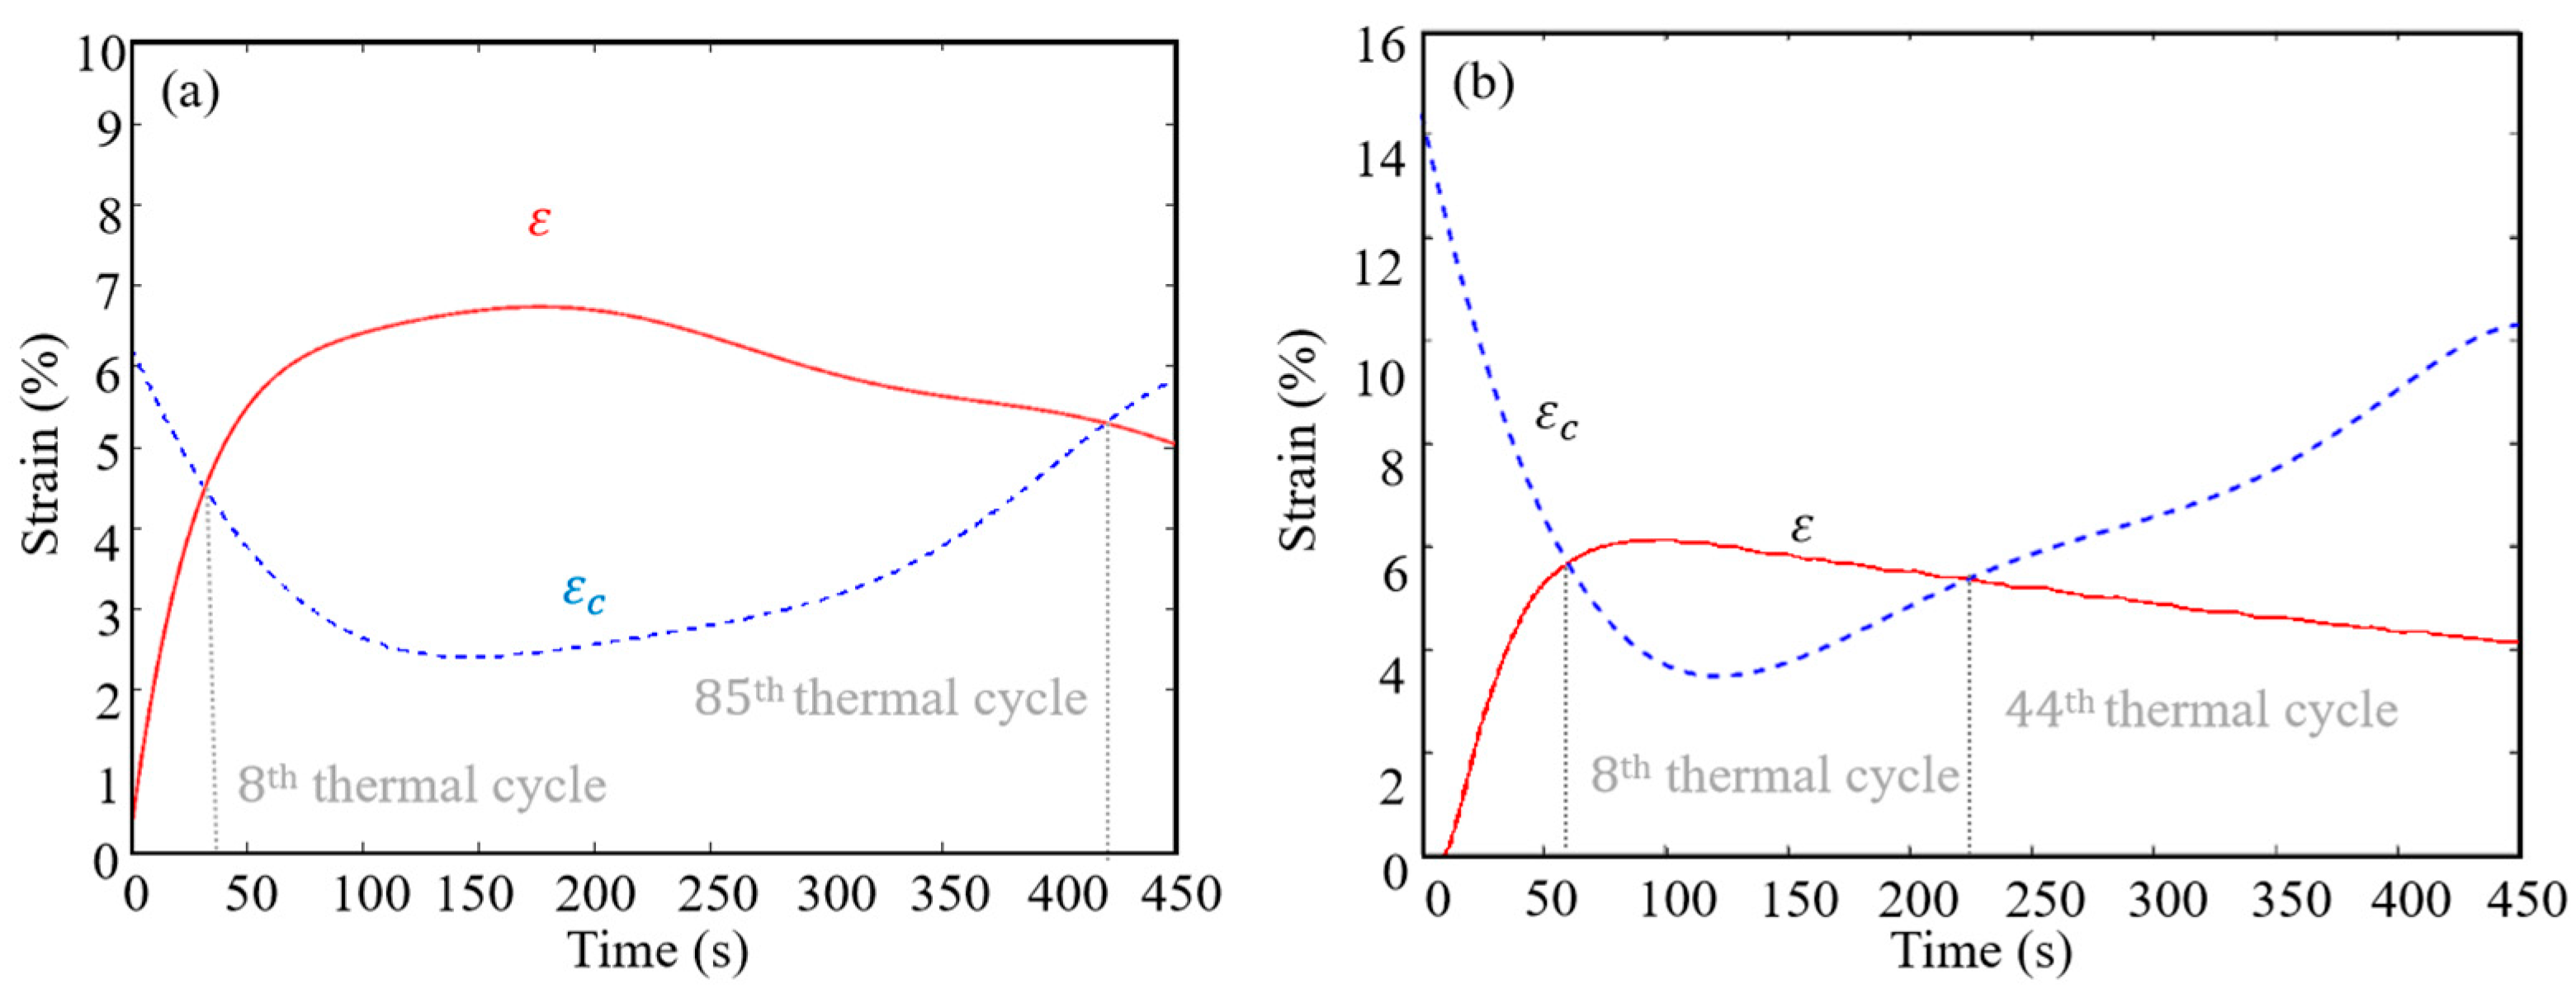
3.1.3. Conditions for the Activation of Dynamic Recrystallization
3.2. Evolution of Microstructure and Mechanical Property
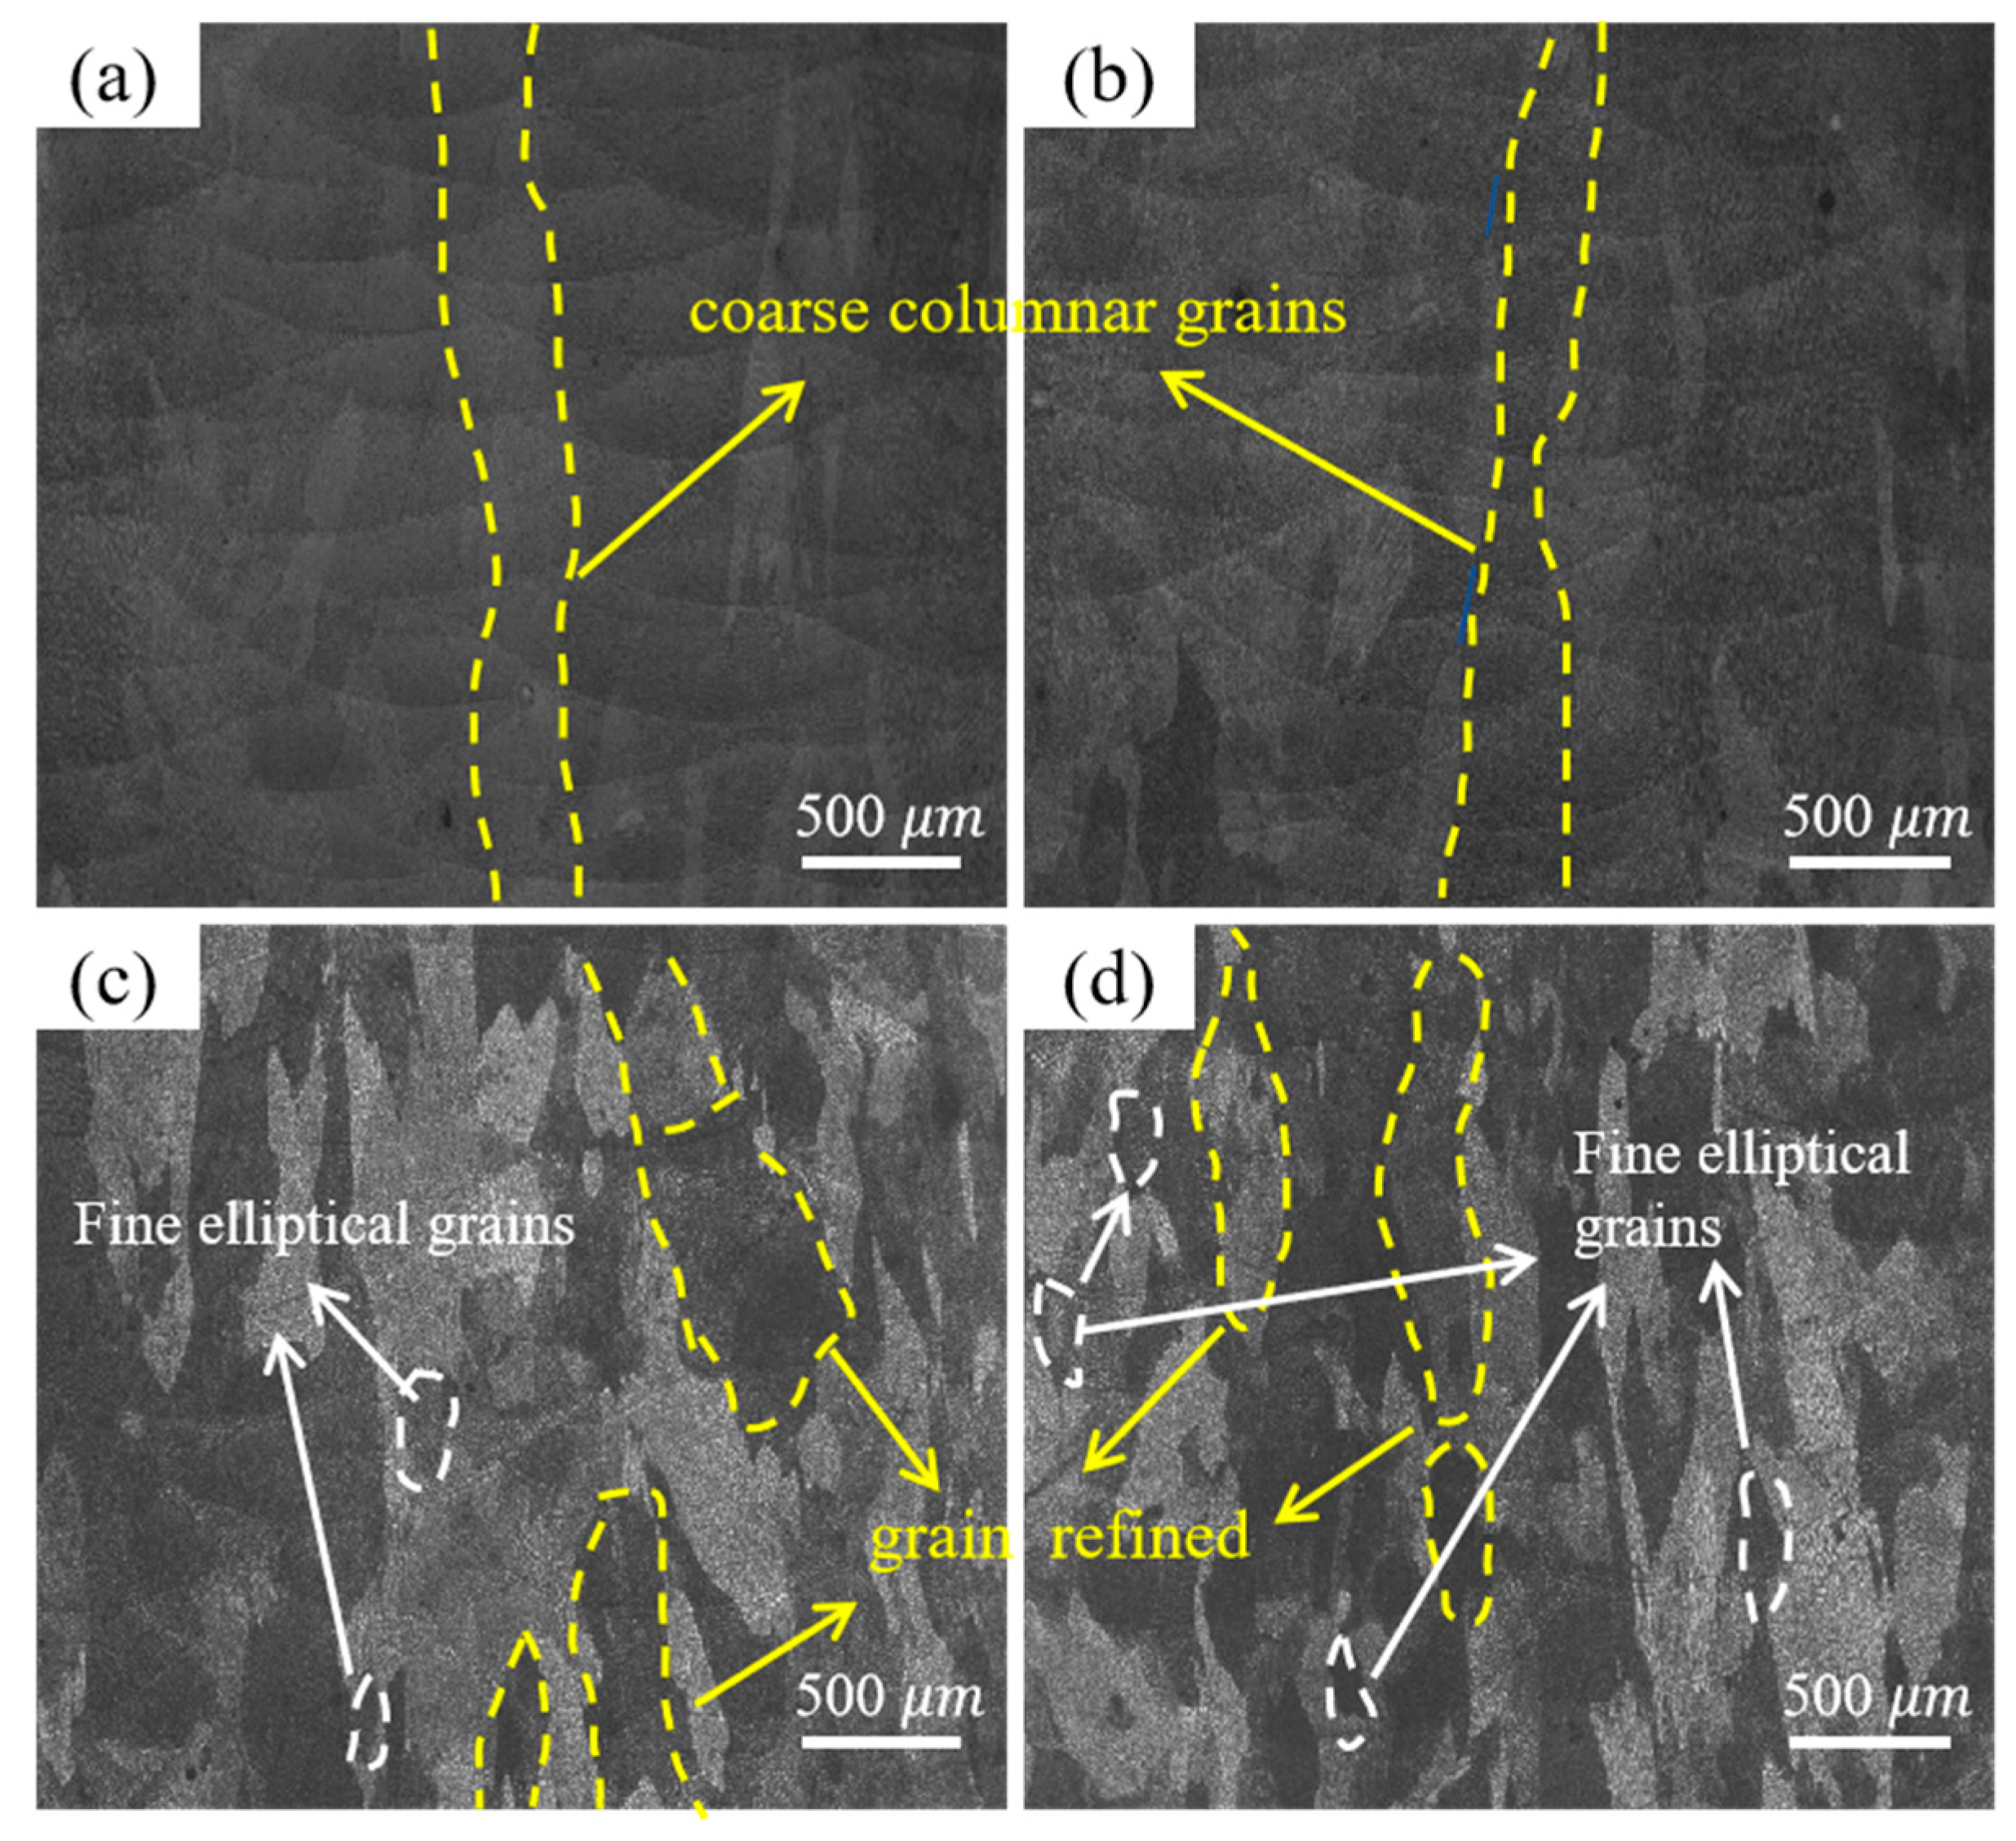
3.2.1. Grain Morphology and Size
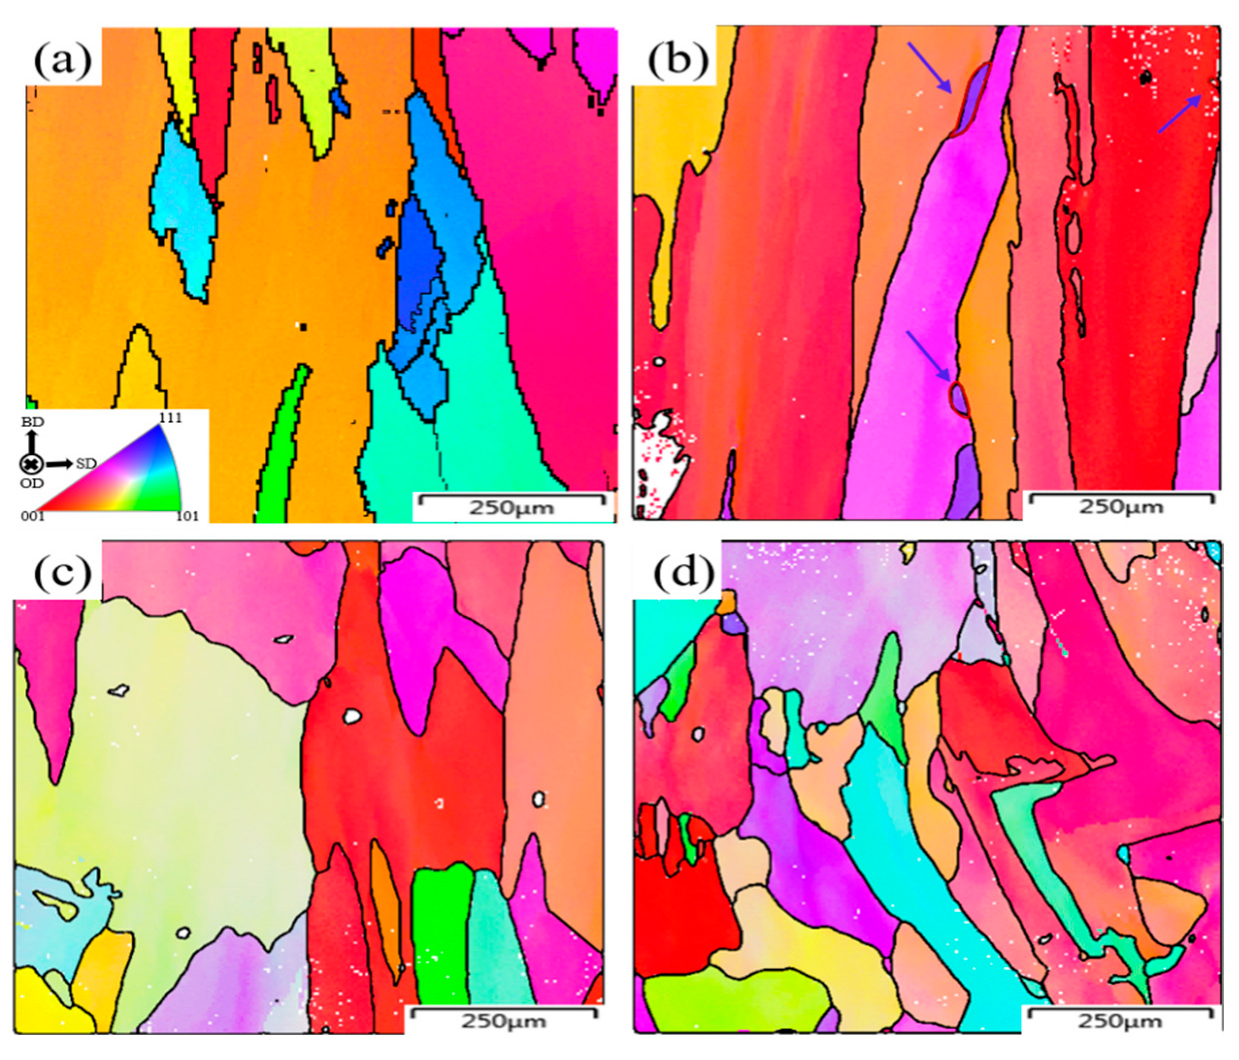
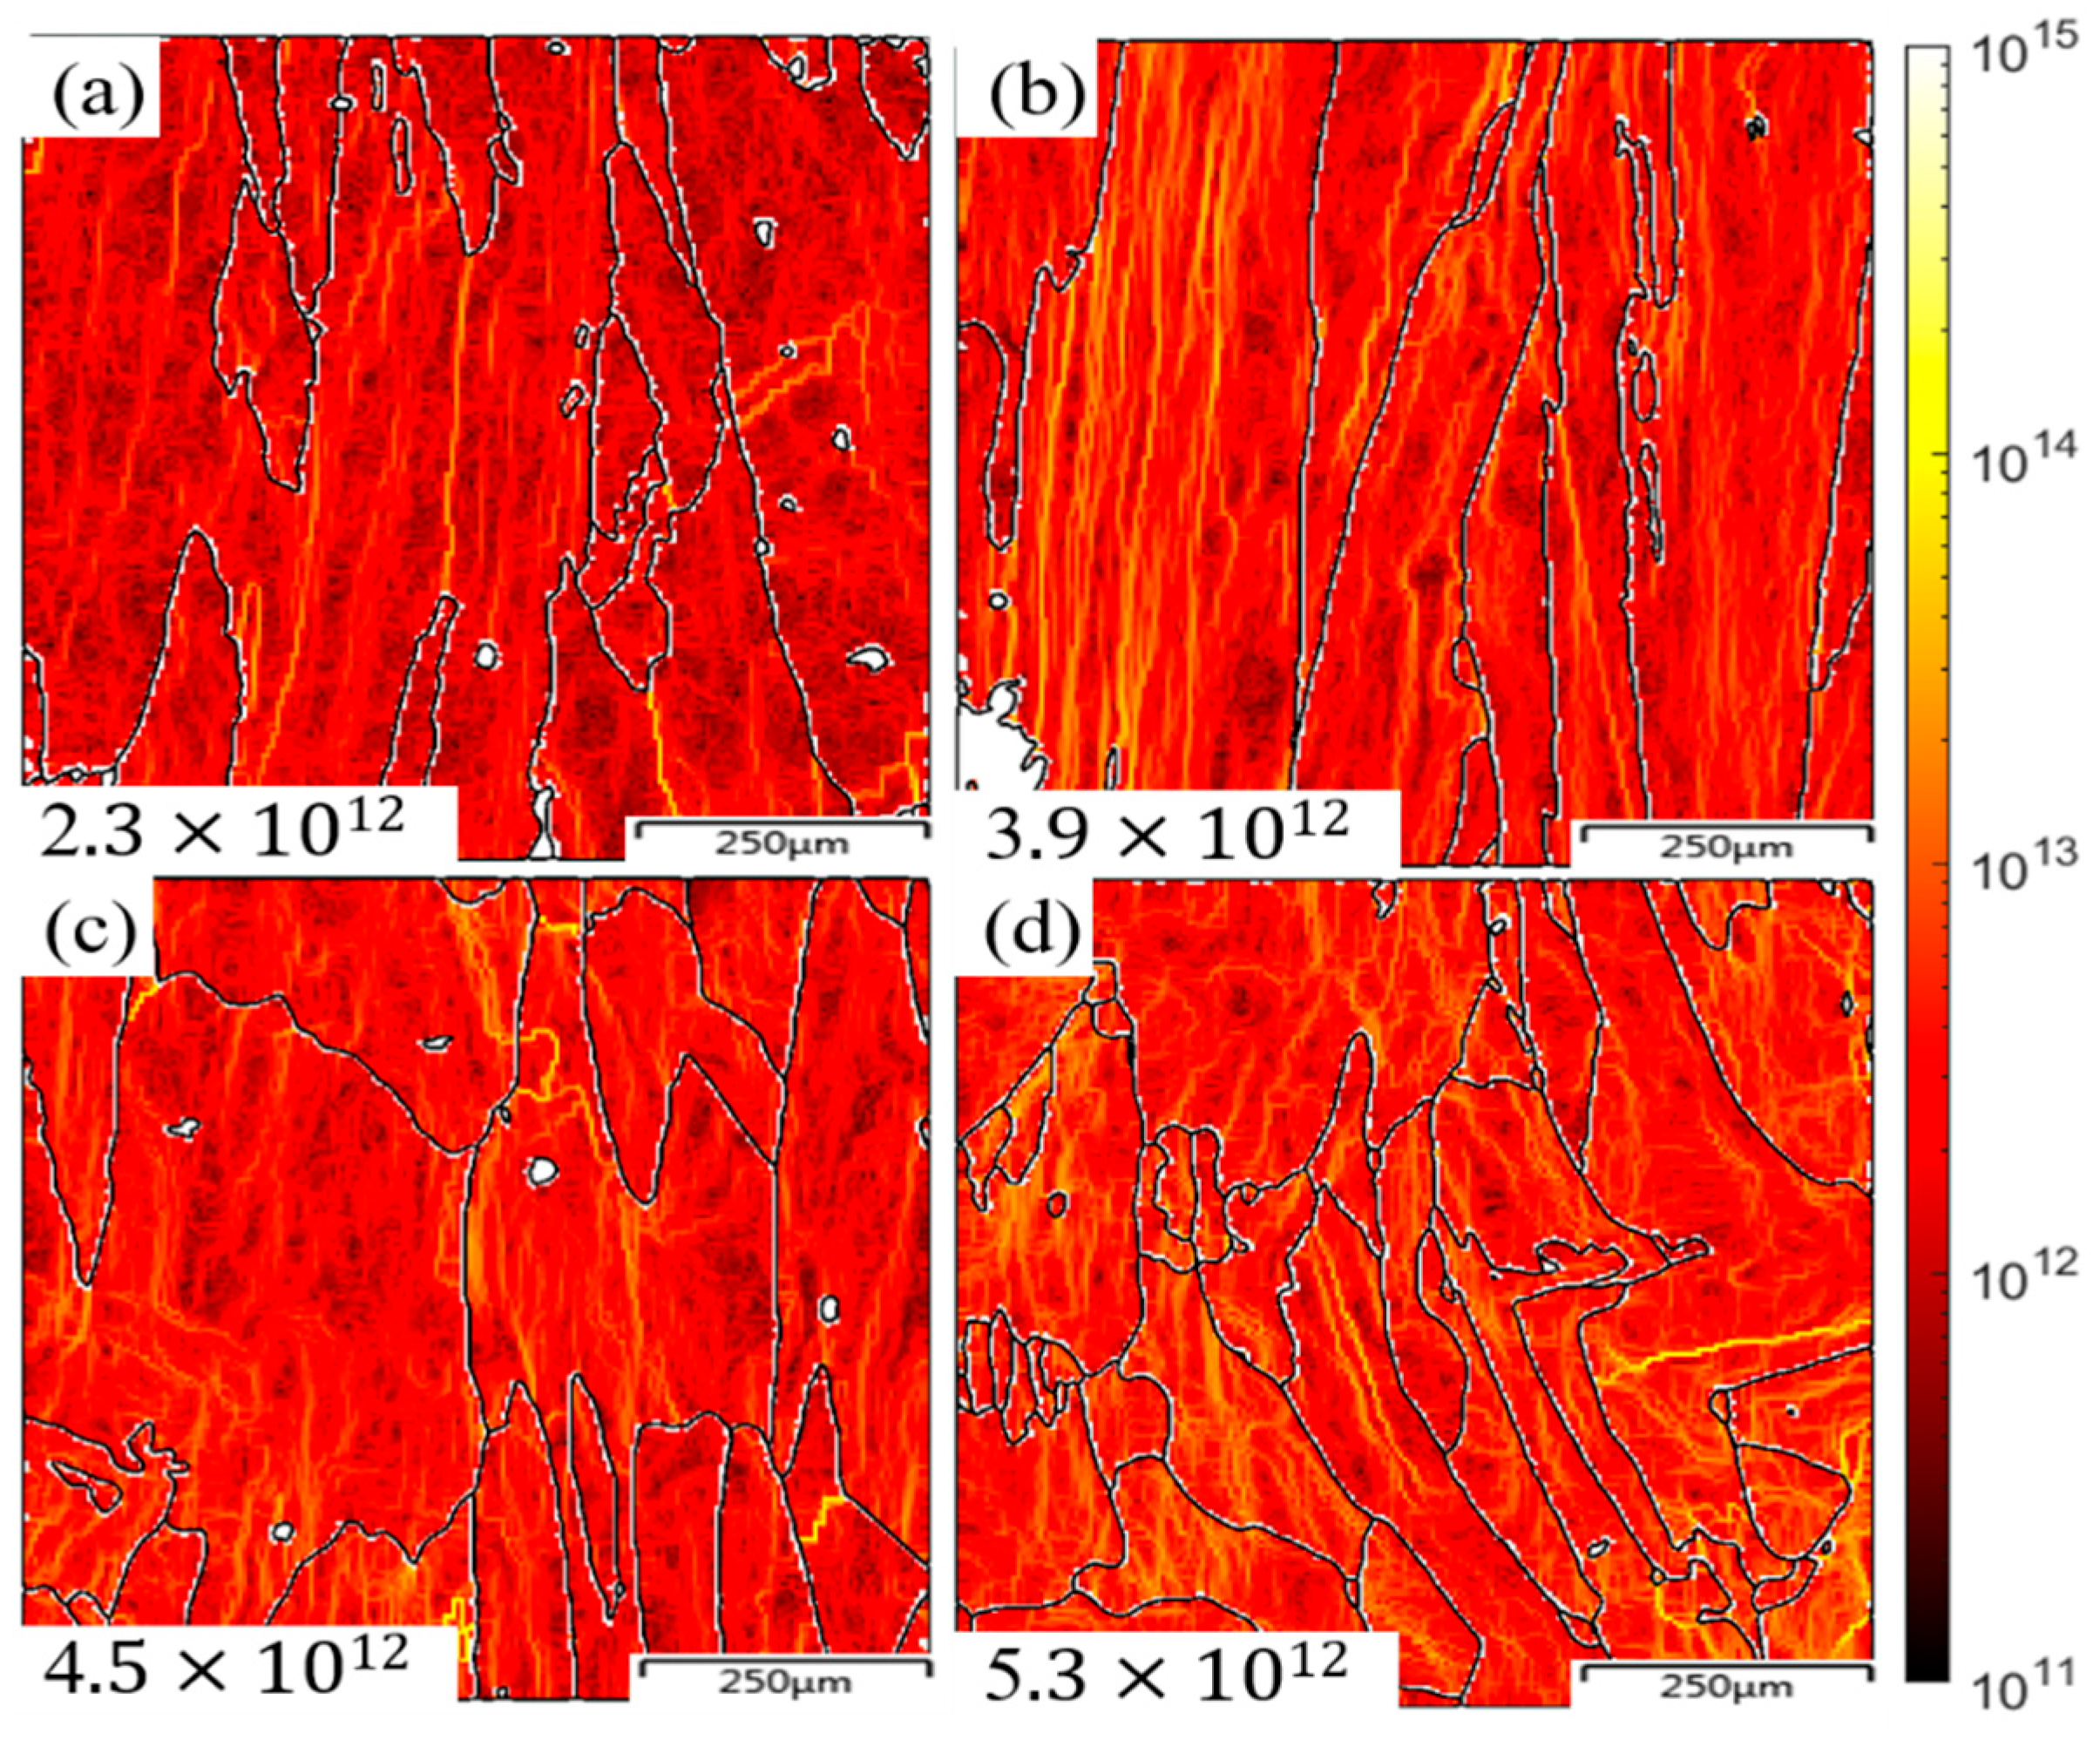
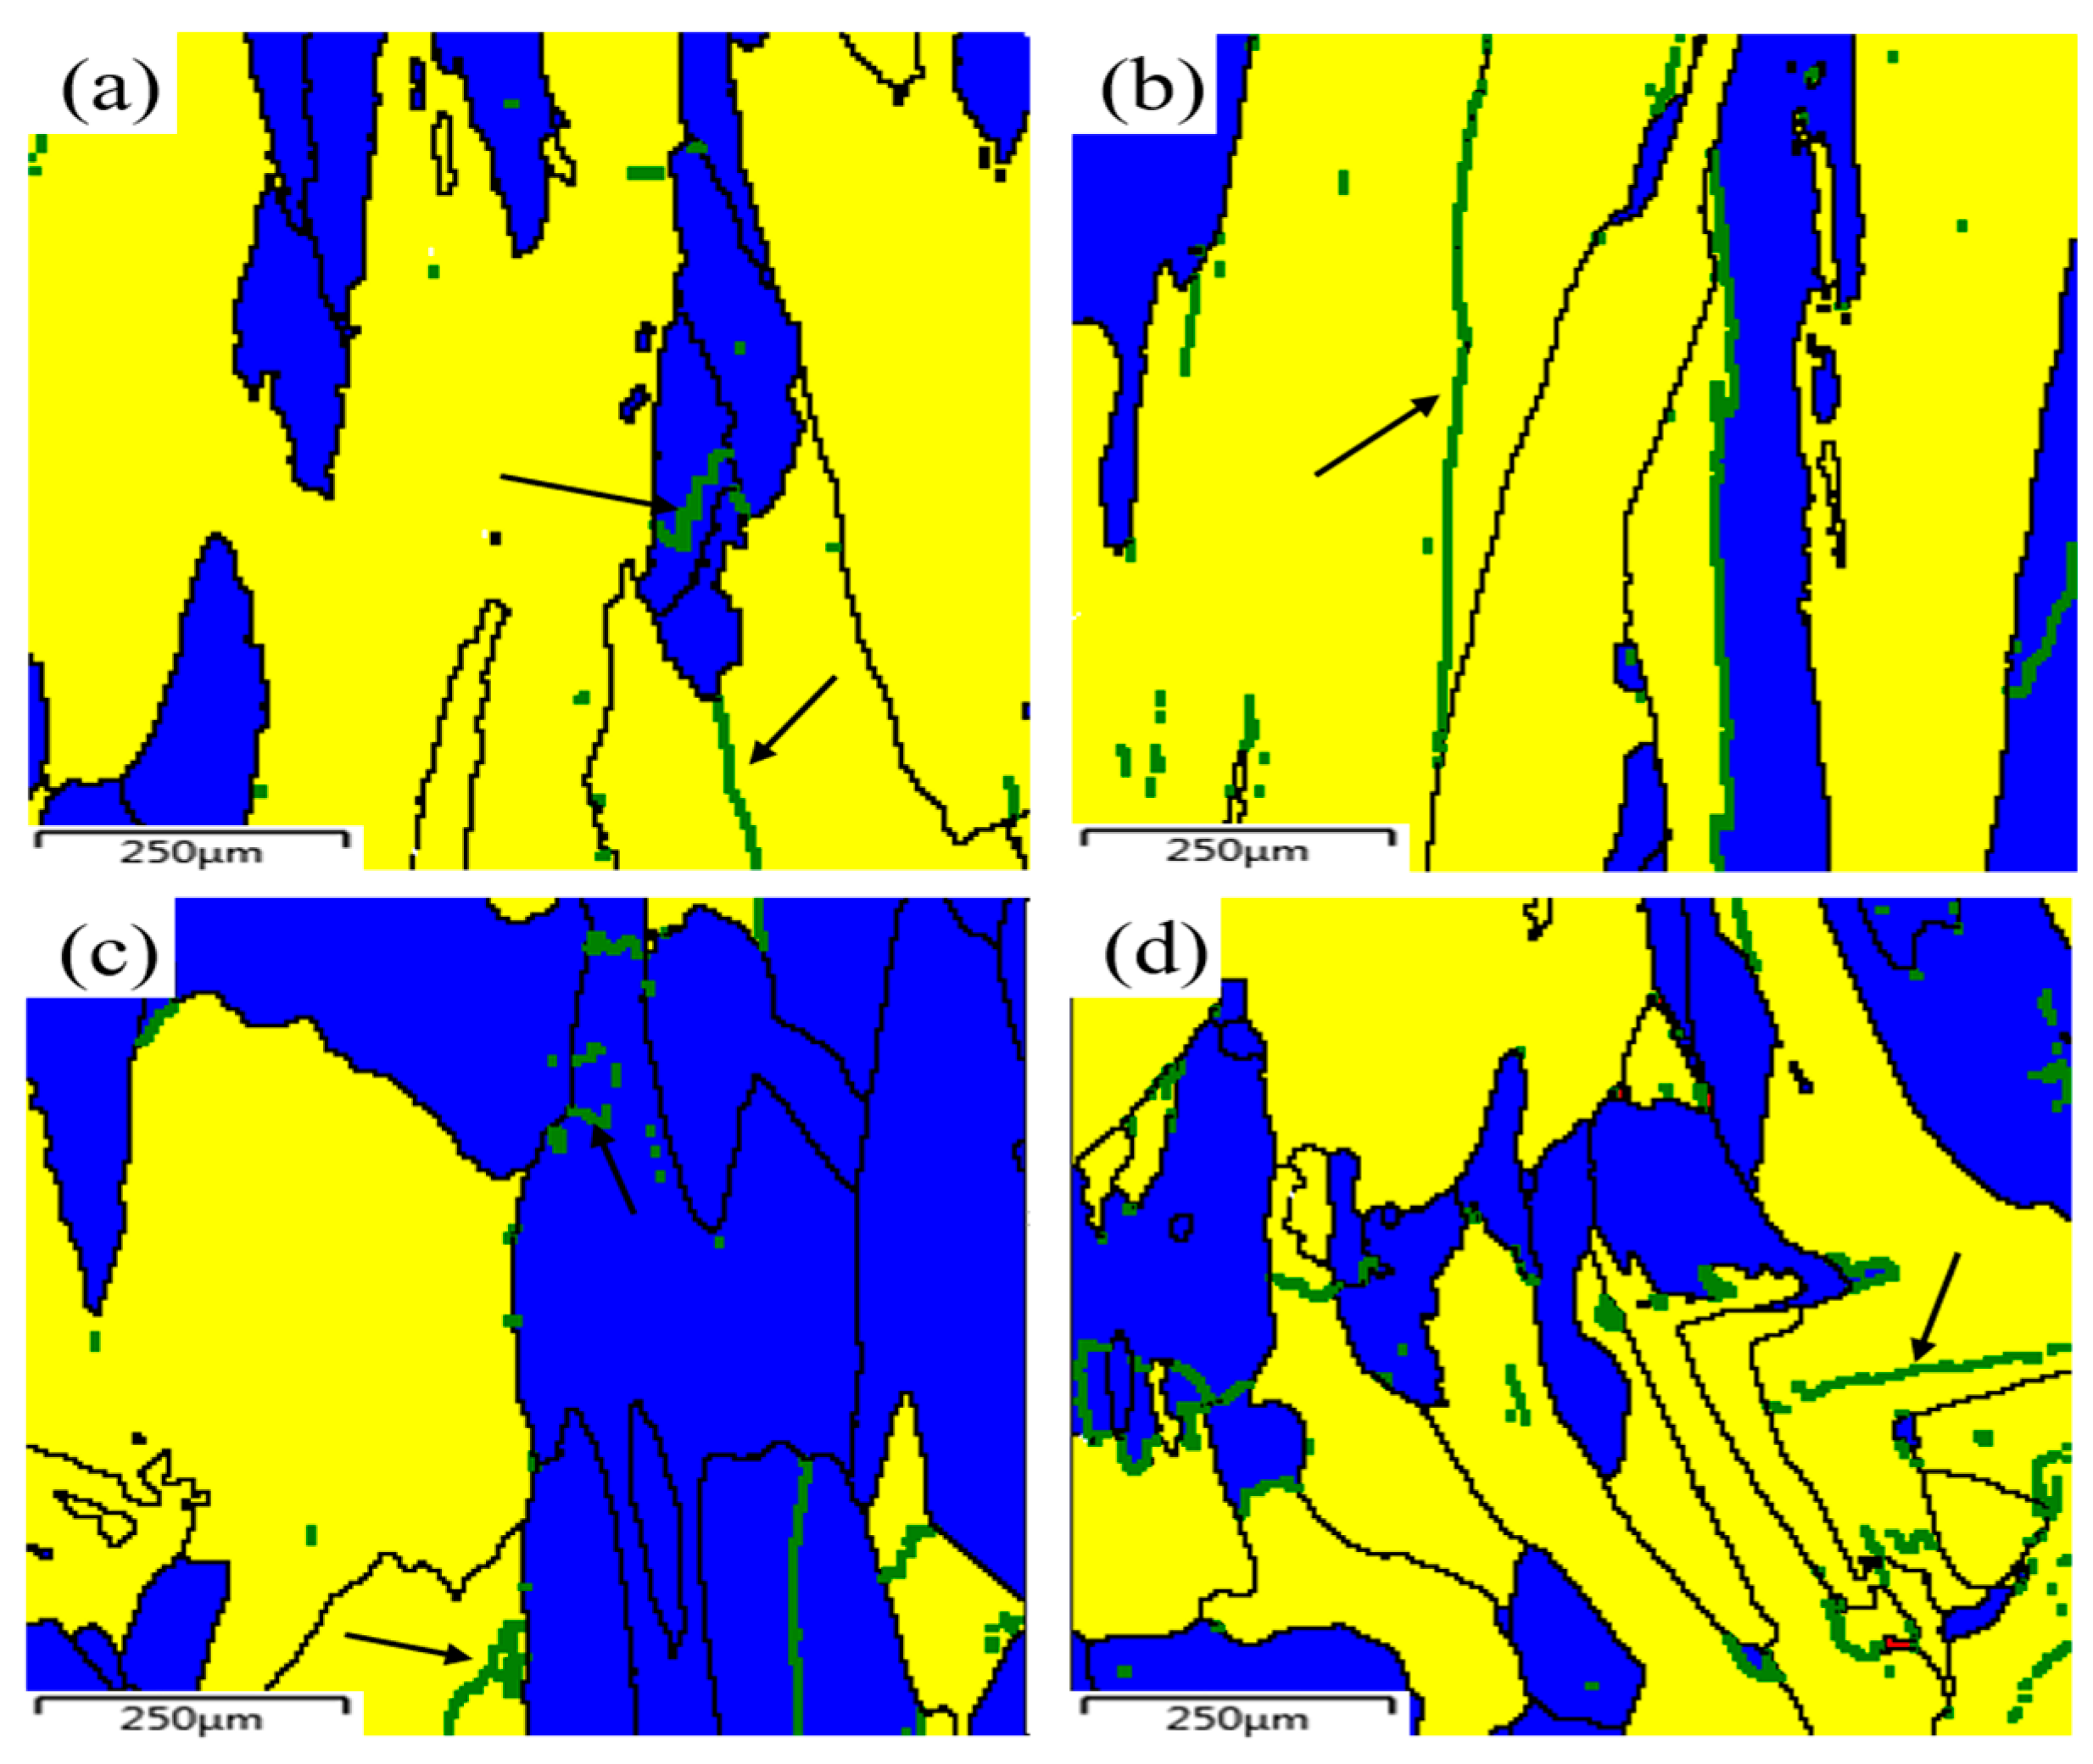
3.2.2. GND and Grain Misorientations
3.2.3. Hardness and Mechanical Properties
3.3. Effect of Pulsed Laser Parameters on Microstructure and Hardness of Thermal Cycle Samples
3.3.1. Frequency
3.3.2. Duty Cycle
3.3.3. Hardness
4. Conclusions
- (1)
- DDRX is activated from the 8th to 44th thermal cycles of PW laser with temperature evolving in the range of 680 K–750 K–640 K and the corresponding thermal strain evolving in the range of 5.6%–6.2%–5.2%. Compared with CW laser, the improvement of and the decline in makes the DDRX conditions more rigorous and the duration shorter.
- (2)
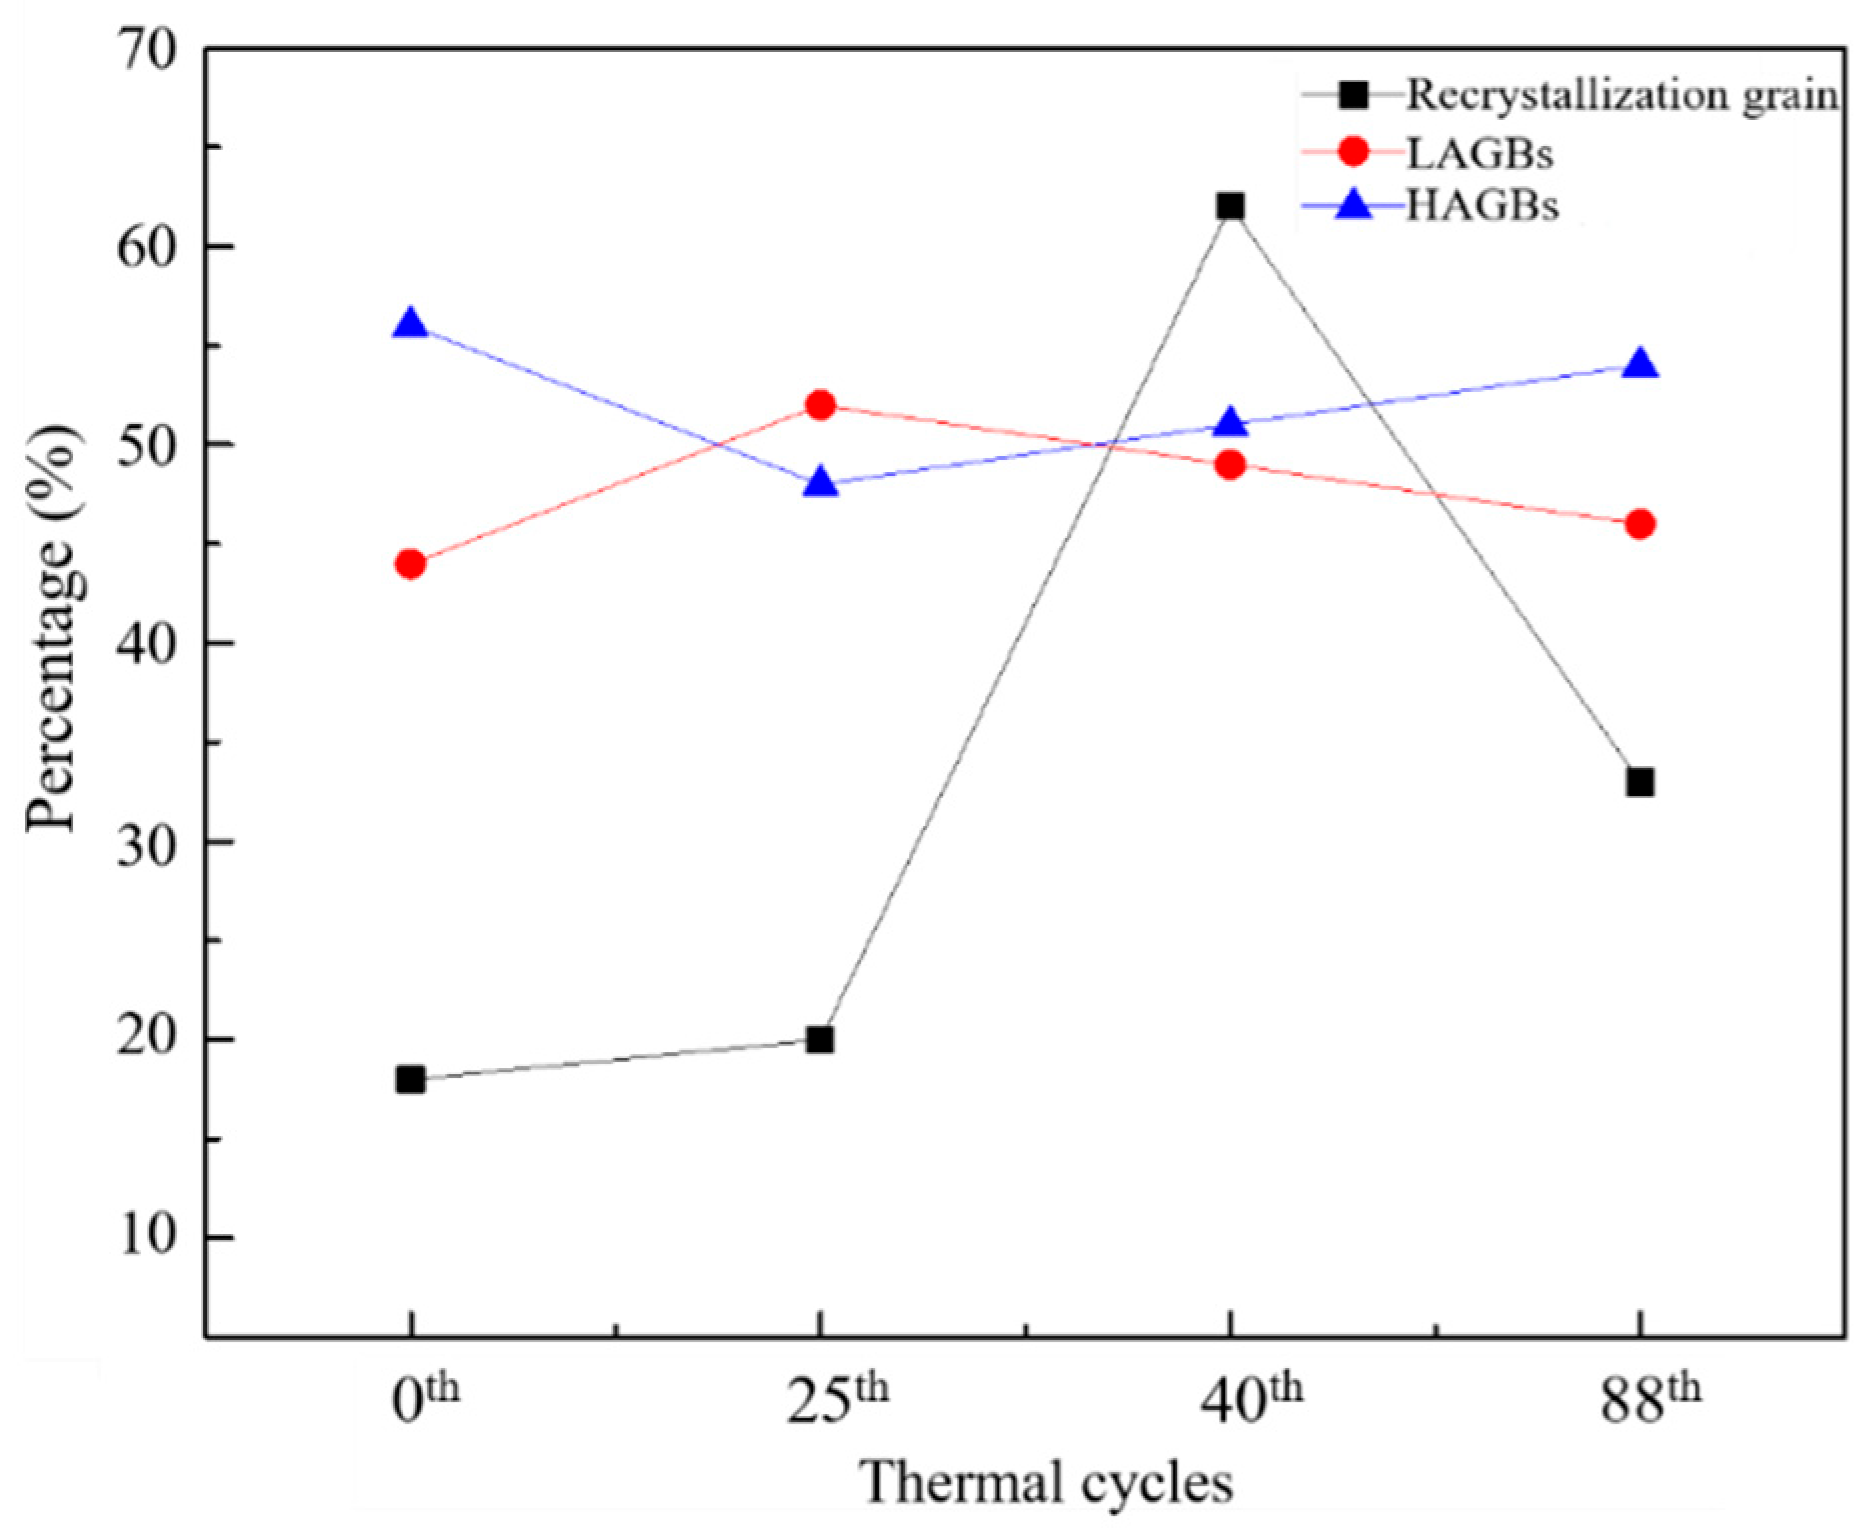
- During the process of PW laser thermal cycling, the original solidified grains undergo DRV, DDRX, and CDRX successively. DRV can make a large number of sub-grain structures inside the grains to prepare for the subsequent occurrence of CDRX. When DDRX is activated, DRV does not stop, but occurs simultaneously with DDRX. Meanwhile, the occurrence of CDRX makes the LAGBs gradually rotate and merge into HAGBs.
- (3)
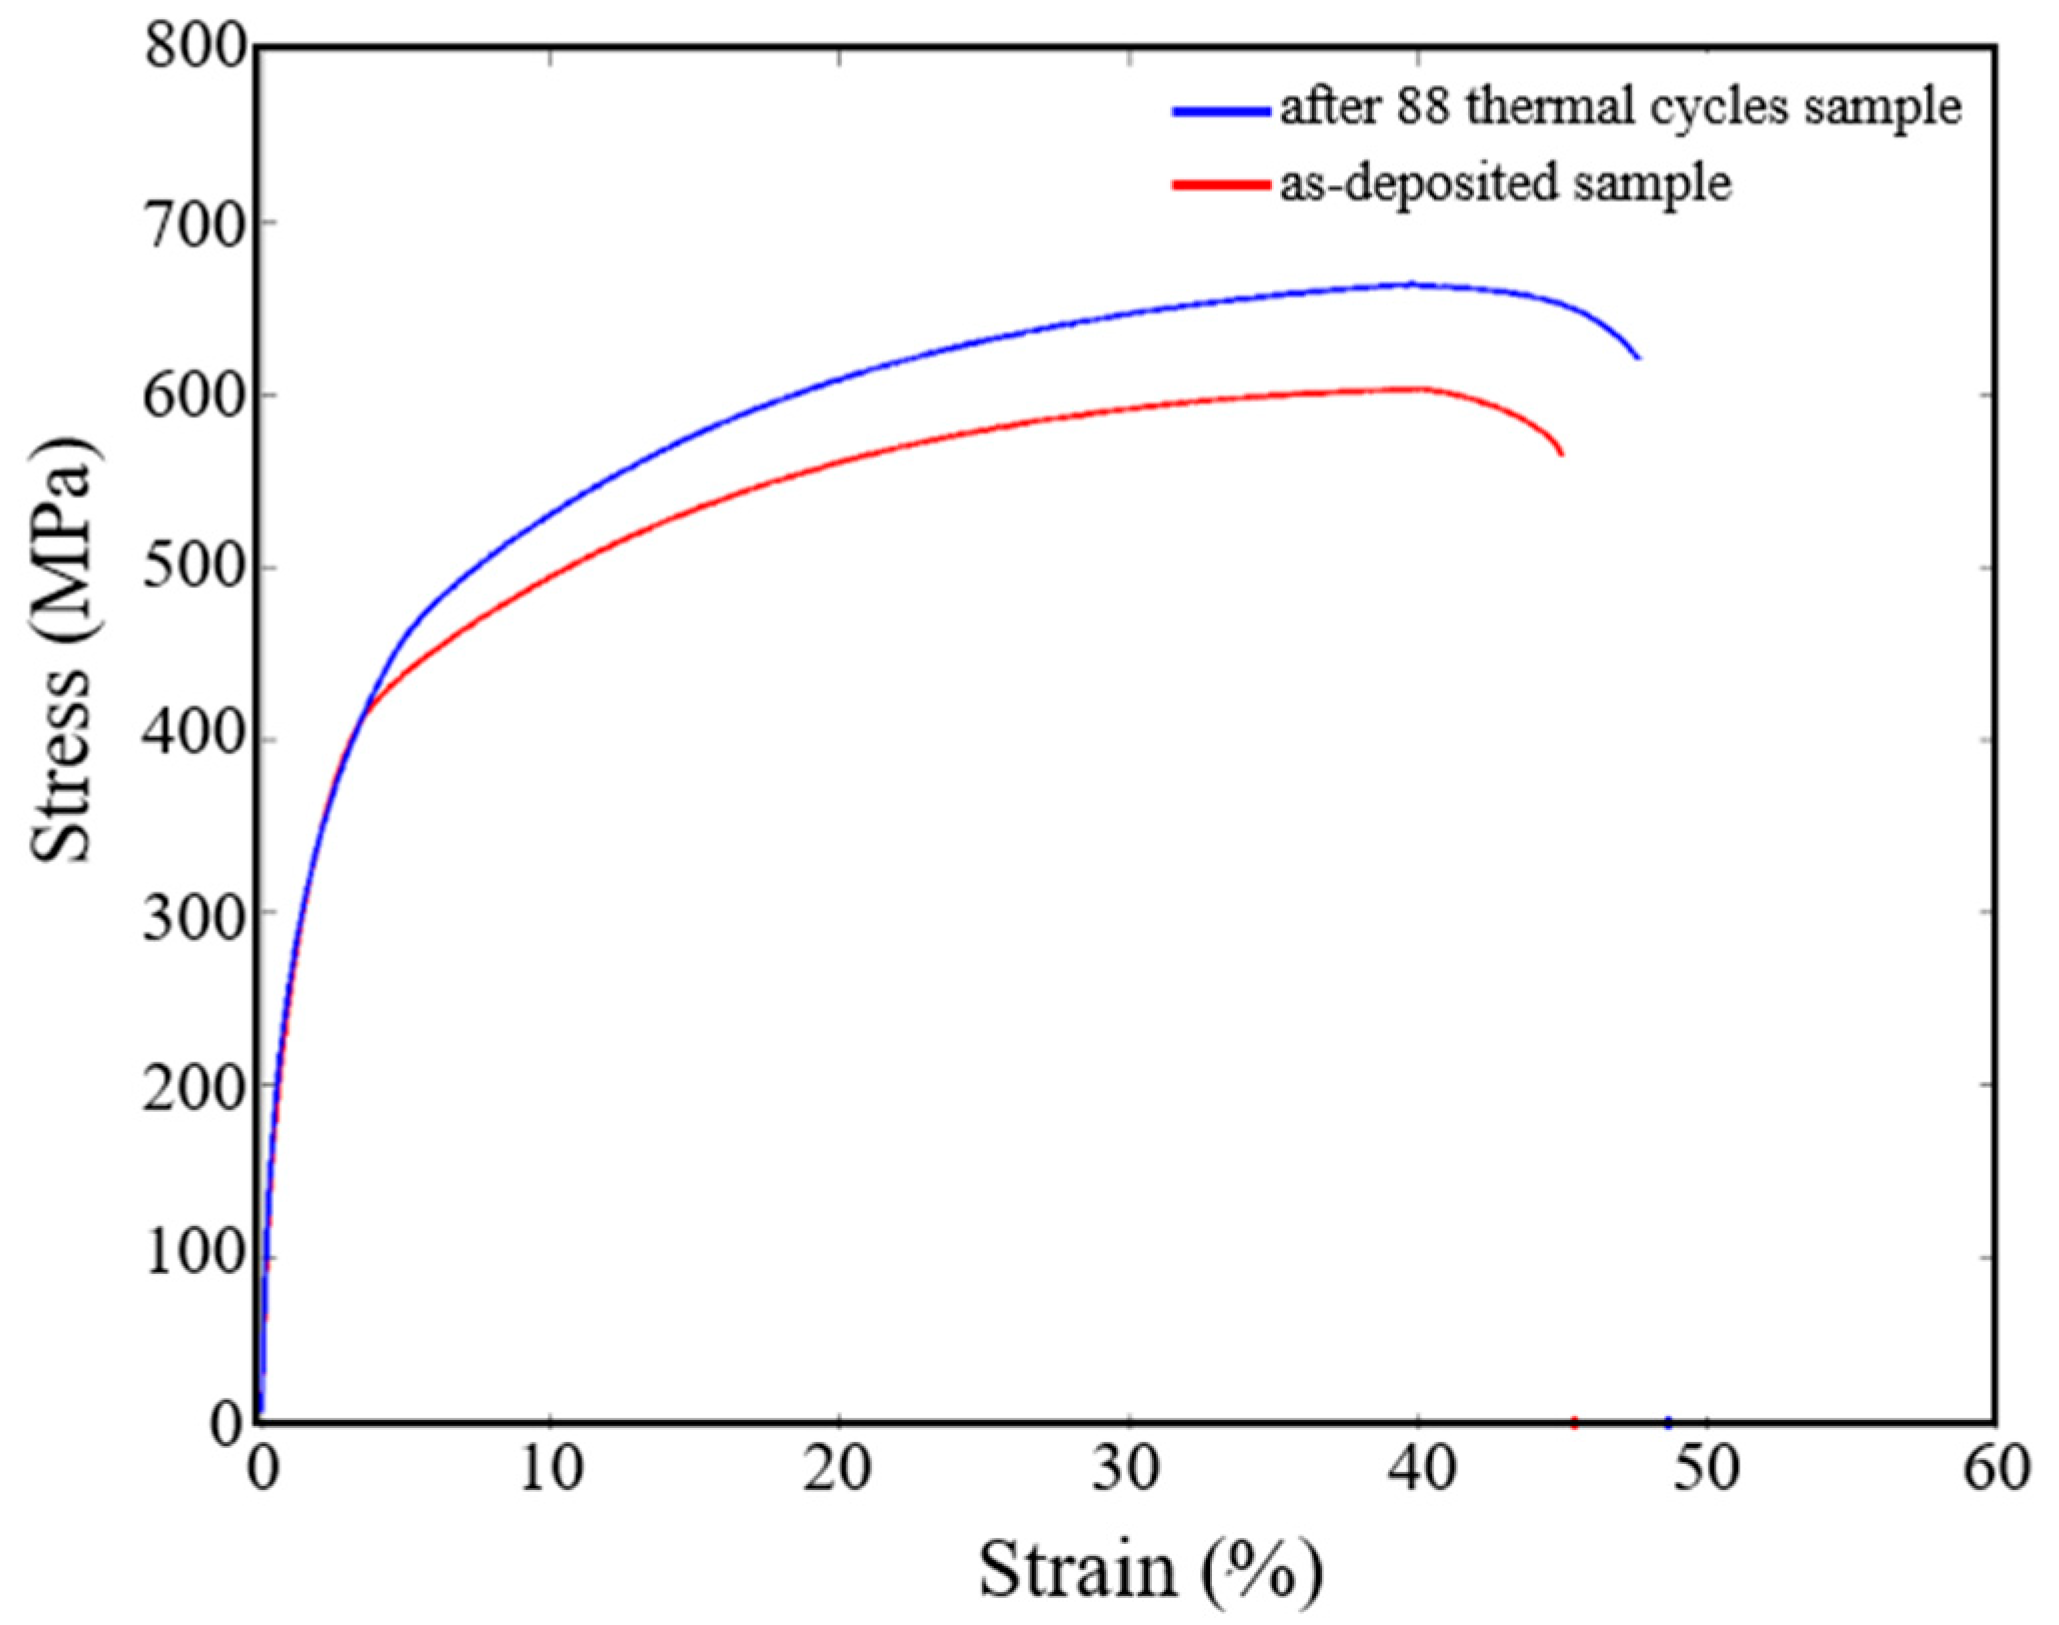
- The grain morphology of the thermal cyclic sample exhibits a large number of irregular equiaxed grains coexisting with uniform aspect ratio columnar grains with an average grain size of 53 ± 10 , which is 28% less than that of the as-deposited sample. The average value of GND increases steadily from 2.3 × 10¹² m−2 to 5.3 × 10¹² m−2 with thermal cycling. The hardness and tensile yield strength are improved to a certain extent.
- (4)
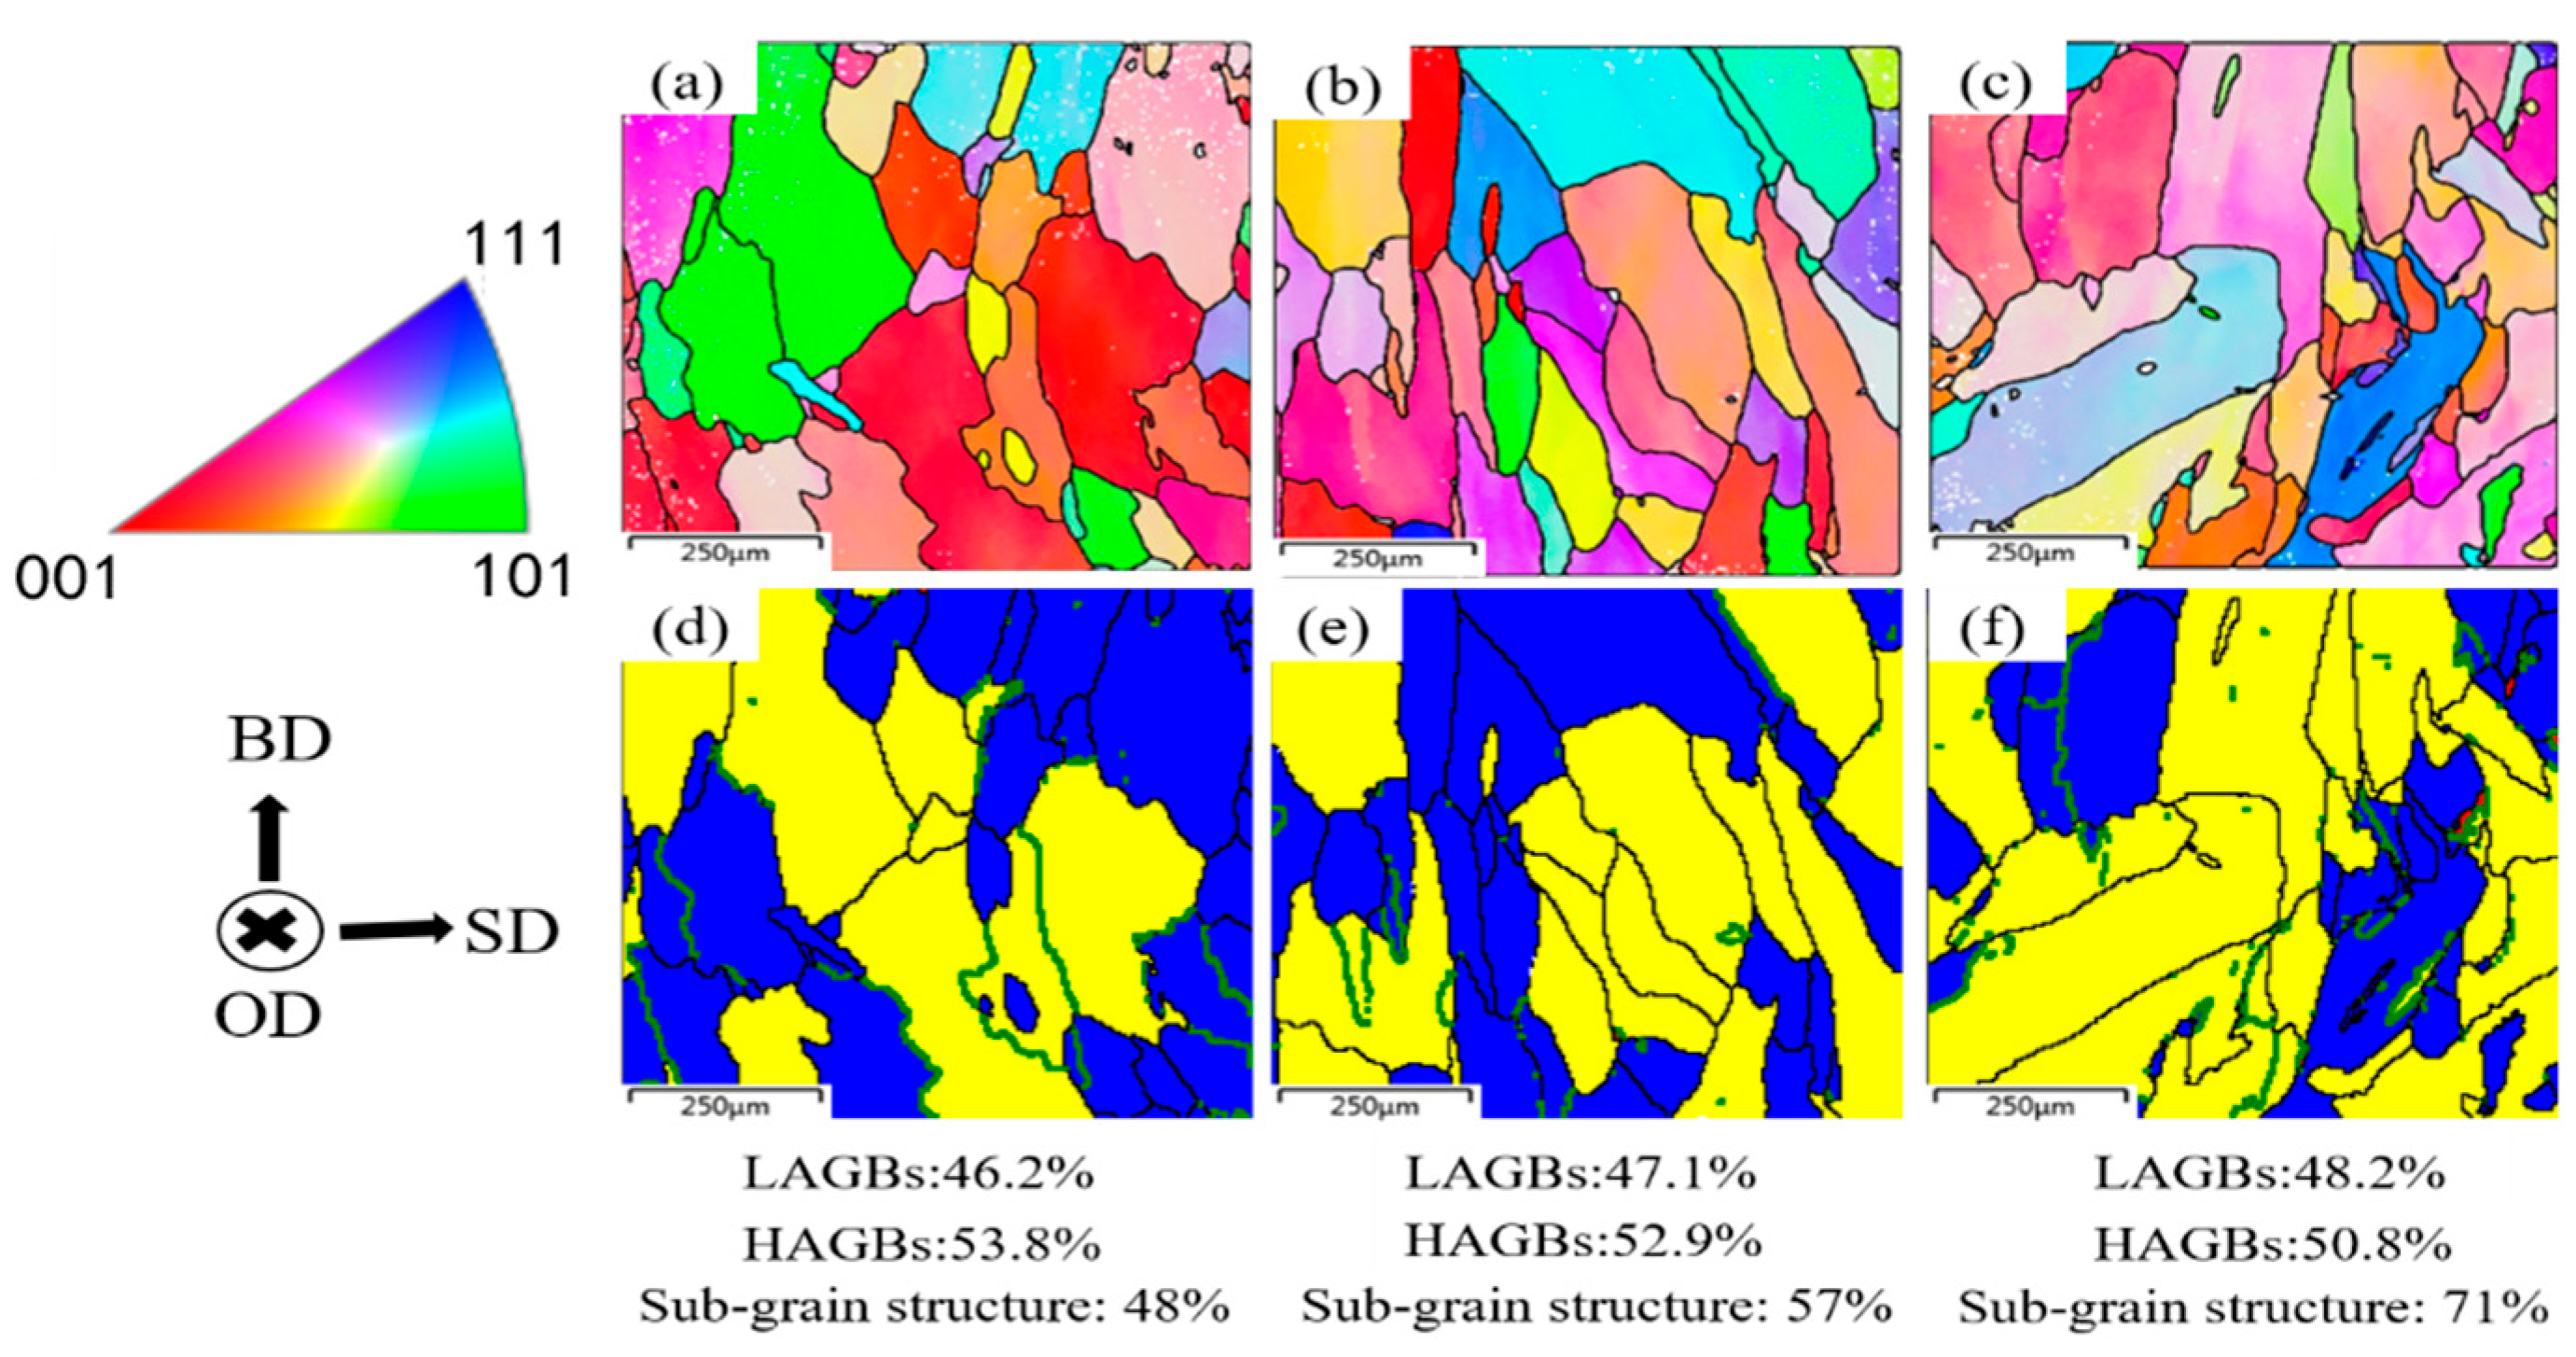
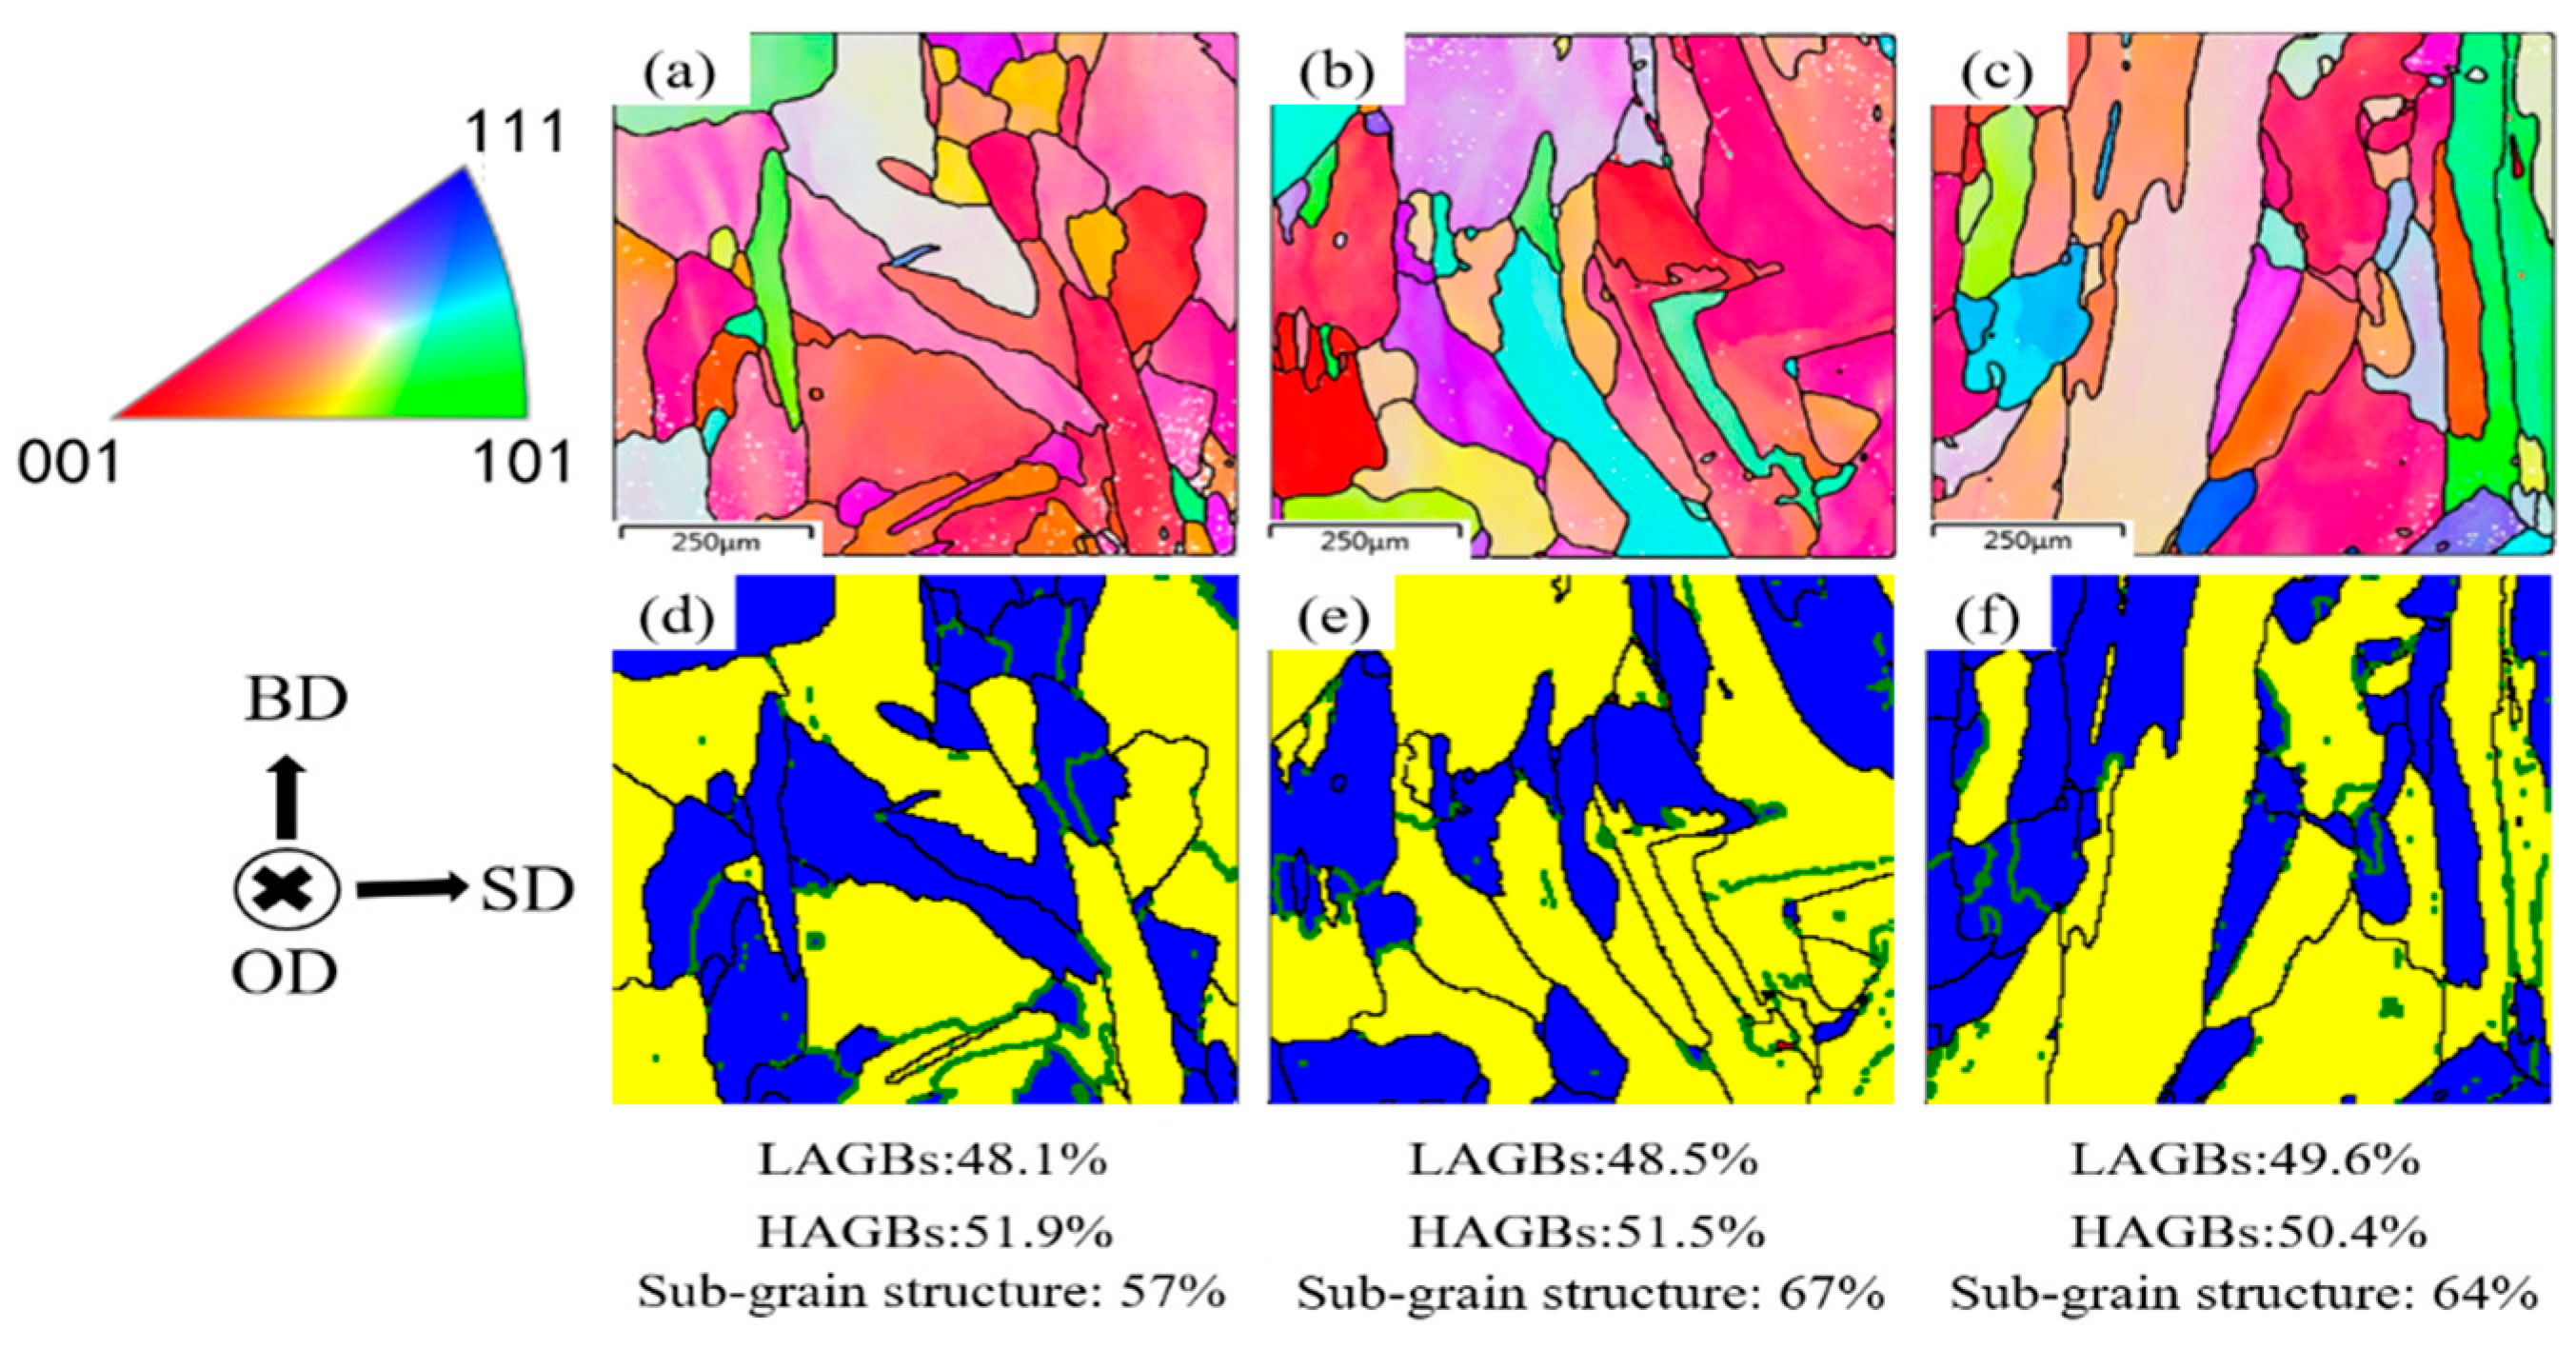
- There exist few various on the grain morphology of PW laser cyclic samples with different frequency and duty cycle. Under high frequency, it is more favorable to obtain LAGBs and sub-grain structures, which is beneficial to the hardness of the PW laser thermal cyclic sample.
Author Contributions
Funding
Institutional Review Board Statement
Informed Consent Statement
Data Availability Statement
Conflicts of Interest
References
- Huang, S.H.; Liu, P.; Mokasdar, A.; Hou, L. Additive manufacturing and its societal impact: A literature review. Int. J. Adv. Manuf. Technol. 2013, 67, 1191–1203. [Google Scholar] [CrossRef]
- Blinn, B.; Lion, P.; Jordan, O.; Meiniger, S.; Mischliwski, S.; Tepper, C.; Gläßner, C.; Aurich, J.C.; Weigold, M.; Beck, T. Process-influenced fatigue behavior of AISI 316L manufactured by powder- and wire-based Laser Direct Energy Deposition. Mater. Sci. Eng. A 2021, 818, 141383. [Google Scholar] [CrossRef]
- AlMangour, B.; Grzesiak, D.; Jenn, M. Selective laser melting of TiC reinforced 316L stainless steel matrix nanocomposites: Influence of starting TiC particle size and volume content. Mater. Des. 2016, 104, 141–151. [Google Scholar] [CrossRef]
- Ma, K.; Zhao, Y.; Xu, X.; Hou, H. The effect of undercooling on growth velocity and microstructure of Ni95Cu5 alloys. J. Cryst. Growth 2019, 513, 30–37. [Google Scholar] [CrossRef]
- An, Y.; Xu, X.; Liang, L.; Zhao, Y.; Hou, H. Microstructure transformation and grain refinement during non-equilibrium solidification of a highly undercooled alloy system. J. Alloys Compd. 2021, 864, 158821. [Google Scholar] [CrossRef]
- Sabzi, H.E.; Aboulkhair, N.T.; Liang, X.; Li, X.-H.; Simonelli, M.; Fu, H.; Rivera-Díaz-del-Castillo, P.E.J. Grain refinement in laser powder bed fusion: The influence of dynamic recrystallization and recovery. Mater. Des. 2020, 196, 109181. [Google Scholar] [CrossRef]
- Zhang, J.; Liu, Y.; Bayat, M.; Tan, Q.; Yin, Y.; Fan, Z.; Liu, S.; Hattel, J.H.; Dargusch, M.; Zhang, M.-X. Achieving high ductility in a selectively laser melted commercial pure-titanium via in-situ grain refinement. Scr. Mater. 2021, 191, 155–160. [Google Scholar] [CrossRef]
- Wang, H.; Zhu, Z.G.; Chen, H.; Wang, A.G.; Liu, J.Q.; Liu, H.W.; Zheng, R.K.; Nai, S.M.L.; Primig, S.; Babu, S.S.; et al. Effect of cyclic rapid thermal loadings on the microstructural evolution of a CrMnFeCoNi high-entropy alloy manufactured by selective laser melting. Acta Mater. 2020, 196, 609–625. [Google Scholar] [CrossRef]
- Zhang, Z.; Li, Z.; He, Y.; Song, G.; Liu, L. The effect of low-power laser on micro-forming of 316 stainless steel additive manufacturing part. J. Manuf. Process. 2021, 68, 583–601. [Google Scholar] [CrossRef]
- Smith, T.R.; Sugar, J.D.; Marchi, C.S.; Schoenung, J.M. Microstructural development in DED stainless steels: Applying welding models to elucidate the impact of processing and alloy composition. J. Mater. Sci. 2020, 56, 762–780. [Google Scholar] [CrossRef]
- Zou, X.; Yan, Z.; Zou, K.; Liu, W.; Song, L.; Li, S.; Cha, L. Grain refinement by dynamic recrystallization during laser direct energy deposition of 316L stainless steel under thermal cycles. J. Manuf. Process. 2022, 76, 646–655. [Google Scholar] [CrossRef]
- Li, S.; Xiao, H.; Liu, K.; Xiao, W.; Li, Y.; Han, X.; Mazumder, J.; Song, L. Melt-pool motion, temperature variation and dendritic morphology of Inconel 718 during pulsed- and continuous-wave laser additive manufacturing: A comparative study. Mater. Des. 2017, 119, 351–360. [Google Scholar] [CrossRef]
- Xiao, H.; Li, S.M.; Xiao, W.J.; Li, Y.Q.; Cha, L.M.; Mazumder, J.; Song, L.J. Effects of laser modes on Nb segregation and Laves phase formation during laser additive manufacturing of nickel-based superalloy. Mater. Lett. 2017, 188, 260–262. [Google Scholar] [CrossRef]
- Xiao, H.; Li, S.; Han, X.; Mazumder, J.; Song, L. Laves phase control of Inconel 718 alloy using quasi-continuous-wave laser additive manufacturing. Mater. Des. 2017, 122, 330–339. [Google Scholar] [CrossRef]
- Cheng, M.; Xiao, X.; Luo, G.; Song, L. Integrated control of molten pool morphology and solidification texture by adjusting pulse duration in laser additive manufacturing of Inconel 718. Opt. Laser Technol. 2021, 142, 107137. [Google Scholar] [CrossRef]
- Biegler, M.; Graf, B.; Rethmeier, M. In-situ distortions in LMD additive manufacturing walls can be measured with digital image correlation and predicted using numerical simulations. Addit. Manuf. 2018, 20, 101–110. [Google Scholar] [CrossRef]
- Xie, R.; Chen, G.; Zhao, Y.; Zhang, S.; Yan, W.; Lin, X.; Shi, Q. In-situ observation and numerical simulation on the transient strain and distortion prediction during additive manufacturing. J. Manuf. Process. 2019, 38, 494–501. [Google Scholar] [CrossRef]
- Puli, R.; Ram, G.D.J. Dynamic recrystallization in friction surfaced austenitic stainless steel coatings. Mater. Charact. 2012, 74, 49–54. [Google Scholar] [CrossRef]
- Zou, X.; Yan, Z.; Zou, K.; Zhang, S.G.; Liu, W.; Song, L. Residual stress control of 316 L stainless steel using pulsed-wave laser additive manufacturing. Opt. Laser Technol. 2022, 150, 107910. [Google Scholar] [CrossRef]
- Zener, C.; Hollomon, J.H. Effect of Strain Rate Upon Plastic Flow of Steel. J. Appl. Phys. 1944, 15, 22–32. [Google Scholar] [CrossRef]
- Liu, X.G.; Zhang, L.G.; Qi, R.S.; Chen, L.; Jin, M.; Guo, B.F. Prediction of critical conditions for dynamic recrystallization in 316LN austenitic steel. J. Iron Steel Res. Int. 2016, 23, 238–243. [Google Scholar] [CrossRef]
- Huang, K.; Logé, R.E. A review of dynamic recrystallization phenomena in metallic materials. Mater. Des. 2016, 111, 548–574. [Google Scholar] [CrossRef]
- Dong, D.; Chen, F.; Cui, Z. Investigation on metadynamic recrystallization behavior in SA508-III steel during hot deformation. J. Manuf. Process. 2017, 29, 18–28. [Google Scholar] [CrossRef]
- Mozumder, Y.H.; Babu, K.A.; Saha, R.; Sarma, V.S.; Mandal, S. Dynamic microstructural evolution and recrystallization mechanism during hot deformation of intermetallic-hardened duplex lightweight steel. Mater. Sci. Eng. A 2020, 788, 139613. [Google Scholar] [CrossRef]
- Yu, S.; Liu, C.; Gao, Y.; Jiang, S.; Bao, Z. Dynamic recrystallization mechanism of Mg-8.5Gd-2.5Y-0.4Zr alloy during hot ring rolling. Mater. Charact. 2017, 131, 135–139. [Google Scholar] [CrossRef]
- Sabzi, H.E.; Hernandez-Nava, E.; Li, X.-H.; Fu, H.; San-Martín, D.; Rivera-Díaz-del-Castillo, P.E.J. Strengthening control in laser powder bed fusion of austenitic stainless steels via grain boundary engineering. Mater. Des. 2021, 212, 110246. [Google Scholar] [CrossRef]
- Smith, T.R.; Sugar, J.D.; Marchi, C.S.; Schoenung, J.M. Strengthening mechanisms in directed energy deposited austenitic stainless steel. Acta Mater. 2019, 164, 728–740. [Google Scholar] [CrossRef]
- Dehghan-Manshadi, A.; Hodgson, P.D. Dependency of Recrystallization Mechanism to the Initial Grain Size. Metall. Mater. Trans. A 2008, 39, 2830–2840. [Google Scholar] [CrossRef]

| Element | Cr | Ni | Mo | C | Mn | P | S | N | Si | Fe |
|---|---|---|---|---|---|---|---|---|---|---|
| Percentage (%) | 16.28 | 12.05 | 2.1 | 0.021 | 1.54 | 0.015 | 0.005 | 0.005 | 0.68 | 67.3 |
| S1 | S2 | S3 | |
|---|---|---|---|
| As-deposited sample | 172.6 | 170.4 | 174.1 |
| 88-layers thermal cycles sample | 188.5 | 186.7 | 189.2 |
| Process Parameters | Frequency/Duty Cycle | Hardness (HV) |
|---|---|---|
| PW800 W 8 mm/s-75% | 10 Hz | 188.5 |
| 20 Hz | 187.9 | |
| 40 Hz | 190.2 | |
| 80 Hz | 192.3 | |
| PW800 W 8 mm/s-10 Hz | 50% | 188.4 |
| 65% | 186.5 | |
| 75% | 188.5 | |
| 85% | 187.2 |
Disclaimer/Publisher’s Note: The statements, opinions and data contained in all publications are solely those of the individual author(s) and contributor(s) and not of MDPI and/or the editor(s). MDPI and/or the editor(s) disclaim responsibility for any injury to people or property resulting from any ideas, methods, instructions or products referred to in the content. |
© 2025 by the authors. Licensee MDPI, Basel, Switzerland. This article is an open access article distributed under the terms and conditions of the Creative Commons Attribution (CC BY) license (https://creativecommons.org/licenses/by/4.0/).
Share and Cite
Cheng, M.; Zou, X.; Zhu, Y.; Chang, T.; Cao, Q.; Ju, H.; Ning, J.; Ding, Y.; Qiang, L. Grain Refinement Caused by Dynamic Recrystallization Under Pulsed-Wave Laser Multi-Layer Cyclic Thermal Load. Coatings 2025, 15, 788. https://doi.org/10.3390/coatings15070788
Cheng M, Zou X, Zhu Y, Chang T, Cao Q, Ju H, Ning J, Ding Y, Qiang L. Grain Refinement Caused by Dynamic Recrystallization Under Pulsed-Wave Laser Multi-Layer Cyclic Thermal Load. Coatings. 2025; 15(7):788. https://doi.org/10.3390/coatings15070788
Chicago/Turabian StyleCheng, Manping, Xi Zou, Yuan Zhu, Tengfei Chang, Qi Cao, Houlai Ju, Jiawei Ning, Yang Ding, and Lijun Qiang. 2025. "Grain Refinement Caused by Dynamic Recrystallization Under Pulsed-Wave Laser Multi-Layer Cyclic Thermal Load" Coatings 15, no. 7: 788. https://doi.org/10.3390/coatings15070788
APA StyleCheng, M., Zou, X., Zhu, Y., Chang, T., Cao, Q., Ju, H., Ning, J., Ding, Y., & Qiang, L. (2025). Grain Refinement Caused by Dynamic Recrystallization Under Pulsed-Wave Laser Multi-Layer Cyclic Thermal Load. Coatings, 15(7), 788. https://doi.org/10.3390/coatings15070788