Article

Analysis of the Suitability of 3D-Printed Road Surface Replicas for Laboratory Testing of Rolling Resistance

by
Wojciech Owczarzak
*,
Sławomir Sommer
and
Grzegorz Ronowski
Institute of Mechanics and Machine Design, Faculty of Mechanical Engineering and Ship Technology and EkoTech Center, Gdańsk University of Technology, ul. Narutowicza 11/12, 80-233 Gdańsk, Poland
*
Author to whom correspondence should be addressed.
Coatings 2025, 15(7), 766; https://doi.org/10.3390/coatings15070766 (registering DOI)
Submission received: 2 June 2025 / Revised: 24 June 2025 / Accepted: 27 June 2025 / Published: 28 June 2025

Abstract

This study investigates the influence of the method and materials used for creating road surface replicas on the evaluation of rolling resistance using the oscillatory method. While casting resin is commonly employed for this purpose, the research explores 3D printing as a viable alternative. To assess the effectiveness of the proposed approach, replicas of three road surfaces with differing rolling resistance characteristics were created using both techniques. The conventional resin-based replicas served as a reference. A range of tires—summer, winter, and all-season—were tested on the prepared samples. The results were compared to evaluate the consistency between the two replica fabrication methods and to determine the suitability of 3D-printed surfaces as substitutes for those made with casting resin.

1. Introduction

Rolling resistance of car tires is one of the key factors influencing the interaction between the tire and the road surface. It directly affects a vehicle’s energy consumption, the emission of harmful atmospheric compounds (such as NH3, CO2, and NO2), and fundamental performance parameters such as top speed, acceleration, and driving range. High rolling resistance also contributes to increased tire temperatures, which accelerate aging and reduce mechanical durability [1,2,3,4,5].
Among the primary forces opposing vehicle motion—alongside aerodynamic drag, gradient resistance, and inertia—rolling resistance plays a particularly significant role at speeds up to approximately 80–90 km/h, when its contribution to overall energy consumption is greatest. A 10% reduction in rolling resistance can lead to a 2%–4% decrease in fuel consumption, with some studies indicating a 3%–4% reduction in CO2 emissions under typical driving conditions [2,6].
Rolling resistance results from energy losses during the tire’s cyclic deformation in the contact area with the road surface. Due to the viscoelastic hysteresis of rubber materials, more energy is required to deform the tire than is recovered when it returns to its original shape. Most of this energy loss is converted into heat, while the remainder dissipates through noise, permanent surface deformations, and tire wear. Numerous factors influence the magnitude of rolling resistance: tire construction (width, height, tread pattern, number of casing layers, belt material, and rubber compound composition), operating conditions (load, inflation pressure, temperature, and speed), and road surface characteristics (texture, stiffness, and condition) [2,7]. Rolling resistance is studied both to optimize tire design and to improve road surfaces.
Key parameters characterizing road surfaces in terms of their interaction with vehicle tires include texture, smoothness, stiffness, and the porosity of the surface layer (wearing course). Road surface texture refers to deviations in the pavement from an ideally flat plane, with characteristic wavelengths of less than 0.5 m. Depending on the wavelength, surface texture is typically classified as follows (Figure 1) [8,9,10]:
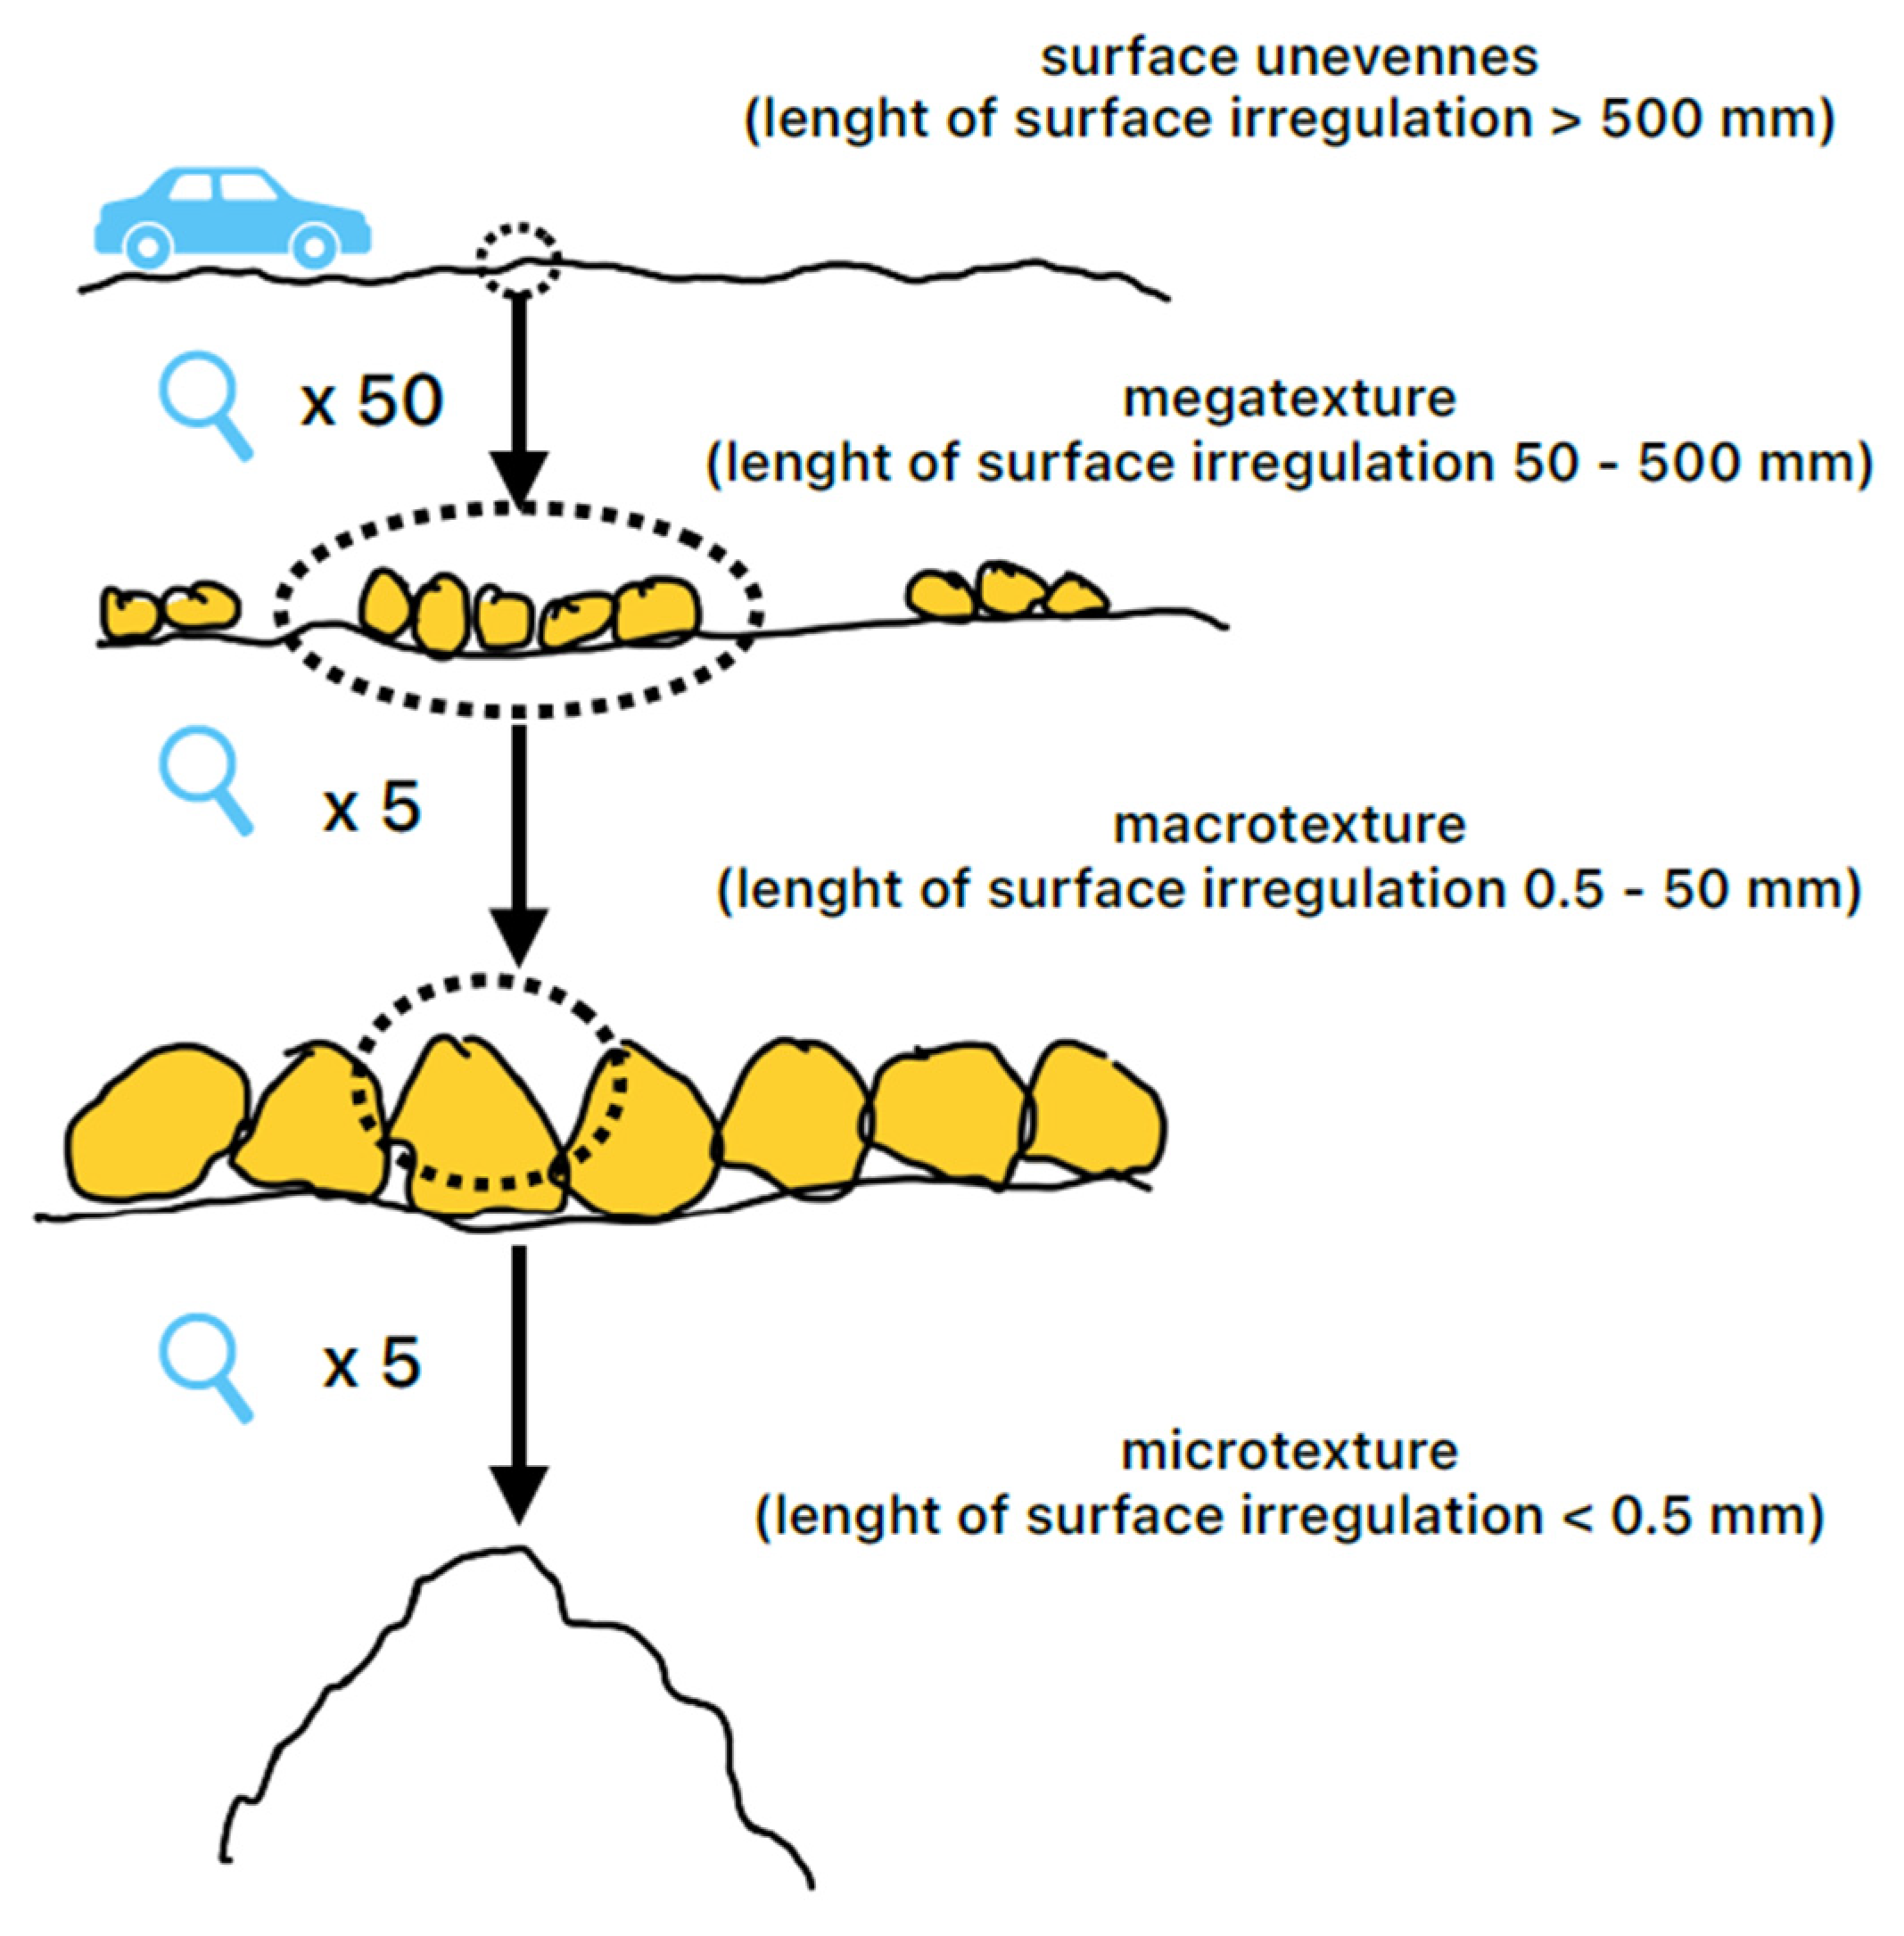
  • Irregularities: Wavelengths greater than 500 mm.
  • Megatexture: Wavelengths between 50 and 500 mm, with typical amplitudes ranging from 0.1 to 50 mm.
  • Macrotexture: Wavelengths from 0.5 to 50 mm, with amplitudes between 0.1 and 20 mm.
  • Microtexture: Wavelengths below 0.5 mm, with amplitudes from 0.001 to 0.5 mm.
The texture of the road surface has a significant impact on the local deformation of tire tread elements. Surfaces with pronounced, aggressive textures cause substantial increases in these deformations, leading to higher rolling resistance. However, when the texture is extremely pronounced, the flexibility of the tread elements (or “blocks”) becomes insufficient to fully conform to the surface profile. Due to a phenomenon known as enveloping, contact between the tread and the road is limited to the highest protruding features—primarily the peaks of aggregate particles—while other areas remain out of contact.
According to the laws of physics, deformations resulting from tire–road interactions occur not only in the tire but also in the road surface. However, because the mechanical impedance of the road surface is typically much higher than that of the tire, surface deflection is minimal. For standard pavement materials, the dynamic Young’s modulus ranges from 10 to 45 GPa, whereas for car tires, it is approximately 0.3 to 1 MPa [11,12]. Numerous studies have examined the complex nature of tire–road interactions [10,13].
Over the past two decades, tire manufacturers have made significant progress in reducing rolling resistance. Initially, these improvements were achieved primarily by introducing tires with large outer diameters and narrow widths (e.g., size 155/70 R19). Today, however, low rolling resistance models are also available in more conventional sizes [6].
Reducing energy losses associated with rolling resistance has become increasingly important in light of the rapid growth of hybrid and electric vehicles. In such vehicles, energy losses during braking have been significantly reduced thanks to regenerative braking, and aerodynamic drag has been minimized through optimized vehicle design. However, their overall mass has increased—electric vehicles are typically heavier than their internal combustion counterparts due to the need for large battery packs. Since rolling resistance is proportional to the normal load on the wheels, its relative contribution to total energy losses has not decreased; in fact, it has increased.
Accurately measuring rolling resistance poses a considerable technical challenge. In modern tires, the rolling resistance force accounts for only about 1% of the wheel load. For example, in the case of a 5 kN wheel load, the rolling resistance force ranges from just 30 to 60 N. Achieving 1% measurement accuracy therefore requires detecting forces with a precision of approximately 0.3 to 0.6 N. While measurements conducted on real roads are the most representative, they are subject to numerous variables, including pavement and air temperature, speed fluctuations, surface irregularities, and surrounding traffic conditions [5,14].
These challenges are addressed through laboratory testing, where temperature, speed, load, and tire pressure can be precisely controlled. In most cases, tests are performed on steel drums using the torque method [5]. However, this approach introduces several limitations. The curvature of the drum causes tire deformations that differ from those on flat road surfaces, and the absence of realistic surface texture affects the interaction between the tread and the substrate (an example of a road–wheel facility is shown in Figure 2). As a result, the gain in measurement precision comes at the cost of real-world representativeness. Standard testing protocols are outlined in documents such as ISO 28580 (2018) and SAE J2452 (2017) [15,16,17,18]. The issue of unrealistic surface texture can be addressed by using cast replicas of actual pavements.
Gdańsk University of Technology operates the only laboratory in the world that uses replicas of real road surfaces made from reinforced laminates with epoxy resins, preserving the authentic texture of the original pavement (see Figure 3). Testing on these replicas yields more accurate and reliable results than tests conducted on steel surfaces, as they better simulate actual vehicle operating conditions. Measurements of rolling resistance and tire noise on these replicas correspond closely with data obtained from real roads under actual traffic conditions [19].
An analysis of the available literature on simplified testing methods reveals a growing body of research focused on tire–road surface interactions [20]. One notable example is the use of high-precision pressure measurement systems, such as pressure sensitive films, to investigate the actual contact characteristics between tires and asphalt surfaces. Other studies utilize flexible force sensors embedded directly within the tire structure [21,22,23]. Another approach involves integrating pressure sensors into a matrix embedded in the road surface and surrounded by aggregate-simulating supports, enabling the measurement of triaxial stress distributions at the tire–pavement interface [24]. These interactions can also be studied using numerical methods [25,26].
Focusing specifically on the analysis of energy losses at the tire–road interface, researchers have explored innovative techniques such as 3D digital image correlation (3D-DIC)—a non-contact method used to estimate rolling resistance by calculating the relative velocity of primary elastic deformations. Alternatively, rolling resistance can be indirectly assessed through the pressure distribution between the tire and the road surface, obtained using specialized pressure-mapping films [26,27,28]. Numerical techniques also remain a valuable tool for estimating rolling resistance [29,30].
In light of these developments, alternative laboratory methods are receiving increasing attention. These methods aim to replicate realistic tire–road contact conditions while maintaining high measurement accuracy and offering simplicity and speed of testing. One such proposed approach involves the use of an oscillatory method combined with 3D printing to create test surfaces with predefined geometry and texture, thereby simulating road conditions in a controlled laboratory environment. In earlier implementations of this method, epoxy resin-based replicas were used—similar to those mentioned previously—with the distinction that the replicas used in oscillatory testing were much smaller and flat (i.e., without curvature) [31].
However, producing such replicas using traditional casting materials presents certain challenges, primarily due to the need for an initial texture template to be placed into a mold—typically obtained through silicone rubber casting. This method inherently limits researchers to existing surface textures. In contrast, 3D printing offers the potential not only to modify existing textures but also to design entirely new surface patterns from scratch. The application of 3D printing will also contribute to a reduction in manufacturing costs, shorten production time, and minimize the generation of environmentally harmful chemical waste.

2. Materials and Methods

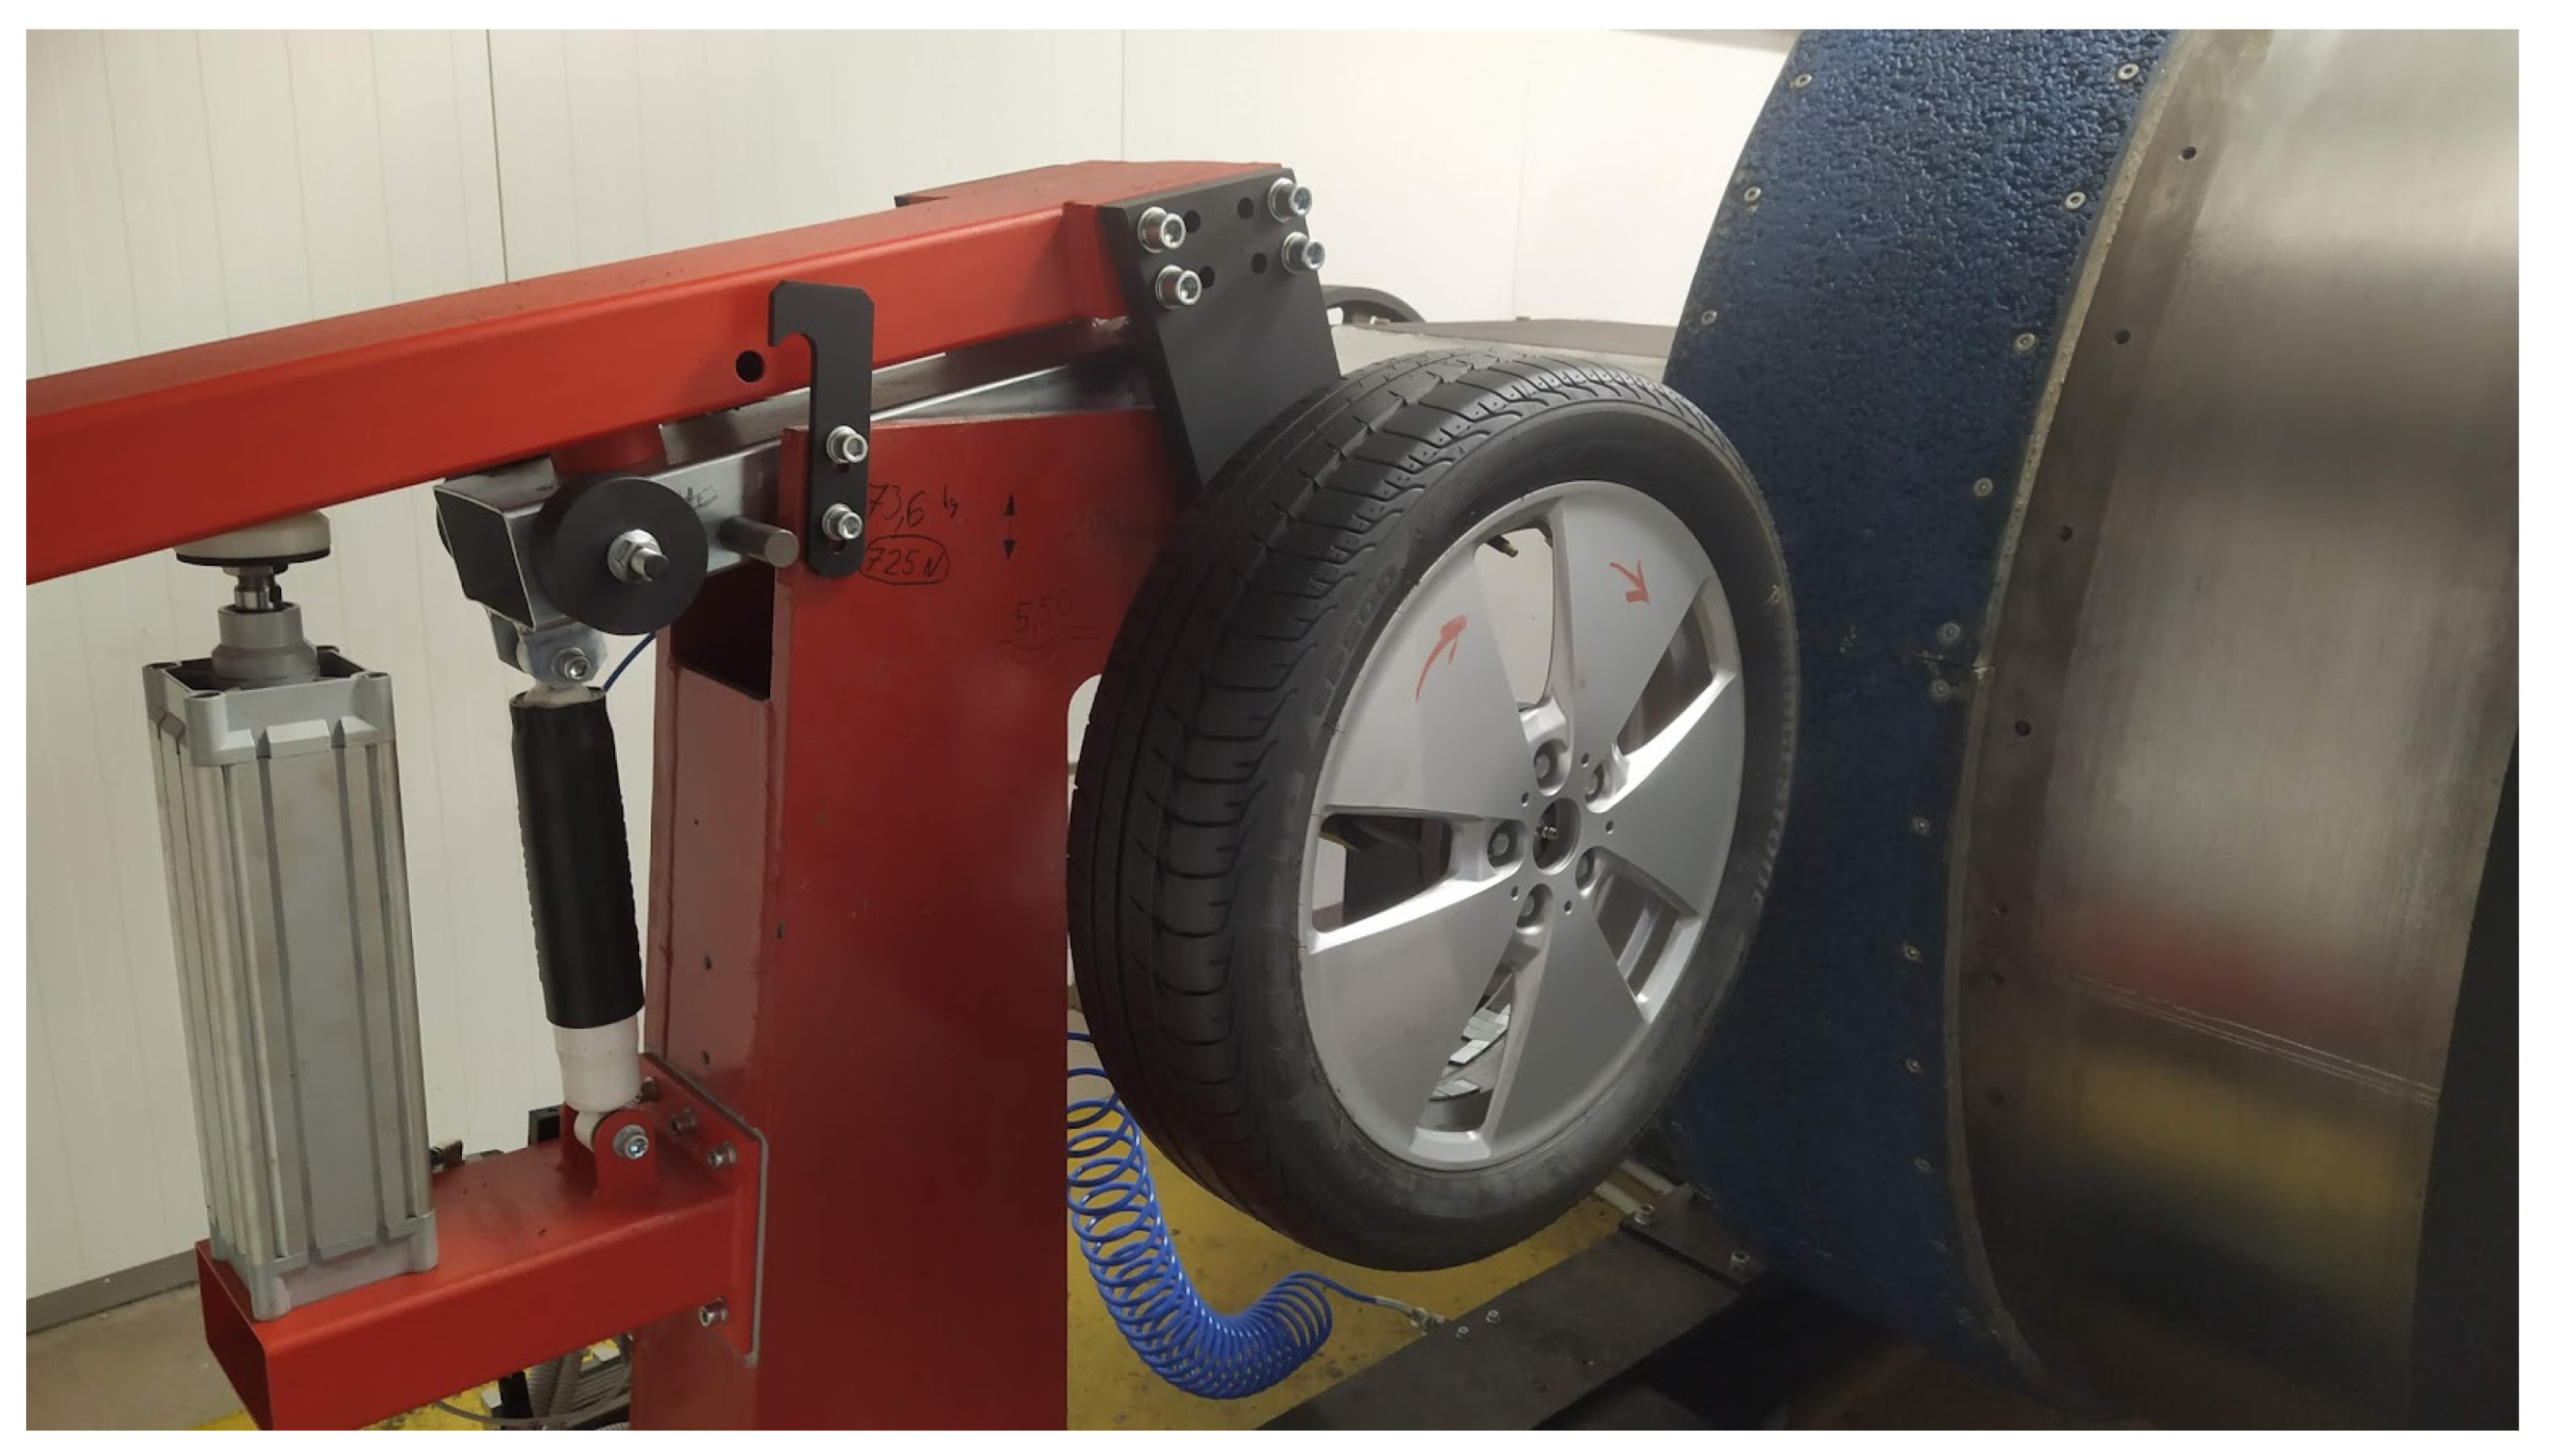
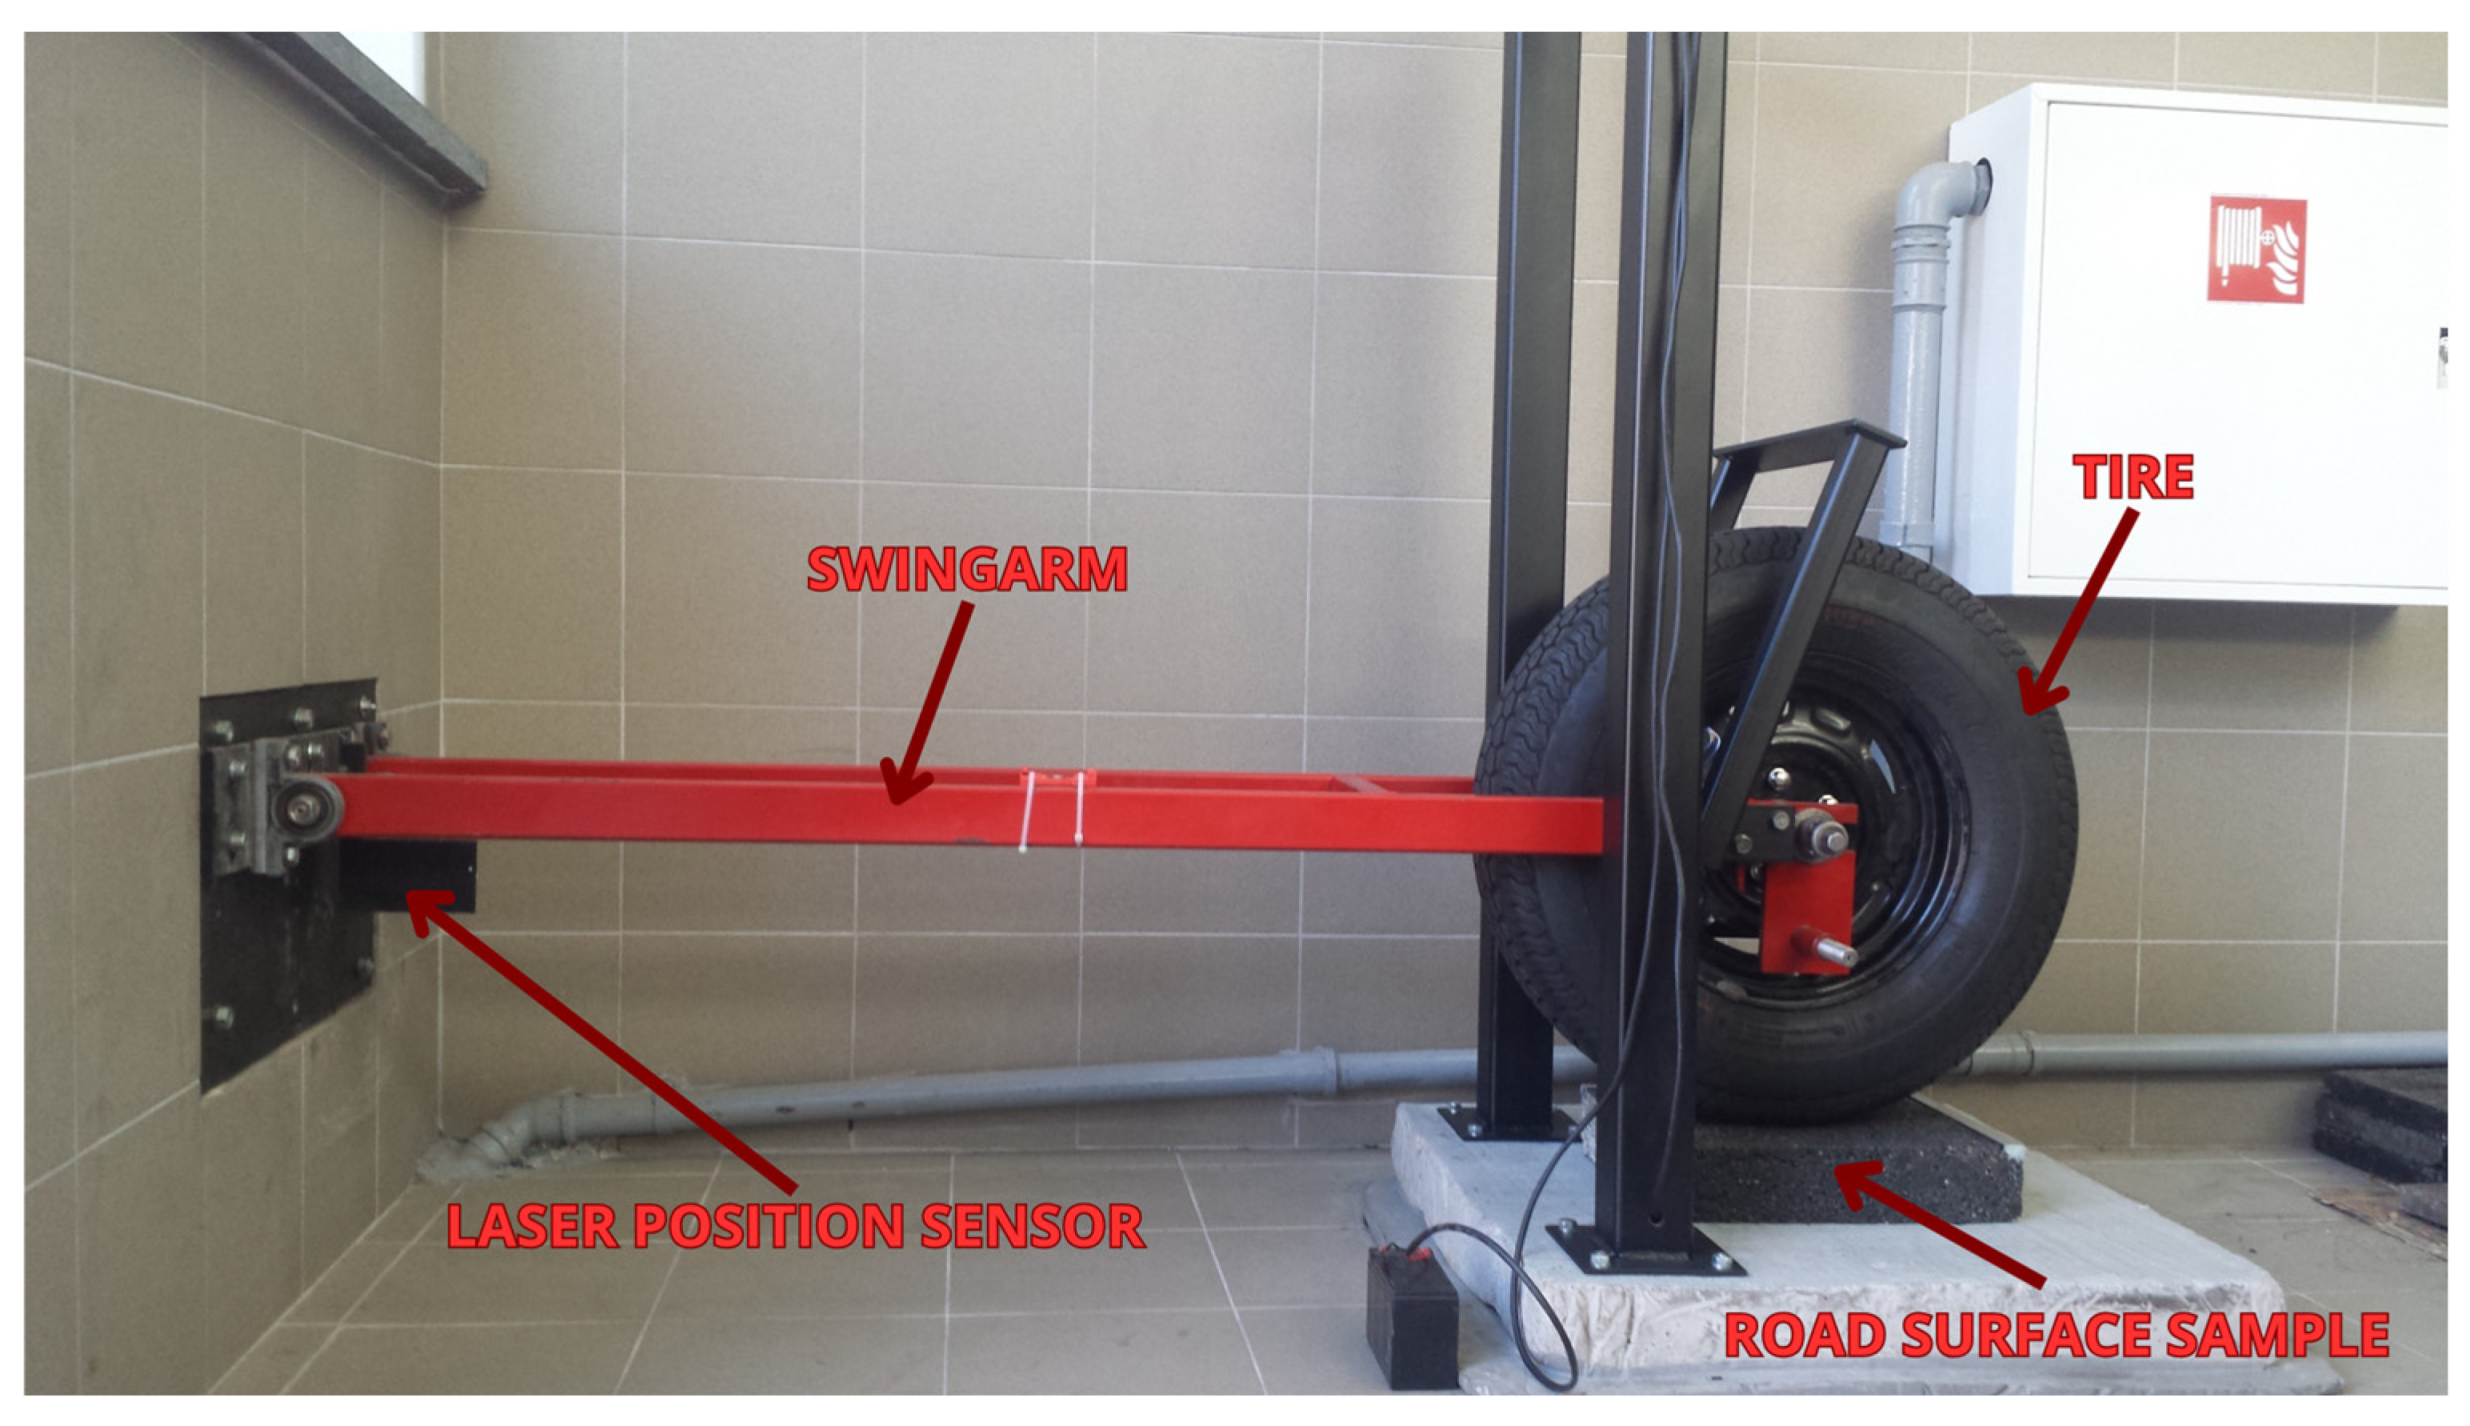
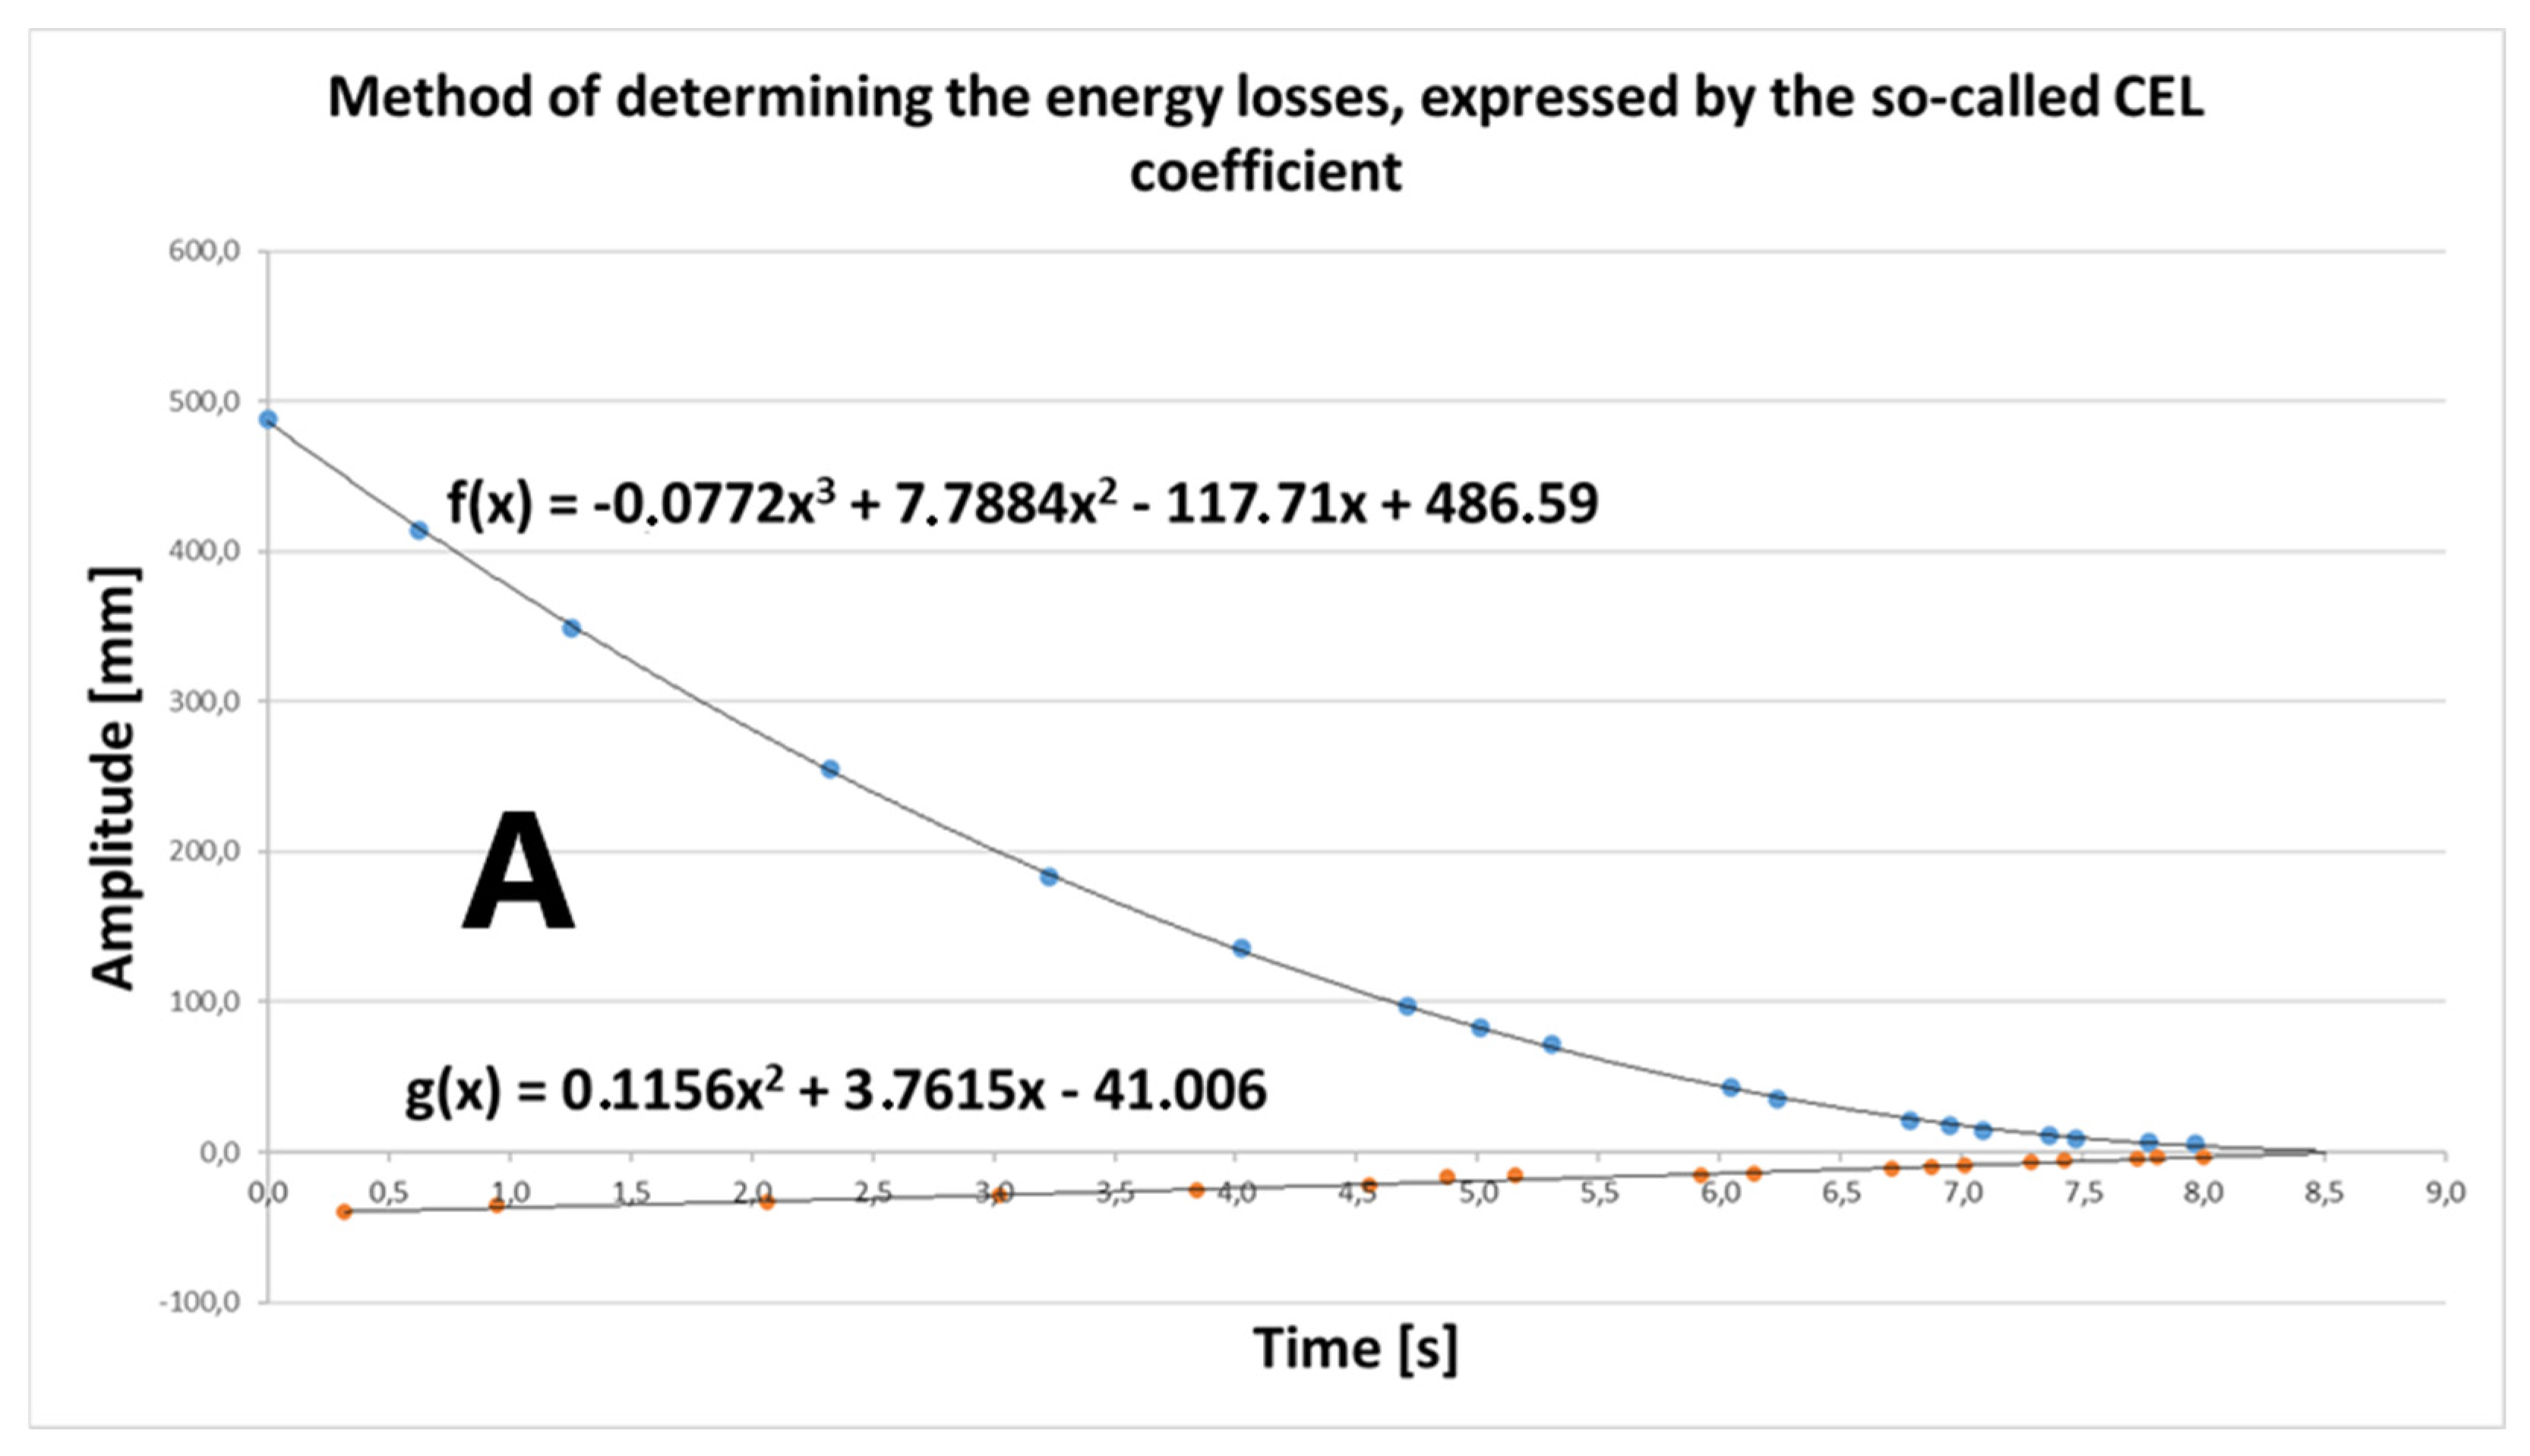
2.1. Oscillatory Method for Estimating Energy Losses During Tire–Road Surface Contact

To assess the impact of the manufacturing technique used for road surface replicas on measured rolling resistance values, the oscillatory method was applied. This method involves evaluating energy losses resulting from the repeated contact of a tire with a surface sample, initiated by a free-fall motion. The tire is mounted on a 1.5 m long arm, which remains level in its resting position. This motion induces oscillations within a system composed of mass, elasticity, and damping components. Replacing the wheel’s rotational movement with a sliding or swinging motion simplifies both the apparatus and the measurement setup (Figure 4). This simplification enables the use of small surface samples, which are easy to prepare under laboratory conditions.
During oscillation, the vibration amplitude is measured and analyzed by calculating the area between the upper and lower envelopes of the amplitude curve (Figure 5). The initial drop height and load applied to the test tire were selected based on specific assumptions. In both laboratory and real-world rolling resistance tests, the load exerted on a passenger car tire generally ranges from 2000 to over 9000 N, depending on the particular testing conditions [15]. External temperature and internal tire pressure correspond to standard conditions commonly used in ISO rolling resistance measurement procedures (25 °C, 210 kPa). Throughout the oscillation, the frequency of tire deformation increases over time, ranging from approximately 1 Hz at the start of the measurement to around 15 Hz at its conclusion. This frequency range corresponds to deformation frequencies observed in standard drum tests, which are typically conducted at speeds of about 80 km/h [15]. The method closely simulates the actual interaction between the tire and the road surface, accounting for tire structure deformation, tread behavior, and dynamic pressure distribution.
This technique shows a strong correlation with the torque-based method, which employs rolling test machines and complies with ISO standards. Although the oscillatory method does not provide absolute rolling resistance values, it offers a reliable comparative metric, particularly useful for evaluating prototype road surfaces. This approach enables researchers to assess surface characteristics without the need to build extensive and costly test tracks [9].
Formula for determining the CEL coefficient is as follows:
C E L = 1 A = 1 a b f x g x d x
where C E L —Coefficient of Energy Losses.

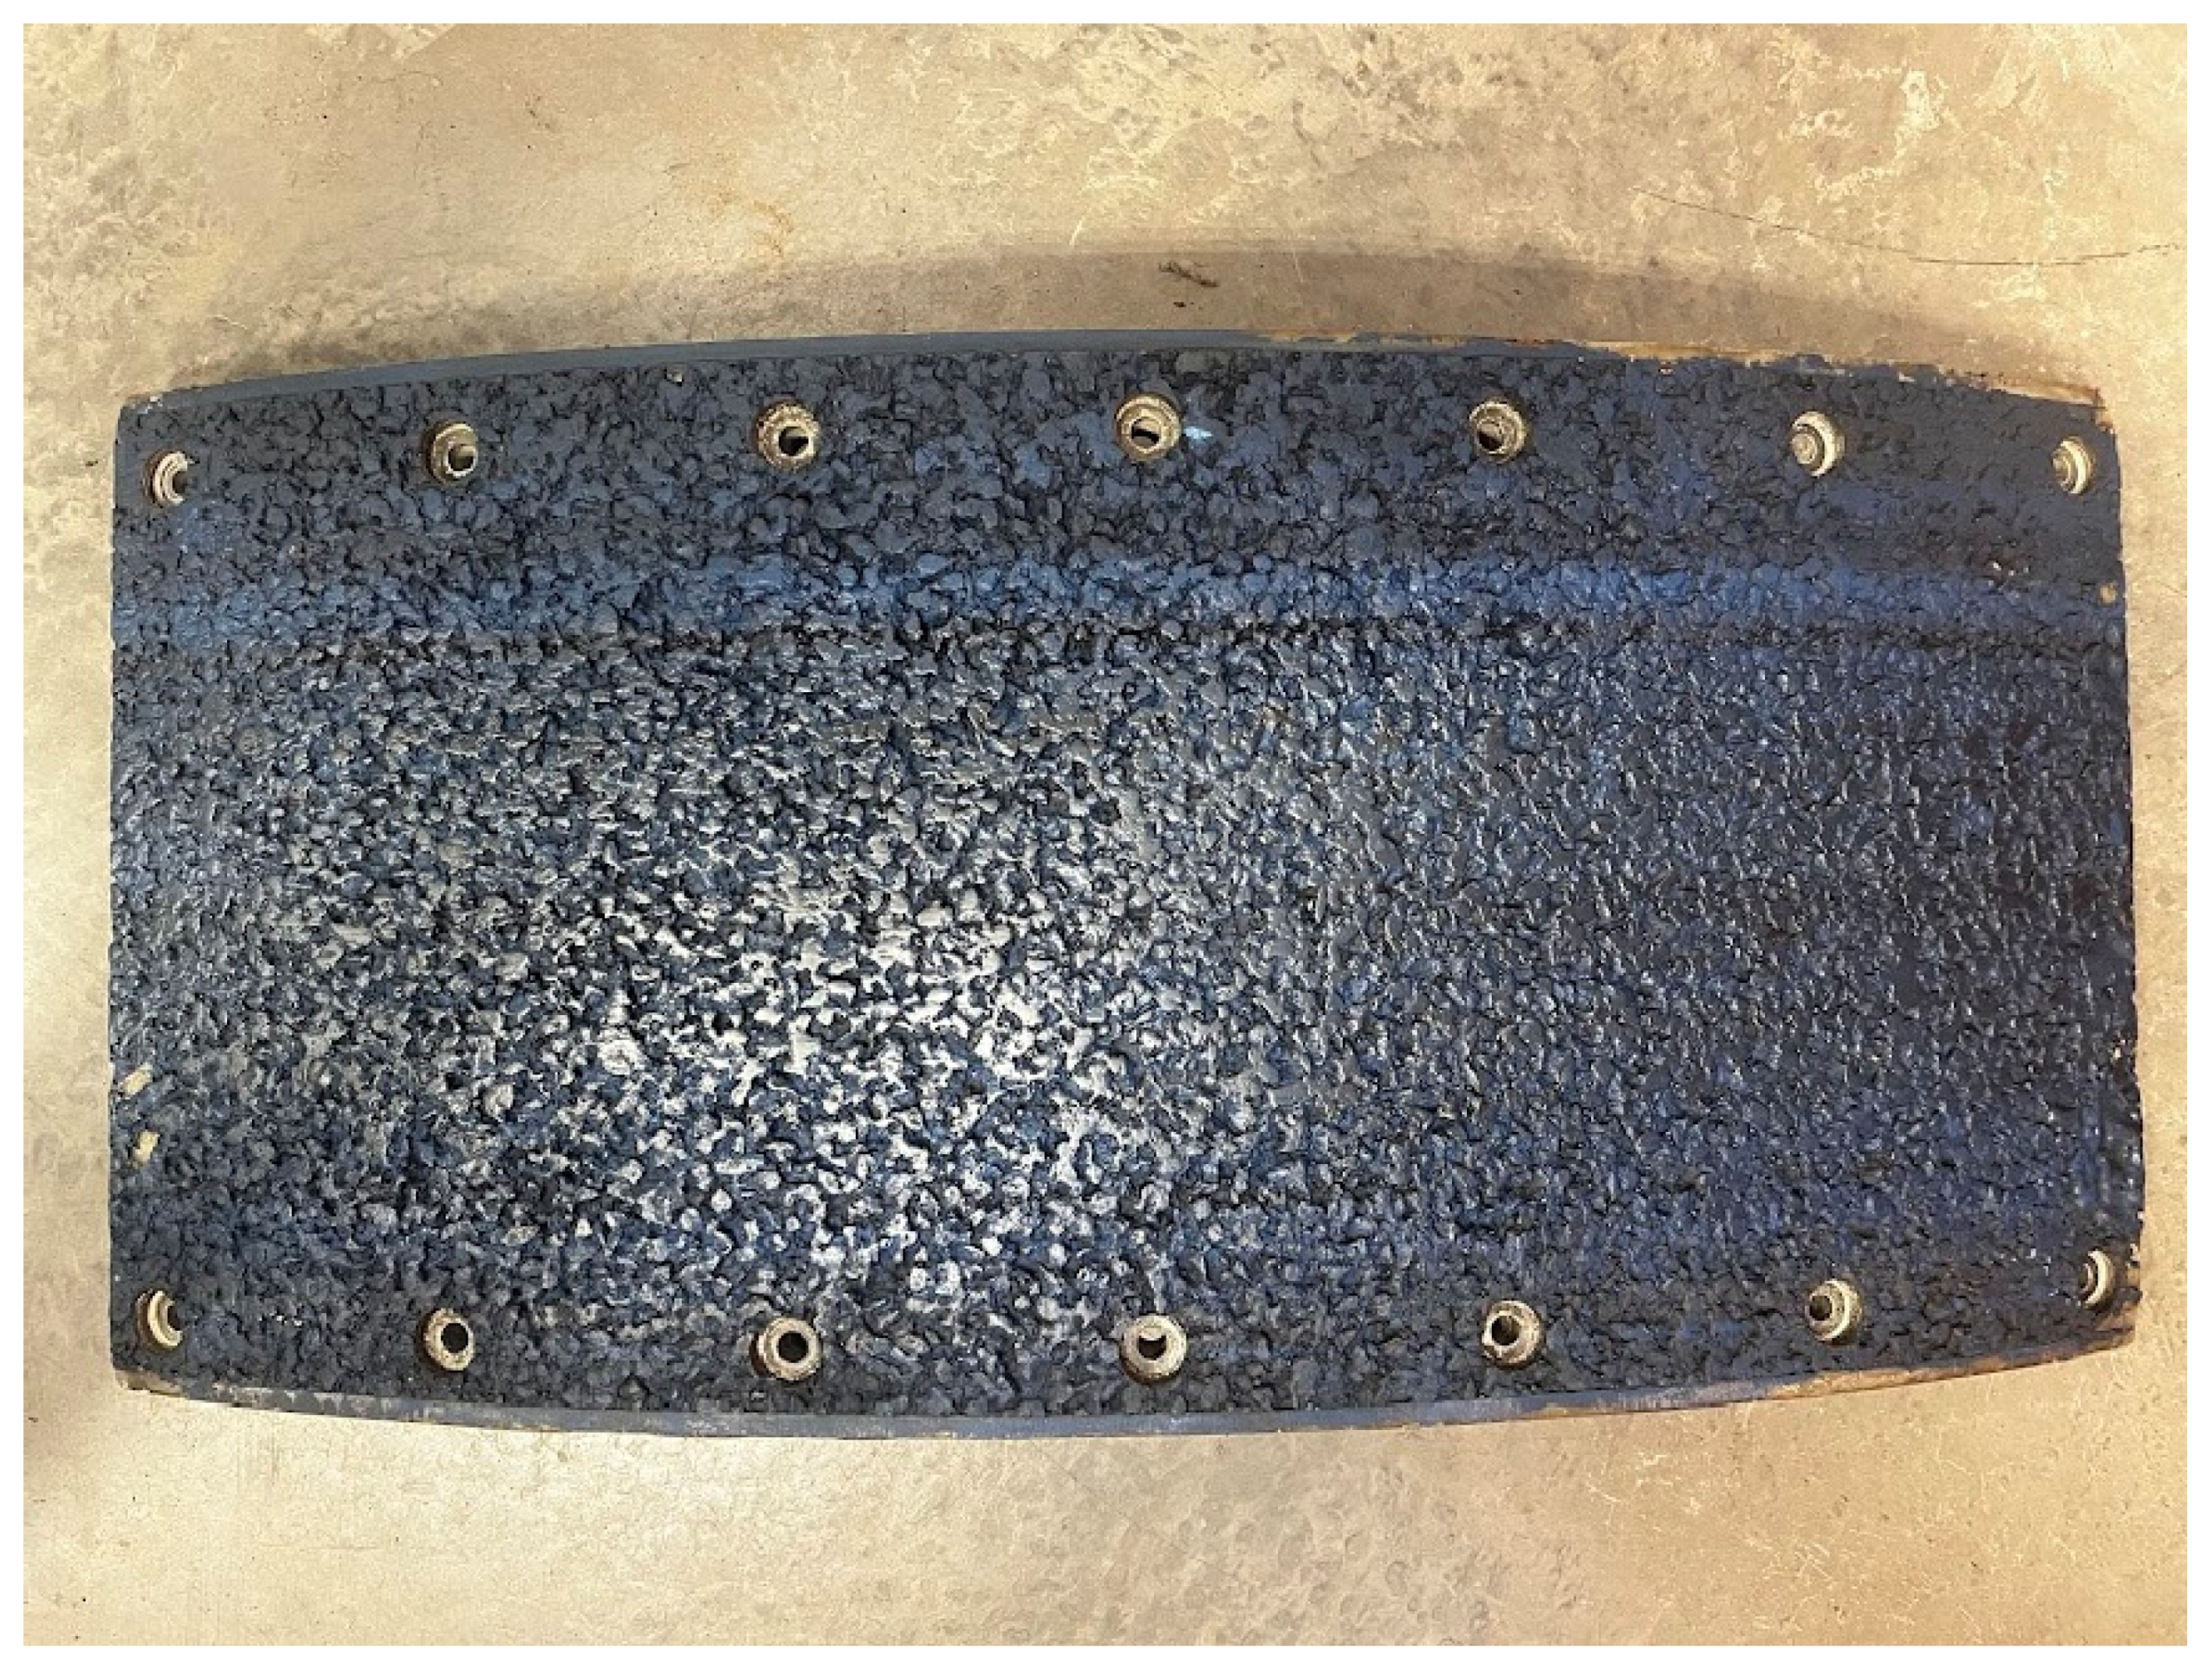
2.2. The Road Surface Replicas Used During the Tests

The tests were conducted using three types of road surface replicas: PERS, SMA8, and APS4 (see Figure 6, Figure 7 and Figure 8):
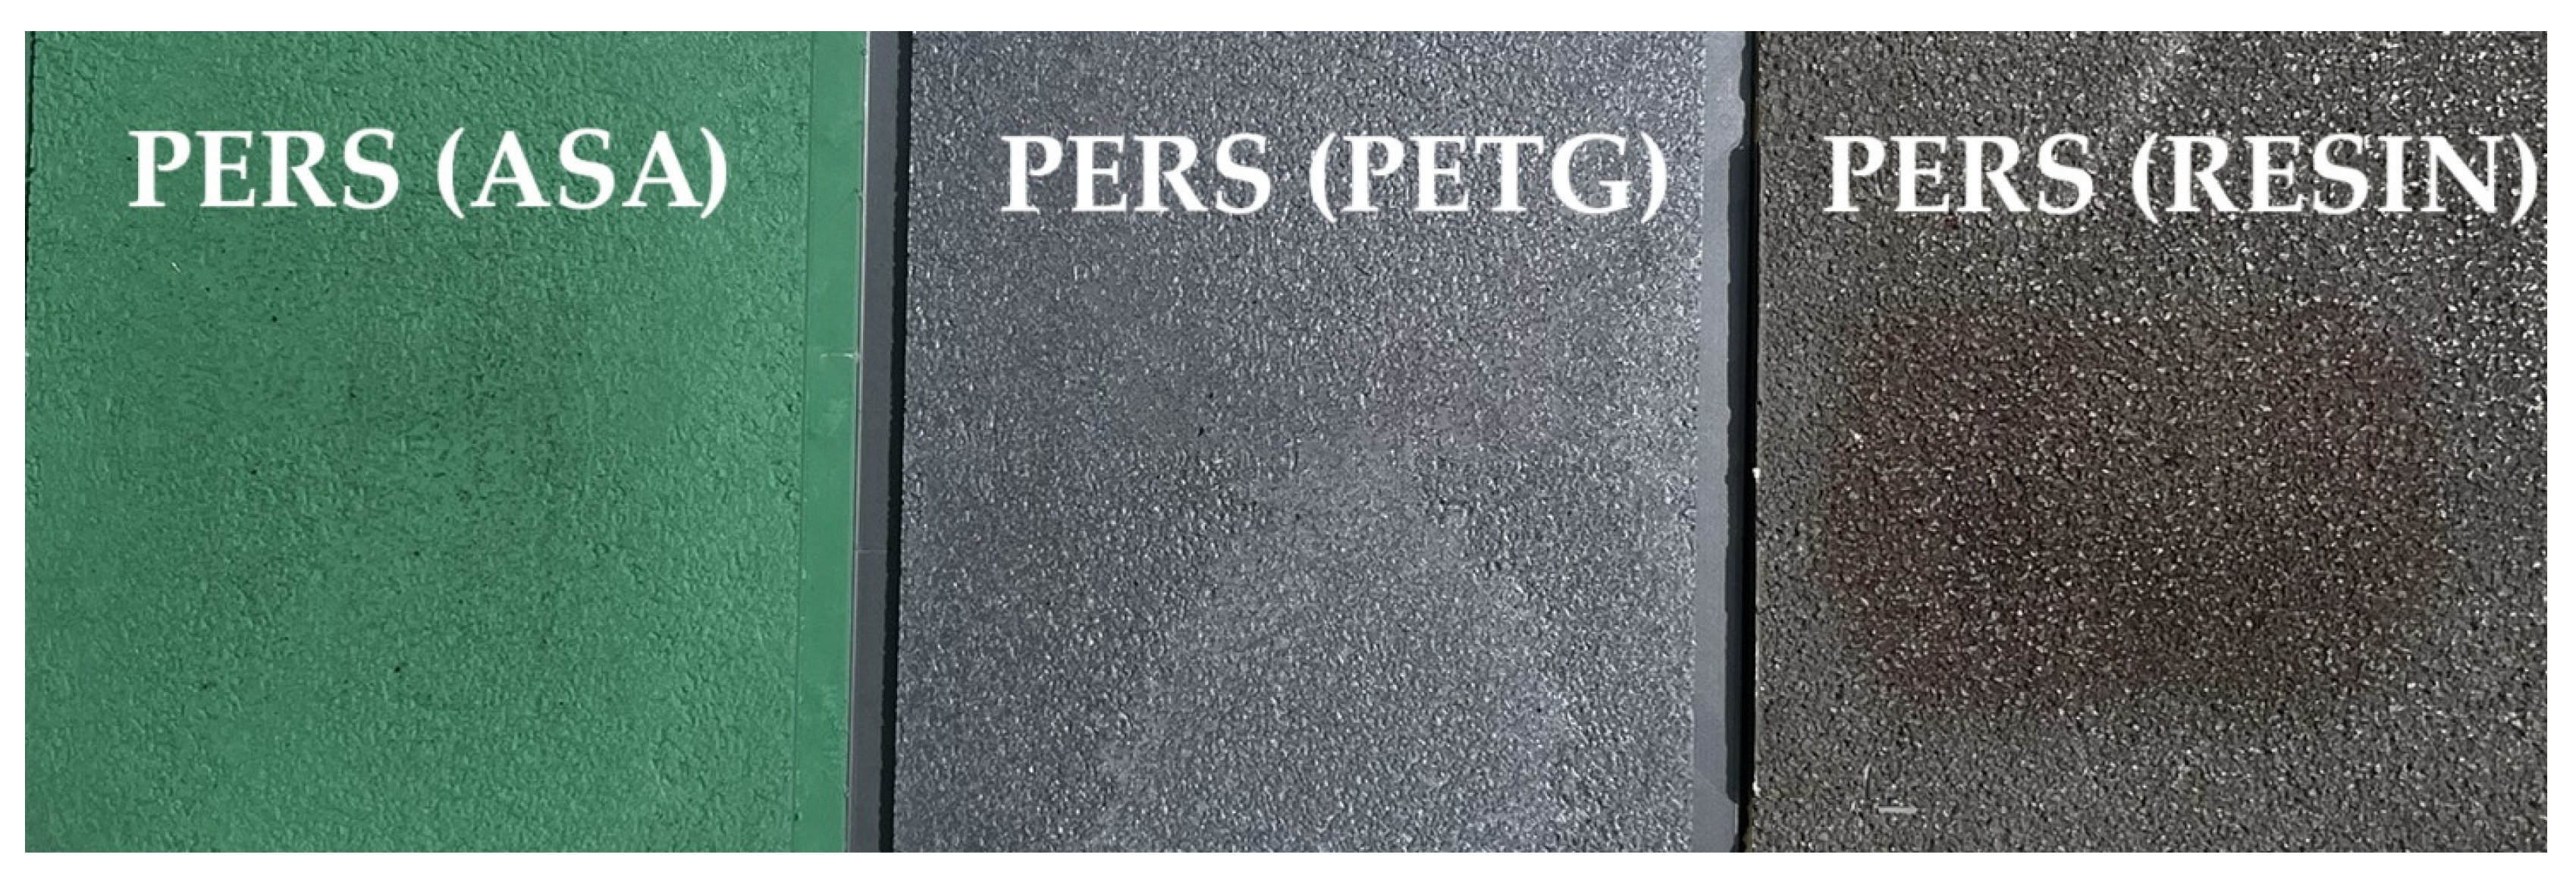
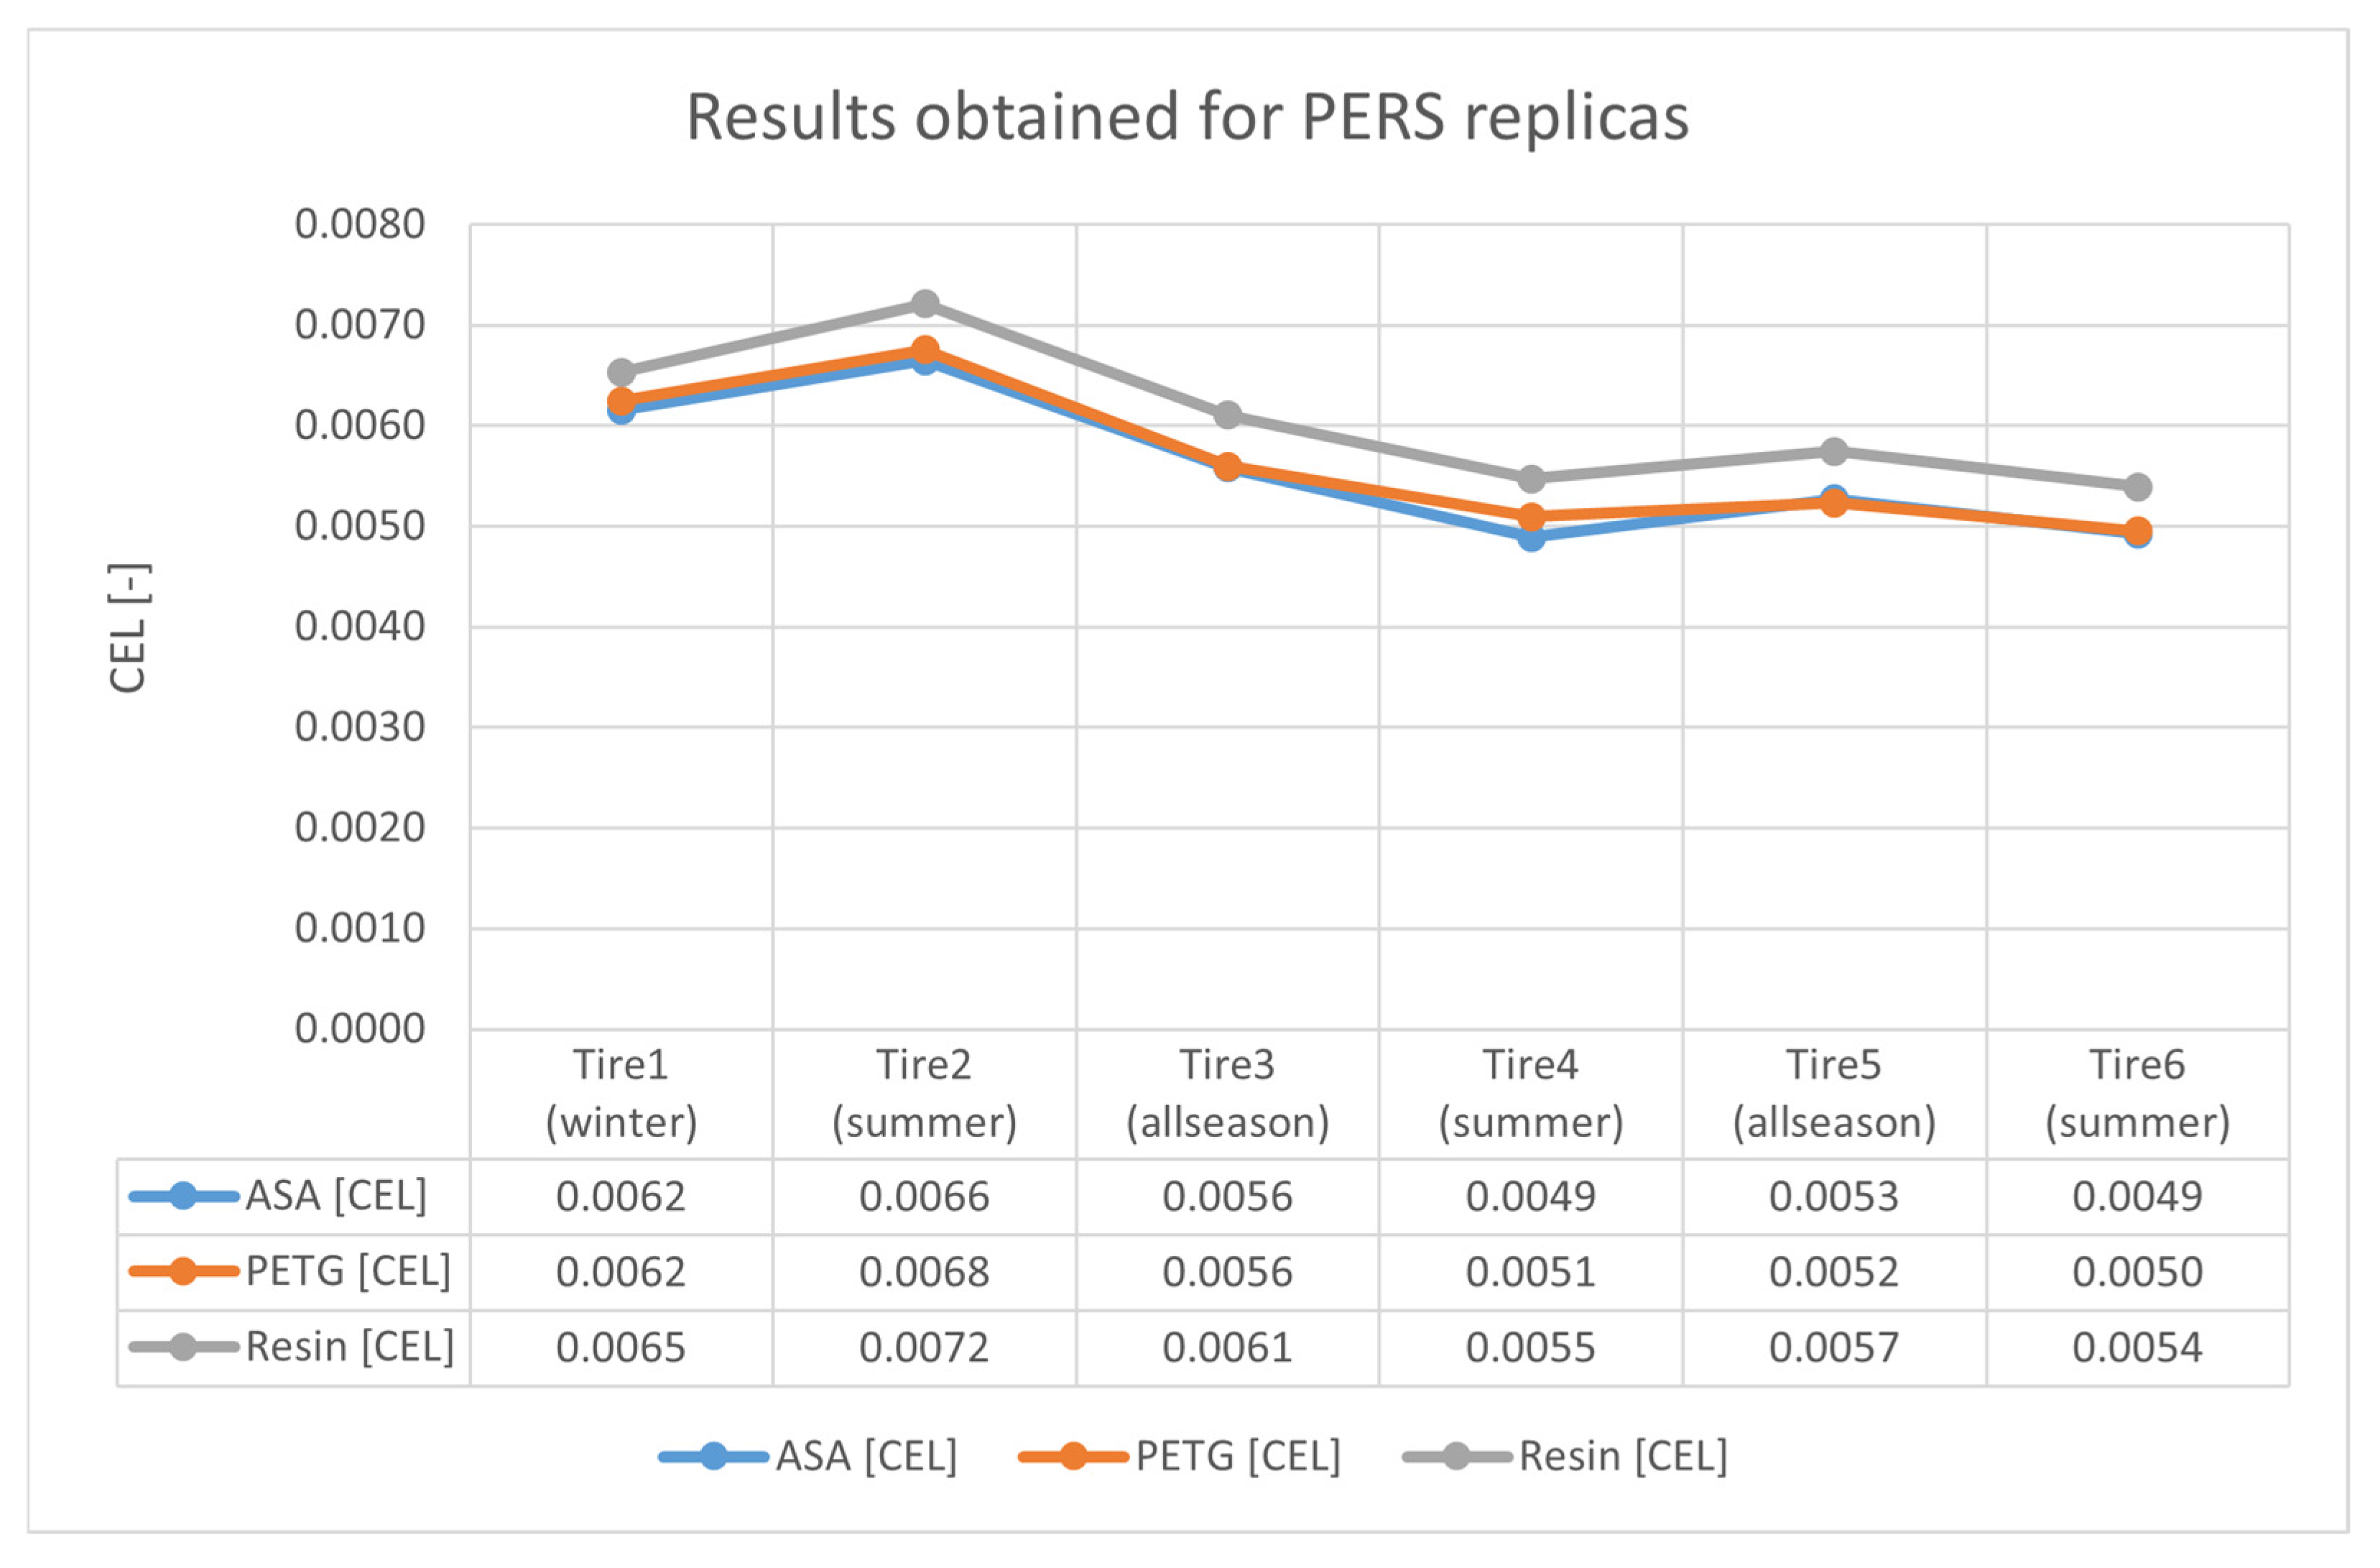
  • PERS (Porous Elastic Road Surface) is a porous, elastic road surface designed to reduce noise generated by tire–road interaction. It is typically composed of a mixture of rubber granules (often recycled tire rubber) and a polyurethane binder. Due to its structure, PERS offers good elasticity, vibration damping capabilities, and anti-skid properties, while also allowing efficient water drainage, which enhances driving safety [32].
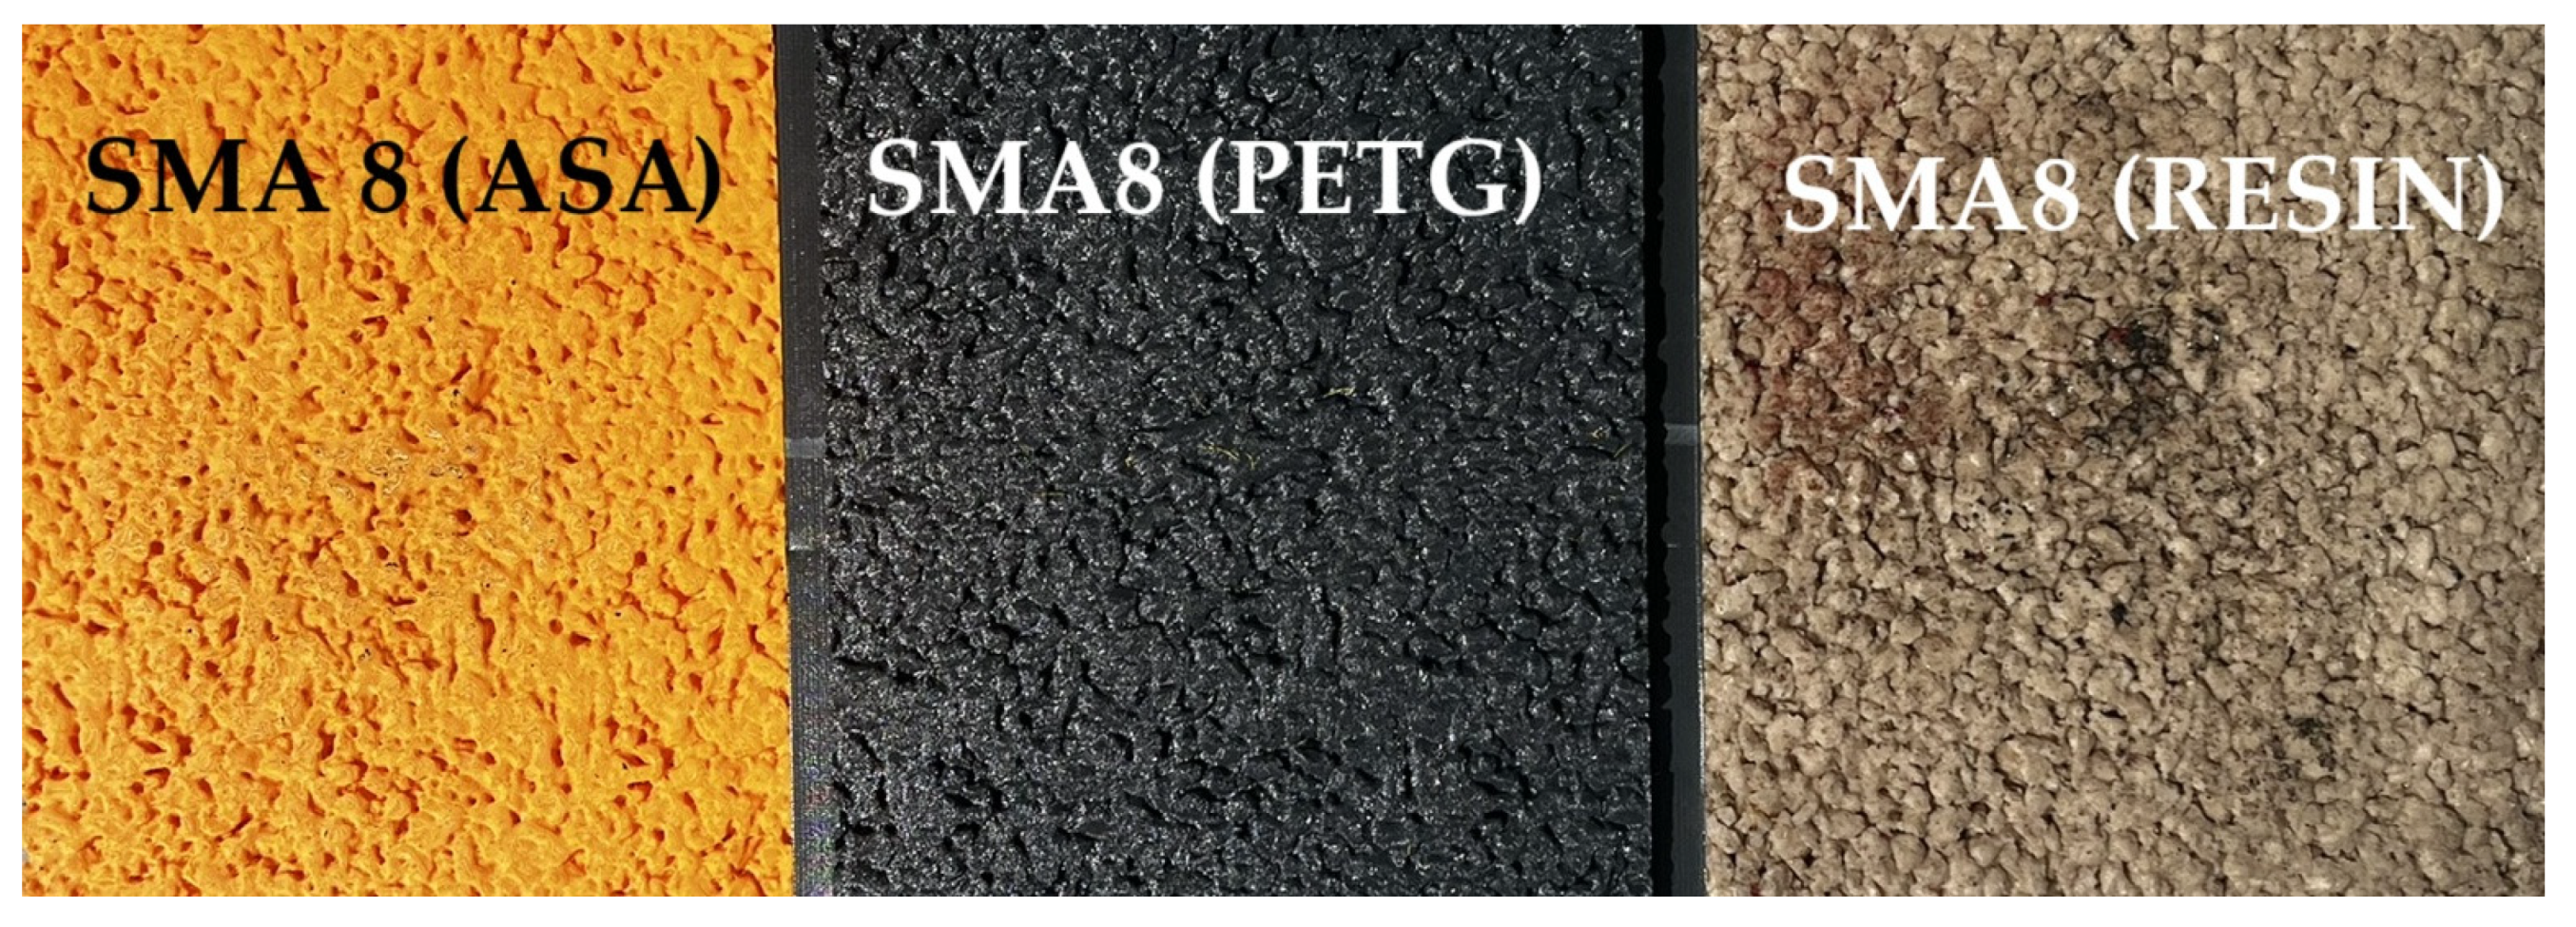
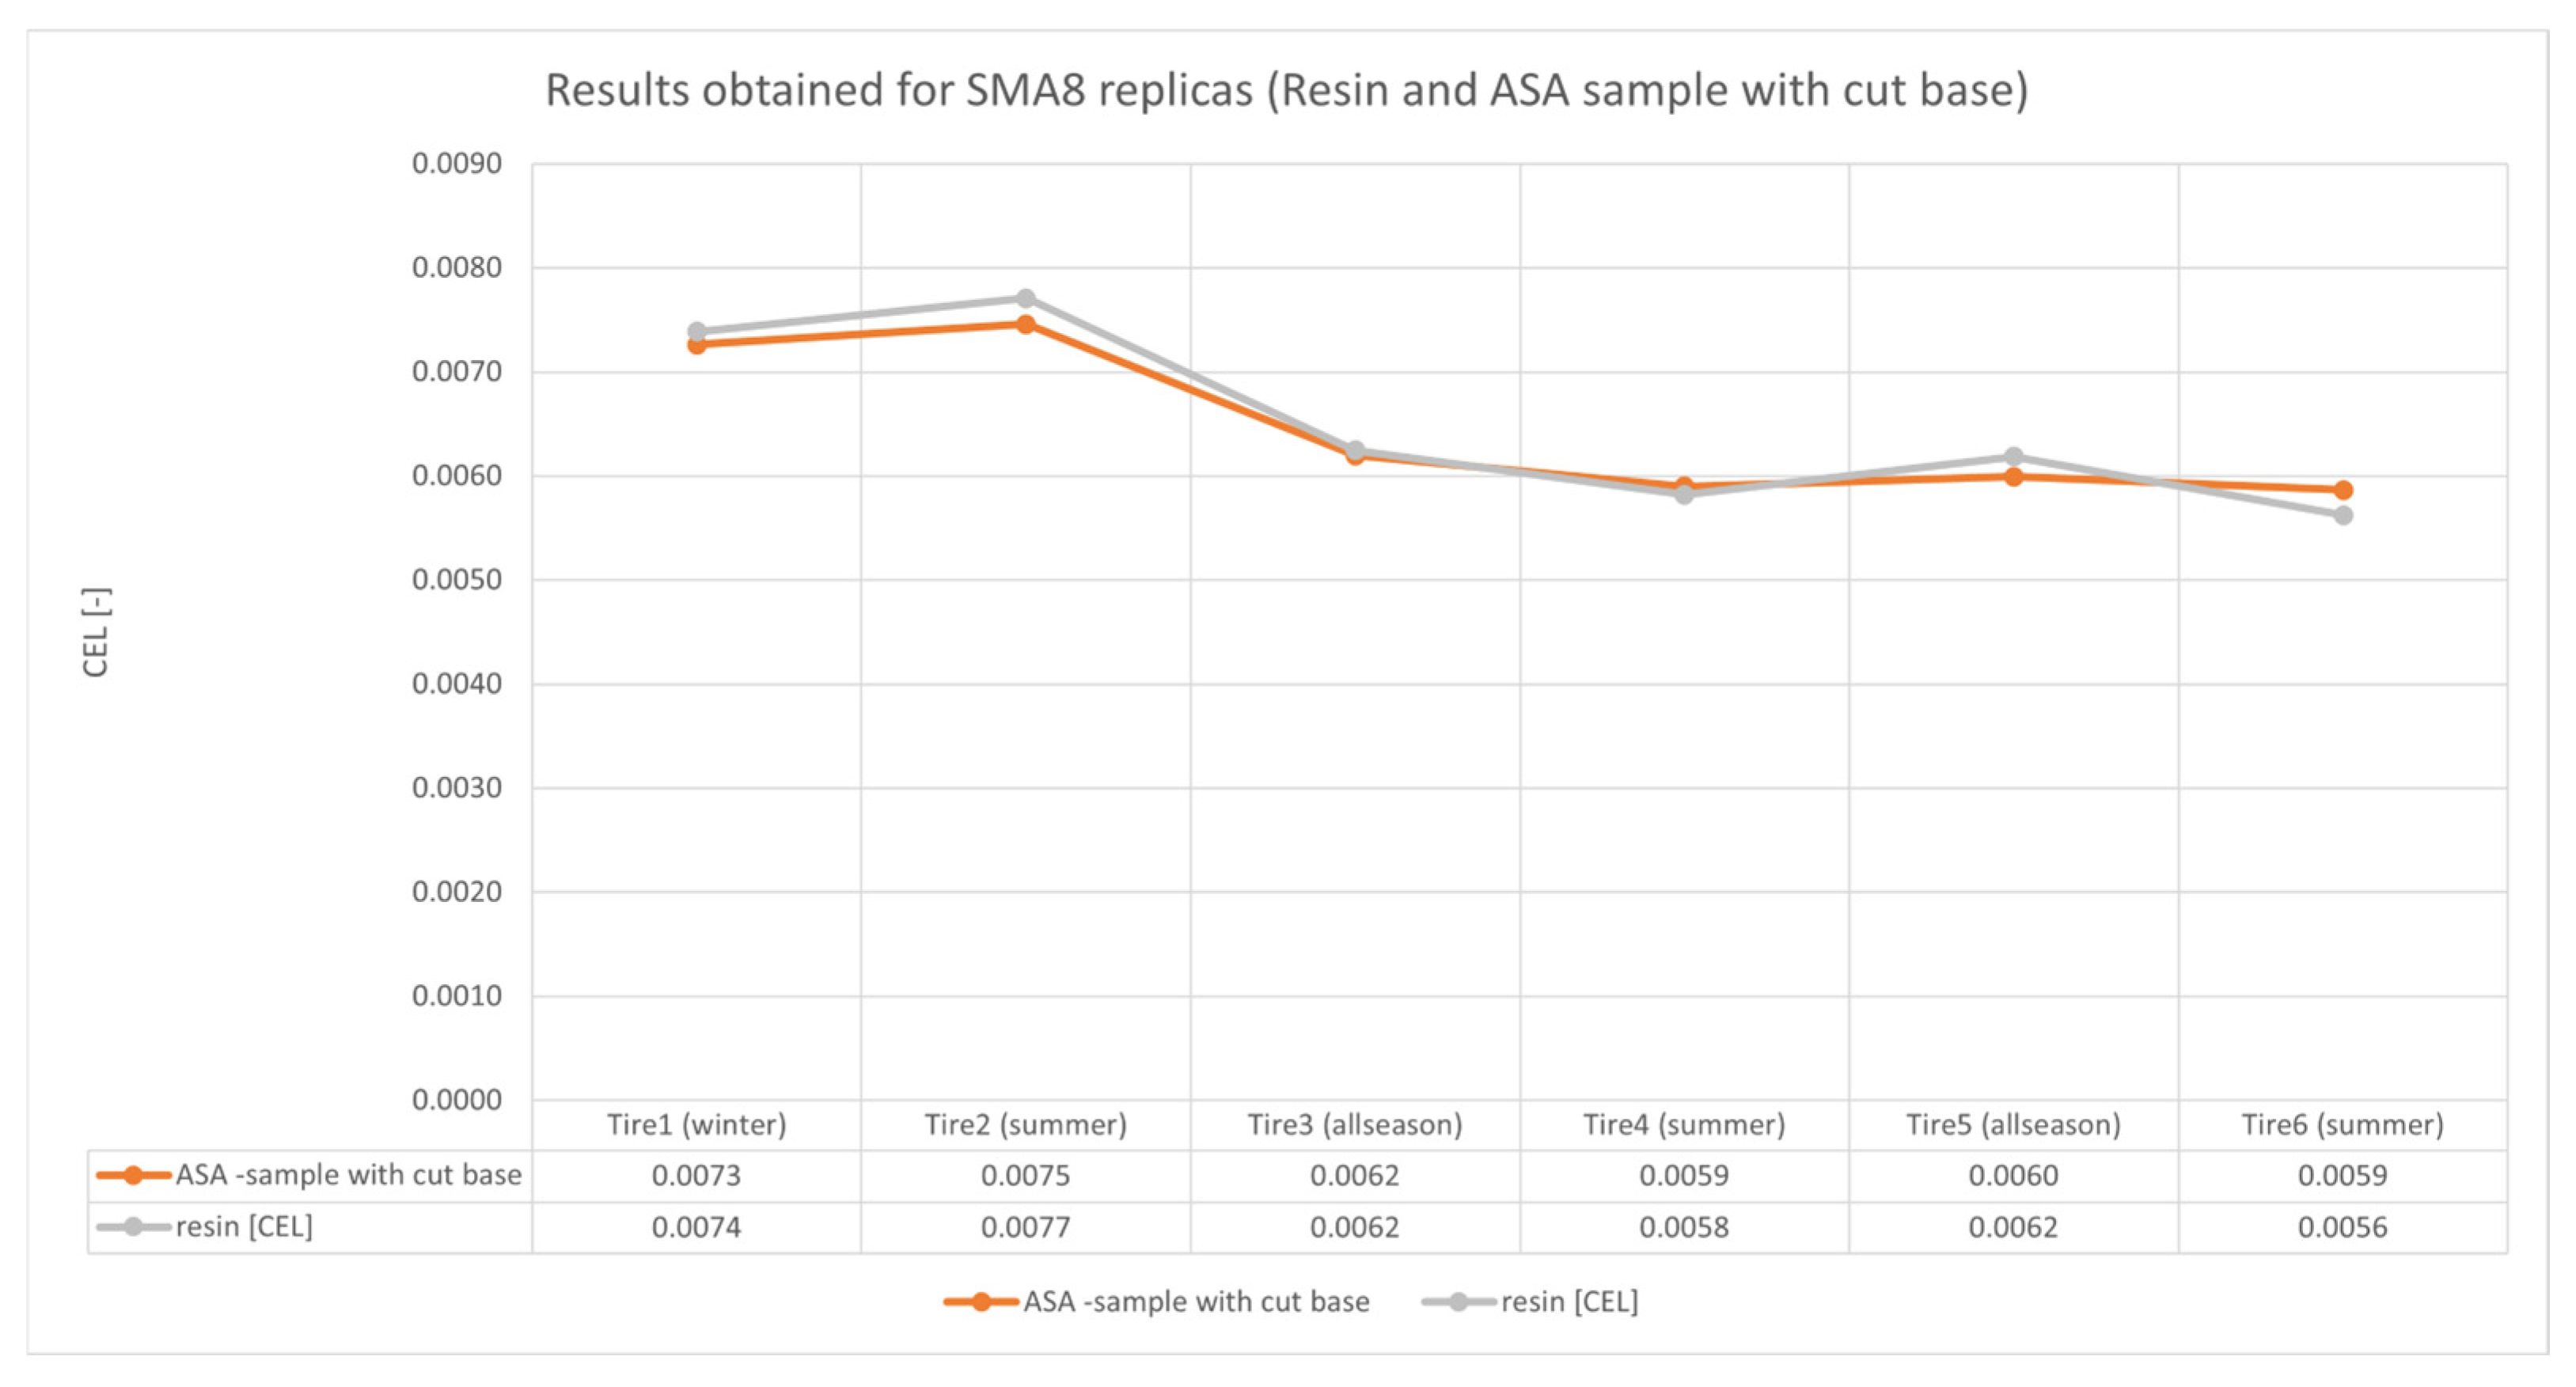
  • SMA8 (Stone Mastic Asphalt 8) is a type of mastic asphalt featuring finer aggregate grading, with a maximum aggregate size of 8 mm. It is characterized by a high content of coarse aggregate, asphalt binder, and stabilizing additives such as cellulose fibers. SMA8 is commonly used as a wearing course in pavement structures, offering excellent rutting resistance, fatigue durability, and favorable acoustic properties. Its dense structure and high binder content ensure good impermeability and long-term performance. Testing on SMA8 replicas is especially relevant in light of findings by Zaumanis and Haritonovs (2015), who demonstrated that SMA mixtures provide superior durability and rutting resistance under long-term, real-world traffic loads. This supports the selection of SMA8 as a reference material in laboratory studies simulating wheel–pavement interaction [33].
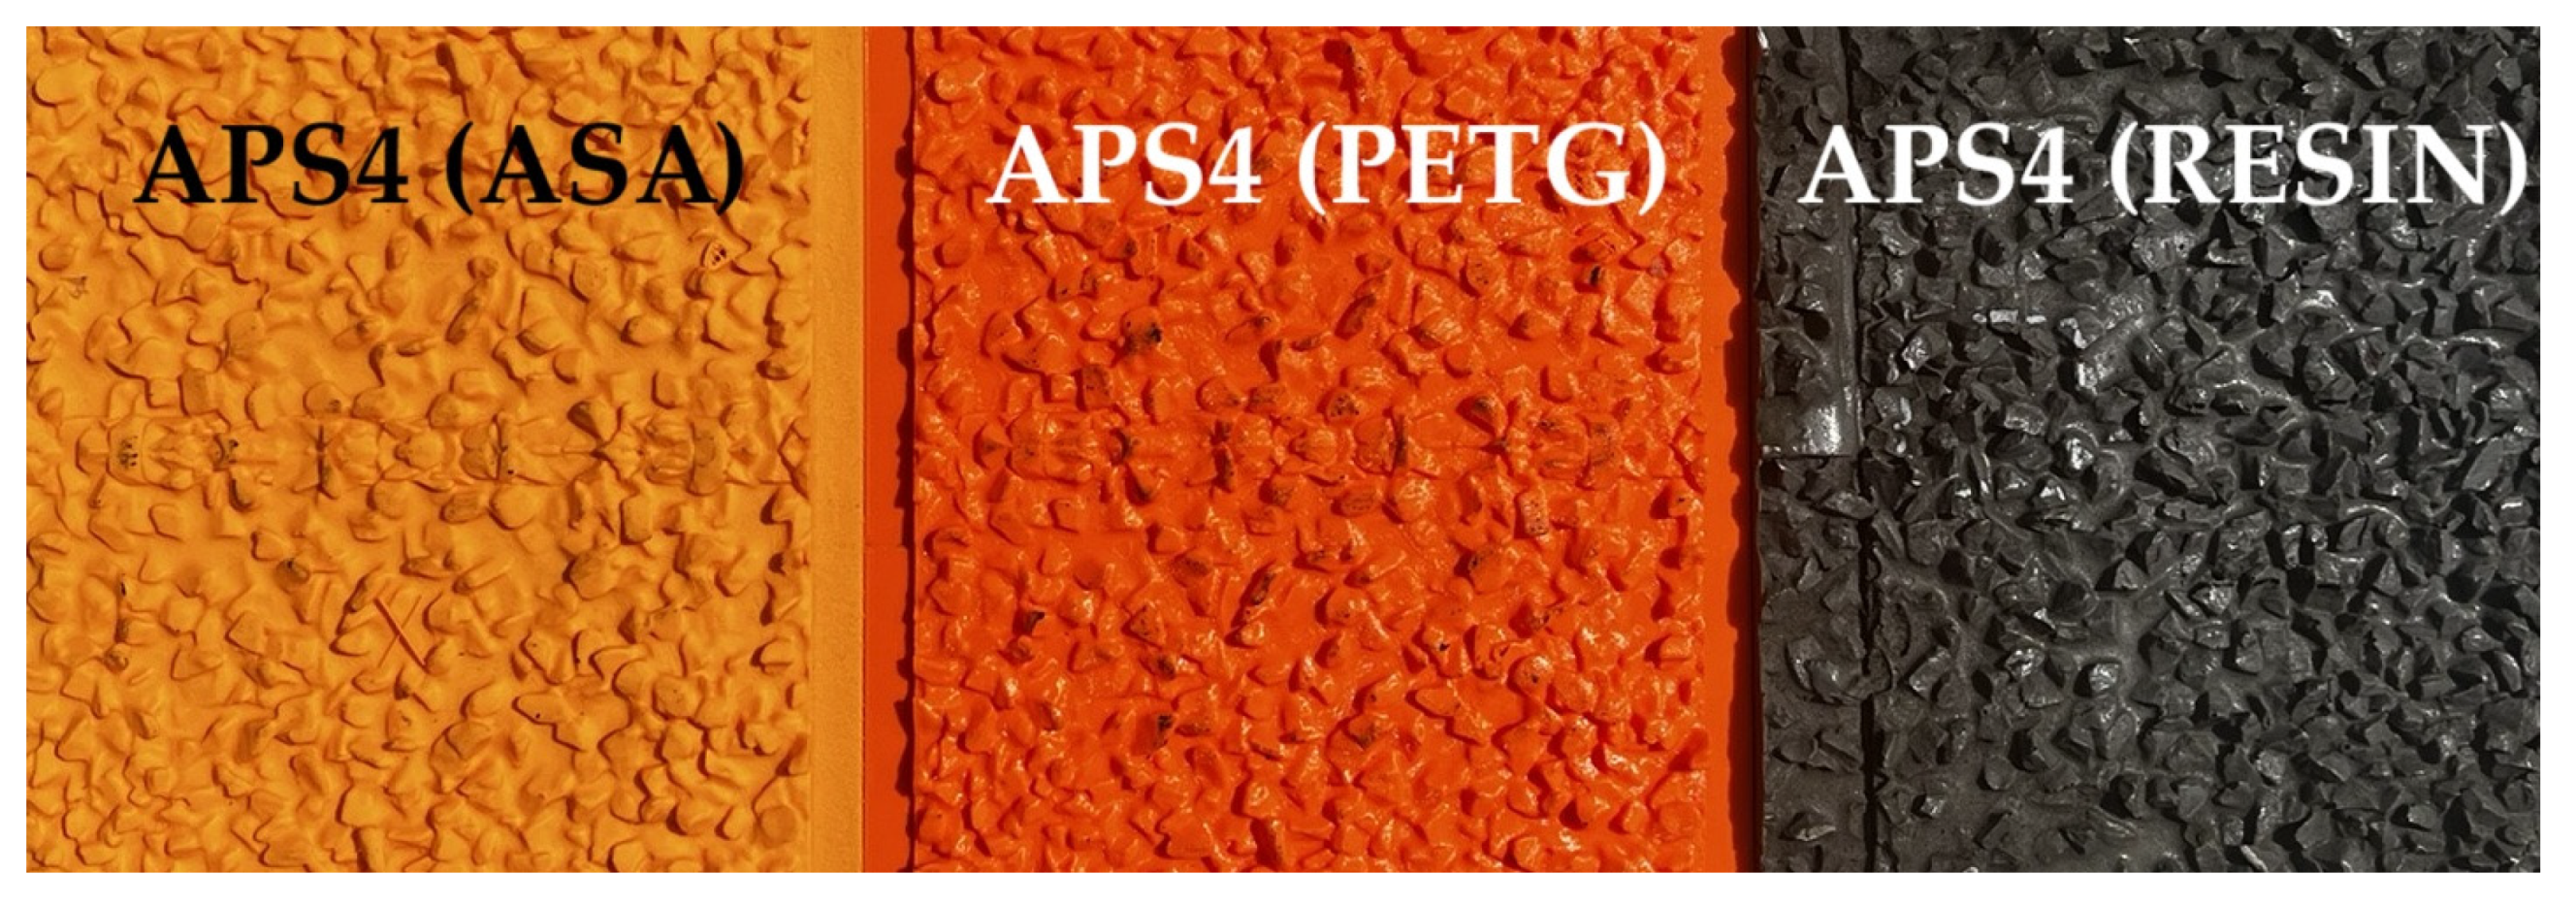
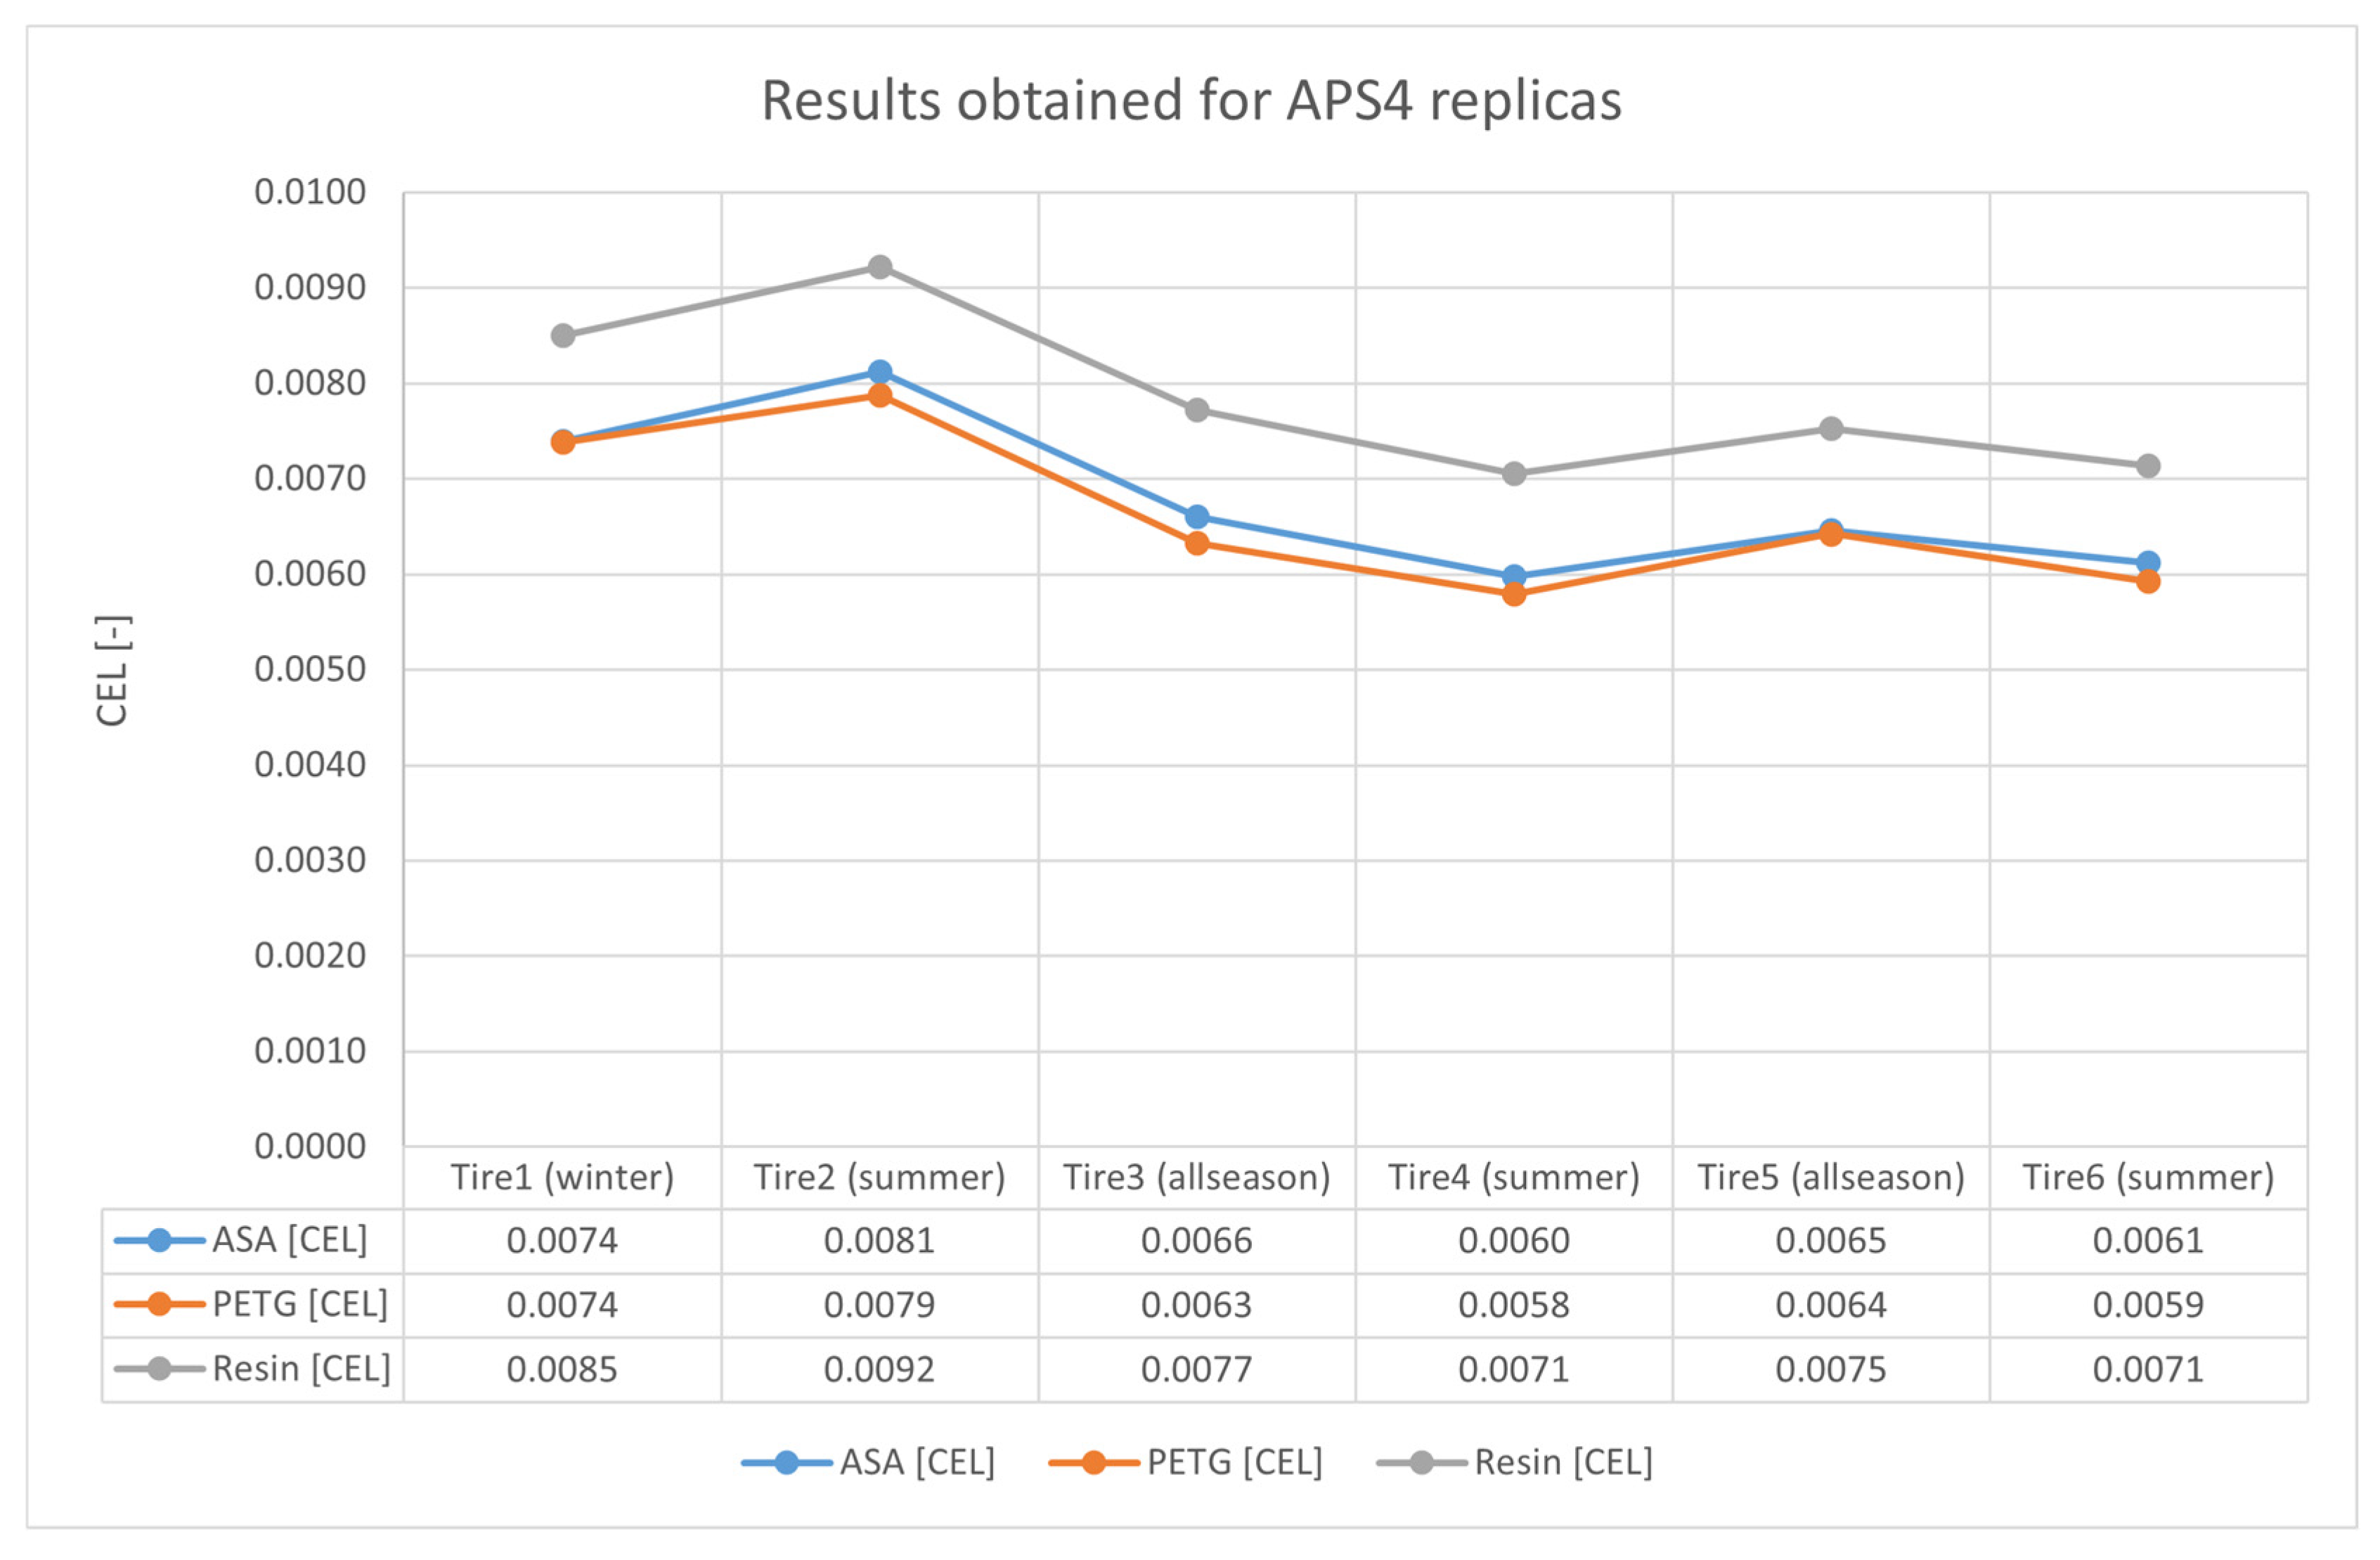
  • APS4 is an imitation of a highly rough road surface, created as a surface treatment [34].
The replicas were produced using both 3D printing technology and traditional casting with epoxy resins (see Figure 6, Figure 7 and Figure 8).
  • The first and second series consisted of replicas fabricated via 3D printing. PETG (Polyethylene Terephthalate Glycol) and ASA (Acrylonitrile Styrene Acrylate) were selected due to their complementary mechanical and processing properties, which align well with the functional requirements of the test setup. The 3D printing parameters included a 5% infill density and a Tri-hexagon infill pattern. The choice of these filaments and the printing method were based on strength tests described in a previous publication by the researchers [35].
  • The third series was produced using the conventional casting method with epoxy resin. This series served as the reference standard for comparison with the results obtained from the 3D-printed replicas.

2.3. The Tires Used During the Tests

Six tires of different types (summer, winter, and all-season) were used for the measurements. All tires had the same size and load index (205/55R16 and LI 91, corresponding to a maximum load capacity of 615 kg). The tests were conducted under standard conditions for the oscillatory method: an internal tire pressure of 210 kPa, an ambient temperature of 25 °C, and a load of 50 kg (including the mass of the wheel, the arm, and additional weights).

3. Results and Discussion

This section presents the results obtained from tests conducted on the individual types of road surfaces.
The results obtained for the APS4 surface replicas across all measurement series are presented in Table 1. When comparing the results for the ASA-printed surfaces to those for the reference surfaces (cast from resin), the values were on average 13.9% lower (ranging from 12% to 15.2%). For the replicas printed from PETG, the results were also lower, with an average difference of 15.9% (ranging from 13.2% to 18.1%).
The ranking of tires according to the decreasing oscillation coefficient is consistent across all measurement series (see Figure 9).
The results obtained for the SMA8 surface replicas across all measurement series are presented in Table 2. When comparing the ASA-printed surfaces to the reference surfaces (cast from resin), the results were on average 11.5% lower (ranging from 6.6% to 14.5%). Similarly, the replicas printed from PETG showed lower results by an average of 13.4% (ranging from 11.4% to 16.4%).
The ranking of tires by decreasing oscillation coefficient is identical across all measurement series (see Figure 10).
The results for the PERS surface across all measurement series are presented in Table 3. When comparing the ASA-printed surfaces to the reference surfaces (cast from resin), the results were, on average, 8.3% lower (ranging from 5.7% to 10.6%). For the replicas printed from PETG, the results were also lower by an average of 7.2% (ranging from 4.4% to 8.9%).
The ranking of tires by decreasing oscillation coefficient is identical for both measurement series (see Figure 11).
The measurement results obtained from 3D-printed replicas consistently showed lower CEL coefficient values compared to those obtained from surfaces manufactured using the traditional casting method. Specifically, replicas printed with the ASA material exhibited, on average, an 11.23% lower value, while those made with PETG showed a 12.17% reduction. To investigate the cause of this discrepancy, an additional series of measurements was conducted. In this series, SMA8 surface replicas printed with the ASA material were produced without the tri-hexagon infill base instead; only a 1 cm thick layer replicating the exact surface texture was retained (see Figure 12).
As previously mentioned, the base of the replicas was constructed using a tri-hexagon geometry with 5% infill density. From a mechanical strength perspective, such replicas fulfilled their intended function [34]. However, the low infill density may have led to excessive deflection, which in turn could have caused the tested tire to be “propelled” to a greater height than with standard replicas. This, consequently, may have resulted in the observed underestimation of the measurement values. As shown in Table 4 and in the graph (Figure 13), this modification resulted in greater consistency between the obtained results, with an average difference of 2.43% (ranging from 0.82% to 4.15%).
The greatest differences were observed for the APS4 surface, followed by SMA8, with the smallest differences recorded for PERS. It can be seen that the discrepancies decrease as the surface texture becomes progressively smoother. This suggests that the APS4 and SMA8 surfaces, due to their more “scratched” texture, may be more challenging to replicate accurately using 3D printing. To achieve greater printing precision, it may be beneficial to reduce the thickness of the extruded filament layer. Nevertheless, the degree of correlation remains high, and the ranking of surfaces and tires is identical across both methods.

4. Conclusions

The analysis of the obtained results led to the formulation of the following conclusions:
  • Road surface replicas produced using 3D printing exhibited lower values of the CEL (coefficient of rolling resistance) compared to replicas made using the traditional epoxy resin casting method.
  • The average reduction in CEL values was 11.23% for surfaces printed with ASA and 12.17% for those printed with PETG.
  • The greatest differences between the methods were observed for the APS4 surface, followed by SMA8, with the smallest differences noted for PERS. This suggests that rougher and more complex textures are more difficult to reproduce accurately using 3D printing.
  • Modifying the replica design—by removing the low-infill base and retaining only a thin textured layer—improved the consistency of results, reducing the average discrepancy to 2.43%.
  • Despite the absolute value differences, a high correlation was maintained between the results from 3D-printed and cast replicas, along with consistent surface and tire ranking.
  • 3D-printed replicas can be effectively used for comparative rolling resistance testing, provided that printing parameters and sample construction are optimized.
It is important to emphasize that the intended application of the printed replicas is their use as drum coverings in torque-based rolling resistance testing. Measurements obtained using the oscillatory method serve only to estimate energy losses at the tire–road interface, which directly correlate with rolling resistance. Although the oscillatory method has not yet been standardized, research is ongoing to further develop it. This method offers a practical solution for preliminary evaluations, reducing the costs associated with constructing long test tracks under real-world conditions—or, as in this case, enabling the production of full-scale printed replicas for rolling resistance testing machines. This approach allows for the ranking of road sections based on rolling resistance variability and the elimination of sections with extreme values.

Author Contributions

Conceptualization, W.O.; Methodology, W.O. and G.R.; Software, G.R.; Validation, W.O.; Formal analysis, W.O., S.S. and G.R.; Data curation, S.S.; Writing – original draft, W.O.; Visualization, S.S.; Supervision, W.O.; Funding acquisition, W.O. All authors have read and agreed to the published version of the manuscript.

Funding

Financial support of these studies from Gdańsk University of Technology by the DEC-037406 grant under the ARGENTUM TRIGGERING RESEARCH GRANTS—‘Excellence Initiative—Research University’ program is gratefully acknowledged.

Data Availability Statement

Data available on request.

Acknowledgments

The authors would like to acknowledge Marcin Żurek for his contribution to measurements.

Conflicts of Interest

The authors declare no conflicts of interest. The funders had no role in the design of the study; in the collection, analyses, or interpretation of data; in the writing of the manuscript; or in the decision to publish the results.

References

  1. Reimpell, J.; Betzler, J. Podwozia Samochodów Podstawy Konstrukcji; WKŁ: Warszawa, Poland, 2001; pp. 151–154. [Google Scholar]
  2. Taryma, S. Opór Toczenia Opon Samochodowych; Wydawnictwo PG: Gdańsk, Poland, 2007. [Google Scholar]
  3. Clark, S.K. A brief history of tire rolling resistance. In Proceedings of the Symposium on Tire Rolling Resistance at 122nd Meeting of Rubber Division, American Chemical Society, Chicago, IL, USA, 5–7 October 1982. [Google Scholar]
  4. Clark, S.K.; Dodge, R.N. A Handbook for the Rolling Resistance of Pneumatic Tires; Institute of Science and Technology, The University of Michigen: Ann Arbor, MI, USA, 1979. [Google Scholar]
  5. Andersen, L.G.; Larsen, J.K.; Fraser, E.S.; Schmidt, B.; Dyre, J.C. Rolling resistance measurement and model development. J. Transp. Eng. 2015, 141, 04014075. [Google Scholar] [CrossRef]
  6. 6. Ejsmont, J.; Ronowski, G.; Berge, T.; Sommer, S.; Owczarzak, W.; Szerszyńska, A. At what temperature should the tire rolling resistance be measured? Proc. Inst. Mech. Eng. Part D J. Automob. Eng. 2024. [Google Scholar] [CrossRef]
  7. Sun, Z.; Premarathna, W.; Anupam, K.; Kasbergen, C.; Erkens, S.M. A state-of-the-art review on rolling resistance of asphalt pavements and its environmental impact. Constr. Build. Mater. 2024, 411, 133589. [Google Scholar] [CrossRef]
  8. ISO 13473-5:2009(en); Characterization of Pavement Texture by Use of Surface Profiles—Part 5: Determination of Megatexture. International Organization for Standardization: Geneva, Switzerland, 2009.
  9. Sandberg, U. Influence of Road Surface Texture on Traffic Characteristics Related to Environment, Economy and Safety; VTI Notat 53A-1997; Swedish National Road and Transport Research Institute: Linkoeping, Sweden, 1997.
  10. Fathi, H.; El-Sayegh, Z.; Ren, J.; El-Gindy, M. Analysis of Tire-Road Interaction: A Literature Review. Machines 2024, 12, 812. [Google Scholar] [CrossRef]
  11. Von Meier, A.; Van Blokland, G.J.; Descornet, G. The influence of texture and sound absorption on the noise of porous road surfaces. In Proceedings of the 2nd International Symposium on Road Surface Characteristics, Berlin, Germany, 23–26 June 1992. [Google Scholar]
  12. Lak, M.A.; Degrande, G.; Lombaert, G. Influence of poroelastic road surfaces on ground borne vibration due to traffic. In Deliverable D6.8; 7FP Persuade; European Commission: Brussels, Belgium, 2013. [Google Scholar]
  13. Hoever, C.; Kropp, W. A model for investigating the influence of road surface texture and tyre tread pattern on rolling resistance. J. Sound Vib. 2015, 351, 161–176. [Google Scholar] [CrossRef]
  14. Ejsmont, J.; Ronowski, G.; Ydrefors, L.; Owczarzak, W.; Sommer, S.; Świeczko-Żurek, B. Comparison of Tire Rolling Resistance Measuring Methods for Different Surfaces. Int. J. Automot. Technol. 2024, 25, 965–976. [Google Scholar] [CrossRef]
  15. ISO28580; Passenger Car, Truck and Bus Tyres—Methods of Measuring Rolling Resistance—Single Point Test and Correlation of Measurement Results, 2nd ed. International Organization for Standardization: Genève, Switzerland, 2018.
  16. J2452_201707; Society of Automotive Engineers. Stepwise Coastdown Methodology for Measuring Tire Rolling Resistance. Society of Automotive Engineers: Warrendale, PA, USA, 2017.
  17. ISO18164; Passenger Car, Truck, Bus and Motorcycle Tyres—Methods of Measuring Rolling Resistance, 2nd ed. International Organization for Standardization: Genève, Switzerland, 2005.
  18. J1269_201912; Rolling Resistance Measurement Procedure for Passenger Car, Light Truck, and Highway Truck and Bus Tires. Society of Automotive Engineers: Warrendale, PA, USA, 2019.
  19. Ejsmont, J.; Ronowski, G.; Sommer, S.; Owczarzak, W.; Berge, T. Replica road pavements for rolling resistance measurements. Road Mater. Pavement Des. 2025, 1–11. [Google Scholar] [CrossRef]
  20. Gong, Z.; Miao, Y.; Lantieri, C. Review of Research on Tire–Pavement Contact Behavior. Coatings 2024, 14, 157. [Google Scholar] [CrossRef]
  21. Chen, B.; Ding, P.; Wei, G.; Xiong, C.; Wang, F.; Yu, J.; Yu, H.; Zou, Y. A Study on the Contact Characteristics of Tires–Roads Based on Pressure-Sensitive Film Technology. Materials 2023, 16, 6323. [Google Scholar] [CrossRef]
  22. Chen, X.; Sathyanarayan, H.; Gong, Y.; Yi, J.; Wang, H. Dynamic Tire/Road Friction Estimation With Embedded Flexible Force Sensors. IEEE Sens. J. 2023, 23, 26608–26619. [Google Scholar] [CrossRef]
  23. Yang, S.; Chen, Y.; Shi, R.; Wang, R.; Cao, Y.; Lu, J. A Survey of Intelligent Tires for Tire-Road Interaction Recognition Toward Autonomous Vehicles. IEEE Trans. Intell. Veh. 2022, 7, 520–532. [Google Scholar] [CrossRef]
  24. Guan, J.; Zhou, X.; Liu, L.; Ran, M. Measurement of Tire-Pavement Contact Tri-Axial Stress Distribution Based on Sensor Array. Coatings 2023, 13, 416. [Google Scholar] [CrossRef]
  25. Ge, H.; Quezada, J.C.; Le Houerou, V.; Chazallon, C. Multiscale analysis of tire and asphalt pavement interaction via coupling FEM–DEM 547 simulation. Eng. Struct. 2022, 256, 113925. [Google Scholar] [CrossRef]
  26. Liu, X.; Jayme, A.; Al-Qadi, I.L. ContactGAN development–prediction of tire-pavement contact stresses using a generative and 549 transfer learning model. Int. J. Pavement Eng. 2023, 24, 2138876. [Google Scholar] [CrossRef]
  27. Gao, X.; Zhuang, Y.; Liu, S. High-speed 3D digital image correlation for measuring tire rolling resistance coefficient. Measurement 2020, 171, 108830. [Google Scholar] [CrossRef]
  28. Kawakami, A.; Ishigaki, T.; Shirai, Y.; Terada, M.; Kubo, K. Evaluation method of pavement surface characteristics for rolling resistance. Road Mater. Pavement Des. 2017, 18 (Suppl. S2), 2–11. [Google Scholar] [CrossRef]
  29. Cho, J.R.; Lee, H.W.; Jeong, W.B.; Jeong, K.M.; Kim, K.W. Numerical estimation of rolling resistance and temperature distribution of 3-D periodic patterned tire. Int. J. Solids Struct. 2013, 50, 86–96. [Google Scholar] [CrossRef]
  30. Ding, Y.; Wang, H.; Qian, J.; Zhou, H. Evaluation of tire rolling resistance from tire-deformable pavement interaction modeling. J. Transp. Eng. Part B Pavements 2021, 147, 04021041. [Google Scholar] [CrossRef]
  31. Ejsmont, J.; Owczarzak, W. Engineering method of tire rolling resistance evaluation. Measurement 2019, 145, 144–149. [Google Scholar] [CrossRef]
  32. Ejsmont, J.; Sandberg, U.; Świeczko-Zurek, B.; Mioduszewski, P. Tyre/Road Noise Reduction by a Poroelastic Road Surface. Presented at the 43rd International Congress on Noise Control Engineering: Improving the World Through Noise Control, INTERNOISE 2014, Melbourne, Australia, 16–19 November 2014. Available online: https://urn.kb.se/resolve?urn=urn:nbn:se:vti:diva-9349 (accessed on 30 May 2025).
  33. Zaumanis, M.; Haritonovs, V. Long term monitoring of full scale pavement test section with eight different asphalt wearing courses. Mater. Struct. 2016, 49, 1817–1828. [Google Scholar] [CrossRef]
  34. Taryma, S.; Woźniak, R. Wpływ zużycia opony samochodowej na jej opór toczenia. Autobusy Tech. Eksploat. Syst. Transp. 2014, 15, 272–275. [Google Scholar]
  35. Owczarzak, W.; Sommer, S.; Ronowski, G. Method of Forming Road Surface Replicas Using 3D Printing Technology. Coatings 2024, 14, 1455. [Google Scholar] [CrossRef]
Figure 1. Individual road surface texture ranges.
Coatings 15 00766 g001
Figure 2. Roadwheel facility for rolling resistance measurements.
Coatings 15 00766 g002
Figure 3. Replica of road surface made using the casting method.
Coatings 15 00766 g003
Figure 4. Oscillation method measurement stand.
Coatings 15 00766 g004
Figure 5. Method of determining energy losses by calculating the area between two envelopes of the oscillation waveform.
Coatings 15 00766 g005
Figure 6. Road surfaces replicas (PERS).
Coatings 15 00766 g006
Figure 7. Road surfaces replicas (SMA8).
Coatings 15 00766 g007
Figure 8. Road surfaces replicas (APS4).
Coatings 15 00766 g008
Figure 9. Results obtained for APS4 replicas.
Coatings 15 00766 g009
Figure 10. Results obtained for SMA8 replicas.
Coatings 15 00766 g010
Figure 11. Results obtained for PERS replicas.
Coatings 15 00766 g011
Figure 12. Replica without base (a); replica with base (b); cross-section of the base showing type and degree of filling (c).
Coatings 15 00766 g012
Figure 13. Results obtained for SMA8 replicas (ASA sample with cut base and resin one).
Coatings 15 00766 g013
Table 1. Results obtained for APS4 surface for all measurement series.
TireASA [CEL]PETG [CEL]Resin [CEL]ASA-
Resin[%]
PETG-
Resin[%]
Tire1 (winter)0.00650.00640.007412.313.4
Tire2 (summer)0.00720.00680.00777.011.4
Tire3 (allseason)0.00580.00530.00626.614.5
Tire4 (summer)0.00500.00490.005814.216.4
Tire5 (allseason)0.00530.00540.006214.513.0
Tire6 (summer)0.00480.00500.005614.311.4
Table 2. Results obtained for SMA8 surface for all measurement series.
TireASA [CEL]PETG [CEL]Resin [CEL]ASA-
Resin[%]
PETG-
Resin[%]
Tire1 (winter)0.00650.00640.007412.313.4
Tire2 (summer)0.00720.00680.00777.011.4
Tire3 (allseason)0.00580.00530.00626.614.5
Tire4 (summer)0.00500.00490.005814.216.4
Tire5 (allseason)0.00530.00540.006214.513.0
Tire6 (summer)0.00480.00500.005614.311.4
Table 3. Results obtained for PERS surface for both measurement series.
TireASA [CEL]PETG [CEL]Resin [CEL]ASA-
Resin[%]
PETG-
Resin[%]
Tire1 (winter)0.00620.00620.00655.74.4
Tire2 (summer)0.00660.00680.00727.86.4
Tire3 (allseason)0.00560.00560.00618.68.3
Tire4 (summer)0.00490.00510.005510.66.9
Tire5 (allseason)0.00530.00520.00578.28.9
Tire6 (summer)0.00490.00500.00548.88.1
Table 4. Results obtained for SMA8 surface for ASA sample with cut base and resin replica.
TireASA Sample with Cut Base [CEL]Resin
[CEL]
Tire1 (winter)0.00730.0074
Tire2 (summer)0.00750.0077
Tire3 (allseason)0.00620.0062
Tire4 (summer)0.00590.0058
Tire5 (allseason)0.00600.0062
Tire6 (summer)0.00590.0056
Disclaimer/Publisher’s Note: The statements, opinions and data contained in all publications are solely those of the individual author(s) and contributor(s) and not of MDPI and/or the editor(s). MDPI and/or the editor(s) disclaim responsibility for any injury to people or property resulting from any ideas, methods, instructions or products referred to in the content.

