Abstract
The modeling of the corrosion rate of Alloy 600 in primary water stress corrosion cracking conditions (PWSCC) is a challenging task for existing as well as new structures due to the wide deviation of its composition across the worldwide PWSCC environment. The major parameters influencing the rate are temperature, stress intensity factor, pH, conductivity, ECP, Yield strength, B3(OH)3, and LiOH. The individual effects of these parameters on corrosion are known to some extent; however, the combined effect of these parameters together is complex, nonlinear, and unpredictable. Herein, we developed an Artificial Neural Network to predict the corrosion crack growth rate for any combination of the above five parameters and to better understand the effects of these parameters jointly on corrosion behavior. Three-dimensional mappings clearly reveal the complex interrelationship between the temperature and stress intensity factor at different variables, and the effect of the variables rather than a single variable on the corrosion rate of Inconel alloy 600 in PWSCC conditions. Moreover, the index of relative importance for these variables has also been presented providing deep insights for anti-corrosion coating designs in PWSCC environments.
1. Introduction
The demanding operational conditions within steam generators necessitate materials capable of retaining mechanical integrity at elevated temperatures while exhibiting superior corrosion resistance [1]. Nickel-based superalloys are widely employed in such high-temperature, corrosive environments due to their excellent strength and oxidation resistance [2]. These properties are attributed to their microstructure comprising ordered precipitates dispersed within a face-centered cubic (FCC) matrix [3]. Nonetheless, exposure to steam, particularly in power generation systems, renders these alloys vulnerable to intergranular stress corrosion cracking (IGSCC) [4].
Inconel Alloy 600, a conventional choice for steam generator tubing, control rod drive mechanism (CRDM) nozzles, and other pressure boundary components in pressurized water reactors (PWRs), is valued for its corrosion resistance [5]. However, prolonged service under PWR primary conditions has revealed its susceptibility to IGSCC, especially in the mill-annealed condition [6,7]. The earliest manifestation of this degradation—designated primary water stress corrosion cracking (PWSCC)—was first identified on the primary side (“hot leg”) of steam generator tubes in contact with the reactor coolant [8,9].
PWSCC remains a critical concern due to its implications for plant safety and the significant economic burden of unanticipated component failures [10]. The crack growth rate (CGR) in Alloy 600 is governed by a multifaceted interplay of mechanical stress, environmental conditions, and inherent material susceptibility [11]. The intricate coupling of these factors renders it exceedingly difficult to isolate and assess the influence of individual parameters through conventional experimental approaches, particularly given the challenges associated with controlling or accurately quantifying numerous independent variables under high-pressure, high-temperature aqueous conditions [12,13]. Therefore, a reliable predictive model would substantially enhance mitigation strategies. It would enable proactive maintenance during scheduled outages and reduce the likelihood of costly, unplanned shutdowns.
Numerous investigations have sought to develop predictive models for PWSCC and to apply these in forecasting CGR. Recently, M. W. Rahman et al. developed a microstructure-informed, physics-guided machine learning model to predict corrosion resistance in structural alloys, achieving accurate predictions by integrating experimental data with microstructural and compositional feature [14]. J. Shi et al. proposed a coupled environment fracture model (CEFM) to predict CGR [15]. They examined the influence of stress intensity, hydrogen concentration, yield strength (YS), and temperature to quantitatively predict the CGR in PWRs. D. D. Macdonald utilized a mixed potential model to estimate electrochemical potential data for water reactors; however, his comparison was limited to a small set of in-plant data [16]. Several other empirical models have been proposed for the prediction of PWSCC, including the Materials Reliability Program MRP-55 model for alloy 600 [17], and the MRP-115 model for weld metals such as alloys 82, 182, and 132 [18]. However, these models often fall short of delivering the predictive precision required for practical engineering applications. Their accuracy diminishes significantly when evaluated against large experimental datasets, and the inherent scatter in the data is so pronounced that virtually any model can appear to match a subset, potentially resulting in misleading conclusions.
Artificial Neural Networks (ANNs) are advanced computational tools modeled after the human brain’s neural architecture [19]. Their ability to learn complex, nonlinear patterns from data has made them invaluable in materials science, particularly for predicting properties that are difficult to model using traditional methods [20,21]. In corrosion science, ANNs have shown great promise by accurately forecasting corrosion rates and behavior under varying environmental conditions [22,23]. Q. Chen et al. proposed a two-stage machine learning approach to predict atmospheric corrosion of alloy based on the previous data. In the first stage, they employed tree ensemble learning models to identify key features and generate preliminary predictions. The second stage involved the use of an ANN model to integrate the outputs of multiple models, with optimization carried out through feature importance modification [24]. J. Shi et al. [25] developed an ANN model for the prediction of CGR in Alloy 600; however, their framework was constrained by its focus on univariate predictions and lacked the capacity to evaluate the synergistic or combined influence of multiple input parameters. Furthermore, their model did not facilitate a sequential, quantitative assessment of CGR with the incremental addition of individual variables. The absence of a relative importance index also limited the interpretability of input contributions.
To overcome these limitations and advance the predictive understanding of Alloy 600’s corrosion behavior in PWSCC environments, we introduce a comprehensive ANN-based model engineered to deliver enhanced predictive precision and robustness. This model is intended not only to offer actionable insights for the formulation of more resilient anti-corrosion coatings but also to serve as a versatile computational tool for evaluating material performance under extreme service conditions. The primary objectives of this study are as follows: (i) to predict the corrosion rate of Alloy 600 in PWSCC environments, (ii) to examine the combined influence of two distinct variables on corrosion behavior, and (iii) to elucidate both qualitative patterns and quantitative correlations between input features and corrosion rate by providing detailed numerical estimations and a relative importance index for each contributing parameter.
2. Materials and Methods
2.1. Materials
The typical composition of Alloy 600 selected for this study is given in Table 1.

Table 1.
Typical chemical composition (wt.%) of Alloy 600 selected in this study.
2.2. Collection of Experimental Data
In the present investigation, a comprehensive dataset comprising 163 experimental data points related to the CGR of Alloy 600 was compiled from a range of peer-reviewed publications and technical reports [26,27,28,29,30,31,32,33,34]. Through a critical review of the literature, eight key parameters were identified as the most influential factors affecting the stress corrosion cracking behavior of Alloy 600: temperature (T), stress intensity factor (Kf), pH, conductivity (κ), electrochemical corrosion potential (ECP), concentrations of H3PO3 and LiOH, and the alloy’s yield strength (YS). The statistical characteristics of the dataset—namely the minimum, maximum, mean, and standard deviation for each parameter—are summarized in Table 2, which serves as the foundational input for the development of the ANN (Java 1.4) predictive model.
Table 2.
The statistical parameters of corrosion data used for ANN model development.
2.3. Correlation Analysis
To provide a holistic view of both the strength and direction of relationships between each input parameter and CGR visually, a spider plot (Figure 1) was constructed using the correlation coefficients derived from the dataset. Among the parameters analyzed, Kf, and LiOH concentration exhibited the strongest positive correlations with CGR, showing values of 0.62, 0.61, and 0.61, respectively, indicating that increases in these factors are associated with a pronounced rise in crack growth rate.

Figure 1.
Spider plot illustrating the correlation coefficients between key input parameters and CGR of Alloy 600 in PWSCC environments.
Temperature also demonstrated a moderate positive correlation (~0.37), while pH (~0.41) and YS (~0.22) showed relatively weaker positive associations. Conversely, ECP and H3BO3 concentration presented negative correlations with CGR, at –0.46 and –0.03, respectively. While ECP’s negative correlation implies a moderately inverse relationship, suggesting that more noble potentials may suppress crack growth, the weak correlation of H3BO3 indicates its minimal influence in this context. However, it is important to note that the individual effects of these parameters on CGR can vary depending on the presence and interaction of other factors, and the strength of their influence may not remain constant across different conditions. This radar plot effectively highlights the dominant and subordinate factors influencing CGR and supports the selection of input variables for further predictive modeling using ANN.
2.4. ANN Model Development
Neural networks are typically organized in layers, consisting of an input layer, one or more hidden layers, and an output layer. Each neuron in the hidden layer receives a weighted sum of the outputs from the previous layer, and these weights are iteratively adjusted during training to minimize the error between predicted and target outputs. The training continues until the sum of squared differences between the predicted and actual values reaches a minimum. The number of neurons in the hidden layer is optimized based on the complexity of the problem. Once computed, the output is processed through an activation function to generate the network’s final prediction. According to Z. Guo and W. Sha [35], the typical workflow of an ANN includes the following: data collection from the literature, identification of input and output parameters, training the network, testing its performance, and using the trained model for prediction. Prior to training, all input data are normalized within the range of 0.1 to 0.9—a process known as data homogenization—to improve model stability and convergence.
In this study, the ANN was trained using the backpropagation algorithm (BPA) with a sigmoid transfer function [36,37,38]. The training focused on minimizing the mean square error (MSE) and the average prediction error (Etr). Model implementation and training were conducted using C programming, while Java was employed for developing the graphical user interface.
The schematic diagram of ANN architecture representing the inputs and outputs of the model is shown in Figure 2. Finding the optimum number of hidden layers and neurons helps to design the best architecture and results in the finest predictions [36].
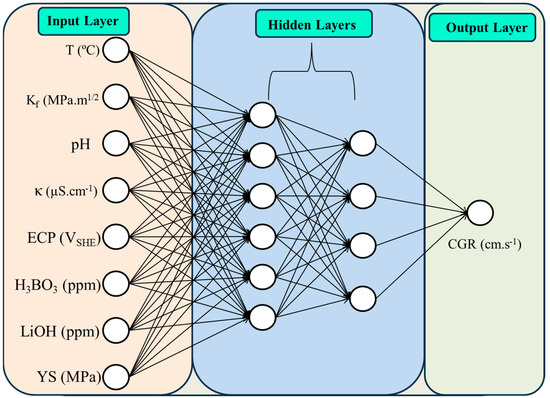
Figure 2.
Schematic representation of the ANN model showing input, hidden, and output layers.
To facilitate model training, the complete experimental dataset was partitioned into training (133) and testing (30) subsets in around an 80:20 ratio. The training dataset was employed to develop the full architecture of the neural network by systematically varying the number of hidden layers and neurons, as well as the momentum term, learning rate, and number of training iterations. The training process involved three key steps: (i) determining the optimal number of hidden layers and neurons, (ii) selecting appropriate values for the momentum term and learning rate, and (iii) defining the number of training iterations required for convergence.
2.5. Choice of Hyperparameters
2.5.1. Hidden Layers and Neurons
The initial step during model training is the selection of hidden layers and neurons. Figure 3a,b shows the change in Etr and MSE as a function of hidden neurons in a single hidden layer, respectively. Training with two hidden layers (Figure 3c,d) shows a decrease in error values (both Etr and MSE) compared to a single hidden layer. The minimum error values of both Etr and MSE were found with two hidden neurons. Hence, the model with two hidden layers with 2 hidden neurons is considered for further model training.
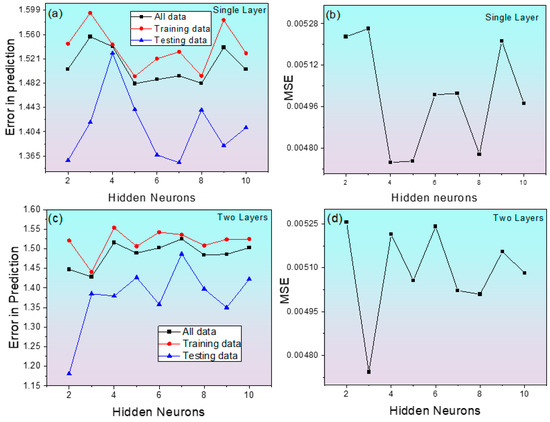
Figure 3.
Changes in MSE and average error of predicted corrosion rate in Alloy 600 as a function of Hidden neurons. (a) Error in prediction for single layer, (b) MSE for single layer, (c) error in prediction for two layers, (d) MSE for two layers.
2.5.2. Momentum Term and Learning Rate
The next step in ANN model training involves changing the momentum term (α) and learning rate (η) in order to obtain the minimum error, which helps to obtain the optimum architecture. Figure 4a,b shows the best value of the momentum term preferred as 0.85. On the other hand, Figure 4c,d shows higher values of learning rate results in higher values of MSE and Etr due to the over-training of the model [39]. The finest combination of MSE and Etr with respect to momentum term and learning rate was found to be at 0.85 and 0.4, respectively.
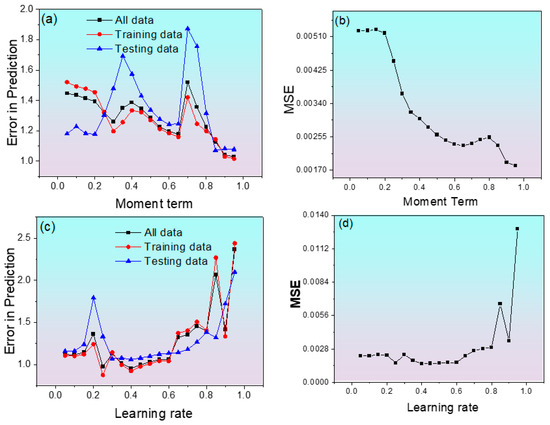
Figure 4.
Changes in average error and MSE of predicted corrosion rate in Alloy 600. (a) Error in prediction vs. momentum term, (b) MSE vs. momentum term, (c) error in prediction vs. learning rate, (d) MSE vs. learning rate.
2.5.3. Number of Iterations
To achieve an appropriate number of iterations, various models were trained with several iterations. Figure 5 shows the error deviations (Etr) for each CGR as a function of iterations. A minimum Etr value for CGR was noticed at 60,000 iterations. Therefore, the final optimal architecture of the present ANN model was chosen as 5-2-2-1 with a 0.85 momentum term and 0.4 learning rate through trial and error.

Figure 5.
Changes in MSE and average error of predicted corrosion rate in Inconel alloy 600. (a) Error in prediction vs. iterations, (b) MSE vs. iterations.
3. Results and Discussion
3.1. Development and Evaluation of a GUI-Based ANN Model for CGR Prediction and Extrapolation Performance
Single Variable Sensitivity Analysis
The influence of individual variables on the CGR of Alloy 600 was systematically investigated by independently varying one parameter while maintaining all others at a constant. The developed model demonstrated exceptional predictive capability, effectively capturing CGR behavior under diverse conditions. Although the model is inherently equipped to simulate the impact of all critical parameters, we specifically present the effects of temperature, Kf, ECP, and LiOH concentration, each benchmarked against corresponding experimental data, as illustrated in Figure 6a–d, respectively.
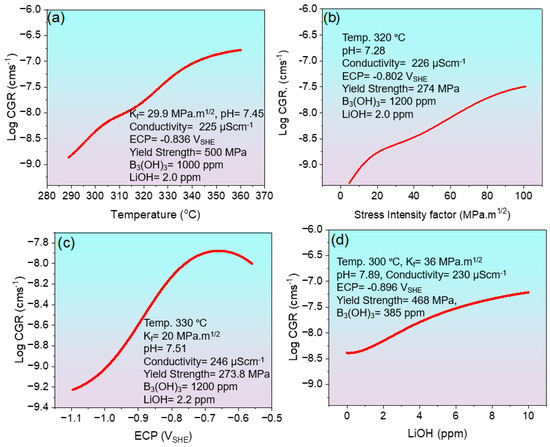
Figure 6.
The line graphs by the ANN model represent the effect of various parameters on the CGR of Alloy 600. (a) Effect of temperature on CGR, (b) effect of stress intensity factor on CGR, (c) effect of ECP on CGR, (d) effect of LiOH concentration on CGR.
As illustrated in Figure 6a, temperature exhibits a direct correlation with CGR, indicating that CGR increases with rising temperature. This behavior is attributed to enhanced oxidation at the grain boundaries ahead of the crack tip [40]. However, at higher temperatures, the CGR curve begins to level off slightly, suggesting that the accelerating influence of temperature becomes less pronounced. This trend can be explained by the interplay between two rate-controlling mechanisms: (i) thermally activated elemental diffusion and oxidation, and (ii) localized deformation processes [41]. Figure 6b illustrates the effect of Kf on CGR at approximately 320 °C. An increase in Kf leads to a higher CGR, as it reduces the activation energy barrier for crack propagation. This trend is consistent with previous findings, where elevated stress intensity was shown to accelerate crack advance by promoting localized plastic deformation and enhancing environmental interactions at the crack tip [41,42]. Figure 6c shows the effect of ECP on CGR. At more negative ECP values, the CGR increases due to enhanced hydrogen uptake and increased susceptibility to hydrogen-assisted cracking. However, as the ECP shifts toward less negative (more noble) values, the CGR begins to decrease.
This reduction is primarily attributed to the suppression of hydrogen generation and adsorption at the crack tip, as well as the stabilization of the passive oxide film, which mitigates further localized corrosion and crack propagation [43]. Figure 6d presents the effect of LiOH concentration on CGR. While the trend indicates a slight increase in CGR with increasing LiOH concentration, the relatively gentle slope suggests that the effect is mild under the given conditions. It is important to note that these trends are derived under the assumption that other influencing variables remain constant. If other input parameters are varied, the observed relationships may differ due to complex interactions among the contributing mechanisms.
The model not only accurately reproduced CGR trends under known conditions but also reliably forecasted crack growth behavior for previously unencountered input scenarios. This consistent accuracy across a broad and complex parameter space underscores the robustness and superior predictive performance of our approach—distinctly surpassing earlier models that often exhibited limited scope and adaptability. The positive correlation of temperature, Kf, ECP, and LiOH with the predicted CGR in our ANN model aligns well with trends reported in earlier studies [25,44,45,46].
3.2. Two Variable Sensitivity Analysis
The combined influence of two interacting variables on the CGR of Alloy 600 is inherently complex and often eludes accurate characterization by empirical equations or conventional models. However, our ANN model successfully captured these intricate interdependencies and demonstrated high precision in predicting CGR behavior under combined parameter inputs.
Figure 7 presents a 3D surface colormap generated from the data predicted by the developed ANN model, illustrating the combined influence of pH and Kf on the CGR of Alloy 600. This interaction reveals a complex interdependence between mechanical loading and electrochemical conditions. At elevated Kf levels, the intensified stress concentration at the crack tip promotes the rupture of the protective oxide layer, increasing the susceptibility of the exposed metal surface to corrosive attack [47]. In acidic to near-neutral pH environments, this mechanical effect is compounded by an enhanced electrochemical dissolution rate, accelerating crack propagation due to the destabilization of passive films [48]. In contrast, under alkaline conditions, the alloy tends to maintain a more stable passive layer; however, high Kf values can still compromise this stability through stress-assisted film rupture or localized depassivation. Additionally, hydrolysis reactions within confined crack environments may locally reduce the pH, even when the bulk environment remains alkaline, thus reactivating corrosion processes. These coupled mechanochemical effects create a highly dynamic and sensitive crack tip environment, which is difficult to represent using traditional empirical models [9]. In contrast, the ANN model effectively captures the nonlinear and synergistic interactions between pH and Kf, demonstrating high predictive fidelity and providing a reliable tool for evaluating CGR behavior under complex service conditions.
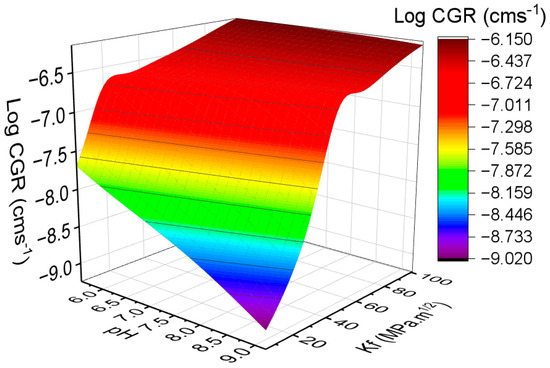
Figure 7.
Three-dimensional surface colormap obtained by ANN predicted data showing the combined effect of pH and Kf on the CGR of Alloy 600.
Similarly, the developed ANN model demonstrates strong capability in accurately capturing the combined effects of other critical parameters on the CGR of Alloy 600. The synergistic influence of temperature and Kf is illustrated through the 3D surface colormap presented in Supplementary Figure S1, revealing how elevated temperatures amplify the detrimental effects of mechanical loading on crack propagation. Additionally, the coupled effect of temperature and YS is depicted in Supplementary Figure S2, highlighting the dynamic interaction between thermally activated corrosion kinetics and electrochemical driving forces.
3.3. Quantitative Estimation of Input Parameters on the CGR
To quantitatively assess the influence of individual input parameters on the CGR of Alloy 600, a sensitivity analysis was conducted, as summarized in Table 3.
Table 3.
Qualitative estimation of influence of input parameters on corrosion rate (Bold text indicates virtual addition of individual input parameters to study their isolated impact on corrosion crack growth rate).
By incrementally varying one parameter while holding the others constant, the ANN model revealed how specific changes—such as a defined increase in temperature, Kf, ECP, pH, and LiOH concentration influence the CGR. The model’s predicted values were directly compared with corresponding experimental results, demonstrating excellent agreement. Notably, the maximum deviation between the predicted and experimental CGR values was limited to approximately 3%, underscoring the model’s high precision in capturing the quantitative relationship between environmental and mechanical variables and their effect on crack propagation behavior.
3.4. Index of Relative Importance (IRI)
The impact of input variables on corrosion depth was assessed through the use of the Index of Relative Importance (IRI), a vector-based metric [49]. This index quantifies both the extent and the direction of each variable’s effect on corrosion depth. A positive IRI denotes that an increase in the respective parameter leads to a greater corrosion depth, while a negative value implies a mitigating influence. Figure 8 illustrates the IRI for three distinct PWSCC environments applied to Alloy 600, each corresponding to a different CGR. In Figure 8a for sample 1 (with log CGR: −8.602), YS exhibited the most significant negative influence, indicating its strong inhibitory effect on crack propagation, followed by conductivity and ECP. Conversely, temperature and pH and B3(OH)3 showed minor positive IRIs, suggesting a slight promoting effect on CGR. With the Kf showing a strong positive influence and yield strength displaying a prominent negative IRI, implying that a lower strength in this environment contributed to higher CGR. In Sample 33 (log CGR: −8.508), the IRI profile changed notably as shown in Figure 8b.
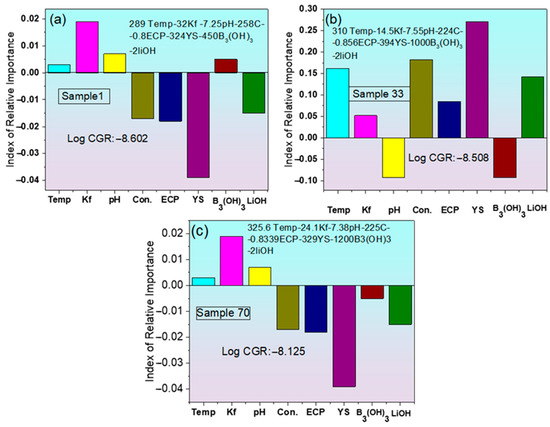
Figure 8.
Index of Relative Importance (IRI) of input parameters influencing CGR of Alloy 600 in three PWSCC environments, (a) with log CGR = −8.602, (b) with log CGR = −8.508, (c) with log CGR = −8.125.
In this case, the pH shows a strong negative influence and yield strength displays a prominent positive IRI, implying that increased strength in this environment contributed to higher CGR. Meanwhile, LiOH demonstrated a substantial positive influence in this case, unlike in Sample 1.
For Sample 70 (log CGR: −8.125), the highest among the three, Kf and YS again appeared as dominant factors with negative YS and positive Kf, suggesting their different roles across different conditions (Figure 8c). Overall, the comparative analysis highlights that the influence of individual parameters on CGR varies with the specific environmental conditions, underscoring the complex interdependence between water chemistry and material properties in PWSCC behavior.
3.5. Graphical User Interface (GUI)
A screenshot of the graphical user interface (GUI) for the developed ANN model is shown in Figure 9. The GUI, developed using Java (version 1.4), facilitates the prediction of CGR for Alloy 600 based on various PWSCC environmental parameters. Users can manually input values for parameters such as temperature, stress intensity factor, pH, conductivity, ECP, YS, B3(OH)3, and LiOH to obtain CGR predictions. The line plot feature enables single-variable sensitivity analysis, illustrating the trend of an individual parameter, while the surface plot visualizes the combined effect of two parameters. The software is user-friendly and requires no prior programming knowledge.
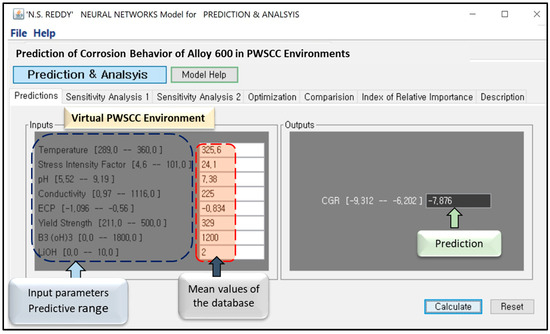
Figure 9.
Screenshot GUI of ANN model for the prediction of CGR of Alloy 600 in virtual PWSCC environment.
The developed model significant value to both academic researchers and industry professionals focused on developing corrosion-resistant coatings. It also supports personnel in nuclear power plant operations, where Alloy 600 is extensively used in critical components such as steam generator tubes, nozzles, and reactor pressure vessel penetrations. By enabling early detection of material degradation, the model facilitates predictive maintenance and life-extension strategies. Additionally, it provides rapid and reliable CGR predictions under diverse service conditions, aiding alloy design optimization and regulatory decision-making while enhancing structural integrity and safety in high-temperature, pressurized water environments.
3.6. Limitations and Future Scope of Model Interpretability
Incorporating a physics-informed architecture—such as structuring hidden layers to separately represent mechanical (e.g., Kf, YS) and corrosion-related (e.g., ECP, pH) factors—offers strong potential to enhance model interpretability and alignment with the physical mechanisms governing PWSCC. However, in standard artificial neural networks, hidden layers function as abstract computational units without explicit physical meaning, making such domain-specific separation challenging. While structural mediation is feasible in fields like social sciences using methods such as Structural Equation Modeling (SEM), achieving similar interpretability in ANN models requires large, decoupled datasets and advanced techniques like physics-informed neural networks (PINNs). Given the current limitations in data and methodological scope, this approach remains outside the present study’s framework but represents a valuable direction for future research.
Additionally, the model was developed using a literature-derived dataset and lacks direct validation through dedicated PWSCC testing on Alloy 600. Experimental validation under actual service conditions is essential to confirm the model’s reliability. However, such testing requires specialized high-temperature, high-pressure facilities, which were not available for this study. Future work will prioritize collaboration with institutions equipped to perform these tests, enabling stronger integration of experimental and computational insights.
4. Conclusions
An Artificial Neural Network model was developed to estimate the CGR of Alloy 600 as a function of Stress Intensity factor, conductivity, pH, LiOH, Yield strength, ECP, and H3(BO)3. In the present study, the effectiveness of neural networks was demonstrated the estimation of corrosion crack growth rate in Alloy 600. The influence of environmental variables is analyzed using the model.
The model successfully reproduces many experimentally observable trends and general features of corrosion progress. The results predicted by the model provide useful information from relatively small experimental databases. Sensitivity analysis provided the effects of affecting variables. This leads to considerable savings in cost and time in the design of new alloys.
Supplementary Materials
The following supporting information can be downloaded at: https://www.mdpi.com/article/10.3390/coatings15070749/s1, Figure S1: 3D surface colormap obtained by ANN predicted data showing the combined effect of temperature and Kf on the CGR of Alloy 600; Figure S2: 3D surface colormap obtained by ANN predicted data showing the combined effect of temperature and yield strength on the CGR of Alloy 600.
Author Contributions
Conceptualization, M.I. and N.G.S.R.; methodology, M.I. and X.-S.W.; software, N.G.S.R.; validation, X.-S.W., A.G.B. and H.J.B.; formal analysis, X.-S.W. and A.G.B.; investigation, H.J.B.; resources, A.G.B.; data curation, X.-S.W.; writing—original draft preparation, M.I.; writing—review and editing, H.J.B. and N.G.S.R.; visualization, A.G.B.; supervision, N.G.S.R. All authors have read and agreed to the published version of the manuscript.
Funding
This research received no external funding.
Institutional Review Board Statement
Not applicable.
Informed Consent Statement
Not applicable.
Data Availability Statement
Data will be available upon reasonable request from the corresponding author.
Acknowledgments
N. S. Reddy gratefully acknowledges the valuable contribution of Yandra Kiran Kumar, Software Professional, Minneapolis, USA, to the GUI development of the ANN model. This work was supported by the Learning & Academic research institution for Master’s PhD students, and Postdocs (LAMP) Program of the National Research Foundation of Korea (NRF), funded by the Ministry of Education (No. RS-2023-00301974).
Conflicts of Interest
The authors declare no conflicts of interest.
Abbreviations
The following abbreviations are used in this manuscript:
| PWSCC | primary water stress corrosion cracking |
| IGSCC | Intergranular stress corrosion cracking |
| CGR | Corrosion crack growth rate |
| ANN | Artificial neural network |
| ECP | Electrochemical corrosion potential |
| YS | Yield strength |
| MSE | Mean square error |
References
- Briceño, D.G.; Castaño, M.L.; García, M.S. Stress corrosion cracking susceptibility of steam generator tube materials in AVT (all volatile treatment) chemistry contaminated with lead. Nucl. Eng. Des. 1996, 165, 161–169. [Google Scholar] [CrossRef]
- Reed, R.C. The Superalloys: Fundamentals and Applications; Cambridge University Press: Cambridge, UK, 2006. [Google Scholar]
- Ishtiaq, M.; Jung, J.E.; Bae, H.J.; Yun, D.W.; Kang, S.-G.; Zargaran, A.; Lee, Y.-K.; Choi, Y.-S.; Seol, J.B. Observation of interface disruption and Lomer-Cottrell locks in a crept L12-strengthened Ni-based superalloy. Mater. Sci. Eng. A 2025, 940, 148570. [Google Scholar] [CrossRef]
- Viskari, L.; Hörnqvist, M.; Moore, K.L.; Cao, Y.; Stiller, K. Intergranular crack tip oxidation in a Ni-base superalloy. Acta Mater. 2013, 61, 3630–3639. [Google Scholar] [CrossRef]
- Zhao, H.; Liu, Q.B.; Yao, D.W. The Research and Application Status of Inconel 600 Alloy under Extremely Situation. Key Eng. Mater. 2017, 730, 21–27. [Google Scholar] [CrossRef]
- Mechehoud, F.; Benaioun, N.E.; Hakiki, N.E.; Khelil, A.; Simon, L.; Bubendorff, J.L. Thermally oxidized Inconel 600 and 690 nickel-based alloys characterizations by combination of global photoelectrochemistry and local near-field microscopy techniques (STM, STS, AFM, SKPFM). Appl. Surf. Sci. 2018, 433, 66–75. [Google Scholar] [CrossRef]
- Kim, D.-H.; Choi, J.; Ha, S.-H. Examination of Oxide Formation in Oxidation of Inconel 600 and 625 at High Temperatures Using Phase Diagrams. Coatings 2024, 14, 1550. [Google Scholar] [CrossRef]
- Kim, S.; Kim, D.W.; Kim, Y.S. Primary water stress corrosion cracking (PWSCC) mechanism based on ordering reaction in Alloy 600. Met. Mater. Int. 2013, 19, 969–974. [Google Scholar] [CrossRef]
- Scott, P.M.; Combrade, P. General corrosion and stress corrosion cracking of Alloy 600 in light water reactor primary coolants. J. Nucl. Mater. 2019, 524, 340–375. [Google Scholar] [CrossRef]
- Perez, C.; Couvant, T.; Guipont, V.; Kermouche, G.; Balloy, D.; Royes, P.; Duhamel, C. Corrosion behaviour of Alloy 600 containing oxide inclusions exposed to primary water of pressurised water reactors. Corros. Sci. 2025, 254, 113035. [Google Scholar] [CrossRef]
- Lim, Y.S.; Kim, D.J.; Kim, S.W.; Kim, H.P. Crack growth and cracking behavior of Alloy 600/182 and Alloy 690/152 welds in simulated PWR primary water. Nucl. Eng. Technol. 2019, 51, 228–237. [Google Scholar] [CrossRef]
- Liu, X.; Hwang, W.; Park, J.; Van, D.; Chang, Y.; Lee, S.H.; Kim, S.-Y.; Han, S.; Lee, B. Toward the multiscale nature of stress corrosion cracking. Nucl. Eng. Technol. 2018, 50, 1–17. [Google Scholar] [CrossRef]
- Lim, Y.S.; Kim, H.P.; Hwang, S.S. Microstructural characterization on intergranular stress corrosion cracking of Alloy 600 in PWR primary water environment. J. Nucl. Mater. 2013, 440, 46–54. [Google Scholar] [CrossRef]
- Rahman, M.W.; Zhao, B.; Pan, S.; Qu, Y. Microstructure-informed machine learning for understanding corrosion resistance in structural alloys through fusion with experimental studies. Comput. Mater. Sci. 2025, 248, 113624. [Google Scholar] [CrossRef]
- Shi, J.; Fekete, B.; Wang, J.; Macdonald, D.D. Customization of the coupled environment fracture model for predicting stress corrosion cracking in Alloy 600 in PWR environment. Corros. Sci. 2018, 139, 58–67. [Google Scholar] [CrossRef]
- Macdonald, D.D. Viability of Hydrogen Water Chemistry for Protecting In-Vessel Components of Boiling Water Reactors. Corrosion 1992, 48, 194–205. [Google Scholar] [CrossRef]
- Hicking, J.; McIlree, A.; Pathania, R. Crack Growth Rates for Evaluating Primary Water Stress Corrosion Cracking (PWSCC) of Thick-Wall Alloy 600 Material (MRP-55); Electric Power Research Institute: Palo Alto, CA, USA, 2002. [Google Scholar]
- White, G.; Gorman, J.; Nordmann, N.; Jones, P.; Kreider, M.; Hickling, J. Materials Reliability Program Crack Growth Rates for Evaluating Primary Water Stress Corrosion Cracking (PWSCC) of Alloy 82, 182, and 132 Welds; Electric Power Research Institute: Palo Alto, CA, USA, 2004. [Google Scholar]
- Agatonovic-Kustrin, S.; Beresford, R. Basic concepts of artificial neural network (ANN) modeling and its application in pharmaceutical research. J. Pharm. Biomed. Anal. 2000, 22, 717–727. [Google Scholar] [CrossRef] [PubMed]
- Ishtiaq, M.; Tiwari, S.; Panigrahi, B.B.; Seol, J.B.; Reddy, N.S. Neural Network-Based Modeling of the Interplay between Composition, Service Temperature, and Thermal Conductivity in Steels for Engineering Applications. Int. J. Thermophys. 2024, 45, 137. [Google Scholar] [CrossRef]
- Ishtiaq, M.; Tariq, H.M.R.; Reddy, D.Y.C.; Kang, S.-G.; Reddy, N.G.S. Prediction of Creep Rupture Life of 5Cr-0.5Mo Steel Using Machine Learning Models. Metals 2025, 15, 288. [Google Scholar] [CrossRef]
- Kim, H.-S.; Park, S.-J.; Seo, S.-M.; Yoo, Y.-S.; Jeong, H.-W.; Jang, H. Regression analysis of high-temperature oxidation of Ni-based superalloys using artificial neural network. Corros. Sci. 2021, 180, 109207. [Google Scholar] [CrossRef]
- Jiménez-Come, M.J.; González Gallero, F.J.; Álvarez Gómez, P.; Mena Baladés, J.D. Corrosion Behaviour Modelling Using Artificial Neural Networks: A Case Study in Biogas Environment. Metals 2023, 13, 1811. [Google Scholar] [CrossRef]
- Chen, Q.; Wang, H.; Ji, H.; Ma, X.; Cai, Y. Data-driven atmospheric corrosion prediction model for alloys based on a two-stage machine learning approach. Process Saf. Environ. Prot. 2024, 188, 1093–1105. [Google Scholar] [CrossRef]
- Shi, J.; Wang, J.; Macdonald, D.D. Prediction of primary water stress corrosion crack growth rates in Alloy 600 using artificial neural networks. Corros. Sci. 2015, 92, 217–227. [Google Scholar] [CrossRef]
- Rebak, R.; Szklarska-Smialowska, Z.; McIlree, A. Effects of pH and Stress Intensity on Crack Growth Rate in Alloy 600 in Lithiated+ Borated Water at High Temperatures; American Nuclear Society, Inc.: La Grange Park, IL, USA, 1992. [Google Scholar]
- Rebak, R.; Szklarska-Smialowska, Z. Influence of stress intensity and loading mode on intergranular stress corrosion cracking of alloy 600 in primary waters of pressurized water reactors. Corrosion 1994, 50, 378–393. [Google Scholar] [CrossRef]
- Lott, R.; Jacko, R.; Gold, R. Primary Water Stress Corrosion Crack Growth Rates in Alloy 600 Steam Generator Tubing; American Nuclear Society, Inc.: La Grange Park, IL, USA, 1992. [Google Scholar]
- Morton, D.; Attanasio, S.; Young, G. Primary Water SCC Understanding and Characterization Through Fundamental Testing in the Vicinity of the Nickel/Nickel Oxide Phase Transition; Lockheed Martin Corporation: Schenectady, NY, USA, 2001. [Google Scholar]
- Hunt, E.; Gross, D. PWSCC of Alloy 600 Materials in PWR Primary System Penetrations; EPRI Report TR-103696; Electric Power Research Institute: Palo Alto, CA, USA, 1994. [Google Scholar]
- Bamford, W.H.; Foster, J. Crack Growth and Microstructural Characterization of Alloy 600 Head Penetration Materials; Electric Power Research Institute (EPRI): Palo Alto, CA, USA, 1995. [Google Scholar]
- BAMFORD, V.; Foster, J. Crack Growth and Microstructural Characterization of Alloy 600 PWR Vessel Head Penetration Materials; EPRI rapport TR-109136; Electric Power Research Institute: Palo Alto, CA, USA, 1997; p. 271. [Google Scholar]
- Hickling, J.; Mcllree, A.; Pathania, R. Materials Reliability Program (MRP): Crack Growth Rates for Evaluating Primary Water Stress Corrosion Cracking (PWSCC) of Thick-Wall Alloy 600 Materials (MRP-55) Revision 1; Rapport EPRI; Electric Power Research Institute: Palo Alto, CA, USA, 2002; p. 1006695. [Google Scholar]
- Ruther, W.; Soppett, W.; Kassner, T.; Commission, N.R. Corrosion Fatigue of Alloys 600 and 690 in Simulated LWR Environments; Nuclear Regulatory Commission: Washington, DC, USA, 1996. [Google Scholar]
- Guo, Z.; Sha, W. Modelling the correlation between processing parameters and properties of maraging steels using artificial neural network. Comput. Mater. Sci. 2004, 29, 12–28. [Google Scholar] [CrossRef]
- Reddy, N.S.; Panigrahi, B.B.; Ho, C.M.; Kim, J.H.; Lee, C.S. Artificial neural network modeling on the relative importance of alloying elements and heat treatment temperature to the stability of α and β phase in titanium alloys. Comput. Mater. Sci. 2015, 107, 175–183. [Google Scholar] [CrossRef]
- Okuyucu, H.; Kurt, A.; Arcaklioglu, E. Artificial neural network application to the friction stir welding of aluminum plates. Mater. Des. 2007, 28, 78–84. [Google Scholar] [CrossRef]
- Malinov, S.; Sha, W.; Guo, Z. Application of artificial neural network for prediction of time–temperature–transformation diagrams in titanium alloys. Mater. Sci. Eng. A 2000, 283, 1–10. [Google Scholar] [CrossRef]
- Reddy, N.; Krishnaiah, J.; Hong, S.-G.; Lee, J.S. Modeling medium carbon steels by using artificial neural networks. Mater. Sci. Eng. A 2009, 508, 93–105. [Google Scholar] [CrossRef]
- Sennour, M.; Laghoutaris, P.; Guerre, C.; Molins, R. Advanced TEM characterization of stress corrosion cracking of Alloy 600 in pressurized water reactor primary water environment. J. Nucl. Mater. 2009, 393, 254–266. [Google Scholar] [CrossRef]
- Meisnar, M.; Vilalta-Clemente, A.; Moody, M.; Arioka, K.; Lozano-Perez, S. A mechanistic study of the temperature dependence of the stress corrosion crack growth rate in SUS316 stainless steels exposed to PWR primary water. Acta Mater. 2016, 114, 15–24. [Google Scholar] [CrossRef]
- Hall, M.M. Interacting sensitivities of alloy 600 PWSCC to stress intensity factor, yield stress, temperature, carbon concentration, and crack growth orientation Alloy 600. Corros. Sci. 2017, 125, 152–165. [Google Scholar] [CrossRef]
- Andresen, P.L.; Hickling, J.; Ahluwalia, A.; Wilson, J. Effects of Hydrogen on Stress Corrosion Crack Growth Rate of Nickel Alloys in High-Temperature Water. Corrosion 2008, 64, 707–720. [Google Scholar] [CrossRef]
- Shen, Z.; Meisnar, M.; Arioka, K.; Lozano-Perez, S. Mechanistic understanding of the temperature dependence of crack growth rate in alloy 600 and 316 stainless steel through high-resolution characterization. Acta Mater. 2019, 165, 73–86. [Google Scholar] [CrossRef]
- Kim, J.-S.; Kim, J.-S.; Jeon, J.-Y.; Kim, Y.-J. PWSCC Growth Assessment Model Considering Stress Triaxiality Factor for Primary Alloy 600 Components. Nucl. Eng. Technol. 2016, 48, 1036–1046. [Google Scholar] [CrossRef]
- Abraham, G.J.; Kain, V.; Dey, G.K.; Raja, V.S. Stability of oxide film formed at different temperatures on Alloy 600 in lithiated environment. J. Nucl. Mater. 2013, 437, 188–195. [Google Scholar] [CrossRef]
- Lv, S.; Li, K.; Chen, J.; Li, X. Corrosion of High-Strength Steel Wires under Tensile Stress. Materials 2020, 13, 4790. [Google Scholar] [CrossRef]
- Liu, T.; Wang, B. Effect of pH on corrosion mechanism of two austenitic stainless steels in artificial sweat. Int. J. Electrochem. Sci. 2025, 20, 101065. [Google Scholar] [CrossRef]
- Shen, Z.; Chen, A. Comprehensive relative importance analysis and its applications to high dimensional gene expression data analysis. Knowl. Based Syst. 2020, 203, 106120. [Google Scholar] [CrossRef]
Disclaimer/Publisher’s Note: The statements, opinions and data contained in all publications are solely those of the individual author(s) and contributor(s) and not of MDPI and/or the editor(s). MDPI and/or the editor(s) disclaim responsibility for any injury to people or property resulting from any ideas, methods, instructions or products referred to in the content. |
© 2025 by the authors. Licensee MDPI, Basel, Switzerland. This article is an open access article distributed under the terms and conditions of the Creative Commons Attribution (CC BY) license (https://creativecommons.org/licenses/by/4.0/).